
Document 154672
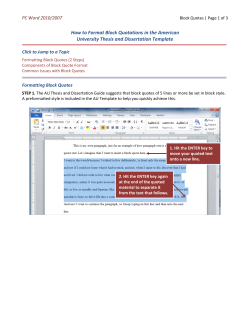
C8057 (Research Methods in Psychology): Writing Laboratory Reports
Writing Lab Reports & APA Format
Structure and Content of a Laboratory Report
This following provides a brief overview of the structure and content of various elements in a laboratory report, based
on APA guidelines. The APA publication manual can be referred to for more detail.
The purpose of a lab report is to communicate research in a clear, systematic and standardised way. Primarily, a lab
report should communicate the following things:
→ Why did I bother? Why did I do this experiment and why is it an interesting contribution to science?
→ How did I do it? How did I carry out this research (this should be detailed enough so that the experiment
could be replicated precisely)?
→ What did I find? What were the results of your study?
→ So What? What do your findings mean in terms of your hypotheses and what theoretical contribution do
they make?
IMPORTANT!
The advice that we give you in this handout is not inflexible, it is a guide! For example, when we say
that the title should be fewer than 15 words, the world will not end if your title is 16 words. So,
please use your common sense. In case you don’t have any, the snail of sense will appear to give you
some advice.
Format
There are several sections to a lab report:
→ Title
→ Abstract
→ Introduction
→ Method
o
Participants
o
Materials (Optional)
o
Design
o
Procedure
o
Scoring (Optional)
→ Results
→ Discussion
→ References
→ Appendix (Optional)
Title
Your title should ideally be fewer than 15 words. A good title alerts the reader to the overarching theme of the work
to be reported. A good title also captures the reader's attention. But the latter goal should not interfere with the
former one. Don’t use superfluous words, such as “An Empirical Investigation into Anxiety Disorders in Children with
…”, when you could write “Anxiety Disorders in Children with ...”.
Too Vague: “The ‘Beer-Goggles’ effect”.
© Dr. Andy Field, 2008
Page 1
C8057 (Research Methods in Psychology): Writing Laboratory Reports
Too specific: “Investigation into the effects of drinking 6 pints of Guinness in a nightclub in Brighton at 11.30,
while listening to drum and bass played at 100 db through a good sound system, on 12 men’s and 15
women’s ability to accurately judge the attractiveness of members of the opposite sex”.
About Right: “The ‘Beer-Goggles’ effect: the effects of alcohol on attractiveness ratings of the opposite
gender”.
Abstract
What is the study all about (in no more than about 150 words)? Abstracts provide a reader with the most important
details. Ideally, the abstract enables the reader to decide whether he or she should read the article. Again, never
promise more than can be given. Not everyone is going to be interested in the work; but that doesn't mean the writer
shouldn't point out some of the most intriguing features of the study. The abstract should not be composed of
selected sentences from the body of the paper. Instead, the writer should sit down and try to distil the essential
elements of the work to be reported. The abstract is extremely important; it shouldn't be short-changed. It should be
written last. This paragraph should concisely describe the problem under investigation and the motivation for the
study, the participants, the experimental method, findings, and conclusions. You could try to write a sentence on each
of these areas. To conserve characters in the abstract, type all numbers except those that begin a sentence as digits.
Avoid ending the abstract with throw-away and uninformative statements such as ‘These results will be discussed’, or
‘how these results relate to past theory will be discussed’.
Ugly (1993) has shown that the propensity to misclassify members of the opposite sex as attractive is
increased in nightclub settings. This study was designed to ascertain whether this effect is due to the dim
lighting employed in these venues, or the consumption of alcohol in this setting. Ratings of the attractiveness
of a set of stooge participants were taken in both a well-lit and dimly-lit nightclub by both sober and drunk
participants. A 2 way ANOVA revealed a significant effect of alcohol consumption, but not of the lighting
used. The results suggest that, contrary to Ugly’s hypothesis, dim lighting does not contribute to the inflated
attractiveness of opposite-gender mates; instead these ratings are influenced solely by alcohol intake.
Introduction
A good introduction addresses two questions: What has been done in this area by other researchers? and, What is the
point of the present study?
The introduction is the place to include the review of the research literature that led to your hypothesis. For instance,
you might show how prior findings are inconsistent or ambiguous. Explain how your experiment may clarify the
problem. State your hypothesis explicitly toward the end of the introduction, after you have explained the research
and thinking that led to it. Identify independent and dependent variables here: do this subtly, do not write things like
‘The independent variable was amount of alcohol drunk and the dependent variable was the attractiveness of the
mate selected’, but instead say something like ‘this study looks at whether the amount of alcohol drunk and the
gender of the consumer has an effect on the attractiveness of the mate selected’. If you have made predictions about
the outcome of the study, say so (‘alcohol is expected to reduce the attractiveness of the selected mate’). Be sure you
say why you expect these results. Do not expect readers to guess what you are thinking.
In the introduction, you are moving from the general to the specific: a general discussion of the problem area, to your
specific hypothesis. Successive paragraphs should be explicitly connected and form the thread of a coherent
argument. If we take the ‘beer-goggles’ example, a good ‘broad’ structure would be:
→ Define the beer-goggles effect and why it is important.
→ Describe relevant previous research and what it has told us about the beer-goggles effect. This could include
theories of the beer-goggles effect.
→ Describe the problems with previous research and/or explain any unresolved issues within the literature.
→ Describe how you are going to overcome these problems/resolve this issue and why that will be an important
advancement to our knowledge (and/or why it will have practical benefit).
→ Informally state your hypotheses.
Do not criticise past work on the beer-goggles effect and then suddenly announce your prediction that the ‘beergoggles effect will be more pronounced in dim lighting’. What research has been done on levels of lighting and
© Dr. Andy Field, 2008
Page 2
C8057 (Research Methods in Psychology): Writing Laboratory Reports
attractiveness ratings? Why does this research lead you to this hypothesis? Have Staggering (1996) and Vomiting
(2002) had a theoretical dispute over the origins of the beer goggles effect or the factors mediating it? Make sure
everything you say is there for a reason that directly leads to the motivation for your study. Other issues can be taken
up in the discussion.
Provide a rationale for your study. Most of you will do experiments that are subtle variations on the experiments given
to you as inspiration. This means that you are replicating in spirit what the original researchers did, but in a slightly
different way. Perhaps this is simply to check the generality of the results with a slightly different procedure and with
different materials. If so, state what interesting differences there are between your study and the one you’re
replicating to show how your results extend their findings. Or you may be extending the research in a more radical
way: for example, you may be applying the beer goggles effect to a domain in which (as far as you know) it hasn’t
been applied before (for example, attractiveness ratings of same-gender mates). Whatever the rationale of your
study, state it. Related to this point, state why you chose the conditions that you did, and what you expect to happen.
However, this needs to be stated informally (anyone writing ‘my experimental hypothesis is that …’ will be fed to a
large swimming pool of hungry piranha fish).
This section should not get a primary heading (i.e., "Introduction"), although subheadings may be useful to help
organize the material for the reader.
Method
This section should be written so that someone else can repeat the experiment just by reading your method section. A
key point throughout is include enough information for replication, but to not include superfluous information that
you don’t think has any bearing on the results of your study. The method section generally consists of up to four
subsections:
1.
Participants
2.
Materials (Optional)
3.
Design
4.
Procedure
5.
Scoring (Optional)
Subsections
Although the above 5 sections are recommended if you look through journal articles in different
areas of psychology, and from different publishers you’ll notice differences in these sections.
For example, it might not be sensible to have a ‘materials’ section for your particular piece of
research, but you might choose to have a ‘stimuli’ section (common in cognitive psychology), or
‘apparatus’ (for example, if you have used an fMRI scanner, you might want to describe its details).
Similarly, the ‘scoring’ section is not that common in some areas of psychology, but in developmental
psychology you might have a section on ‘scoring’ or ‘coding’ where you, for example, explain how
you have transformed videos of children into numeric codes/values.
Also, some articles have a design section, whereas others don’t. Just be aware that there isn’t a ‘law’,
just guidelines. Read a few APA journals (e.g. Journal of Experimental Psychology, Journal of
Abnormal Psychology, Journal of Personality and Social Psychology, Emotion, Developmental
Psychology) to see the variability in how research is written up.
Throughout the method, results and discussion, label any experimental groups with meaningful
names, not with numbers or letters.
© Dr. Andy Field, 2008
Page 3
C8057 (Research Methods in Psychology): Writing Laboratory Reports
Participants/Subjects
Who was studied? How were they selected? From where were they selected? It is often sufficient simply to state the
number of participants used in the study (perhaps with a breakdown by gender). However, it may be necessary to
provide more information. For example, if the researcher is investigating racism, information regarding the
participants’ ethnicity, education, and socioeconomic background should be provided. This information might not be
pertinent if the researcher were studying memory. It may also be necessary to describe the recruitment procedures
for participants (for example if using clinical samples). For some studies, it may be enough to say that subjects were
contacted by phone (or through the mail) and were paid for their participation (or that they received course credit,
etc.) On the other hand, a good deal more may need to be said. Some research, in which participants must
participate in several sessions, may require using postcards or phone calls to remind and motivate them. If this is the
case, then the method used should be described. If not all participants contacted to participate actually completed
the study, the number of individuals who did not participate and their reasons (if known) should be provided.
Unfortunately, there are no strict guidelines about what information should be included. The researcher needs to use
his or her best judgement.
There is no need to describe how participants were randomly allocated to groups, just state that they were; similarly
there is no need to describe how experimenters were assigned to participants.
→ Example: Fifty participants completed all conditions of this study: 25 were male and 25 female. Ages ranged
from 18 to 39 years (M = 24.26, SD = 3.52 years). Participants were all undergraduate students at the
University of Sussex who took part in return for free admission to the nightclub. All participants were naive to
the purpose of the experiment.’
Use the word ‘subject’ only when referring to non-human animals (i.e. mice, rats, skunks, killer
whales etc.). When referring to humans use the word ‘participant’.
Materials/Apparatus/Stimuli
What equipment or instruments were used to collect data? If questionnaires were used, they should be described in
this section, giving brief examples. If computers were used, describe the specific models of the computers and the
software used to collect the data, if this is relevant to how the data was collected. Sometimes these sections are
separated – the section for apparatus describes the physical tools to present or collect data, and the materials section
describes the stimuli that participants see or hear. If materials (such as a questionnaire) were used, either cite your
source (if published materials were used) or provide a copy in the appendix of your paper if you devised the
instrument yourself. For example:
→ Considered Ratings of Attractiveness of Personality Scale (CRAPS), Legless (1994): the CRAPS was used to
measure each participant’s opinions of the attractiveness of the stooges’ personalities. This scale is a 45-item
self-report questionnaire containing a 5-point Likert response scale, ranging from 1 (strongly disagree) to 5
(strongly agree). Dazed and Confused (2005) found that, compared to other assessment scales, the CRAPS is a
better measure for discriminating between nice people and statistics lecturers, and has high internal
consistency, α = .83.
→ Considered Opinion of Attractiveness Rating scale (COAR), Nicearse (1992): the COAR was used to ascertain
participant’s opinions of the physical attractiveness of the stooges. This scale is a 30-item self-report
questionnaire containing a 5-point Likert response scale, ranging from 1 (strongly disagree) to 5 (strongly
agree). Minger (2003) found that, compared to other assessment scales, the CRAPS is a better measure for
discriminating between ugly and attractive people, and has good internal consistency, α = .76.
There is no need for an apparatus section unless you have complex apparatus. In materials, there
is no need to list objects that you self evidently used, such as pieces of paper, pens, chairs and
tables etc. Instead, in materials you should describe only the stimuli and their relevant properties
and the criteria by which you selected or constructed them. For example, if participants had to
view a video tape of a traumatic event, from where did the footage come?
© Dr. Andy Field, 2008
Page 4
C8057 (Research Methods in Psychology): Writing Laboratory Reports
Design
This heading is normally included only if you have an experimental design that is complex, such as mixed design with
several independent or dependent variables. Otherwise, this information would be part of your procedure. It should
explain to the reader clearly what the different conditions are and how they were manipulated. This tells the reader
about what form the experiment took. How many people took part in each condition and what did you ask them to
do? Did each person perform in all the experimental conditions? Did you have a number of different groups of people,
each of whom took part in only one experimental condition (i.e. repeated measures -vs- randomised design)? How did
you decide who was in which group, if you used a randomised design? What kind of measurement scale best describes
the data you collected? State clearly what your independent and dependent variables were and how they were
operationalised.
→ Example: A repeated measures design was used. There were two independent variables: the lighting used in
the nightclub (bright or dim) and the level of alcohol consumed (none or 6 pints). There were two dependent
measures that were analysed separately: the participants’ ratings of physical attractiveness (the COAR scale)
and the participants’ ratings of the attractiveness of personality (the CRAPS scale). Participants took part in all
four conditions of the experiment.
Procedure
How were the data gathered? Were participants run individually or in small groups? Were participants tested in a
laboratory or in a field setting? How were relevant dependent variables assessed? Did participants respond using a
questionnaire, a computer, or were their behaviours assessed using videotapes and trained raters? Give enough
information for replication, but don’t give information that would not be relevant to how the results were obtained,
e.g. don’t say ‘participants entered the laboratory and were told to sit down on the provided chairs’ unless the chair
has a steaming dog-turd on it and your study is about reactions to being asked to sit on steaming dog turds.
In the procedure, make sure you describe what the cover tasks were; the reader should not have to refer to the
appendix, materials section, etc, to know what the procedure was (conversely, don’t put procedural information in
the materials or other sections). Note if participants responded to the cover task questions verbally or in writing; if
verbally, how did you record the participant’s responses? Were participants run individually or in groups?
Results
What did you find? The first paragraph in the Results section should include a brief overview of the analyses to be
described. This might include summarizing the hypotheses to be investigated. In subsequent sections, the
researchers should state the specific hypothesis being evaluated and describe the analyses that were performed to
test the hypothesis. The results should then be reported. Generally, one reports descriptive statistics, then inferential
statistics, then states in words what was found. It may be helpful to provide a table or figure to aid in presenting the
results from specific analyses.
→ This section should be a summary of your findings.
→ Begin with a description of the analysis (optional).
→ Describe the data (Means, SDs etc.). If you have lots of summary statistics (i.e. means) to report, use a Graph
or a Table instead of writing them.
o
Remember to give any graphs or tables full titles - remember to label the axes on graphs.
o
Graphs of means should include error bars.
→ Report the findings in sentence form.
→ Include the results of any statistical tests and explain what these tests mean in relation to the experiment and
your initial predictions.
o
Report statistical tests in APA format (your stats handouts will advise you on this for tests we do this
year, and Field (2009) and Field & Hole (2003) also summarise how to report a variety of different
tests).
o
There should be no leading zero before correlation coefficients or probability values. So, it is correct
to report r = .32, or p < .001, but incorrect to report r = 0.32, or p < 0.001.
© Dr. Andy Field, 2008
Page 5
C8057 (Research Methods in Psychology): Writing Laboratory Reports
→ Finally, ask yourself “If the graphs and/or tables were removed, could the reader still understand the results
from the text I have written?” If the answer is ‘no’ then you haven’t included enough information on how you
did your analysis and what it means.
Don’t cut and paste tables straight from SPSS – reformat tables using APA guidelines to include only pertinent
information, and graphs may need to be edited in the SPSS graph editor.
Do not include raw data.
Don’t present the same data in both a graph and a table - do one or the other.
Do not discuss or interpret your results in this section—save it for the discussion section.
Do not try to complicate the results section. You don’t get extra marks for trying to flash for the sake of it.
The best experiments are elegantly designed so that they can be analysed with a straightforward statistical
procedure.
Results
Although you often get told not to ‘interpret’ or ‘discuss’ your results in the results section, this
doesn’t mean that you can’t talk about them at all. Note that I’ve also said that you should ‘report
your results in sentence form’. So, it’s good to report a result and say something like ‘… indicating
that difference in attractiveness ratings due to lighting was present in the sober participants but not
the drunk ones’. That’s not discussing your results, that’s stating what they are. However, you
should try to avoid saying things like ‘…indicating that difference in attractiveness ratings due to
lighting was present in the sober participants but not the drunk ones, which supports Drunk’s
(1978) theory of the beer-goggles effect, in which he states that lighting will magnify the effect of
beer on attraction’.
Example:
Mean Physical Attractive ness Rating
Figure 1 shows the mean attractiveness ratings given by participants in each of the four experimental conditions. The
graph shows that when participants were drunk, the attractiveness ratings were higher than when participants were
sober, supporting the idea that the beer-goggles effect is alcohol dependent. In addition, although the level of lighting
appeared to have an effect in sober participants (attractiveness ratings were higher in bright lighting conditions
compared to dim), in drunk participants lighting had little impact (the means are very similar across lighting
conditions).
Lighting Level
Dim Lighting
60.00
40.00
20.00
Bright Lighting
0.00
Sober (0 Pints)
Drunk (6 Pints L ager)
Alcohol Consumed
Figure 1: Graph showing the mean physical attractiveness ratings (and 95% confidence interval) given by participants
when sober and drunk, and in dim and bright lighting.
© Dr. Andy Field, 2008
Page 6
C8057 (Research Methods in Psychology): Writing Laboratory Reports
A two way 2 (alcohol: 0 pints or 6 pints) × 2 (lighting: dim vs. bright) repeated measures ANOVA was conducted on the
attractiveness ratings. This revealed a significant main effect of alcohol, F(1, 25) = 287.78, p < .001, indicating that
attractiveness ratings were significantly higher when participants were drunk. There was also a significant main effect
of lighting, F(1, 25) = 14.04, p < .01, indicating that attractiveness ratings were significantly higher in dim conditions.
The alcohol × lighting interaction was also significant, F(1, 25) = 47.29, p < .001, indicating that difference in
attractiveness ratings due to lighting was present in the sober participants but not the drunk ones.
APA Format
Reporting your results in APA format IS important because it ensures that we communicate numeric
data in a way that everyone understands. Therefore, using M to represent the mean, SD to
represent the standard deviation and so on, matters because everyone can be 100% clear about
what you’re reporting. So, this is one respect where (in my opnion) attention to detail is good.
Discussion
Start your discussion by summarising your main findings. Even though the results were described in some
detail in the Results section, they should be briefly reviewed here. You shouldn’t include any statistical results
in the discussion, only the conclusions from them. This portion of the Discussion section need not be longer
than a short paragraph.
Then relate these findings back to your original predictions, and in turn what this means in terms of the
question you were originally trying to answer. What are the theoretical implications of your findings?
o
Do the results support, contradict, extend or qualify the previous findings? The implications of each
of the major findings should be discussed. It is particularly important to link the findings obtained in
the study being described with those of other researchers. The reader should be told how the
researcher's findings fit into the available literature on the topic, and what the implications of these
findings could be. Speculation can also be offered to explain the data if they are not consistent with
other research
What are the weaknesses of your own study? Are there any factors that could be improved?
o
When bringing up criticisms of your study in the discussion, relate what you say to the conclusions
you drew. How could the particular point you bring up undermine the conclusions you draw? If it
cannot, then it is not a useful criticism of your study. Just because a variable you did not control e.g.
an individual difference between people (or a materials variable) could influence the dependent
variable, it does not mean there is a problem with your study. Remember the magic of random
assignment of participants to groups. If you bring up a problem explain why it is really a problem.
Suggest some areas for future research based on what you’ve found.
Finally, conclude by summarising the main findings and their implications.
Do not repeat statistical details in your discussion (those that do will be dragged naked through a field of
stinging nettles).
Your lab report should follow the shape of an hour glass. It should start in the introduction in broad terms as you
introduce the background to your study, narrow in the middle as your describe your study in detail, and then broaden
out towards the end as you discuss the implications of your findings.
References
Follow the APA style guidelines summarised below.
Appendix
If more than one set of items is included in the appendix it should be given alphabetically, labelling each with a letter
APPENDIX A, APPENDIX B etc… on separate pages. You won’t normally be marked for materials in the appendix, but it
is worthwhile including materials that you have created especially for the study that the reader would not be able see
somewhere else through a reference. In some cases your results might be worth including, if they would help the
© Dr. Andy Field, 2008
Page 7
C8057 (Research Methods in Psychology): Writing Laboratory Reports
reader in understanding your study, such as the inclusion of transcribed interviews in a qualitative study. Here are
some examples of what you put in:
Full instructions given to participants.
Full list of stimuli presented to participants.
Master copies of questionnaires, forms etc. used in the experiment (e.g. a parental consent form).
Diagrams or sketches of unusual experimental equipment.
Do not include any SPSS output unless you are told to do so.
How to Write Well
A good lab report would be well written, which would involve having well constructed sentences, without grammatical
errors and spelling mistakes. Sentences should follow on from each other logically, and paragraphs should be used
appropriately. Advising how to do this is beyond the scope of this document, but there are numerous guides on the
internet and books in the library that can help you in improving your writing. One classic work is:
→ Strunk, W., Jr., & White, E. B. (1979). The elements of style (3rd ed.). New York: Macmillan. Which is available
online: http://www.bartleby.com/141/
You would also benefit from looking at the style of writing found in articles from psychology journals, and using them
as a model of how to write.
Good writing is a process that takes time, care and practice. Some basic process tips on writing any kind of academic
work are given below:
→ Never turn in a first draft. The secret to good writing is re-writing. Review and edit your paper — several
times, if necessary — to achieve your best work. The quality of your grade will depend on the quality of your
work.
→ Never write your paper the night before (or day) it is due. Write your paper, then walk away from it for a
day or two. You will be surprised at the mistakes and improvements you will discover when you re-visit it!
→ Every paper is too long. A good paper is direct, to the point, and economical. A good exercise is to (a) write
your paper, (b) wait a couple of days; then (c) rewrite your paper cutting the length by one-third.
→ Always proofread your papers. Nothing makes a bad impression on a tutor like a paper that contains obvious
typographical, spelling, punctuation, and grammatical errors. In addition, never rely on your spelling checker
as your proof-reader. Spell checkers generally cannot correct grammatical or punctuation errors. Spell
checkers also miss typographical errors where the word used is incorrect, however, it is spelled properly (e.g.,
form instead of from).
→ Work from an outline. It does not matter if you have all the facts if the reader has to work to make sense of
your paper. Content is not enough. It has to be well-organized. Any lack of organization will be obvious.
→ Make it interesting: Remember that someone is going to read your paper, so make it interesting. No one
likes a flat, monotonous, colourless recitation on a topic.
→ Make sense: give your report to a non-psychologist. If they can understand it then you have probably written
it clearly.
What the Hell is APA Style?
Your lab report should follow the same format as an article submitted to be published in a Psychology Journal. There is
a ‘right’ way to write papers in psychology, which is governed by a set of rules called APA style. This does not refer to
writing style but to an editorial style which is followed by journals of the American Psychological Association (APA) and
used by many other journals in psychological and social sciences. We expect you to follow APA style in all written work
© Dr. Andy Field, 2008
Page 8
C8057 (Research Methods in Psychology): Writing Laboratory Reports
for this course. This editorial style consists of rules or guidelines that a publisher observes to ensure clear and
consistent presentation of written material. Editorial style concerns uniform use of such elements as:
→ Punctuation and abbreviations
→ Construction of tables
→ Selection of headings
→ Citation of references
→ Presentation of statistics
→ Many other elements that are a part of every manuscript
The style is documented in the 440 page long APA Publication Manual (5th ed., 2001). Today the manual is in its fifth
edition (the sixth has just been published but my copy hasn’t arrived yet so I can’t tell you how it differs from the
fifth), and the APA format described in it is a widely recognized standard for scientific writing in psychology and
education. It’s an unwieldy beast, and although copies are available in the Sussex library (Main/Reserve/Short QZ 35
Ame), only a madman would read it from cover to cover. Summaries of the rules for using APA style are available on
the internet. A useful ‘crib sheet’ that summarises important aspects of APA style is:
→ http://www.wooster.edu/psychology/apa-crib.html
This link below has in a great to resource for writing psychology reports and using APA style:
→ http://owl.english.purdue.edu/workshops/hypertext/apa/index.html
The APA Manual draws a distinction between final manuscripts such as class papers, theses, and dissertations, and
copy manuscripts to be submitted for review and publication. Final manuscripts differ from copy manuscripts by
having double spacing and placing figures and tables at the end. Your laboratory reports should be 1.5 spaced (or
double spaced if you want to waste paper) and tables and charts should be placed at appropriate places in the text.
This all Sounds Horribly Complex: I’m Going to Have a Nervous Breakdown!
Don’t (have a nervous breakdown, that is). We don’t expect you to follow APA style to the letter. We aren’t concerned
if you don’t indent paragraphs in the exact way specified by the APA, for example, as long as the lab report looks
presentable. Again, a good way to get an idea of how to format your paper is look at recent journal article in the field
that you are writing on and emulate the style they have used. Articles can be easily viewed from the electronic
resources for psychology section from the library, available at this link:
→ http://www.sussex.ac.uk/library/subjects/psych_indexes_and_abstracts.php
However, there are certain aspects of APA style that we do expect to be adhered to, such as the use of references and
presentation of results, which we will give some pointers for. Other notable aspects are:
→ Word-Processing: Reports should be word-processed, with a size 12 serif font (such as Courier or Times New
Roman) with no handwriting.
→ Use of Colour: Use colour only when it is absolutely necessary – most figures and graphs in APA publications
are clear enough without the use of colour.
→ Numerical Values: Use figures to express numbers 10 and above except at the beginning of a sentence; spell
out words for nine and below, except for numbers used in conjunction with a larger number (e.g., 5 to 12),
numbers in mathematical functions, and numbers denoting place in a series (e.g., Grade 6).
→ Abbreviations: Give the full title of abbreviations on their first usage; don’t overuse abbreviations and
acronyms.
→ Emphasis: A general rule of thumb is to use italics and other marks of emphasis (i.e., such things as quote
marks, dashes to separate words, and capitalized letters) sparingly.
© Dr. Andy Field, 2008
Page 9
C8057 (Research Methods in Psychology): Writing Laboratory Reports
→ Quotations: Short quotations (fewer than 40 words) should be incorporated in the text and longer quotes in
freestanding, indented blocks of lines (double spaced), without quotation marks. Start such a block quotation
on a new line, and indent the block about 1/2 in. (1.3 cm, or five spaces) from the left margin (in the same
position as a new paragraph).
→ Statistical Notation: Throughout your results sections you should follow APA conventions, these will be
highlighted in handouts on particular topics and examples can be found also in Field (2009). The following are
a few common terms: SD (standard deviation); N (total sample); n (portion of a sample); % if preceded by a
number or use P; t (in association with the computed value of a t-test); Mdn (median); M (mean); and p > .05
(for probability greater than .05).
How Do I Reference Material?
→ Your use of evidence is crucial to a successful lab report. Don’t write “evidence suggests…” or “figures show
that 58% of people have some kind of anxiety disorder” – always cite from where your evidence comes.
→ References cited in text must appear in the reference list; conversely, each entry in the reference list must be
cited in text.
→ Don’t include references in the reference list that you didn’t include in the text.
→ You should also not cite articles that you read about in a secondary paper or book, without acknowledging
that you haven’t actually read that article. Guidelines on how to cite secondary sources can be found here:
http://cmhs.utoledo.edu/npiazza/course_info/2ndSource.htm. You can cite secondary sources, by saying
something like: Smith (1998) suggested that anxiety disorders can be bad for you (as cited in Jones, 2000).
You should include the reference to the Jones article at the end, but you don’t include the secondary Smith
reference.
References in the Text
To refer to an item in the list of references from the text, an author-date method should be used. That is, use the
surname of the author (without suffixes) and the year of the publication in the text at appropriate points. Example:
Evidence suggests that drunk people tend to overestimate the attractiveness of the opposite sex (Legless,
1994)
Studies by Legless (1994, 1987) indicate that drunk people tend to overestimate the attractiveness of
members of the opposite sex.
Largerlout (1987) found that alcohol did not impair his ability to judge the attractiveness of women, however,
his subsequent marriage to Daisy the cow casts doubt upon his findings.
Citing Work of Two or More Authors
When a work has two authors, always cite both names every time the reference occurs. For works with three, four, or
five authors, cite all authors the first time the reference occurs. In subsequent citations, include only the last name of
the first author followed by et al.
Reference List at the End
The references should be given on a separate page and listed in alphabetical order. If there is more than one author,
use the first author’s surname. Two papers by the same author go in date order (older one first). If both appeared in
the same year, indicate by letter e.g. 1998a and the second 1998b. The following gives some examples, showing a dual
authored journal article, a web-page, an edited book, a single authored journal article, and a book in an edited
volume. For other examples consult the crib-sheet link given above or the APA publication manual.
Journal articles:
Slaughtered, V., & Offmyface, J. (1994). The effect of alcohol on perception of objects. Journal of Liver
Cirrhosis, 15, 154-167.
Books:
© Dr. Andy Field, 2008
Page 10
C8057 (Research Methods in Psychology): Writing Laboratory Reports
Drunkwoman, M. G. (1992). Beer-Goggles: Fact or fiction. Langered, USA:Betty Ford Clinic Press.
Chapters in Books:
Shit-faced, H. (1991). A few pints never stopped me from being able to accurately judge attractiveness. In
Drunkwoman, M. G. (Ed.) Some boring case histories from people who think that they are immune to the
effects of alcohol (pp. 234-246). Yawn, USA: Boring Press.
Reporting Results
There is a specific way in which to report the results from inferential statistics, which is given in the APA publication
manual. When giving means, always include the units of measurement. Means should be accompanied by their
standard deviations or standard errors (also give units for these). Don’t report more decimal places than you can
precisely measure, as it is implies your tool of measurement is more accurate than it actually is. An example of
sentence from a results section is:
“The mean score in the conflicting condition (37.5s, SD 5.9s) was significantly greater than the mean
score in the consistent condition (24.3s, SD 6.8s) and this difference was significant (t(67) = 4.38, p <
.05).”
Throughout your statistics handouts you will be given advice on APA format for particular techniques. Field (2009) and
Field & Hole (2003) also have examples of how to report results in APA format.
Using tables and figures
'Figures' is the technical term for graphs, charts, drawings and pictures. When correctly used they can be invaluable in
aiding the presentation of complex data. Avoid duplication description of data, i.e. don’t have table and graph that
shows the same thing, and describe the data in detail in your text as well. As well as mentioning the figure or table in
the text, you should also describe in words what they tell you, such as the main trends of results that a figure shows.
Figure checklist for APA style:
1.
All figures included in a paper should be necessary for understanding the results.
2.
Figures should be simple, clean, and free of elaborate detail.
3.
Always double-check to see if data have been plotted correctly.
4.
All figures should be mentioned in the text (e.g. ‘see Figure 1’).
5.
All figure labels are numbered consecutively (Figure 1, Figure 2, etc.).
6.
The length of the vertical (Y) axis should be approximately 2/3 the length of the horizontal (X) axis.
7.
The dependent variable is plotted on the Y-axis, and the independent variable is plotted on the X-axis.
8.
Clearly label each axis with respect to what was measured, quantity measured, and units in which the
variable was measured.
9.
Choose the appropriate scale units (length of intervals) so that the figure will not distort actual data
points.
10.
Make sure that the scale points on each axis have equal intervals.
11.
All figures are followed by a caption, which is written below each figure and ended with a period, e.g:
‘Figure 6. Reaction time in seconds as a function of the intensity of the stimulus’.
Table checklist for APA style
1.
All tables included in a paper should be necessary for understanding the data.
2.
Tables should be simple, clean, and free of elaborate detail.
3.
Always double-check to make sure the data are correct.
4.
All tables should be mentioned in the text.
5.
All table labels should be numbered consecutively (Table 1, Table 2, etc.).
© Dr. Andy Field, 2008
Page 11
C8057 (Research Methods in Psychology): Writing Laboratory Reports
6.
The data are listed in an orderly fashion with the decimal points falling in a straight vertical line.
7.
All tables include a caption which is located directly below the table label. These should be concise but
communicate essential features of the table (what it measures and in what units).
How to write a REALLY good lab report
In the course document there is a guide to what each grade means. This is well worth reading and bearing this in mind
when writing your lab report and in your self-evaluation of it. If you really want to get top marks, then you should be
aiming to write a lab report that, in principle, is worthy of publication. If you want some advice on what makes papers
worthy of getting published and what makes others get rejected, the following guide is useful. This link below is from
APA and provides a gateway to online tutorials and the like.
→ http://www.apastyle.org/
If all as else fails, you might want to read:
→ Field, A.P., & Hole, G. (2003). How to design and report experiments. London: Sage.
General Tips
Write in past tense throughout. The only exception is when you make your predictions at the end of the
introduction; these can be in the future tense (e.g. ‘sobriety will predict accuracy of attractiveness ratings’).
Generally experiments are written up in the passive voice (i.e. it is not appropriate to say ‘I’, ‘we’, or ‘my’).
However, the APA have relaxed on this issue a bit (which is a good thing because it makes science more
readable). However, if your report is littered with ‘we did that’ and ‘we did this’ and ‘I think that’ you will do
badly. It is still the norm that the passive voice is used, it’s just that we won’t complain quite as much as we
used to if the occasional ‘we predict that…’ creeps in.
Make sure any factual assertions are substantiated with a reference or your own data (n.b., your own data
not your own experience): don’t make sweeping statements and generalisations without good evidence.
Saying things like ‘I think the beer goggles effect is rubbish because I can drink 10 pints and never end up
waking up next to a gibbon’ will result in a large electrical current being passed through parts of your
anatomy that ensure the beer goggles effect will no longer be something with which you unduly concern
yourself.
Do not use technical terms (especially statistical ones) inappropriately: the marker will not be fooled!
Do not quote other people without referencing them: this is plagiarism and the university gets very upset
about it.
Do not copy your mate’s report: It is very easy to detect, it is nearly always picked up on, and the results are
usually unpleasant for all concerned.
Acknowledgements
This handout has a long history. Some of it is from an old handout I did in about 1998, it also cribs some stuff from an
old handout of Zoltan Dienes, and much of it comes from a handout Shane Lindsay did in 2004. Shane’s handout used
material found on the following sources:
→ Writing Lab Reports in Psychology, Greg Pierce, Psychology Department, Copyright © 2003 The Trustees of
Hamilton College. All rights reserved.
→ Preparing your laboratory report by Dr. Jan Kennedy, http://www.psychwww.com/tipsheet/labrep.htm
→ Owen Williams, University of Minnesota, Crookston
→ http://www.wooster.edu/psychology/apa-crib.html
© Dr. Andy Field, 2008
Page 12
C8057 (Research Methods in Psychology): Writing Laboratory Reports
Needless to say, you should consult these excellent resources, and I am grateful to the authors for generously making
them available. I also apologise to them for taking their work and inserting loads of gratuitous smut, and my own (no
doubt) extremely bad advice. They should not be blamed for these additions.
© Dr. Andy Field, 2008
Page 13


© Copyright 2026