
course notes - Oak - Northern Arizona University
A Sufficient Introduction to R
Derek Sonderegger
April 23, 2015
1
This set of notes has grown out of teaching applied statistics courses at NAU to graduate students
in Biology, Ecology and Forestry. Typically these students do not have a background in programming
the scripting aspect of R is very challenging. I attempt to be clear and emphasize the major ideas
but leave the documentation of the fine details to references that actually cost money or can be
found on coding forums such as Stack Exchange.
While there is a definite statistical flair to the chosen examples, the reader is not assumed to have
much statistical knowledge, and thus this tutorial can be read prior to an introductory statistical
methods course, or more likely, concurrently with such a course.
Finally, I wish to thank the R community that has created such a wonderful resource and the
package developers that have enriched it so greatly.
Derek Sonderegger
Department of Mathematics and Statistics
Northern Arizona University
2
To Aubrey and Elise, because they make coming home the best part of the day.
Contents
1 Introducing simple calculations and scripts
1.1 R as a simple calculator . . . . . . . . . . .
1.2 Assignment . . . . . . . . . . . . . . . . . .
1.3 Scripts and RMarkdown . . . . . . . . . . .
1.3.1 R Scripts (.R files) . . . . . . . . . .
1.3.2 R Markdown (.Rmd files) . . . . . .
1.4 Exercises . . . . . . . . . . . . . . . . . . .
.
.
.
.
.
.
.
.
.
.
.
.
.
.
.
.
.
.
.
.
.
.
.
.
.
.
.
.
.
.
.
.
.
.
.
.
.
.
.
.
.
.
.
.
.
.
.
.
.
.
.
.
.
.
.
.
.
.
.
.
.
.
.
.
.
.
.
.
.
.
.
.
.
.
.
.
.
.
.
.
.
.
.
.
.
.
.
.
.
.
.
.
.
.
.
.
.
.
.
.
.
.
.
.
.
.
.
.
.
.
.
.
.
.
.
.
.
.
.
.
.
.
.
.
.
.
.
.
.
.
.
.
.
.
.
.
.
.
5
6
7
8
8
8
10
2 Data Structures: Vectors
2.1 Vector Creation . . . . . . . . . . . .
2.2 Accessing Vector Elements . . . . . .
2.3 Scalar Functions Applied to Vectors
2.4 Vector Algebra . . . . . . . . . . . .
2.5 Commonly Used Vector Functions .
2.6 Exercises . . . . . . . . . . . . . . .
.
.
.
.
.
.
.
.
.
.
.
.
.
.
.
.
.
.
.
.
.
.
.
.
.
.
.
.
.
.
.
.
.
.
.
.
.
.
.
.
.
.
.
.
.
.
.
.
.
.
.
.
.
.
.
.
.
.
.
.
.
.
.
.
.
.
.
.
.
.
.
.
.
.
.
.
.
.
.
.
.
.
.
.
.
.
.
.
.
.
.
.
.
.
.
.
.
.
.
.
.
.
.
.
.
.
.
.
.
.
.
.
.
.
.
.
.
.
.
.
.
.
.
.
.
.
.
.
.
.
.
.
.
.
.
.
.
.
11
11
12
13
13
14
15
3 Data Types - Numerical, Strings, Factors, and Logicals
3.1 Integers and Numerics . . . . . . . . . . . . . . . . . . . .
3.2 Character Strings . . . . . . . . . . . . . . . . . . . . . . .
3.3 Factors . . . . . . . . . . . . . . . . . . . . . . . . . . . . .
3.4 Logicals . . . . . . . . . . . . . . . . . . . . . . . . . . . .
3.5 Exercises . . . . . . . . . . . . . . . . . . . . . . . . . . .
.
.
.
.
.
.
.
.
.
.
.
.
.
.
.
.
.
.
.
.
.
.
.
.
.
.
.
.
.
.
.
.
.
.
.
.
.
.
.
.
.
.
.
.
.
.
.
.
.
.
.
.
.
.
.
.
.
.
.
.
.
.
.
.
.
.
.
.
.
.
.
.
.
.
.
17
17
18
19
20
22
4 Data Structures:
4.1 Matrices . . .
4.2 Data Frames
4.3 Lists . . . . .
4.4 Exercises . .
.
.
.
.
.
.
.
.
.
.
.
.
.
.
.
.
.
.
.
.
.
.
.
.
.
.
.
.
.
.
.
.
.
.
.
.
.
.
.
.
.
.
.
.
.
.
.
.
.
.
.
.
.
.
.
.
.
.
.
.
24
24
25
27
30
5 Importing Data
5.1 Comma Separated Data . . . . . . . . . . . . . . . . . . . . . . . . . . . . . . . . . .
5.2 MS Excel . . . . . . . . . . . . . . . . . . . . . . . . . . . . . . . . . . . . . . . . . .
5.3 Exercises . . . . . . . . . . . . . . . . . . . . . . . . . . . . . . . . . . . . . . . . . .
33
33
35
36
6 Manipulating Data Frames
6.1 Classical functions for summarizing
6.1.1 summary() . . . . . . . . .
6.1.2 apply() . . . . . . . . . . .
6.2 Package dplyr . . . . . . . . . . .
6.2.1 Basic actions . . . . . . . .
6.2.2 Split, apply, combine . . . .
6.3 Package tidyr . . . . . . . . . . .
6.4 Exercises . . . . . . . . . . . . . .
37
37
37
38
39
39
42
46
48
.
.
.
.
.
.
.
.
.
.
.
.
.
.
.
.
.
.
Matrices, Data Frames,
. . . . . . . . . . . . . . . .
. . . . . . . . . . . . . . . .
. . . . . . . . . . . . . . . .
. . . . . . . . . . . . . . . .
rows
. . .
. . .
. . .
. . .
. . .
. . .
. . .
3
.
.
.
.
.
.
and Lists
. . . . . . .
. . . . . . .
. . . . . . .
. . . . . . .
and columns
. . . . . . . .
. . . . . . . .
. . . . . . . .
. . . . . . . .
. . . . . . . .
. . . . . . . .
. . . . . . . .
.
.
.
.
.
.
.
.
.
.
.
.
.
.
.
.
.
.
.
.
.
.
.
.
.
.
.
.
.
.
.
.
.
.
.
.
.
.
.
.
.
.
.
.
.
.
.
.
.
.
.
.
.
.
.
.
.
.
.
.
.
.
.
.
.
.
.
.
.
.
.
.
.
.
.
.
.
.
.
.
.
.
.
.
.
.
.
.
.
.
.
.
.
.
.
.
.
.
.
.
.
.
.
.
.
.
.
.
.
.
.
.
.
.
.
.
.
.
.
.
.
.
.
.
.
.
.
.
.
.
.
.
.
.
.
.
.
.
.
.
.
.
.
.
4
CONTENTS
7 Using R for Statistical Tables
7.1 mosaic::plotDist() function
7.2 Base R functions . . . . . . . .
7.2.1 d-function . . . . . . . .
7.2.2 p-function . . . . . . . .
7.2.3 q-function . . . . . . . .
7.2.4 r-function . . . . . . . .
7.3 Exercises . . . . . . . . . . . .
.
.
.
.
.
.
.
.
.
.
.
.
.
.
.
.
.
.
.
.
.
.
.
.
.
.
.
.
.
.
.
.
.
.
.
.
.
.
.
.
.
.
.
.
.
.
.
.
.
.
.
.
.
.
.
.
.
.
.
.
.
.
.
.
.
.
.
.
.
.
.
.
.
.
.
.
.
.
.
.
.
.
.
.
.
.
.
.
.
.
.
.
.
.
.
.
.
.
.
.
.
.
.
.
.
.
.
.
.
.
.
.
.
.
.
.
.
.
.
.
.
.
.
.
.
.
.
.
.
.
.
.
.
.
.
.
.
.
.
.
.
.
.
.
.
.
.
.
.
.
.
.
.
.
.
.
.
.
.
.
.
.
.
.
.
.
.
.
.
.
.
.
.
.
.
.
.
.
.
.
.
.
.
.
.
.
.
.
.
.
.
.
.
.
.
.
.
.
.
.
.
.
.
.
.
.
.
.
.
.
50
50
51
52
54
56
58
58
8 Graphing using ggplot2
8.1 A simple scatterplot .
8.2 Geometries . . . . . .
8.2.1 Bar plots . . .
8.2.2 Histograms . .
8.3 Adjusting labels . . . .
8.4 Faceting . . . . . . . .
8.5 Exercises . . . . . . .
.
.
.
.
.
.
.
.
.
.
.
.
.
.
.
.
.
.
.
.
.
.
.
.
.
.
.
.
.
.
.
.
.
.
.
.
.
.
.
.
.
.
.
.
.
.
.
.
.
.
.
.
.
.
.
.
.
.
.
.
.
.
.
.
.
.
.
.
.
.
.
.
.
.
.
.
.
.
.
.
.
.
.
.
.
.
.
.
.
.
.
.
.
.
.
.
.
.
.
.
.
.
.
.
.
.
.
.
.
.
.
.
.
.
.
.
.
.
.
.
.
.
.
.
.
.
.
.
.
.
.
.
.
.
.
.
.
.
.
.
.
.
.
.
.
.
.
.
.
.
.
.
.
.
.
.
.
.
.
.
.
.
.
.
.
.
.
.
.
.
.
.
.
.
.
.
.
.
.
.
.
.
.
.
.
.
.
.
.
.
.
.
.
.
.
.
.
.
.
.
.
.
.
.
.
.
.
.
.
.
.
.
.
.
.
.
.
.
.
.
.
.
.
.
.
.
.
.
.
.
.
.
.
.
.
.
.
.
.
.
.
.
.
.
.
60
60
63
63
65
68
68
71
9 Flow Control Structures
9.1 Decision statements .
9.2 Loops . . . . . . . . .
9.2.1 While Loops .
9.2.2 For Loops . . .
9.3 Exercises . . . . . . .
.
.
.
.
.
.
.
.
.
.
.
.
.
.
.
.
.
.
.
.
.
.
.
.
.
.
.
.
.
.
.
.
.
.
.
.
.
.
.
.
.
.
.
.
.
.
.
.
.
.
.
.
.
.
.
.
.
.
.
.
.
.
.
.
.
.
.
.
.
.
.
.
.
.
.
.
.
.
.
.
.
.
.
.
.
.
.
.
.
.
.
.
.
.
.
.
.
.
.
.
.
.
.
.
.
.
.
.
.
.
.
.
.
.
.
.
.
.
.
.
.
.
.
.
.
.
.
.
.
.
.
.
.
.
.
.
.
.
.
.
.
.
.
.
.
.
.
.
.
.
.
.
.
.
.
.
.
.
.
.
.
.
.
.
.
.
.
.
.
.
.
.
.
.
.
74
74
76
77
77
79
10 User Defined Functions
10.1 Basic function definition
10.2 Parameter Defaults . . .
10.3 Ellipses . . . . . . . . .
10.4 Function Overloading .
10.5 Scope . . . . . . . . . .
10.6 Exercises . . . . . . . .
.
.
.
.
.
.
.
.
.
.
.
.
.
.
.
.
.
.
.
.
.
.
.
.
.
.
.
.
.
.
.
.
.
.
.
.
.
.
.
.
.
.
.
.
.
.
.
.
.
.
.
.
.
.
.
.
.
.
.
.
.
.
.
.
.
.
.
.
.
.
.
.
.
.
.
.
.
.
.
.
.
.
.
.
.
.
.
.
.
.
.
.
.
.
.
.
.
.
.
.
.
.
.
.
.
.
.
.
.
.
.
.
.
.
.
.
.
.
.
.
.
.
.
.
.
.
.
.
.
.
.
.
.
.
.
.
.
.
.
.
.
.
.
.
.
.
.
.
.
.
.
.
.
.
.
.
.
.
.
.
.
.
.
.
.
.
.
.
.
.
.
.
.
.
.
.
.
.
.
.
.
.
.
.
.
.
.
.
.
.
.
.
.
.
.
.
.
.
.
.
.
.
.
.
82
82
83
86
88
89
91
11 Manipulating Strings
11.1 Base function . . . . . . . . . . . . .
11.1.1 paste() . . . . . . . . . . . .
11.2 Package stringr: basic operations .
11.3 Package stringr: Pattern Matching
11.4 Regular Expressions . . . . . . . . .
11.5 Exercises . . . . . . . . . . . . . . .
.
.
.
.
.
.
.
.
.
.
.
.
.
.
.
.
.
.
.
.
.
.
.
.
.
.
.
.
.
.
.
.
.
.
.
.
.
.
.
.
.
.
.
.
.
.
.
.
.
.
.
.
.
.
.
.
.
.
.
.
.
.
.
.
.
.
.
.
.
.
.
.
.
.
.
.
.
.
.
.
.
.
.
.
.
.
.
.
.
.
.
.
.
.
.
.
.
.
.
.
.
.
.
.
.
.
.
.
.
.
.
.
.
.
.
.
.
.
.
.
.
.
.
.
.
.
.
.
.
.
.
.
.
.
.
.
.
.
.
.
.
.
.
.
.
.
.
.
.
.
.
.
.
.
.
.
.
.
.
.
.
.
92
92
92
93
95
98
99
12 Dates and Times using the lubridate
12.1 Creating Date and Time objects . .
12.2 Extracting information . . . . . . . .
12.3 Arithmetic on Dates . . . . . . . . .
12.4 Exercises . . . . . . . . . . . . . . .
package
. . . . . .
. . . . . .
. . . . . .
. . . . . .
.
.
.
.
.
.
.
.
.
.
.
.
.
.
.
.
.
.
.
.
.
.
.
.
.
.
.
.
.
.
.
.
.
.
.
.
.
.
.
.
.
.
.
.
.
.
.
.
.
.
.
.
.
.
.
.
.
.
.
.
.
.
.
.
.
.
.
.
.
.
.
.
.
.
.
.
.
.
.
.
.
.
.
.
100
100
102
102
103
Chapter 1
Introducing simple calculations and
scripts
R is a open-source program that is commonly used in Statistics. It runs on almost every platform
and is completely free and is available at r-project.org. Most of the cutting-edge statistical research
is first available on R.
R is a script based language, so there is no point and click interface. (Actually there are packages
that attempt to provide a point and click interface, but they are still somewhat primitive.) While
the initial learning curve will be steeper, understanding how to write scripts will be valuable because
it leaves a clear description of what steps you performed in your data analysis. Typically you will
want to write a script in a separate file and then run individual lines. The saves you from having to
retype a bunch of commands and speeds up the debugging process.
This document is a very brief introduction to using R in my course. I highly recommend
downloading and reading/skimming the manual “An Introduction to R” which is located at http:
//cran.r-project.org/doc/manuals/R-intro.pdf.
Finding help about a certain function is very easy. At the prompt, just type help(function.name)
or ?function.name. If you don’t know the name of the function, your best bet is to go the the
web page www.rseek.org which will search various R resources for your keyword(s). Another great
resource is the coding question and answer site stackoverflow.com.
The basic editor that comes with R works fairly well, but you should consider running R through
the program RStudio which is located at www.rstudio.org.
The prompt > is waiting for you to input a command. The prompt + tells you that the current
command is spanning multiple lines. In a script file you might have typed something like this:
for( i in 1:5 ){
print(i)
}
But when you copy and paste it into the console in R you’ll see something like this:
> for (i in 1:5) {
+ print(i)
+ }
If you type your commands into a file, you won’t type the > or + prompts. For the rest of the
tutorial, I will show the code as you would type it into a script and I will show the output being
shown with two hashtags (##) before it to designate that it is output.
When doing anything more difficult than simple algebra, you should write your commands in a
script instead of directly to the console. The reason why is that unless you are a perfect typist and
never make a mistake, creating a script file with the correct commands will save a massive amount
5
CHAPTER 1. INTRODUCING SIMPLE CALCULATIONS AND SCRIPTS
6
of re-typing. Furthermore, having a script file fully documents how you did your analysis, which
can help when writing the methods section of a paper. Finally, having a script makes it easy to
re-run an analysis after a change in the data (additional data values, transformed data, or removal
of outliers).
It often makes your script more readable if you break a single command up into multiple lines.
R will disregard all whitespace (including line breaks) so you can safely spread your command over
as multiple lines. Finally, it is useful to leave comments in the script for things such as explaining a
tricky step, who wrote the code and when, or why you chose a particular name for a variable. The
# sign will denote that the rest of the line is a comment and R will ignore it.
1.1
R as a simple calculator
Assuming that you have started R on whatever platform you like, you can use R as a simple
calculator. At the prompt, type 2+3 and hit enter. What you should see is the following:
# Some simple addition
2+3
## [1] 5
In this fashion you can use R as a very capable calculator.
6*8
## [1] 48
4^3
## [1] 64
exp(1)
## [1] 2.718282
R has most constants and common mathematical functions you could ever want. sin(), cos(),
and other trigonometry functions are available, as are the exponential and log functions exp(),
log(). The absolute value is given by abs(), and round() will round a value to the nearest integer.
pi
## [1] 3.141593
sin(0)
## [1] 0
log(5)
# Unless you specify the base, R will assume base e
## [1] 1.609438
log(5, base=10)
## [1] 0.69897
Whenever I call a function, there will be some arguments that are mandatory, and some that are
optional and the arguments are separated by a comma. In the above statements the function log()
CHAPTER 1. INTRODUCING SIMPLE CALCULATIONS AND SCRIPTS
7
requires at least one argument, and that is the number(s) to take the log of. However, the base
argument is optional. If you do not specify what base to use, R will use a default value. You can
see that R will default to using base e by looking at the help page (by typing help(log) or ?log at
the command prompt).
Arguments can be specified via the order in which they are passed or by naming the arguments.
So for the log() function which has arguments log(x, base=exp(1)). If I specify which arguments
are which using the named values, then order doesn’t matter.
# Demonstrating order does not matter if you specify
# which argument is which
log(x=5, base=10)
## [1] 0.69897
log(base=10, x=5)
## [1] 0.69897
But if we don’t specify which argument is which, R will decide that x is the first argument, and
base is the second.
# If not specified, R will assume the second value is the base...
log(5, 10)
## [1] 0.69897
log(10, 5)
## [1] 1.430677
When I specify the arguments, I have been using the name=value notation and a student might
be tempted to use the <- notation here1 . Don’t do that as the name=value notation is making an
association mapping and not a permanent assignment.
1.2
Assignment
We need to be able to assign a value to a variable to be able to use it later. R does this by using an
arrow ’<-’ or an equal sign ’=’. While R supports either, for readability, I suggest people pick one
assignment operator and stick with it. I personally prefer to use the arrow. Variable names cannot
start with a number, may not include spaces, and are case sensitive.
tau <- 2*pi
my.test.var = 5
tau
## [1] 6.283185
my.test.var
## [1] 5
tau * my.test.var
## [1] 31.41593
1 See
next section.
CHAPTER 1. INTRODUCING SIMPLE CALCULATIONS AND SCRIPTS
8
As your analysis gets more complicated, you’ll want to save the results to a variable so that
you can access the results later2 . If you don’t assign the result to a variable, you have no way of
accessing the result. 3
1.3
Scripts and RMarkdown
One of the worst things about a pocket calculator is there is no good way to go several steps and
easily see what you did or fix a mistake (there is nothing more annoying than re-typing something
because of a typo. To avoid these issues I always work with script (or RMarkdown) files instead
of typing directly into the console. You will quickly learn that it is impossible to write R code
correctly the first time and you’ll save yourself a huge amount of work by just embracing scripts
(and RMarkdown) from the beginning.
1.3.1
R Scripts (.R files)
The first type of file that we’ll discuss is a traditional script file. To create a new .R script in RStudio
go to File -> New File -> R Script. This opens a new window in RStudio where you can type
commands and functions as a common text editor. Type whatever you like in the script window and
then you can execute the code line by line (using the run button or its keyboard shortcut to run the
highlighted region or whatever line the curser is on) or the entire script (using the source button).
Other options for what piece of code to run are available under the Code dropdown box.
An R script for a homework assignment might look something like this:
# Problem 1
# Calculate the log of a couple of values and make a plot
# of the log function from 0 to 3
log(0)
log(1)
log(2)
x <- seq(.1,3, length=1000)
plot(x, log(x))
# Problem 2
# Calculate the exponential function of a couple of values
# and make a plot of the function from -2 to 2
exp(-2)
exp(0)
exp(2)
x <- seq(-2, 2, length=1000)
plot(x, exp(x))
This looks perfectly acceptable as a way of documenting what you did, but this script file doesn’t
contain the actual results of commands I ran, nor does it show you the plots. Also anytime I want
to commend on some output, it needs to be offset with the commenting character #. It would be
nice to have both the commands and the results merged into one document. This is what the R
Markdown file does for us.
1.3.2
R Markdown (.Rmd files)
When I was a graduate student, I had to tediously copy and past tables of output from the R console
and figures I had made into my Microsoft Word document. Far too often I would realize I had made
2 To
paraphrase Beyonce, “Cause if you liked it, then you should have put a name on it.”
isn’t strictly true, the variable .Last.value always has the result of the last expression evaluated, but you
can’t go any farther back.
3 This
CHAPTER 1. INTRODUCING SIMPLE CALCULATIONS AND SCRIPTS
9
a small mistake in part (b) of a problem and would have to go back, correct my mistake, and then
redo all the laborious copying. I often wished that I could write both the code for my statistical
analysis and the long discussion about the interpretation all in the same document so that I could
just re-run the analysis with a click of a button and all the tables and figures would be updated by
magic. Fortunately that magic4 now exists.
To create a new R Markdown document, we use the File -> New File -> R Markdown... dropdown option and a menu will appear asking you for the document title, author, and preferred output
type. In order to create a PDF, you’ll need to have LATEX installed, but the HTML output nearly
always works and I’ve had good luck with the MS Word output as well.
The R Markdown is an implementation of the Markdown syntax that makes it extremely easy to
write webpages and give instructions for how to do typesetting sorts of things. This syntax was
extended to allow use to embed R commands directly into the document. Perhaps the easiest way
to understand the syntax is to look at an example:
--output: word_document
--#Problem 1#
Calculate the log of a couple of values and make a plot of
the log function from 0 to 3. First we will calculate some values...
```{r}
log(0)
log(1)
log(2)
```
Notice that log(0) is equal to -infinity and log(1) == 0. Next we'll make a nice plot.
```{r, fig.height=2, fig.width=4}
x <- seq(.1,3, length=1000)
plot(x, log(x))
```
Notice that this function is only defined for positive values of X and
is monotonically increasing from -infinity to +infinity as X goes from 0 to infinity.
#Problem 2#
Calculate the exponential function of a couple of values and make a
plot of the function from -2 to 2.
```{r}
exp(-2)
exp(0)
exp(2)
```
The most important of these is to notice that e^0=1. Next we'll make a nice plot
```{r}
x <- seq(-2, 2, length=1000)
plot(x, exp(x))
```
Notice that this function is also monotonically increasing but now the X
range is -infinity to +infinity while the output lives in [0, infinity).
This is because the log and exponential functions are inverses of each other.
4 Clark’s
third law states “Any sufficiently advanced technology is indistinguishable from magic.”
CHAPTER 1. INTRODUCING SIMPLE CALCULATIONS AND SCRIPTS
10
The R code in my document is nicely separated from my regular text using the three backticks and
an instruction that it is R code that needs to be evaluated. The output of this document looks good
as a HTML, PDF, or MS Word document.
This template is sufficient to get a student through STA 570 and its lab section, but more
information about Markdown syntax and all of its different tricks can be found online. In particular,
I’ve found the following links to be quite useful.
• http://daringfireball.net/projects/markdown/syntax
• http://markdown-guide.readthedocs.org/en/latest/basics.html
1.4
Exercises
Create an RMarkdown file that solves the following exercises.
1. Calculate log (6.2) first using base e and second using base 10. To figure out how to do different
bases, it might be helpful to look at the help page for the log function.
2. Calculate the square root of 2 and save the result as the variable named sqrt2. Have R display
the decimal value of sqrt2.
Chapter 2
Data Structures: Vectors
2.1
Vector Creation
R operates on vectors where we think of a vector as a collection of objects, usually numbers. The
first thing we need to be able to do is define an arbitrary collection using the c() function1 .
# Define the vector of numbers 1, ..., 4
c(1,2,3,4)
## [1] 1 2 3 4
There are many other ways to define vectors. The function rep(x, times) just repeats x a the
number times specified by times.
rep(2, 5)
## [1] 2 2 2 2 2
rep( c('A','B'), 3 )
## [1] "A" "B" "A" "B" "A" "B"
Finally, we can also define a sequence of numbers using the seq(to, from, by, length.out)
function which expects the user to supply 3 out of 4 possible arguments. The possible arguments are
from, to, by, and length.out. From is the starting point of the sequence, to is the ending point,
by is the difference between any two successive elements, and length.out is the total number of
elements in the vector.
1 The
“c” stands for collection.
11
CHAPTER 2. DATA STRUCTURES: VECTORS
12
seq(from=1, to=4, by=1)
## [1] 1 2 3 4
seq(1,4)
# 'by' has a default of 1
## [1] 1 2 3 4
1:4
# a shortcut for seq(1,4)
## [1] 1 2 3 4
seq(1,5, by=.5)
## [1] 1.0 1.5 2.0 2.5 3.0 3.5 4.0 4.5 5.0
seq(1,5, length.out=11)
##
[1] 1.0 1.4 1.8 2.2 2.6 3.0 3.4 3.8 4.2 4.6 5.0
If we have two vectors and we wish to combine them, we can again use the c() function.
vec1 <- c(1,2,3)
vec2 <- c(4,5,6)
vec3 <- c(vec1, vec2)
vec3
## [1] 1 2 3 4 5 6
2.2
Accessing Vector Elements
Suppose I have defined a vector
foo <- c('A', 'B', 'C', 'D', 'F')
and I am interested in accessing whatever is in the first spot of the vector. Or perhaps the 3rd or
5th element. To do that we use the [] notation, where the square bracket represents a subscript.
foo[1]
# First element in vector foo
## [1] "A"
foo[4]
# Fourth element in vector foo
## [1] "D"
This subscripting notation can get more complicated. For example I might want the 2nd and 3rd
element or the 3rd through 5th elements.
foo[c(2,3)]
# elements 2 and 3
## [1] "B" "C"
foo[ 3:5 ]
# elements 3 to 5
## [1] "C" "D" "F"
CHAPTER 2. DATA STRUCTURES: VECTORS
13
Finally, I might be interested in getting the entire vector except for a certain element. To do
this, R allows us to use the square bracket notation with a negative index number.
foo[-1]
# everything but the first element
## [1] "B" "C" "D" "F"
foo[ -1*c(1,2) ] # everything but the first two elements
## [1] "C" "D" "F"
Now is a good time to address what is the [1] doing in our output? Because vectors are often
very long and might span multiple lines, R is trying to help us by telling us the index number of the
left most value. If we have a very long vector, the second line of values will start with the index of
the first value on the second line.
# The letters vector is a vector of all 26 lower-case letters
letters
## [1] "a" "b" "c" "d" "e" "f" "g" "h" "i" "j" "k" "l" "m" "n" "o" "p" "q"
## [18] "r" "s" "t" "u" "v" "w" "x" "y" "z"
Here the [1] is telling me that ’a’ is the first element of the vector and the [18] is telling me that
’r’ is the 18th element of the vector.
2.3
Scalar Functions Applied to Vectors
It is very common to want to perform some operation on all the elements of a vector simultaneously.
For example, I might want take the absolute value of every element. Functions that are inherently
defined on single values will almost always apply the function to each element of the vector if given
a vector.
x <- -5:5
x
##
[1] -5 -4 -3 -2 -1
0
1
2
3
4
5
abs(x)
##
[1] 5 4 3 2 1 0 1 2 3 4 5
exp(x)
## [1] 6.737947e-03 1.831564e-02 4.978707e-02 1.353353e-01 3.678794e-01
## [6] 1.000000e+00 2.718282e+00 7.389056e+00 2.008554e+01 5.459815e+01
## [11] 1.484132e+02
2.4
Vector Algebra
All algebra done with vectors will be done element-wise by default.2 So two vectors added together
result in their individual elements being summed.
2 For
matrix and vector multiplication as usually defined by mathematicians, use %*% instead of *.
CHAPTER 2. DATA STRUCTURES: VECTORS
14
x <- 1:4
y <- 5:8
x + y
## [1]
6
8 10 12
x * y
## [1]
5 12 21 32
R does another trick when doing vector algebra. If the lengths of the two vectors don’t match, R
will recycle the elements of the shorter vector to come up with vector the same length as the longer.
This is potentially confusing, but is most often used when adding a long vector to a vector of length
1.
x <- 1:4
x + 1
## [1] 2 3 4 5
2.5
Commonly Used Vector Functions
Function
min(x)
max(x)
length(x)
sum(x)
mean(x), median(x)
var(x), sd(x)
Result
returns the minimum element of the vector x
maximum element of x
number of elements in x
sum of all the elements in x
mean and median of all the elements in x
variance and standard deviations of elements of x
Putting this all together, we can easily perform tedious calculations with ease. To demonstrate
how scalars, vectors, and functions of them work together, we will calculate the variance of 5 numbers.
Recall that variance is defined as
Pn
2
(xi − x
¯)
V ar (x) = i=1
n−1
CHAPTER 2. DATA STRUCTURES: VECTORS
x <- c(2,4,6,8,10)
xbar <- mean(x)
xbar
15
# calculate the mean
## [1] 6
x - xbar
# calculate the errors
## [1] -4 -2
0
2
4
0
4 16
(x-xbar)^2
## [1] 16
4
sum((x-xbar)^2)
## [1] 40
n <- length(x)
n
# how many data points do we have
## [1] 5
sum((x-xbar)^2)/(n-1)
# calculating the variance by hand
## [1] 10
var(x)
# Same thing using the built-in variance function
## [1] 10
2.6
Exercises
1. Create a vector of three elements (2,4,6) and name that vector vec_a. Create a second vector,
vec_b, that contains (8,10,12). Add these two vectors together and name the result vec_c.
2. Create a vector, named vec_d, that contains only two elements (14,20). Add this vector to
vec_a. What is the result and what do you think R did (look up the recycling rule in your
text book)? What is the warning message that R gives you?
3. Next add 5 to the vector vec_a. What is the result and what did R do? Why doesn’t in give
you a warning message similar to what you saw in the previous problem?
4. Generate the vector of integers {1, 2, . . . 5} in two different ways. First use the seq() function
and second use the a:b shortcut.
5. Generate the vector of even numbers {2, 4, 6, . . . , 20} using both the seq() function and using
the a:b shortcut and some subsequent algebra. Hint: Generate a vector and multiple it by 2.
6. Generate a vector of 1001 elements that are evenly placed between 0 and 1 using the seq()
command and name this vector x.
7. Generate the vector {2, 4, 8, 2, 4, 8, 2, 4, 8} using the rep() command to replicate the vector
c(2,4,8).
8. Generate the vector {2, 2, 2, 2, 4, 4, 4, 4, 8, 8, 8, 8} using the rep() command. You might need
to check the help file for rep() to see all of the options that rep() will accept. In particular,
look at the optional argument each=.
CHAPTER 2. DATA STRUCTURES: VECTORS
9. The vector letters is a built-in vector to R and contains the lower case English alphabet.
(a) Extract the 9th element of the letters vector.
(b) Extract the sub-vector that contains the 9th, 11th, and 19th elements.
(c) Extract the sub-vector that contains everything except the last two elements.
16
Chapter 3
Data Types - Numerical, Strings,
Factors, and Logicals
There are some basic data types that are commonly used.
1. Integers - These are the integer numbers (. . . , −2, −1, 0, 1, 2, . . . ). To convert a numeric value
to an integer you may use the function as.integer().
2. Numeric - These could be any number (whole number or decimal). To convert another type
to numeric you may use the function as.numeric().
3. Strings - These are a collection of characters (example: Storing a student’s last name). To
convert another type to a string, use as.character().
4. Factors - These are strings that can only values from a finite set. For example we might wish
to store a variable that records home department of a student. Since the department can only
come from a finite set of possibilities, I would use a factor. Factors are categorical variables,
but R calls them factors instead of categorical variable. A vector of values of another type can
always be converted to a factor using the as.factor() command.
5. Logicals - This is a special case of a factor that can only take on the values TRUE and FALSE.
(Be careful to always capitalize TRUE and FALSE. Because R is case-sensitive, TRUE is not the
same as true. Using the function as.logical() you can convert numeric values to TRUE and
FALSE where 0 is FALSE and anything else is TRUE.
Depending on the command, R will coerce your data if necessary, but it is a good habit to do
the coercion yourself. If a variable is a number, R will automatically assume that it is continuous
numerical variable. If it is a character string, then R will assume it is a factor when doing any
statistical analysis.
To find the type of an object, the str() command gives the type, and if the type is complicated,
it describes the structure of the object.
3.1
Integers and Numerics
Integers and numerics are exactly what they sound like. Integers can take on whole number values,
while numerics can take on any decimal value. The reason that there are two separate data types
is that integers require less memory to store than numerics. For most users, the distinction can be
ignored.
17
CHAPTER 3. DATA TYPES - NUMERICAL, STRINGS, FACTORS, AND LOGICALS
18
x <- c(1,2,1,2,1)
# show that x is of type 'numeric'
str(x)
##
3.2
num [1:5] 1 2 1 2 1
Character Strings
In R, we can think of collections of letters and numbers as a single entity called a string. Other
programming languages think of strings as vectors of letters, but R does not so you can’t just pull
off the first character using vector tricks. In practice, there are no limits as to how long string can
be.
x <- "Goodnight Moon"
# Notice x is of type character (chr)
str(x)
##
chr "Goodnight Moon"
# R doesn't care if I use single quotes or double quotes, but don't mix them...
y <- 'Hop on Pop!'
# we can make a vector of character strings
Books <- c(x, y, 'Where the Wild Things Are')
Books
## [1] "Goodnight Moon"
"Hop on Pop!"
## [3] "Where the Wild Things Are"
Character strings can also contain numbers and if the character string is in the correct format
for a number, we can convert it to a number.
x <- '5.2'
str(x)
# x really is a character string
##
chr "5.2"
x
## [1] "5.2"
as.numeric(x)
## [1] 5.2
If we try an operation that only makes sense on numeric types (like addition) then R complain
unless we first convert it1 .
1 There are places where R will try to coerce an object to another data type but it happens inconsistently and you
should just do the conversion yourself.
CHAPTER 3. DATA TYPES - NUMERICAL, STRINGS, FACTORS, AND LOGICALS
19
x+1
## Error in x + 1:
non-numeric argument to binary operator
as.numeric(x) + 1
## [1] 6.2
3.3
Factors
Factors are how R keeps track of categorical variables. R does this in a two step pattern. First it
figures out how many categories there are and remembers which category an observation belongs
two and second, it keeps a vector character strings that correspond to the names of each of the
categories.
# A charater vector
y <- c('B','B','A','A','C')
y
## [1] "B" "B" "A" "A" "C"
# convert the vector of characters into a vector of factors
z <- factor(y)
str(z)
##
Factor w/ 3 levels "A","B","C": 2 2 1 1 3
Notice that the vector z is actually the combination of group assignment vector 2,2,1,1,3 and the
group names vector “A”,”B”,”C”. So we could convert z to a vector of numerics or to a vector of
character strings.
as.numeric(z)
## [1] 2 2 1 1 3
as.character(z)
## [1] "B" "B" "A" "A" "C"
Often we need to know what possible groups there are, and this is done using the levels() command.
levels(z)
## [1] "A" "B" "C"
Notice that the order of the group names was done alphabetically, which we did not chose. This
ordering of the levels has implications when we do an analysis or make a plot and R will always
display information about the factor levels using this order. It would be nice to be able to change
the order. Also it would be really nice to give more descriptive names to the groups rather than just
the group code in my raw data. I find it is usually easiest to just convert the vector to a character
vector, and then convert it back using the levels argument to define the order of the groups, and
labels to define the modified names.
CHAPTER 3. DATA TYPES - NUMERICAL, STRINGS, FACTORS, AND LOGICALS
20
z <- factor(z, levels=c('B','A','C'), labels=c("B Group", "A Group", "C Group"))
z
## [1] B Group B Group A Group A Group C Group
## Levels: B Group A Group C Group
Often we wish to take a continuous numerical vector and transform it into a factor. The function
cut() takes a vector of numerical data and creates a factor based on your give cut-points.
# Define a continuous vector to convert to a factor
x <- 1:10
# divide range of x into three groups of equal length
cut(x, breaks=3)
## [1] (0.991,4] (0.991,4] (0.991,4] (0.991,4] (4,7]
## [8] (7,10]
(7,10]
(7,10]
## Levels: (0.991,4] (4,7] (7,10]
(4,7]
(4,7]
# divide x into four groups, where I specify all 5 break points
cut(x, breaks = c(0, 2.5, 5.0, 7.5, 10))
## [1] (0,2.5] (0,2.5] (2.5,5] (2.5,5] (2.5,5]
## [8] (7.5,10] (7.5,10] (7.5,10]
## Levels: (0,2.5] (2.5,5] (5,7.5] (7.5,10]
(5,7.5]
(5,7.5]
# divide x into 3 groups, but give them a nicer
# set of group names
cut(x, breaks=3, labels=c('Low','Medium','High'))
## [1] Low
Low
Low
## Levels: Low Medium High
3.4
Low
Medium Medium Medium High
High
High
Logicals
Often I wish to know which elements of a vector are equal to some value, or are greater than
something. R allows us to make those tests at the vector level.
Very often we need to make a comparison and test if something is equal to something else, or
if one thing is bigger than another. To test these, we will use the <, <=, ==, >=, >, and !=
operators. These can be used similarly to
6 < 10
# 6 less than 10?
## [1] TRUE
6 == 10
# 6 equal to 10?
## [1] FALSE
6 != 10
# 6 not equal to 10?
## [1] TRUE
where we used 6 and 10 just for clarity. The result of each of these is a logical value (a TRUE or
FALSE). In most cases these would be variables you had previously created and were using. Assign
CHAPTER 3. DATA TYPES - NUMERICAL, STRINGS, FACTORS, AND LOGICALS
21
values to variable a and to variable b and test if a < b.
Suppose I have a vector of numbers and I want to get all the values greater than 16. Using the >
comparison, I can create a vector of logical values that tells me if the specified value is greater than
16. The which() takes a vector of logicals and returns the indices that are true.
x <- 1:20
x > 16
# a vector of 20 integers
# a vector of 20 logicals
## [1] FALSE FALSE FALSE FALSE FALSE FALSE FALSE FALSE FALSE FALSE FALSE
## [12] FALSE FALSE FALSE FALSE FALSE TRUE TRUE TRUE TRUE
indices <- which( x > 16 )
indices
## [1] 17 18 19 20
x[ indices ]
## [1] 17 18 19 20
On function I find to be occasionally useful is the is.element function which allows me to figure
out which elements of a vector are one of a set of possibilities. For example, I might want to know
which elements of the letters vector are vowels.
letters
# recall this is all 26 english lowercase letters
## [1] "a" "b" "c" "d" "e" "f" "g" "h" "i" "j" "k" "l" "m" "n" "o" "p" "q"
## [18] "r" "s" "t" "u" "v" "w" "x" "y" "z"
vowels <- c('a','e','i','o','u')
which( is.element(letters, vowels) )
## [1]
1
5
9 15 21
This shows me the vowels occur at the 1st, 5th, 9th, 15th, and 21st elements of the alphabet.
Often I want to make multiple comparisons, for example maybe I want to find all undergraduate
Forestry majors with a GPA greater than 3.0. Then give my set of university students I want ask
two questions: Is their major Forestry, and is their GPA greater than 3.0. So I need to combine
those two logical results into a single logical that is true if both questions are true. The command &
means “and” and | means “or”. We can combine two logical values using these two similarly:
TRUE
& TRUE
# both are true so combo so result is true
## [1] TRUE
TRUE
& FALSE
# one true and one false so result is false
## [1] FALSE
FALSE & FALSE
## [1] FALSE
# both are false so the result is false
CHAPTER 3. DATA TYPES - NUMERICAL, STRINGS, FACTORS, AND LOGICALS
TRUE
| TRUE
22
# at least one is true -> TRUE
## [1] TRUE
TRUE
| FALSE
# at least one is true -> TRUE
## [1] TRUE
FALSE | FALSE
# neither is true -> FALSE
## [1] FALSE
3.5
Exercises
1. Create a vector of character strings with six elements
test <- c('red','red','blue','yellow','blue','green')
(a) Transform the test vector just you created into a factor.
(b) Use the levels() command to determine the levels (and order) of the factor you just
created.
(c) Transform the factor you just created into integers. Comment on the relationship between
the integers and the order of the levels you found in part (b).
(d) Use some sort of comparison to create a vector that identifies which factor elements are
the red group.
2. Given the vector of ages,
ages <- c(17, 18, 16, 20, 22, 23)
create a factor that has levels Minor or Adult where any observation greater than or equal to
18 qualifies as an adult.
3. Suppose we vectors that give a students name, their GPA, and their major. We want to come
up with a list of forestry students with a GPA of greater than 3.0.
Name <- c('Adam','Benjamin','Caleb','Daniel','Ephriam', 'Frank','Gideon')
GPA <- c(3.2, 3.8, 2.6, 2.3, 3.4, 3.7, 4.0)
Major <- c('Math','Forestry','Biology','Forestry','Forestry','Math','Forestry')
(a) Create a vector of TRUE/FALSE values that indicate whether the students GPA is greater
than 3.0.
(b) Create a vector of TRUE/FALSE values that indicate whether the students’ major is forestry.
(c) Create a vector of TRUE/FALSE values that indicates if a student has a GPA greater than
3.0 and is a forestry major.
(d) Convert the vector of TRUE/FALSE values in part (b) to integer values using the as.numeric()
function. Which numeric value corresponds to TRUE?
(e) Sum the vector of numbers you created in part (c) to count the number of values in x
that are less than or equal to 0.
4. Make two variables, and call them a and b where a=2 and b=10. I want to think of these as
defining an interval.
CHAPTER 3. DATA TYPES - NUMERICAL, STRINGS, FACTORS, AND LOGICALS
23
(a) Define the vector x <- c(-1, 5, 12)
(b) Using the &, come up with a comparison that will test if the value of x is in the interval
[a, b]. (We want the test to return TRUE if a ≤ x ≤ b). That is, test if a is less than
x and if x is less than b. Confirm that for x defined above you get the correct vector of
logical values.
(c) Similarly make a comparison that tests if x is outside the interval [a, b] using the |
operator. That is, test if x < a or x > b. I want the test to return TRUE is x is less than
a or if x is greater than b. Confirm that for x defined above you get the correct vector of
logical values.
Chapter 4
Data Structures: Matrices, Data
Frames, and Lists
4.1
Matrices
We often want to store numerical data in a square or rectangular format and mathematicians will
call these “matrices”. These will have two dimensions, rows and columns. To create a matrix in R
we can create it directly using the matrix() command which requires the data to fill the matrix
with, and optionally, some information about the number of rows and columns:
The alternative to this is we could create two columns as individual vectors and just push them
together. Or we could have made three rows and lump them by rows instead. To do this we’ll use a
group of functions that bind vectors together. To join two column vectors together, we’ll use cbind
and to bind rows together we’ll use the rbind function
first <- c(1,2,3)
second <- c(4,5,6)
cbind(first, second)
##
first second
## [1,]
1
4
## [2,]
2
5
## [3,]
3
6
rbind(first, second)
##
[,1] [,2] [,3]
## first
1
2
3
## second
4
5
6
Notice that doing this has provided R with some names for the individual rows and columns. I
can change these using the commands colnames() and rownames().
24
CHAPTER 4. DATA STRUCTURES: MATRICES, DATA FRAMES, AND LISTS
25
M <- matrix(1:6, nrow=3, ncol=2, byrow=TRUE)
colnames(M) <- c('Column1', 'Column2')
rownames(M) <- c('Row1', 'Row2','Row3')
M
##
Column1 Column2
## Row1
1
2
## Row2
3
4
## Row3
5
6
Accessing a particular element of a matrix is done in a similar manner as with vectors, using the
[] notation, but this time we must specify which row and which column. Notice that this scheme
always is [row, col].
M1 <- matrix(1:6, nrow=3, ncol=2)
M1
##
[,1] [,2]
## [1,]
1
4
## [2,]
2
5
## [3,]
3
6
M1[1,2] # Grab row 1, column 2 value
## [1] 4
M1[1, 1:2]
# grab the 1st and 2nd elements in row 1
## [1] 1 4
I might want to grab a single row or a single column out of a matrix, which is sometimes referred
to as taking a slice of the matrix. I could figure out how long that vector is, but often I’m too lazy.
Instead I can just specify the specify the particular row or column I want.
M1
##
[,1] [,2]
## [1,]
1
4
## [2,]
2
5
## [3,]
3
6
M1[1,]
# grab the 1st row
## [1] 1 4
M1[,2]
# grab second column
## [1] 4 5 6
4.2
Data Frames
Matrices are great for mathematical operations, but I also want to be able to store data that is
numerical. For example I might want to store a categorical variable such as manufacturer brand. To
generalize our concept of a matrix to include these types of data, we will create a structure called a
data.frame. These are very much like a simple Excel spreadsheet where each column represents a
CHAPTER 4. DATA STRUCTURES: MATRICES, DATA FRAMES, AND LISTS
26
different trait or measurement type and each row will represent an individual.
Perhaps the easiest way to create a data frame is to just type the columns of data
data <- data.frame(
Name = c('Bob','Jeff','Mary'),
Score = c(90, 75, 92)
)
# Show the data.frame
data
##
Name Score
## 1 Bob
90
## 2 Jeff
75
## 3 Mary
92
Because a data frame feels like a matrix, R also allows matrix notation for accessing particular
values.
format
result
[a,b] element in row a and column b
[a,]
all elements in row a
[,b]
all elements in column b
data[1,1]
## [1] Bob
## Levels: Bob Jeff Mary
data[2,]
##
Name Score
## 2 Jeff
75
data[,2]
## [1] 90 75 92
Because the columns have meaning and we have given them column names, it is desirable to
want to access an element by the name of the column as opposed to the column number.1
data$Name
## [1] Bob Jeff Mary
## Levels: Bob Jeff Mary
data$Name[2]
## [1] Jeff
## Levels: Bob Jeff Mary
I can mix the [] notation with the column names. The following is also acceptable:
1 In
large Excel spreadsheets I often get annoyed trying to remember which column something was in and muttering
“Was total biomass in column P or Q?” A system where I could just name the column Total.Biomass and be done
with it is much nicer to work with and I make fewer dumb mistakes.
CHAPTER 4. DATA STRUCTURES: MATRICES, DATA FRAMES, AND LISTS
27
data[, 'Name']
## [1] Bob Jeff Mary
## Levels: Bob Jeff Mary
The next thing we might wish to do is add a new column to a preexisting data frame. There are
two ways to do this. First, we could use the cbind() function to bind two data frames together.
Second we could reference a new column name and assign values to it.
Second.score <- data.frame(Score2=c(41,42,43))
data <- cbind( data, Second.score )
data
##
Name Score Score2
## 1 Bob
90
41
## 2 Jeff
75
42
## 3 Mary
92
43
data$Score3 <- c(61,62,63) # the Score3 column will created
data
##
Name Score Score2 Score3
## 1 Bob
90
41
61
## 2 Jeff
75
42
62
## 3 Mary
92
43
63
Data frames are very commonly used and many commonly used functions will take a data
argument and all other arguments are assumed to be in the given data frame. Unfortunately this
is not universally supported by all functions and you must look at the help file for the function you
are interested in.
4.3
Lists
Data frames are quite useful for storing data but sometimes we’ll need to store a bunch of different
pieces of information and it won’t fit neatly as a data frame. The most general form of a data
structure is called a list. This can be thought of as a vector of objects where there is no requirement
for each element to be the same type of object.
Consider that I might need to store information about person. For example, suppose that I want
make an object that holds information about my immediate family. This object should have my
spouse’s name (just one name) as well as my siblings. But since I have many siblings, I want the
siblings to be a vector of names. Likewise I might also include my pets, but we don’t want any
requirement that the number of pets is the same as the number of siblings (or spouses!).
wife <- 'Aubrey'
sibs <- c('Tina','Caroline','Brandon','John')
pets <- c('Beau','Tess','Kaylee')
Derek <- list(Spouse=wife, Siblings=sibs, Pets=pets)
str(Derek) # show the structure of object
## List of 3
## $ Spouse : chr "Aubrey"
## $ Siblings: chr [1:4] "Tina" "Caroline" "Brandon" "John"
## $ Pets
: chr [1:3] "Beau" "Tess" "Kaylee"
CHAPTER 4. DATA STRUCTURES: MATRICES, DATA FRAMES, AND LISTS
28
Notice that the object Derek is a list of three elements. The first is the single string containing
my wife’s name. The next is a vector of my siblings’ names and it a vector of length 4. Finally the
vector of pets’ names is only of length 3.
To access any element of this list we can use an indexing scheme similar to matrices and vectors.
The only difference is that we’ll use two square brackets instead of one.
Derek[[ 1 ]]
## [1] "Aubrey"
Derek[[ 3 ]]
## [1] "Beau"
"Tess"
"Kaylee"
There is a second way I can access elements. For data frames it was convenient to use the
notation DataFrame$ColumnName and we will use the same convention for lists.2 To access my pets
names we can use the following notation:
Derek$Pets
## [1] "Beau"
"Tess"
"Kaylee"
To add something new to the list object, we can just make an assignment in a similar fashion.
Derek$Offspring <- c('Elise')
We can also add extremely complicated items to my list. Here we’ll add a matrix as another list
element.
2 Actually a data frame is just a list with the requirement that each list element is a vector and all vectors are of
the same length.
CHAPTER 4. DATA STRUCTURES: MATRICES, DATA FRAMES, AND LISTS
29
# from the previous section, recall we had
# defined the following data.frame
str(data)
## 'data.frame': 3 obs. of 4 variables:
## $ Name : Factor w/ 3 levels "Bob","Jeff","Mary": 1 2 3
## $ Score : num 90 75 92
## $ Score2: num 41 42 43
## $ Score3: num 61 62 63
Derek$foo <- data
str(Derek)
## List of 5
## $ Spouse
: chr "Aubrey"
## $ Siblings : chr [1:4] "Tina" "Caroline" "Brandon" "John"
## $ Pets
: chr [1:3] "Beau" "Tess" "Kaylee"
## $ Offspring: chr "Elise"
## $ foo
:'data.frame': 3 obs. of 4 variables:
##
..$ Name : Factor w/ 3 levels "Bob","Jeff","Mary": 1 2 3
##
..$ Score : num [1:3] 90 75 92
##
..$ Score2: num [1:3] 41 42 43
##
..$ Score3: num [1:3] 61 62 63
Derek$foo
##
Name Score Score2 Score3
## 1 Bob
90
41
61
## 2 Jeff
75
42
62
## 3 Mary
92
43
63
The place that most users will run into lists is that the output of many statistical procedures
will return the results in a list object. When a user asks R to perform a regression, the output
returned is a list object, and we’ll need to grab particular information from that object afterwards.
For example, the output from a t-test in R is a list:
CHAPTER 4. DATA STRUCTURES: MATRICES, DATA FRAMES, AND LISTS
30
x <- c(5.1, 4.9, 5.6, 4.2, 4.8, 4.5, 5.3, 5.2)
result <- t.test(x, alternative='less', mu=5)
str(result)
## List of 9
## $ statistic : Named num -0.314
##
..- attr(*, "names")= chr "t"
## $ parameter : Named num 7
##
..- attr(*, "names")= chr "df"
## $ p.value
: num 0.381
## $ conf.int
: atomic [1:2] -Inf 5.25
##
..- attr(*, "conf.level")= num 0.95
## $ estimate
: Named num 4.95
##
..- attr(*, "names")= chr "mean of x"
## $ null.value : Named num 5
##
..- attr(*, "names")= chr "mean"
## $ alternative: chr "less"
## $ method
: chr "One Sample t-test"
## $ data.name : chr "x"
## - attr(*, "class")= chr "htest"
We see that result is actually a list with 9 elements in it. To access the p-value we could use:
result$p.value
## [1] 0.3813385
If I ask R to print the object result, it will hide the structure from you and print it in a “pretty”
fashion because there is a print function defined specifically for objects created by the t.test()
function.
result
##
##
##
##
##
##
##
##
##
##
##
One Sample t-test
data: x
t = -0.314, df = 7, p-value = 0.3813
alternative hypothesis: true mean is less than 5
95 percent confidence interval:
-Inf 5.251691
sample estimates:
mean of x
4.95
4.4
Exercises
1. In this problem, we will work with the matrix
2 4 6
12 14 16
22 24 26
8
18
28
10
20
30
(a) Create the matrix in two ways and save the resulting matrix as M.
CHAPTER 4. DATA STRUCTURES: MATRICES, DATA FRAMES, AND LISTS
31
i. Create the matrix using some combination of the seq() and matrix() commands.
ii. Create the same matrix by some combination of multiple seq() commands and either
the rbind() or cbind() command.
(b) Extract the second row out of M.
(c) Extract the element in the third row and second column of M.
2. Create and manipulate a data frame.
(a) Create a data frame named it trees that has the following columns:
• Girth = c(8.3, 8.6, 8.8, 10.5, 10.7, 10.8, 11.0)
• Height= c(70, 65, 63, 72, 81, 83, 66)
• Volume= c(10.3, 10.3, 10.2, 16.4, 18.8, 19.7, 15.6)
(b) Extract the third observation.
(c) Extract the Girth column referring to it by name (don’t use whatever order you placed
the columns in).
(d) Create a data frame of all the observations except for the fourth observation. (i.e. Remove
the fourth observation/row.)
3. Create and manipulate a list.
(a) Create a list named my.test with elements
• x = c(4,5,6,7,8,9,10)
• y = c(34,35,41,40,45,47,51)
• slope = 2.82
• p.value = 0.000131
(b) Extract the second element in the list.
(c) Extract the element named p.value from the list.
4. The function lm() creates a linear model, which is a general class of model that includes both
regression and ANOVA. We will call this on a data frame and examine the results. For this
problem, there isn’t much to figure out, but rather the goal is to recognize the data structures
being used by common analysis functions.
(a) There are many data sets that are included with R and its packages. One of which is the
trees data which is a data set of n = 31 cherry trees. Load this dataset into your current
workspace using the command
data(trees)
# load trees data.frame
(b) Examine the data frame using the str() command. Look at the help file for the data
using the command help(trees) or ?trees.
(c) Perform a regression relating the volume of lumber produced to the girth and height of
the tree using the following command
m <- lm( Volume ~ Girth + Height, data=trees)
(d) Use the str() command to inspect m. Extract the model coefficients from this list.
CHAPTER 4. DATA STRUCTURES: MATRICES, DATA FRAMES, AND LISTS
32
(e) The list m can be passed to other functions. For example, the function summary() will
take the list and recognize that it was produced by the lm() function and produce a
summary table in the manner that we are used to seeing. Produce that summary table
using the command
summary(m)
##
##
##
##
##
##
##
##
##
##
##
##
##
##
##
##
##
##
##
Call:
lm(formula = Volume ~ Girth + Height, data = trees)
Residuals:
Min
1Q Median
-6.4065 -2.6493 -0.2876
3Q
2.2003
Max
8.4847
Coefficients:
Estimate Std. Error t value Pr(>|t|)
(Intercept) -57.9877
8.6382 -6.713 2.75e-07 ***
Girth
4.7082
0.2643 17.816 < 2e-16 ***
Height
0.3393
0.1302
2.607
0.0145 *
--Signif. codes: 0 '***' 0.001 '**' 0.01 '*' 0.05 '.' 0.1 ' ' 1
Residual standard error: 3.882 on 28 degrees of freedom
Multiple R-squared: 0.948,Adjusted R-squared: 0.9442
F-statistic:
255 on 2 and 28 DF, p-value: < 2.2e-16
Chapter 5
Importing Data
Reading data from external sources is necessary. It is most common for data to be in a data-frame
like storage, such as a MS Excel workbook, so we will concentrate on reading data into a data.frame.
In the typical way data is organized, we think of each column of data representing some trait
or variable that we might be interested in. In general, we might wish to investigate the relationship between variables. In contrast, the rows of our data represent a single object on which the
column traits are measured. For example, in a grade book for recording students scores throughout
the semester, their is one row for every student and columns for each assignment. A green-house
experiment dataset will have a row for every plant and columns for treatment type and biomass.
5.1
Comma Separated Data
To consider how data might be stored, we first consider the simplest file format... the comma separated values file. In this file time, each of the “cells” of data are separated by a comma. For example,
the data file storing scores for three students might be as follows:
Able, Dave, 98, 92, 94
Bowles, Jason, 85, 89, 91
Carr, Jasmine, 81, 96, 97
Typically when you open up such a file on a computer with Microsoft Excel installed, Excel will
open up the file assuming it is a spreadsheet and put each element in its own cell. However, you can
also open the file using a more primitive program (say Notepad in Windows, TextEdit on a Mac)
you’ll see the raw form of the data.
Having just the raw data without any sort of column header is problematic (which of the three
exams was the final??). Ideally we would have column headers that store the name of the column.
LastName, FirstName, Exam1, Exam2, FinalExam
Able, Dave, 98, 92, 94
Bowles, Jason, 85, 89, 91
Carr, Jasmine, 81, 96, 97
To see another example, open the “Body Fat” dataset from the Lock5 introductory text book at
the website http://www.lock5stat.com/datasets/BodyFat.csv. The first few rows of the file are as
follows:
33
34
CHAPTER 5. IMPORTING DATA
Bodyfat,Age,Weight,Height,Neck,Chest,Abdomen,Ankle,Biceps,Wrist
32.3,41,247.25,73.5,42.1,117,115.6,26.3,37.3,19.7
22.5,31,177.25,71.5,36.2,101.1,92.4,24.6,30.1,18.2
22,42,156.25,69,35.5,97.8,86,24,31.2,17.4
12.3,23,154.25,67.75,36.2,93.1,85.2,21.9,32,17.1
20.5,46,177,70,37.2,99.7,95.6,22.5,29.1,17.7
.
.
.
To make R read in the data arranged in this format, we need to tell R three things:
1. Where does the data live? Often this will be the name of a file on your computer, but the file
could just as easily live on the internet (provided your computer has internet access).
2. Is the first row data or is it the column names?
3. What character separates the data? Some programs store data using tabs to distinguish
between elements, some others use white space. R’s mechanism for reading in data is flexible
enough to allow you to specify what the separator is.
The primary function that we’ll use to read data from a file and into R is the function read.table().
This function has many optional arguments but the most commonly used ones are outlined in the
table below.
argument
default Interpretation
file
A character string denoting the file location
header
FALSE
Is the first line column names?
What character separates each data value.
sep
“”
The default sep=”” represents any whitespace
The number of lines to skip before reading anything.
skip
0
This is useful when there are multiple lines of text describing
how the data was collected or what the columns mean.
What values represent missing data. Can have multiple strings
na.strings
NA
such as na.strings=c(’NA’,-9999)
quote
“ and ’ For character strings, what characters represent quotations.
So to read in the “Body Fat” dataset we could run the R command:
BodyFat <file
=
header =
sep
=
read.table(
'http://www.lock5stat.com/datasets/BodyFat.csv',
TRUE,
',' )
# where the data lives
# first line is column names
# Data is sparated by commas
str(BodyFat)
## 'data.frame': 100 obs. of 10 variables:
## $ Bodyfat: num 32.3 22.5 22 12.3 20.5 22.6 28.7 21.3 29.9 21.3 ...
## $ Age
: int 41 31 42 23 46 54 43 42 37 41 ...
## $ Weight : num 247 177 156 154 177 ...
## $ Height : num 73.5 71.5 69 67.8 70 ...
## $ Neck
: num 42.1 36.2 35.5 36.2 37.2 39.9 37.9 35.3 42.1 39.8 ...
## $ Chest : num 117 101.1 97.8 93.1 99.7 ...
## $ Abdomen: num 115.6 92.4 86 85.2 95.6 ...
## $ Ankle : num 26.3 24.6 24 21.9 22.5 22 23.7 21.9 24.8 25.2 ...
## $ Biceps : num 37.3 30.1 31.2 32 29.1 35.9 32.1 30.7 34.4 37.5 ...
## $ Wrist : num 19.7 18.2 17.4 17.1 17.7 18.9 18.7 17.4 18.4 18.7 ...
CHAPTER 5. IMPORTING DATA
35
Looking at the help file for read.table() we see that there are variants such as read.csv() that
sets the default arguments to header and sep more intelligently. Also, there are many options to
customize how R responds to different input.
5.2
MS Excel
Commonly our data is stored as a MS Excel file. There are two approaches you could use to import
the data into R.
1. From within Excel, export the worksheet that contains your data as a comma separated values
(.csv) file and proceed using the tools in the previous section.
2. Use functions within R that automatically convert the worksheet into a .csv file and read it
in. This option requires that your computer have additional programming languages installed.
My preferred package for reading Excel files requires that Perl (which is amazingly powerful
for text processing) be installed1 .
I generally prefer using option 2 because all of my collaborators can’t live without Excel and I’ve
resigned myself to this. However if you have complicated formulas in your Excel file, it is often times
safer to export it as a .csv file to guarantee the data imported into R is correct. Furthermore, other
spreadsheet applications (such as Google docs) requires you to export the data as a .csv file so it
is good to know both paths.
Because R can only import a complete worksheet, the desired data worksheet must be free of
notes to yourself about how the data was collected, preliminary graphics, or other stuff that isn’t
the data. I find it very helpful to have a worksheet in which I describe the sampling procedure and
describe what each column means (and give the units!), then a second worksheet where the actual
data is, and finally a third worksheet where my “Excel Only” collaborators have created whatever
plots and summary statistics they need.
The simplest package for importing Excel files seems to be the package gdata2 . This library
provides a function read.xls() that calls Perl to parse the Excel file into a .csv file and then just
applies the usual read.table() function. So most all the options that are available to read.table()
are available to read.xls().
From Bblearn, download the files Example_1.xls, Example_2.xls, Example_3.xls and Example_4.xls
Place these files in the same directory that you store your STA 599 course work. Make sure that the
working directory that RStudio is using is that same directory (Session -> Set Working Directory).
# load the library that has the read.xls function. Unfortunately it overwrites some
# functions in the mosaic package, so you should remove it once the data are loaded.
library(gdata)
# read the first worksheet of the Example_1 file
data.1 <- read.xls('./Example_1.xls')
# read the second worksheet where the second worksheet is named 'data'
data.2 <- read.xls('./Example_2.xls', sheet=2
)
# both ways
data.2 <- read.xls('./Example_2.xls', sheet='data')
# will work
There is one additional problem that shows up while reading in Excel files. Blank columns often
show up in Excel files because at some point there was some text in a cell that got deleted but a
space remains and Excel still thinks there is data in the column. To fix this, you could find the cell
with the space in it, or you can select a bunch of columns at the edge and delete the entire columns.
Alternatively, you could remove the column after it is read into R.
1 Macs
come with Perl already installed, but PCs do not.
package that does this is the XLConnect which does the Excel -> .csv conversion using Java. The RODBC
package allows R to connect to various databases and it is possible to make it consider an Excel file as an extremely
crude database.
2 Another
CHAPTER 5. IMPORTING DATA
36
Open up the file Example_4.xls in Excel and confirm that the data sheet has name columns out
to carb. Read in the data frame using the following code:
setwd('~/Dropbox/NAU/Teaching/STA 599 - R/Notes_V2/')
data.4 <- read.xls('./Example_4.xls', sheet='data')
# Extra Column Example
str(data.4)
## 'data.frame': 31 obs. of 14 variables:
## $ model: Factor w/ 31 levels "AMC Javelin",..: 17 18 5 12 13 30 7 20 19 21 ...
## $ mpg : num 21 21 22.8 21.4 18.7 18.1 14.3 24.4 22.8 19.2 ...
## $ cyl : int 6 6 4 6 8 6 8 4 4 6 ...
## $ disp : num 160 160 108 258 360 ...
## $ hp
: int 110 110 93 110 175 105 245 62 95 123 ...
## $ drat : num 3.9 3.9 3.85 3.08 3.15 2.76 3.21 3.69 3.92 3.92 ...
## $ wt
: num 2.62 2.88 2.32 3.21 3.44 ...
## $ qsec : num 16.5 17 18.6 19.4 17 ...
## $ vs
: int 0 0 1 1 0 1 0 1 1 1 ...
## $ am
: int 1 1 1 0 0 0 0 0 0 0 ...
## $ gear : int 4 4 4 3 3 3 3 4 4 4 ...
## $ carb : int 4 4 1 1 2 1 4 2 2 4 ...
## $ X
: logi NA NA NA NA NA NA ...
## $ X.1 : logi NA NA NA NA NA NA ...
We notice that after reading in the data, there are an additional two columns (labeled X and X.1
because R had to make up some column name so it chose that) that just has missing data (the NA
stands for not available which means that the data is missing). Go back to the Excel file and go to
row 4 column N and notice that the cell isn’t actually blank... there is a space. Delete the space,
save the file, and then reload the data into R. You should notice that the extra columns are now
gone.
5.3
Exercises
1. Download from Bblearn the file Example_5.xls. Open it in Excel and figure out which sheet
of data we should import into R. At the same time figure out how many initial rows need to
be skipped. Import the data set into a data frame and show the structure of the imported
data using the str() command. Make sure that your data has n = 31 observations and the
three columns are appropriately named. If your computer doesn’t have Perl installed (most
Windows machines don’t) then export the Excel file as a .csv file and proceed. If your machine
does have Perl, just use the read.xls() function directly.
Chapter 6
Manipulating Data Frames
Most of the time, our data is in the form of a data frame and we are interested in exploring the
relationships. This chapter explores how to manipulate data frames and methods.
6.1
Classical functions for summarizing rows and columns
6.1.1
summary()
The first method is to calculate some basic summary statistics (minimum, 25th, 50th, 75th percentiles, maximum and mean) of each column. If a column is categorical, the summary function will
return the number of observations in each category.
# use the iris data set which has both numerical and categorical variables
data( iris )
str(iris)
# recall what columns we have
## 'data.frame': 150 obs. of 5 variables:
## $ Sepal.Length: num 5.1 4.9 4.7 4.6 5 5.4 4.6 5 4.4 4.9 ...
## $ Sepal.Width : num 3.5 3 3.2 3.1 3.6 3.9 3.4 3.4 2.9 3.1 ...
## $ Petal.Length: num 1.4 1.4 1.3 1.5 1.4 1.7 1.4 1.5 1.4 1.5 ...
## $ Petal.Width : num 0.2 0.2 0.2 0.2 0.2 0.4 0.3 0.2 0.2 0.1 ...
## $ Species
: Factor w/ 3 levels "setosa","versicolor",..: 1 1 1 1 1 1 1 1 1 1 ...
# display the summary for each column
summary( iris )
##
##
##
##
##
##
##
##
##
##
##
##
##
##
Sepal.Length
Min.
:4.300
1st Qu.:5.100
Median :5.800
Mean
:5.843
3rd Qu.:6.400
Max.
:7.900
Species
setosa
:50
versicolor:50
virginica :50
Sepal.Width
Min.
:2.000
1st Qu.:2.800
Median :3.000
Mean
:3.057
3rd Qu.:3.300
Max.
:4.400
Petal.Length
Min.
:1.000
1st Qu.:1.600
Median :4.350
Mean
:3.758
3rd Qu.:5.100
Max.
:6.900
37
Petal.Width
Min.
:0.100
1st Qu.:0.300
Median :1.300
Mean
:1.199
3rd Qu.:1.800
Max.
:2.500
CHAPTER 6. MANIPULATING DATA FRAMES
6.1.2
38
apply()
The summary function is convenient, but we want the ability to pick another function to apply
to each column and possibly to each row. To demonstrate this, suppose we have data frame that
contains students grades over the semester.
# make up some data
grades <- data.frame(
l.name = c('Cox', 'Dorian', 'Kelso', 'Turk'),
Exam1 = c(93, 89, 80, 70),
Exam2 = c(98, 70, 82, 85),
Final = c(96, 85, 81, 92) )
The apply() function will apply an arbitrary function to each row (or column) of a matrix or a data
frame and then aggregate the results into a vector.
# Because I can't take the mean of the last names column,
# remove the name column
scores <- grades[,-1]
# Summarize each column by
apply( scores,
# what
MARGIN=2,
# rows
FUN=mean
# what
)
calculating the mean.
object do I want to apply the function to
= 1, columns = 2, (same order as [rows, cols]
function do we want to apply
## Exam1 Exam2 Final
## 83.00 83.75 88.50
To apply a function to the rows, we just change which margin we want. We might want to calculate
the average exam score for person.
apply( scores,
MARGIN=1,
FUN=mean
)
# what object do I want to apply the function to
# rows = 1, columns = 2, (same order as [rows, cols]
# what function do we want to apply
## [1] 95.66667 81.33333 81.00000 82.33333
This is useful, but it would be more useful to concatenate this as a new column in my grades data
frame.
average <- apply(
scores,
# what object do I want to apply the function to
MARGIN=1,
# rows = 1, columns = 2, (same order as [rows, cols]
FUN=mean
# what function do we want to apply
)
grades <- cbind( grades, average )
grades
##
##
##
##
##
l.name Exam1 Exam2 Final average
1
Cox
93
98
96 95.66667
2 Dorian
89
70
85 81.33333
3 Kelso
80
82
81 81.00000
4
Turk
70
85
92 82.33333
There are several variants of the apply() function, and the variant I use most often is the function
CHAPTER 6. MANIPULATING DATA FRAMES
39
sapply(), which will apply a function to each element of a list or vector and returns a corresponding
list or vector of results.
6.2
Package dplyr
Many of the tools to manipulate data frames in R were written without a consistent syntax and
are difficult use together. To remedy this, Hadley Wickham (the writer of ggplot2) introduced a
package called plyr which was quite useful. As with many projects, his first version was good but
not great and he introduced an improved version that works exclusively with data.frames called
dplyr which we will investigate. The package dplyr strives to provide a convenient and consistent
set of functions to handle the most common data frame manipulations and a mechanism for chaining
these operations together to perform complex tasks.
The author of the dplyr package has put together a very nice introduction to the package that
explains in more detail how the various pieces work and I encourage you to read it at some point.
http://cran.rstudio.com/web/packages/dplyr/vignettes/introduction.html.
6.2.1
Basic actions
The foundational operations to perform on a data frame are:
• filter - Selecting a subset of rows from a data frame.
• arrange - Re-ordering the rows of a data frame.
• select - Use only a certain set of columns
• mutate - Add a new column that might be some function of another column
• summarise - calculate some summary statistic of a column of data.
Each of these operations is a function in the package dplyr. These functions all have a similar
calling syntax, the first argument is a data frame, subsequent arguments describe what to do with
the input data frame and you can refer to the columns without using the df$column notation, and
all of these functions will return a data frame.
filter()
This function allows you select certain rows of a data frame. The first argument is the data frame
and the subsequent arguments are logical expressions that select the desired rows.
# recall what the grades are
grades
##
##
##
##
##
l.name Exam1 Exam2 Final average
1
Cox
93
98
96 95.66667
2 Dorian
89
70
85 81.33333
3 Kelso
80
82
81 81.00000
4
Turk
70
85
92 82.33333
# load the dplyr library
library(dplyr)
# select students with Final grades greater than 90
filter(grades, Final > 90)
##
l.name Exam1 Exam2 Final average
## 1
Cox
93
98
96 95.66667
## 2
Turk
70
85
92 82.33333
CHAPTER 6. MANIPULATING DATA FRAMES
40
You can have multiple logical expressions to select rows and they will be logically combined so that
only rows that satisfy all of the conditions are selected.1
# select students with Final grades above 90 and
# average score also above 90
filter(grades, Final > 90, average > 90)
##
l.name Exam1 Exam2 Final average
## 1
Cox
93
98
96 95.66667
# we could also use an "and" condition
filter(grades, Final > 90 & average > 90)
##
l.name Exam1 Exam2 Final average
## 1
Cox
93
98
96 95.66667
arrange()
We often need to re-order the rows of a data frame. For example, we might wish to take our grade
book and sort the rows by the average score, or perhaps alphabetically. The arrange() function
does exactly that. The first argument is the data frame to re-order, and the subsequent arguments
are the columns to sort on. The order of the sorting column determines the precedent... the first
sorting column is first used and the second sorting column is only used to break ties.
arrange(grades, l.name)
##
##
##
##
##
l.name Exam1 Exam2 Final average
1
Cox
93
98
96 95.66667
2 Dorian
89
70
85 81.33333
3 Kelso
80
82
81 81.00000
4
Turk
70
85
92 82.33333
The default sorting is in ascending order, so to sort the grades with the highest scoring person in
the first row, we must tell arrange to do it in descending order using desc(column.name).
arrange(grades, desc(Final))
##
##
##
##
##
l.name Exam1 Exam2 Final average
1
Cox
93
98
96 95.66667
2
Turk
70
85
92 82.33333
3 Dorian
89
70
85 81.33333
4 Kelso
80
82
81 81.00000
In a more complicated example, consider the following data and we want to order it first by
Treatment Level and secondarily by the y-value. I want the Treatment level in the default ascending
order (Low, Medium, High), but the y variable in descending order.
1 The logicals are joined together using & (and) operator or the | (or) operator and you may explicitly use other
logicals. For example a factor column type might be used to select rows where type is either one or two via the
following: type==1 | type==2.
CHAPTER 6. MANIPULATING DATA FRAMES
41
# make some data
dd <- data.frame(
Trt = factor(c("High", "Med", "High", "Low"),
levels = c("Low", "Med", "High")),
y = c(8, 3, 9, 9),
z = c(1, 1, 1, 2))
dd
##
##
##
##
##
Trt y z
1 High 8 1
2 Med 3 1
3 High 9 1
4 Low 9 2
# arrange the rows first by treatment, and then by y (y in descending order)
arrange(dd, Trt, desc(y))
##
##
##
##
##
Trt y
1 Low 9
2 Med 3
3 High 9
4 High 8
z
2
1
1
1
select()
Often you only want to work with a small number of columns of a data frame. It is relatively easy to
do this using the standard [,col.name] notation, but is often pretty tedious. The dataset mtcars
contains information about 32 models of cars from the 70s.
str(mtcars)
## 'data.frame': 32 obs. of 11 variables:
## $ mpg : num 21 21 22.8 21.4 18.7 18.1 14.3 24.4 22.8 19.2 ...
## $ cyl : num 6 6 4 6 8 6 8 4 4 6 ...
## $ disp: num 160 160 108 258 360 ...
## $ hp : num 110 110 93 110 175 105 245 62 95 123 ...
## $ drat: num 3.9 3.9 3.85 3.08 3.15 2.76 3.21 3.69 3.92 3.92 ...
## $ wt : num 2.62 2.88 2.32 3.21 3.44 ...
## $ qsec: num 16.5 17 18.6 19.4 17 ...
## $ vs : num 0 0 1 1 0 1 0 1 1 1 ...
## $ am : num 1 1 1 0 0 0 0 0 0 0 ...
## $ gear: num 4 4 4 3 3 3 3 4 4 4 ...
## $ carb: num 4 4 1 1 2 1 4 2 2 4 ...
I could select the columns mpg, cyl, disp, hp by hand, or by using an extension of the : operator
42
CHAPTER 6. MANIPULATING DATA FRAMES
small <- select( mtcars, mpg, cyl, disp, hp )
small <- select( mtcars, mpg:hp )
str(small)
# these two commands are
# equivalent
## 'data.frame': 32 obs. of 4 variables:
## $ mpg : num 21 21 22.8 21.4 18.7 18.1 14.3 24.4 22.8 19.2 ...
## $ cyl : num 6 6 4 6 8 6 8 4 4 6 ...
## $ disp: num 160 160 108 258 360 ...
## $ hp : num 110 110 93 110 175 105 245 62 95 123 ...
mutate()
I often need to create a new column that is some function of the old columns. This was often
cumbersome. Consider code to calculate the average grade in my grade book example.
grades$average <- (grades$Exam1 + grades$Exam2 + grades$Final) / 3
Instead, we could use the mutate() function and avoid all the grades$ nonsense.2
mutate( grades, average = (Exam1 + Exam2 + Final)/3 )
##
##
##
##
##
l.name Exam1 Exam2 Final average
1
Cox
93
98
96 95.66667
2 Dorian
89
70
85 81.33333
3 Kelso
80
82
81 81.00000
4
Turk
70
85
92 82.33333
summarise()
By itself, this function is quite boring, but will become useful later on. Its purpose is to calculate
summary statistics using any or all of the data columns. Notice that we get to chose the name of
the new column.
# calculate the mean of exam 1
summarise( grades, mean.E1=mean(Exam1))
##
mean.E1
## 1
83
We could calculate multiple summary statistics if we like.
# calculate the mean of each of the exams
summarise( grades, mean.E1=mean(Exam1), mean.E2=mean(Exam2), mean.Final=mean(Final) )
##
mean.E1 mean.E2 mean.Final
## 1
83
83.75
88.5
6.2.2
Split, apply, combine
Aside from unifying the syntax behind the common operations, the major strength of the dplyr
package is the ability to split a data frame into a bunch of sub-dataframes, apply a sequence of one
2 There is another way to do this. The command with(df, expression) will attach the dataframe df to the current
environment, then evaluate the expression, and then detach the dataframe. However, to assign the result back to the
data frame, I still end up typing the name of the dataframe twice.
CHAPTER 6. MANIPULATING DATA FRAMES
43
or more of the operations we just described, and then combine results back together. We’ll consider
data from an experiment from spinning wool into yarn. This experiment considered two different
types of wool (A or B) and three different levels of tension on the thread. The response variable is
the number of breaks in the resulting yarn. For each of the 6 wool:tension combinations, there are
9 replicated observations.
data(warpbreaks)
str(warpbreaks)
## 'data.frame': 54 obs. of 3 variables:
## $ breaks : num 26 30 54 25 70 52 51 26 67 18 ...
## $ wool
: Factor w/ 2 levels "A","B": 1 1 1 1 1 1 1 1 1 1 ...
## $ tension: Factor w/ 3 levels "L","M","H": 1 1 1 1 1 1 1 1 1 2 ...
The first we must do is to create a data frame with additional information about how to break the
data into sub-dataframes. In this case, I want to break the data up into the 6 wool-by-tension combinations. Initially we will just figure out how many rows are in each wool-by-tension combination.
# what variable(s) shall we group one
grouped.warpbreaks <- group_by( warpbreaks, wool, tension)
# n() is a function that returns how many rows are in the
# currently selected sub-dataframe
summarise(grouped.warpbreaks, n = n() )
##
##
##
##
##
##
##
##
##
##
Source: local data frame [6 x 3]
Groups: wool
1
2
3
4
5
6
wool tension n
A
L 9
A
M 9
A
H 9
B
L 9
B
M 9
B
H 9
Using the same summarise function, we could calculate the group mean and standard deviation for
each wool-by-tension group.
summarise(grouped.warpbreaks,
n
= n(),
mean.breaks = mean(breaks),
sd.breaks
= sd(breaks)
)
##
##
##
##
##
##
##
##
##
##
# I added some formatting to tell the
# reader I am calculating several
# statistics.
Source: local data frame [6 x 5]
Groups: wool
1
2
3
4
5
6
wool tension n mean.breaks sd.breaks
A
L 9
44.55556 18.097729
A
M 9
24.00000 8.660254
A
H 9
24.55556 10.272671
B
L 9
28.22222 9.858724
B
M 9
28.77778 9.431036
B
H 9
18.77778 4.893306
CHAPTER 6. MANIPULATING DATA FRAMES
44
If instead of summarizing each split, we might want to just do some calculation and the output
should have the same number of rows as the input data frame. In this case I’ll tell dplyr that we are
mutating the data frame instead of summarizing it. For example, suppose that I want to calculate
the residual value eijk = yijk − y¯ij· where y¯ij· is the mean of each wool:tension combination.
temp <- mutate(grouped.warpbreaks, resid = breaks - mean(breaks))
head( temp ) # show the first couple of rows of the result
##
##
##
##
##
##
##
##
##
##
Source: local data frame [6 x 4]
Groups: wool, tension
1
2
3
4
5
6
breaks wool tension
resid
26
A
L -18.555556
30
A
L -14.555556
54
A
L
9.444444
25
A
L -19.555556
70
A
L 25.444444
52
A
L
7.444444
Chaining commands together
Suppose we have the results of a small 5K race. The data given to us is in the order that the runners
signed up but we want to calculate the results for each gender, calculate the placings, and the sort
the data frame by gender and then place. We can think of this process as having three steps: 1)
Splitting 2) Ranking 3) Re-arranging.
# input the initial data
race.results <- data.frame(
name=c('Bob', 'Jeff', 'Rachel', 'Bonnie', 'Derek', 'April','Elise','David'),
time=c(21.23, 19.51, 19.82, 23.45, 20.23, 24.22, 28.83, 15.73),
gender=c('M','M','F','F','M','F','F','M')
)
# how should I group?
grouped.results <- group_by( race.results, gender)
# calculate the rankings using the rank() function
temp.df1 <- mutate( grouped.results, place = rank(time) )
# calculate the rankings using the rank() function
temp.df1 <- mutate( grouped.results, place = rank(time) )
# arrange the rows based on gender and then place
temp.df2 <- arrange( temp.df1, gender, place )
CHAPTER 6. MANIPULATING DATA FRAMES
45
# output the result
temp.df2
##
##
##
##
##
##
##
##
##
##
##
##
Source: local data frame [8 x 4]
Groups: gender
name time gender place
1 Rachel 19.82
F
1
2 Bonnie 23.45
F
2
3 April 24.22
F
3
4 Elise 28.83
F
4
5 David 15.73
M
1
6
Jeff 19.51
M
2
7 Derek 20.23
M
3
8
Bob 21.23
M
4
It would be nice if I didn’t have to save all these intermediate results because keeping track of
temp1 and temp2 gets pretty annoying if I keep changing the order of how things or calculated or
add/subtract steps. The way this is typically handled in R is to to just nest one command inside
the next. The same set of commands could be run as follows:
arrange(
mutate(
group_by(
race.results,
gender),
place = rank( time )),
gender, place)
##
##
##
##
##
##
##
##
##
##
##
##
#
#
#
#
using race.results
group by gender
mutate to calculate the place column
arrange the result by gender and place
Source: local data frame [8 x 4]
Groups: gender
name time gender place
1 Rachel 19.82
F
1
2 Bonnie 23.45
F
2
3 April 24.22
F
3
4 Elise 28.83
F
4
5 David 15.73
M
1
6
Jeff 19.51
M
2
7 Derek 20.23
M
3
8
Bob 21.23
M
4
This is extremely hard to read because the commands are separated from the arguments (e.g. the
arrange function call was at the top, but the columns to arrange by are on the last line). To get
around this, the author of dplyr gives us an operator to combine these simple operations smoothly.
The composition operation %>% takes the following A %>% f(B) and converts it to the statement
f(A, B). This allows us to write the following code that does exactly what the above two code
chunks did.
CHAPTER 6. MANIPULATING DATA FRAMES
race.results %>%
group_by(gender) %>%
mutate(place=rank(time)) %>%
arrange(gender, place)
##
##
##
##
##
##
##
##
##
##
##
##
#
#
#
#
46
what data frame am I interested in
break things by gender
calculate the placings within each gender
arrange the result by gender and place
Source: local data frame [8 x 4]
Groups: gender
name time gender place
1 Rachel 19.82
F
1
2 Bonnie 23.45
F
2
3 April 24.22
F
3
4 Elise 28.83
F
4
5 David 15.73
M
1
6
Jeff 19.51
M
2
7 Derek 20.23
M
3
8
Bob 21.23
M
4
If I only wanted the top three finishers in each gender, we could simply add a filter command
after the place column was calculated.
race.results %>%
group_by(gender) %>%
mutate(place=rank(time)) %>%
filter( place <= 3 ) %>%
arrange(gender, place)
##
##
##
##
##
##
##
##
##
##
#
#
#
#
#
what data frame am I interested in
break things by gender
calculate the placings within each gender
only get the top 3 finishers within each gender
arrange the result by gender and place
Source: local data frame [6 x 4]
Groups: gender
name time gender place
1 Rachel 19.82
F
1
2 Bonnie 23.45
F
2
3 April 24.22
F
3
4 David 15.73
M
1
5
Jeff 19.51
M
2
6 Derek 20.23
M
3
6.3
Package tidyr
There is a common issue with obtaining data with many columns that you wish were organized as
rows. For example, I might have data in a grade book that has several homework scores and I’d
like to produce a nice graph that has assignment number on the x-axis and score on the y-axis.
Unfortunately this is incredibly hard to do when the data is arranged in the following way:
CHAPTER 6. MANIPULATING DATA FRAMES
47
grade.book <- rbind(
data.frame(name='Alison', HW.1=8, HW.2=5, HW.3=8),
data.frame(name='Brandon', HW.1=5, HW.2=3, HW.3=6),
data.frame(name='Charles', HW.1=9, HW.2=7, HW.3=9))
grade.book
##
name HW.1 HW.2 HW.3
## 1 Alison
8
5
8
## 2 Brandon
5
3
6
## 3 Charles
9
7
9
What we want to do is turn this data frame from a wide data frame into a long data frame.
In MS Excel this is called pivoting. Essentially I’d like to create a data frame with three columns:
name, assignment, and score. That is to say that each homework datum really has three pieces
of information: who it came from, which homework it was, and what the score was. It doesn’t
conceptually matter if I store it as 5 columns or 5 rows so long as there is a way to identify how a
student scored on a particular homework. So we want to reshape the HW1 to HW5 columns into
two columns (assignment and score).
This package was built by the sample people that created dplyr and ggplot2 and there is a nice
introduction at:
http://blog.rstudio.org/2014/07/22/introducing-tidyr/
gather() and spread()
As with the dplyr package, there are 3 main verbs to remember:
1. Gather - Gather multiple columns that are related into two columns that contain the original
column name and the value. For example for columns HW1, ..., HW5 we would gather them into
two column HomeworkNumber and Score. In this case, we refer to HomeworkNumber as the key
column and Score as the value column. So for any key:value pair you know everything you
need.
2. Separate - The separates a key column into multiple key columns. Often this will involve some
sort of regular expression rules for splitting a character string into
3. Spread - This is the opposite of gather. Takes a key column (or columns) and a results column
and forms a new column for each level of the key column(s).
library(tidyr)
# first we gather the score columns into columns we'll name Assesment and Score
tidy.scores <- gather( grade.book, Assessement, Score, HW.1:HW.3 )
tidy.scores
##
##
##
##
##
##
##
##
##
##
1
2
3
4
5
6
7
8
9
name Assessement Score
Alison
HW.1
8
Brandon
HW.1
5
Charles
HW.1
9
Alison
HW.2
5
Brandon
HW.2
3
Charles
HW.2
7
Alison
HW.3
8
Brandon
HW.3
6
Charles
HW.3
9
48
CHAPTER 6. MANIPULATING DATA FRAMES
To spread the key:value pairs out into a matrix, we use the spread() command.
library(tidyr)
# first we gather the score columns into columns we'll name Assesment and Score
spread( tidy.scores, Assessement, Score )
##
name HW.1 HW.2 HW.3
## 1 Alison
8
5
8
## 2 Brandon
5
3
6
## 3 Charles
9
7
9
# Commands can be chained together useing dplyr syntax
# First we'll tidy the data, and then spread it back out but transposing
# the rows for the columns.
grade.book %>%
gather( Assessement, Score, HW.1:HW.3 ) %>%
spread( name, Score )
##
Assessement Alison Brandon Charles
## 1
HW.1
8
5
9
## 2
HW.2
5
3
7
## 3
HW.3
8
6
9
6.4
Exercises
1. The dataset ChickWeight which tracks the weights of 48 baby chickens (chicks) feed four
different diets.
(a) Load the dataset using
data(ChickWeight)
(b) Look at the help files for the description of the columns.
(c) Remove all the observations except for the weights on day 10 and day 20.
(d) Calculate the mean and standard deviation for each diet group on days 10 and 20.
2. The OpenIntro textbook on statistics includes a data set on body dimensions.
(a) Load the file using
Body <- read.csv('http://www.openintro.org/stat/data/bdims.csv')
(b) The column sex is coded as a 1 if the individual is male and 0 if female. This is a
non-intuitive labeling system. Create a new column sex.MF that uses labels Male and
Female.
(c) The columns wgt and hgt measure weight and height in kilograms and centimeters (respectively). Use these to calculate the Body Mass Index (BMI) for each individual where
BM I =
W eight (kg)
2
[Height (m)]
Notice you should get values between 18 to 30.
(d) Double check that your calculated BMI column is correct by examining the summary
statistics of the column.
49
CHAPTER 6. MANIPULATING DATA FRAMES
(e) The function cut takes a vector of continuous numerical data and creates a factor based
on your give cut-points.
# Define a continuous vector to convert to a factor
x <- 1:10
# divide range of x into three groups of equal length
cut(x, breaks=3)
## [1] (0.991,4] (0.991,4] (0.991,4] (0.991,4] (4,7]
## [8] (7,10]
(7,10]
(7,10]
## Levels: (0.991,4] (4,7] (7,10]
(4,7]
(4,7]
# divide x into four groups, where I specify all 5 break points
cut(x, breaks = c(0, 2.5, 5.0, 7.5, 10))
## [1] (0,2.5] (0,2.5] (2.5,5] (2.5,5] (2.5,5]
## [8] (7.5,10] (7.5,10] (7.5,10]
## Levels: (0,2.5] (2.5,5] (5,7.5] (7.5,10]
(5,7.5]
(5,7.5]
# divide x into 3 groups, but give them a nicer
# set of group names
cut(x, breaks=3, labels=c('Low','Medium','High'))
## [1] Low
Low
Low
## Levels: Low Medium High
Low
Medium Medium Medium High
High
High
Create a new column of in the data frame that divides the age into decades (10-19, 20-29,
30-39, etc). Notice the oldest person in the study is 67.
(f) Find the average BMI for each Sex and Age group.
Chapter 7
Using R for Statistical Tables
Statistics makes use of a wide variety of distributions and before the days of personal computers,
every statistician had books with hundreds and hundreds of pages of tables allowing them to look
up particular values. Fortunately in the modern age, we don’t need those books and tables, but we
do still need to access those values. To make life easier and consistent for R users, every distribution
is accessed in the same manner.
7.1
mosaic::plotDist() function
The mosaic package provides a very useful routine for understanding a distribution. The plotDist()
function takes the R name of the distribution along with whatever parameters are necessary for that
function and show the distribution. For reference below is a list of common distributions and their
R name and a list of necessary parameters.
use
Distribution
R stem
Binomial
binom
Poisson
Exponential
pois
exp
Normal
norm
Uniform
unif
parameters (and defaults)
size
prob
lambda
rate
mean=0
sd=1
min=0
max=1
parameter interpretation
number of trials
probability of success
mean of the distribution
mean is 1/rate
mean
standard deviation
lower bound
upper bound
For example, to see the normal distribution with mean µ = 10 and standard deviation σ = 2, we
50
51
CHAPTER 7. USING R FOR STATISTICAL TABLES
library(mosaic)
plotDist('norm', mean=10, sd=2)
0.20
0.15
0.10
0.05
0.00
5
10
15
This function works for discrete distributions as well
plotDist('binom', size=10, prob=.3)
●
0.25
●
0.20
●
0.15
●
●
0.10
0.05
●
●
●
0.00
0
7.2
2
4
6
●
●
8
Base R functions
All the probability distributions available in R are accessed in exactly the same way, using a
d-function, p-function, q-function, and r-function. For the rest of this section suppose that
X is a random variable from the distribution of interest and x is some possible value that X could
take on.
CHAPTER 7. USING R FOR STATISTICAL TABLES
Function
d-function(x)
p-function(x)
q-function(q)
r-function(n)
52
Result
the height of the probability distribution at x
P (X ≤ x)
x such that P (X ≤ x) = q
n random observations from the distribution
Notice that the p-function is the inverse of the q-function.
For each distribution in R, there will be be this set of functions but we replace the “-function”
with the distribution name or a shortened version. norm, exp, binom, t, f are the names for
the normal, exponential, binomial, T and F distributions. Furthermore, most distributions have
additional parameters that define the distribution and will also be passed as arguments to these
functions, although, if a reasonable default value for the parameter exists, there will be a default.
7.2.1
d-function
The purpose of the d-function is to calculate the height of a probability mass function or a density
function.
We start with an example of the Binomial distribution. For X ∼ Binomial (n = 10, π = .2)
suppose we wanted to know P (X = 0)? We know the probability mass function is
n x
n−x
P (X = x) =
π (1 − π)
x
thus
P (X = 0)
=
10
10
0.20 (0.8)
0
=
1 · 1 · 0.810
≈
0.107
but that calculation is fairly tedious. To get R to do the same calculation, we just need the height
of the probability mass function at 0. To do this calculation, we need to know the x value we are
interested in along with the distribution parameters n and π.
The first thing we should do is check the help file for the binomial distribution functions to see
what parameters are needed and what they are named.
?dbinom
The help file shows us the parameters n and π are called size and prob respectively. So to
calculate the probability that X = 0 we would use the following command:
dbinom(0, size=10, prob=.2)
## [1] 0.1073742
To graph all the probabilities (from 0 to 10 successes) we can do the following:
53
CHAPTER 7. USING R FOR STATISTICAL TABLES
0.25
0.00
Probability
# Plotting Binomial(n=10, p=.2) distribution
x <- 0:10
heights <- dbinom(x, size=10, prob=.2)
barplot(heights, names.arg=x, ylab='Probability')
0
1
2
3
4
5
6
7
8
9
10
Next we plot the Standard Normal distribution using dnorm() to give use the height of the
density function. Notice I haven’t given the mean and standard deviation to the dnorm() function.
If I don’t specify anything, R will default to using mean=0 and sd=1.
0.2
0.0
density
0.4
# Plotting a standard normal distribution
z <- seq(-4,4,by=.01) # grid of 801 z values
heights <- dnorm(z)
# get density value for each
plot(z, heights, type='l', ylab='density', xlab='Z') # make a plot
−4
−2
0
2
4
Z
In the previous plot, we essentially drew the line by asking R to “connect the dots” and we had
a lot of dots, so the graph looks very smooth. We will cover more about graphing in later chapters.
We could make a similar plot of a non-standard normal as well.
54
CHAPTER 7. USING R FOR STATISTICAL TABLES
0.10
0.00
density
0.20
# Plotting a non-standard normal distribution
x <- seq(2,18,length=801)
# grid of 801 x values
heights <- dnorm(x, mean=10, sd=2)
# get density value for each
plot(x, heights, type='l', ylab='density', xlab='X') # make a plot
5
10
15
X
7.2.2
p-function
Often we are interested in the probability of observing some value or anything less. P-values will be
calculated this way, so we want a nice easy way to do this.
To start our example with the binomial distribution, again let X ∼ Binomial (n = 10, π = 0.2).
Suppose I want to know what the probability of observing a 0, 1, or 2? That is, what is P (X ≤ 2)?
I could just find the probability of each and add them up.
dbinom(0, size=10, prob=.2)
+
dbinom(1, size=10, prob=.2) +
dbinom(2, size=10, prob=.2)
## [1] 0.6777995
but this would get tedious for binomial distributions with a large number of trials. The shortcut is
to use the pbinom() function.
pbinom(2, size=10, prob=.2)
## [1] 0.6777995
For discrete distributions, you must be careful because R will give you the probability of less
than or equal to 2. If you wanted less than two, you should use dbinom(1,10,.2).
The normal distribution works similarly. Suppose for Z ∼ N (0, 1) and we wanted to know
P (Z ≤ −1)?
55
0.2
P(Z < −1)
0.0
density
0.4
CHAPTER 7. USING R FOR STATISTICAL TABLES
−4
−2
−1
0
2
4
Z
The answer is easily found via pnorm()
pnorm(-1)
## [1] 0.1586553
Notice for continuous random variables, the probability P (Z = −1) = 0 so we can ignore the issue
of “less than” vs “less than or equal to”.
Often times we will want to know the probability of greater than some value. That is, we might
want to find P (Z ≥ 1). For the normal distribution, there are a number of tricks we could use.
Notably
P (Z ≥ −1)
=
P (Z ≤ 1) = 1 − P (Z < −1)
but sometimes I’m lazy and would like to tell R to give me the area to the right instead of area to
the left (which is the default). This can be done by setting the argument lower.tail=FALSE.
The mosaic package includes an augmented version of the pnorm() function called xpnorm()
that calculates the same number but includes some extra information and produces a pretty graph
to help us understand what we just calculated and do the tedious “1 minus” calculation to find the
upper area.1
1 Unfortunately
this x-variant only exists for the normal distribution.
56
CHAPTER 7. USING R FOR STATISTICAL TABLES
library(mosaic)
xpnorm(-1)
##
## If X ~ N(0,1), then
##
## P(X <= -1) = P(Z <= -1) = 0.1587
## P(X > -1) = P(Z > -1) = 0.8413
0.5
−1
(z=−1)
0.1587
density
0.4
0.8413
0.3
0.2
0.1
−2
0
2
## [1] 0.1586553
7.2.3
q-function
In class, we will also find ourselves asking for the quantiles of a distribution. For example, I might
want to find the 0.30 quantile, which is the value such that 30% of the distribution is less than it,
and 70% is greater. Mathematically, I wish to find the value z such that P (Z < z) = 0.30.
57
0.2
70%
30%
0.0
density
0.4
CHAPTER 7. USING R FOR STATISTICAL TABLES
−4
−2
z 0
2
4
Z
To find this value in the tables in the book, we use the table in reverse. R gives us a handy way
to do this with the qnorm() function.
qnorm(0.30)
## [1] -0.5244005
# if we take that and stuff it back into the
# pnorm() function, we should get 0.30 back out again
pnorm(-0.5244005)
## [1] 0.3
The mosaic package also provides an augmented version of the qnorm() function named xqnorm()
that calculates the same value but also includes a nice graph to help us understand what we just
calculated.
58
CHAPTER 7. USING R FOR STATISTICAL TABLES
xqnorm(0.30)
##
##
P(X <= -0.524400512708041) = 0.3
P(X > -0.524400512708041) = 0.7
−0.5244
0.5
(z=−0.524)
0.3
density
0.4
0.7
0.3
0.2
0.1
−2
0
2
## [1] -0.5244005
7.2.4
r-function
Finally, I often want to be able to generate random data from a particular distribution. R does this
with the r-function. The first argument to this function the number of random variables to draw
and any remaining arguments are the parameters of the distribution.
rnorm(5, mean=20, sd=2)
## [1] 20.75462 20.11767 12.87048 19.73444 19.17646
rbinom(4, size=10, prob=.8)
## [1]
7.3
9
7
9 10
Exercises
1. We will examine how to use the probability mass functions (a.k.a. d-functions) and cumulative
probability function (a.k.a. p-function) for the Poisson distribution.
(a) Create a graph of the distribution of a Poisson random variable with rate parameter λ = 2
using the mosaic function plotDist().
(b) Calculate the probability that a Poisson random variable (with rate parameter λ = 2)
is exactly equal to 3 using the dpois() function. Be sure that this value matches the
graphed distribution in part (a).
(c) For a Poisson random variable with rate parameter λ = 2, calculate the probability it is
less than or equal to 3, by summing the four values returned by the Poisson d-function.
CHAPTER 7. USING R FOR STATISTICAL TABLES
59
(d) Perform the same calculation as the previous question but using the cumulative probability function ppois().
2. We will examine how to use the cumulative probability functions (a.k.a. p-functions) for the
normal distributions.
(a) Use the mosaic function plotDist() to produce a graph of the standard normal distribution.
(b) For a standard normal, use the pnorm() function or its mosaic augmented version
xpnorm() to calculate
i. P (Z < −1)
ii. P (Z ≥ 1.5)
(c) Use the mosaic function plotDist() to produce a graph of an exponential distribution
with rate parameter 2.
(d) Suppose that Y ∼ Exp (2), as above, use the pexp() function to calculate P (Y ≤ 1).
3. We next examine how to use the quantile functions for the normal and exponential distributions
using R’s q-functions.
(a) Find the value of a standard normal distribution (µ = 0, σ = 1) such that 5% of the
distribution is to the left of the value using the qnorm() function or the mosaic augmented
version xqnorm().
(b) Find the value of an exponential distribution with rate 2 such that 60% of the distribution
is less than it using the qexp() function.
4. Finally we will look at generating random deviates from a distribution.
(a) Generate a value of 1 from a uniform distribution with minimum 0, and maximum 1
using the runif() function. Repeat this step several times and confirm you are getting
different values each time.
(b) Generate a sample of size 20 from the same uniform distribution and save it as a column
in a data frame. Then produce a histogram of the sample using the mosaic function
histogram().
(c) Generate a sample of 2000 from a normal distribution with mean=10 and standard deviation sd=2 using the rnorm() function. Create a histogram the the resulting sample.
Chapter 8
Graphing using ggplot2
There are three major “systems” of making graphs in R. The basic plotting commands in R are quite
effective but the commands do not have a way of being combined in easy ways. Lattice graphics
(which the mosaic package uses) makes it possible to create some quite complicated graphs but it
is very difficult to do make non-standard graphs. The last package, ggplot2 tries to not anticipate
what the user wants to do, but rather provide the mechanisms for pulling together different graphical
concepts and the user gets to decide elements to combine.
To make the most of ggplot2 it is important to wrap your mind around “The Grammar of
Graphics”. The act of building a graph can be broken down into three steps.
1. Define what data we are using.
2. What is the major relationship we wish to exam.
3. Third, in what way should we present that relationship. These relationships can be presented
in multiple ways, and the process of creating a good graph relies on building layers upon layers
of information. For example, we might start with printing the raw data and then overlay a
regression line over the top.
Next, it should be noted that ggplot2 is designed to act on data frames. It is actually hard to just
draw three data points and for simple graphs (like I might make for a lecture) I prefer to use the
base graphing system in R. However for any real data analysis project, the data will already be in
a data frame and this is not an annoyance.
These notes are in no sufficient for graphing, particularly with ggplot2. There are many places
online to get help with ggplot2. One very nice resource is the website http://www.cookbookr.com/Graphs/ which gives much of the information available in the book R Graphics Cookbook
which I highly recommend. Second is just googling your problems and see what you can find on
websites such as StackExchange.
In this chapter we will use three different data sets. The first is the iris data that shows the
dimensions of petals and sepals for three varieties of iris. The mtcars dataset shows some cars from
a Motor Trend magazine and gives information about gas efficiency, number of cylinders, volume of
cylinders, etc. Finally the diamond data set looks at the price versus a number of other covariates
such as carats, cut, and clarity of the diamond.
8.1
A simple scatterplot
To start with, we’ll make a very simple scatterplot using the iris dataset that will make a scatterplot
of Sepal.Length versus Petal.Length.
60
61
CHAPTER 8. GRAPHING USING GGPLOT2
library(ggplot2)
ggplot( data=iris, aes(x=Sepal.Length, y=Petal.Length) ) +
geom_point( )
●
● ●
6
●
●
● ●
● ●
● ●
● ● ●
●
●
●
●
● ● ●
● ●
●
●
● ● ● ● ● ●
●
●
●
●
●
● ●
●
Petal.Length
●
● ●
●
4
● ● ●
●
● ●
●
●
● ●
●
●
● ●
●
●
●
●
●
●
● ●
●
●
●
● ● ●
●
●
●
●
● ● ●
●
●
● ●
●
●
●
●
●
●
2
●
● ●
●
● ● ●
● ● ● ●
● ●
●
●
●
●
●
●
●
●
●
●
●
● ●
● ● ●
●
● ●
●
●
●
5
6
7
8
Sepal.Length
1. The data set we wish to use is specified using data=iris.
2. The relationship we want to explore is x=Sepal.Length and y=Petal.Length. This means
the x-axis will be the Sepal Length and the y-axis will be the Petal Length.
3. The way we want to display this relationship is through graphing 1 point for every observation.
We can define other attributes that might reflect other aspects of the data. For example, we might
want for the of the data point to change dynamically based on the species of iris.
ggplot( data=iris, aes(x=Sepal.Length, y=Petal.Length, color=Species) ) +
geom_point( )
●
●●
Petal.Length
6
●
●
● ●●● ●●
● ●●
●● ●
●●
● ●
●
●
●●●
●
● ●
●
● ●
●● ●●
●
●
●
●●●●
●● ●
●●●●
●●●●●●●
●
●
● ●
●●
●●●
●●
● ●
● ●●
●
●●
●
●
●
4
●
●
●●
●
●
●
●
Species
●
2
●
●
●
●
●●●
●●
●●
●
●
●
●
●
●
●●
●●●
●● ●
●
●●
●
●
●
●
5
●
setosa
●
versicolor
●
virginica
●
●
●
6
7
8
Sepal.Length
The aes() command inside the previous section of code is quite mysterious. The way to think
about the aes() is that it gives you a way to define relationships that are data dependent. In the
62
CHAPTER 8. GRAPHING USING GGPLOT2
previous graph, the x-value and y-value for each point was defined dynamically by the data, as was
the color. If we just wanted all the data points to be colored blue and larger, then the following
code would do that
ggplot( data=iris, aes(x=Sepal.Length, y=Petal.Length) ) +
geom_point( color='blue', size=4 )
Petal.Length
6
4
2
●
●● ●
●●● ●
● ● ●● ●●
●
●●●●
●● ●
●●●
●
●●
●● ●
●
● ●
●●●
●●●●
●
●●
●●
●
●
● ●●
●
●
●
●
●●●● ● ●
●
●
●
●●
●●
●●●● ● ●
●
●
●
● ●
●
●
●
●●●
●●
●
●
● ●
●
●
●●
●
●
●
●●
●
●
●
●●
●
●
●
●
●●
●
●
●
●
●
●
●
●
●
●
●
●
● ●
5
6
7
8
Sepal.Length
The important part isn’t that color and size were defined in the geom_point() but that they were
defined outside of an aes() function!
1. Anything set inside an aes() command will be of the form attribute=Column_Name and will
change based on the data.
2. Anything set outside an aes() command will be in the form attribute=value and will be
fixed.
Next, I suppose I want to add a regression line1 to each of these groups. We can do this by adding
another layer to the graph, in this case, a smoother layer. The geom_smoother is intended to take a
scatterplot of points and draw the best-fitting curve to the data. There are several options for how
it choses to do this, but I’ll tell it to fit a regression line to each set of data. Below, we have a graph
of data points, a regression line, and a confidence region for the line2 .
1 The
line that best summarizes the relationship between Sepal.Length and Petal.Length.
typically don’t use this method because it has too many limitations as to how I fit the smoother. I prefer to fit
a model to the data and calculate the predicted values along with whatever confidence intervals I want and plot those
directly using geom_ribbon().
2I
63
CHAPTER 8. GRAPHING USING GGPLOT2
ggplot( data=iris, aes(x=Sepal.Length, y=Petal.Length, color=Species) ) +
geom_point( ) +
geom_smooth( method='lm' ) # fit a regression to each species
●
●●
Petal.Length
6
●
●
●●
● ●
●
●
●
● ●●
●
●
●
● ●
●● ● ●
●●●
●
● ● ● ●
●● ●●
●
●●
●●
●
●
●● ●
●●●●
●●●●●●●
●●
●
●
●●
●●●●●
●●
● ●
●
●
●●
●
●
●
4
●
●
●●
●
●
●
●
Species
●
2
●
●
●
●
●● ●
●
●
●●●
●●●●
●●
●
●●
●●●
●
●
●
●●
●
●
●
5
●
setosa
●
versicolor
●
virginica
●
●
●
6
7
8
Sepal.Length
8.2
Geometries
One way that ggplot2 makes it easy to form very complicated graphs is that it provides a large
number of basic building blocks that, when stacked upon each other, can produce extremely complicated graphs. A full list is available at http://docs.ggplot2.org/current/ but the following list gives
some idea of different building blocks.
Geom
Description
geom_bar
A barplot
geom_boxplot
Boxplots
geom_density
A smoothed histogram
geom_errorbar
Error bars
geom_histogram A histogram
geom_line
Draw a line (after sorting x-values)
geom_path
Draw a line (without sorting x-values)
geom_point
Draw points (for a scatterplot)
geom_ribbon
Enclose a region, and color the interior
geom_smooth
Add a ribbon that summarizes a scatterplot
geom_text
Add text to a graph
8.2.1
Bar plots
These different geometries are different ways to display the relationship between variables and can
be combined in many interesting ways. Suppose that you just want make some barplots and add ±
S.E. bars. This should be really easy to do, but in the base graphics in R, it is a pain. Fortunately
in ggplot2 this is easy. First, define a data frame with the bar heights you want to graph and the
± values you wish to use.
64
CHAPTER 8. GRAPHING USING GGPLOT2
# Calculate the mean and sd of the Petal Widths for each species
library(dplyr)
stats <- iris %>%
group_by(Species) %>%
summarize( Mean = mean(Petal.Width),
# Mean
= ybar
StdErr = sd(Petal.Width)/sqrt(n()) ) %>% # StdErr = s / sqrt(n)
mutate( lwr = Mean - StdErr,
upr = Mean + StdErr )
stats
##
##
##
##
##
##
Source: local data frame [3 x 5]
Species Mean
StdErr
lwr
upr
1
setosa 0.246 0.01490377 0.2310962 0.2609038
2 versicolor 1.326 0.02796645 1.2980335 1.3539665
3 virginica 2.026 0.03884138 1.9871586 2.0648414
Next we take these summary statistics and define the following graph which makes a bar graph of
the means and error bars that are ±1 estimated standard deviation of the mean (usually referred to
as the standard errors of the means). By default, geom_bar() tries to draw a bar plot based on how
many observations each group has. What I want, though, is to draw bars of the height I specified,
so to do that I have to add stat=’identity’ to specify that it should just use the heights I tell it.
ggplot(stats, aes(x=Species)) +
geom_bar( aes(y=Mean), stat='identity') +
geom_errorbar( aes(ymin=lwr, ymax=upr) )
2.0
Mean
1.5
1.0
0.5
0.0
setosa
versicolor
virginica
Species
While this isn’t too bad, we would like to make this a bit more pleasing to look at. Each bars
is a little too wide and the error bars should be a tad narrower than then bar. Also, the fill color
for the bars is too dark. So I’ll change all of these, by setting those attributes outside of an aes()
command.
65
CHAPTER 8. GRAPHING USING GGPLOT2
ggplot(stats, aes(x=Species)) +
geom_bar( aes(y=Mean), stat='identity', fill='grey', width=.6) +
geom_errorbar( aes(ymin=lwr, ymax=upr), color='red', width=.4 )
2.0
Mean
1.5
1.0
0.5
0.0
setosa
versicolor
virginica
Species
The last thing to notice is that the order in which the different layers matter. This is similar to
photoshop or GIS software where the layers added last can obscure prior layers. In the graph below,
the lower part of the error bar is obscured by the grey bar.
ggplot(stats, aes(x=Species)) +
geom_errorbar( aes(ymin=lwr, ymax=upr), color='red', width=.4 ) +
geom_bar( aes(y=Mean), stat='identity', fill='grey', width=.6)
2.0
Mean
1.5
1.0
0.5
0.0
setosa
versicolor
virginica
Species
8.2.2
Histograms
Creating histograms of continuous data is a very common thing to do. The simplest way to do this
in ggplot() is using the geom_histogram function. The simplest form is the the following:
66
CHAPTER 8. GRAPHING USING GGPLOT2
data <- data.frame(x=rexp(10000, rate=1/5))
ggplot(data, aes(x=x)) +
geom_histogram()
## stat_bin:
binwidth defaulted to range/30.
Use ’binwidth = x’ to adjust this.
count
2000
1000
0
0
10
20
30
40
50
x
Somewhat annoyingly, ggplot2 does not include an easy way for use intelligent choices for how
many bins to use.3 Instead we are stuck investigating different bin widths by hand. To do this, we
can set the number of bins via the binwidth argument. Notice that the y-axis is the number of
observations in each bin. If we want the y-axis to be density 4 we just need to tell geom_histogram
to have y=..density.. instead of the default.
ggplot(data, aes(x=x, y=..density..)) +
geom_histogram(binwidth=.25)
0.20
density
0.15
0.10
0.05
0.00
0
10
20
30
40
50
x
Often I want to also add some sort of smoothed density plot to my histogram. The geom to do
that is geom_density() which takes your x-values and creates a smoothed density function using
kernel density algorithm with a normal kernel. To do this, we need both layers of my plot to have
a y-axis of density.
3 To use Scott’s rule or Freedman-Draconis rule and we have to calculate those by hand. Letting the binwidth by h
ˆ
ˆ S = 3.49ˆ
ˆ F D = 2 ∗ IQR ∗ n−1/3 where σ
these are h
σ n−1/3 and h
ˆ is the standard deviation of the observations plotted
and IQR is the inter-quartile range.
4 So that the area shaded has area 1, so that when I compare a distribution to the data, the y-axes are on the same
scale.
67
CHAPTER 8. GRAPHING USING GGPLOT2
ggplot(data, aes(x=x, y=..density..)) +
geom_histogram(binwidth=.25) +
geom_density(color='red', size=1.5)
0.20
density
0.15
0.10
0.05
0.00
0
10
20
30
40
50
x
In this case, we know the distribution the data came from, so we add the exponential distribution
that the data was drawn from over the top of the histogram, mostly to demonstrate building a plot
layer by layer. We first need to create another data frame that has the distribution we wish to plot.
x <- seq(0, 50, by=0.1)
y <- dexp(x, rate=1/5)
density.data <- data.frame(x=x, y=y)
Now to build our plot, we first by creating the histogram, and then add the layer with the exponential
distribution on top. Notice that we must pass the data frame in which we stored the density
information to the geom_line() function because the data we are using for this graph are in two
different data frames.
ggplot(data, aes(x=x)) +
geom_histogram(aes(y=..density..), binwidth=.25) +
geom_line( data=density.data, aes(x=x, y=y),
color='red', size=1.5 )
0.20
density
0.15
0.10
0.05
0.00
0
10
20
30
x
40
50
68
CHAPTER 8. GRAPHING USING GGPLOT2
8.3
Adjusting labels
To make a graph more understandable, it is necessary to tweak labels for the axes and add a main
title and such. Here we’ll adjust labels in a graph, including the legend labels.
# Treat the number of cylinders in a car as a
# categorical variable (4,6 or 8)
mtcars$cyl <- factor(mtcars$cyl)
ggplot(mtcars, aes(x=wt, y=mpg, col=cyl)) +
geom_point() +
labs( title='Weight vs Miles per Gallon') +
labs( x="Weight in tons (2000 lbs)" ) +
labs( y="Miles per Gallon (US)") +
labs( color="Cylinders")
Weight vs Miles per Gallon
Miles per Gallon (US)
35
●
●
30
●●
●
Cylinders
●
25
●
●
●
●
● ● ●●
●
20
●
●
●
●
●
15
●●●
●
●
4
●
6
●
8
●
●
●
●
●
●
● ●
10
2
3
4
5
Weight in tons (2000 lbs)
8.4
Faceting
The goal with faceting is to make many panels of graphics where each panel represents the same
relationship between variables, but something changes between each panel. For example using the
iris dataset we could look at the relationship between Sepal.Length and Petal.Length either
with all the data in one graph, or one panel per species.
69
CHAPTER 8. GRAPHING USING GGPLOT2
library(ggplot2)
ggplot(iris, aes(x=Sepal.Length, y=Sepal.Width)) +
geom_point() +
facet_grid( . ~ Species )
setosa
Sepal.Width
4.5
4.0
3.5
3.0
versicolor
virginica
●
●
●
●
●
●
● ●●
● ●●
●●● ●
● ● ●●● ●
●●
● ●● ●
● ●●
●● ●●●
●
●
●●
●
●
●
● ●
●
●●
● ●● ● ● ●●
●● ●●● ● ●
● ● ● ●
● ● ●●
●
● ●●
● ●●
●
●
●
● ●
●
●●
●
2.5
●
2.0
5
6
7
8
5
6
7
●
●●
● ●
●● ●● ●
● ●●
●
●●● ● ●● ●● ●●
●
●
● ● ●●●
● ●
● ●●
●
●
●
● ●
●
8
5
6
7
8
Sepal.Length
The line facet_grid( formula ) tells ggplot2 to make panels, and the formula tells how to orient
the panels. Recall that a formula is always in the order y ~ x and because I want the species to
change as we go across the page, but don’t have anything I want to change vertically we use . ~
Species to represent that. If we had wanted three graphs stacked then we could use Species ~ ..
For a second example, we look at a dataset that examines the amount a waiter was tipped by 244
parties. Covariates that were measured include the day of the week, size of the party, total amount
of the bill, amount tipped, whether there were smokers in the group5 and the gender of the person
paying the bill6
library(reshape2)
data(tips)
head(tips)
##
##
##
##
##
##
##
1
2
3
4
5
6
total_bill
16.99
10.34
21.01
23.68
24.59
25.29
tip
sex smoker day
time size
1.01 Female
No Sun Dinner
2
1.66
Male
No Sun Dinner
3
3.50
Male
No Sun Dinner
3
3.31
Male
No Sun Dinner
2
3.61 Female
No Sun Dinner
4
4.71
Male
No Sun Dinner
4
It is easy to look at the relationship between the size of the bill and the percent tipped.
5 Old
data set when smoking in restaurants was allowed.
as sex.
6 Mis-labeled
70
CHAPTER 8. GRAPHING USING GGPLOT2
# make a graph and save it as an object
p2 <- ggplot(tips, aes(x = total_bill, y = tip / total_bill )) +
geom_point()
# Now print the graph
p2
●
tip/total_bill
0.6
●
0.4
●
●
●
● ●
●
●
● ●● ●
●
●●
●
●
●
●
● ●
●●
●● ●
●
●
●
●
●
●
●
●
●
●● ● ● ● ●
●
●
●
●
●
●
●
●●
● ●
●● ● ●
●●●● ●●
●
●●
●
● ●
●
●●
●
● ●
● ●
● ●
● ●
● ●
● ●
●●
●
●
●●●
●
●
●
●
●
●
●
●
●
●
●
●
●
●
●
●
●
●
●
●
●
●
●
●● ●
●● ●
●● ● ●
●●
● ●●
● ● ● ●●●
●● ●
● ● ●●●
● ●● ●
● ●●● ●
●●●
●●●●
● ●
●●●●● ●
● ●● ●
●● ●●●
● ●●
●●●
●● ●
●
●
●
●
●
●
●
●
●
● ●
●● ● ●●
●
●
0.2
10
20
30
●
● ●●
●● ●
●
●
●
●
●
●
40
●
50
total_bill
Next we ask if there is a difference in tipping percent based on gender or day of the week by plotting
this relationship for each combination of gender and day.
p2 + facet_grid( sex ~ day )
0.6
0.4
0.2
Sat
Sun
Thur
●
●
●
●●●
●● ●
● ●
●
●
●●●●
● ●●●
●●
●●●●
●● ●● ●
● ● ●
●
●
●●
●● ● ●
●
●●●
● ●
●
●
●
●●
●
●● ●
●
●
●
●● ● ● ●
●
●●
●●●
●
●
●
●
●
●
Female
●
0.6
0.4
0.2
●
●
●● ●● ●●
●
●
●
●●●
●●
●
●●● ●
●●
●●●
●
●●
●
●
●
●●
●
●
●●
●
●
●
●
●
●●●●●● ●● ●
●
●
●●
●
●
●
● ●●
● ●●
●●
●●
●●●
●●
●●
●●●
●
●●
●
●
●●● ●
●
●
●
●●●
●●
●
●
● ●●
●●●●●
● ● ●
●●
●
●●
●●●
●●
●
●
● ● ●
●
●●●●●
●● ●
Male
tip/total_bill
Fri
10 20 30 40 50 10 20 30 40 50 10 20 30 40 50 10 20 30 40 50
total_bill
Sometimes we want multiple rows and columns of facets, but there is only one categorical variable
with many levels. In that case we use facet_wrap which takes a one-sided formula.
71
CHAPTER 8. GRAPHING USING GGPLOT2
p2 + facet_wrap( ~ day )
tip/total_bill
Fri
0.6
0.4
0.2
●
Sat
●
●
●●●●● ●
●
●
●● ●
●●
●
●●
● ●
●
●●
●●●
●●●
●● ●● ●
●●●●●
●
●
●
● ●
●●●
●
●
●
●●
●
●●
●
●●
●●
●●
●
●
●
●●
●
●
●●
●●
●
●
●●
●●
● ●●●●●
●●
●● ●
●
●
Sun
●
● ●
●
Thur
●
0.6
0.4
0.2
●
●
●●●
●
●● ●●
●
●●
●
●
●
●
●●● ●
●●●
●
●
● ●
● ●●
●
●●●
●
●
●
●
●
●
●
●
●●●
● ●
●
●
●
● ●● ●●● ● ● ●
● ●
10
20
30
●
●●●
●●● ● ●
●● ●
●
●
●●
●●
●
●
●●●●●● ● ● ●●
●
●
●●●
●
●●
●●
●●
●●
●●
●
●
●
● ●
●
● ●
40
50
10
20
30
●●
40
50
total_bill
Finally we can allow the x and y scales to vary between the panels by setting “free”, “free_x”,
or “free_y”. In the following code, the y-axis scale changes between the gender groups.
p2 + facet_grid( sex ~ day, scales="free_y" )
Sat
Sun
Thur
●
●
●
●
●●● ● ●
●●
●
●●
●
●● ●
●
●
● ●● ●
●
●
●
●●
●
●●
● ●
● ●
●
●●●
●
● ●● ●
●● ●
●
●
●●
●
●● ●
●
●●
●
●
●
●
●●●
●
●●
●
●
●
●● ● ● ●
●
●
●
●
Female
●
0.6
0.4
0.2
●
●
●● ●● ●●
●
●
●
●●●
●●
●
●●● ●
●●
●●●
●
●●
●
●
●
●●
●
●
●●
●
●
●
●
●
●●●●●● ●● ●
●
●
●●
●
●
●
● ●●
● ●●
●●
●●
●●●
●●
●●
●●●
●
●●
●
●
●●● ●
●
●
●
●●●
●●
●
●
● ●●
●●●●●
● ● ●
●●
●
●●
●●●
●●
●
●
● ● ●
●
●●●●●
●● ●
Male
tip/total_bill
Fri
0.4
0.3
0.2
0.1
10 20 30 40 50 10 20 30 40 50 10 20 30 40 50 10 20 30 40 50
total_bill
8.5
Exercises
1. The mosaic package includes a function that allows for a point and click interface to building
a graph in ggplot2. The point of the mplot() command is to allow you to do some point and
click selection to build a graph and then click the button that produces the R commands that
produced the graph. You then copy and past the R commands into your markdown file. Once
you know the ggplot2 system better, you won’t ever bother with mplot(), you’ll just type it
in directly. Until then it is nice to have some help in formatting the plotting commands.
(a) Load the mosaic library.
library(mosaic)
(b) For the dataset trees, which should already be pre-loaded7 , we wish to build a scatterplot
that compares the height and girth of these cherry trees to the volume of lumber that was
7 Look
at the help file ?trees for more information about this data set.
CHAPTER 8. GRAPHING USING GGPLOT2
72
produced. The mosaic function mplot() will allow you to explore many different ways
of visualizing the data. Run the command
library(mosaic)
mplot(trees)
and create a graph using ggplot2 with Height on the x-axis, Volume on the y-axis, and
Girth as the either the size of the data point or the color of the data point.
(c) Have mplot() produce the code to produce this graph and copy that code into your
RMarkdown file for this lab. Because mplot() *requires* user input via the mouse, it is
a pointless command for a document that will be printed and will cause an error when
you try to knit your results. Instead you’ll use mplot() to help produce the code for a
graphic, and then do any final tweaking on the graph that is necessary. In your write up,
I would recommend that you include the mplot() command so that you can go back and
remember how it was called but then comment it out using the ‘#’ character.
(d) Add appropriate labels for the x and y axes along with a title.
2. Consider the following small dataset that represents the number of times per day my wife
plays "Ring around the Rosy” with my daughter relative to the number of days since she has
learned this game. The column yhat represents the best fitting line through the data, and lwr
and upr represent a 95% confidence interval for the predicted value on that day.8
Rosy <times
day
yhat
lwr
upr
data.frame(
= c(15, 11, 9, 12, 5, 2, 3),
= 1:7,
= c(14.36, 12.29, 10.21, 8.14,
6.07, 4.00, 1.93),
= c(9.54, 8.5, 7.22, 5.47, 3.08,
0.22, -2.89),
= c(19.18, 16.07, 13.2, 10.82,
9.06, 7.78, 6.75))
(a) Using ggplot() and geom_point(), create a scatterplot with day along the x-axis and
times along the y-axis.
(b) Add a line to the graph where the x-values are the day values but now the y-values are
the predicted values which we’ve called yhat. Notice that you have to set the aesthetic
y=times for the points and y=yhat for the line. Because each geom_ will accept and
aes() command, you can specify the y attribute to be different for different layers of the
graph.
(c) Add a ribbon that represents the confidence region of the regression line. The geom_ribbon()
function requires and x, ymin, ymax columns to be defined inside an aes() command.
For the x=day, ymin=lwr, and ymax=upr.
(d) What happened when you added the ribbon? Did some points get hidden? If so, why?
(e) Reorder the statements that created the graph so that the ribbon is on the bottom and
the data points are on top and the regression line is visible.
(f) The color of the ribbon fill is ugly. Use google to find a list of named colors available
to ggplot2. For example, I googled “ggplot2 named colors” and found the following link:
http://sape.inf.usi.ch/quick-reference/ggplot2/colour. Choose a color for the fill that is
pleasing to you.
8 This is actually a repeated measures study because we are taking repeated observations on the same child so this
analysis is way too simplistic, but our purpose here is just to make a pretty graph.
CHAPTER 8. GRAPHING USING GGPLOT2
73
(g) Add labels for the x-axis and y-axis that are appropriate along with a main title.
3. We’ll next make some density plots that relate several factors towards the birthweight of a
child.
(a) Load the MASS library, which includes the dataset birthwt which contains information
about 189 babies and their mothers.
(b) Add better labels to the race and smoke variables using the following:
library(MASS)
##
## Attaching package: ’MASS’
##
## The following object is masked from ’package:dplyr’:
##
##
select
birthwt$race <- factor(birthwt$race, labels=c('White','Black','Other'))
birthwt$smoke <- factor(birthwt$smoke, labels=c('No Smoke', 'Smoke'))
(c) Graph a histogram of the birthweights bwt using ggplot(birthwt, aes(x=bwt)) + geom_histogram().
(d) Make separate graphs that denote whether a mother smoked during pregnancy using the
facet_grid() command.
(e) Perhaps race matters in relation to smoking. Make our grid of graphs vary with smoking status changing vertically, and race changing horizontally (that is the formula in
facet_grid() should have smoking be the y variable and race as the x).
(f) Remove race from the facet grid, (so go back to the graph you had in part d). I’d like to
next add an estimated density line to the graphs, but to do that, I need to first change
the y-axis to be density (instead of counts), which we do by using aes(y=..density..)
in the ggplot() aesthetics command.
(g) Next we can add the estimated smooth density using the geom_density()
(h) To really make this look nice, lets change the fill color of the histograms to be something
less dark, lets use fill=’cornsilk’ and color=’grey60’.
(i) Change the order in which the histogram and the density line are added to the plot. Does
it matter and which do you prefer?
4. Load the dataset ChickWeight and remind yourself what the data was using ?ChickWeight.
Using facet_wrap(), produce a scatter plot of weight vs age for each chick. Use color to
distinguish the four different Diet treatments.
# load the data
data(ChickWeight)
Chapter 9
Flow Control Structures
Often it is necessary to write scripts that perform different action depending on the data or to
automate a task that must be repeated many times. To address these issues we will introduce the
if statement and its closely related cousin if else. To address repeated tasks we will define two
types of loops, a while loop and a for loop.
9.1
Decision statements
An if statement takes on the following two formats
# Simplest version
if( logical ){
expression
}
# Including the optional else
if( logical ){
expression
}else{
expression
}
where the else part is optional.
Suppose that I have a piece of code that generates a random variable from the Binomial distribution with one sample (essentially just flipping a coin) but I’d like to label it head or tails instead
of one or zero.
74
CHAPTER 9. FLOW CONTROL STRUCTURES
75
# Flip the coin, and we get a 0 or 1
result <- rbinom(n=1, size=1, prob=0.5)
result
## [1] 1
# convert the 0/1 to Tail/Head
if( result == 0 ){
result <- 'Tail'
}else{
result <- 'Head'
}
result
## [1] "Head"
What is happening is that the test expression inside the if() is evaluated and if it is true, then
the subsequent statement is executed. If the test expression is false, the next statement is skipped.
The way the R language is defined, only the first statement after the if statement is executed
(or skipped) depending on the test expression. If we want multiple statements to be executed (or
skipped), we will wrap those expressions in curly brackets {}. I find it easier to follow the if else
logic when I see the curly brackets so I use them even when there is only one expression to be
executed. Also notice that the RStudio editor indents the code that might be skipped to try help
give you a hint that it will be conditionally evaluated.
# Flip the coin, and we get a 0 or 1
result <- rbinom(n=1, size=1, prob=0.5)
result
## [1] 0
# convert the 0/1 to Tail/Head
if( result == 0 ){
result <- 'Tail'
print(" in the if statement, got a Tail! ")
}else{
result <- 'Head'
print("In the else part!")
}
## [1] " in the if statement, got a Tail! "
result
## [1] "Tail"
There are cases where you have two alternative routes of computation. Instead of writing two if
statements you could use the if else construct. This will evaluate the test expression and, if true,
execute the statement following the if. If the test expression is false, it will execute the statement
in the else section.
Finally we can nest if else statements together to allow you to write code that has many
different execution routes.
CHAPTER 9. FLOW CONTROL STRUCTURES
76
# randomly grab a number between 0,5 and round it up to 1,2, ..., 5
birth.order <- ceiling( runif(1, 0,5) )
if( birth.order == 1 ){
print('The first child had more rules to follow')
}else if( birth.order == 2 ){
print('The second child was ignored')
}else if( birth.order == 3 ){
print('The third child was spoiled')
}else{
# if birth.order is anything other than 1, 2 or 3
print('No more unfounded generalizations!')
}
## [1] "No more unfounded generalizations!"
To provide a more statistically interesting example of when we might use an if else statement,
consider the calculation of a p-value in a 1-sample t-test with a two-sided alternative. Recall the
calculate was:
• If the test statistic t is negative, then p − value = 2 ∗ P (Tdf < t)
• If the test statistic t is positive, then p − vlaue = 2 ∗ P (Tdf > t)
# create some fake data
n <- 20
# suppose this had a sample size of 20
x <- rnorm(n, mean=2, sd=1)
# testing H0: mu = 0 vs Ha: mu =/= 0
t <- ( mean(x) - 0 ) / ( sd(x)/sqrt(n) )
df <- n-1
if( t < 0 ){
p.value <- 2 * pt(t, df)
}else{
p.value <- 2 * (1-pt(t, df))
}
# print the resulting p-value
p.value
## [1] 2.748559e-09
This sort of logic is necessary for the calculation of p-values and so something similar is found
somewhere inside the t.test() function.
9.2
Loops
It is often desirable to write code that does the same thing over and over, relieving you of the burden
of repetitive tasks. To do this we’ll need a way to tell the computer to repeat some section of code
over and over. However we’ll usually want something small to change each time through the loop
and some way to tell the computer how many times to run the loop or when to stop repeating.
CHAPTER 9. FLOW CONTROL STRUCTURES
9.2.1
77
While Loops
The basic form of a while loop is as follows:
# while loop with 1 line
while( logical )
expression
# while loop with multiple lines to be repeated
while( logical ){
expression1
expression2
}
The computer will first evaluate the test expression. If it is true, it will execute the code once. It
will then evaluate the test expression again to see if it is still true, and if so it will execute the code
section a third time. The computer will continue with this process until the test expression finally
evaluates as false.
x <- 2
while( x < 100 ){
x <- 2*x
print(x)
}
##
##
##
##
##
##
[1]
[1]
[1]
[1]
[1]
[1]
4
8
16
32
64
128
It is very common to forget to update the variable used in the test expression. In that case the
test expression will never be false and the computer will never stop. This unfortunate situation is
called an infinite loop.
x <- 1
while( x < 10 ){
print(x)
}
9.2.2
For Loops
Often we know ahead of time exactly how many times we should go through the loop. We could use
a while loop, but there is also a second construct called a for loop that is quite useful.
The format of a for loop is as follows: for( index in vector ) statement where the index
will take on each value in vector in succession and then statement will be evaluated. As always,
statement can be multiple statements wrapped in curly brackets {}.
CHAPTER 9. FLOW CONTROL STRUCTURES
78
for( i in 1:5 ){
print(i)
}
##
##
##
##
##
[1]
[1]
[1]
[1]
[1]
1
2
3
4
5
What is happening is that i starts out as the first element of the vector c(1,2,3,4,5), in
this case, i starts out as 1. After i is assigned, the statements in the curly brackets are then
evaluated. Once we get to the end of those statements, i is reassigned to the next element of the
vector c(1,2,3,4,5). This process is repeated until i has been assigned to each element of the
given vector. It is somewhat traditional to use i and j and the index variables, but they could be
anything.
We can use this loop to calculate the first 10 elements of the Fibonacci sequence. Recall that
the Fibonacci sequence is defined by Fn = Fn−1 + Fn−2 where F1 = 0 and F2 = 1.
F <- rep(0, 10)
F[1] <- 0
F[2] <- 1
cat('F = ', F, '\n')
## F =
# concatenate for pretty output
0 1 0 0 0 0 0 0 0 0
for( n in 3:10 ){
F[n] <- F[n-1] + F[n-2]
cat('F = ', F, '\n')
}
##
##
##
##
##
##
##
##
F
F
F
F
F
F
F
F
=
=
=
=
=
=
=
=
0
0
0
0
0
0
0
0
1
1
1
1
1
1
1
1
1
1
1
1
1
1
1
1
0
2
2
2
2
2
2
2
0
0
3
3
3
3
3
3
0
0
0
5
5
5
5
5
0
0
0
0
8
8
8
8
0 0 0
0 0 0
0 0 0
0 0 0
0 0 0
13 0 0
13 21 0
13 21 34
For a more statistical case where we might want to perform a loop, we can consider the creation
of the bootstrap estimate of a sampling distribution. We will show how to create the bootstrap
sampling distribution using mosaic syntax and using the base R for loop.
# mosaic way
library(mosaic)
mosaic.SampDist <- do(10000) * mean( ~ Height, data=resample(trees) )
# Base R way
baseR.SampDist <- rep(NA, 10000) # Make a vector to store the means
for( i in 1:10000 ){
baseR.SampDist[i] <- mean( ~ Height, data=resample(trees) )
}
CHAPTER 9. FLOW CONTROL STRUCTURES
9.3
79
Exercises
1. The U nif orm (a, b) distribution is defined on x ∈ [a, b] and represents a random variable that
takes on any value of between a and b with equal probability.1 It has the density function
(
1
a≤x≤b
f (x) = b−a
0
otherwise
The R function
a <- 4
b <- 10
x <- runif(n=1, 0,10)
x
# one random value between 0 and 10
## [1] 3.852551
# what is value of f(x) at the randomly selected x value?
dunif(x, a, b)
## [1] 0
evaluates this density function for the above defined values of x, a, and b. Somewhere in that
function, there is a chunk of code that evaluates the density for arbitrary values of x. Write
a sequence of statements that utilizes an if statements to appropriately calculate the density
of x assuming that a and b are already known.
(a) We could write a set of if/else statements
a <- 4
b <- 10
x <- runif(n=1, 0,10)
if( x < a ){
result <- ???
}else if( x <= b ){
result <- ???
}else{
result <- ???
}
# one random value between 0 and 10
Replace the ??? with the appropriate value, either 0 or 1/ (b − a).
(b) We could perform the logical comparison all in one comparison. Recall that we can use
& to mean “and” and | to mean “or”. In the following two code chunks, replace the ???
with either & or | to make the appropriate result.
i.
x <- runif(n=1, 0,10) # one random value between 0 and 10
if( (a<=x) ??? (x<=b) ){
result <- 1/(b-a)
}else{
result <- 0
}
1 Technically since there are an infinite number of values between a and b, each value has a probability of 0 of being
selected and I should say each interval of width d has equal probability.
80
CHAPTER 9. FLOW CONTROL STRUCTURES
ii.
x <- runif(n=1, 0,10) # one random value between 0 and 10
if( (x<a) ??? (b<x) ){
result <- 0
}else{
result <- 1/(b-a)
}
2. I often want to repeat some section of code some number of times. For example, I might want
to create a bunch plots that compare the density of a t-distribution with specified degrees of
freedom to a standard normal distribution.
library(ggplot2)
df <- 4
N <- 1000
x <- seq(-4, 4, length=N)
data <- data.frame(
x = c(x,x),
y = c(dnorm(x), dt(x, df)),
type = c( rep('Normal',N), rep('T',N) ) )
# make a nice graph
myplot <- ggplot(data, aes(x=x, y=y, color=type, linetype=type)) +
geom_line() +
labs(title = paste('Std Normal vs t with', df, 'degrees of freedom'))
# actually print the nice graph we made
print(myplot)
Std Normal vs t with 4 degrees of freedom
0.4
y
0.3
type
Normal
0.2
T
0.1
0.0
−4
−2
0
2
4
x
(a) Use a for loop to create similar graphs for degrees of freedom 2, 3, 4, . . . , 29, 30.
(b) In retrospect, perhaps we didn’t need to produce all of those. Rewrite your loop so that
we only produce graphs for {2, 3, 4, 5, 10, 15, 20, 25, 30} degrees of freedom. Hint: you can
just modify the vector in the for statement to include the desired degrees of freedom.
3. The for loop usually is the most natural one to use, but occasionally we have occasions where
it is too cumbersome and a different sort of loop is appropriate. One example is taking a
random sample from a truncated distribution. For example, I might want to take a sample
from a normal distribution with mean µ and standard deviation σ but for some reason need
the answer to be larger than zero. One solution is to just sample from the given normal distribution until I get a value that is bigger than zero.
CHAPTER 9. FLOW CONTROL STRUCTURES
81
mu
<- 0
sigma <- 1
x <- rnorm(1, mean=mu, sd=sigma)
# start the while loop checking if x < 0
#
generate a new x value
# end the while loop
Replace the comments in the above code so that x is a random observation from the truncated
normal distribution.
Chapter 10
User Defined Functions
It is very important to be able to define a piece of programing logic that is repeated often. For
example, I don’t want to have to always program the mathematical code for calculating the sample
variance of a vector of data. Instead I just want to call a function that does everything for me and
I don’t have to worry about the details.
While hiding the computational details is nice, fundamentally writing functions allows us to think
about our problems at a higher layer of abstraction. For example, most scientists just want to run
a t-test on their data and get the appropriate p-value out; they want to focus on their problem and
not how to calculate what the appropriate degrees of freedom are. Functions let us do that.
10.1
Basic function definition
In the course of your analysis, it can be useful to define your own functions. The format for defining
your own function is
function.name <- function(arg1, arg2, arg3)
statement
where arg1 is the first argument passed to the function and arg2 is the second. As usual
statement is a single statement or multiple statements wrapped in the familiar curly brackets {}.
To illustrate how to define your own function, we will define a variance calculating function.
# define my function
my.var <- function(x){
n <- length(x)
xbar <- mean(x)
SSE <- sum( (x-xbar)^2 )
v <- SSE / ( n - 1 )
return(v)
}
#
#
#
#
#
calculate
calculate
calculate
"average"
result of
sample size
sample mean
sum of squared error
squared error
function is v
# create a vector that I wish to calculate the variance of
test.vector <- c(1,2,2,4,5)
# calculate the variance using my function
calculated.var <- my.var( test.vector )
calculated.var
## [1] 2.7
Notice that even though I defined my function using x as my vector of data, and passed my
82
CHAPTER 10. USER DEFINED FUNCTIONS
83
function something named test.vector, R does the appropriate renaming.1 Think of the variable
x as a placeholder, with it being replaced by whatever gets passed into the function.
When I call a function, the function might cause something to happen (e.g. draw a plot) or it
might do some calculates the result is returned by the function and we might want to save that.
Inside a function, if I want the result of some calculation saved, I return the result as the output of
the function. The way I specify to do this is via the return statement.2
By writing a function, I can use the same chunk of code repeatedly. This means that I can do all
my tedious calculations inside the function and just call the function whenever I want and happily
ignore the details. Consider the function t.test() which we have used to do all the calculations in
a t-test. We could write a similar function using the following code:
# define my function
one.sample.t.test <- function(input.data, mu0){
n
<- length(input.data)
xbar <- mean(input.data)
s
<- sd(input.data)
t
<- (xbar - mu0)/(s / sqrt(n))
if( t < 0 ){
p.value <- 2 * pt(t, df=n-1)
}else{
p.value <- 2 * (1-pt(t, df=n-1))
}
# we haven't addressed how to print things in a organized
# fashion, the following is ugly, but works...
# Notice that this function returns a character string
# with the necessary information in the strong.
return( paste('t =', t, ' and p.value =', p.value) )
}
# create a vector
test.data <- c(1,2
Nearly every function we use to do data analysis is written in a similar fashion. Somebody
decided it would be convenient to have a function that did an ANOVA analysis and they wrote
something similar to the above function, but is a bit grander in scope. Even if you don’t end up
writing any of your own functions, knowing how to will help you understand why certain functions
you use are designed the way they are.
10.2
Parameter Defaults
When I define a function and can let it take as many arguments as I want and I can also give default
values to the arguments. For example we can define the normal density function using the following
code which gives a default mean of 0 and default standard deviation of 1.
# a function that defines the shape of a normal distribution.
# by including mu=0, we give a default value that the function
# user can override
dnorm.alternate <- function(x, mu=0, sd=1){
out <- 1 / (sd * sqrt(2*pi)) * exp( -(x-mu)^2 / (2 * sd^2) )
return(out)
}
1 If my function doesn’t modify its input arguments, then R just passes a pointer to the inputs to avoid copying
large amounts of data when you call a function. If your function modifies its input, then R will take the input data,
copy it, and then pass that new copy to the function. This means that a function cannot modify its arguments. In
Computer Science parlance, R does not allow for procedural side effects.
2 Actually R doesn’t completely require this. But the alternative method is less intuitive and I strongly recommend
using the return() statement for readability.
84
CHAPTER 10. USER DEFINED FUNCTIONS
# test the function to see if it works
dnorm.alternate(1)
## [1] 0.2419707
dnorm.alternate(1, mu=1)
## [1] 0.3989423
0.2
0.1
0.0
dnorm.alternate(x)
0.3
0.4
# Lets test the function a bit more by drawing the height
# of the normal distribution a lots of different points
# ... First the standard normal!
x <- seq(-3, 3, length=601)
plot( x, dnorm.alternate(x) ) # use default mu=0, sd=1
●
●
●
●
●
●
●
●
●
●
●
●
●
●
●
●
●
●
●
●
●
●
●
●
●
●
●
●
●
●
●
●
●
●
●
●
●
●
●
●
●
●
●
●
●
●
●
●
●
●
●
●
●
●
●
●
●
●
●
●
●
●
●
●
●
●
●
●
●
●
●
●
●
●
●
●
●
●
●
●
●
●
●
●
●
●
●
●
●
●
●
●
●
●
●
●
●
●
●
●
●
●
●
●
●
●
●
●
●
●
●
●
●
●
●
●
●
●
●
●
●
●
●
●
●
●
●
●
●
●
●
●
●
●
●
●
●
●
●
●
●
●
●
●
●
●
●
●
●
●
●
●
●
●
●
●
●
●
●
●
●
●
●
●
●
●
●
●
●
●
●
●
●
●
●
●
●
●
●
●
●
●
●
●
●
●
●
●
●
●
●
●
●
●
●
●
●
●
●
●
●
●
●
●
●
●
●
●
●
●
●
●
●
●
●
●
●
●
●
●
●
●
●
●
●
●
●
●
●
●
●
●
●
●
●
●
●
●
●
●
●
●
●
●
●
●
●
●
●
●
●
●
●
●
●
●
●
●
●
●
●
●
●
●
●
●
●
●
●
●
●
●
●
●
●
●
●
●
●
●
●
●
●
●
●
●
●
●
●
●
●
●
●
●
●
●
●
●
●
●
●
●
●
●
●
●
●
●
●
●
●
●
●
●
●
●
●
●
●
●
●
●
●
●
●
●
●
●
●
●
●
●
●
●
●
●
●
●
●
●
●
●
●
●
●
●
●
●
●
●
●
●
●
●
●
●
●
●
●
●
●
●
●
●
●
●
●
●
●
●
●
●
●
●
●
●
●
●
●
●
●
●
●
●
●
●
●
●
●
●
●
●
●
●
●
●
●
●
●
●
●
●
●
●
●
●
●
●
●
●
●
−3
−2
−1
0
x
1
2
3
85
CHAPTER 10. USER DEFINED FUNCTIONS
0.2
0.0
0.1
dnorm.alternate(x, mu = 1)
0.3
0.4
# next a normal with mean 1, and standard deviation 1
plot( x, dnorm.alternate(x, mu=1) ) # override mu, but use sd=1
●
●
●
●
●
●
●
●
●
●
●
●
●
●
●
●
●
●
●
●
●
●
●
●
●
●
●
●
●
●
●
●
●
●
●
●
●
●
●
●
●
●
●
●
●
●
●
●
●
●
●
●
●
●
●
●
●
●
●
●
●
●
●
●
●
●
●
●
●
●
●
●
●
●
●
●
●
●
●
●
●
●
●
●
●
●
●
●
●
●
●
●
●
●
●
●
●
●
●
●
●
●
●
●
●
●
●
●
●
●
●
●
●
●
●
●
●
●
●
●
●
●
●
●
●
●
●
●
●
●
●
●
●
●
●
●
●
●
●
●
●
●
●
●
●
●
●
●
●
●
●
●
●
●
●
●
●
●
●
●
●
●
●
●
●
●
●
●
●
●
●
●
●
●
●
●
●
●
●
●
●
●
●
●
●
●
●
●
●
●
●
●
●
●
●
●
●
●
●
●
●
●
●
●
●
●
●
●
●
●
●
●
●
●
●
●
●
●
●
●
●
●
●
●
●
●
●
●
●
●
●
●
●
●
●
●
●
●
●
●
●
●
●
●
●
●
●
●
●
●
●
●
●
●
●
●
●
●
●
●
●
●
●
●
●
●
●
●
●
●
●
●
●
●
●
●
●
●
●
●
●
●
●
●
●
●
●
●
●
●
●
●
●
●
●
●
●
●
●
●
●
●
●
●
●
●
●
●
●
●
●
●
●
●
●
●
●
●
●
●
●
●
●
●
●
●
●
●
●
●
●
●
●
●
●
●
●
●
●
●
●
●
●
●
●
●
●
●
●
●
●
●
●
●
●
●
●
●
●
●
●
●
●
●
●
●
●
●
●
●
●
●
●
●
●
●
●
●
●
●
●
●
●
●
●
●
●
●
●
●
●
●
●
●
●
●
●
●
●
●
●
●
●
●
●
●
●
−3
−2
−1
0
1
2
3
x
Many functions that we use have defaults that we don’t normally mess with. For example, the
function mean() has an option the specifies what it should do if your vector of data has missing
data. The common solution is to remove those observations, but we might have wanted to say that
the mean is unknown one component of it was unknown.
x <- c(1,2,3,NA)
mean(x)
# fourth element is missing
# default is to return NA if any element is missing
## [1] NA
mean(x, na.rm=TRUE) # Only average the non-missing data
## [1] 2
As you look at the help pages for different functions, you’ll see in the function definitions what
CHAPTER 10. USER DEFINED FUNCTIONS
86
the default values are. For example, the function mean has another option, trim, which specifies
what percent of the data to trim at the extremes. Because we would expect mean to not do any
trimming by default, the authors have appropriately defined the default amount of trimming to be
zero via the definition trim=0.
10.3
Ellipses
When writing functions, I occasionally have a situation where I call function a() and function a()
needs to call another function, say b(), and I want to pass an unusual parameter to that function.
To do this, I’ll use a set of three periods called an ellipses. What these do is represent a set of
parameter values that will be passed along to a subsequent function.
For example the following code takes the result of a simple linear regression and plots the data
and the regression line and confidence region (basically I’m recreating a function that does the same
thing as ggplot2’s geom_smooth() layer). I might not want to specify (and give good defaults) to
every single graphical parameter that the plot() function supports. Instead I’ll just use the ’...’
argument and pass any additional parameters to the plot function.
# a function that draws the regression line and confidence interval
# notice it doesn't return anything... all it does is draw a plot
show.lm <- function(m, interval.type='confidence', fill.col='light grey', ...){
x <- m$model[,2]
# extract the predictor variable
y <- m$model[,1]
# extract the response
pred <- predict(m, interval=interval.type)
plot(x, y, ...)
polygon( c(x,rev(x)),
# draw the ribbon defined
c(pred[,'lwr'], rev(pred[,'upr'])), # by lwr and upr - polygon
col='light grey')
# fills in the region defined by
lines(x, pred[, 'fit'])
# a set of vertices, need to reverse
points(x, y)
# the uppers to make a nice figure
}
This function looks daunting, but we experiment to see what it does.
# first define a simple linear model from our cherry tree data
m <- lm( Volume ~ Girth, data=trees )
87
CHAPTER 10. USER DEFINED FUNCTIONS
# call the function with no extraneous parameters
show.lm( m )
60
70
●
●
●●
y
50
●
●
40
●
●
●
●
●
30
●
●
●
●
●
20
●
● ●
● ●
10
●
●
● ●
●
●
●
● ●●
8
10
12
14
16
x
18
20
88
CHAPTER 10. USER DEFINED FUNCTIONS
# Pass arguments that will just be passed along to the plot function
show.lm( m, xlab='Girth', ylab='Volume',
main='Relationship between Girth and Volume')
Relationship between Girth and Volume
60
70
●
●
●●
●
40
Volume
50
●
●
●
●
●
●
30
●
●
●
●
●
20
●
● ●
● ●
10
●
●
●
● ●
●
●
● ●●
8
10
12
14
16
18
20
Girth
This type of trick is done commonly. Look at the help files for hist() and qqnorm() and you’ll see
the ellipses used to pass graphical parameters along to sub-functions. Functions like lm() use the
ellipses to pass arguments to the low level regression fitting functions that do the actual calculations.
By only including these parameters via the ellipses, must users won’t be tempted to mess with the
parameters, but experts who know the nitty-gritty details can still modify those parameters.
10.4
Function Overloading
Frequently the user wants to inspect the results of some calculation and display a variable or object
to the screen. The print() function does exactly that, but it acts differently for matrices than it
does for vectors. It especially acts different for lists that I obtained from a call like lm() or aov().
The reason that the print function can act differently depending on the object type that I pass
it is because the function print() is overloaded. What this means is that there is a print.lm()
CHAPTER 10. USER DEFINED FUNCTIONS
89
function that is called whenever I call print(obj) when obj is the output of an lm() command.
Recall that we initially introduced a few different classes of data, Numerical, Factors, and Logicals. It turns out that I can create more types of classes.
x <- seq(1:10)
y <- 3+2*x+rnorm(10)
h <- hist(y)
class(h)
# h should be of class "Histogram"
## [1] "histogram"
model <- lm( y ~ x ) # model is something of class "lm"
class(model)
## [1] "lm"
Many common functions such as plot() are overloaded so that when I call the plot function
with an object, it will in turn call plot.lm() or plot.histogram() as appropriate. When building
statistical models I am often interested in different quantities and would like to get those regardless
of the model I am using. Below are a list of functions that work whether I fit a model via aov(),
lm(), glm(), or gam().
Quantity
Residuals
Model Coefficients
Summary Table
ANOVA table
AIC value
Function name
resid( obj )
coef( obj )
summary( obj )
anova( obj )
AIC( obj )
For the residual function, there actually exists a resid.aov() function, and resid.lm(), resid.glm(),
and resid.gam() and it is these functions are called when we run the command resid( obj ).
10.5
Scope
Consider the case where we make a function that calculates the trimmed mean. A good implementation of the function is given here.
CHAPTER 10. USER DEFINED FUNCTIONS
90
trimmed.mean <- function(x, k){
x <- sort(x)
n <- length(x)
if( k > 0){
x <- x[c(-1*(1:k), -1*((n-k+1):n))]
}
tm <- sum(x)/ length(x)
return( tm )
}
x <- c(10:1,50)
# 10, 9, 8, ..., 1
output <- trimmed.mean(x, k=2)
output
## [1] 6
x
##
# x is unchanged
[1] 10
9
8
7
6
5
4
3
2
1 50
Notice that even though I passed x into the function and then sorted it, x remained unsorted
outside the function.3 But what if I didn’t bother with passing x and k. If I don’t pass in the values
of x and k, then R will try to find them in my current workspace.
trimmed.mean <- function(){
x <- sort(x)
n <- length(x)
if( k > 0){
x <- x[c(-1*(1:k), -1*((n-k+1):n))]
}
tm <- sum(x)/length(x)
return( tm )
}
x <- c( 1:10, 50 )
k <- 2
output <- trimmed.mean() # amazingly this still works
output
# this is actually the correct output!
## [1] 6
x
##
# still the same x vector
[1]
1
2
3
4
5
6
7
8
9 10 50
So if I forget to pass some variable into a function, but it happens to be defined outside the
function, R will find it. It is not good practice to rely on that because how do I take the trimmed
mean of a vector named z? Worse yet, what if the variable x changes between runs of your function?
What should be consistently giving the same result keeps changing. This is especially insidious when
you have defined most of the arguments the function uses, but missed one. Your function happily
goes to the next higher scope and sometimes finds it.
When executing a function, R will have access to all the variables defined in the function, all
the variables defined in the function that called your function and so on until the base workspace.
However, you should never let your function refer to something that is not either created in your
3 When I modified x, R made a copy of x and sorted the copy that belonged to the function so that I didn’t modify
a variable that was defined outside of the scope of my function. The only way you can do that is to use the assignment
operator ’ <<- ’. This can lead to all sorts of weird behavior and I recommend against it.
91
CHAPTER 10. USER DEFINED FUNCTIONS
function or passed in via a parameter.
10.6
Exercises
1. The following function augments the t.test() so that it calculates the usual t test information
along with the bootstrap confidence interval.
x.t.test <- function( formula, data, conf.level=0.95, M=10000, ... ){
alpha <- 1-conf.level
SampDist <- rep(NA, M)
for( i in 1:M ){
SampDist[i] <- t.test(formula, data)$statistic
}
bootCI <- quantile(SampDist, probs=c(alpha/2, 1-alpha/2)) # vector of 2 numbers
bootCI <- paste( bootCI, collapse=TRUE )
# Character string
t.test(formula, data, mu, conf.level, ... )
print(paste('Bootstrap Confidence Interval:', bootCI))
}
2. Write a function that calculates the density function of a Uniform continuous variable on the
interval (a, b). The function is defined as
(
1
if a ≤ x ≤ b
f (x) = b−a
0
otherwise
which looks like this
density
1 (a + b)
0
a
b
x
We want to write a function duniform(x, a, b) that takes an arbitrary value of x and parameters a and b and return the appropriate height of the density function. For various values
of x, a, and b, demonstrate that your function returns the correct density value. Ideally, your
function should be able to take a vector of values for x and return a vector of densities.
3. I very often want to provide default values to a parameter that I pass to a function. For example, it is so common for me to use the pnorm() and qnorm() functions on the standard normal,
that R will automatically use mean=0 and sd=1 parameters unless you tell R otherwise. To get
that behavior, we just set the default parameter values in the definition. When the function is
called, the user specified value is used, but if none is specified, the defaults are used. Look at the
help page for the functions dunif(), and notice that there are a number of default parameters.
For your duniform() function provide default values of 0 and 1 for a and b. Demonstrate
that your function is appropriately using the given default values.
Chapter 11
Manipulating Strings
Strings make up a very important class of data. Data being read into R often come in the form
of character strings where different parts might mean different things. For example a sample ID of
“R1_P2_C1_2012_05_28” might represent data from Region 1, Park 2, Camera 1, taken on May
28, 2012. It is important that we have a set of utilities that allow us to split and combine character
strings in a easy and consistent fashion.
Unfortunately, the utilities included in the base version of R are somewhat inconsistent and were
not designed to work nicely together. Hadley Wickham, the developer of ggplot2 and dplyr has
this to say:
R provides a solid set of string operations, but because they have grown organically over
time, they can be inconsistent and a little hard to learn. Additionally, they lag behind
the string operations in other programming languages, so that some things that are easy
to do in languages like Ruby or Python are rather hard to do in R. – Hadley Wickham
For this chapter we will introduce the most commonly used functions from the base version of
R that you might use or see in other people’s code. Second, we introduce Dr Wickham’s stringr
package that provides many useful functions that operate in a consistent manner.
11.1
11.1.1
Base function
paste()
The most basic thing we will want to do is to combine two strings or to combine a string with a
numerical value. The paste() command will take one or more R objects and converts them to
character strings and then pastes them together to form one or more character strings. It has the
form:
paste( ..., sep = ' ', collapse = NULL )
The ... piece means that we can pass any number of objects to be pasted together. The sep
argument gives the string that separates the strings to be joined and the collapse argument that
specifies if a simplification should be performed before pasting together.
Suppose we want to combine the strings “Peanut butter” and “Jelly” then we could execute:
paste( "PeanutButter", "Jelly" )
## [1] "PeanutButter Jelly"
Notice that without specifying the separator character, R chose to put a space between the two
strings. We could specify whatever we wanted:
92
93
CHAPTER 11. MANIPULATING STRINGS
paste( "Hello", "World", sep='_' )
## [1] "Hello_World"
Also we can combine strings with numerical values
paste( "Pi is equal to", pi )
## [1] "Pi is equal to 3.14159265358979"
We can combine vectors of similar or different lengths as well. By default R assumes that you want
to produce a vector of character strings as output.
paste( "n =", c(5,25,100) )
## [1] "n = 5"
"n = 25"
"n = 100"
first.names <- c('Robb','Stannis','Daenerys')
last.names <- c('Stark','Baratheon','Targaryen')
paste( first.names, last.names)
## [1] "Robb Stark"
"Stannis Baratheon"
"Daenerys Targaryen"
If we want paste() produce just a single string of output, use the collapse= argument to first paste
together each input vector (separated by the collapse character).
paste( paste( "n =", c(5,25,100) ) )
## [1] "n = 5"
"n = 25"
"n = 100"
paste( "n =", c(5,25,100), collapse=':' )
## [1] "n = 5:n = 25:n = 100"
paste(first.names, last.names, sep='.', collapse=' : ')
## [1] "Robb.Stark : Stannis.Baratheon : Daenerys.Targaryen"
Notice we could use the paste() command with the collapse option to combine a vector of character
strings together.
paste(first.names, collapse=':')
## [1] "Robb:Stannis:Daenerys"
11.2
Package stringr: basic operations
The goal of stringr is to make a consistent user interface to a suite of functions to manipulate
strings.
“(stringr) is a set of simple wrappers that make R’s string functions more consistent,
simpler and easier to use. It does this by ensuring that: function and argument names
(and positions) are consistent, all functions deal with NA’s and zero length character
appropriately, and the output data structures from each function matches the input
data structures of other functions.” - Hadley Wickham
We’ll investigate the most commonly used function but there are many we will ignore.
CHAPTER 11. MANIPULATING STRINGS
Function
str_c()
str_length()
str_sub()
str_trim()
str_pad
94
Description
string concatenation, similar to paste()
number of characters in the string
extract a substring
remove leading and trailing whitespace
pad a string with empty space to be a designated length
Concatenating with str_c() or str_join()
The first thing we do is to concatenate two strings or two vectors of strings similarly to the paste()
command. The str_c() and str_join() functions are a synonym for the exact same function, but
str_join() might be a more natural verb to use and remember. The syntax is:
str_join( ..., sep='', collapse=NULL)
You can think of the inputs building a matrix of strings, with each input creating a column of the
matrix. For each row, str_join() first joins all the columns (using the separator character given
in sep) into a single column of strings. If the collapse argument is non-NULL, the function takes
the vector and joins each element together using collapse as the separator character.
# load the stringr library
library(stringr)
# envisioning the matrix of strings
cbind(first.names, last.names)
##
first.names
## [1,] "Robb"
## [2,] "Stannis"
## [3,] "Daenerys"
last.names
"Stark"
"Baratheon"
"Targaryen"
# join the columns together
full.names <- str_c( first.names, last.names, sep='.')
cbind( first.names, last.names, full.names)
##
first.names
## [1,] "Robb"
## [2,] "Stannis"
## [3,] "Daenerys"
last.names
"Stark"
"Baratheon"
"Targaryen"
full.names
"Robb.Stark"
"Stannis.Baratheon"
"Daenerys.Targaryen"
# Join each of the rows together separated by collapse
str_join( first.names, last.names, sep='.', collapse=' : ')
## [1] "Robb.Stark : Stannis.Baratheon : Daenerys.Targaryen"
Calculating string length with str_length()
The str_length() function calculates the length of each string in the vector of strings passed to it.
text <- c('WordTesting', 'With a space', NA, 'Night')
str_length( text )
## [1] 11 12 NA
5
Notice that str_length() correctly interprets the missing data as missing and that the length ought
to also be missing.
CHAPTER 11. MANIPULATING STRINGS
95
Extracting substrings with str_sub()
If we know we want to extract the 3rd through 6th letters in a string, this function will grab them.
str_sub(text, start=3, end=6)
## [1] "rdTe" "th a" NA
"ght"
If a given string isn’t long enough to contain all the necessary indices, str_sub() returns only the
letters that where there (as in the above case for “Night”
Pad a string with str_pad()
Sometimes we to make every string in a vector the same length to facilitate display or in the creation
of a uniform system of assigning ID numbers. The str_pad() function will add spaces at either the
beginning or end of the of every string appropriately.
str_pad(first.names, width=8)
## [1] "
Robb" " Stannis" "Daenerys"
str_pad(first.names, width=8, side='right', pad='*')
## [1] "Robb****" "Stannis*" "Daenerys"
Trim a string with str_trim()
This removes any leading or trailing whitespace where whitespace is defined as spaces ’ ’, tabs
’\t’, or returns ’\n’.
text <- ' Some text. \n
print(text)
## [1] " Some text. \n
'
"
str_trim(text)
## [1] "Some text."
11.3
Package stringr: Pattern Matching
The previous commands are all quite useful but the most powerful string operation is take a string
and match some pattern within it. The following commands are available within stringr.
Function Description
str_detect() Detect if a pattern occurs in the input string
str_locate()
Locates the first (or all) position(s) of a pattern
str_locate_all()
str_extract()
Extracts the first (or all) substrings corresponding to a pattern
str_extract_all()
str_replace()
Replaces the matched substrings with a new pattern
str_replace_all()
str_split()
Splits the input string based on the input pattern
str_split_fixed()
We will first examine these functions using a very simple pattern matching algorithm where we
are matching a specific pattern. For most people, this is as complex as we need. The next section
CHAPTER 11. MANIPULATING STRINGS
96
will introduce using regular expressions1 in these functions. Suppose that we have a vector of strings
that contain a date in the form “2012-May-27” and we want to manipulate them to extract certain
information.
test.vector <- c('2008-Feb-10', '2010-Sept-18', '2013-Jan-11', '2016-Jan-2')
Detecting a pattern using str_detect()
Suppose we want to know which dates are in September. We want to detect if the pattern “Sept”
occurs in the strings. It is important that I used fixed(“Sept”) in this code to “turn off” the
complicated regular expression matching rules and just look for exactly what I specified.
str_detect( test.vector, pattern=fixed('Sept') )
## [1] FALSE
TRUE FALSE FALSE
Here we see that the second string in the test vector included the substring “Sept” but none of the
others did.
Locating a pattern using str_locate()
To figure out where the “-” characters are, we can use the str_locate() function.
str_locate(test.vector, pattern=fixed('-') )
##
##
##
##
##
[1,]
[2,]
[3,]
[4,]
start end
5
5
5
5
5
5
5
5
which shows that the first dash occurs as the 5th character in each string. If we wanted all the
dashes in the string the following works.
1 Regular expressions are a way to specify very complicated patterns. Go look at https://xkcd.com/208/ to gain
insight into just how geeky regular expressions are.
97
CHAPTER 11. MANIPULATING STRINGS
str_locate_all(test.vector, pattern=fixed('-') )
##
##
##
##
##
##
##
##
##
##
##
##
##
##
##
##
##
##
##
[[1]]
start end
[1,]
5
5
[2,]
9
9
[[2]]
start end
[1,]
5
5
[2,]
10 10
[[3]]
start end
[1,]
5
5
[2,]
9
9
[[4]]
start end
[1,]
5
5
[2,]
9
9
The output of str_locate_all() is a list of matrices that gives the start and end of each matrix.
Using this information, we could grab the Year/Month/Day information out of each of the dates.
We won’t do that here because it will be easier to do this using str_split().
Replacing substrings using str_replace()
Suppose we didn’t like using “-” to separate the Year/Month/Day but preferred a space, or an
underscore, or something else. This can be done by replacing all of the “-” with the desired
character. The str_replace() function only replaces the first match, but str_replace_all()
replaces all matches.
str_replace(test.vector, pattern=fixed('-'), replacement=fixed(':') )
## [1] "2008:Feb-10"
"2010:Sept-18" "2013:Jan-11"
"2016:Jan-2"
str_replace_all(test.vector, pattern=fixed('-'), replacement=fixed(':') )
## [1] "2008:Feb:10"
"2010:Sept:18" "2013:Jan:11"
"2016:Jan:2"
Splitting into substrings using str_split()
We can split each of the dates into three smaller substrings using the str_split() command, which
returns a list where each element of the list is a vector containing pieces of the original string
(excluding the pattern we matched on).
CHAPTER 11. MANIPULATING STRINGS
98
str_split(test.vector, pattern=fixed('-'))
##
##
##
##
##
##
##
##
##
##
##
[[1]]
[1] "2008" "Feb"
"10"
[[2]]
[1] "2010" "Sept" "18"
[[3]]
[1] "2013" "Jan"
"11"
[[4]]
[1] "2016" "Jan"
"2"
If we know that all the strings will be split into a known number of substrings (we have to specify how
many substrings to match), we can use str_split_fixed() to get a matrix of substrings instead of
list of substrings. It is somewhat unfortunate that the _fixed modifier to the function name is the
same as what we use to specify to use simple pattern matching.
str_split_fixed(test.vector, pattern=fixed('-'), n=3)
##
##
##
##
##
[1,]
[2,]
[3,]
[4,]
11.4
[,1]
"2008"
"2010"
"2013"
"2016"
[,2]
"Feb"
"Sept"
"Jan"
"Jan"
[,3]
"10"
"18"
"11"
"2"
Regular Expressions
Regular expressions are a way of precisely writing out patterns that are very complicated. The
stringr package pattern arguments can be given using standard regular expressions (not perlstyle!) instead of using fixed strings.
Regular expressions are extremely powerful for sifting through large amounts of text. For example, we might want to extract all of the 4 digit substrings (the years) out of our dates vector, or I
might want to find all cases in a paragraph of text of words that begin with a capital letter and are
at least 5 letters long. In another, somewhat nefarious example, spammers might have downloaded
a bunch of text from webpages and want to be able to look for email addresses. So as a first pass,
they want to match a pattern:
com
Username
. org
| {z } @ OrganizationName
|
{z
}
1 or more letters
edu
1 or more letter
where the Username and OrganizationName can be pretty much anything, but a valid email address
looks like this. We might get even more creative and recognize that my list of possible endings could
include country codes as well.
For most people, I don’t recommend opening the regular expression can-of-worms, but it is good
to know that these pattern matching utilities are available within R and you don’t need to export
your pattern matching problems to Perl or Python.
CHAPTER 11. MANIPULATING STRINGS
11.5
99
Exercises
1. Using the test.vector of dates given in the text, create a vector of the years using stringr
functions.
2. The following file names were used in a camera trap study. The S number represents the site,
P is the plot within a site, C is the camera number within the plot, the first string of numbers
is the YearMonthDay and the second string of numbers is the HourMinuteSecond.
file.names <- c( 'S123.P2.C10_20120621_213422.jpg',
'S10.P1.C1_20120622_050148.jpg',
'S187.P2.C2_20120702_023501.jpg')
Use a combination of str_sub() and str_split() to produce a data frame with columns corresponding to the site, plot, camera, year, month, day, hour, minute, and second for these
three file names. So we want to produce code that will create the data frame:
##
Site Plot Camera Year Month Day Hour Minute Second
## 1 S123
P2
C10 2012
06 21
21
34
22
## 2 S10
P1
C1 2012
06 22
05
01
48
## 3 S187
P2
C2 2012
07 02
02
35
01
Hint: Split the file names first by the underscore, and save the resulting three pieces as SiteInfo, DateInfo and TimeInfo and then further break each of those apart in whatever way is
appropriate.
Chapter 12
Dates and Times using the lubridate
package
Dates within a computer require some special organization because there are several competing
conventions for how to write a date (some of them more confusing than others) and because the sort
order should be in the order that the dates occur in time.
One useful tidbit of knowledge is that computer systems store a time point as the number of
seconds from set point in time, called the epoch. So long as your system uses the same epoch, the use
doesn’t have to worry about when the epoch is, but if you are switching between software systems,
you might run into problems if they use different epochs.1 In R, we use midnight on Jan 1, 1970.
In Microsoft Excel, they use Jan 0, 1900.
For many years, R users hated dealing with dates because it was difficult to remember how to
get R to take a string that represents a date (e.g. “June 26, 1997”) because users were required
to specify how the format was arranged using a relatively complex set of rules. For example %y
represents the two digit year, %Y represents the four digit year, %m represents the month, but %b
represents the month written as Jan or Mar. Into this mess came Hadley Wickham (of ggplot2
and dplyr fame) and his student Garrett Grolemund. The internal structure of R dates and times
is quite robust, but the functions we use to manipulate them are horrible. To fix this, Dr Wickham
and his then PhD student Dr Grolemund introduced the lubridate package.
12.1
Creating Date and Time objects
To create a Date object, we need to take a string or number that represents a date and tell the
computer how to figure out which bits are the year, which are the month, and which are the day.
The lubridate package uses the following functions:
Common Orders
ymd() Year Month Day
mdy() Month Day Year
dmy() Day Month Year
Uncommon Orders
dym() Day Year Month
myd() Month Year Day
ydm() Year Day Month
The uncommon orders aren’t likely to be used, but the lubridate package includes them for completeness. Once the order has been specified, the lubridate package will try as many different ways
to parse the date that make sense. As a result, so long as the order is consistent, all of the following
will work:
1 http://en.wikipedia.org/wiki/Epoch_(reference_date)#Computing
100
CHAPTER 12. DATES AND TIMES USING THE LUBRIDATE PACKAGE
101
library( lubridate )
mdy( 'June 6, 1997', 'Jun 6 97', '6-26-97', '6-6-1997', '6/6/97', '6-6/97' )
## [1] "1997-06-06 UTC" "1997-06-06 UTC" "0097-06-26 UTC" "1997-06-06 UTC"
## [5] "2097-06-06 UTC" "2097-06-06 UTC"
Unfortunately lubridate() is inconsistency recognizing the two digit year as either 97, 1997, or
2097. This illustrates that you should ALWAYS fully specify the year.
The lubridate functions will also accommodate if an integer representation of the date, but it
has to have enough digits to uniquely identify the month and day.
ymd(20090110)
## [1] "2009-01-10 UTC"
ymd(2009722) # only one digit for month --- error!
## Warning:
All formats failed to parse.
No formats found.
## [1] NA
ymd(2009116) # this is ambiguous! 1-16 or 11-6?
## Warning:
All formats failed to parse.
No formats found.
## [1] NA
If we want to add a time to a date, we will use a function with the suffix _hm or _hms. Suppose
that we want to encode a date and time, for example, the date and time of my wedding ceremony2 .
mdy_hm('Sept 18, 2010 5:30 PM', '9-18-2010 17:30')
## Warning:
1 failed to parse.
## [1] NA
"2010-09-18 17:30:00 UTC"
In the above case, lubridate is having trouble understanding AM/PM differences and it is better to
always specify times using 24 hour notation and skip the AM/PM designations.
By default, R codes the time of day using as if the event occurred in the UMT time zone (also
know as Greenwich Mean Time GMT). To specify a different time zone, use the tz= option. For
example:
mdy_hm('9-18-2010 17:30', tz='MST') # Mountain Standard Time
## [1] "2010-09-18 17:30:00 MST"
This isn’t bad, but Loveland, Colorado is on MST in the winter and MDT in the summer because
of daylight savings time. So to specify the time zone that could switch between standard time and
daylight savings time, I should specify tz=’US/Mountain’
mdy_hm('9-18-2010 17:30', tz='US/Mountain') # US mountain time
## [1] "2010-09-18 17:30:00 MDT"
As Arizonans, we recognize that Arizona is weird and doesn’t use daylight savings time. Fortunately
R has a built-in time zone just for us.
2 It
is convenient to have this written down in many places in case need to figure it out.
102
CHAPTER 12. DATES AND TIMES USING THE LUBRIDATE PACKAGE
mdy_hm('9-18-2010 17:30', tz='US/Arizona') # US Arizona time
## [1] "2010-09-18 17:30:00 MST"
R recognizes 582 different time zone locals and you can find these using the function OlsonNames().
To find out more about what these mean you can check out the Wikipedia page on timezones3 .
12.2
Extracting information
The lubridate package provides many functions for extracting information from the date. Suppose
we have defined
x <- mdy_hm('9-18-2010 17:30', tz='US/Mountain') # US Mountain time
Command
year(x)
month(x)
day(x)
Output
2010
9
18
Command
hour(x)
minute(x)
second(x)
Output
17
30
0
Command
wday(x)
mday(x)
yday(x)
Output
7
18
261
Here we get the output as digits, where September is represented as a 9 and the day of the week is
a number between 1-7. To get nicer labels, we can use label=TRUE for some commands.
Command
wday(x, label=TRUE)
month(x, label=TRUE)
tz(x)
Output
Sat
Sep
US/Mountain
All of these functions can also be used to update the value. For example, we could move the
day of the wedding from September 18th to October 18th by changing the month.
month(x) <- 10
x
## [1] "2010-10-18 17:30:00 MDT"
Often I want to consider some point in time, but need to convert the timezone the date was
specified into another timezone. The function with_tz() will take a given moment in time and
figure out when that same moment is in another timezone. For example, Game of Thrones is made
available on HBO’s streaming service at 9pm on Sunday evenings Eastern time. I need to know
when I can start watching it here in Arizona.
GoT <- ymd_hm('2015-4-26 21:00', tz='US/Eastern')
with_tz(GoT, tz='US/Arizona')
## [1] "2015-04-26 18:00:00 MST"
This means that Game of Thrones is available for streaming at 6 pm Arizona time.
12.3
Arithmetic on Dates
Once we have two or more Date objects defined, we can perform appropriate mathematical operations. For example, we might want to the know the number of days there are between two dates.
3 http://en.wikipedia.org/wiki/List_of_tz_database_time_zones
CHAPTER 12. DATES AND TIMES USING THE LUBRIDATE PACKAGE
103
Wedding <- ymd('2010-Sep-18')
Elise <- ymd('2013-Jan-11')
Childless <- Elise - Wedding
Childless
## Time difference of 846 days
Because both dates were recorded without the hours or seconds, R defaults to just reporting the
difference in number of days.
Often I want to add two weeks, or 3 months, or one year to a date. However it is not completely
obvious what I mean by “add 1 year”. Do we mean to increment the year number (eg Feb 2, 2011
-> Feb 2, 2012) or do we mean to add 31,536,000 seconds? To get around this, lubridate includes
functions of the form dunits() and units() where the “unit” portion could be year, month, week,
etc. The “d” prefix will stand for duration when appropriate.
x <- ymd("2011-Feb-21")
x + years(2)
## [1] "2013-02-21 UTC"
# 2012 was a leap year, so Feb 21, 2011 + 2*365 days results in Feb 20, 2013
x + dyears(2)
## [1] "2013-02-20 UTC"
12.4
Exercises
1. For the following formats for a date, transform them into a date/time object. Which formats
can be handled nicely and which are not?
September 13, 1978
Sept 13, 1978
Sep 13, 1978
9-13-78
9/13/78
2. Suppose that we have a vector of character strings but obnoxiously they are all in the form
“9/13/76” and we want to turn them into dates where the year is 1976.
my.dates <- c('10/5/72', '8/23/74', '9/13/76')
To convert these to dates that have the proper year, I could use the stringr package to tear
them apart, append a “19” in front of the year, and then put it back together with the following
code:
library(stringr)
d2 <- str_split_fixed(my.dates, pattern=fixed('/'), n=3)
d3 <- str_c( d2[,1], d2[,2], str_c('19',d2[,3]), sep = '-' )
mdy(d3)
Or we could use the mdy() function to convert these to dates and subtract 100 years. Write
code to do the second solution.
3. Suppose you have arranged for a phone call to be at 3 pm on May 8, 2015 at Arizona time.
However, the recipient will be in Auckland, NZ. What time will it be there?
CHAPTER 12. DATES AND TIMES USING THE LUBRIDATE PACKAGE
104
4. Number of births per day.
(a) Using the mosaicData package, load the data set Births78 which records the number of
children born on each day in the United States in 1978.
library(mosaicData)
data(Births78)
(b) There is already a date column in the data set that is called, appropriately, date. Notice
that ggplot2 knows how to represent dates in a pretty fashion and the following chart
looks nice.
library(ggplot2)
ggplot(Births78, aes(x=date, y=births)) +
geom_point()
What stands out to you? Why do you think we have this trend?
(c) To test your assumption, we need to figure out the what day of the week each observation
is. Use dplyr::mutate to add a new column named dow that is the day of the week
(Monday, Tuesday, etc). This calculation will involve some function in the lubridate
package.
(d) Plot the data with the point color being determined by the dow variable.
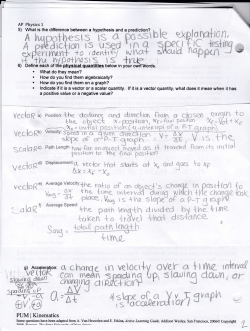


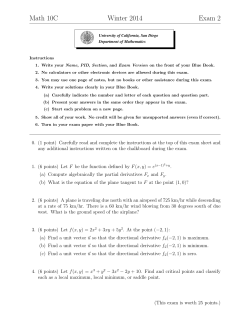


© Copyright 2026