
Document 155473
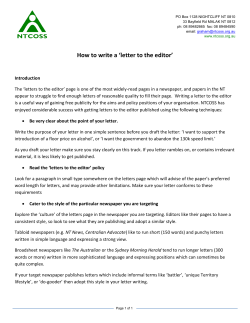
Revision of IBM SPSS Statistics IBM SPSS Statistics™ (SPSS from now on) is a computer package design to cater for your every statistical need. It carries out analyses that take hours by hand in a matter of seconds. Here’s a list of what SPSS can and cannot do: SPSS will: • Do complex statistical analysis in a few seconds. • Produce graphs. Sod • Save you time. Off! • Do anything statistical that you ask it to do. SPSS won’t: • Decide what test needs to be done in a given circumstance. • Pass your exam for you. • Make tea. So, although SPSS is a very powerful tool, it works only within the limits of your own statistical knowledge. In many respects it is rather stupid because if you provide it with data and ask it to run a completely meaningless analysis, it will happily oblige. Therefore, you still need to use your brain to initiate the correct analysis. Please analyse my data for me. Getting started with SPSS There are several excellent texts that give introductions to the general environment within which SPSS operates. In my entirely unbiased opinion, the best is Field (2009; 2013)! SPSS mainly uses two windows: the data editor (this is where you input your data and carry out statistical functions) and the viewer (this is where the results of any analysis appear). Once SPSS has been activated, a start-‐up window will appear, which allows you to select various options. If you already have a data file on disk that you would like to open then select Open an existing data source by clicking on the so that it looks like : this is the default option. In the space underneath this option there will be a list of recently used data files that you can select with the mouse. If you want to open a data file that isn’t in the list then simply select More Files… with the mouse and click on . The main SPSS window includes a data editor for entering data. This window is where most of the action happens. The data editor has two views: the data view and the variable view. The data view is for entering data into the data editor, and the variable view allows us to define various © Prof. Andy Field, 2012 www.discoveringstatistics.com Page 1 characteristics of the variables within the data editor. At the bottom of the data editor, you should notice that there are two tabs labelled ‘Data View’ and ‘Variable View’ ( ) and all we do to switch between these two views is click on these tabs (the highlighted tab tells you which view you’re in, although it will be obvious). The highlighted cell is the cell that is currently active This area displays the value of the currently active cell This shows that we are currently in the ‘Data View’ We can click here to switch to the ‘Variable View’ Figure 1: The SPSS Data Editor (‘Data View’) Below is a brief reference guide to each of the menus and some of the options that they contain. This is merely a summary and we will discover the wonders of each menu as we progress through the book: • This menu contains all of the options that are customarily found in File menus: you can save data, graphs or output, open previously saved files and print graphs, data or output. • This menu contains edit functions for the data editor. In SPSS it is possible to cut and paste blocks of numbers from one part of the data editor to another (which can be very handy when you realize that you’ve entered lots of numbers in the wrong place). You can also use the to select various preferences such as the font that is used for the output. The default preferences are fine for most purposes. • This menu allows you to make changes to the data editor. The important features are , which is used to insert a new variable into the data editor (i.e., add a column); , which is used to add a new row of data between two existing rows of data; , which is used to split the file by a grouping variable and , which is used to run analyses on only a selected sample of cases © Prof. Andy Field, 2012 www.discoveringstatistics.com Page 2 You should use this menu if you want to manipulate one of your variables in some • way. For example, you can use recode to change the values of certain variables (e.g., if you wanted to adopt a slightly different coding scheme for some reason). The compute function is also useful for transforming data (e.g. you can create a new variable that is the average of two existing variables). This function allows you to carry out any number of calculations on your variables (we’ll use this menu in due course). • The fun begins here, because the statistical procedures lurk in this menu. Below is a brief guide to the options in the statistics menu that will be used during the course of this book (this is only a small portion of what is available): → This menu is for conducting descriptive statistics (mean, mode, median, etc.), frequencies and general data exploration. There is also a command called crosstabs that is useful for exploring frequency data and performing tests such as chi-‐square, Fisher’s exact test and Cohen’s kappa. → This is where you can find t-‐tests and one-‐way independent ANOVA. → This menu is for ANOVAs such as two-‐way (unrelated, related or mixed), and any ANOVA with repeated measures. → It doesn’t take a genius to work out that this is where the correlation techniques are kept! You can do bivariate correlations such as Pearson’s R, Spearman’s rho (ρ) and Kendall’s tau (τ) as well as partial correlations. → There are a variety of regression techniques available in SPSS. You can do simple linear regression and multiple linear regression and more advanced techniques such as logistic regression. → Loglinear analysis is hiding in this menu, waiting for you, and ready to pounce like a tarantula from its burrow. → You’ll find factor analysis here. → Here you’ll find reliability analysis. → There are a variety of non-‐parametric statistics available such the chi-‐ square goodness-‐of-‐fit statistic, the binomial test, the Mann-‐Whitney test, the Kruskal-‐ Wallis test, Wilcoxon’s test and Friedman’s ANOVA. • SPSS has some graphing facilities and this menu is used to access the Chart Builder (see Field, 2009, Chapter 4 for details). The types of graphs you can do include: bar charts, histograms, scatterplots, box-‐whisker plots, pie charts and error bar graphs to name but a few. This is an invaluable menu because it offers you online help on both the system itself and the statistical tests. The statistics help files are fairly incomprehensible at times (the program is not designed to teach you statistics) and are certainly no substitute for acquiring a good book like the one I’ve writtenJ. As well as the menus there are also a set of icons at the top of the data window (see Figure 1) that are shortcuts to specific, frequently used, facilities. All of these facilities can be accessed via the menu system but using the icons will save you time. Below is a brief list of some of the most popular icons and their function: • This icon gives you the option to open a previously saved file (if you are in the data editor SPSS assumes you want to open a data file; if you are in the output viewer, it will offer to © Prof. Andy Field, 2012 www.discoveringstatistics.com Page 3 open a viewer file). This icon allows you to save files. It will save the file you are currently working on (be it data or output). If the file hasn’t already been saved it will produce the Save Data As dialog box. This icon activates a dialog box for printing whatever you are currently working on (either the data editor or the output). The exact print options will depend on the printer you use. One useful tip is to select parts of the output by clicking on branches in the viewer window. When the print dialog box appears remember to click on the option to print only the selected text. Selecting parts of the output will save a lot of trees because by default SPSS will print everything in the output window. This icon implies to me (what with the big arrow and everything) that if you click on it SPSS will send a miniaturising ray our of your monitor that shrinks you and then sucks you into a red cell in the data editor, where you will spend the rest of your days fighting decimal points with your bare hands. Fortunately, this icon does do this, but instead enables you to go directly to a case (a row in the data editor). This button is useful if you are working on large data files: if you were analysing a survey with 3000 respondents it would get pretty tedious scrolling down the data sheet to find participant 2407’s responses. By clicking on this icon you can skip straight to the case by typing the case number required (in our example 2407) into this dialog box: Similar to the previous icon, clicking this button activates a function that enables you to go directly to a variable (i.e., a column in the data editor). As before, this is useful when working with big data files in which you have many columns of data. In the example below, we have a data file with 23 variables and each variable represents a question on a questionnaire and is named accordingly (we’ll use this data file, SAQ.sav, in Chapter 17). We can use this icon to activate the Go To dialog box, but this time to find a variable. Notice that a drop-‐down box lists the first 10 variables in the data editor but you can scroll down to go to others. This icon doesn’t allow you to spy on your neighbours (unfortunately), but it does enable you to search for words or numbers in your data file and output window. In the data editor it will search within the variable (column) that is currently active. This option is useful if, for example, you realise from a graph of your data that you have typed 20.02 instead of 2.02, you can simply search for 20.02 within that variable and replace that value with 2.02. Clicking on this icon inserts a new case in the data editor (so it creates a blank row at the point that is currently highlighted in the data editor). This function is very useful if you need to add new data at a particular point in the data editor. Clicking on this icon creates a new variable to the left of the variable that is currently active (to activate a variable simply click once on the name at the top of the column). © Prof. Andy Field, 2012 www.discoveringstatistics.com Page 4 Clicking on this icon is a shortcut to the function. There are often situations in which you might want to analyse groups of cases separately. In SPSS we differentiate groups of cases by using a coding variable and this function lets us divide our output by such a variable. For example, we might test males and females on their statistical ability. We can code each participant with a number that represents their gender (e.g. 1 = female, 0 = male). If we then want to know the mean statistical ability of each gender we simply ask the computer to split the file by the variable Gender. Any subsequent analyses will be performed on the men and women separately. This icon is a shortcut to the function. If you want to analyse only a portion of your data, this is the option for you. This function allows you to specify what cases you want to include in the analysis. Clicking on this icon will either display or hide the value labels of any coding variables. We often group people together and use a coding variable to let the computer know that a certain participant belongs to a certain group. For example, if we coded gender as 1 = female, 0 = male then the computer knows that every time it comes across the value 1 in the Gender column, that person is a female. If you press this icon, the coding will appear on the data editor rather than the numerical values; so, you will see the words male and female in the Gender column rather than a series of numbers. This idea will become clear later. Entering Data Using the Data Editor Overview When you first load SPSS it will provide a blank data editor (showing the ‘data view’) with the title New Data. When inputting a new set of data, you must input your data in a logical way. The SPSS data editor is arranged such that each row represents data from one participant while each column represents a variable. There is no discrimination between independent and dependent variables, both types should be placed in a separate column. It follows from this arrangement that any variable measured with the same participants (a repeated measure) should be represented by several columns (each column representing one level of the repeated measures variable). However, when a between-‐group design was used (e.g. different participants were assigned to each level of the independent variable) the data will be represented by two columns: one that has the values of the dependent variable and one that is a coding variable indicating to which group the participant belonged. This idea will become clearer as you learn about how to carry out specific procedures. http://www.youtube.com/watch?v=b163iBByycw The data editor is made up of lots of cells, which are just boxes in which data values can be placed. When a cell is active it becomes highlighted with a black surrounding box (as in Figures 1 and 2). You can move around the data editor, from cell to cell, using the arrow keys ← ↑ ↓ → (found on the right of the keyboard) or by clicking the mouse on the cell that you wish to activate. To enter a number into the data editor simply move to the cell in which you want to place the data value, type in the value, then press the arrow button appropriate to the direction in which you wish to © Prof. Andy Field, 2012 www.discoveringstatistics.com Page 5 move. So, to enter a row of data, move to the far left of the row, type the first value and then press → (this inputs the value and then moves you into the next cell on the right). The first step in entering your data is to create some variables using the ‘variable view’ of the data editor, and then to input your data using the ‘data view’ of the data editor. We’ll go through these two steps by working through an example. Creating a Variable: The ‘Variable view’ Before we input any data into the data editor, we need to create the variables. To create variables we use the ‘Variable View’ of the data editor. To access this view click on the ‘Variable View’ tab at the bottom of the data editor ( ); the contents of the window will change (Figure 2). Figure 2: The ‘Variable View’ of the SPSS Data Editor Every row of the variable view represents a variable, and you set characteristics of a particular variable by entering information into the labelled columns. You can change various characteristics of the variable by entering information into the following columns (play around and you’ll get the hang of it): You can enter a name in this column for each variable. This name will appear at the top of the corresponding column in the data view, and helps you to identify variables in the data view. There are certain symbols you can’t use (mainly symbols that have other uses in SPSS such as +, −, $, &), and you can’t use spaces. (Many people use a ‘hard’ space in variable names, which replaces the space with an underscore; for example, Andy_Field instead of Andy Field.) If you use a character that SPSS doesn’t like you’ll get an error message saying that the variable name is invalid when you click on a different cell, or try to move off the cell using the arrow keys. You can have different types of data. Mostly you will use numeric variables (which just means that the variable contains numbers -‐ SPSS assumes this data type). You will come across string variables, which consist of strings of letters. If you wanted to type in people’s names, for example, you would need to change the variable type to be string rather than numeric. You can also have currency variables (i.e. £s, $s, euro) and date variables. The name of the variable (see above) has some restrictions on characters, and you also wouldn’t want to use huge long names at the top of your columns (they become hard to read). Therefore, you can write a longer variable description in this column. This may seem pointless, but is actually one of the best habits you © Prof. Andy Field, 2012 www.discoveringstatistics.com Page 6 can get into. This column is for assigning numbers to represent groups of people (see below). This is where you define the level at which a variable was measured (Nominal, Ordinal or Scale). This is important, especially if you want to draw graphs! Data set 1: Between-group design To begin with, imagine that a film company director was interested in whether there was really such a thing as a ‘chick flick’ (a film that typically appeals to women more than men). He took 20 men and 20 women and showed half of each sample a film that was supposed to be a ‘chick flick’ (Bridget Jones’ Diary), and the other half of each sample a film that didn’t fall into the category of ‘chick flick’ (Memento, a brilliant film by the way). In all cases he measured their physiological arousal as an indicator of how much they enjoyed the film. Male Female Bridget Jones’ Diary Memento Bridget Jones’ Diary Memento 22 37 3 30 13 20 15 25 16 16 5 31 10 28 16 36 18 27 13 23 24 18 20 14 13 32 11 21 14 24 19 31 19 21 15 22 23 35 7 14 We need to pay attention to the rule of the data editor that scores from different people appear in different rows because this is not how the data are laid out in the table above (to save space). Remember that each score above comes from a different person, therefore we will need 40 rows (not 10 as above). To enter the data above into the SPSS data editor we need to create several variables. If we begin with the variable Arousal, we should follow these steps: 1. Move the on-‐screen arrow (using the mouse) to the first white cell in the column labelled Name. 2. Type the word Arousal. 3. Move off of this cell using the arrow keys on the keyboard (you can also just click on a different cell, but this is actually a very slow way of doing it). © Prof. Andy Field, 2012 www.discoveringstatistics.com Page 7 You’ve just created your first variable! You should notice that once you’ve typed a name, SPSS creates default settings for the variable (such as assuming it’s numeric and assigning 2 decimal places). Now because I want you to get into good habits, move to the cell in the column labelled label and type ‘Average physiological arousal during the film’. Once the variable has been created, you can return to the data view by clicking on the ‘data view’ tab at the bottom of the data editor ( ). The contents of the window will change, and you’ll notice that the first column now has the label arousal. To enter the data, click on the white cell at the top of the column labelled arousal and type the first value (22). To register this value in this cell, we have to move to a different cell and because we are entering data down a column, the most sensible way to do this is to press the ↓ key on the keyboard. This action moves you down to the next cell, and the number 22.00 should appear in the cell above. Enter the next number (13) and then press ↓ to move down to the next cell, and so on. Creating Coding Variables A coding variables (also known as a grouping variable) is a type of variable that you will use on numerous occasions: it is a variable consisting of a series of numbers that represent levels of an independent variable. In experiments, coding variables are used to represent independent variables that have been measured between-‐groups (i.e. different participants were assigned to different groups). So, if you were to run an experiment with one group of participants in an experimental condition and a different group of participants in a control group, you might assign the experimental group a code of 1, and the control group a code of 0. When you come to put the data into the data editor, then you would create a variable (which you might call group) and type in the value 1 for any participants in the experimental group, and a 0 for any participant in the control group. This tells the computer that all of the cases that have been assigned the value 1 should be treated as belonging to the same group, and likewise for the participants assigned the value 0. There is a simple rule for how variables should be placed in the SPSS data editor: levels of the between-‐group variables go down the data editor whereas levels of within-‐subject (repeated measures) variables go across the data editor. We will practice this rule over the coming weeks. We have two coding variable in our data: the one describing whether a person was male or female, and a second describing whether the person watched ‘Bridget Jones’ diary’ or ‘Memento’. Let’s create the variable gender first. To create this coding variable, we follow the steps for creating a normal variable, but we also have to tell the computer which numeric codes have been assigned to which groups. So, first of all, move to the cell in the second row in the column labelled Name type a name (let’s call it Gender). I’m still trying to instil good habits, so move along the third row to the column called Label and give the variable a full description such as ‘Participant’s gender’ Then to define the group codes, move along the row to the column labelled and into this cell: . Click on to access the Value Labels dialog box (see Figure 3). © Prof. Andy Field, 2012 www.discoveringstatistics.com Page 8 Click on the appropriate cell in the column labelled Values This button activates the Value Labels dialog box Then, click on Figure 3: Defining coding values in SPSS The Value Labels dialog box is used to specify group codes. This can be done in three easy steps. First, click with the mouse in the white space next to where it says Value (or press Alt and u at the same time) and type in a code (e.g. 1). These codes are completely arbitrary; for the sake of convention people typically use 0, 1, 2, 3, etc, but in practice you could have a code of 495 if you were feeling particularly arbitrary. The second step is to click the mouse in the white space below, next to where it says Value Label (or press Tab, or Alt and e at the same time) and type in an appropriate label for that group. In Figure 3 I have already defined a code of 1 for Males, and then I have typed in 2 as my code and given this a label of Female. The third step is to add this coding to the list by clicking on . When you have defined all of your coding values you can click on and SPSS will check your variable labels for spelling errors (which can be very handy if you are as bad at spelling as I am). To finish, click on ; if you click on and have forgotten to add your final coding to the list, SPSS will display a message warning you that any pending changes will be lost. In plain English this simply tells you to go back and click on before continuing. Finally, coding variables always represent categories and so the level at which they are measured is nominal (or ordinal if the categories have a meaningful order). Therefore, you should specify the level at which the variable was measured by going to the column labelled Measure and selecting (or if the groups have a meaningful order) from the drop-‐down list. Having defined your codes, you can then go to the data view (by clicking the tab at the bottom of the window) and type these numerical values into the appropriate column (so if a person was a male type a value of 1, if they were a female type the value 2). What is really groovy is that you can get the computer to display the numerical codes, or the value labels that you gave them by clicking on . Having created these variables arousal and gender, try to create the variable film and enter the rest of the data yourself. Save these data in a file called ChickFlick.sav – we’ll need them later. © Prof. Andy Field, 2012 www.discoveringstatistics.com Page 9 Data set 2: repeated measures Hiccups can be a serious problem: Charles Osborne apparently got a case of hiccups while slaughtering a hog (well, who wouldn’t?) that lasted 67 years. People have many methods for stopping hiccups (a surprise, holding your breath), but actually medical science has put its collective mind to the task too. The official treatment methods include tongue-‐pulling manoeuvres, massage of the carotid artery, and, believe it or not, digital rectal massage (Fesmire, 1988). Let’s say we wanted to put digital rectal massage to the test (erm, as a cure of hiccups I mean). We took 15 hiccup sufferers, and during a bout of hiccups administered each of the three procedures (in random order and at intervals of 5 minutes) after taking a baseline of how many hiccups they had per minute. We counted the number of hiccups in the minute after each procedure. Baseline Tongue Pulling Carotid Artery Massage Digital Rectal Massage 15 9 7 2 13 18 7 4 9 17 5 4 7 15 10 5 11 18 7 4 14 8 10 3 20 3 7 3 9 16 12 3 17 10 9 4 19 10 8 4 3 14 11 4 13 22 6 4 20 4 13 4 14 16 11 2 13 12 8 3 These data can be entered as above because each person took part in all four conditions – therefore, each row represents a particular person, and each column represents the number of hiccups that they had during a particular treatment. → You know how to create variables and enter data, so create four new variables representing the treatments in this experiment. Label them, set the properties, and then enter the scores for the 15 participants. Save the completed data file as Hiccups.sav. © Prof. Andy Field, 2012 www.discoveringstatistics.com Page 10 The SPSS Viewer Alongside the SPSS Data Editor window, there is a second window known as the SPSS Viewer. Figure 4 shows the basic layout of the SPSS viewer. On the right-‐hand side there is a large space in which the output is displayed. SPSS displays both graphs and the results of statistical analyses in this part of the viewer. It is also possible to edit graphs and to do this you simply double-‐click on the graph you wish to edit (this creates a new window in which the graph can be edited). On the left-‐hand side of the output viewer there is a tree diagram illustrating the structure of the output. This tree diagram is useful when you have conducted several analyses because it provides an easy way of accessing specific parts of the output. The tree structure is fairly self-‐explanatory in that every time you do something in SPSS (such as drawing a graph or running a statistical procedure), it lists this procedure as a main heading. Graph of some data Tree diagram of the current output Results of statistical analysis Figure 4: The Output Viewer http://www.youtube.com/watch?v=8dDIw_oJsBs In Figure 4 I conducted a graphing procedure followed by a univariate analysis of variance (ANOVA) and so these names appear as main headings. For each procedure there are a series of sub-‐headings that represents different parts of the analysis. For example, in the ANOVA procedure, which you’ll learn more about later in the course, there are several sections to the © Prof. Andy Field, 2012 www.discoveringstatistics.com Page 11 output such as Levene’s test and a table of the between-‐group effects. You can skip to any one of these sub-‐components of the ANOVA output by clicking on the appropriate branch of the tree diagram. So, if you wanted to skip straight to the between-‐group effects you should move the on-‐ screen arrow to the left-‐hand portion of the window and click where it says Tests of Between-‐ Subjects Effects. This action will highlight this part of the output in the main part of the viewer Presenting Data Does and Don’ts of Presenting Data The advent of computers has allowed people to spend vast amounts of time producing very snazzy looking graphs, but I hope to convince you that snazzy is not always best! Tufte (2001) has written an excellent text about how data should be presented; the main points that he (and others) make are summarised extremely well in a very readable article by Wright & Williams (2003). Tufte (2001) points out that graphs should do, amongst other things, the following: ü Show the data ü Induce the reader to think about the data being presented (rather than some other aspect of the graph, like how nice the colour scheme is). ü Avoid distorting the data ü Present many numbers with minimum ink! ü Make large data sets coherent ü Encourage the reader to compare different pieces of data ü Reveal data. However, graphs often don’t do these things. Let’s look at an example of a bad graph. 18 Number of Obsessive Thoughts/Actions per Day 16 Thoughts Actions Error Bars Show 95% CI 14 12 10 8 6 4 2 0 CBT BT Therapy No Treatment Figure 5: A cringingly bad example of a graph from the first edition of my book ‘Discovering Statistics …’ (2000), and a better example of how it should be done © Prof. Andy Field, 2012 www.discoveringstatistics.com Page 12 One of the most truly appalling examples of bad graphics was done by me in the first edition of my book ‘Discovering Statistics …’ (2000). Overexcited by SPSSs ability to put all sorts of useless crap on graphs (like 3-‐D effects, fill effects and so on) I literally went into some weird orgasmic state and produced an absolute abomination (I’m surprised Tufte didn’t kill himself just so he could turn in his grave at the sight of it …). It’s a graph showing the mean number of obsessive thoughts and behaviours experienced by groups of people suffering from obsessive compulsive disorder after three types of therapy: Cognitive Behaviour Therapy (CBT), Behaviour therapy (BT) and no treatment. Figure 5 reproduces this graph and shows an alternative display of these data. What’s wrong with the original (left)? û The bars have a 3-‐D effect: Never use 3-‐D on a 2-‐D graph because all it does is obscure the data. In particular it makes it hard to see the values of the bars because of the 3-‐D effect. This graph is a great example because the 3-‐D effect makes the error bars almost impossible to read. û Patterns: The bars also have patterns, which although very pretty, merely distract the eye from what matters (namely the data). These are completely unnecessary! û Cylindrical bars: what’s that all about eh? û Badly labelled y-‐axis: ‘number’ of what … delusions? Fish? Cabbage eating sea lizards from the 8th dimension? Idiots who don’t know how to draw graphs? Now, take a look at the redone version (right). What improvements have been made? ü 2-‐D: The completely unnecessary third dimension is gone making it much easier to compare the values across therapies and thoughts/behaviours. ü The y-‐axis has a more informative label: we now know that is was the number of obsessive thoughts or actions per day that was being measured. ü Distractions: There are fewer distractions like patterns, cylindrical bars and the like! Tufte (2001) actually goes a step further and recommends trying to minimise the amount of ink used to present data. 11.0 Number of Times Urine was Left on the Toilet Seat per Week Number of Times Urine was Left on the Toilet Seat per Week 12 10 8 6 4 2 0 10.8 10.6 10.4 10.2 10.0 9.8 9.6 Male Female Gender Male Female Gender Figure 6: two graphs showing the same thing © Prof. Andy Field, 2012 www.discoveringstatistics.com Page 13 Governments love to lie with statistics, but scientists shouldn’t. How you present your data can make a huge difference to the message conveyed to the audience. Figure 6 shows two graphs that, believe it or not, display exactly the same data. The first panel shows how the graph should probably be scaled. The important thing is that the y-‐axis begins at 0, and this creates the correct impression: that there isn’t any difference between the amount that men and women urinate on the toilet seat. However, imagine you wanted to create the impression that men urinated on the toilet seat more than women (OK, so we know they do, but bear with me), all we have to do is re-‐ scale the graph (by not starting the y-‐axis at zero) and there suddenly seems to be a huge difference. In fact, the difference is numerically very small, but the graph makes it look really big! Tempting as it is, don’t do this (unless you plan to be Prime Minister at some point in your future in which case you might as well start practicing this kind of deceit). So, if you want to draw a good graph follow a few of Tufte’s recommendations: ü Don’t create false impressions of what the data actually show (likewise, don’t hide effects!) by scaling the y-‐axis in some weird way. ü Abolish chartjunk: don’t use patterns, 3-‐D effects, shadows, pictures of hippopotami, photos of your grandma or anything else. ü Avoid excess ink: this is a bit radical, but if you don’t need the axis, then get rid of them. The SPSS Chart Builder In SPSS we can use the all-‐singing and all-‐dancing Chart Builder to produce graphs. Figure 7 shows the basic Chart Builder dialog box, which is accessed through the menu. There are some important parts of this dialog box: → Gallery: For each type of graph, a gallery of possible variants is shown. Double-‐click on an icon to select a particular type of graph. → Variable list: The variables in the data editor are listed here. These can be dragged into drop zones to specify what is shown in a given graph. → The canvas: This is the main area in the dialog box and is where a preview of the graph is displayed as you build it. → Drop zones: These zones are designated with blue dotted lines. You can drag variables from the variable list into these zones. There are two ways to build a graph: the first is by using the gallery of predefined graphs and the second is by building a graph on an element-‐by-‐element basis. The gallery is the default option and this tab ( ) is automatically selected and is fine for our purposes. © Prof. Andy Field, 2012 www.discoveringstatistics.com Page 14 When you first use the chart builder to draw a graph you will see a dialog box that seems to signal an impending apocalypse. In fact, SPSS is just helpfully(?!) reminding you that for the Chart Builder to work, you need to have set the level of measurement correctly for each variable. That is, when you defined each variable you must have set them correctly to be Scale, Ordinal or Nominal. This is because SPSS needs to know whether variables are categorical (nominal) or continuous (scale) when it creates the graphs. If you have been diligent and set these properties when you entered the data then simply click on to make the dialog disappear. If you forgot to set the level of measurement for any variables then click on to go to a new dialog box in which you can change the properties of the variables in the data editor. Variables list: variables in the data editor are displayed here. Drop Zones: Variables can be dragged into these zones. The Canvas: An example graph will appear here as you build it. Gallery: Select a style of graph by clicking on an item on this list Figure 7: The SPSS Chart Builder Graphing means: bar charts and error bars How you create bar charts in SPSS depends largely on how you collected your data (whether the means come from independent cases and are, therefore, independent, or came from the same cases and so are related). For this reason we will look at a variety of situations. Figure 8 shows the various options in the chart builder under the option ‘bar’. Given what I’ve said above, avoid the 3-‐ D options. The main options that you’ll use will be: © Prof. Andy Field, 2012 www.discoveringstatistics.com Page 15 → Simple bar: Use this option when you just want to see the means of scores across different groups of cases. For example, you might want to plot the mean ratings of two films. → Clustered bar: If you had a second grouping variable you could produce a simple bar chart (as above) but with bars produced in different colours for levels of a second grouping variable. For example, you could have ratings of the two films, but for each film have a bar representing ratings of ‘excitement’ and another bar showing ratings of ‘enjoyment’. Simple Histogram Stacked Histogram Frequency Polygon Population Pyramid Figure 8: The bar chart gallery Simple bar charts for independent means First of all, let’s just plot the mean rating of the two films from our film data that we typed in earlier. Open the data file that you saved earlier (ChickFlick.sav). We have just one grouping variable (the film) and one outcome (the arousal); therefore, we want a simple bar chart. In the Chart Builder double-‐click on the icon for a simple bar chart (Figure 8). On the canvas you will see a graph and two drop zones: one for the y-‐axis and one for the x-‐axis. The y-‐axis needs to be the dependent variable, or the thing you’ve measured, or more simply the thing for which you want to display the mean. In this case it would be arousal, so select arousal from the variable list and drag it into the y-‐axis drop zone ( ). The x-‐axis should be the variable by which we want to split the arousal data. To plot the means for the two films, select the variable film from the variable list and drag it into the drop zone for the x-‐axis ( ). Figure 9 shows the completed Chart Builder for the bar chart and some other options. The ‘element properties’ dialog box should appear when you select the type of graph you want, but if it doesn’t click on in the Chart Builder. There are three important features of this dialog box. The first is that, by default, the bars will display the mean value. This is fine, but just note that you can plot other summary statistics such as the median or mode. Second, just because you’ve selected a simple bar chart doesn’t mean that you have to have a bar chart. Also, you can ask SPSS to add error bars to your bar chart to create an error bar chart by selecting . You have a choice of what your error bars represent. Normally, error bars show the 95% confidence interval, and I have selected this option ( ).Note, though, that you can change the width of the confidence interval displayed by changing the ‘95’ to a different value. You can also display the standard error (the default is to show 2 standard errors, but you can change this to 1) © Prof. Andy Field, 2012 www.discoveringstatistics.com Page 16 or standard deviation (again, the default is 2 but this could be changed to 1 or another value). It’s important that when you change these properties that you click on : if you don’t then the changes will not be applied to Chart Builder. Click on to produce the graph. Figure 9: Dialog boxes for a simple bar chart with error bar Figure 10: Bar chart of the mean arousal for each of the two films. © Prof. Andy Field, 2012 www.discoveringstatistics.com Page 17 Figure 10 shows the resulting bar chart. This graph displays the mean (and the confidence interval of those means) and shows us that on average, people were more aroused by Memento than they were by Bridget Jones’ Diary. However, we originally wanted to look for gender effects, so this graph isn’t really telling us what we need to know. The graph we need is a clustered graph. Clustered bar charts for independent means To do a clustered bar chart for means that are independent (i.e. have come from different groups) we need to double-‐click on the clustered bar chart icon in the Chart Builder (Figure 8). On the canvas you will see a graph as with the simple bar chart but there is now an extra drop zone: . All we need to do is to drag our second grouping variable into this drop zone. As with the previous example, select arousal from the variable list and drag it into , then select film from the variable list and drag it into . In addition, though, select the Gender variable and drag it into . This will mean that bars representing males and females will be displayed in different colours. As in the previous section, select error bars in the properties dialog box and click on to apply them to the Chart Builder. Figure 11 shows the completed Chart Builder. Click on to produce the graph. Figure 11: Dialog boxes for a clustered bar chart with error bar Figure 12 shows the resulting bar chart. Like the simple bar chart this graph tells us that arousal was overall higher for Memento than Bridget Jones’ Diary, but it also splits this information by gender. The mean arousal for Bridget Jones’ Diary shows that males were actually more aroused during this film than females. This indicates they enjoyed the film more than the women did! Contrast this with Memento, for which arousal levels are comparable in males and females. On the face of it, this contradicts the idea of a ‘chick flick’: it actually seems that men enjoy chick flicks more than the chicks (probably because it’s the only help we get to understand the complex workings of the female mind!). © Prof. Andy Field, 2012 www.discoveringstatistics.com Page 18 Figure 12: Bar chart of the mean arousal for each of the two films Simple bar charts for related means Load the file Hiccups.sav that you saved earlier on. Remember that there is no grouping variable that specifies the interventions because each patient experienced all interventions. In the previous two examples we have used grouping variables to specify aspects of the graph (e.g. we used the grouping variable film to specify the x-‐axis). For repeated-‐measures data we will not have these grouping variables and so the process of building a graph is a little more complicated (but not a lot more). To plot the mean number of hiccups go to the Chart Builder and double-‐click on the icon for a simple bar chart (Figure 8). As before, you will see a graph on the canvas with drop zones for the x-‐ and y-‐axis. Previously we specified the column in our data that contained data from our outcome measure on the y-‐axis, but for these data we have four columns containing data on the number of hiccups (the outcome variable). What we have to do then is to drag all four of these variables from the variable list into the y-‐axis drop zone. We have to do this simultaneously. First, we need to select multiple items in the variable list: to do this, select the first variable by clicking on it with the mouse. The variable will be highlighted in blue. Now, hold down the Ctrl key on the keyboard and click on a second variable. Both variables are now highlighted in blue. Again, hold down the Ctrl key and click on a third variable in the variable list and so on for the fourth. In cases in which you want to select a list of consecutive variables, you can do this very quickly by simply clicking on the first variable that you want to select (in this case baseline), hold down the Shift key on the keyboard and then click on the last variable that you want to select (in this case digital rectal massage); notice that all of the variables in between have been selected too. Once the four variables are selected you can drag them by clicking on any one of the variables and then dragging them into as shown in Figure 13. Once you have dragged the four variables onto the y-‐axis drop zones a new dialog box appears (Figure 14). This box tells us that SPSS is creating two temporary variables. One is called Summary, which is going to be the outcome variable (i.e. what we measured — in this case the number of hiccups per minute). The other is called index and this variable will represent our independent variable (i.e. what we manipulated — in this case the type of intervention). SPSS uses these temporary names because it doesn’t know what our particular variables represent, but we should change them to something more helpful! Just click on to get rid of this dialog box. © Prof. Andy Field, 2012 www.discoveringstatistics.com Page 19 Figure 13: Specifying a simple bar chart for repeated-‐measures data Figure 14: The Create Summary Group dialog box We need to edit some of the properties of the graph. Figure 15 shows the options that need to be set: if you can’t see this dialog box then click on in the Chart Builder. In the left panel of Figure 15 just note that I have selected to display error bars (see the previous two sections for more information). The middle panel is accessed by clicking on X-‐Axis1 (Bar1) in the list labelled Edit Properties of which allows us to edit properties of the horizontal axis. The first thing we need to do is give the axis a title and I have typed Intervention in the space labelled Axis Label. This label will appear on the graph. Also, we can change the order of our variables if we want to by selecting a variable in the list labelled Order and moving it up or down using and . If we change our mind about displaying one of our variables then we can also remove it from the list by selecting it and clicking on . Click on for these changes to take effect. The right panel of Figure 15 is accessed by clicking on Y-‐Axis1 (Bar1) in the list labelled Edit Properties of which allows us to edit © Prof. Andy Field, 2012 www.discoveringstatistics.com Page 20 properties of the vertical axis. The main change that I have made here is to give the axis a label so that the final graph has a useful description on the axis (by default it will just say Mean, which isn’t very helpful). I have typed ‘Mean Number of Hiccups Per Minute’ in the box labelled Axis Label. Also note that you can use this dialog box to set the scale of the vertical axis (the minimum value, maximum value and the major increment, which is how often a mark is made on the axis). Mostly you can let SPSS construct the scale automatically and it will be fairly sensible — and even if it’s not you can edit it later. Click on to apply the changes. Figure 15: Setting Element Properties for a repeated-‐measures graph Figure 16 shows the completed Chart Builder. Click on to produce the graph. The resulting bar chart in Figure 17 displays the mean (and the confidence interval of those means) number of hiccups at baseline and after the three interventions. Note that the axis labels that I typed in have appeared on the graph. The error bars on graphs of repeated-‐measures designs aren’t actually correct (see Field, 2009, Chapter 9) but you’ll have to read the book if you want to sort that problem out! We can conclude that the amount of hiccups after tongue pulling was about the same as at baseline; however, carotid artery massage reduced hiccups, but not by as much as a good old fashioned digital-‐rectal massage. The moral here is: if you have hiccups, find something digital and go amuse yourself for a few minutes. Clustered bar charts for related means Now we have seen how to plot means that are related (i.e. show different conditions applied to the same group of cases), you might well wonder what you do if you have a second independent variable that had been measured in the same sample. You’d do a clustered bar chart, right? Wrong? Actually, the SPSS Chart Builder doesn’t appear to be able to cope with this situation at all — at least not that I can work out from playing about with it. © Prof. Andy Field, 2012 www.discoveringstatistics.com Page 21 Figure 16: Completed Chart Builder for a Figure 17: Bar chart of the mean number of repeated-‐measures graph hiccups at baseline and after various interventions Clustered bar charts for ‘mixed’ designs The Chart Builder might not be able to do charts for multiple repeated-‐measures variables, but it can graph what is known as a mixed design. This is a design in which you have one or more independent variables measured using different groups, and one or more independent variables measured using the same sample. Basically, the Chart Builder can produce a graph provided you have only one variable that was a repeated measure. We all like to text-‐message. What will happen to the children, though? Not only will they develop super-‐sized thumbs, they might not learn correct written English. Imagine we conducted an experiment in which a group of 25 children was encouraged to send text messages on their mobile phones over a six-‐month period. A second group of 25 children was forbidden from sending text messages for the same period. To ensure that kids in this latter group didn’t use their phones, this group was given armbands that administered painful shocks in the presence of microwaves (like those emitted from phones). The outcome was a score on a grammatical test (as a percentage) that was measured both before and after the intervention. The first independent variable was, therefore, text message use (text messagers versus controls) and the second independent variable was the time at which grammatical ability was assessed (baseline or after six months). The data are in the file Text Messages.sav. © Prof. Andy Field, 2012 www.discoveringstatistics.com Page 22 Figure 18: Selecting the repeated-‐measures variable in the Chart Builder To graph these data we need to follow the procedure for graphing related means. Our repeated-‐ measures variable is time (whether grammatical ability was measured at baseline or six months) and is represented in the data file by two columns, one for the baseline data and the other for the follow-‐up data. In the Chart Builder select these two variables simultaneously by clicking on one and then holding down the Ctrl key on the keyboard and clicking on the other. When they are both highlighted click on either one and drag it into as shown in Figure 18. The second variable (whether children text messaged or not) was measured using different children and so is represented in the data file by a grouping variable (group). This variable can be selected in the variable list and dragged into . The two groups will be displayed as different-‐coloured bars. → Use what you learnt earlier in this handout to add error bars to this graph and to label both the x-‐ (I suggest ‘Time’) and y-‐axis (I suggest ‘Mean Grammar Score (%)’). The finished Chart Builder is in Figure 19. Click on to produce the graph. Figure 20 shows the resulting bar chart. It shows that at baseline (before the intervention) the grammar scores were comparable in our two groups; however, after the intervention, the grammar scores were lower in the text messagers than in the controls. Also, if you compare the two blue bars you can see that text messagers’ grammar scores have fallen over the six months; compare this to the controls (green bars) whose grammar scores are fairly similar over time. We could, therefore, conclude that text messaging has a detrimental effect on children’s understanding of English grammar and civilization will crumble, with Abaddon rising cackling from his bottomless pit to claim our wretched souls. Maybe. © Prof. Andy Field, 2012 www.discoveringstatistics.com Page 23 Figure 19: Completed dialog box for an error Figure 20: Error bar graph of the mean grammar bar graph of a mixed design score over six months in children who were allowed to text-‐message versus those who were forbidden Editing Graphs You can edit graphs, there’s a movie that shows you how. http://www.youtube.com/watch?v=en0t0QS9uo8 Tasks Task 1 A neurologist carried out an experiment to investigate the depressant effects of certain recreational drugs. She tested 20 clubbers in all: 10 were given an ecstasy tablet to take on a Saturday night and 10 were allowed only to drink alcohol. Levels of depression were measured using the Beck Depression Inventory (BDI) the day after and midweek. Using what you know about entering data below into SPSS, Enter the data above into the SPSS Data Editor. Draw two bar charts; one to see whether ecstasy makes you more depressed than alcohol the day after (Sunday) and the other showing whether ecstasy makes you more depressed than alcohol midweek (Wednesday). © Prof. Andy Field, 2012 www.discoveringstatistics.com Page 24 Participant Drug BDI (Sunday) BDI (Wednesday) 1 Ecstasy 15 28 2 Ecstasy 35 35 3 Ecstasy 16 35 4 Ecstasy 18 24 5 Ecstasy 19 39 6 Ecstasy 17 32 7 Ecstasy 27 27 8 Ecstasy 16 29 9 Ecstasy 13 36 10 Ecstasy 20 35 11 Alcohol 16 5 12 Alcohol 15 6 13 Alcohol 20 30 14 Alcohol 15 8 15 Alcohol 16 9 16 Alcohol 13 7 17 Alcohol 14 6 18 Alcohol 19 17 19 Alcohol 18 3 20 Alcohol 18 10 Task 2 Shackelford et al. (2000) did a study to look at emotional reactions to infidelity (it’s in Cognition & Emotion, 14, 643-‐659). The upshot is men get homicidal and suicidal and women feel undesirable and insecure. Let’s imagine we did something similar: we took some men and women and got their partners to tell them they had slept with someone else. We then took each person to two shooting galleries and each time gave them a gun and 100 bullets. In one gallery was a human shaped target with a picture of their own face on it, and in the other was a target with their partner’s face on it. They were left alone with each target for 5 minutes and the number of bullets used was measured. © Prof. Andy Field, 2012 www.discoveringstatistics.com Page 25 Using what you know about entering data in to SPSS, enter the data below into the SPSS Data Editor. Draw a clustered bar chart to show the mean number of bullets used on the ‘partner target’ and ‘self target’ for males and females. Male Female Harm Partner Harm Themselves Harm Partner Harm Themselves 69 33 70 97 76 26 74 80 70 10 64 88 76 51 43 100 72 34 51 100 65 28 93 58 82 27 48 95 71 9 51 83 71 33 74 97 75 11 73 89 52 14 41 69 34 46 84 82 Task 3 According to some highly unscientific research done by a UK department store chain and reported in Marie Clare magazine (http://ow.ly/9Dxvy) shopping is good for you: they found that the average women spends 150 minutes and walks 2.6 miles when she shops, burning off around 385 calories. In contrast, men spend only about 50 minutes shopping, covering 1.5 miles. This was based on strapping a pedometer on a mere 10 participants. Although I don’t have the actual data, some simulated data based on these means are below. Enter these data into SPSS and save them as Shopping Exercise.sav. Male Distance 0.16 0.40 1.36 1.99 3.61 Female Time 15 30 37 65 103 Distance 1.40 1.81 1.96 3.02 4.82 Time 22 140 160 183 245 Task 4 I was taken by two new stories. The first was about a Sudanese man who was forced to Marry Goat after being caught having sex with it (http://ow.ly/9DyyP). I’m not sure he treated the goat © Prof. Andy Field, 2012 www.discoveringstatistics.com Page 26 to a nice dinner in a posh restaurant before taking advantage of her, but either way you have to feel sorry for the goat. I’d barely had time to recover from that story when another appeared about an Indian man forced to marry a dog to atone for stoning two dogs and stringing them up in a tree 15 years earlier http://ow.ly/9DyFn. Why anyone would think it’s a good idea to enter a dog into matrimony with a man with a history of violent behaviour towards dogs is beyond me. Still, I wondered whether a goat or dog made a better spouse. I found some other people who had been forced to marry goats and dogs and measured their life satisfaction and, also, how much they like animals. Enter these data into SPSS and save as Goat or Dog.sav. Goat Dog Animal Liking Life Satisfaction Animal Liking Life Satisfaction 69 25 31 29 12 49 25 35 51 40 23 37 47 6 47 33 13 56 42 51 42 46 27 48 16 65 39 35 19 53 27 44 52 66 65 61 60 68 37 72 References Field, A. P. (2007). Summarising Data. In G. C. L. Davey (ed.) Complete Psychology (2nd edition). London: Hodder & Stoughton. Tufte, E. R. (2001). The Visual Display of Quantitative Information (2nd Ed.). Cheshire, Conn.: Graphics Press. Wright, D. B., & Williams, S. (2003). Producing bad results sections. The Psychologist, 16, 644-‐648. This handout contains material from: Field, A. P. (2013). Discovering statistics using IBM SPSS Statistics: and sex and drugs and rock ‘n’ roll (4th Edition). London: Sage. This material is copyright Andy Field (2000, 2005, 2009, 2013). © Prof. Andy Field, 2012 www.discoveringstatistics.com Page 27


© Copyright 2026