
July 28, 2014
July 28, 2014
MORGAN STANLEY BLUE PAPER
MORGAN ST ANLEY RESEARCH
Global
Stephen Byrd
1
Timothy Radcliff
Simon Lee
1
2
Bobby Chada
3
Dominik Olszewski
Yuka Matayoshi
Parag Gupta
3
6
4
5
Miguel Rodrigues
1
Adam Jonas
Peter J. Mackey
3
3
Paul R. Walsh
Mary Curtis
Solar Power & Energy Storage
Policy Factors vs. Improving Economics
We have developed a model that calculates solar economics around the world
based on local regulatory dynamics and solar conditions. We project combined
solar growth for China, Japan, the US, Europe, India, and Brazil of 39 GW per year
through 2020, and global demand of 47 GW. We are bullish on US demand growth due
to improving solar economics. In Europe, we highlight the German “solar slowdown.” In
China, we are below industry forecasts because we believe that the Chinese government
will keep solar growth to rates similar to nuclear and wind to achieve emission reduction
goals. In Japan, our projected demand is below industry estimates due to our bearish
view of the pending government review of solar subsidies.
7
Roy Campbell
7
7
Dimple Gosai
*See page 2 for all contributors to this report
1 Morgan Stanley & Co. LLC
2 Morgan Stanley Asia Limited+
3 Morgan Stanley & Co. International plc+
4 Morgan Stanley India Company Private Limited
5 Morgan Stanley C.T.V.M. S.A.
6 Morgan Stanley MUFG Securities Co., Ltd.+
7 RMB Morgan Stanley (Proprietary) Limited
Energy storage, when combined with solar power, could disrupt utilities in the US
and Europe to the extent customers move to an off-grid approach. We believe
Tesla’s energy storage product will be economically viable in parts of the US and Europe,
and at a fraction of the cost of current storage alternatives.
Potentially advantaged: Solar power “integrators” (SUNE, SCTY, NRG), renewable
Yieldcos (NYLD, NEP, ABY, and TERP), and Tesla (TSLA) as a result of its energy
storage product. Facing downside risk are solar panel and polysilicon manufacturers
(Wacker Chemie, First Solar, GCL Poly, Trina Solar, Yingli Green Energy, Xinyi Solar,
and Jinko Solar), given our expectation of bearish demand in China and Japan. US
utilities in sun-rich, and/or rate-high states (HE, PNW, PCG, EIX, SRE) may be affected
by the growth in both solar power and energy storage.
Morgan Stanley Blue Papers focus on critical
investment themes that require coordinated
perspectives across industry sectors, regions,
or asset classes.
Morgan Stanley does and seeks to do business with companies covered in Morgan Stanley Research. As a result, investors should be aware that the firm may
have a conflict of interest that could affect the objectivity of Morgan Stanley Research. Investors should consider Morgan Stanley Research as only a single factor
in making their investment decision.
For analyst certification and other important disclosures, refer to the Disclosure Section, located at the end of this report.
* = This Research Report has been partially prepared by analysts employed by non-U.S. affiliates of the member. Please see page 2 for the name of each non-U.S.
affiliate contributing to this Research Report and the names of the analysts employed by each contributing affiliate.
+= Analysts employed by non-U.S. affiliates are not registered with FINRA, may not be associated persons of the member and may not be subject to NASD/NYSE
restrictions on communications with a subject company, public appearances and trading securities held by a research analyst account.
MORGAN STANLEY RESEARCH
July 28, 2014
Solar Power & Energy Storage
Contributors to this Report
US Utilities
Stephen Byrd1
+1 (212) 761-3865
[email protected]
+1 (212) 761-4139
[email protected]
+1 (212) 761-1726
[email protected]
+44 20 7425-5238
+44 20 7425-6863
+39 02 7633-5486
+44 20 7677-7167
+44 20 7425-6230
+44 20 7425-4267
+44 20 7425-7238
[email protected]
[email protected]
[email protected]
[email protected]
[email protected]
[email protected]
[email protected]
+ 44 20 7425-4182
+ 44 20 7425-4657
[email protected]
[email protected]
+852-2848-1985
+852-2239-7821
Simon.Lee @morganstanley.com
Sheng.Zhong @morganstanley.com
+81 3 6836-5414
[email protected]
+81 3 6836-8410
+81 3 6836-8404
[email protected]
[email protected]
+91 22-6118-2230
+91 22-6118-2231
[email protected]
[email protected]
+55 11 3048-6016
[email protected]
+91 22 6118-2243
[email protected]
+27 11 282-8139
+27 11 282-1499
+27 11 282-8553
[email protected]
[email protected]
[email protected]
+971 4 709-7110
[email protected]
US Clean Technology
Timothy Radcliff1
US Autos
Adam Jonas1
Europe Utilities
Bobby Chada3
Emmanuel Turpin3
Anna Maria Scaglia, CFA3
Carolina B. Dores, CFA3
Anne N. Azzola Lim3
Timothy Ho3
Dominik P. Olszewski3
Europe Chemicals
Paul R. Walsh3
Peter J. Mackey3
China Utilities
Simon H.Y. Lee, CFA2
Sheng Zhong2
Japan Utilities
Yuka Matayoshi6
Japan Technology
Masahiro Ono (Consumer Electronics)6
Shoji Sato (Electronic Components)6
India Utilities
Parag Gupta4
Satyam Thakur4
Latin American Utilities
Miguel F. Rodrigues5
Consumer/Retail
Girish Achhipalia4
South Africa Industrials
Mary Curtis7
Roy D. Campbell7
Dimple Gosai7
Middle East Infrastructure
Saul Rans8
1 Morgan Stanley & Co. LLC
2 Morgan Stanley Asia Limited+
3 Morgan Stanley & Co. International plc+
4 Morgan Stanley India Company Private Limited
5 Morgan Stanley C.T.V.M. S.A.
6 Morgan Stanley MUFG Securities Co., Ltd.+
7 RMB Morgan Stanley (Proprietary) Limited
8 Morgan Stanley & Co. International plc (DIFC
Branch)
See page 57 for recent Blue Paper reports.
2
MORGAN STANLEY RESEARCH
July 28, 2014
Solar Power & Energy Storage
Table of Contents
Executive Summary ................................................................................................................................................................
4
Analytical Approach..........................................................................................................................................................
9
Global Solar Market Landscape .......................................................................................................................................
10
Implications for Polysilicon ...............................................................................................................................................
14
Growth Potential by Region
China................................................................................................................................................................................
20
Europe..............................................................................................................................................................................
26
United States....................................................................................................................................................................
36
Japan ...............................................................................................................................................................................
41
India .................................................................................................................................................................................
48
Brazil ................................................................................................................................................................................
52
3
MORGAN STANLEY RESEARCH
July 28, 2014
Solar Power & Energy Storage
Executive Summary
We have developed a model that calculates solar
economics around the world based on local regulatory
dynamics and solar conditions. We believe investors can
use this analytical framework to better understand solar
economics in the context of local regulatory dynamics, solar
installation costs, and solar operating conditions.
We project combined solar growth for China, Japan, the
US, Europe, India, and Brazil of 39 GW per year through
2020, or 47 GW including Rest of World. We expect growth
to be heavily driven by China, which we forecast will account
for 27% of new demand globally. We are bullish on US
demand growth due to improving solar economics. In Europe,
we see a risk of a “solar slowdown.”
Exhibit 1
Solar Installation Forecast through 2020 (GW)
-
20
40
60
80
100
China
Europe
US
Japan
India
Brazil
Source: Morgan Stanley Research
Our solar growth forecast is in aggregate below industry
estimates, driven by a more bearish outlook on solar
demand in China and Japan. While we project a 28% CAGR
in solar capacity in China from 2013 to 2020, industry
estimates call for a far more rapid growth rate. Our projected
solar demand in China is below industry levels due to our
view that the Chinese government will seek to grow solar at
similar rates to nuclear and wind to minimize the cost of
achieving emission reduction goals, and ineffective distributed
generation policies. In Japan, we are relatively pessimistic
regarding the outcome of the pending review of solar
subsidies by the Japanese government. Without subsidies,
solar power has a long road ahead in Japan before the
technology can reach grid parity, driven by poor solar
conditions in the country.
We are relatively bullish on solar demand growth in the US,
driven by strong and improving rooftop solar economics and
the likely continuation of favorable net metering subsidies for
solar, which together more than offset a likely reduction (from
30% to 10%) of the solar Investment Tax Credit (ITC) in 2017.
In the long term, we believe solar power will be economic in
some US states without any form of subsidy.
In Europe, we see a mixed bag: a slowdown in additions in
Germany, but with solid growth in other regions. Overall we
expect European capacity additions to remain flat vs 2013,
but with a different regional mix.
What sets our solar analysis apart? We believe our global
analysis benefits from the close integration of local utility
regulatory dynamics (subsidies, as well as explicit renewables
goals set by government entities), solar operating conditions,
and future trends in the local installed cost of solar. Each of
these factors has a significant impact on solar demand
estimates, and none of these factors is static. As solar
economics continue to improve, however, there may be
further reductions in government support, such as the current
review of solar subsidies occurring in Japan. We also factor in
physical limits, such as the availability of suitable land in India,
that in the future may limit the growth of solar power. Our
analysis factors in these evolving dynamics to drive our solar
growth forecast.
Energy storage, specifically Tesla’s product, could be
disruptive in the US and Europe, but is less likely to be
economic in the rest of the world. Given the relatively high
cost of the power grid, we think that customers in parts of the
US and Europe may seek to avoid utility grid fees by going
“off-grid” through a combination of solar power and energy
storage. We believe there is not sufficient appreciation of the
magnitude of energy storage cost reduction that Tesla has
already achieved, nor of the further cost reduction magnitude
that Tesla might be able to achieve once the company has
constructed its “Gigafactory,” targeted for completion later in
the decade. While “off-grid” applications are the most
disruptive use of energy storage, we note that there are also
less disruptive applications such as strengthening the grid to
compensate for the variability of solar output.
Rooftop solar should be a major driver of growth in solar
demand. While large-scale solar projects will continue to be
an important source of growth for the industry in certain parts
of the world, we see a global trend towards greater
4
MORGAN STANLEY RESEARCH
July 28, 2014
Solar Power & Energy Storage
“distributed generation” in the form of rooftop solar, both on
residences and on commercial buildings, driven by:
Significant reductions in installation costs. As solar
“integrators” such as SUNE and SCTY have become
more experienced and have streamlined their installation
process for rooftop solar, installation costs have fallen
rapidly, improving rooftop solar economics.
Favorable regulatory treatment. In Europe, the US, Brazil,
and Japan, residential and commercial customers are
able to avoid some portion or all of their utility bills by
installing solar panels. The entire utility bill is far greater
than simply the cost of generating power from the largescale power plants that feed the power grid. As a result,
solar panel project economics can often be attractive
given the ability to “arbitrage” some or most of the utility
bill. Under such incentives, we believe solar growth, and
returns on solar investments by solar “integrators” that
provide complete solar power solutions to customers, can
surprise to the upside. However, in many
countries/regions we may well see this favorable
regulatory treatment change over time, and as a result
solar power would be able to compete only against the
portion of the utility bill associated with the cost of
producing power from relatively efficient, large-scale
conventional power plants. In sun-rich regions such as
the Southwestern US and India, solar power may in the
long-term become economic against large-scale
conventional power plants, even without government
subsidies.
The following two charts show US solar economics with and
without the US Investment Tax Credit (ITC) subsidy for solar
power, and applying varying “fixed grid fees” to solar
customers (a 100% fixed grid fee indicates that the solar
panel must compete solely against the power generation
portion of the utility bill). These charts illustrate how further
solar cost reductions can in some geographies offset the loss
of subsidies, but in other geographies, the loss of subsidies
would have a critical impact on the ability of solar power to be
a competitive source of power. We expect subsidies may fall
in the US, Europe, and Japan, but may remain, and even
grow, in China, India, and Brazil.
Exhibit 2
Residential Solar Will in Our View Become
Competitive in California, Even without Subsidies
$ / KWh
$0.25
$0.20
$0.15
$0.10
$0.05
$0.00
$3.00
$2.78
$2.57
$2.37
$2.20
$2.03
$1.88
System Price ($ / w)
ITC Scenarios
30%
Fixed Charge as % of T&D
0%
0%
50%
100%
Source: Company Data, Morgan Stanley Research
Exhibit 3
However, in Midwestern US States Such as Illinois,
the LT Outlook for Solar Is Much More Challenging
$ / KWh
$0.20
$0.18
$0.16
$0.14
$0.12
$0.10
$0.08
$0.06
$0.04
$0.02
$0.00
$3.00
$2.78
$2.57
$2.37
$2.20
$2.03
$1.88
System Price ($ / w)
ITC Scenarios
Fixed Charge as % of T&D
30%
0%
0%
50%
100%
Source: Morgan Stanley Research
No significant impact to fossil fuel demand. While our
solar power growth forecast shows significant volumes
relative to the current installed base of solar power, the
magnitude is not large enough to have a major impact on
fossil fuel demand. Keep in mind that solar power is still an
extremely small element of the overall global power
generation asset base, and large increases off a small base
will have modest overall impacts to demand for fossil fuels.
For example, in the US the loss of natural gas demand from
the growth in solar power in the Western US is dwarfed by the
growth in gas demand from petrochemical demand and LNG
export projects. In high-growth markets such as China and
India, solar power is one of several tools needed to meet
growing power demand; this solar growth will in our view likely
not damage demand from coal and natural gas.
5
MORGAN STANLEY RESEARCH
July 28, 2014
Solar Power & Energy Storage
Potentially Advantaged Companies, and
Those Facing Downside Risk
Potentially Advantaged companies, according to our
analysis:
Tesla (TSLA): From our analysis of the economics of
energy storage products, we conclude that Tesla will likely
have the most economic energy storage solution by a
significant margin. This advantage is driven primarily by the
company’s very significant scale (Tesla will produce as
many cells from its Gigafactory as are currently produced
by all worldwide battery manufacturers combined) and
integrated manufacturing efficiencies. We project the capital
cost of Tesla’s battery will fall from the current $250/kWh to
$150/kWh by 2020, whereas its closest competitor will be at
a cost of ~$500/kWh. The utility sector market potential for
Tesla’s storage product is difficult to determine, given the
number of variables that affect this market size, but based
on our analysis we believe it could be above 10 GWh of
storage per year, equal to at least $2b in annual revenue to
Tesla. By today’s numbers, an incremental 10 GWh of
storage sales at a 25% gross margin would boost TSLA’s
share price by $17.
Solar power “integrators” (SunEdison, SolarCity, and
NRG Energy): Given the falling cost of solar, we believe
the “integrators” — companies that offer to finance, design,
and install solar power solutions for customers — will create
greater shareholder value than the panel manufacturers.
This is the case because the integrators typically compete
against a fixed utility rate in the US, Europe, Brazil and
Japan. As solar costs fall and many utility rates increase
with substantial grid investments around the world, returns
on equity can rise significantly given the small number of
companies positioned to capture meaningful share of a very
large market.
In Europe, some of the utilities may pursue, successfully,
an integrator business model – this could be a growth
catalyst and a meaningful value driver. At present it is
unclear who will develop the best and most successful
European “integrator” business model. Of the larger
integrated utilities, RWE seems most focused on
developing a residential energy services model but many
others are also focusing on this.
Renewable energy Yieldcos (NRG Yield, Abengoa Yield,
NextEra Energy Partners, and TerraForm Power): We
see a new investment class emerging, the renewable
Yieldco, that is economically similar to Master Limited
Partnerships (MLPs) but applied to renewable generation
assets. We think Yieldcos will have a cost of
capital/valuation advantage over competitors, and will be
able to create shareholder value by growing their
renewables asset base at returns significantly in excess of
a Yieldco cost of capital. Benefits of the Yieldco investment
vehicle include: an appropriate focus on cash flow as the
most important valuation metric (as opposed to multiples of
GAAP earnings for example, given that earnings are often
lower than cash flow for reneables), the ability to efficiently
return capital to shareholders (often dividends are largely or
entirely tax-free returns of capital), and a lower required
rate of return from investors given the long-term contracted
cash flow stream with creditworthy power purchasers.
SunEdison’s (SUNE) recently completed Yieldco IPO,
TerraForm Power (TERP), in our view should allow SUNE
to capture long-term project value and monetize its asset
base at a more attractive valuation, similar to what NRG is
doing with its Yieldco, NRG Yield (NYLD). Both parent
company and Yieldco subsidiaries can in our view create
shareholder value through the parent selling assets to the
Yieldco at values above the implied value of the assets
reflected in the parent stock, driving significant dividend
growth for the Yieldco. This approach has been pursued
with great success in the MLP industry, and we believe the
renewables segment is well suited to such an approach.
European utilities investing in regulated “good” capex:
(SSE, RWE AG, E.ON, and Enel): Increasingly
decentralized energy will emphasise the need for a reliable
grid and require significant capex. Distributed power will
become part of the network balancing solution. This should
be a positive for regulated capex, which we view as “good”
capex. The most increases in capex are likely where we
see the biggest solar penetration – Germany, Italy, and the
UK. In these markets SSE, RWE E.ON and Enel could
benefit from higher grid capex and associated returns in the
medium term.
Companies facing potential downside risks:
Solar panel manufacturers (First Solar, GCL Poly, Trina
Solar, Yingli Green Energy, Xinyi Solar, and Jinko
Solar), given the large amount of worldwide
manufacturing capacity already on the ground (~50
GW) relative to our global estimate of 47 GW per year:
Given that our solar growth forecast is bearish relative to
solar industry growth estimates (some industry estimates
reach 90 GW of solar demand per year by 2020), solar
panel manufacturers’ profitability may be impacted by the
issue of over-capacity. Without larger, more rapid global
6
MORGAN STANLEY RESEARCH
July 28, 2014
Solar Power & Energy Storage
increases in solar demand, we believe margin expansion
for solar panel manufacturers may be muted.
Given our view that rooftop solar will play an increasingly
large role in solar demand growth, we believe silicon-based
solar panels will in our view be more competitive than thinfilm and concentrating solar. Silicon-based solar panels are
the most appropriate technology for rooftop applications. As
a result, we are cautious with respect to First Solar’s thin
film panel product, given the higher cost of this product
relative to silicon-based panels and the inability of First
Solar’s thin film panels to be used economically for rooftop
applications.
Polysilicon (PS) manufacturers (Wacker Chemie, GCL,
OCI, and Hemlock), given that PS industry projections
of solar panel installation growth are significantly more
bullish than Morgan Stanley’s projections for key
countries such as China and Japan (PS is a key material
used in the manufacture of silicon-based solar panels):. As
with the solar panel industry, PS industry estimates of
growth for China and Japan are significantly in excess of
Morgan Stanley estimates through 2020. PS industry
estimates for 2014-20 Chinese solar panel demand is ~2x3x Morgan Stanley demand, and ~4x Morgan Stanley
estimates for Japanese demand during the same period. If
demand levels in these two key countries disappoint, it is
likely in our view that PS prices would be disappointingly
low, and manufacturing costs (due to low capacity utilization
levels) disappointingly high(although those with the best
quality product would likely remain fully utilized).
US and European utilities that see significant solar
growth and either experience further generation
headwinds, or lack sufficient regulatory protection from
the loss of demand: Pinnacle West in the US; RWE,
E.ON, Enel, GDF Suez, SSE in Europe:. Most US utilities
in solar-heavy states, such as California and Hawaii, have a
“decoupling” mechanism under which utilities are made
whole from the loss of power demand due to customers
self-generating power. However, as solar power grows in
these states, so does the gap between the cost of power for
solar customers and utility customers who receive their
power from the grid.
This can result in a “tipping point” that creates ever greater
incentives for customers to adopt solar, thus leaving utilities
with the potential long-term issue of losing a significant
portion of their customer base. As we highlighted in our
report “Batteries + Distributed Gen. May Be a Negative for
Utilities,” given the very high cost of power in Hawaii, we
believe the solar power adoption rate could be very high,
pressuring rates for non-solar utility customers, which in
turn could create a sufficient incentive for customers to go
fully off-grid. In Arizona, Pinnacle West has only partial
insulation against loss of demand as customers selfgenerate power; we continue to monitor the solar
penetration rate in Arizona closely. In 2014, solar
applications have been rising throughout the year, although
the absolute level has still not reached the point that we
would expect a major impact on PNW’s EPS.
In fast-growing economies such as China, Brazil, and India,
solar power growth is driven by large power demand
growth; as a result, solar power has a less severe
“cannibalization” impact on other generation types and a
smaller impact on utilities.
In Europe, the rollout of solar photovoltaic (PV) systems
has had a big influence on power markets, especially in
Northwest Europe (and particularly in Germany). This has
been a major negative over the last few years for RWE,
E.ON and GDF Suez. However, this was exacerbated by
the decline in coal and CO2 prices. The rollout of solar PV in
the UK has also been faster than expected. We believe this
is one reason for the slower-than-anticipated improvement
in UK spark spreads, a negative for all UK generators, but
especially for SSE, Centrica, RWE and E.ON.
Potentially significant negative impacts to the extent
energy storage costs drop: Hawaiian Electric and
California utilities Sempra Energy, Edison International,
and PG&E Corp., and the generation divisions of
European utilities, including Enel, SSE, E.ON, RWE, and
GDF Suez. It is worth noting that due to important
regulatory, market structure, and economic differences, we
see limited scope for a material move of customers “offgrid” in Europe. This is different from our expectations in
the US.
In Europe and parts of the US, utility bills are relatively high,
which could encourage relatively greater numbers of
customers to disconnect from the grid by using solar power
coupled with energy storage, or in Europe to consume more
self produced power but remain grid connected. Under this
approach, a customer’s solar panels would overproduce
power during the day, and the excess power would be
stored in batteries and drawn upon at night. This risk will
likely materialize over many years (>5 years), and the
degree of risk is subject to many variables that we discuss
in this report. In Europe in particular, there are numerous
issues that may hinder the ability of customers to move fully
7
MORGAN STANLEY RESEARCH
July 28, 2014
Solar Power & Energy Storage
off-grid. For example, the vast majority of customers’ solar
panels are not sized to allow for complete reliance on solar
power – that is, such customers would still be dependent on
the grid for a portion of their power. There are also
regulatory impediments. Perhaps most importantly, adding
sufficient storage capacity to provide full autarky is
sufficiently expensive that it drives IRR’s to unattractive (ie
below breakeven) levels.
and avoid the fixed grid fees. The size of the storage
market, and the corresponding negative impact to utilities,
is quite sensitive to the fixed grid fee that regulators impose
on solar customers. For example, moving from our US base
case (50% of typical fixed grid costs imposed on solar
customers) to our storage bull case (100% of typical fixed
grid costs imposed on solar customers) results in a sharp
increase in demand for energy storage in the US, from 70
GWh to 113 GWh.
Exhibit 4
Solar Power Output Differs Substantially from
Customers’ Power Demand Profile
Source: Edison Electric Institute. The profile of power output and demand represents a
typical customer in California.
Based on our analysis, for the US, we believe that Hawaii
and California represent the greatest opportunity for off-grid
approaches because of their significantly higher electricity
rates and strong solar conditions. Given that utilities in
Hawaii and California are decoupled, rates for non-solar
customers will rise as more customers install solar panels;
this “rate shift” accelerates the adoption rate for solar,
because the delta between the utility rate for power and the
cost of producing solar power increases.
Over time, to the extent regulators increase the fixed “grid
fee” that solar customers must pay to remain connected to
the grid (we do not believe there will be material increases
in these fees in the near to medium terms), there will be a
growing incentive for consumers to install energy storage
For Europe, if storage is cheaper than we expect, and
penetration is faster/bigger, the main negative implication
we see for utilities would be peak shaving and the impact
that this could have on the peak-baseload power price. We
estimate that this would be an additional negative for all
conventional generators. However, the additional impact is
a function of how much more peak shaving is seen, and this
is hard to quantify. Suffice to say that it would be negative
for all European generators in markets where we see
storage as economic, especially Germany and Italy. The
stocks most negatively affected would be RWE, E.ON, GDF
Suez, Enel, and SSE. Enel and SSE have the largest
generation exposure by percentage of EBITDA. E.ON,
RWE, Enel and GDF Suez have the biggest exposure by
production (in TWh). We see the risk of stranded
distribution assets as very low, as we expect few customers
to move off-grid in Europe given the economic and
regulatory issues.
Conversely, greater storage penetration would likely lead to
faster development of a residential energy services model,
and that could be a positive for utilities that successfully
develop it. It is very early to identify potentially advantaged
companies, though we note that RWE have been focused
on this space. It is however possible that the big winners
come from outside the utility space.
8
MORGAN STANLEY RESEARCH
July 28, 2014
Solar Power & Energy Storage
Analytical Approach
We have constructed a model that calculates returns
associated with solar projects around the world.
Potential Approaches Customers Could Take
On the grid, but net zero grid power usage. Under this
approach, a customer’s solar panels produce excess power
during the day (which is sold back to the grid), and at night the
customer draws power from the grid. This approach could
result in low or net zero usage of power produced by largescale power plants attached to the grid.
On the grid, partial grid power usage. This approach is
often taken in Europe, where solar panel systems are not
sized to fully allow customers to eliminate their net usage of
power from the grid, and where economics and regulation
mean moving fully off-grid is very unlikely. It is thus unlikely
that such customers pursue a fully off-grid approach.
Fully off the grid. In this approach, consumers fully depend
on their on-site power generation, using storage and a power
management system to provide power to the home when
needed. Consumers could choose this approach for a number
of reasons. For instance, in select markets, customers who
choose to “net meter” as in the “on-grid” approach described
above, have to pay a large non-bypassable, fixed grid charge;
these consumers have an incentive to go fully off the grid. The
key variable in this approach is the cost of power storage.
Tesla’s Gigafactory for battery production, which will in our
view reduce the cost of batteries significantly below the cost
of other storage options, may significant affect how many
consumers seek to go off the grid.
Methodology
Our model uses national system pricing and financing
assumptions and statewide average irradiance and electricity
rates to estimate the solar levelized cost of electricity (LCOE)
versus grid-sourced electricity. Countries/regions with a
combination of high irradiance and high electricity rates are at
or nearing “grid parity”; those with less sunshine and/or lower
electricity rates tend to be farther away. To calculate LCOE
(measured in $/KWh), we tally the present value of after-tax
cash costs incurred over the lifetime of the system, then
adjust for tax benefits. We then divide the result by the
present value of all electricity produced over the lifetime of the
system to arrive at each state’s or country’s LCOE.
We compare the resulting LCOE against the appropriate
leverageable grid-supplied electricity cost. Next, we compare
the solar LCOE against the relevant electricity rate. If the
LCOE is lower than the relevant “threshold” electricity rate
(remember we have already taken into account the project
owner’s required equity return through LCOE), we consider
the market in-the-money. We divide this addressable
consumption by the same annual sunlight hours data that fed
the original LCOE calculation to determine a country’s solar
addressable market, in megawatts (MW) of capacity.
In Europe, where the electricity produced is partially self
consumed and partially sold either under a FIT or into the
wholesale power market when subsidies end, we use the
same model but focus on the IRR, rather than the LCOE
which can be confusing given the different revenue streams
for self consumption and power sold.
Solar Cost Assumptions
We assume that solar costs continue to decline, although at a
lower rate than over the past 5 years. This decline rate varies
significantly by country, with a slower pace in more mature
solar markets (such as Germany). Whereas pricing has
declined by 60% or more in key markets on a cumulative
basis over the last few years, we expect pricing to decline at a
lower rate (less than 40%) through 2020 in our base case.
Cost declines should be driven by a combination of
operational efficiencies with respect to design and installation
of systems, as well as continued equipment cost declines.
Energy Storage System Cost Assumptions
In addition to battery cost declines of ~50% (consistent with
Tesla’s Gigafactory roadmap that could reduce battery costs
by 50-60%), we forecast declines in costs of associated
hardware to manage a storage system. We believe Tesla’s
combined battery/inverter product will be the most
economically competitive, and we forecast that the inverter
will cost $0.45/watt in our base case. The following table
highlights our energy storage assumptions.
Exhibit 5
Storage Costs Scenarios – for a Typical Household
Installation costs (USD)
Balance of System Costs (USD)
Bear
5,000
2,000
Base
3,000
1,500
Bull
2,000
1,000
Inverter cost (USD/watt)
Total inverter cost (USD)
0.60
3,000
0.45
2,250
0.30
1,500
Battery cost (USD/kWh)
Total battery cost (USD)
250
3,125
150
1,875
100
1,250
Total system cost (USD)
Total system cost (EUR)
13,125
9,722
8,625
6,389
5,750
4,259
1,050
778
690
511
460
341
Total system cost (USD/kWh)
Total system cost (EUR/kWh)
Based on a typical household installing a 5kW solar panel and a 12.5kWh battery (one day’s
storage). We assume EUR/USD is stable at 1.35.
Source: Company Data, Morgan Stanley Research estimates
9
MORGAN STANLEY RESEARCH
July 28, 2014
Solar Power & Energy Storage
Global Solar Market Landscape
Solar economics and regulatory dynamics vary significantly
among the six regions/countries we analyzed. The following
is a high-level overview of solar economics and regulatory
treatment by region/country:
China (27% of projected demand): Solar power is one of
three zero-carbon, zero-emissions power sources (the other
two are wind and nuclear) that the government of China is
increasingly promoting to address the growth in power
demand. The magnitude of power demand growth in China is
very significant as the country added ~90 GW per year in
2009-14, equal to ~8% of total US installed capacity. China
uses feed-in tariffs (FiTs), a fixed payment stream for power
produced by solar panels, coupled with local incentives to
ensure that solar capacity growth meets government targets.
Our projected growth in solar demand is in-line with the most
recent Chinese government targets.
Europe (21% of projected demand): Given the very high
cost of power in Europe, solar is already economic relative to
the entire utility bill (which, as in all countries, is comprised of
grid costs, taxes, subsidies and the costs of actually
generating power). Governments in Europe primarily use
FiTs and tax breaks to incent the growth of solar power.
Many European countries (Germany being the most
significant) already have relatively high solar penetration
levels, but there is the potential for significant future growth
given how competitive solar power is throughout Europe.
United States (17% of projected demand): In 43 US
states, solar panel owners are allowed to net meter,
effectively allowing panel owners to avoid the entire utility bill
(both the portion associated with fixed grid costs and that
associated with actual power generation). Given rapidly
declining solar costs and rising utility bills, we believe solar
growth potential is well above market expectations, even
under our base case assumption in which the 30%
Investment Tax Credit (ITC) steps down to 10% and the net
metering rules are changed so solar customers must pay
50% of the typical fixed grid costs that a utility customer
pays.
Japan (10% of projected demand): Much as in Europe,
Japan uses FiTs to incent solar power installations, and
these incentives have allowed for rapid recent solar growth in
the country. However, we are concerned that a pending
government review of the solar FiT may result in a
substantial reduction in this rate, which would reduce solar’s
growth potential.
India (4% of projected demand): India conducts
competitive auctions for the procurement of additional power
plants, and growth in power demand has been very high
(11% per year over the past several years). The government
has conducted some plant procurement designed solely for
solar power. In procurement auctions open to all generation
types, solar has not been competitive, but recent data points
highlight the potential for solar power to become closer to
competitive with other generation sources. Given practical
limits on the growth of other types of generation in India, we
think solar power will have significant growth potential. But
as solar grows, land requirements will increasingly become a
limiting factor.
Brazil (2% of projected demand): The government of Brazil
has recently pursued a number of approaches to encourage
solar development, including tax breaks, solar-only
procurement processes, and a net metering approach similar
to that in the United States. The objective is to bring scale
and turn solar into a competitive source in the country. Given
the strong solar conditions in parts of Brazil and the net
metering approach, we believe solar projects will become
economically viable in parts of the country.
Africa (1% of projected demand): The solar potential is
huge (NASA data suggests that 60% of the total global solar
potential is concentrated in the Middle East and Africa) but
current installed capacity is minimal (only 1GW at the end of
2013). We expect this to double by the end of 2015 and to
double again to the end of 2020 to c. 4.4GW of capacity.
ROW (18% of projected demand): We estimate ROW
installations by applying the same forecasted growth rate
from China, the US, India, and Brazil. We exclude Europe
and Japan from the calculation given their maturity relative to
the remainder of our focus regions.
A note on the Middle East: Electricity consumption is rising
rapidly across the Middle East (10-year CAGRs of 6% are
common) and governments have struggled to boost their gas
output fast enough to meet demand. Keen to maximize oil
exports, some governments have identified solar as a
potential solution (most notably, the Saudi Arabian
government announced in 2012 a plan to build 41GW of
capacity by 2032). However, developers in the region will
need to overcome a number of technical and organizational
challenges (dust, water scarcity, etc.) to meet its goal, and
we do not have sufficient conviction that these challenges
will be resolved to include separately in our forecast.
10
MORGAN STANLEY RESEARCH
July 28, 2014
Solar Power & Energy Storage
Solar Energy in Africa
The solar potential in Africa is huge, but current installed
megawatts are minimal (1 GW at the end of 2013) and
our projected growth in solar installations, of 0.5 GW per
year through 2020, is relatively small on an absolute
basis. NASA data suggests that many countries in Africa
and the Middle East have daily solar radiation ranging
between 5 and 6 kwh/m2,equivalent to roughly 60% of the
total global potential. However, the speed with which this
potential has been harnessed is still some way behind
developments in all the other regions of the world. As at the
end of 2013, according to the IHS, only 0.7% of the world’s
PV solar capacity was operating in the Middle East and
Africa combined.
What next in Africa? PV solar capacity is growing quickly
within the region. The drivers are a combination of
government support, feed-in-tariff schemes and better
economics as the price of solar capacity has continued to
fall. However, given the abundance of competing (and
cheap) energy sources in many African markets (e.g. coal in
South Africa and Mozambique, oil across much of West
Africa) the solar roll-out is (a) coming off a very low base and
(b) unlikely to make-up a significant proportion of total
electricity generating capacity in many of the African markets
anytime soon. However, noteworthy initiatives include:
5. A 115 MW solar plant in Ghana is scheduled to be
completed in 2015.
6. Morocco is currently building a 160 MW plant as part of
their 2,000 MW solar build plan set to be achieved by
2020.
7. In South Africa, current total electricity generating capacity
is 42 GW. Expansion plans are in place increase capacity
by 17 GW by 2018 and a further 22 GW by 2030. Of the
new build, coal will account for the bulk of it (46%), nuclear
13%, and renewables 21%, including 1.5 GW of solar
capacity due to come on line by 2018. Obviously, this will
still represent a very small percentage of total generating
capacity.
Exhibit 6
Solar PV Energy as a % of Total Energy Generation
in South Africa
0.8%
790%
719%
0.7%
690%
0.6%
590%
0.5%
490%
387%
0.4%
390%
0.3%
290%
0.2%
0.1%
0.0%
190%
41%
14%
34%
1%
8%
7%
7% 90%
10%
2012 2013e 2014f 2015f 2016f 2017f 2018f 2019f 2020f
1. Ethiopia has an average daily radiation of 5.26 kWh/m²
and a target of 2.5 GW of renewable energy (including
solar) by 2025 was announced under the “Climate
Resilient Green Economy” initiative.
2. Tanzania has recently launched the "Solar PV Scheme" an
initiative to drive small-scale solar installations in 10 rural
districts.
3. In Nigeria, the Minister of Power announced plans to add
1,000 MW of solar power over the next 10 years, targeting
5% energy generation mix from renewables.
Solar as a % of Total electricity generation
(LHS)
Solar Generation, yoy growth % (RHS)
Source: BMI, RMB Morgan Stanley
All in all, therefore, we expect significant growth in solar PV
capacity across Africa, but the absolute numbers are still
small. From a base of just over 1 GW at the end of 2013, we
expect solar PV capacity for the region to increase to 2 GW
by the end of 2015 and to double again to c. 4.4 GW of
capacity by 2020. Lower costs of installation (and hence a
shorter pay-back period) are the key to a faster rate of
adoption.
4. In Mozambique the country has been granted a US$35mn
loan (by the ADB) to provide 400-500kw of power and has
set up several solar plants in rural areas as the primary
source of energy.
11
MORGAN STANLEY RESEARCH
July 28, 2014
Solar Power & Energy Storage
Visualizing Market Attractiveness
From our analysis, we compared the relative attractiveness
of markets, as well as subsidy levels, now and over time.
The following chart highlights our view of:
1. Market attractiveness: The degree to which the
market offers attractive growth opportunities, given
solar economics and magnitude of potential growth.
2. Subsidy level: Amount of subsidy provided by the
federal (and sometimes local) government.
We believe China will remain an attractive market for solar,
driven by continued strong government support and
improving solar economics. The Chinese government has
targeted the growth of three zero-emissions power
generation types (solar, wind and nuclear) to reduce the
country’s emissions intensity.
Europe remains an attractive market given high utility bills in
the region, but there is a potential over the long term that the
growth in solar penetration slows as Europe further
considers subsidy reductions and as solar reaches high
penetration levels (as in Germany).
India and Brazil are increasingly attractive markets for solar,
driven by solar cost declines and a degree of further
government support for solar power. However, in Brazil,
other clean energy technologies (wind and hydroelectric) are
far more economic than solar, and significant future solar
cost reductions, combined with further government support,
will be needed to incent large increases in solar
development.
Japan may become a relatively unattractive market for solar
to the extent that the current review of solar subsidies by the
government results in a significant reduction in the solar
feed-in tariff (FiT).
The United States should become the second-most attractive
solar market, driven by low current penetration levels,
favorable solar economics relative to utility bills, and further
cost declines that we expect will more than offset upcoming
subsidy decreases.
Exhibit 7
Market Landscape
More Subsidized
Japan
Europe
China
US
Unattractive Market
Brazil
Attractive Market
India
Less Subsidized
Source: Morgan Stanley Research
12
MORGAN STANLEY RESEARCH
July 28, 2014
Solar Power & Energy Storage
Summary of Key Takeaways by Region/Country
China
27% of projected
growth
Europe
21% of projected
growth
United States
17% of projected
growth
Japan
10% of projected
growth
India
4% of projected
growth
Brazil
2% of projected
growth
Africa
1% of projected
growth
13 GW per year solar growth through 2020, driven by very large absolute power demand growth, and
the government’s goal of improving air quality through a combination of solar, wind and nuclear.
Power demand growth is significant by any measure, averaging ~8% of total US capacity per year.
Headwinds on other generation will aid growth in solar, nuclear and wind: coal growth constrained by
growing environmental restrictions, hydropower limited by available sites.
Changes in China’s renewables decisions has a strong impact on global solar demand – our 13 GW per
year forecast for solar growth is a fraction of the country’s ~90 GW per year demand growth.
Energy storage not economic as a grid substitute given the low cost of the Chinese power grid.
10 GW per year solar growth through 2020, driven by strong solar economics relative to high
European utility rates. There is, however, a risk of a “solar slowdown” in Europe.
By 2020, we project solar will be economic in Europe without subsidies.
The slowdown of solar installations in Germany given the high current penetration level, even with strong
solar economics, is a trend that could lead to lower overall solar growth in Europe.
Energy storage coupled with solar power could be commercially viable in Germany, Italy, Portugal and
Spain, but many uncertainties exist and implementation of this approach has several challenges.
8 GW per year solar growth through 2020, driven by highly supportive net metering rules in 43 states,
strong solar conditions in many states, and further solar cost reductions.
By 2020, solar will be economic in some US states even without a subsidy.
The long-term addressable distributed solar market in the US is larger than appreciated, at 280 GW, even
assuming net metering rules are changed to be less favorable to solar and the federal subsidy is reduced.
Energy storage coupled with solar power is in our view likely to be commercially viable in sun-rich, rate
high states in the Western US. This dynamic could in the long run damage utilities in these states.
5 GW per year solar growth through 2020, driven by improving solar economics and a supportive Feed
in Tariff (FiT).
There is a risk of a slowdown in solar growth in Japan as a result of the Japanese government’s pending
review of the solar FiT.
The path to grid parity for solar in Japan is a long one, given more gradual solar cost reductions in the
future.
Energy storage not economic as a grid substitute given the low cost of the Japanese power grid.
2 GW per year solar growth through 2020, driven by, in the near-term, government initiatives to
procure solar power, and in the longer-term by economics for solar power that is approaching parity
with other generation sources.
Solar power is in our view approaching cost parity with other generation sources, without subsidies.
Headwinds facing new coal, hydropower and wind plant development all aid the growth of solar.
The biggest challenge facing solar development in the long-term is likely in our view to be land availability.
Energy storage not economic as a grid substitute given the low cost of the Indian power grid.
Slightly less than 1 GW per year solar growth through 2020, driven by strong solar conditions, but
other renewable energy types have historically shown more favorable economics.
Competitive renewable procurement auctions in Brazil have shown other renewable types, especially hydro
and wind, as being more economic than solar.
Net metering rules, recently established, should help the growth of distributed solar power.
Storage does not seem viable in Brazil. All energy exported to the grid is taxable and, given that the pricing
on energy export cannot be made on an hourly basis, this reduces the potential benefit of storage (e.g.
storage would help to export in the higher price times, but this is not possible under the current regulation).
0.5 GW per year solar growth through 2020 with most capacity installations focused in Saudi Arabia
and South Africa.
Despite strong solar conditions, cheap fossil fuel supply (coal in Southern Africa and oil in West Africa) still
dominates planned capacity expansion in electricity generation.
13
MORGAN STANLEY RESEARCH
July 28, 2014
Solar Power & Energy Storage
Implications for Polysilicon
What is polysilicon? Polysilicon is a hyper-pure form of
silicon, the earth’s second most abundant element. Due to its
semiconductor-like material properties, polysilicon is used as
feedstock material in manufacturing silicon based solar PV.
Exhibit 8
260k mtpa. Including all players, potential production capacity
of polysilicon likely sits closer to ~400k mtpa, we think.
Exhibit 9
Major Gglobal Polysilicon shares (2013) – All
Capacities
Polysilicon Manufacturing Process
Hemlock
9%
Other
producers
20%
Wacker
12%
Other China
15%
GCL
16%
Tokuyama
2%
LDK
4%
Osaka REC MEMC
Titanium 5%
4%
1%
Source: Green Rhino Energy, Morgan Stanley Research
Who are the major producers? According to our analysis,
the world’s largest 4 producers of polysilicon based on 2013
data are (1) GCL, with a share of ~16%; (2) Wacker Chemie,
with a share of ~12%; (3) OCI, with a share of ~10%; and (4)
Hemlock, with a share of ~9%. Indeed, the top 4 players
account for around half of global polysilicon supply. However,
beyond the four “majors”, the polysilicon market is very
fragmented, with Chinese players, emergent and existing,
having carved out substantial shares within the industry.
However, the extent to which some of the older, high cost and
smaller PS facilities are operational or closed down remains a
point of contention, and views vary greatly as to the amount of
effective capacity that is available to the solar market. This is
because weak PS prices over recent years led to high cost
producers in China having to curb production and close down
facilities. China is a highly opaque market when it comes to
PS capacity, and to add to the complexity, it is quite clear that
product quality varies greatly between the different producers
(i.e. ultra-pure product is a “must” for market leaders like
Wacker, Hemlock and OCI, whereas lower purity levels are a
common problem for smaller Chinese producers). The quality
of product from China’s GCL, the world’s largest producer, is
the subject of much debate).
Wacker Chemie believes that total production capacities for
solar-grade/electronics-grade polysilicon sat at 212k mtpa in
2013, whereas we would suggest this figure was actually
closer to ~280k mtpa (i.e. excluding Chinese capacity from
smaller players). REC Silicon suggests 2013 PS capacity of
OCI
10%
Daqo
2%
Source: Company Data, Morgan Stanley Research Estimates.
Exhibit 10
Major Global PS shares (2013) of Those Likely
Operating
Other
Osaka 12%
1%
MEMC
5%
Wacker
18%
TBEA
Daqo
1%
2%
Tokuyama
3%
REC
7%
Hemlock
13%
GCL
23%
OCI
15%
Source: Company Data, Morgan Stanley Research Estimates
Polysilicon content in solar modules. It is widely accepted
that today’s solar modules contain approximately 5.5-6.0g/Wp
of polysilicon, which is expected to creep down towards 4.55.0g/Wp medium-term (i.e. by 2017e according to Wacker
Chemie). With module costs ranging from 50-60c/Wp and the
implied silicon cost of ~11c/Wp, this suggests polysilicon is
around 20% of the module cost. Wacker suggests total solar
installations amounted to ~40 GW in 2013, equating to
polysilicon demand of ~220-230k mt, equivalent to ~5.6g/Wp
of polysilicon at the mid-point.
14
MORGAN STANLEY RESEARCH
July 28, 2014
Solar Power & Energy Storage
Exhibit 11
Solar Panel Spot Prices Have Been Declining
(USD/W)
GCL expects 44.6 GW of solar installations in 2014.
Although Chinese solar installations suffered in 1H14 due to
the postponement of large solar farm installations to the end
of of May, GCL believes total installations will reach ~44-45
GW in 2014, of which China will continue to be the largest
contributor.
Exhibit 13
GCL’s View on Q’ly Incremental Solar Installations
(’14)
Source: REC, Morgan Stanley Research
Wacker estimates GW installations to grow way above
Morgan Stanley’s forecast. Wacker believes that annual
global installations will fall within ~43-52 GW in 2014, rising to
~49-65 GW in 2015, before growing to ~80 GW in 2017.
Based on silicon consumption of <5g/Wp (i.e. 4.5g/Wp), this
should see polysilicon demand growing to ~360k mtpa by
2017, implying a CAGR over the next 4 years of >12%. In
total, over the period 2014-17e alone, Wacker expects
incremental solar installations totaling ~290-300 GW, a level
we expect to be achieved only by 2020e.
Source: GCL, Morgan Stanley Research
Exhibit 14
GCL’s View on Annual Solar Installations Out to ‘16
Exhibit 12
Wacker’s View on Incremental Solar Installations
Source: GCL, Morgan Stanley Research
Source: Wacker Chemie, Morgan Stanley Research
REC Silicon suggests 45 GW of solar in 2014. Similar to
GCL, REC Silicon suggests 45 GW of solar installations are
likely in 2014, which is closer to the bottom end of Wacker’s
expectations. Importantly, what we can see is that the majority
of polysilicon majors believe incremental solar installations will
increase at a very rapid rate, driven by views of demand in the
US (where Morgan Stanley’s view is bullish and in line with
industry estimates) and China and Japan (where industry
estimates far exceed Morgan Stanley estimates). However,
REC is a touch more conservative on China this year,
suggesting just 10 GW of incremental solar (in line with
Morgan Stanley projections), reflecting a lower forecast for
distributed grid (rooftop) PV of 4 GW (from 8 GW previously).
15
MORGAN STANLEY RESEARCH
July 28, 2014
Solar Power & Energy Storage
Exhibit 15
REC Silicon’s View on GW Installations
Source: REC Silicon, Morgan Stanley Research
Exhibit 16
REC’s View on Solar Installations Longer-Term
Annual Module Installations (GW)
What do our forecasts for solar installations mean for
polysilicon supply/demand? Our forecasts are, in
aggregate, considerably more cautious than the views of the
polysilicon manufacturers. There has always been, and
continues to be, an understandable degree of optimism
regarding the success of solar within the raw material
suppliers.
We are most bearish in our view of solar growth, relative to
industry views, for China (some industry views as large as
>30 GW growth per year by 2020, versus our 13 GW per year
for 2014-20) and Japan (some industry views as large as >20
GW per year by 2020, versus our 5 GW per year for 2014-20).
Put simply, our base case solar installation forecasts see
installation growth of an average 5% pa, far lower than
the polysilicon manufacturers whose estimates range
between 11% and 19%. In that context, our forecasts
could mean significant downside risk for the industry.
Exhibit 18
Polysilicon Producers are Much more aggressive
on Solar Installations vs MSe and IEA
100
90
Morgan Stanley
IEA
Wacker
REC
GCL
Tokuyama
80
Source: REC, Morgan Stanley Research
70
60
Tokuyama sees incremental PV installations at 85-90 GW
by 2018. From a 2014 base of ~45 GW of solar installations,
Tokuyama expects a CAGR in new installations of >18%, to
~88 GW of new installations in 2018. In China, it flags an
upwards revision to 35 GW of new solar capacity by 2015.
Exhibit 17
Tokuyama Sees ~90 GW of Annual Installations by
2018
Source: Tokuyama, Morgan Stanley Research
50
40
30
20
10
0
2013
2014e
2015e
2016e
2017e
2018e
Source: Company Data, Morgan Stanley Research Estimates
2019e
2020e
A disappointing outcome for polysilicon demand. A future
where solar installations growth disappointed in key markets
such as China and Japan would leave polysilicon markets in a
complicated situation. We’d see limited growth for the raw
material, which would lead to material reductions in polysilicon
utilisation rates and put further pressure on pricing.
Supply is the other consideration. We estimate the “big 4”
alone had polysilicon capacity totaling ~195k mtpa in 2013,
which is set to rise to ~266k mtpa by 2016e, an increase of
~70k mtpa (equivalent to ~13 GW of additional annual solar
installations). Other players still operating, i.e. excluding those
Chinese players that likely shut their plants in 2012/13, are
also expanding PS capacity by ~37k mtpa (equivalent to ~6.5
GW of solar installations). In aggregate, to ensure future PS
capacity additions are utilized by the solar market, annual
16
MORGAN STANLEY RESEARCH
July 28, 2014
Solar Power & Energy Storage
installations will have to rise by ~20 GW per annum from the
2013 rate of 40 GW (i.e. to ~60 GW per annum), a demand
growth level that appears highly challenging based on our
analysis, which shows installations still below this level in
2020.
Exhibit 19
Exhibit 21
Polysilicon S/D Model Based on Morgan Stanley’s
Installations Assumptions
140%
120%
100%
Future Polysilicon Supply Additions
600,000
80%
Big four (Wacker, Hemlock, OCI, GCL)
Other capacities likely still operating
60%
Capacities definitely/likely shuttered
500,000
Wacker's Demand Estimates
Morgan Stanley's Demand Estimates
40%
400,000
20%
300,000
0%
2004 2005 2006 2007 2008 2009 2010 2011 2012 2013 2014e 2015e 2016e 2017e
200,000
Total
Incumbents + OCI + GCL
All >3kt
All >3kt
Source: Company Data, Morgan Stanley Research Estimates
100,000
0
2011
2012
2013
2014e
2015e
2016e
Source: Company Data, Morgan Stanley Research Estimates
Exhibit 20
Polysilicon S/D Model Based on WCH “High” &
“Low” Case GW Installations
140%
120%
Implications for polysilicon prices under a range of
scenarios. In terms of the likely impact on polysilicon pricing,
we illustrate 3 scenarios below. First, we take the Morgan
Stanley view of average annual solar installations globally for
the period 2014-2017. Second, we take the likely 2014
installation of ~45 GW (@5.5g/W). Lastly, we take an average
2014-2017 view on GW installations from the polysilicon
producers (i.e. ~60 GW of installations @ 5g/W).
100%
80%
60%
40%
20%
0%
2004 2005 2006 2007 2008 2009 2010 2011 2012 2013 2014e 2015e 2016e 2017e
Total
Incumbents + OCI + GCL - HIGH DEMAND
All >3kt - HIGH DEMAND
All - HIGH DEMAND
Incumbents + OCI + GCL - LOW DEMAND
All >3kt - LOW DEMAND
All - LOW DEMAND
Building a polysilicon cost curve is notoriously difficult.
Producers are persistently cutting costs, few are transparent
about their production costs and opacity surrounding Asian
players adds to the uncertainties. We have built an indicative
cost curve using data that is available, but warn that the
margin of error could be meaningful, with considerable
change likely over the next few years as efforts to reduce
cash costs continue. We also include an indicative cost curve
from an industry producer of polysilicon for comparative
purposes.
Source: Company Data, Morgan Stanley Research Estimates
17
MORGAN STANLEY RESEARCH
July 28, 2014
Solar Power & Energy Storage
Exhibit 22
Scenario 2. The expectation of 45 GW of solar installations in
2014 (at the current level ~5.5g/W) would translate into PS
demand of ~245k mt, which would imply a spot price of
~$22/kg, which is largely where current pricing sits.
Indicative Polysilicon Cost Curve ($/kg = Y axis &
‘000 of PS Capacity = X axis)
Scenario 3. Should we see the average of polysilicon industry
expectations for 2014-20167 solar installations of 60 GW,
polysilicon demand would be ~300k mt, under which scenario
prices could lift to ~$25/kg (assuming no further structural shift
down in the PS cost curve).
Exhibit 24
Solar Grade Polysilicon Spot Prices ($/kg)
Source: Company Data, Morgan Stanley Research
Exhibit 23
Tokuyama’s View on the PS Cost Curve
Source: Bloomberg, Morgan Stanley Research
Potential implication of lower polysilicon prices on
Wacker forecasts
We note that the implied marginal cost for the current likely
demand level in 2014, ~$22/kg, is consistent with the level at
which prices are currently trading (and which we assume
roughly flat through 2018 in our current Wacker forecasts).
Our model suggests that prices could fall to a sustainable
level of $18/kg based on our more conservative demand
forecasts. Were we to run this assumption in our Wacker
model we would reduce our Wacker EBITDA forecasts by
18-20% for 2015-2018. Given the high level of the group’s
D&A, this would cut EPS by 40-50% for 2016-2018, and by
potentially as much as 70% for 2015.
Source: Tokuyama, Morgan Stanley Research
Scenario 1. We take MS Utilities expectations of average
annual solar installations of 45 GW/annum 2014-2017 (this
compares with an average forecast from the polysilicon
manufacturers over the same time period of ~60GW). At an
average 5g/W, this would drive PS demand of ~225k mt,
which given the current shape of the cost curve could see PS
prices falling back down towards ~$18/kg.
Exhibit 25
Morgan Stanley Forecast Annual GW Installations by Region, 2013-2020e
2013
2014e
2015e
2016e
2017e
2018e
2019e
2020e
Total 14-20
Avg 14-20
China
12.9
10.5
11.3
12.4
13.5
14.1
14.4
15.0
91.2
13.0
Japan
6.8
10.0
10.0
8.3
1.3
1.3
1.3
1.3
33.5
4.8
US
4.8
5.5
7.2
10.3
6.4
7.6
9.2
11.0
57.2
8.2
W Europe
10.3
9.8
9.8
9.8
9.8
9.8
9.8
9.8
68.4
9.8
India
1.0
1.2
1.4
1.6
1.9
2.2
2.6
3.0
13.8
2.0
Brazil
0.2
0.3
0.4
0.5
0.6
0.8
1.1
1.5
5.1
0.7
SUBTOTAL
36.0
37.2
40.0
42.8
33.5
35.8
38.3
41.5
269.2
38.5
Australia
1.0
1.0
1.0
1.0
1.0
1.0
1.0
1.0
7.0
1.0
Canada
0.4
0.5
0.5
0.6
0.6
0.7
0.8
0.9
4.6
0.7
Israel
0.2
0.3
0.4
0.5
0.6
0.8
1.1
1.5
5.1
0.7
Korea
0.4
0.5
0.7
0.9
1.3
1.7
2.2
2.9
10.3
1.5
Thailand Ukraine
0.3
0.3
0.4
0.3
0.5
0.4
0.7
0.4
0.9
0.5
1.2
0.5
1.7
0.6
2.2
0.7
7.7
3.5
1.1
0.5
Taiwan
0.2
0.3
0.4
0.5
0.6
0.8
1.1
1.5
5.1
0.7
ROW
1.2
1.5
1.8
2.1
2.6
3.1
3.8
4.6
19.4
2.8
GLOBAL TOTAL
40.0
41.9
45.6
49.6
41.6
45.8
50.6
56.8
331.9
47.4
Source: Company data, Morgan Stanley Research estimates
18
MORGAN STANLEY RESEARCH
July 28, 2014
Solar Power & Energy Storage
MORGAN STANLEY BLUE PAPER
Solar Power & Energy Storage
Growth Potential by Region
China
Europe
United States
Japan
India
Brazil
19
MORGAN STANLEY RESEARCH
July 28, 2014
Solar Power & Energy Storage
China
MORGAN STANLEY BLUE PAPER
projected 13 GW per year of solar growth is a fraction of
total power plant capacity growth in China, and a change
in government goals would have a greater impact on our
global solar forecast than any other single factor.
Simon Lee
Sheng Zhong
Solar Growth to Exceed All Other
Countries/Regions
Key conclusions:
1.
4.
Headwinds facing other generation types are an
opportunity for solar to exceed our growth
expectations. Coal, the dominant source of power
generation in China, accounted for 69% of cumulative
capacity in 2013. However, because of severe pollution
issues in China, new installation of coal power slowed
from the peak 92 GW in 2006 to only 43 GW in 2013.
Environmental protection cost increases in all industries
may seriously challenge further coal power development
in China. We expect hydropower, which constitutes 22%
of the current installed base, to face growth headwinds
due to insufficient water resources in most regions in
China. For this reason, we expect most of hydropower
resources to be fully developed by 2020. Renewable
power is currently China’s third-largest source of power,
accounting for 6% of the installed base. Renewable
power grew rapidly in the past two years as a result of
significant cost decreases and government efforts to
encourage development of clean energy. We expect the
market share of renewable power to continue to expand.
5.
Energy storage is likely not economic in China, given
relatively low grid costs. China’s power grid has been
developed at a lower cost than in the US and Europe,
and the system is younger, resulting in lower
maintenance costs. As a result, we think there would not
be sufficient savings to customers from installing solar
power and energy storage at their home/business and
disconnecting from the grid.
6.
Given that our projected 2014-20 solar demand in
China is significantly (~50%) below solar industry
estimates, this demand level is bearish for
polysilicon solar panel manufacturers, because that
returns may be impacted by overcapacity relative to
global demand. Silicon-based panel manufacturers
(GCL Poly, Trina Solar, Yingli Green Energy, Xinyi Solar,
and Jinko Solar) could see margin pressure if demand in
China, while still growing at a rapid rate under Morgan
Stanley estimates, fails to achieve projected industry
growth rates.
China comprises 27% of our global 2014-2020
forecast (91 GW of growth, or 13 GW per year), driven
by very large absolute power demand growth,
headwinds facing other generation types, and the
government’s goal of improving air quality.
Exhibit 26
We Expect Solar Power to Reach 70 GW by 2017
and 110 GW by 2020
GW
160
140
CAGR = +24%
120
110
100
80
70
60
40
30
40
20
0
2014e
2015e
2017e
2020e
Source: Morgan Stanley Research
2.
3.
China is the fastest-growing solar market in the world
today. Solar PV installation in China, which effectively
started up in 2010, has accelerated since 2012. In 2013
China surpassed Germany to become the fastestgrowing PV market worldwide, with a record 12.8 GW
new PV capacity installed. Note that the high level of
installations in 2013 was primarily due to a rush ahead of
impending changes in solar subsidy policies.
Incremental renewable decisions in China have a
greater impact than any other country/region. China’s
power demand growth has been very large by any
measure. On average over the past 5 years, China has
added ~90 GW of new power plants per annum, equal to
~8% of total power plant capacity in the US. Our
20
MORGAN STANLEY RESEARCH
July 28, 2014
Solar Power & Energy Storage
Market Growth Review
Exhibit 27
China’s Installed Power Capacity (GW)
GW
1,400
1,200
1,000
800
600
400
200
2000
2001
2002
2003
2004
2005
Thermal
2006
Hydro
2007
2008
Nuclear
2009
2010
2011
2012
2013
2014e
Renewables
Note: Renewables includes Wind, Solar.
Source: NEA, Morgan Stanley Research e = Morgan Stanley Research estimates
Exhibit 28
Exhibit 29
Solar Power Capacity Has Been Rising as a Portion
of Total Renewables Development in China
China Became the Fastest Growing Solar Market in
2013
MW
GW
383
40,000
5,362
30
MEA
30,000
20
9,833
7
3
1
9
16
2008
2009
45
30
61
75
93
Americas
APAC
20,000
10,975
Europe
China
10,000
12,891
2010
2011
Wind
Source: NEA, Morgan Stanley Research
2012
2013
2014e
Solar
e = Morgan Stanley Research estimates
0
2009
2010
2011
2012
2013
Source: Company Data, Morgan Stanley Research,,MEA: Middle East and Africa,
APAC: Asia Pacific
Chinese power plant capacity will total ~1,350 GW in 2014,
we estimate, the largest installed base in the world. In 2014,
according to the latest statement from the Chinese National
Energy Administration (NEA), the target of solar PV new
installation in China is 10 GW, at a minimum, which is likely
still the highest capacity addition volume globally. Solar farms
are still the dominant format of PV in China, due to abundant
ground resources, available financing, and easier power tariff
collection from grid operators.
21
MORGAN STANLEY RESEARCH
July 28, 2014
Solar Power & Energy Storage
Regulatory Dynamics and Market Outlook
Solar demand is still primarily a policy-driven source of power
globally, due to the higher cost of solar relative to other
sources, such as coal, gas, and hydro. In China, both the
central and provincial governments have adopted supportive
policies and provided subsidies to encourage faster growth of
solar PV.
Solar development in the 12th five-year plan: We poject
solar PV capacity additions are likely to be >10GW per year in
both 2014 and 2015. In the latest adjustments to the 12th fiveyear plan, the government of China has targeted solar PV
new installation of 35 GW by year-end 2015; this is upwardly
revised from the original target of 21 GW. According to media
reports, the real upper target could be 40 GW.
encourage consumption of PV-generated power. The
announced solar PV FiT is a rate of Rmb0.9-1.0/kWh for
ground-mounted projects. In addition, for distributed solar, the
China’s central government provides a subsidy of
Rmb0.42/kWh to total power generated from distributed solar
PV projects. As a result, the distributed solar developer would
receive total revenue equivalent to the end user power tariff
(Rmb1/kWh) saved plus Rmb0.42/kWh subsidy (for a total of
Rmb1.42/kWh) if the electricity is self-consumed; and a total
of Rmb0.35/kWh on-grid power tariff plus Rmb0.42/kWh (for a
total of Rmb0.77/kWh) when the electricity is sold to the grid.
Exhibit 31
Solar PV Benchmark FiT During 12th Five-year Plan
Rmb/kWh
Exhibit 30
Government Target of Solar PV New Installations in
12th Five-Year Plan
1.15
MW
5,000
12,891
2011
1.1
2012
Solar PV FiT
10,000
0.1
0.1
0.9
0.9
2014e
2015e
1.1
2013
Solar PV FiT regional difference
Source: NDRC, NEA, Morgan Stanley Research
6,109
2,500
3,500
2011
2012
2013
2014e
2015e
New Installation and Estimate based on PV 12th 5-year plan
Upside Potential based on high-scenario plan target
Source: Company Data, Morgan Stanley Research
“Golden Sun Program” drove the first wave of PV
development: In July 2009, the government of China
released the “Golden Sun” demonstration project program,
providing up-front subsidies for qualified demonstrative PV
projects through mid-2011. This program provided a subsidy
equal to 50% of total costs for on-grid systems and 70% of
total costs for off-grid systems that were above 300 kW. With
that subsidy, solar capacity grew by ~3 GW in 3 years. The
government now plans to install more than 500 MW of solar
power pilot projects in the next 2-3 years.
Solar PV feed-in tariff and generation subsidy released to
encourage more power generation from PV: In July 2009,
after the Golden Sun program ended, and again in August
2013, the NDRC published new policies to subsidize PV
development from the power generation perspective to
Local government additional subsidies to support local
PV development: In addition to central government
subsidies, provincial and municipal governments provide
subsidies to encourage local solar PV development — mainly
additional power generation subsidy and one-off setup
supportive funds, as well as some tax returns on purchasing
PV products from local enterprises.
More policies to encourage PV distributed generation
could be expected, mainly from the administrative and tax
perspectives. In April 2014, the NEA stated that no electric
business certificate is needed for electric generation
installations below 6 MW from solar, wind, biomass, ocean,
and geothermic energies. And in June 2014, China’s State
Administration of Taxation stated that, in an effort to simplify
the administrative operations of PV, the state grid will issue
the invoice for electricity it buys from distributed solar PV
projects. In addition, at the end of June, NEA sent a draft
version of its “Further Implementation of Distributed Solar
Photovoltaic Generations-Related Policies” to municipal
governments, solar PV investment and construction
companies, and grid companies as well as financial
22
MORGAN STANLEY RESEARCH
July 28, 2014
Solar Power & Energy Storage
institutions, to collect the opinions from every party. Many key
issues around distributed generation (DG) development were
addressed, including the difficulties on solar PV project
financing, rooftop resources, unstable profit return on DGs,
etc.
We believe new installation in 2013 was a near-term
record high: After the “Golden Sun Program” (details below)
expired in 2012, the solar PV installation type changed
significantly. DG as a percentage of total new installation
declined. In 2013, one year after Golden Sun Program, DG
only accounted for 6% of total installations, compared with
35% before 2012. This is mainly because of the relatively
unfavorable incentives on DG comparing with “Golden Sun
Program”.
improve through lower costs while suitable land remains
limited for utility-scale development. We estimate total
installation by 2017 will be back to 2013’s peak level.
Exhibit 32
Solar Farm and Distributed Generation Installation
Comparison During and After “Golden Sun
Program”
100%
90%
80%
70%
4,188
60%
12,088
50%
40%
30%
New installation may fall in 2014-2016 due to a slowdown
in utility-scale development and current DG policies that
do not attract necessary investments: We expect levels of
solar PV installation to be lower than the peak in 2013, due
primarily to a slowdown in utility-scale solar development.
Western China is ideal for solar installation, but limited local
power demand means solar power needs long transmission
lines to remit electricity to load centers. We note transmission
lines will only be commissioned in 2016-17, thus near-term
growth in utility-scale solar will be limited.
On the other hand, the Chinese government has indicated
that it will support substantial growth in distributed solar
development. Present challenges in DG include: 1)
estimated financial returns on DG are lower than on utilityscale solar farms; 2) difficulty in securing sufficient bank
borrowing to fund projects; and 3) lack of good quality rooftop
resources to install DG. We estimate the decline in utilityscale development will exceed growth in DG, and thus overall
installation in 2014/15 to be lower than 2013. This estimate
could be wrong if further favoriable policies on DG are
announced by the government.
20%
2,300
10%
803
0%
Before 2012
Distributed Generation
2013
Solar Farm
Source: Company Data, Morgan Stanley Research
Exhibit 33
We expect Distributed Generation Installations Will
Ramp up Gradually, while Utility Scale Decelerates
GW
16
14
12
10
8
6
4
2
0
2013
2014e 2015e 2016e 2017e 2018e 2019e 2020e
Distribution Generation
Solar Farm
Source: Company Data, Morgan Stanley Research
New installation in 2017 back to 2013 level: For the period
2017-2020, we expect DG will continue to grow while utilityscale solar farm growth decelerates, as economics on DG
23
MORGAN STANLEY RESEARCH
July 28, 2014
Solar Power & Energy Storage
Exhibit 34
China’s Central Government Rolled Out Solar PV FiT to Encourage PV Installation and Development
FiT (CNY/kWh)
Province
0.90
Ningxia
Region 1
Qinghai
Gansu: Jiayuguan, Wuwei, Zhangye, Jiuquan, Dunhuang, Jinchang
Xinjiang: Kumui, Tacheng, Altay, Karamay
Inner Mongolia: excluding Chifeng, Tongliao, Hinggan League, Hulunbeier
Region 2
0.95
Beijing, Tianjin, Heilongjiang, Jilin, Liaoning, Sichuan, Yunnan
Inner Mongolia: Chifeng, Tongliao, Hinggan League, Hulunbeier
Hebei: Chengde, Zhangiakou, Tangshan, Qinhuang Island
Shanxi: Datong, Shuozhou, Xinzhou
Shaanxi: Yulin, Yan'an
All other regions of Qinghai, Gansu and Xinjiang not included in Region 1
Region 3
1.00
All other regions not included in Regions 1 and 2
Source: NDRC, NEA, Morgan Stanley Research
Exhibit 35
Solar PV Subsidies from Central and Municipal Government (Rmb/kWh)
Province
Zhejiang
City
Wenzhou
Hangzhou
Tongxiang
Jiaxing
Anhui
Jiangsu
Hefei
National
Subsidy
Provincial
Subsidy
Municipal
Subsidy
Total
Subsidy
0.42
0.1
0.1 - 0.2
0.62 - 0.72
0.42
0.1
0.3
0.82
0.42
0.1
0.1
0.62
0.42
0.1
0.2 - 0.3
0.72 - 0.82
Comments
Solar farm subsidy
DG subsidy
One-off subsidy - Rmb1.5/Wp
Total subsidy at Rmb2.8 / 2.75 / 2.7 per kWh for 2013-15
0.42
0.25
0.67
0.42
Shandong
0.42
Jiangxi
0.42
Shanghai
0.42
One-off subsidy - Rmb2/Wp
FiT at Rmb1.2 / 1.15 for 2014-15 for non-central government subsidized projects
0.78
1.2
One-off subsidy - Rmb4/Wp and Rmb3/Wp for Phases I and II projects respectively
0.3 - 0.4
Rmb0.3/kWh for solar farm; Rmb0.4/kWh for DG
Source: Government Official Website, Morgan Stanley Research
Exhibit 36
PV Module Price Down Sharply
US$/W
1.4
1.2
1.0
0.8
0.6
Jul-14
May-14
Jan-14
Mar-14
Nov-13
Jul-13
Sep-13
May-13
Jan-13
Mar-13
Nov-12
Jul-12
Sep-12
May-12
Jan-12
Mar-12
Nov-11
Jul-11
0.4
Sep-11
Capital costs have been declining. Capital costs for solar
power projects in China have been declining consistently and
rapidly, mainly thanks to the rapid decrease in PV module
prices. As a result, solar power has come closer to achieving
grid parity, from an end-user perspective. In the past 3 years,
solar PV module prices declined by 53% to US$0.58/Watt in
June 2014; this drove down the cost of capital investment in
solar PV projects by 50% in the same period. Currently, the
capital cost of solar PV projects is Rmb8/W, with the solar
module comprising ~50% of total costs. Some experts expect
capital cost for solar PV will be down to Rmb6/W within 1-2
years. We agree that solar PV capital costs will keep trending
down in the future, with steady module price declines.
However, we project the panel and other component (inverter,
installation) cost declines will be less rapid than in the past.
Source: Solarzoom, Wind, Morgan Stanley Research
24
MORGAN STANLEY RESEARCH
July 28, 2014
Solar Power & Energy Storage
Exhibit 37
Solar PV Capital Cost Has Come Down Quickly In
Corresponding to Module Price Decline
rmb/W
30
25
As coal costs increase, solar PV power costs keep
decreasing, thanks to module and other component cost
declines and module power generation efficiency
improvements (currently, 0.5-0.8% efficiency improvement
every year). However, solar will likely remain the most
expensive source of clean energy and government subsidies
and policies will therefore remain the key drivers of growth.
20
Exhibit 38
15
Solar PV Levelized Cost of Energy Has Been
Coming Down Quickly
10
5
0
2009
2010
2011
2012
2013
2014
Source: Morgan Stanley Research
Levelized cost of solar power has been declining: The
reduction in capital costs has led to a decline in the price of
electricity generated from solar power projects. Assuming the
solar project leverage at 80%, interest rate at 7%, with the
capital cost down from Rmb25/W in 2009 to Rmb8/W today,
the 25-year life solar levelized cost comes down from
Rmb1.88/kWh in 2009 to Rmb0.6/kWh today.
In accordance with the decline in solar PV generation cost,
the FiT has also been reduced. However, with current solar
PV FiT and subsidies. we estimate some solar projects enjoy
strong profitability. Thus, we believe that solar farms will
attract strong investment interest, but scale of development
will be subject to government approvals.
2.0
1.8
1.5
1.3
1.0
0.8
0.5
0.3
0.0
2009
2011
2012
2013
2014
Exhibit 39
Levelized Cost of Energy Comparison – 2014,
(Rmb/kWh)
LCOE comp
0.76
0.60
0.48
0.23
Solar Power cost is coming closer to grid parity: Currently,
the coal power tariff is at a low level (Rmb 0.47-0.48/kWh)
due to the low cost of coal. However, while coal cost is likely
to remain low in 2014-15, we expect the environmental
protection cost to trend up due to higher requirements
emissions. In June 2014, the government of China released
requirements for further improvements in desulfurization,
denitration, and dust removal at coal power plants, which
increase coal power cost by Rmb0.03/kWh.
2010
Source: Company Data, Morgan Stanley Research
Nuclear
0.27
0.28
Coal
Hydro
Onshore
Wind
0.52
Gas
Solar
Offshore
wind
Source: Morgan Stanley Research
25
MORGAN STANLEY RESEARCH
July 28, 2014
Solar Power & Energy Storage
Europe
Exhibit 41
Bobby Chada
German Feed-In Tariffs Have Declined as Solar
Capital Costs Have Declined
Dominik P Olszewski
c€/kWh
Solar & Storage Growth Potential Strong,
but Recent Data Points to a Slowdown
70
Key conclusions:
50
1.
40
Europe comprises 21% of our global 2014-2020
forecast (68.4 GW of growth, or 10 GW per year),
driven by strong solar economics relative to high
European utility rates.
60
30
20
10
0
Exhibit 40
Jan Jan Jan Jan Jan Jan Jan Jan Jan Jan Jan July
2004 2005 2006 2007 2008 2009 2010 2011 2012 2013 2014 2014
Projected Solar Growth in Europe, 2014-20
GW Solar Growth (2014-20)
Source: BNetZa, Morgan Stanley Research
60
50
4.
The slowdown of solar installations in Germany,
given already high solar penetration levels, is a trend
worth watching and one that could cause our solar
growth estimates to be somewhat overstated. In
2013, the rate of growth slowed materially, and the first
five months of 2014 have been even worse. For larger
installations, the changes in legislation (coming this
summer) could explain some of the slowdown, although
in the past this has normally caused a rush to install
before the new legislation takes effect. But for smaller,
residential, installations the changes in legislation are not
nearly as severe. IRRs remain healthy for residential
installations, so it is unclear what is driving a slowdown. It
is possible that the German market is approaching a
saturation level, but we would like to see further data
points given the favourable economics for further solar
installations.
5.
Energy storage, coupled with solar power, could be a
commercially viable solution in Europe if battery and
associated system costs decline significantly. Given
our base case assumption is that installed solar and
storage costs will decline materially, we believe that this
can be a commercially viable solution in some European
countries, although the IRR may be quite low in some
cases. The most viable countries for energy storage are
in our view Germany, Italy, Portugal and Spain.
40
30
20
10
0
France
Germany
Italy
Portugal
Spain
UK
Total
Source: Company Data, Morgan Stanley Research
2. Looking forward to 2020, with lower solar PV capital
costs, we calculate that solar should be competitive
even without subsidies. Rooftop solar is therefore likely
to remain a very important technology in Europe. The
economics are partly driven by high retail power costs.
This means that solar could run unsubsidised if
necessary as a pure solar generation unit for a retail
customer.
3. Including subsidies (generally feed-in tariffs, or FiTs),
solar is generally commercial in almost all countries
in Europe, although we would argue that many of
these subsidies are now becoming overly generous,
as capital costs have decreased, and thus at risk. It
would seem to us economically sensible for overall
member state economies and for energy affordability in
general, if solar subsidies are reduced markedly or even
eliminated.
26
MORGAN STANLEY RESEARCH
July 28, 2014
Solar Power & Energy Storage
Europe Solar Power Market Size
We estimate that Europe will install an average of c.10GW per
year up to 2020. We forecast c.8GW coming from the six
markets we have analysed most closely, and c.2GW from the
Rest of Europe. It is also worth noting that we forecast annual
growth above the implied run rate for Europe in 2014 (based
on YTD additions).
Our analysis of the European market has focussed primarily
on developments in six countries (France, Germany, Italy,
Portugal, Spain, and the UK). We expect these to be the most
significant contributors to European installations. They
accounted for 63% of European 2013 capacity installed
(6.6GW from a total of 10.4GW).
But in the Rest of Europe, countries such as Greece and
Romania both installed over 1GW in 2013. Regulatory
changes have reduced installations dramatically in these
countries. But we do see additions continuing in other
countries. Thus we expect c.2GW of capacity to be
contributed from the Rest of Europe (outside of the six largest
contributors).
Exhibit 42
Scenarios for Installed Capacity (GW) by 2020
France
Germany
Spain
UK
RoE
Bull
29.8
75.4
36.9
Italy Portugal
3.2
18.3
35.3
50.7
Base
Bear
11.6
5.4
51.8
51.8
27.8
23.0
1.0
1.0
8.4
8.4
20.0
9.9
33.2
26.2
RoE – Rest of Europe
Bull Case: Blue Sky scenario based on theoretical rooftop potential.
Base Case: Based on currently installed capacity plus recent installation rate. (For Germany,
Portugal, Spain and the UK we use the government targets).
Bear Case: National targets (For the UK we use current capacity plus run rate)
Source: Morgan Stanley Research
There are two ways to assess the potential solar market:
1. a physical assessment of suitable rooftop areas and
2. a market assessment based on current capacity.
1. Rooftop Assessment
Studies of roof cadastres such as that by Sun-Area estimate
that approximately 20% of Germany’s rooftops are suitable for
solar energy use. We forecast that a physical assessment of
European rooftops would imply residential capacity and
production levels as displayed in Exhibit 43. We assume that
residential installations are reduced to a smaller size (3kW)
when the level of installations reaches government targets,
because subsidies are likely to be reduced or removed when
targets are reached. Without subsidies, the value of power
that is not self consumed is very low. Thus, we reduce the
installation to a scale that is optimized for self-consumption.
This leads to a ‘blue sky’ scenario in which PVs become
increasingly commoditised and are installed nationally on
rooftops. This is the driver of our bull case.
2. Market Assessment
Our market assessment, which makes up our base case, is
based upon a combination of observable run rates, specific
country conditions, coupled with country capacity targets.
For example, in Germany it is clear that solar is a mainstream
technology and we see no reason why the government target
of 52GW will not be reached given solar IRRs at ~6%.
However, we do note a marked slowdown in 2014.
France and Italy show significant skew towards large-scale
installations with lower take-up among households. Given
their advantageous climate and lower relative take-up,
households in France and Italy may be expected to increase
their solar capacity in the near future as costs fall. For
France, our base case assumes a pick-up in the current run
rate to 11.6 GW by 2020. For Italy, our base case assumes
the continuation of the current run rate.
In the UK, by contrast, small-scale installations under 4 kW
account for 68% of total capacity. The UK Department of
Energy and Climate Change has focused on encouraging
installations among the residential and commercial segments.
They estimate that the UK has 250,000 hectares of southfacing commercial roof space and hope to exploit it. Our UK
base case assumes that the government targets are met.
Exhibit 43
Installed Capacity vs. National Targets
France
Germany
Italy
Portugal
Spain
UK
Cumulative
Capacity
(End of 2013)
(GW)
National 2020
PV Target
(GW)
Capacity Installed
During 2013
(GW)
4.63
35.50
17.60
0.28
5.57
2.90
14.00*
51.75
23.00**
1.00
8.37
20.00
0.61
3.30
1.46
0.06
0.15
1.00
*France is close to its (old) formal target of 5.4GW. Grid operator RTE plans for 14GW of
solar capacity by 2020
**Italy’s target is for 2017
Source:EPIA, Morgan Stanley Research
27
MORGAN STANLEY RESEARCH
July 28, 2014
Solar Power & Energy Storage
Exhibit 44
Exhibit 45
Annual Solar Capacity Additions
Installed Solar Capacity (as at Year-End 2013)
MW
GW
35.50
10,000
8,000
17.60
Germany
2009
France
2010
2011
UK
2012
Spain
2013
0.28
60
0
Italy
5.57
4.63
152
1,000
2,000
613
1,461
4,000
3,304
6,000
Portugal
France
Germany
Italy
Portugal
Spain
2.90
UK
Source: IEA-PVPS, Morgan Stanley Research
Source: EurObserv’ER, IEA-PVPS, Morgan Stanley Research
28
MORGAN STANLEY RESEARCH
July 28, 2014
Solar Power & Energy Storage
Regulatory Dynamics and Solar
Economics
We expect downward pressure on solar subsidies due to (1)
the ongoing decline in solar capital costs, (2) the fact that
solar installations have been ahead of targets in many
countries, and (3) the developing realisation that subsidies are
often not needed to support residential solar deployment.
There are many “free rider” issues with solar PV across
Europe. This would also apply to a combined solar panel and
battery system. The free rider issue arises as a result of the
inequality in the treatment of grid fees – charging utility
customers on a fully variable basis, that is, on a per-unit of
power consumed, solar customers can avoid paying the utility
for fixed grid costs when solar customers eliminate/reduce
their net power demand from the grid; as in the 43 US states
with net metering rules, and in Brazil, this approach raises the
retail price for standard (i.e. non-solar) customers. The same
free rider concept applies to renewable subsidies. A per-unit
of power consumed billing approach implies that the greater
the renewable penetration, the higher the retail price for
standard customers who must pay for the subsidy. Given that
solar is moving from an emerging technology to one that is
increasingly competitive, we believe it is likely that some of
these charging systems are likely to be altered over time.
Germany has passed legislation to increase costs for selfconsumption by SMEs. There are also discussions to mimic
this in Austria. Exhibit 46 shows the makeup of the German
retail tariff. Clearly any changes to the structure of grid fees,
the EEG subsidy, or taxes would have a material impact on
the commercial viability of solar power. Across Europe, there
are various taxes included within the electricity bill. In
Germany, the electricity tax is a material element of the bill.
Exhibit 46
In the UK, we expect the very generous FiT system to come
under review as well, given the increasing focus on solar
costs and the subsidy burden attached to solar power.
Recently, the UK government changed its proposed subsidies
for large scale (>5 MW) solar. However, the UK remains very
supportive of small and medium-scale installations.
In Spain, new solar installations have been disincentivized
given the focus on affordability. No subsidies are available,
and a tariff for backup (peaje de respaldo) was imposed on
self consumption. This prevents the increase in self
consumption from increase the deficit in the system (as in the
past years, consumers tariffs in Spain have not been enough
to cover the system's costs, generating the so-called annual
tariff deficit).
In Portugal, the government is currently working on changing
the authorization process for solar PV (Jornal de Negocios,
June 24). Up to now, the government imposed caps on new
capacity for small producers that limited the potential of the
market. The government is considering giving more flexibility
for self-consumption, which could improve the market outlook.
However, the potential for new capacity will depend on the
framework approved by the government. As the Portuguese
electricity system also runs a deficit, we do not believe new
capacity will be strongly incetivized.
In Italy, the solar FiT has been stopped for new capacity.
Under existing tax legislation, solar panels are considered to
be equivalent to energy efficiency spending. This implies that
a consumer may subtract part of the investment from its
taxable income over 10 years in equal installments. For
investments made in 2014, 50% of the initial investments can
be subtracted up to a maximum total investment of €96,000.
For investments carried out in 2015, 40% of the initial
investments can be subtracted, up to a maximum total
investment of €98,000.
German Electricity – Retail Tariff Breakdown
100%
80%
Grid Utilization
60%
Tax Portion
40%
Environmental Subsidy
20%
Generation
0%
Source: Fraunhofer Institute, Morgan Stanley Research
Including subsidies (generally feed-in tariffs, or FiTs),
solar is generally commercial in almost all countries in
Europe, although we would argue that many of these
subsidies are now becoming overly generous, as capital
costs have decreased, and thus at risk. It would seem to us
economically sensible for overall member state economies
and for energy affordability in general, if solar subsidies are
reduced markedly or even eliminated.
We believe it is important to analyse the situation on an
unsubsidised basis because a number of countries are
already seeing solar capacity increase to levels close to, or
above, the 2020 targets. Thus, there is a risk that the
29
MORGAN STANLEY RESEARCH
July 28, 2014
Solar Power & Energy Storage
subsidies are changed, and that the treatment of grid charges
will change, meaning that solar would compete only against a
smaller part of the retail bill. So, should we expect domestic
customers to pursue solar PV on an unsubsidised basis, if it is
now commercial? This depends on (1) how they finance the
upfront installation costs, (2) their attitude to economic
returns, and (3) their personal preferences. There is some
evidence that adding solar could be viewed as a longer-term
investment in a low interest rate environment. However, there
is little evidence of unsubsidised solar appetite as yet, since
most PV installations still get some form of support (via FiTs,
tax allowances etc.).
For example, we calculate that, for household installations
(typically around 4-5 kW), it would make sense for Germany
to cancel its PV FiT. Continuing the subsidy for a technology
that is now economic is irrational and costly to the nation. The
industry should be cognisant of this, and should work to
minimise system costs.
Exhibit 47
German Solar LCOE – Assuming 4% PV Cost
Reduction Per Annum
€/kWh
0.35 €
0.30 €
0.25 €
0.20 €
0.15 €
0.10 €
0.05 €
0.00 €
2014
2015
2016
LCOE
2017
Retail Tariff
2018
2019
2020
Wholesale Price
Source: Morgan Stanley Research
Exhibit 48
Country-by-Country Regulatory Overview
Comment
Target PV Capacity
France
Feed-in Tariff in place for systems up to 100kW. Greater transparency on tendering schemes
for larger installations. France doubled its target for 2013 installations but did not meet it
Latest NREAP targeted 5.4GW by
2020. Given France is close to
reaching its target already, pressure is
being applied to raise this target to 1520GW
Germany
There is relatively high visibility on FIT support into the future. The new EEG reform comes into
force from 1 August 2014. Annual growth of up to 2.5GW of new solar capacity is targeted. The
existing "breathing cap" for excess capacity will be tightened so FIT support will reduce more
sharply should the target be exceeded. There are restrictions on utility-scale installations in
order to limit market growth.
Current feed-in tariff system capped at
52GW
Italy
No subsidy but domestic users can benefit from tax allowances as PV installation constitutes
energy efficiency investment. For investments made in 2014, 50% of the investment (40% in
2015) is deductible in 10 equal annual installments.
Target of 23GW by 2017.
Portugal
Clear FIT evolution for small-scale producers (<8kW). The Financial Crisis limited market
growth.
Limit on new installations in 2014 of
11.45MW (microproduction - up to
3.85kW) and 30.35MW
(miniproduction - above 3.85kW)
Spain
There is currently a moratorium on solar panel installations. Support for solar installations was
frozen at the beginning of 2012. The Spanish electricity tariff deficit is a blockade on future
developments.
Given the moratorium on solar
support, there is no target.
UK
Government solar support is in flux as the UK seeks to support Residential, Industrial and
Commercial installations. This comes at the expense of support via RO for large-scale
installations (over 5MW). However, without FIT support, most projects would not be
economically viable.
Total target of 20GW by 2020. The
specific target for large-scale solar
(>5MW) is 2.4-4.0GW
Source: Morgan Stanley Research
30
MORGAN STANLEY RESEARCH
July 28, 2014
Solar Power & Energy Storage
Energy Storage Economics
Exhibit 49
Where Does Solar, and Solar + Storage, Give a Positive Financial Return Today?
France
Germany
Italy
Portugal
Spain
Solar (with subsidy)
UK
n/a
Solar (no subsidy)
×
Solar + Storage (with subsidy)
×
×
×
×
n/a
×
Solar + Storage (no subsidy)
×
×
×
×
×
×
Spain
UK
n/a – Spain does not offer subsidies for new capacity. There is currently a moratorium on additional solar installations
Note that Italy does not offer FiTs, only offering tax deductions for solar installations (which we consider economically similar to a subsidy).
Source: Morgan Stanley Research
Exhibit 50
Where Will Solar, and Solar + Storage, Give a Positive Financial Return in 2020?
France
Germany
Italy
Portugal
Solar (with subsidy)
n/a
Solar (no subsidy)
Solar + Storage (with subsidy)
Solar + Storage (no subsidy)
n/a
×
×
n/a – Spain does not offer subsidies for new capacity. There is currently a moratorium on additional solar installations
Note that Italy does not offer FiTs, only offering tax deductions for solar installations (which we consider economically similar to a subsidy).
Source: Morgan Stanley Research
Is solar PV plus battery storage commercially viable?
Battery storage has been the “holy grail” of the power
generation sector for many years. It is now obvious that this
is potentially on the cusp of becoming a commercially viable
technology, assuming that various factors can drive storage
system costs lower.
In Germany there have been around 5,000 systems installed,
subsidised not only with a FiT but with a discrete battery
subsidy in addition – albeit this is limited in scale. As Exhibit
51 shows, we currently calculate that storage is uneconomic
(i.e., the IRR is slightly negative).
Exhibits 49 and 50 shows a variety of scenarios for the
commercial viability of solar PV including and excluding
battery storage. This shows that, for solar PV, it is widely
commercial. The markets where it is most “in the money”
versus retail tariffs are Germany, Italy and the UK.
So what return are households/investors seeking? In our
view the answer is probably quite a low IRR given prevailing
interest rates. It may be that any IRR above zero is
acceptable. It could also be that some financing solutions
become available in order to reduce the upfront capital costs.
At present, fitting a typical solar/battery home system (5kW
solar panels with a 12.5kWh battery) costs around €25,000 –
a material outlay for many families. However, our base case
assumes that by 2020 this declines (based on a 5kW panel
and 12.5kWh battery) to just €12,500, which is much more
manageable.
Exhibit 51
We Project Positive IRRs for Solar + Storage in
European Households by 2020 (Without Any
Government Subsidy)
France
Germany
Italy
Portugal
Spain
UK
Bear
nm
nm
nm
nm
nm
nm
Base
nm
2.09%
0.83%
2.11%
2.78%
nm
Bull
nm
4.12%
3.17%
4.71%
5.44%
nm
NM = not meaningful
Source: Morgan Stanley Research
But can solar and battery storage be a commercially viable
solution in Europe? The answer very much depends on how
much the battery and associated system costs decline. Given
our base case assumption is that installed solar and storage
costs will decline materially, we believe that this can be a
commercially viable solution in some European countries,
although the IRR may be quite low in some cases. Exhibit 51
shows some conclusions on the commercial viability of solar
PV and battery storage systems across Europe. In our base
case, which incidentally assumes a ~40% reduction in storage
costs, battery storage would be economic in Germany, Italy,
Portugal and Spain, even without a subsidy.
31
MORGAN STANLEY RESEARCH
July 28, 2014
Solar Power & Energy Storage
Recent German Solar Slowdown
MORGAN STANLEY BLUE PAPER
The rate of solar additions in Germany is falling. In 2013 the rate
of growth slowed materially, and the first five months of 2014
have been even worse. For larger installations, the changes in
legislation (coming this summer) could explain some of the
slowdown, although in the past this has normally caused a rush
to install before the new legislation takes effect. However, for
smaller, residential, installations the changes in legislation are not
nearly as severe. IRRs remain healthy for residential installations,
so what can explain the slowdown? Is this just a blip, or is it a
sign of market saturation?
aim of having renewables account for 40-45% of energy by
2025; total production from solar in 2013 was 29.66TWh.
The new laws reaffirm the previous installation ‘corridor’ of
2.5GW – installations above this target cause sharper falls in
government subsidies.
The new legislation comes into effect on 1 August 2014, so
one might expect a surge in installations before that date.
Exhibit 54 demonstrates that over the past few years, the
expectation of a decline in the FiT rate has caused a spike in
installations. But surprisingly, no such spike seems evident
yet.
Exhibit 52
Recent German Trends – just 818MW in January-May
2014
Recent solar additions have disappointed. As Exhibits 52
and 53 show, Q1 2014 saw only 460MW of additions (vs.
773MW in Q1 2013 and 1,968MW in Q1 2012). Total
Germany solar capacity stood at 36.86GW in April, so we are
70% of the way to the long-term national cap. Capacity
additions have been surprisingly low, and the rate of
slowdown in installations is clear both for Q1 and for the last
year or so.
New regulations to take effect later in 2014 – But these
do not explain the German residential slowdown
In July 2014, the German coalition passed bill that amends
the Renewable Energy Sources Act (EEG). Under the terms
of the new law, the self-consumption levy is introduced, but
does not apply to household installations below 10kW. We
expect these to slow the pace of renewable additions, as has
been evident in 2014 to date.
The bill introduces a 40% levy on self-consumption from new
renewable plants over 10kW. This will impact the economics
of many larger solar PV installations (the current EEG
surcharge stands at €62.4/MWh). The levy is aimed at
slowing down installations within the SME market, which took
up solar with gusto between 2009 and 2013. The regulations
also seek to limit utility-scale solar installations (1MW and
above).
The revised EEG legislation does not explain the slowdown
in residential installations, as the self consumption changes
do not impact these smaller sites. The levy itself is no reason
for any slowdown in the residential market (<10kW). The
legislation is set to come into effect in August with the overall
Quarterly Solar Additions over the Past Four Years
(GW)
Q1
2010
717
3,136
Q2
1,681
Q3
1,844
Q4
2011
513
1,200
1,644
4,128
2012
1,968
2,404
1,853
1,377
2013
773
1,020
895
611
2014
460
Source: BNetZa, Morgan Stanley Research
Exhibit 53
The First Quarter Has Seen Disappointing Capacity
Additions
Additions (MW)
Jan
Feb
Mar
Apr
May
2014
193.4
110.4
155.8
158.0
200.0
Average 2010-13
319.4
175.8
497.6
344.6
385.5
2014 vs Average 2010-13
-39%
-37%
-69%
-54%
-48%
Source: BNetZa, Morgan Stanley Research
Exhibit 54
Year-on-Year Comparison Shows Persistent
Slowdown in Installations
Capacity Additions (MW)
YoY % Change
March 2013
289
-76%
April 2013
367
2%
May 2013
344
35%
June 2013
309
-83%
July 2013
312
-42%
August 2013
292
-11%
September 2013
291
-70%
October 2013
226
-63%
November 2013
219
-50%
December 2013
166
-50%
January 2014
193
-29%
February 2014
110
-48%
March 2014
156
-46%
Source: BNetZa, Morgan Stanley Research
32
MORGAN STANLEY RESEARCH
July 28, 2014
Solar Power & Energy Storage
Exhibit 55
M Feed-In
O R G A NTariffs
STAN
L E Y B(RHS)
L U E Continue
P A P E R to Decline
(€c/kW)
as Monthly Additions Slow (MW) (LHS)
3,500
45
3,000
40
35
2,500
30
2,000
25
1,500
20
15
1,000
10
500
5
0
Jan 10
Do economics explain the Residential slowdown? We
think this is not the case
As the cost of installed PVs fell sharply; the German feed-in
tariff (FiT) was repeatedly cut and eventually placed on a
‘degression’ schedule – see Exhibits 55 and 56. In our view,
solar is clearly commercially attractive versus high German
retail tariffs (partly inflated due to the high subsidies that are
collected from retail consumers). Yet even after the cuts to the
FiT, lower PV costs mean that a German household installing
solar panels in June 2014 is rewarded with an IRR of 6.4%
(post-tax, unlevered). This is still an attractive return and
higher than many alternatives in a low interest rate
environment.
0
Jan 11
Jan 12
Jan 13
Jan 14
If it’s not explained by subsidy changes or by economics,
is it due to market saturation, or is it just a blip?
Its still very early days, and it is possible that the slowdown in
the first five months of 2014 is just a temporary blip. But if this
is not the case we cannot explain the slowdown by the EEG
changes – as residential installations are not really impacted
by these – or by the economics of solar – as IRRs remain
healthy. So what else could explain this? One option is that
the market is reaching a point of saturation. Physically, we
would argue that there is still scope for a huge amount of
further residential solar installations in Germany – as some
20% of rooftops are suitable for solar – and thus our base
case is that the market will restart, and that we will see more
rooftop solar than Q1 2014 suggests.
Source: BNetZa, Morgan Stanley Research
Exhibit 56
As the Cost of Installed PVs Continues to Fall
(€/W)
4.50
4.00
3.50
3.00
2.50
2.00
1.55
1.50
1.00
Q1
2009
Q4
2009
Q3
2010
Q2
2011
Q1
2012
Q4
2012
Q3
2013
Price Index based on an installation size of 1-100kW
Source: Morgan Stanley Research
Exhibit 57
But IRRs Are More Attractive Today – So Why the
Residential Slowdown?
6.46%
5.22%
5.25%
2010
2011
2012
6.84%
2013
6.39%
But counter-intuitively, our experience has seen that whilst
households are aware of FiTs, they don’t tend to calculate
their own projected IRRs, focussing rather on payback
periods and affordability. One possible explanation then is
that the fall in residential demand is more likely to be a result
of market saturation among consumers interested in installing
solar PV. In other words, perhaps the majority of those
households that were interested in having solar PV, had the
financial wherewithal to afford it, and have a suitable rooftop
location have already installed solar panels. This is a difficult
thesis to prove, but unless the rate of residential solar
installations picks up, it may be that it is correct. It is also
possible that households have witnessed the decline in cash
FiTs and subsequently decided against solar purchases. It is
conceivable that only (1) sharply falling PV costs; or (2)
above-average electricity tariffs increases – which the
German government is keen to avoid – would stimulate
residential purchases again.
June 2014
Historical IRRs (2010-13) assume actual, observed electricity tariff increases over the period
Source: Morgan Stanley Research
33
MORGAN STANLEY RESEARCH
July 28, 2014
Solar Power & Energy Storage
Implications for Power Markets and Stocks
MORGAN STANLEY BLUE PAPER
Solar additions (with or without storage) are likely to continue
at a high rate, further depressing power markets. However, if
we see a further slowdown of solar in Germany, this would be
a positive surprise for utilities, in our view, primarily benefiting
RWE. There are also significant upcoming power plant
retirements which will improve market fundamentals and
improve utility margins, which partially offsets the growth in
solar power. These retirements, which should help return
oversupplied systems back to balance, are happening at
different speeds across the European power markets. For
example, in Germany and Benelux there will be 31GW of
plant closures in the coming years. Nevertheless, it seems
obvious that, all else equal, the higher the rate of solar
additions, the longer it will take to see European power
markets recover.
Solar and battery storage could become a solution to
meeting peak demand. This would be the solution to the
power generation “Holy Grail”. Renewables are by nature
intermittent, and produce substantially less than their
nameplate capacity. As such, they are problematic for grid
operators and consumers. However, with the right smart grid
technology, smart meters, software, regulation, and
agreements between customers and TSOs, solar and energy
storage could be used to help balance the grid system, not
just as generation units. In other words, they could act as
peak shaving and supply-demand management devices, as
they can provide power that has been stored back onto the
grid. This negative demand is sometimes called “negawatts.”
This could mean that, rather than simply continuing to build
large centralized power capacity to cover for peaks in
consumption and troughs in intermittent production,
transmission system operators (TSOs) gradually would be
able to call on consumers to reduce consumption, through
direct pricing signals, or with the intermediation of
‘aggregators’.
Solar and battery storage could have negative impacts to
utilities, but many technical issues/obstacles would need
to be overcome. For solar power and energy storage to be
truly disruptive to utilities, customers would need to be
capable of, and motivated to, fully disconnect from the grid.
For this to be feasible for the residential market, we think a
number of complex system architecture changes need to fall
into place.
A number of regulatory developments including (1) the
legal framework for contracts, (2) the role and power of
TSOs which can vary country by country, and (3) the
ownership and economics of power that has been
stored and is available to be exported on demand
Increased availability of battery storage, produced on a
big enough scale to justify the efforts on the regulatory
issues above
Standardization of smart meter devices and
applications, partly dependent on smart meter rollout
and other issues.
Integration of software on customer-side devices that
allows TSOs to govern “interruptibility,” i.e., the
switching on or off of household freezers, electric
heating, and air conditioning for short periods of time
according to the needs of the greater grid.
We note that our models in this report are based on the
principle that the solar economics are driven by avoiding the
cost of retail electricity – we focus on the residential side of
the market. Selling power back to the TSO at the wholesale
price (~€35/MWh versus retail price at €300/MWh in Germany
for example) would thus detract materially from the economics
for the consumer. And paying a price as high as the retail
price to extract stored electricity would be very expensive for
the TSO, relative to current balancing power.
Regulation is going to be critical for many reasons, and
the devil will be firmly in the details. In the short term, we
expect material solar additions, a steep decline in storage
costs, and therefore increasing numbers of solar + battery
additions. This will focus the debate on how grid fees, and
other parts of the retail tariff, should be treated. Utilities should
be heavily involved in this debate. But even changing the
treatment of grid fees is unlikely to reduce material additions
of residential solar and battery storage, assuming our forecast
cost reductions are correct.
The industry would be well-advised to stop investing in
unsubsidised thermal generation, in our view. The last
decade has shown that it is very hard to accurately predict the
economics of thermal generation. The relationship between
gas, coal and CO2 costs, the supply-demand balance, the
renewable capacity additions – all have been underestimated
in importance by the European utilities.
Governments, whether by accident or design, have been only
too willing to let thermal generation economics suffer at the
expense of other areas like small-scale renewables. The
reduction in costs of solar, and the potential competitiveness
of solar and battery storage, make the debate even more
complex.
34
MORGAN STANLEY RESEARCH
July 28, 2014
Solar Power & Energy Storage
But one gets what one pays for
There is a good chance
M that
ORG
A N S generation
T A N L E Y cannot
B L U Eexist
PAP
ER
thermal
profitably
without a
capacity market, or controls on solar. If the governments
do not impose these, utilities should not invest. And they
should make this clear, soon. Recent data from the IEA
suggests that Europe will still require 100GW of new thermal
capacity and nuclear capacity over the period 2014-35,
costing some €390bn. It seems unlikely to us that this will be
forthcoming.
The logical conclusion should be a well-functioning capacity
market, alongside an energy market and a large renewable
fleet that operates basically as must run. The economics of
storage, even at our low cost estimates, still mean it is very
expensive to be self sufficient, or to rely on negawatts for
system security. So in our view, thermal is still critical, but it
cannot, and should not, be viewed as a free resource.
More aggressive carbon reduction goals could further
encourage solar development. Europe is comfortably on
course to meet its 2020 target of reducing greenhouse gas
(GHG) emissions by 20% (compared to 1990 levels). By 2012
the EU had achieved 19.2% reductions in emissions, almost
eight years ahead of schedule.
Projections from Member States indicate that total EU
emissions will further decrease between 2012 and 2020. EU
emissions are expected to reach a 2020 level which is 21%
below 1990 levels (incl. international aviation). Implementing
the additional measures in Member States is expected to
achieve a reduction of 24% below 1990 levels in 2020. Given
the ease with which the EU is set to reach its 2020 goal, the
EU has placed growing importance and focus on the
negotiations for the 2030 targets. The EU's 2030 framework is
for a 40% reduction on 1990 levels. EU leaders agreed at the
European Council meeting on 21 March 2014 to take a final
decision on the framework in October 2014 at the latest.
Assuming existing national measures continue up to 2030,
there would only be an average reduction in emissions of
0.2% per year between 2020 and 2030 (i.e. in 2030 we would
only see a 22% reduction on 1990 levels, compared to the
target of 40%). Even with the implementation of additional
measures (in planning stages) the EEA estimates that GHG
emissions would decrease to 28%. This is still a significant
shortfall on the 2030 target. It is clear that there is still a lot of
work to do in order to reach the 2030 goal. At this point,
greater clarity on the 2030 framework would be extremely
welcome.
And a potential key surprise The logical extension of this
could be a much bigger focus on cash flow at the generation
businesses of the EU Utilities. The cash flow from the large
integrated gencos is much more attractive than the
accounting earnings. Thus, we theorise that one or more
integrated operators could decide to take action and
externalise its depressed generation business to highlight the
value case. This could take the following form:
1.
Companies could start to show generation cash
flows separately to highlight the value case. In our
view, most generation portfolios are undervalued if one
assumes the businesses are put in run-off mode. And
with no support and low power prices, we do not see any
other mode that would make sense.
2.
Eventually, one EU integrated utility hypothetically
could take this a step further and split its generation
unit, and possibly associated decommissioning liabilities,
into a separate business. This would make further
closures politically easier to implement, in our view, as
some of the assets would now be visibly loss making.
Further impairments could follow suit, rebasing D&A to a
more realistic level and enhancing earnings. Other
developments could include an announcement that staff
incentives would be changed materially, and the
company would likely focus almost solely on reducing
cash costs, minimising maintenance costs, and beating
forecast decommissioning costs. This would highlight that
(1) the internally generated CFs would be sufficient to
deal with the decommissioning liabilities, and (2) that
after stripping out the generation business and the non
cash interest charge on the provision, the rump earnings
power would be much higher than expected. This would
crystallise material value and could attract interest from
financial buyers in a minority stake. We note that we are
speaking theoretically, and have no knowledge of any
such action under consideration..
Another potential scenario is that, in an effort to hurry
change, as policy on capacity markets is slow to change, two
large utilities take matters into their own hands, combine their
EU generation fleets and announce (1) material further
impairment charges, which would serve to boost accounting
earnings of the generation business, and (2) a raft of closures
of thermal capacity and some early nuclear closures in
Germany. The staff incentives would also change materially,
and a number of minority financial investors could conceivably
be attracted to take stakes. As a result, the associated stocks
could be expected to re-rate, as the value of the nongeneration assets would gain more visibility.
35
MORGAN STANLEY RESEARCH
July 28, 2014
Solar Power & Energy Storage
United States
MORGAN STANLEY BLUE PAPER
all or most of their power bill in 43 states by using
distributed generation, including the part associated with
utilities’ investments in providing a reliable grid; this net
metering approach will in our view likely change over
time. In our base case, with 10% ITC and customers
paying 50% of a typical customer’s fixed grid charge, we
see ~265 GW US solar market potential.
Stephen Byrd
Timothy Radcliff
Very Strong Growth Outlook, Even as
Subsidies Likely to Fall Later in the Decade
Key conclusions:
1.
The United States comprises 17% of our global 20142020 forecast (57 GW of growth, or 8 GW per year),
driven by supportive net metering rules in 43 states,
strong solar conditions in many states, and further
solar cost reductions. Looking forward to 2020, with
lower solar PV capital costs, we calculate that solar
would be competitive in many US states even without
subsidies.
2.
The long-term addressable solar market in the US is
larger than appreciated. In our base case, with only
10% federal Investment Tax Credit (ITC) and solar
customers paying 50% of a typical fixed grid charge, we
see a US commercial and residential solar market of
~265 GW. Our bull case, a 30% ITC and 0% fixed grid
charge, implies ~435 GW; our bear case, no ITC and
75% fixed grid charge, less than 30 GW.
3.
The addressable household market for solar panels
is quite dependent on two key factors: net metering
rules and the 30% solar Investment Tax Credit (ITC).
Currently, distributed generation customers can eliminate
4.
Projected decrease in costs of batteries and
distributed generation could significantly disrupt the
relationship between utilities and their customers in
states with high utility rates and favorable sun
conditions. Over time, many US customers could
partially or completely eliminate their usage of the power
grid. We see the greatest potential for such disruption in
the West, Southwest, and mid-Atlantic. However, utilities
in some regions could adapt to distributed generation to
minimize the impact on shareholders.
5.
Potentially advantaged based on our analysis: solar
“integrators” that provide financing, design and
construction of solar projects, such as SunEdison
(SUNE), NRG Energy (NRG) and SolarCity (SCTY), and
Tesla (TSLA), given its highly competitive energy storage
product. Potentially disadvantaged: Pinnacle West
(PNW) as a result of solar growth, and to the extent
energy storage costs achieve our projected level, all 3
California utilities (SRE, PCG, and EIX) and Hawaiian
Electric.
Exhibit 58
US Forecast
Annual Installations (MW)
12,000
10,000
8,000
6,000
4,000
2,000
-
2009 2010 2011 2012 2013 2014 2015 2016 2017 2018 2019 2020
Distributed Generation
Utility-Scale
Source: SEIA, Morgan Stanley Research estimates
36
MORGAN STANLEY RESEARCH
July 28, 2014
Solar Power & Energy Storage
Market Size
MORGAN STANLEY BLUE PAPER
Current Installed Solar Capacity
The US market has grown steadily from less than 500MW in
2009 to more than 4.5GW in 2013.
Exhibit 59
US Solar Capacity Has Grown Steadily
Installations (MW)
5,000
4,500
4,000
3,500
3,000
2,500
2,000
1,500
1,000
500
0
states. Although California still leads this segment by a wide
margin, other states such as New Jersey, Arizona and
Massachusetts have all installed considerable DG capacity,
driven by state-level tax advantages and availability of
renewable energy credits that can be sold to industry for
additional income. Although Hawaii is small in absolute
capacity, it is notable in the sense that the large proportions of
customers within certain service territories (for instance 10%
of Hawaiian Electric’s customers) have installed solar systems
given highly favorable economics for solar power in Hawaii..
Exhibit 60
California Dominated Installations in 2013
CA
AZ
NC
MA
2009
2010
Residential
2011
Commercial
2012
2013
Utility-Scale
Source: SEIA, Morgan Stanley Research
The solar market has historically been driven by the utilityscale segment, driven in large part by state-level Renewable
Portfolio Standards (RPS) that incentivize renewable buildout
through above-market power pricing from qualifying
generation technologies. California has been the most active
satisfying its renewable portfolios standard through utilityscale solar buildout, and all three major utilities have reached
20% renewable penetration. Given the success of the RPS
program over the last 5 years and limited need for incremental
renewable (and particularly solar) capacity, we believe that
utility-scale buildout will slow significantly following expiration
of the federal investment tax credit that currently supports
economics of these projects.
The remainder of the market – the distributed generation (or
DG) segment – is comprised of residential and commercial
applications and has been driven by a greater number of
NJ
HI
Residential
GA
Commercial
TX
Utility
NY
CO
0
1,000
2,000
3,000
2013 Installations (MW)
Source: SEIA, Morgan Stanley Research
Solar Penetration in Hawaii
Hawaii now has almost 10% rooftop solar penetration (versus
~2% in California), driven by favorable solar conditions, a high
per-unit utility bill ($.37/kWh residential rate, versus $.16 in
California and $.10-$.12 in many Southern states), and a
significant state subsidy for solar in addition to the federal
solar ITC. Solar rooftop volumes increased ~40% in 2013
relative to 2012.
37
MORGAN STANLEY RESEARCH
July 28, 2014
Solar Power & Energy Storage
Regulatory Dynamics and Solar Economics
MORGAN STANLEY BLUE PAPER
Net metering, which is permitted in 43 US states (the largest
exception to this being Texas), involves utility customers who
self-generate sufficient power to meet their own needs, but
the power generated is not coincident with the hourly profile of
their power demand. For example, a net metered solar
customer would “over-produce” power during the day, sell the
excess power back to the grid, and buy power from the grid at
night. While the net power consumption from the grid, net
metering customers depend on the grid to (1) manage the
volatile output of their self-generated power, (2) provide power
whenever customers need it, and (3) ultimately provide
reliable, round-the-clock power.
The following table shows the high degree of sensitivity that
the solar market opportunity has to net metering rules:
Exhibit 62
Solar Market Potential in the US Is Very Large,
Depending on Grid Charges
Base
Bull
ITC
10%
30%
0%
Fixed Charge (as % of T&D Bill)
50%
0%
75%
Residential Market Size (GW)
% of Total
Commercial Market Size (GW)
167.6
63%
98.7
221.9
51%
37%
49%
Total Solar Market Size (GW)
266.4
435.6
71.1
11.7
43%
213.6
% of Total
Total Storage Market Size (GWh)
Bear
15.8
57%
-
27.6
71.1
Source: Morgan Stanley Research
Exhibit 61
43 States Currently Allow Net Metering
There may be a “tipping point” that causes customers to
seek an off-grid approach – Higher fixed charges to
distributed generation customers are likely to drive more
battery purchases and exits from the grid. The more
customers move to solar, the remaining utility customer bill
will rise, creating even further “headroom” for an off-grid
approach. For every $25/kWh reduction in the cost of lithiumion batteries, we estimate the all-in cost of power to
customers falls by about $.01, or about 15% of the residential
customer price for grid charges.
Solar Economics Reaching Highly Competitive Levels
Source: Morgan Stanley Research
If utilities succeed in altering the regulatory construct such
that solar customers are required to pay all or a large
percentage of the fixed grid fees, the impacts to solar
penetration would be significant. Ultimately, we believe that
state regulators will likely impose some degree of fixed charge
on solar customers, because we believe there will be support
for the logic that solar customers connected to the grid do
derive a significant reliability benefit from their connection to
the grid. Our commercial solar market potential is especially
dependent on the fixed grid charge that commercial
customers using solar power must pay. This is the case
because, in many states, the “power-only” rate (the portion
associated with the cost of large power plants to produce
power) for commercial customers is lower than for residential
customers. Therefore, if the fixed grid charge that a
commercial customer must pay were to be at 100% (not likely
in our view), solar power would need to compete solely
against the relatively low rate charged for power production
from large power plants connected to the grid
In our work covering the solar sector, we have witnessed
significant reductions in the installed cost of solar panels, as
well as improved power output efficiency gains. Much, but not
all, of future installed cost reductions will come from improved
installation economics, driven by the scale and experience of
large solar service providers such as SolarCity (SCTY). We
project that, by 2017, the national average installed cost/Watt
for commercial projects will be ~$2.14/watt, falling to
$1.84/Watt in 2020.
Although the US solar market has historically been dominated
by the utility-scale market, these projects have been profitable
primarily due to above-market power prices associated with
renewable projects to satisfy state-level renewable portfolio
standards. As key states (most particularly California) reach
interim targets, pricing support has declined rapidly, along
with corresponding project returns.
On the other hand, distributed generation projects compete
against relatively high retail pricing to residential and
commercial customers. In distributed markets, cost declines
have rendered profitable substantial portions of the market
with the help of the investment tax credit, and we expect
38
MORGAN STANLEY RESEARCH
July 28, 2014
Solar Power & Energy Storage
further cost declines in the coming years to improve
M economics
O R G A N to
ST
N L where
E Y Bthe
L Ufederal
E PAP
E credit
R
aA
point
tax
is
unnecessary to generate sufficiently attractive returns to
incentivize investment.
Exhibit 63
In California, We Expect Residential Solar to Be
Competitive with the Grid, Even without ITC and
with Fixed Grid Fees
$ / KWh
$0.25
$0.20
$0.15
$0.10
$0.05
$0.00
$3.00
$2.78
$2.57
$2.37
$2.20
$2.03
$1.88
System Price ($ / w)
ITC Scenarios
30%
Fixed Charge as % of T&D
0%
0%
50%
100%
Source: Morgan Stanley Research
Exhibit 64
However, in Midwestern States Such as Illinois, the
LT Outlook for Solar is Much More Challenging
$ / KWh
$0.20
$0.18
$0.16
$0.14
$0.12
$0.10
$0.08
$0.06
$0.04
$0.02
$0.00
$3.00
$2.78
$2.57
$2.37
$2.20
$2.03
$1.88
System Price ($ / w)
ITC Scenarios
Fixed Charge as % of T&D
30%
0%
Source: Morgan Stanley Research
0%
50%
100%
Recent US State Net Metering Regulatory Activity
Two recent state regulatory developments are worth studying
given their relevance to how the debate around net metering
may play out at the state kevel. In California, the legislature
passed Assembly Bill (AB) 327 in October 2013, which
imposes a fixed charge of $10/month (~20% of the typical
monthly bill for fixed grid charges, as opposed to the portion
of the bill for the production of power) on all residential
customers, regardless of net amount of power usage. AB 327
also authorizes the California utility regulator to (1) flatten the
tiered rate structure (high users of power pay more per unit of
power, affording improved economics for solar projects that
reduce the grid power usage of such customers) and (2)
determine the fees that should be charged to net metering
customers.
In Arizona, the issue of net metering was the subject of
intense debate in 2013. A large Arizona utility, Arizona Public
Service (APS; its parent company is PNW), proposed that
distributed generation (primarily solar) customers pay a
monthly fee for grid maintenance costs. As highlighted by the
utility’s spokesperson, “[t]his is about fairness. It’s about
addressing the cost shift that clearly exists. The current net
metering structure creates a cost shift that unfairly burdens
non-solar customers. We should fix that problem now before it
gets worse.” APS proposed charging a fixed monthly fee of
$45-80 for customers using distributed generation. Ultimately
the Arizona utility regulator approved a monthly fee of
~$5/month, far below what was requested by APS. At
$5/month (~10% of a typical Arizona customer’s monthly bill
for fixed grid charges), we do not believe the fixed grid charge
in Arizona will materially slow down the pace of rooftop solar
development.
We view Pinnacle West (PNW) as exposed to margin
reductions from solar demand. Unlike California and
Hawaii, where utilities are fully “decoupled” and are made
whole from lost power demand from solar customers,
Pinnacle West does not have a perfect hedge against lost
demand. We will continue to monitor solar penetration levels
in the state of Arizona to determine impacts to PNW’s
earnings.
39
MORGAN STANLEY RESEARCH
July 28, 2014
Solar Power & Energy Storage
Storage Costs: Dropping to Levels That
Could Be Grid-Competitive
MORGAN STANLEY BLUE PAPER
Historically, power storage costs have been too high to
realistically allow customers to disconnect from the utility
power grid. However, given the prospect of reduction in
battery production costs to $125-$150 per kilowatt-hour of
storage capacity, and perhaps lower (a few years ago, a
typically battery would cost >$500/kWh), we see the potential
for customers to decide to move off-grid. For example, in
California the typical annual residential cost for fixed utility
grid costs was ~$500 in 2012. California rates are projected to
increase materially, likely 4-6% through 2020 in our view.
Given that most of the rate increases in our view relate to
“wires” costs (rather than to the cost of power production from
large power plants), we believe the grid charge in California
could grow faster than 4-6%. If grid charges grew by 5%
annually, by 2020 the typical fixed grid cost for a California
utility customer would be ~$750.
Given Hawaii’s high utility tariff rate and strong solar
conditions, the state may serve as an early test of the viability
of customers using a combination of solar power and energy
storage to go fully off-grid.
Exhibit 65
In Hawaii, Solar Is Very Competitive
$ / KWh
$0.45
$0.40
$0.35
$0.30
$0.25
$0.20
$0.15
$0.10
$0.05
$0.00
$3.00
$2.78
$2.57
$2.37
$2.20
$2.03
$1.88
System Price ($ / w)
ITC Scenarios
Fixed Charge as % of T&D
30%
0%
0%
50%
opposite exposure to the fixed fee that solar customers must
pay. However, we believe in the long term, both products will
experience significant growth. As solar penetration rises, the
“rate headroom” for Tesla’s batteries will increase.
As mentioned, the “tipping point” could come if two dynamics
come into play: increasing rates paid by utility customers, and
the potential that utilities may encounter operational
challenges in interconnecting large amounts of renewables
(see our discussion of Hawaii for further information). For
example, if (a) California utility bills increase 5% per year, (b)
solar penetration reaches 20%, and (c) fixed grid fees paid by
solar customers is 50% of the typical customer’s
transmission/distribution bill, a residential utility customer’s
solar customer’s bill would be $.26/kWh in 2020, whereas a
solar/storage off-grid approach under our assumptions would
result in total costs per kWh below this level.
The scale of Tesla’s battery production, even for its own
use as an auto manufacturer, thrusts the company into
‘key player’ status for grid storage. There are currently
around 15 Lithium Ion battery deployments with >1MW of
capacity in the US with the largest installation being 40MW.
Tesla’s current Model S production (assuming 80 units per
day with an 80kWh average battery capacity – i.e., 80% of
Model S’s delivered with 85 kWh packs, 20% with the 60kWh)
is equivalent to 6.4 MW hours of battery capacity per day. At
that rate, by our calculations Tesla’s Model S production could
produce a combined vehicle population with as many MW of
battery storage for the US grid as exists today (304 MW)
including all chemistries.
Analysis of Tesla’s growing car population offers a
valuable perspective to its position in energy storage. By
2028, we estimate Tesla’s 3.9 million units NA car population
(or “park”) will have an energy storage capacity of 237 GW
(443 GW globally), equal to 22% of today’s US production
capacity and nearly 10x larger than the entirety of US grid
storage that exists today. These figures excludes any
recycled (2nd life) battery after EV use.
100%
Source: Morgan Stanley Research. Analysis does not include financial incentives given to
solar by the State of Hawaii.
The higher the fixed charge required of distributed
generation (primarily solar) customers, the greater the
potential that customers purchase batteries on a large
scale and go completely off the grid. Such an outcome
would be bullish for Tesla, whose batteries we believe will be
the most competitive energy storage solution. Tesla’s
batteries and the solar leasing companies are, for a period of
time, somewhat diversifying products in the sense of their
1 Tesla Model S (85 kWh) can store enough energy to
power the average US household for 3.5 days.
By 2020, we estimate Tesla’s 690k unit US fleet will
contain the stored energy capacity to provide 1 full hour of
electricity to 1.6% of US households.
By 2028, we estimate Tesla’s 3.9m unit US fleet will
contain the stored energy capacity to provide 1 hour of
electricity to 8% of US households.
40
MORGAN STANLEY RESEARCH
July 28, 2014
Solar Power & Energy Storage
Japan
result of solar purchase prices set at high levels, and (3)
limits on the amount of solar power that electric power
companies can accept due to shortages of excess grid
capacity.
Yuka Matayoshi
Solar Power Highly Economic Under
Current Feed-in Tariff Scheme, but
Downside Risk Exists
3.
Key conclusions:
1.
Japan comprises 10% of our global 2014-2020
forecast (33.5 GW of growth, or 4.8 GW per year
based on our base case scenario), driven by a
supportive feed-in tariff (FiT) and improving solar
economics. Most of this growth will be larger-scale, nonresidential solar projects, driven by more favorable
economics for these larger projects.
Exhibit 66
Japan Installed Solar Capacity by 2020 Based on
our Bear/Base/Bull Scenarios
(GW)
75
Exhibit 67
61.6
60
47.8
45
$0.30
14.3
5.6
7.3
F2011
F2012
$0.25
0
F2013
Non-household
Bear
Non-household
Base
F2020e
Bull
Household
e= Morgan Stanley Research (Japan Utility team) estimate.
Source: METI, Morgan Stanley Research
2.
Non-household Solar: Solar Generation Cost,
Purchased Price under the FiT and EPCos’ Retail
Tariff for Commercial/Industrial Customers
$0.35
32.6
30
15
The path to grid parity for solar in Japan likely to be a
long one. It is possible that solar cost declines will be
slower than FiT price declines, resulting in a
slowdown of Japanese demand for solar power.
Further solar panel and installation costs reductions will
in our view bring the cost of power produced from solar
panels cost closer to grid parity. However, assuming that
electric power operators maintain their current rates, the
prospect of solar power reaching grid parity appears to us
to be not something achievable in the near- to mediumterm, given our view that cost declines will begin to slow
in the future. The following chart shows a scenario in
which solar cost declines are slower than the reduction in
the FiT, eventually leading to the potential that solar
installations would be uneconomic.
While renewable additions have been consistently
strong since 2013 (300-700 MW online per month),
there is a risk that the pending review of the FiT by
the Japanese government could result in a
significant reduction to the solar FiT rate, which
would reduce solar economics and volumes, in our
view. In June 2014, the Japanese Ministry of Economy,
Trade and Industry (METI) started to consider a review of
the current FiT scheme, which guarantees high solar
power generating profitability. In the background are
factors including: (1) growing resistance from the
consumer side over increased surcharge burdens, (2)
criticism of high solar power operator profitability as a
$0.20
$0.15
$0.10
2014
2015
2016
2017
2018
LCOE
Fixed selling price under FIT
Retail Tariff (commercial)
Retail Tariff (industrial)
Source: METI, Morgan Stanley Research
4.
Energy storage is unlikely to be economic in Japan
when coupled with solar power, because solar power
economics are challenging on a standalone basis
and grid costs are not sufficiently high to offer
energy storage the potential to allow customers to
save money by moving off-grid. This is in contrast to
portions of the US and Europe, in which solar economics
are more promising and the utility bill is relatively high,
allowing customers the potential to avoid utility fees
through a combined solar/energy storage product.
41
MORGAN STANLEY RESEARCH
July 28, 2014
Solar Power & Energy Storage
Market Size
Japanese Solar Cell/Panel Volumes
Renewable energy capacity has continued to increase rapidly
since the adoption of a renewable energy FiT in July 2012.
There has been a marked increase in new non-residential
solar capacity (10kW or more). Since 2013, added solar
volumes per month has stayed in the 300-700MW range.
Domestic cell module shipments double in F3/14: Japan
domestic cell module shipment volume was 8.5GW in F3/14,
according to JPEA (Japan Photovoltaic Energy Association)
data. Japanese companies top market share rankings on a
total shipment basis, with Sharp at 23%, Kyocera 13%,
Toshiba 9%, Panasonic 9%, and Mitsubishi Electric 7%. On a
production basis, however, the domestic production ratio is
down 18%YoY to 44%, with overseas production and OEM
procurement rising. Total shipments rose 2.2-fold YoY in
F3/14, buoyed by the FiT scheme and run-up in residential
demand ahead of Japan’s consumption tax hike, and yet all
companies expect a pullback in shipments in F3/15. Further,
companies that are unable to offset the reduction in purchase
prices with conversion efficiency gains are likely to be forced
to curtail the size of their operations.
Exhibit 68
Monthly Renewable Capacity Additions by Sources
(MW)
1,000
800
600
400
200
Jul-12
Aug-12
Sep-12
Oct-12
Nov-12
Dec-12
Jan-13
Feb-13
Mar-13
Apr-13
May-13
Jun-13
Jul-13
Aug-13
Sep-13
Oct-13
Nov-13
Dec-13
Jan-14
Feb-14
Mar-14
0
Solar (household)
Solar (non-household)
Wind
Biomass
Note: The data in Dec-2012 are invalid, due to definition change.
Source: METI, Morgan Stanley Research
We expect solar power capacity — mainly nonresidential — to continue to increase
The amount of solar power capacity certified for fixed-price
purchase by end-March 2014 was 65.7GW (2.7/63.0GW
household/non-household). Only 8.7GW has already entered
service; assuming a steady entry into operation of certified
projects, going forward there should be a 57.1GW increase in
capacity (0.5/56.6GW household/non-household), and we
calculate cumulative solar power capacity deployed of
71.3GW (household 7.4GW, non-household 63.9GW).
Sharp (6753.T, covered by Masahiro Ono): Demand
pullback and reduction in FIT purchase prices to squeeze
profitability from F3/15: Sharp has the leading share of
Japan’s market, and in F3/14 had solar cell sales volume of
2.1GW (+59% YoY) and sales of ¥439bn (+69% YoY). While
the business produced a strong 7.4% OPM, Sharp guides for
F3/15 sales volume of 2.0GW (-5% YoY) and sales of ¥290bn
(-34% YoY). While we think Sharp’s guidance is conservative
and expect the business to stay in the black, we do expect to
see an ongoing trend toward low module prices, assuming
continual reductions in FiT purchase prices. Given the
inevitable need to increase OEM procurement in this
business, profitability looks set to remain under pressure.
Exhibit 70
Sharp Sales, Operating Profit and Energy
Production
(Y bn)
Sales (LS)
500
Exhibit 69
Installed and Approved Solar Capacity
OP (LS)
(MW)
Energy production (RS)
2,500
439.0
2,100
400
311.1
(GW)
80
300
60
200
40
100
20
0
223.9
259.9
299.4
305.4
1,700
1,300
900
Before FIT
Solar (household)
500
F3/17e
Incl. not
operated, but
approved
12.2
-300
F3/16e
In-operation
12.0
100
F3/15e
F2013 end
7.8
-4.5
F3/14
Capacity
installed
F2012 end
-22.0
F3/12
F2011 end
-100
F3/13
0
32.4
Source: Company Data, Morgan Stanley Research
After FIT implemented
Solar (non-household)
Note: Projects approved but not in operation may include projects for which operation plans
could be put on hold. Source: METI, Morgan Stanley Research
42
MORGAN STANLEY RESEARCH
July 28, 2014
Solar Power & Energy Storage
Regulatory Dynamics and Solar
Economics
Kyocera (6971.T, covered by Shoji Sato): Shipment
volume to keep rising, but expect F3/14 to have been the
peak for sales and profits as prices fall: Kyocera is No.2 in
Japan after Sharp in terms of solar panel-related sales. The
firm’s solar business sales and profits jumped in F3/13 with
the start of FiT in July 2012, and we attribute the ¥185bn
record solar sales marked in F3/14 to contributions from FiT
for the full 12-month period. However, FiT purchase prices
(excluding the consumption tax) have declined from ¥40 in
F3/13 to ¥36 in F3/14 and ¥32 in F3/15. We expect weaker
prices and tighter price competition triggered by the growing
entrance of overseas competitors into the Japanese market to
send both sales and profits on a downtrend in F3/15. Also in
F3/16 onward too, we foresee ongoing declines in sales and
profits as, assuming a continued slide in FiT purchase prices,
we expect price competition with overseas rivals to stiffen in
the Japanese market.
FiT scheme, which favors solar power, behind the
increase in capacity
The advantages created by the various conditions laid down
in the FiT scheme are behind the remarkably strong increase
in solar power capacity deployed, especially non-household.
Exihibit 72 shows the purchase prices, purchase periods, and
purchase price calculation assumptions established by METI.
Project risk for solar power generation is relatively low due to
the absence of a mandated environmental assessment, but
the project IRR assumption when calculating the purchase
price is a high 6% (before tax, unleveraged), and the fixedprice purchase period is a long 20 years. Partly due to
government efforts aiming to cultivate domestic solar powerrelated industry and accelerate the ramp-up period for
renewable energy, the scheme gives prominent advantages
to large-scale "mega solar" solar power operators
Exhibit 71
Kyocera Sales and Energy Production
Sales (LS)
Energy production (RS)
(Y bn)
250
Purchase prices falling year after year, but
The purchase price and purchase period are revised every
year based on the recommendation of a METI procurement
price setting committee and set by the METI minister. The
committee gathers data on the installed system costs of solar
power operators that have begun operations under the FIT
scheme, and has the purchase prices to be applied to
operators entering the scheme from the following fiscal year
reflect the effect of decreases in actual costs. Exhibit 73
shows purchase prices from F3/13 through F3/15 since the
start of the FIT scheme. Solar power purchases prices have
fallen by an average of 6% per year for residential-use and an
average of 13% per year for non-residential use.
(MW)
2,000
200
1,600
150
1,200
100
800
50
400
F3/17e
F3/16e
F3/15e
F3/14
F3/13
0
F3/12
0
Source: Company Data, Morgan Stanley Research
Exhibit 72
Purchase Prices, Purchase Periods, and Purchase Price Calculation Assumptions by Source
(F3/15 FIT Scheme)
Solar
Wind
Above 10kW Below 10kW Above 20kW Below 20kW
Purchase price (yen/kWh)
Capital cost (yen/kW)
System cost (yen/kW)
Geothermal
Offshore
Above
15MW
Hydro
Above1MW Above200kW
Below 15W Below30MW Below1MW Below200kW
32+tax
37
22+tax
55+tax
36+tax
26+tax
40+tax
24+tax
29+tax
34+tax
--
--
300,000
1,250,000
565,000
790,000
1,230,000
85,000
800,000
1,000,000
275,000
385,000
--
--
--
--
--
--
--
--
Land development cost (yen/kW)
4,000
--
--
--
--
--
--
--
--
--
Connection cost (yen/kW)
13,500
--
--
--
--
--
--
--
--
--
Operating & maintenance cost (yen/kW/yea
8,000
3,600
6,000
--
22,500
33,000
48,000
9,500
69,000
75,000
Intensity
--
30%
--
--
--
--
--
10%
13%
13%
7%
7%
7%
20
15
15
20
20
20
13%
12%
--
IRR (before tax)
6%
3.2%
8%
Purchase period (year)
20
10
20
20
Source: METI, Morgan Stanley Research
43
MORGAN STANLEY RESEARCH
July 28, 2014
Solar Power & Energy Storage
Purchase price calculation method still assumes project
IRR of 3-6%
However, in the three years (F3/13-F3/15) since the adoption
of the renewable energy feed-in tariff scheme (FiT) in July
2012, the policy has remained to set purchases prices with
particular consideration given to operator profits. Project IRR
assumptions (3% for residential solar power and 6% for nonresidential solar power) used for calculating purchase prices
have not changed, and the situation still allows for relatively
high profitability despite low project risk.
Exhibit 73
Purchased Prices by Sources/Start-Years
Purchased price (Yen/kWh)
Duration
F3/13
F3/14
F3/15
F3/13-15
CAGR
Solar (non-household)
42.0
36.0
32.0
-13%
20
Solar (household)
42.0
38.0
37.0
-6%
10
Wind
22.0
22.0
22.0
0%
20
--
--
36.0
--
20
27.3
27.3
27.3
0%
15
Off-shore Wind
Geothermal
(Years)
Equity IRR >10% for some leveraged mega solar projects
IRR in Exhibit 74 is “project IRR”, which calculates the
investment effect of entire projects. Mega solar projects with
output of over 1MW generally use project financing and are
looking for a leverage effect. In cases with about 70%
leverage based on bank loans with fixed interest rates about
3-4ppt lower than project IRR (6%), we calculate equity IRR of
over 15-18%.
Major risk of solar power becoming less economic in
Japan from F3/16
We believe there is risk of non-residential solar power
generation becoming sharply less economic for projects
entering operation from F3/16. That is because a drastic
review of the current FiT scheme is likely to cause purchases
prices to fall faster than system cost.
Exhibit 75
Non-household Solar: Solar Generation Cost,
Purchased Price under the FiT and EPCos’ Retail
Tariff for Commercial/Industrial Customers
Source: METI, Morgan Stanley Research
$0.35
Project IRR of over 10% on some large-scale projects
In March 2014, METI disclosed anticipated pretax IRR
recovered by operators starting operations in OctoberDecember 2013. According to these materials, the majority—
67%—of large-scale solar power projects with output of over
1MW known as "mega solar" had anticipated IRR of over 6%.
Among which, 27% of projects, such as those using idle land,
were in the high anticipated IRR range of 9-12% (Exhibit 74).
$0.30
$0.25
$0.20
$0.15
$0.10
2014
2015
2016
LCOE
Retail Tariff (commercial)
Exhibit 74
Reported Project IRRs (above 1MW)
2017
2018
Fixed selling price under FIT
Retail Tariff (industrial)
Source: METI, Morgan Stanley Research
(% of projects)
25
Percentage of projects with
IRR above 6% = 67%
20
15
Percentage of
projects with IRR
above 9% = 27%
10
Exhibit 76
Household Solar: Solar Generation Cost,
Purchased Price under the FIT and EPCo’s Retail
Tariff For Commercial/Industrial Customers
$0.40
$0.35
5
$0.30
-5%
-4%
-3%
-2%
-1%
0%
1%
2%
3%
4%
5%
6%
7%
8%
9%
10%
11%
12%
13%
14%
>15%
0
(Project IRR)
Source: METI, Morgan Stanley Research
$0.25
$0.20
$0.15
$0.10
2014
2015
LCOE
Fixed selling price under FIT
2016
2017
2018
Retail Tariff
Source: METI, Morgan Stanley Research
44
MORGAN STANLEY RESEARCH
July 28, 2014
Solar Power & Energy Storage
Drastic review of FiT scheme likely
In June 2014, METI started to consider a review of the current
FIT scheme, which guarantees high solar power generating
profitability. In the background are factors including: (1)
growing resistance from the consumer side over increased
surcharge burdens, (2) criticism of high solar power operator
profitability as a result of solar purchase prices set at high
levels, and (3) limits on the amount of solar power that electric
power companies can accept due to shortages of excess grid
capacity.
Surcharge burdens may go beyond what is acceptable
over the next 2-3 years
Consumers shoulder the expenses which electric power
operators are required to procure at through the renewable
energy feed-in tariff scheme in the form of surcharges
proportional to electric power usage as a portion of electricity
charges. Exhibit 77 shows surcharge levels (the amount
shouldered monthly by a standard household). The amount
was ¥120/month in F3/14 (a 1.3% increase on the total
amount paid for electricity monthly) and is ¥225/month in
F3/15 (a 2.7% increase). Once projects become part of the
purchase scheme, the same purchase price is applied for 120 years, and thus the structure is such that the newly
purchased portion in the new fiscal year is added to the
surcharge on top of the portion purchased under the purchase
scheme up until the previous fiscal year. Given the current
pace of expansion in capacity certified under the current
purchase scheme, we calculate an increase in the surcharge
burden for a standard household to ¥500/month (a 6.1%
increase on the total amount paid for electricity monthly) as
soon as F3/18. There is starting to be the risk of going beyond
the range of what is acceptable to consumer groups.
Exhibit 77
Monthly Surcharge for a Standard Household
F12 new additions
F14 new additions
Our estimate
400
F13 new additions
F15 new additions
Y300 +a
Y225
200
Y120
0
F2013
F2014
F2015e
F2016e
Uncertain whether profitability can be guaranteed at
lower purchases prices/lower volume
At this point, it is hard to make projections because it is
unclear where upper limits might be set, how far prices might
be lowered (how far project IRR used for calculating purchase
prices might be brought down). We cannot deny the possibility
of large-scale solar project development plans being toned
down due to the difficulty of securing the kind of profitability
seen until now.
Road to grid parity still long
After a major review to the FIT scheme, procurement cost
reductions and such would lead solar power cost closer to
grid parity (purchase prices from electric power companies),
making it more important to secure profitability mainly from inhouse consumption rather than power sales. However,
assuming that electric power operators maintain their current
rates, reaching grid parity does not look at all easy, as we
expect the procurement cost reduction curve to be gentle.
If the current rate of system cost decline were to
continue, we calculate that residential solar power
cost would approach grid parity, but
(Yen/month)
600
Adoption of controls on total purchase volume being
considered
METI has indicated its intention to complete a review of the
renewable energy feed-in tariff scheme favoring solar power
by around end-2014. The main revisions proposed to date
include: (1) the adoption of controls on total volume setting
upper limits on volume purchased at fixed prices (the
obligation to purchase the portion above the upper limited
would be eliminated, and buying and selling at freelydetermined prices would be permitted), and (2) changes in the
frequency of feed-in tariff reviews (the existing review
frequency is once per year; this could be changed to multiple
times, such as in Germany, where there is a monthly review).
The changes are likely to reduce the incentives for new solar
power projects that guarantee high profitability.
F2017e
Solar power generation system cost have been falling at an
annual rate of 10% since the launch of the FiT scheme in 2H
2012 due to the effect of solar module volume production and
intensified price competition along with the rise of Chinese
makers (Exhibit 78). If costs were to continue to decline at an
annual rate of about 10%, we calculate that solar power
generating cost could reach the level of residential electrical
power rates (grid parity) around F3/19-F3/20). However, the
system price decline curve is declining at a slower rate.
Source: METI, Morgan Stanley Research
45
MORGAN STANLEY RESEARCH
July 28, 2014
Solar Power & Energy Storage
Exhibit 78
Cost of Installed PVs to Fall, but Rate of Decrease
Become Moderate
(Yen/kW)
500
450
400
350
300
250
200
4Q
1Q
2Q
2011
3Q
4Q
1Q
2012
Household
Non-household
(500W-1,000kW)
2Q
3Q
4Q
2013
Non-household
(10kW-50kW)
Non-household
(1,000kW-)
1Q
2014
Non-household
(50kW-500kW)
System costs may decline at a slower rate
We believe the cost decline curve for solar power generating
systems is likely to moderate over time. As volume production
effects surface and next-generation module technology is
developed, we expect a continued degree of cost reduction
effects for PV modules, but there are likely to be limits to how
far costs can fall for braces and other peripheral equipment
and for installation work, which we estimate account for about
40-50% of deployment cost. Indeed, for relatively large-scale
non-residential mega solar projects, there are starting to be
cases where deployment costs increase, due for instance to
higher land development cost.
Exhibit 79
Cost Structure of Mega Solar Projects (2MW class)
Ancillary facilities
(Power
conditioners,
rack, etc)
22%
Land
development,
construction
32%
Source: METI, Morgan Stanley Research
We have calculated F3/21 solar power capacity
based on bull and bear scenarios
Considering the change in profitability of solar power
deployment due to the far-reaching review to the FIT system,
and limits to the amount of solar power capacity that can be
accepted by the electrical power system generated locally, it
is markedly difficult to work out estimates for solar power
capacity deployment up ahead. We have therefore drawn up
three scenarios based on the following assumptions for the
increase in capacity deployed (flow) by F3/21 and the
cumulative capacity deployed (stock) by end-F3/21.
Greatest wildcard non-residential solar power
capacity deployment forecasts
Source: METI, Morgan Stanley Research
Desigh fee,
general expenses
4%
Our Market Size Assessment
Others
1%
PV Module,
41%
The greatest variable in solar power capacity deployment
forecasts is the extent to which non-residential solar power
projects that have already had fixed purchase prices certified
under the current FiT system as of end-March 2014
(corresponding to 56.6 GW on an output basis) actually go
live. In April 2014, METI partially changed calculation
methods for the renewable energy feed-in tariff scheme.
Projects unable to secure land and facilities within six months
of obtaining fixed-price purchase certification are to have their
certifications revoked. Of power plants obtaining certification
in F3/13, those that have settled either location or facilities are
likely to be spared revocation so long as they secure what is
missing by end-August 2014. Our trial calculations produce
different capacity deployment forecasts for bearish and bullish
scenarios depending on the variable of what percentage of
certified but not yet running projects are cancelled.
Base scenario: we come up with 47GW in total solar
capacity by end-F3/21: In calculating new residential solar
power capacity deployment, we assume 4kW per dwelling for
60% of new housing starts (not including collective housing)
to F3/16, when we expect purchase prices under the FiT
system to be set at a relatively high level, and for 40% from
F3/17. In calculating new capacity deployment of nonresidential solar power, we assume that 50% of projects that
had obtained fixed-price purchase certification by end-March
2014 but had not yet entered operation (56.6GW) enter
operation. We thus calculate cumulative capacity deployment
of 47GW (of which household 12GW and non-household
35GW) at end-F3/21.
46
MORGAN STANLEY RESEARCH
July 28, 2014
Solar Power & Energy Storage
Bull scenario: 61 GW in total solar capacity by end-F3/21:
In calculating new residential solar power capacity
deployment, we assume 4kW per dwelling for 70% of new
housing starts (not including collective housing) to F3/16,
when we expect purchase prices under the FiT system to be
set at a relatively high level, and for 60% from F3/17. In
calculating new capacity deployment of non-residential solar
power for this scenario, we assume that 70% of projects that
had obtained fixed-price purchase certification by end-March
2014 but had not yet entered operation (56.6 GW) enter
operation. We thus calculate cumulative capacity deployment
of 61 GW (of which household 14GW and non-household 47
GW) at end-F3/21.
Bear scenario: 32 GW in total solar capacity by end-F3/21:
In calculating new residential solar power capacity
deployment, we assume 4kW per dwelling for 60% of new
housing starts (not including collective housing) to F3/16,
when we expect purchase prices under the FIT system to be
set at a relatively high level, and for 30% from F3/17. In
calculating new capacity deployment of non-residential solar
power for this scenario, we assume that 25% of projects that
had obtained fixed-price purchase certification by end-March
2014 but had not yet entered operation (56.6 GW) enter
operation. We thus calculate cumulative capacity deployment
of 32 GW (of which household 11 GW and non-household 21
GW) at end-F3/21.
47
MORGAN STANLEY RESEARCH
July 28, 2014
Solar Power & Energy Storage
India
and environmental impacts. Hitherto, a large chunk of the
renewable power portfolio has come from wind power
plants, given grid parity of wind power and attractive
government policies. However, with the discontinuation of
accelerated depreciation benefits and lack of good wind
sites, wind additions have slowed down, giving way to
large-scale solar projects over the last 2 years.
Parag Gupta
Satyam Thakur
Solar Reaching Parity with Other
Generation Sources, Fueling Growth, but
Land Requirements a Limiting Factor
Key conclusions:
1.
4.
Solar capital costs have been declining, and are
approaching levels competitive with other generation
types. The cost of setting up Solar PV projects declined
by 53% from Rs170 mn/MW in F2010 to Rs80 mn/MW in
F2014. Solar power tariffs discovered through
competitive bidding have witnessed significant declines
as well. The average solar PV tariff has fallen from
Rs12.1/kWh (Dec 2010) to Rs6.8/kWh in the latest round
of bidding (Jan 2014). This brings the tariffs very close to
achieving grid parity, with gas-based electricity, which is
the next costliest source of electricity, priced at around
Rs5/kWh. At the same time, the Indian government has
begun pursuing further support measures for solar power.
5.
While the government has attractive incentive plans
for promoting solar power, and solar tariffs have
fallen, a key challenge remains land. While thermal
power plants require about 0.5-0.7 acres per MW, solar
power plants require over 5 acres per MW. With limited
land supply, this is likely to pose a formidable challenge
for the future of solar power in India. We factored land
limitations into our sizing of the Indian solar market.
6.
Energy storage is not likely economic in India, given
relatively low grid costs. India’s power grid has been
developed at a lower cost than in the US and Europe,
and utility rates are much lower in India. As a result, there
would not be sufficient savings to customers from
installing solar power and energy storage at a customer’s
home/business and disconnecting from the grid.
7.
Advantaged from the growth of solar power: power
project developers (Tata Power, Lanco, NTPC,
Reliance Power). Niche renewable players such as
Azure Power, Welspun Renewables Energy and Swelect
Energy are also likely to benefit from the scale-up in solar
capacity. We do not believe the growth of solar power will
be disruptive to the coal power business, given the rapid
growth of power demand in India allows both generation
types to prosper.
India comprises 4% of our global 2014-2020 forecast
(14 GW of growth, or 2 GW per year) driven by, in the
near term, government initiatives to procure solar
power, and in the longer term by economics for solar
power that is approaching parity with other
generation sources.
Exhibit 80
We Expect the Share of Solar Power in the
Renewable Portfolio to Rise
100%
90%
9
8
7
10
80%
70%
60%
37
50%
40%
47
27
21
30%
20%
10%
0%
14
6
2
F2014e
F2017e
Solar
Wind
F2022e
28
F2027e
Others
Notes:
1) The figures in the chart above are actual capacities estimated in GW.
2) Renewables capacity includes Wind, Solar, Biomass, Biogas and Small hydro capacities.
e = Morgan Stanley Research estimates
Source: SECI, MNRE, CEA, Ministry of Power, Morgan Stanley Research
2.
Coal is the largest source of electricity in India, but
domestic coal production limits growth. In the last few
years, several issues have surfaced that have impeded
the growth of coal capacity, predominantly relating to
difficulties in securing environmental clearances and a
shortfall in domestic coal production.
3.
A slowdown in hydro and wind power additions
favors the growth of solar power. Hydropower capacity
constitutes the 2nd biggest source of power in India.
However, growth in hydropower capacity has been slow
due to construction challenges, longer gestation periods
48
MORGAN STANLEY RESEARCH
July 28, 2014
Solar Power & Energy Storage
Market Size
The majority of capacity addition in India has been through
coal-fired plants, which now comprise 60% of the total
capacity in the country. However, in the last few years,
several issues have surfaced that have impeded the growth of
coal capacity, predominantly relating to difficulties in securing
environmental clearances and a shortfall in domestic coal
production.
Renewable power (13% of the installed base) has seen rising
investor interest in India, with the segment growing at the
fastest pace CAGR (18.2%) over the last 5 years, albeit over
a small base.
Exhibit 81
India’s Installed Capacity Base (GW)
243
250
223
225
200
200
175
150
125
132
108
113
118
124
105
F2002
F2003
F2004
F2005
F2006
143
148
F2008
F2009
159
174
100
75
50
25
0
Hydro
F2007
Renewables
F2010
Others
F2011
F2012
F2013 F2014e
Nuclear
Note: Renewables includes Wind, Solar, Biomass, Biogas and Small hydro capacities.
e = Morgan Stanley Research estimates
Source: CEA, Morgan Stanley Research
Exhibit 82
The total installed power capacity in India currently stands at
243 GW, and power demand growth is robust. Power plant
additions grew at a CAGR of 10.4% between F2009-14e.
While wind has historically been the biggest source of
renewable growth, due to lack of good wind sites, we expect a
significant slowdown in new wind development.
Solar Power Capacity Has Been Rising in the
Renewable Segment
35
30
25
20
15
10
5
0
F2009
F2010
Solar
F2011
Wind
F2012
F2013
F2014e
Others
Note: Renewables capacity includes Wind, Solar, Biomass, Biogas and Small hydro.
e = Morgan Stanley Research estimates
Source: MNRE, CEA, Morgan Stanley Research
49
MORGAN STANLEY RESEARCH
July 28, 2014
Solar Power & Energy Storage
Regulatory Dynamics and Solar
Economics
Ambitious government targets: The government in India
has a stated objective of increasing the proportion of
renewable energy as a whole and solar energy in particular, in
India’s total electricity consumption to 3% by 2022, which
implies a solar power capacity of ~35 GW by 2022. Of this
target, 20 GW is being planned through the JNNSM program,
while the balance remains unplanned.
While the government has attractive incentive plans for
promoting solar power, and solar tariffs have fallen, a key
challenge remains land. While thermal power plants require
about 0.5-0.7 acres per MW, solar power plants require over 5
acres per MW. With limited land supply, this is likely to pose a
formidable challenge for the future of solar power in India.
Given land and technological challenges, we assume slower
solar additions than stated government targets. We expect
solar capacity to reach 35 GW only by F2029.
The Indian government has enacted a number of policies
and programs to support the growth of solar power:
JNNSM: The government has clubbed all solar power
capacity addition plans for India under the Jawaharlal Nehru
National Solar Mission (JNNSM) program. Under the
program, the government planned up to 2 GW of capacity
additions by 2013, addition of 4-10 GW by 2017 and a total of
20 GW by 2022 (Exhibit 83). The long-term target is to add
100 GW of solar power capacity by 2030.
Exhibit 83
JNNSM Total Solar Capacity Addition Targets
Segment
Grid connected power
including rooftop
Off-grid applications
Ph I Targets
By 2013
Ph II Targets
By 2017
Ph III Targets
By 2022
1 – 2 GW
4 – 10 GW
20 GW
200 MW
1,000 MW
2,000 MW
Source: SECI, Morgan Stanley Research
GBI & VGF: The government has been providing generationbased incentives (GBI) earlier for small solar PV plants and
Viability Gap Funding (VGF) now (in JNNSM Ph II Batch I),
ensuring the government bears the burden of the difference
between the solar power tariffs and an assumed grid parity
tariff of Rs 5.45/unit. This ensures that the power distribution
companies at the state level do not have to bear any
incremental burden on sourcing solar power.
plants. The government has specified these limits as Solar
RPOs (Renewable Purchase Obligation), which keeps
increasing annually to reach a target of 3% by 2022. In 2010,
CERC also announced the Renewable Energy Certificate
(REC) trading scheme under which a solar power generator
gets an opportunity to earn RE certificates for each MWh of
electricity generated. The state discoms can also purchase
these solar RECs to make good their RPO targets.
Net Metering Policy: Many state regulators are currently
working on drafting net metering policies, though the state of
Gujarat is expected to implement its policy soon. Most states
are considering limits on how much power can be injected
back into the system, with 80-90% of the sanctioned grid
connected load likely to be decided upon as the limit.
Favorable solar resource, and improving solar
economics. The average daily solar radiation received in
India varies between 4 to 7 kWh/sqm for most parts of India
and there are on an average 250 to 300 clear sunny days a
year. Thus, the country receives about 5,000 trillion kWh of
solar energy in a year, which is equivalent to more than 600
GW of solar power potential. The cost of setting up Solar PV
projects declined by 53% from Rs 170 mn/MW in F2010 to Rs
80 mn/MW in F2014, though the cost of setting up solar
thermal power projects declined by only 8% in the same
period from Rs 130 mn/MW to Rs 120 mn/MW (Exhibit 84).
The fall in capital cost has come despite a 19% depreciation
in the Rupee vs. the US dollar in the same period, as a lot of
the solar equipment is imported. The cost decline has not
been significant for solar thermal due to project delays, which
has led to cost inflation due to higher interest cost incurred
during construction.
Exhibit 84
Capital Cost (Rs mn/MW) Has Come Down Over the
Last 5 years
170
169
153
144
130
130
120
100
80
F2010
Solar RPOs & REC Trading: The government has mandated
obligations on each state’s power distribution company to buy
a certain portion of their power requirement from solar power
150
F2011
F2012
F2013
Solar PV
Solar Thermal
F2014
Source: CERC, Morgan Stanley Research
50
MORGAN STANLEY RESEARCH
July 28, 2014
Solar Power & Energy Storage
Levelized cost of solar power has been coming off as
well: The reduction in capital costs has led to a fall in the
price of electricity generated from solar power projects. The
regulated tariff (fixed ROE) based on CERC norms for solar
PV projects has fallen from Rs18.4/kWh in F2010 to
Rs8.8/kWh in F2014 (Exhibit 85). The regulated tariff for solar
thermal projects has fallen from Rs13.5/kWh to Rs11.9/kWh
in the same period.
Exhibit 86
Competitively Bid Solar Power Tariffs (Rs/kWh)
Have Trended Down As Well (Solar PV)
Max Bid
13
Average
12
11
Min Bid
10
Max Bid
9
Solar Power on the verge of achieving grid parity: Solar
power tariffs discovered through competitive bidding have
witnessed significant declines as well. The average solar PV
tariff, bid in JNNSM Ph I Batch I, was Rs12.1/kWh (Dec
2010). This fell to Rs8.8/kWh in JNNSM Ph I Batch II (Dec
2011) and Rs5.5/kWh to Rs6.8/kWh in the latest round of
bidding in JNNSM Ph II Batch I (Jan 2014) (Exhibit 86). This
brings the tariffs very close to achieving grid parity, with gasbased electricity, which is the next costliest source of
electricity, priced at around Rs5/kWh (Exhibit 87).
Interestingly, due to the paucity of domestic natural gas, gasfired power plants currently run at very low PLFs and hence
the tariff required to run such plants profitably at low PLFs is
much higher. Also, while the cost of coal-based power from
operational power plants could range from Rs3.2-4.3/kWh,
some of the bids floated by SEBs in the recent past have
seen tariffs being quoted in the range of Rs4.2-6/kWh. This
suggests that solar tariffs are close to becoming comparable
with other sources of fuel.
Exhibit 85
Max Bid
Min Bid
7
Max Bid
Min Bid
6
Min Bid
5
4
JNNSM Ph I
Batch I
JNNSM Ph I
Batch II
State Bids
JNNSM Ph II
Batch I
Note: Tariffs for JNNSM Ph II Batch I shown above are ex-VGF payment by the government.
Post VGF tariff is a flat Rs 5.45/unit for all projects to be set up in this batch.
Source: CERC, SECI, Morgan Stanley Research
Exhibit 87
Power Tariffs by Generation Type (Rs/kWh)
11.1
5.0
3.1
Regulated Solar Power Tariffs (Rs/kWh) Have
Trended Down
18.4
Average
8
3.2
3.4
3.9
5.5
4.3
17.9
15.3
15.4
Hydro
15.0
13.5
12.5
11.9
10.4
8.8
F2010
F2011
Solar PV
F2012
F2013
Coal Nuclear
(Domestic)
Wind
Coal
Gas Solar PV Solar
(Imported) @
Thermal
US$8.3
/mBtu
Note: For coal, hydro, nuclear and wind we have estimated the tariff of existing plants based
on current operational parameters. For solar, we have taken the lowest bid tariffs from
JNNSM.
Source: Company Data, CERC, Morgan Stanley Research
F2014
Solar Thermal
Source: CERC, Morgan Stanley Research
51
MORGAN STANLEY RESEARCH
July 28, 2014
Solar Power & Energy Storage
Brazil
Miguel Rodrigues
Attractive Growth Potential, but High
Competition with Other Renewables
Exhibit 88
Brazil less irradiated regions have an average level
of 4.0 KWh/m², among the highest in the world
Key conclusions:
1.
Brazil comprises 2% of our global 2014-2020 forecast
(5 GW between 2014 and 2020), a small amount
relative to larger countries/regions. Brazil has
significant potential to develop solar energy as the
country’s average daily solar irradiation is high compared
to other countries. While Germany, the world’s leader in
solar installed capacity, has a maximum irradiation of 3.4
KWh/m²/day, Brazil has an average level of 4.0 KWh/m².
Currently, Brazil has a negligible installed capacity of
solar PV (~10MW), representing just 0.01% of the total
Brazilian power matrix.
2.
The main reason behind the stagnation of solar
generation is the lack of competitiveness, due to high
costs associated with the product, especially when
compared to wind, biomass, and hydropower. Only
recently, solar projects became available on the
regulated market auctions, but under still unattractive
conditions compared to other renewable sources..
Source: ANEEL, INPE, Morgan Stanley Research
3.
Solar energy can be developed in Brazil through new
energy auctions or distributed generation, and we see
potential for both mechanisms. The former involves
larger-scale projects and was critical for making wind
power more competitive in Brazil. The latter just had its
regulation defined and benefits from not having
transmission costs.
4.
Growth potential: The Brazilian energy planning body
(EPE) expects new auctions to contract 3.5 GW from
solar power between 2014 and 2018. This represents
10% of the additional capacity expected for this period,
and could attract suppliers to Brazil, similar to what
happened with the wind segment. This is possible, in our
view, only if dedicated auctions and/or special conditions
are created for solar (e.g. financing conditions, tax
exemption, etc), as competion with other renewable types
would not allow such a large amount of solar in the
expansion of the electricity matrix in the medium-term.
Regarding smaller-scale distributed generation, EPE
expects installed capacity of residential and commercial
segments to reach 1.1 GW by 2021.
Energy Auctions: The Path for Large-Scale Projects
Auctions can bring scale and accelerate the expansion of
wind power in Brazil. At the end of 2013, the A-3 auction
was the first auction to register solar projects, but it was not
attractive at the ceiling price of R$126/MWh. In the last A-5
auction, 88 solar projects were registered (ceiling price of
R$122/MWh), but again these projects were not able to
compete against the other renewable projects (i.e. small
hydro, biomass and wind) that were contracted at an average
price of R$110/MWh, as shown in the exhibit below. Although
the government allowed solar to participate in recent auctions,
competition with more competitive sources did not allow the
development of new solar projects.
Exhibit 89
A-5 Auction Results
Pow er Source
Wind
Biomass
Installed
Capacity
(MW)
Assured
Capacity
(Mw avg)
Load
Factor
Wgt. Avg.
Price
(R$/MWh)
2,338
1,083
46%
119.03
162
95
58%
133.75
137.35
Small Hydros
308
149
48%
São Manoel (Hydro)
700
422
60%
83.49
3,507
1,748
50%
109.93
Total
Source: CCEE, Morgan Stanley Research
52
MORGAN STANLEY RESEARCH
July 28, 2014
Solar Power & Energy Storage
In our analysis, a competitive solar project requires a
price of roughly R$250/MWh, in order to achieve a minimum
equity IRR of ~10% in real terms. Considering that this price
level is still significantly above other renewable sources,
large-scale solar projects currently depends on dedicated
auctions or specific incentives. We believe capex would need
to be as low as R$3mn/MWp to make solar as competitive as
wind, a level that is not realistic in the short-term. The main
assumptions in our analysis are: i) load factor: 20%, ii) Capex:
R$4.75mn/MWp; iii) Asset life: 25 years; iv) PPA duration: 20
years (re-contracted in the free market at R$115/MWh during
the last five years); v) Financing: 70% at TJLP + 2.5%; vi) Tax
regime: lucro presumido, which allows the projects to benefit
from lower tax rates.
Exhibit 90
IRR for Large-Scale Solar Projects
8%
4.25
4.50
4.75
Capex (R$m n/MW)
5.00
5.25
300
24.7%
21.6%
18.8%
16.2%
13.8%
275
20.2%
17.3%
14.6%
12.2%
10.0%
250
15.6%
12.9%
10.4%
8.1%
6.0%
225
11.0%
8.4%
6.1%
3.9%
1.9%
3.8%
1.6%
-0.4%
-2.3%
6.2%
200
Energy Price (R$/MWh)
Source: Morgan Stanley Research
Solar power should gain momentum through the
development of dedicated auctions. The state of
Pernambuco was the first to promote a solar exclusive
auction, which took place in December 2013 and contracted
122MWp to start supplying energy in 2017 at ~R$230/MWh.
In the regulated market, two auctions should negotiate solar
energy in 2014: i) A-5 auction that should take place on
September. In this auction, solar energy will be negotiated on
the same category of wind energy and at the same prices,
limiting the potential for new projects; and ii) a reserve auction
to take place on October, which will have solar projects
registered in an exclusive category for the first time in the
regulated market; this should allow the development of the
most competitive PV projects. Although details such as ceiling
prices and BNDES financing conditions are not available yet,
the government expects success contracting solar projects to
supply energy for a period of 20 years starting in 2017.
ANEEL gives solar projects that start operating until Dec/17 a
discount of 80% in the distribution and transmission tariffs
(TUSD and TUST) during the plant’s first 10 years of
operation, being reduced to 50% after this period. If a project
becomes operational after the mentioned date, the discount in
the tariffs becomes 50% during its whole operation period.
However, financing and taxation are still challenges
towards solar generation development. Since Brazil does
not have a robust and developed solar industry, obtaining
financing from BNDES becomes difficult, as the development
bank requires the project to have national inputs. In terms of
taxes, according to Rodrigo Sauaia, president of the Brazilian
Association of Photovoltaic Solar Energy, taxes are
responsible for ~30-40% of the total production cost required
for such activity.
Brazilian Energy Research Company (EPE) expects new
auctions to contract 3.5 GW from solar power between
2014 and 2018. This represents 10% of the additional
capacity expected for this period, and could attract suppliers
to Brazil, like happened with the wind segment. The
International Energy Agency (IEA) estimates that the solar PV
electricity will demand USD1.0bn of investments per year from
2014-2020. This suggests that ~3.0 - 4.0 GW of additional
solar PV capacity will be added in the period, which is in-line
with the aforementioned scenario from EPE that solar would
contribute with ~10% of the capacity expansion in Brazil over
the next years. This is possible, in our view, only if dedicated
auctions and/or special conditions are created for solar (e.g.
financing conditions, tax exemption, etc), as competion with
other renewable would not allow such a large amount of solar
in the electricity matrix in the medium-term.
Exhibit 91
EPE Expects New Auctions to Contract 3.5 GW from
2014-18, which Implies that Solar Would Contribute
with ~10% of the Capacity Expansion in Brazil
Installed GW of Solar Power in Brazil under different
weights on the national capacity expansion
7.0
2.5%
6.0
5.0%
10.0%
5.4
4.8
5.0
The Brazilian government offers a series of incentives for
renewables expansion, in order to enhance the
diversification in the Brazilian energy matrix. However, these
incentives have not been sufficient in order to transform solar
projects into a competitive source in Brazil. The majority of
these incentives are also available to wind, small hydroelectric
and biomass sources, which are relatively more competitive
than solar. Specific to solar, the Resolution nº 481 from
4.1
4.0
3.5
2.7
3.0
1.9
2.0
1.0
0.0
6.1
15.0%
0.8
0.6
0.3
0.1
2014
3.2
2.3
1.8
1.2
0.6
0.3
2015
3.6
0.9
0.4
2016
1.2
0.6
2017
1.6
0.8
2018
1.8
0.9
2019
2.0
1.0
2020
Source: EPE, Morgan Stanley Research
53
MORGAN STANLEY RESEARCH
July 28, 2014
Solar Power & Energy Storage
Distributed generation
Regulation for distributed generation was only defined in
Brazil in 2012. Distributed generation consists in the
generation of energy by the final consumer, which can be
connected directly or indirectly to the grid. In this system, a
consumer that has a photovoltaic (or other renewable driven
plant) at his residence might sell the excess energy back to
the grid. No monetary transaction occurs in Brazil; instead,
the consumer earns energy credits that can be used to reduce
its bill on the following months. This was defined in April 2012,
based on Resolution nº 482, in which ANEEL defined the
concepts of micro and mini-generation, distributed generation
and created the energy compensation system (net metering).
The net metering system allows the consumer with a small
sized plant (<1MWp) that uses renewable sources to sell the
excess energy to its distribution company for the same tariff it
would charge him, minus the taxes.
The improvement of energy taxation could accelerate the
development of distributed energy. The challenge, in this
case, lies on the fact that the legislation should be adjusted in
each state as it involves ICMS taxes. The state of Minas
Gerais has already adjusted its taxation to favor this
mechanism and, combined with the relatively high irradiation,
should put the state at the forefront of the distributed
generation development. On the equipment side, there is a
national resolution from CONFAZ that foresees exemption of
ICMS and IPI in the photovoltaic module. Some states are
considering the extension of this benefit for other
components. Mr. Sauaia states that both distributed
generation and centralized generation (large projects) are
heavily affected by taxation. He believes that the excess
energy that might be traded with the grid is still discounted by
taxes that can reach 33% of the value per KWh.
EPE expects installed capacity of residential and
commercial segments to reach 1.1 GWp by 2021. Although
this may look conservative considering that it implies a
penetration of less than 1% in the residential and consumer
segments, this could prove realistic in the proposed timeframe, as the PV power will is not yet economically viable for
several regions, what should happen gradually over the next
years.
Exhibit 92
EPE expects solar installed capacity of residential
and commercial segments to reach 1.1 GWp by
2021
Installed capacity (MWp)
1,143
850
587
400
246
11
37
2013
2014
64
2015
130
2016
2017
2018
2019
2020
2021
Source: EPE, Morgan Stanley Research
Distributed generation offers clear benefits for the
system. In our view, the key benefits are: i) environmental
impact, as it reduces the requirement to invest in generation
projects with higher environmental impact; ii) it does not
require transmission investments – a significant cost when we
consider that a large portion of the wind and hydropower
potential in Brazil is distant from the consumption centers; iii)
lower energy losses in the transmission and distribution of
electricity. Once viable from an economic point of view, the
benefits are clear, and so is the growth potential.
We expect distributed generation to become more
attractive after 2018, compared to average tariffs in the
Southeast region, as depending on the distribution
concession area, the development is already close to
breakeven. The next exhibit shows our assessment of
distributed PV generation competitiveness in the Southeast
region. The estimated system cost in Brazil (which includes
the installation and required components) ranges from R$
6/Watt to R$ 10/Watt and it depends heavily on the size and
54
MORGAN STANLEY RESEARCH
July 28, 2014
Solar Power & Energy Storage
consumption levels of the client. In our analysis we assume
an average system cost for 2014 of R$ 8.5/Watt, with a
decline rate of 6.0%/year. Other key assumptions are: i) asset
life of 25 year; ii) overhaul investment of 40% of original
capex, in the 15th year; iii) annual O&M cost of 1.0% of
original capex; iv) weighted average of utilities tariffs in the
Southeast region (2013). We note the economic feasibility of
this power source is very sensitive to the solar irradiation level
and tariff of the utility in the specific concession area. This
means that a specific site could already be viable while others
may not be viable, even after a significant reduction in the
development costs.
Exhibit 70
We expect PV distributed generation to become
viable after further reduction in costs is achieved
(Brazilian Southeast region Competitiveness)
Key Players
CPFL Renovaveis (CPRE3): inaugurated in 2012 the project
of Tanquinhos (1MWp), an operational solar power plant in
the state of São Paulo. The company believes that solar
energy will has a promising outlook, although it still requires
special attention to become feasible. The company has
registered 330MW in the last A-5 auction, which took place in
Dec/2013, but as is known, no company managed to sell solar
contracts, as solar was being negotiated in the same category
of more competitive renewable sources (e.g. wind). Currently,
CPFL Renováveis only develops large-scale solar projects,
while CPFL Serviços, a subsidiary of CPFL Energia (CPFE3 –
OW), is responsible for distributed generation.
Eletrobras (ELET6): inaugurated its first commercial solar
project, through its subsidiary Eletrosul, which installed 4,200
photovoltaic modules in its headquarters. The amount
generated will produce enough energy to supply 540
residences and has an installed capacity of 1MW. The
company aims to negotiate 800MWh/year with this project.
Eletrosul played an important role in the expansion of wind
segment.
R$ / KWh
$0.60
$0.50
$0.40
$0.30
$0.20
$0.10
2014
2015
Development cost of solar
distributed generation (LCOE)
2016
2017
Utility Rate (breakeven for solar
power development)
2018
Max
Average
Min
Source: ANEEL, EPE, CCEE, INPE, Morgan Stanley Research
Storage does not seem viable in Brazil, due to taxes and
high battery costs. All energy exported to the grid is taxable
and, given that the pricing on energy export cannot be made
on an hourly basis, benefiting from peak hours, this reduces
the potential benefit of storage (e.g. storage would help to
export in the higher prices time, but this is not possible on the
current regulation). Also, storage does not make sense
considering that the customer payments for the "minimum
consumption" level are far lower than the cost of a storage
system. The availability cost is calculated multiplying a fixed
value of consumption, which depends on the connection type
(number of conductors) of a consumer and his electricity bill.
These values are 30KWh for consumers with one conductor
(mono-phasic), 50KWh and 100KWh for consumers with two
or three conductors respectively (bi and tri-phasic). Storage
seems to make sense currently only for those who are located
in areas of poor quality of services and cannot be exposed to
disruptions in supply.
Renova (RNEW11): The company has currently more than
ten distributed generation solar projects and recently
announced the construction of its solar power plant, which will
be a hybrid project alongside a wind farm. The company sees
the government efforts to enable solar generation in Brazil as
quite positive and exclusive auctions will be key to organize
the sector and nationalize the production of the equipments,
facilitating access to BNDES financing. The company plans to
register ~200MW in the upcoming reserve auction, but
believes that solar could reach wind power competitiveness in
about 10 years.
Tractebel (TBLE3): the company has under construction the
Cidade Azul photovoltaic solar project in Brazil, which is the
largest in the country with 3MW of installed capacity. In
addition, Tractebel has been developing a few solar trial
modules of 70kWp set in different locations in Brazil. The
trial’s goal, according to the company, is to assess the solar
generation potential in Brazil and identify the most appropriate
technologies matching the climate conditions for several
regions. Total expected investment is R$56.3mn.
55
MORGAN STANLEY RESEARCH
July 28, 2014
Solar Power & Energy Storage
Exhibit 72
Brazilian Electricity Matrix Snapshot
Brazilian Installed Capacity Projections
Currently Brazil has an installed capacity of ~130GW and
relies heavily on hydro generation, with ~65% of its
installed capacity from hydro plants. The high weight of hydro
in the matrix has been the main driver of low short-term prices
for a long period, due to low variable costs (no fuel required
and low O&M). Thermal plants in Brazil are considered as a
support source, helping to complement energy generation by
hydro and other sources. Nevertheless, it has also been an
important concern during bad hydrology periods, like in 2001,
2013 and 2014, when the deterioration in reservoir levels has
significantly increased the rationing risk.
Source: EPE, Morgan Stanley Research
Exhibit 71
Exhibit 73
Brazil’s Currently Relies Heavily on Hydro Sources
(Installed Capacity in MWp)
140,000
11,607
120,000
100,000
3,106
1,990
10
100%
90%
80%
70%
60%
50%
40%
2007 2008 2009 2010 2011 2012 2013 2014 2015 2016 2017 2018 2019 2020 2021 2022
Hydro
Nuclear
Renewables
Thermal
Supply and Demand Balance in Brazil
Demand (including losses)
Supply
5.5%
129,162
80.4
Reserve margin
4.6%
25,326
76.6
4.6%
87,123
73.7
5.0%
80,000
71.1
76.2
73.2
70.5
3.7%
60,000
66.8
40,000
67.7
64.4
20,000
0
Hydro
Thermal
Biomass
Wind
Nuclear
Photovoltaic Inst. Cap.
June-14
2013
2014E
2015E
2016E
2017E
Source: EPE, Morgan Stanley Research
Source: ANEEL, Morgan Stanley Research
Renewables energy sources should represent a growing
share of Brazil’s energy supply, given their relatively low
environmental hurdles and easier approval compared to large
hydro or thermal plants. Government energy plans (PDE
2022) estimate an installed capacity CAGR of 4% in 2013-22,
with an outsized contribution from renewables (8.2% CAGR).
56
MORGAN STANLEY RESEARCH
July 28, 2014
Solar Power & Energy Storage
Morgan Stanley Blue Papers
Morgan Stanley Blue Papers address long-term, structural business changes that are reshaping the fundamentals of entire
economies and industries around the globe. Analysts, economists, and strategists in our global research network collaborate in the
Blue Papers to adder ss critical themes that require a coordinated perspective across regions, sectors, or asset classes.
Recently Published Blue Papers
The ‘Internet of Things’
Is Now
Connecting the Real
Economy
April 3, 2014
MedTech: 3D Printing
A Solution for Innovation
July 22, 2013
Wholesale & Investment
Banking Outlook
Mis-allocated Resources:
Why Banks Need to
Optimise Now
March 20, 2014
Commercial Aviation
A Renewed Lease of Life
July 22, 2013
ContagEM
Could it be worse than the
1990s for DM?
March 5, 2014
Emerging Markets
What If the Tide Goes Out?
June 13, 2013
Mobile Payments
The Coming Battle for the
Wallet
January 8, 2014
Japan and South Korea
The Yen Tide Does Not Lift
All Boats
May 30, 2013
Autonomous Cars
Self-Driving the New Auto
Industry Paradigm
November 6, 2013
Global Steel
Steeling for Oversupply
May 23, 2013
Global Asset Managers
Great Rotation? Probably
Not
October 8, 2013
US Manufacturing
Renaissance
Is It a Masterpiece or a
(Head) Fake?
April 29, 2013
Capital Goods: 3D
Printing
Don’t Believe (All) The
Hype
September 5, 2013
Natural Gas as a
Transportation Fuel
Energy Market Wild Card
April 16, 2013
57
MORGAN STANLEY RESEARCH
July 28, 2014
Solar Power & Energy Storage
Global Semiconductors
Chipping Away at Returns
April 15, 2013
Wholesale & Investment
Banking Outlook
Global Banking Fractures:
The Implications
April 11, 2013
Social Gambling
Click Here to Play
November 14, 2012
Key Secular Themes in IT
Any
Monetizing Big Data
September 4, 2012
Releasing the Pressure
from Low Yields
Should Insurers Consider
Re-risking Investments?
March 15, 2013
Chemicals
‘Green is Good’ – The
Potential of Bioplastics
August 22, 2012
Global Autos
Clash of the Titans: The
Race for Global Leadership
January 22, 2013
MedTech & Services
Emerging Markets: Searching
for Growth
August 6, 2012
Big Subsea Opportunity
Deep Dive
January 14, 2013
Commercial Aviation
Navigating a New Flight Path
June 26, 2012
eCommerce Disruption:
A Global Theme
Transforming Traditional
Retail
January 6, 2013
Mobile Data Wave
Who Dares to Invest, Wins
June 13, 2012
China – Robotics
Automation for the People
December 5, 2012
Global Auto Scenarios 2022
Disruption and Opportunity
Starts Now
June 5, 2012
Global Emerging Market
Banks
On Track for Growth
November 19, 2012
Tablet Landscape Evolution
Window(s) of Opportunity
May 31, 2012
58
MORGAN STANLEY RESEARCH
July 28, 2014
Solar Power & Energy Storage
Financials: CRE Funding
Shift
EU Shakes, US Selectively
Takes
May 25, 2012
China High-Speed Rail
On the Economic Fast Track
May 15, 2011
The China Files
The Logistics Journey Is
Just Beginning
April 24, 2012
Asian Inflation
Consumers Adjust As Inflation
Worsens
March 31, 2011
Solvency
The Long and Winding
Road
March 23, 2012
Wholesale & Investment
Banking
Reshaping the Model
March 23, 2011
Wholesale & Investment
Banking Outlook
Decision Time for
Wholesale Banks
March 23, 2012
Global Gas
A Decade of Two Halves
March 14, 2011
Banks Deleveraging and
Real Estate
Implication of a €400700bn Financing Gap
March 15, 2012
Tablet Demand and
Disruption
Mobile Users Come of Age
February 14, 2011
The China Files
China’s Appetite for Protein
Turns Global
October 25, 2011
The China Files
Chinese Economy through
2020
November 8, 2010
The US Healthcare
Formula
Cost Control and True
Innovation
June 16, 2011
The China Files
Asian Corporates & China’s
Megatransition
November 8, 2010
Cloud Computing Takes
Off
Market Set to Boom as
Migration Accelerates
May 23, 2011
The China Files
European Corporates &
China’s Megatransition
October 29, 2010
59
MORGAN STANLEY RESEARCH
July 28, 2014
Solar Power & Energy Storage
Petrochemicals
Preparing for a Supercycle
October 18, 2010
Solvency 2
Quantitative & Strategic
Impact, The Tide is Going
Out
September 22, 2010
The China Files
US Corporates and China’s
Megatransition
September 20, 2010
Brazil Infrastructure
Paving the Way
May 5, 2010
60
MORGAN STANLEY RESEARCH
July 28, 2014
Solar Power & Energy Storage
Morgan Stanley & Co. International plc ("Morgan Stanley") is acting as financial advisor to certain entities in the LetterOne group of companies and
their affiliates in relation to the proposed acquisition of RWE DEA AG from RWE AG as announced on 16 March 2014. Morgan Stanley expects
fees to be paid for its financial services. Please refer to the notes at the end of the report.
61
MORGAN STANLEY RESEARCH
July 28, 2014
Solar Power & Energy Storage
Disclosure Section
The information and opinions in Morgan Stanley Research were prepared by Morgan Stanley & Co. LLC, and/or Morgan Stanley C.T.V.M. S.A.,
and/or Morgan Stanley Mexico, Casa de Bolsa, S.A. de C.V., and/or Morgan Stanley Canada Limited. As used in this disclosure section, "Morgan
Stanley" includes Morgan Stanley & Co. LLC, Morgan Stanley C.T.V.M. S.A., Morgan Stanley Mexico, Casa de Bolsa, S.A. de C.V., Morgan Stanley
Canada Limited and their affiliates as necessary.
For important disclosures, stock price charts and equity rating histories regarding companies that are the subject of this report, please see the
Morgan Stanley Research Disclosure Website at www.morganstanley.com/researchdisclosures, or contact your investment representative or
Morgan Stanley Research at 1585 Broadway, (Attention: Research Management), New York, NY, 10036 USA.
For valuation methodology and risks associated with any price targets referenced in this research report, please contact the Client Support Team as
follows: US/Canada +1 800 303-2495; Hong Kong +852 2848-5999; Latin America +1 718 754-5444 (U.S.); London +44 (0)20-7425-8169;
Singapore +65 6834-6860; Sydney +61 (0)2-9770-1505; Tokyo +81 (0)3-6836-9000. Alternatively you may contact your investment representative
or Morgan Stanley Research at 1585 Broadway, (Attention: Research Management), New York, NY 10036 USA.
Analyst Certification
The following analysts hereby certify that their views about the companies and their securities discussed in this report are accurately expressed and
that they have not received and will not receive direct or indirect compensation in exchange for expressing specific recommendations or views in
this report: Stephen Byrd.
Unless otherwise stated, the individuals listed on the cover page of this report are research analysts.
Global Research Conflict Management Policy
Morgan Stanley Research has been published in accordance with our conflict management policy, which is available at
www.morganstanley.com/institutional/research/conflictpolicies.
Important US Regulatory Disclosures on Subject Companies
The following analyst or strategist (or a household member) owns securities (or related derivatives) in a company that he or she covers or
recommends in Morgan Stanley Research: Vinay Jaising - Reliance Industries(common or preferred stock).
As of June 30, 2014, Morgan Stanley beneficially owned 1% or more of a class of common equity securities of the following companies covered in
Morgan Stanley Research: E.ON, Kyocera, NRG Yield Inc, RWE AG, Sempra Energy, SolarCity Corp, Sunedison Inc, Tesla Motors Inc..
Within the last 12 months, Morgan Stanley managed or co-managed a public offering (or 144A offering) of securities of Edison International, ENEL,
Mitsubishi Electric, NRG Energy Inc, NRG Yield Inc, PG&E Corp, Sempra Energy, Sharp, SSE, Tesla Motors Inc..
Within the last 12 months, Morgan Stanley has received compensation for investment banking services from E.ON, Edison International, ENEL,
Mitsubishi Electric, NRG Energy Inc, Panasonic, PG&E Corp, Reliance Industries, Sempra Energy, Sharp, SSE, Tesla Motors Inc..
In the next 3 months, Morgan Stanley expects to receive or intends to seek compensation for investment banking services from Centrica, E.ON,
Edison International, ENEL, First Solar Inc, GCL-Poly Energy, GDF SUEZ, Hawaiian Electric Industries Inc., Kyocera, LANCO Infratech Ltd,
Mitsubishi Electric, NRG Energy Inc, OCI N.V., Panasonic, PG&E Corp, Pinnacle West Capital Corp, Reliance Industries, RWE AG, Sempra Energy,
Sharp, SolarCity Corp, SSE, Sunedison Inc, Tata Power Co, Tesla Motors Inc., Toshiba, Trina Solar, Wacker Chemie.
Within the last 12 months, Morgan Stanley has received compensation for products and services other than investment banking services from
Centrica, E.ON, Edison International, ENEL, First Solar Inc, GCL-Poly Energy, GDF SUEZ, Hawaiian Electric Industries Inc., Kyocera, NRG Energy
Inc, Panasonic, PG&E Corp, Pinnacle West Capital Corp, Reliance Industries, RWE AG, Sempra Energy, Sharp, SSE, Toshiba, Yingli Green
Energy.
Within the last 12 months, Morgan Stanley has provided or is providing investment banking services to, or has an investment banking client
relationship with, the following company: Centrica, E.ON, Edison International, ENEL, First Solar Inc, GCL-Poly Energy, GDF SUEZ, Hawaiian
Electric Industries Inc., Kyocera, LANCO Infratech Ltd, Mitsubishi Electric, NRG Energy Inc, NRG Yield Inc, OCI N.V., Panasonic, PG&E Corp,
Pinnacle West Capital Corp, Reliance Industries, RWE AG, Sempra Energy, Sharp, SolarCity Corp, SSE, Sunedison Inc, Tata Power Co, Tesla
Motors Inc., Toshiba, Trina Solar, Wacker Chemie.
Within the last 12 months, Morgan Stanley has either provided or is providing non-investment banking, securities-related services to and/or in the
past has entered into an agreement to provide services or has a client relationship with the following company: Centrica, E.ON, Edison International,
ENEL, First Solar Inc, GCL-Poly Energy, GDF SUEZ, Hawaiian Electric Industries Inc., Kyocera, Mitsubishi Electric, NRG Energy Inc, Panasonic,
PG&E Corp, Pinnacle West Capital Corp, Reliance Industries, RWE AG, Sempra Energy, Sharp, SolarCity Corp, SSE, Tata Power Co, Tesla
Motors Inc., Toshiba, Yingli Green Energy.
Morgan Stanley & Co. LLC makes a market in the securities of Edison International, ENEL, First Solar Inc, Gannett Co Inc., Hawaiian Electric
Industries Inc., JinkoSolar Holding Co Ltd, Kyocera, NRG Energy Inc, NRG Yield Inc, PG&E Corp, Pinnacle West Capital Corp, Sempra Energy,
SolarCity Corp, Sunedison Inc, Tesla Motors Inc., Trina Solar.
The equity research analysts or strategists principally responsible for the preparation of Morgan Stanley Research have received compensation
based upon various factors, including quality of research, investor client feedback, stock picking, competitive factors, firm revenues and overall
investment banking revenues.
Morgan Stanley and its affiliates do business that relates to companies/instruments covered in Morgan Stanley Research, including market making,
providing liquidity and specialized trading, risk arbitrage and other proprietary trading, fund management, commercial banking, extension of credit,
investment services and investment banking. Morgan Stanley sells to and buys from customers the securities/instruments of companies covered in
Morgan Stanley Research on a principal basis. Morgan Stanley may have a position in the debt of the Company or instruments discussed in this
report.
Certain disclosures listed above are also for compliance with applicable regulations in non-US jurisdictions.
STOCK RATINGS
Morgan Stanley uses a relative rating system using terms such as Overweight, Equal-weight, Not-Rated or Underweight (see definitions below).
Morgan Stanley does not assign ratings of Buy, Hold or Sell to the stocks we cover. Overweight, Equal-weight, Not-Rated and Underweight are not
the equivalent of buy, hold and sell. Investors should carefully read the definitions of all ratings used in Morgan Stanley Research. In addition, since
Morgan Stanley Research contains more complete information concerning the analyst's views, investors should carefully read Morgan Stanley
Research, in its entirety, and not infer the contents from the rating alone. In any case, ratings (or research) should not be used or relied upon as
investment advice. An investor's decision to buy or sell a stock should depend on individual circumstances (such as the investor's existing holdings)
and other considerations.
62
MORGAN STANLEY RESEARCH
July 28, 2014
Solar Power & Energy Storage
Global Stock Ratings Distribution
(as of June 30, 2014)
For disclosure purposes only (in accordance with NASD and NYSE requirements), we include the category headings of Buy, Hold, and Sell
alongside our ratings of Overweight, Equal-weight, Not-Rated and Underweight. Morgan Stanley does not assign ratings of Buy, Hold or Sell to the
stocks we cover. Overweight, Equal-weight, Not-Rated and Underweight are not the equivalent of buy, hold, and sell but represent recommended
relative weightings (see definitions below). To satisfy regulatory requirements, we correspond Overweight, our most positive stock rating, with a buy
recommendation; we correspond Equal-weight and Not-Rated to hold and Underweight to sell recommendations, respectively.
Stock Rating Category
Coverage Universe
Investment Banking Clients (IBC)
% of
% of % of Rating
Count
Total
Count Total IBC Category
Overweight/Buy
Equal-weight/Hold
Not-Rated/Hold
Underweight/Sell
Total
1080
1339
113
546
3,078
35%
44%
4%
18%
367
469
23
98
957
38%
49%
2%
10%
34%
35%
20%
18%
Data include common stock and ADRs currently assigned ratings. Investment Banking Clients are companies from whom Morgan Stanley received
investment banking compensation in the last 12 months.
Analyst Stock Ratings
Overweight (O). The stock's total return is expected to exceed the average total return of the analyst's industry (or industry team's) coverage
universe, on a risk-adjusted basis, over the next 12-18 months.
Equal-weight (E). The stock's total return is expected to be in line with the average total return of the analyst's industry (or industry team's) coverage
universe, on a risk-adjusted basis, over the next 12-18 months.
Not-Rated (NR). Currently the analyst does not have adequate conviction about the stock's total return relative to the average total return of the
analyst's industry (or industry team's) coverage universe, on a risk-adjusted basis, over the next 12-18 months.
Underweight (U). The stock's total return is expected to be below the average total return of the analyst's industry (or industry team's) coverage
universe, on a risk-adjusted basis, over the next 12-18 months.
Unless otherwise specified, the time frame for price targets included in Morgan Stanley Research is 12 to 18 months.
Analyst Industry Views
Attractive (A): The analyst expects the performance of his or her industry coverage universe over the next 12-18 months to be attractive vs. the
relevant broad market benchmark, as indicated below.
In-Line (I): The analyst expects the performance of his or her industry coverage universe over the next 12-18 months to be in line with the relevant
broad market benchmark, as indicated below.
Cautious (C): The analyst views the performance of his or her industry coverage universe over the next 12-18 months with caution vs. the relevant
broad market benchmark, as indicated below.
Benchmarks for each region are as follows: North America - S&P 500; Latin America - relevant MSCI country index or MSCI Latin America Index;
Europe - MSCI Europe; Japan - TOPIX; Asia - relevant MSCI country index or MSCI sub-regional index or MSCI AC Asia Pacific ex Japan Index.
.
Important Disclosures for Morgan Stanley Smith Barney LLC Customers
Important disclosures regarding the relationship between the companies that are the subject of Morgan Stanley Research and Morgan Stanley Smith Barney LLC or
Morgan Stanley or any of their affiliates, are available on the Morgan Stanley Wealth Management disclosure website at
www.morganstanley.com/online/researchdisclosures. For Morgan Stanley specific disclosures, you may refer to www.morganstanley.com/researchdisclosures.
Each Morgan Stanley Equity Research report is reviewed and approved on behalf of Morgan Stanley Smith Barney LLC. This review and approval is conducted by the
same person who reviews the Equity Research report on behalf of Morgan Stanley. This could create a conflict of interest.
Other Important Disclosures
Morgan Stanley & Co. International PLC and its affiliates have a significant financial interest in the debt securities of Centrica, E.ON, Edison International, ENEL, First
Solar Inc, Gannett Co Inc., GDF SUEZ, Hawaiian Electric Industries Inc., Mitsubishi Electric, NRG Energy Inc, Panasonic, PG&E Corp, Reliance Industries, RWE AG,
Sempra Energy, Sharp, SSE, Tesla Motors Inc., Toshiba.
Morgan Stanley is not acting as a municipal advisor and the opinions or views contained herein are not intended to be, and do not constitute, advice within the meaning
of Section 975 of the Dodd-Frank Wall Street Reform and Consumer Protection Act.
Morgan Stanley produces an equity research product called a "Tactical Idea." Views contained in a "Tactical Idea" on a particular stock may be contrary to the
recommendations or views expressed in research on the same stock. This may be the result of differing time horizons, methodologies, market events, or other factors.
For all research available on a particular stock, please contact your sales representative or go to Matrix at http://www.morganstanley.com/matrix.
Morgan Stanley Research is provided to our clients through our proprietary research portal on Matrix and also distributed electronically by Morgan Stanley to clients.
Certain, but not all, Morgan Stanley Research products are also made available to clients through third-party vendors or redistributed to clients through alternate
electronic means as a convenience. For access to all available Morgan Stanley Research, please contact your sales representative or go to Matrix at
http://www.morganstanley.com/matrix.
Any access and/or use of Morgan Stanley Research is subject to Morgan Stanley's Terms of Use (http://www.morganstanley.com/terms.html). By accessing and/or
using Morgan Stanley Research, you are indicating that you have read and agree to be bound by our Terms of Use (http://www.morganstanley.com/terms.html). In
addition you consent to Morgan Stanley processing your personal data and using cookies in accordance with our Privacy Policy and our Global Cookies Policy
(http://www.morganstanley.com/privacy_pledge.html), including for the purposes of setting your preferences and to collect readership data so that we can deliver better
and more personalized service and products to you. To find out more information about how Morgan Stanley processes personal data, how we use cookies and how to
reject cookies see our Privacy Policy and our Global Cookies Policy (http://www.morganstanley.com/privacy_pledge.html).
If you do not agree to our Terms of Use and/or if you do not wish to provide your consent to Morgan Stanley processing your personal data or using cookies please do
not access our research.
The recommendations of Miguel Rodrigues in this report reflect solely and exclusively the analyst's personal views and have been developed independently, including
from the institution for which the analyst works.
Morgan Stanley Research does not provide individually tailored investment advice. Morgan Stanley Research has been prepared without regard to the circumstances
and objectives of those who receive it. Morgan Stanley recommends that investors independently evaluate particular investments and strategies, and encourages
investors to seek the advice of a financial adviser. The appropriateness of an investment or strategy will depend on an investor's circumstances and objectives. The
securities, instruments, or strategies discussed in Morgan Stanley Research may not be suitable for all investors, and certain investors may not be eligible to purchase or
participate in some or all of them. Morgan Stanley Research is not an offer to buy or sell or the solicitation of an offer to buy or sell any security/instrument or to
participate in any particular trading strategy. The value of and income from your investments may vary because of changes in interest rates, foreign exchange rates,
default rates, prepayment rates, securities/instruments prices, market indexes, operational or financial conditions of companies or other factors. There may be time
63
MORGAN STANLEY RESEARCH
July 28, 2014
Solar Power & Energy Storage
limitations on the exercise of options or other rights in securities/instruments transactions. Past performance is not necessarily a guide to future performance. Estimates
of future performance are based on assumptions that may not be realized. If provided, and unless otherwise stated, the closing price on the cover page is that of the
primary exchange for the subject company's securities/instruments.
The fixed income research analysts, strategists or economists principally responsible for the preparation of Morgan Stanley Research have received compensation based
upon various factors, including quality, accuracy and value of research, firm profitability or revenues (which include fixed income trading and capital markets profitability
or revenues), client feedback and competitive factors. Fixed Income Research analysts', strategists' or economists' compensation is not linked to investment banking or
capital markets transactions performed by Morgan Stanley or the profitability or revenues of particular trading desks.
The "Important US Regulatory Disclosures on Subject Companies" section in Morgan Stanley Research lists all companies mentioned where Morgan Stanley owns 1%
or more of a class of common equity securities of the companies. For all other companies mentioned in Morgan Stanley Research, Morgan Stanley may have an
investment of less than 1% in securities/instruments or derivatives of securities/instruments of companies and may trade them in ways different from those discussed in
Morgan Stanley Research. Employees of Morgan Stanley not involved in the preparation of Morgan Stanley Research may have investments in securities/instruments or
derivatives of securities/instruments of companies mentioned and may trade them in ways different from those discussed in Morgan Stanley Research. Derivatives may
be issued by Morgan Stanley or associated persons.
With the exception of information regarding Morgan Stanley, Morgan Stanley Research is based on public information. Morgan Stanley makes every effort to use reliable,
comprehensive information, but we make no representation that it is accurate or complete. We have no obligation to tell you when opinions or information in Morgan
Stanley Research change apart from when we intend to discontinue equity research coverage of a subject company. Facts and views presented in Morgan Stanley
Research have not been reviewed by, and may not reflect information known to, professionals in other Morgan Stanley business areas, including investment banking
personnel.
Morgan Stanley Research personnel may participate in company events such as site visits and are generally prohibited from accepting payment by the company of
associated expenses unless pre-approved by authorized members of Research management.
Morgan Stanley may make investment decisions or take proprietary positions that are inconsistent with the recommendations or views in this report.
To our readers in Taiwan: Information on securities/instruments that trade in Taiwan is distributed by Morgan Stanley Taiwan Limited ("MSTL"). Such information is for
your reference only. The reader should independently evaluate the investment risks and is solely responsible for their investment decisions. Morgan Stanley Research
may not be distributed to the public media or quoted or used by the public media without the express written consent of Morgan Stanley. Information on
securities/instruments that do not trade in Taiwan is for informational purposes only and is not to be construed as a recommendation or a solicitation to trade in such
securities/instruments. MSTL may not execute transactions for clients in these securities/instruments. To our readers in Hong Kong: Information is distributed in Hong
Kong by and on behalf of, and is attributable to, Morgan Stanley Asia Limited as part of its regulated activities in Hong Kong. If you have any queries concerning Morgan
Stanley Research, please contact our Hong Kong sales representatives.
Morgan Stanley is not incorporated under PRC law and the research in relation to this report is conducted outside the PRC. Morgan Stanley Research does not
constitute an offer to sell or the solicitation of an offer to buy any securities in the PRC. PRC investors shall have the relevant qualifications to invest in such securities
and shall be responsible for obtaining all relevant approvals, licenses, verifications and/or registrations from the relevant governmental authorities themselves.
Morgan Stanley Research is disseminated in Brazil by Morgan Stanley C.T.V.M. S.A.; in Japan by Morgan Stanley MUFG Securities Co., Ltd. and, for Commodities
related research reports only, Morgan Stanley Capital Group Japan Co., Ltd; in Hong Kong by Morgan Stanley Asia Limited (which accepts responsibility for its contents)
and by Bank Morgan Stanley AG, Hong Kong Branch; in Singapore by Morgan Stanley Asia (Singapore) Pte. (Registration number 199206298Z) and/or Morgan Stanley
Asia (Singapore) Securities Pte Ltd (Registration number 200008434H), regulated by the Monetary Authority of Singapore (which accepts legal responsibility for its
contents and should be contacted with respect to any matters arising from, or in connection with, Morgan Stanley Research) and by Bank Morgan Stanley AG, Singapore
Branch (Registration number T11FC0207F); in Australia to "wholesale clients" within the meaning of the Australian Corporations Act by Morgan Stanley Australia Limited
A.B.N. 67 003 734 576, holder of Australian financial services license No. 233742, which accepts responsibility for its contents; in Australia to "wholesale clients" and
"retail clients" within the meaning of the Australian Corporations Act by Morgan Stanley Wealth Management Australia Pty Ltd (A.B.N. 19 009 145 555, holder of
Australian financial services license No. 240813, which accepts responsibility for its contents; in Korea by Morgan Stanley & Co International plc, Seoul Branch; in India
by Morgan Stanley India Company Private Limited; in Indonesia by PT Morgan Stanley Asia Indonesia; in Canada by Morgan Stanley Canada Limited, which has
approved of and takes responsibility for its contents in Canada; in Germany by Morgan Stanley Bank AG, Frankfurt am Main and Morgan Stanley Private Wealth
Management Limited, Niederlassung Deutschland, regulated by Bundesanstalt fuer Finanzdienstleistungsaufsicht (BaFin); in Spain by Morgan Stanley, S.V., S.A., a
Morgan Stanley group company, which is supervised by the Spanish Securities Markets Commission (CNMV) and states that Morgan Stanley Research has been written
and distributed in accordance with the rules of conduct applicable to financial research as established under Spanish regulations; in the US by Morgan Stanley & Co. LLC,
which accepts responsibility for its contents. Morgan Stanley & Co. International plc, authorized by the Prudential Regulatory Authority and regulated by the Financial
Conduct Authority and the Prudential Regulatory Authority, disseminates in the UK research that it has prepared, and approves solely for the purposes of section 21 of
the Financial Services and Markets Act 2000, research which has been prepared by any of its affiliates. Morgan Stanley Private Wealth Management Limited, authorized
and regulated by the Financial Conduct Authority, also disseminates Morgan Stanley Research in the UK. Private UK investors should obtain the advice of their Morgan
Stanley & Co. International plc or Morgan Stanley Private Wealth Management representative about the investments concerned. RMB Morgan Stanley (Proprietary)
Limited is a member of the JSE Limited and regulated by the Financial Services Board in South Africa. RMB Morgan Stanley (Proprietary) Limited is a joint venture
owned equally by Morgan Stanley International Holdings Inc. and RMB Investment Advisory (Proprietary) Limited, which is wholly owned by FirstRand Limited.
FirstRand Limited and Rand Merchant Bank (a division of FirstRand Limited) may presently hold a 1% or more of a class of common equity securities, in any companies
covered in this report. This may include holding a net long or short position of US$1 million or more of Debt securities. Within the last 12 months, FirstRand Limited may
have co-managed a public offering, received compensation for investment services, or services other than investment services, or expects to receive or intends to seek
compensation for investment services not disclosed in this report. Additionally, FirstRand limited does make a market in securities or acts as a corporate broker not
disclosed in this report. FirstRand Limited (or it's directors, officers or employees) may, to the extent permitted by law, own or have a position in the securities of any
company or related company referred to herein, and may add to or dispose of any such position or may make a market or act as a principle in any transaction in such
securities or financial instruments. Directors of FirstRand Limited may also be directors of any of the companies mentioned in this report. FirstRand Limited may from
time to time provide or solicit investment banking underwriting or other financial services to, for, or from any company referred to herein. FirstRand Limited (or its
directors, officers or employees) may, to the extent permitted by law, act upon or use the information or opinions presented herein, research or analysis on which they
are based prior to the material being published. FirstRand Limited may have issued, or may in the future issue other advice, which is inconsistent with, and reaches
different conclusions from the information presented in this report.
The information in Morgan Stanley Research is being communicated by Morgan Stanley & Co. International plc (DIFC Branch), regulated by the Dubai Financial Services
Authority (the DFSA), and is directed at Professional Clients only, as defined by the DFSA. The financial products or financial services to which this research relates will
only be made available to a customer who we are satisfied meets the regulatory criteria to be a Professional Client.
The information in Morgan Stanley Research is being communicated by Morgan Stanley & Co. International plc (QFC Branch), regulated by the Qatar Financial Centre
Regulatory Authority (the QFCRA), and is directed at business customers and market counterparties only and is not intended for Retail Customers as defined by the
QFCRA.
As required by the Capital Markets Board of Turkey, investment information, comments and recommendations stated here, are not within the scope of investment
advisory activity. Investment advisory service is provided exclusively to persons based on their risk and income preferences by the authorized firms. Comments and
recommendations stated here are general in nature. These opinions may not fit to your financial status, risk and return preferences. For this reason, to make an
investment decision by relying solely to this information stated here may not bring about outcomes that fit your expectations.
The trademarks and service marks contained in Morgan Stanley Research are the property of their respective owners. Third-party data providers make no warranties or
representations relating to the accuracy, completeness, or timeliness of the data they provide and shall not have liability for any damages relating to such data. The
Global Industry Classification Standard (GICS) was developed by and is the exclusive property of MSCI and S&P. Morgan Stanley Research or portions of it may not be
reprinted, sold or redistributed without the written consent of Morgan Stanley.
Morgan Stanley Research, or any portion thereof may not be reprinted, sold or redistributed without the written consent of Morgan Stanley.
64
MORGAN STANLEY RESEARCH
MORGAN STANLEY BLUE PAPER
The Americas
1585 Broadway
New York, NY 10036-8293
United States
Tel: +1 (1)212 761 4000
Ticker
ABY
CNA.L
FSLR.O
6971
6752
PNW.N
6753
EONGY-5
RWEG.DE
0750.HK
3800.HK
HE
JKS.N
NEP
RNEW11
SCTY
SWELECTES-IN
TERP
TSL.N
0968.HK
YGE.N
GCI.N
CPRE3
EIX
ENEL
GSZ.PA
LAIN.NS
6503
NRG.N
NYLD.N
NTPC.NS
PCG.N
RELI.NS
SRE.N
SSE
SUNE.N
TTPW.NS
TSLA
6502
WGSR.NS
ELET6
WCHG.DE
OCI.AS
Europe
20 Bank Street, Canary Wharf
London E14 4AD
United Kingdom
Tel: +44 (0)20 7425 8000
Company
Abengoa Yield PLC
CENTRICA PLC
First Solar Inc
Kyocera Corp
Panasonic Corp
Pinnacle West Capital Corp
Sharp Corp
E.ON SE
RWE AG
China Singyes Solar Technologies Holdings Ltd
GCL-Poly Energy Holdings Ltd
Hawaiian Electric Industries Inc
Jinkosolar Holding Co Ltd
Nextera Energy Partners LP
Renova Energia SA
SolarCity Corp
Swelect Energy Systems Ltd
TerraForm Power Inc
Trina Solar Ltd
Xinyi Solar Holdings Ltd
Yingli Green Energy Holding Company Ltd
Gannett Co Inc
CPFL Energias Renovaveis SA
EDISON INTERNATIONAL
Enel SpA
GDF Suez SA
Lanco Infratech Ltd
Mitsubishi Electric Corp
NRG Energy Inc
NRG Yield Inc
NTPC Ltd
PG&E Corp
Reliance Industries Ltd
SEMPRA ENERGY
Seventy Seven Energy Inc
Sunedison Inc
Tata Power Company Ltd
Tesla Motors Inc
Toshiba Corp
Welspun Corp. Ltd
Centrais Eletricas Brasileiras SA - Eletrobras
Wacker Chemie AG
Oci NV
© 2014 Morgan Stanley
Japan
4-20-3 Ebisu, Shibuya-ku
Tokyo 150-6008
Japan
Tel: +81 (0)3 5424 5000
Close Price
(as of 07/28/2014
39.80
315.20
64.05
4,982.50
1,239.00
56.29
331.00
19.65
31.24
11.48
2.62
24.20
25.85
34.30
40.99
72.57
438.05
33.35
11.36
2.14
3.50
33.21
12.92
56.62
4.24
19.68
9.40
1,357.00
31.35
53.96
149.05
47.10
1,005.60
101.54
24.20
20.95
101.25
223.57
461.10
84.10
11.20
91.06
28.25
Asia/Pacific
1 Austin Road West
Kowloon
Hong Kong
Tel: +852 2848 5200
USD
BPN
USD
JPY
JPY
USD
JPY
USD
EUR
HKD
HKD
USD
USD
USD
BRL
USD
INR
USD
USD
HKD
USD
USD
BRL
USD
EUR
EUR
INR
JPY
USD
USD
INR
USD
INR
USD
USD
USD
INR
USD
JPY
INR
BRL
EUR
EUR


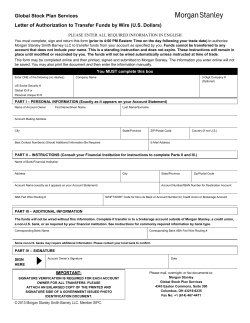


© Copyright 2026