
article
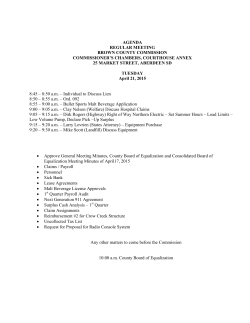
OfficeRank™ Research
Major structural surplus in office space
2015 | Structural surplus in office space
Space/employee - 2005
(current situation, on current total stock of 54.000.000 m²)
(including workplace, meeting, misc spaces)
17.000.000 m²
19 m²
2020 | Structural surplus in office space
Space/employee - 2015
(strengthening economy, increase in workforce, current stock)
(including workplace, meeting, misc spaces)
22.000.000 m²
15 m²
2025 | Structural surplus in office space
Space/employee - prognosis 2020/25
(strong economy, significant increase in workforce, current stock)
(including workplace, meeting, misc spaces)
22.000.000 m²
12 m²
The office market is under pressure from 3 parallel drivers:
- more effective use of space
- increasing productivity/virtual work environment
- aging workforce
These trends combined with the general economic
development ensure a growing vacancy rate.
Average occupancy in office space
(in fully leased space)
55 % - 60 %
The required space per employee has been in decline for
several decades. Through digitalisation (dropbox instead
of archives), micro-computing (tablet or laptop instead of
mainframe) and a changing work culture (teamwork in a
joint space instead of individual offices) the demand for
office space remains in strong decline. Hotdesking provides
further pressure, reducing the total space required even
more.
And finally the aging workforce is expected to stabilise in
the near future, creating a very large structural surplus of
office space.
Workforce development 2010 - 2040
(estimate by national bureau of statistics)
- 8%
Balance by municipality - percentage | 2015
Overschot en tekort per gemeente in 2015 op basis
van huidige beroepsbevolking, uitgedrukt in een
percentage van de kantoorvoorraad per gemeente.
Shortage:
Over 10%
0% to 10%
Surplus:
0% to 10%
10% to 20%
20% to 30%
30% to 40%
40% to 50%
Over 50%
Balance by municipality - percentage | 2020
Overschot en tekort per gemeente in 2020 op basis
van huidige beroepsbevolking, uitgedrukt in een
percentage van de kantoorvoorraad per gemeente.
Shortage:
Over 10%
0% to 10%
Surplus:
0% to 10%
10% to 20%
20% to 30%
30% to 40%
40% to 50%
Over 50%
Balance by municipality - total size | 2015
Overschot en tekort per gemeente in 2015 op basis van
huidige beroepsbevolking, uitgedrukt in oppervlakte
kantoorruimte per gemeente.
Shortage:
Over 10.000 m²
0 to 10.000 m²
Surplus:
0 to 5.000 m²
5.000 to 10.000 m²
10.000 to 20.000 m²
20.000 to 50.000 m²
50.000 to 100.000 m²
Over 100.000 m²
Balance by municipality - total size | 2020
Overschot en tekort per gemeente in 2020 op basis van
huidige beroepsbevolking, uitgedrukt in oppervlakte
kantoorruimte per gemeente.
Shortage:
Over 10.000 m²
0 to 10.000 m²
Surplus:
0 to 5.000 m²
5.000 to 10.000 m²
10.000 to 20.000 m²
20.000 to 50.000 m²
50.000 to 100.000 m²
Over 100.000 m²
Details
Hidden vacancy
The required office space per municipality provides an
indication of the viable part of the stock and inversely an
indication of the hidden/future vacancy.
The stock total does not include new construction and
Estimate for total office jobs
(2014, CBS)
2.270.000
demolition or transformation for the upcoming years. In
Workplace surplus
2014 the balance for the entire year was a decline in the
(based on average of 16 m²/workplace)
total stock of roughly 200.000 m².
This overview also excludes the long-term suitability of the
stock. The spatial impact of these new work environments
will not be feasible (technically or financially for every
building, which may increase the segment of the stock that
has no long-term viability.
1.050.000
Required population in The Nederland
(for full use of the current total stock)
24.600.000
(current situation, on current total stock of 54.000.000 m²)
Number of municipalities with surplus
over 100.000 m² (2015)
€ 22.000.000.000
40
Estimated market value of surplus - 2020
Province with largest surplus
(strengthening economy, increase in workforce, current stock)
(measured in %)
€ 28.000.000.000
Utrecht
Estimated market value of surplus - 2025
Province with largest surplus
(strong economy, significant increase in workforce, current stock)
(measured in m²)
€ 28.000.000.000
Noord-Holland
Estimated market value of surplus - 2015
OfficeRank™
Information and sources
CBS, CPB, EIB, OfficeRank™
Assumptions and source data
All data including our underlying assumptions
and calculations are available upon request.
Nederland
United Kingdom
Nieuwe Plantage 54-55
2611 XK Delft
One Royal Exchange
EC3V 3LL London
+31 (0)70 764 0725
+44 (0)20 3769 0760
[email protected]
www.officerank.com


© Copyright 2026