
One Planet, How Many People? A Review of Earth’s Carrying Capacity
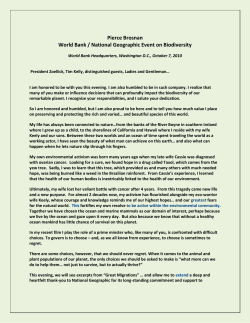
UNEP Global Environmental Alert Service (GEAS)
Taking the pulse of the planet; connecting science with policy
E-mail: [email protected]
Website: www.unep.org/geas
June 2012
Home
Subscribe
Archive
Contact
“Earthrise” taken on 24 December 1968 by Apollo astronauts. NASA
Thematic Focus: Environmental Governance, Resource Efficiency
One Planet, How Many People?
A Review of Earth’s Carrying Capacity
A discussion paper for the year of RIO+20
We travel together, passengers on a little
spaceship, dependent on its vulnerable reserves
of air and soil; all committed, for our safety, to its
security and peace; preserved from annihilation
only by the care, the work and the love we give our
fragile craft. We cannot maintain it half fortunate,
half miserable, half confident, half despairing, half
slave — to the ancient enemies of man — half free
in a liberation of resources undreamed of until this
day. No craft, no crew can travel safely with such
vast contradictions. On their resolution depends
the survival of us all.
~Adlai Stevenson, Speech to the UN Economic and Social
Council, Geneva, Switzerland (9 July 1965)(1)
The size of Earth is enormous from the perspective
of a single individual. Standing at the edge of an ocean
or the top of a mountain, looking across the vast
expanse of Earth’s water, forests, grasslands, lakes or
deserts, it is hard to conceive of limits to the planet’s
natural resources. But we are not a single person; we
are now seven billion people and we are adding one
million more people roughly every 4.8 days (2). Before
1950 no one on Earth had lived through a doubling
of the human population but now some people have
experienced a tripling in their lifetime (3). So many
people now inhabit the planet with so much impact that
scientists have coined a new word to describe our time,
the Anthropocene Epoch (4). Unlike previous epochs,
1
2000
AD
8000
BCE
10000
BCE
0
1200
AD
1500
AD
1 000
500
AD
2 000
400
BCE
1
AD
3 000
1000
BCE
4 000
2000
BCE
5 000
3000
BCE
6 000
4000
BCE
7 000
{
Historical World Population
5000
BCE
8 000
Julius Caesar
rules the
Roman Empire,
projected
285 million
people
7,000 million
The earliest on Earth
since 10 000 BCE
people
Japan becomes centralized ,
known solar
198 million people on Earth
calendars carved
6,000 million
people
by the Mayans,
Bubonic Plague
162 million people on Earth
million
begins, 443 million 5,000
people
people on Earth
Beginning of
Early cities in
Hieroglyphic
script
last ice age ending,
4,000 million
the Iron Age,
North Africa, Mesopotamia,
developed in Egypt,
people
5 million people
50 million people
and South Asia,
14
million
people
on
Earth
3,000
million
on earth
on Earth
Kingdom of
people
7.5 million people on Earth
Zimbabwe,
Settled rice
million
405 million 2,000
people
Agriculture and
cultivation and
Stonehenge completed
people on 1,000 million
permanent settlements
basketry in China,
in England,
Earth
people
in Mesopotamia,
12.5 million people on Earth
27 million people on Earth
5 million people on Earth
6500
BCE
9 000
Estimated Millions of People On Earth
10 000
Figure 1: World population began accelerating about 4 000 years ago and has “exploded” in the past 1 000 years. Source: UNEP-GRID Sioux Falls;
population data – US Census Bureau 2011.
where various natural regimes of geological processes
defined the time periods, the Anthropocene is named
for escalating human influence on the environment.
The release of CO2 into the atmosphere is beginning
to alter the global climate. Species are going extinct
at a rate 100 to 1 000 times above the natural rate.
The scale of human appropriation of the products of
photosynthesis—the most fundamental process of the
biosphere—has reached around one-quarter to one-third
of all global Net Primary Production (see box 1). We have
become a major “global geophysical force” (5).
After roughly 100 000 to 200 000 years of modern
humans remaining at very low numbers (and with a
very minimal impact on the planet), our numbers began
to grow around 4 000 years ago. That growth began to
accelerate over the following centuries until we were
adding more people each year than had ever lived on
Earth at one time prior to 500 BCE (87 million added
in 1989) (2). While the rate of population growth in
percentage terms is estimated to have peaked in the
1960s, the absolute number of people added each year
continues to be staggering (2). The most recent billion
arrivals were added in about 13 years; it took 12 years
for the billion before that and 13 years for the billion
before that. Even though the global growth rate peaked
more than 40 years ago, it is estimated that there will
be another billion added over the next 15 years and yet
another billion before mid-century (6). The UN Population
Division’s “medium-variant” projection for the end of the
century is now 10.1 billion (6)!
Increasing Per Capita Impact
While global population has doubled since the 1960s,
per capita GDP has grown to more than 10 times what
it was then (7). Per capita income for millions in the
developing world including India and China is growing
rapidly, creating enormous demand for material goods
2
and services (7). Life expectancy has also increased
globally —by almost 20 years (8). That puts twice as many
people on the planet, living about 40 per cent longer and
each person consuming many times what the average
person in the 1960s did. Most developing economies are
striving to close the gap between their living standards
and those of developed economies. However, it has
been estimated that “if everyone lived the lifestyle of
the average American we would need five planet Earths”
to provide the needed land and ecosystem goods and
services (9). Living standards and consumption need
not be directly equivalent to environmental impact (10).
While population is a multiplier of per capita impact,
technological advances in efficiency can be a divisor
of per capita impact. However, so far development
of technologies that can deliver goods and services
efficiently enough to stabilize environmental impact
in the face of rapidly growing population remains a
profound challenge (10). In other words, population
growth is multiplying per capita impacts faster than
technology (the divisor) is mitigating environmental
impacts. It is not surprising that concerns about the
number of people the Earth can support have reemerged in the past decade.
How Many People Can We Fit
On Spaceship Earth?
Speculation about the ultimate carrying capacity of the
planet dates back at least to the 17th century. Dutch
scientist Antoni van Leeuwenhoek (1632-1723) estimated
that if the population of Holland in his day (one million
people) were extrapolated across the estimated area
of inhabitable land around the globe, it would equal
13 billion people (11). Since then many more estimates
have been made as to how many people the Earth could
support (11,12). The range of these estimates is enormous,
Many other studies have assumed
a single constraining factor to estimate
population limits (11), such as the
maximum population that could be
supported by the available food. These
estimates could only be as valid (or
invalid) as that assumption of a single
constraining factor and the method
of calculating limits of that assumed
constraint (e.g. food supply).
A more sophisticated variation of
this method assumed a set of multiple
possible constraints (say food, water
and fuel), and whichever of these was
in shortest supply would set the limit of
population (11). This allowed for different
constraints to be limiting in different
locations, as in water in deserts or land
area on an island.
A still more sophisticated
approach identifies several constraining
factors and also takes account of the
interdependence of these variables (11).
This is the approach of dynamic systems
modeling which develops a set of
defined relationships for multiple factors
reflecting their influence on each other
and ultimately on the limits of population
(11). The degree to which humankind
can change its interaction with the
environment through technology cannot
be foreseen. For example, availability
of fossil fuels impacts food production
through fertilizer production, pumping of
irrigation water, use of farm machinery,
Figure 2: Estimates of Earth’s carrying capacity vary dramatically as this survey of 65
different estimates shows.
and so on. Current manufacturing
methods for fertilizer production rely
and rather than converging toward a narrower range over
heavily
on
natural
gas. Guesses about future availability
time, they have if anything, become more wide ranging
and cost of natural gas depend on assumptions about
in recent decades (13). A study looking at 94 different
future technological advances in efficiency. Alternatively,
estimates of the upper bounds of Earth’s population
if an economically viable substitute for natural gas in the
found estimates ranging from a low of 500 000 000 to a
production of fertilizer could be found, then natural gas
high of 1 000 000 000 000 000 000 000 (11).
as a constraint on food production would be diminished
Why do these estimates vary so dramatically? Part
or eliminated. These uncertainties must be incorporated
of the variation comes from the differences in methods
into estimating future agricultural land use efficiency and
used (at least six) to estimate the limits of human
by extension affect whether or not available farmland is
population on Earth (11). One method was the above
ultimately an important constraint on population.
mentioned approach used by Leeuwenhoek. A problem
As methods of estimating an upper limit for human
with this method is that it must assume the initial
population have become more sophisticated they have
populated area to be a valid example of a population
had to incorporate more factors, which often can only
which has reached the limits of its environment. This
be estimated or have uncertain values. Natural limits,
approach also assumes that the factors and dynamics
such as those imposed by the climate system, are not
constraining population in this sample area would apply
fully understood and must be estimated from imperfect
for other areas.
3
models. We do not know how much CO2 can be released
into the atmosphere before it may cause an abrupt
change in the environment, for example. And, it is not
yet possible to say with certainty how much rise in
surface temperature there could be before the Antarctic
Ice sheets would be at risk of collapse.
Individual and societal choices as to the level
of material that is “necessary” for well being and the
deprivations that would be tolerated in the future can
be estimated within some plausible range, but cannot
be known for certain. How much food, medicine, heat,
clothing, shelter and water do we assume is required
for each future inhabitant? How evenly can these
be distributed?
In the end, the outcome of attempts to define
a static ceiling for sustainable human population
seems destined to uncertainty. However, rather than
estimating a static upper limit of human population, it
might be more important to understand the dynamics
of the complex system upon which the survival of
that population depends. Models that capture the key
dynamics of the Earth system can serve as a map for
choices that will impact our collective future (however
many of us there ultimately are).
Modeling Our Future On Earth
In the early 1970s a group of computer scientists at the
Massachusetts Institute of Technology (MIT) developed
just such a model to help use define safe limits to our
impact on the Earth system. Jay Wright Forrester was a
computer engineer at MIT and the founder of “System
Dynamics,” a modeling approach for studying complex
systems. Forrester realized that advances in computers
he used for modeling of economic systems might
enable modeling of the global economy and the global
ecosystem as a single complex system (14). At the same
time, a set of Forrester’s colleagues at MIT, headed by
Dennis Meadows, also began working on the same type
of global models (14). The teams worked independently
publishing their work in 1971 (Forrester’s “World
Dynamics”) and 1972 (Meadows and others’ “The Limits
to Growth”).
The authors had simulated the relationships of
several of the Earth System’s key processes over time,
and both teams came to similar conclusions. They found
that Earth’s economic system tends to stop growing
and collapse from reduced availability of resources,
overpopulation, and pollution at some point in the
future. Various scenarios of technological innovation,
population control, and resource availability could delay
the collapse, but only a “carefully chosen set of world
policies designed to stop population growth and stabilize
material consumption could avoid collapse” (14).
The books were quite successful, particularly
Meadows’ book “The Limits to Growth,” which was
written for the layperson and translated into several
languages (14). Many in the sciences responded
enthusiastically and many tried to adapt the
groundbreaking technical approach to their own fields
of study (14). But in spite of their popularity, criticism
came from several directions as well. Many critics saw a
political meaning in the works (15), many dismissed it as
alarmist (16), but the most enduring push-back came from
mainstream economists (16).
In the past decade, however, many have begun
to revisit the Limits to Growth and “world modeling”
of Forester and Meadows (14,16,17,18,19,). Several have
pointed out that the projections of the Meadows’
World3 model’s “business as usual” scenario are proving
to be remarkably close to reality for the 40 years since
they were first published (14,17,19). New science, including
advances in modeling dynamic systems such as the
Earth System, is trying again to see what might lie in
the future (14).
Living in the Anthropocene
Figure 3: The Limits to
Growth was released in
1972 selling millions of
copies and drawing both
accolades and criticism.
The Club of Rome
4
The past 10 000 years, a period known as the Holocene
to geologists, has given humankind a relatively stable
environment during which human civilization and
population have flourished. Human activity is now
having important influence on the Earth’s climate (20)
and ecosystems (5,21). To most of the scientists studying
the planet it has become increasingly evident that there
are limits to the human impact that our Earth System
can absorb and still remain in that Holocene-like state.
Several crucial processes are believed to have thresholds
which, once passed, could trigger abrupt and/or
irreversible environmental changes at a global scale (22).
A ZOTE
It is feared that these changes could
cause the stable environment of
the Holocene to transition to a new
state which could be detrimental or
even catastrophic to humankind (23).
Climate change, caused by
increasing atmospheric CO2, is the
most widely known of these limits.
However it is not the only limit that
scientists are concerned about. In
particular one group of scientists
working together through the
Stockholm Resilience Centre has
identified nine such key processes in
the global ecosystem which they feel
are being altered enough by human
activity to put the stability of the
Earth System at risk (23). The graphic
(Figure 4) shows those nine Earth
System processes. Several of these
are global in scale, such as climate
Planetary Boundaries: the nine red wedges represent an estimate
change, ocean acidification, and
of the current position of each boundary. The inner green shading
stratospheric ozone. These can be
represents the proposed safe operating space.
understood as “top-down” in their
Figure 4: The Stockholm Resilience Centre’s Planetary Boundaries Framework identifies nine
impact. Others among the nine are
key Earth processes which serve as a sort of set of safety gauges for the Earth System.
local or regional processes which
likewise have local and regional
are primarily contributing factors in the sense of added
thresholds, but whose aggregate influence is important
stress—for example, climate change. On the other hand,
at the global scale. These could be understood as
some processes may also diminish the system’s ability
“bottom-up” in their global impact.
to absorb change, such as land use change. All of the
One of the ideas most emphasized by the
processes are interconnected and the uncertainty about
Stockholm Resilience Centre is the susceptibility of key
change in one process then introduces uncertainty
Earth System processes to “tipping points.” They believe
into the whole system model. Because of this it is not
that exceeding these thresholds risks triggering abrupt
possible to pinpoint exact thresholds where change in
environmental change. Think of the Earth System as a
these processes would trigger a change in the state of
bus that is overloaded (Figure 5). Up to a point each new
the system. To return to the bus metaphor, we would
rider has a “linear” impact—causing the bus to tilt a little
have to know the weight of each passenger, the speed
more when it turns. No one pays much attention when
that the bus will travel in the future, the degree of turns
another and then another rider climb on the bus. After
the bus will make in the future, the condition of the
all it just seems to cause the bus to tilt a little more each
time. Then at some point, just one more added rider
causes the bus to overturn as it rounds a corner. What
had up to that point had a linear impact—one passenger
equals a little more tilt—reaches a tipping point—one
passenger equals an overturned bus. Continuing with
the metaphor, several factors can influence the tipping,
such as speed, weight of the passengers, condition of
the suspension, sharpness of the turn, and so on. Some
of these are contributing factors to the stress on the bus
(e.g. weight of passengers) and others are factors which
reduce the busses ability to handle that stress (e.g. the
condition of the suspension).
Shayan/Flickr (Modified)
In a similar way some of the nine processes that
Figure 5: Like an overloaded bus, the Earth System is subject to
tipping points where linear additions of stress can lead to nonare identified by the Stockholm Resilience Centre’s work
linear outcomes.
5
suspension, and many other factors to know precisely
when the bus will tip over. However, we can see that the
bus is approaching that threshold as it tilts farther and
farther with each added passenger.
The point where the risk becomes intolerable, for
either the bus or the Earth System, is not a clear black
line. For the Earth System, we do not know the future
state of several of the interconnected processes, such as
land cover change and future CO2 emissions. This makes
it impossible to give that precise number of passengers
where the “bus will tip over” but it may allow us to set a
limit on passengers that minimizes the risk that it will.
That there are some unsustainable possibilities
which must be avoided is an emphasis of the Stockholm
Resiliency framework. It could be said that they have
devised and continue to refine a set of “safety gauges”
for the planet. Three of those gauges are already in the
danger zone and others are approaching it.
Another emphasis of the Stockholm Resiliency
Framework is (not surprisingly) resilience. In this context
they mean the Earth System’s capacity to withstand
perturbations without transitioning from the current
Holocene-like state to an alternate state (24). Resorting
again to a metaphor, think of the Earth System as an
airplane (Figure 6). It is flying along at a good speed,
at a good altitude, at the correct angle, and with a
manageable load on board. As long as all of these
parameters are within the design tolerances, the airplane
has a fair “margin for error”—it has resilience. If an
engine fails, the altitude allows our airplane to glide to
Paul Friel/Flickr
Figure 6: The stability and margin of error that an airplane gets by
maintaining proper speed, altitude and weight is a sort of general
resilience. In a similar way, maintaining the Earth System’s resilience
gives it a greater ability to withstand shocks and continue operating
in its current Holocene-like state.
6
a safe place for an emergency landing. If the nose of the
airplane gets too high, there is enough speed so that the
airplane will not immediately stall. Each parameter has
a point that if crossed will be enough to cause serious
trouble on its own (e.g. too much weight, too steep
a climb angle, too close to the ground, or moving too
slowly). In systems dynamics parlance this resilience
of a specific parameter as it relates to one or more
controlling factors is called specified resilience.
General resilience, on the other hand, is the overall
ability of a system to absorb shocks and remain within
its current state or “basin of attraction” (more dynamical
systems parlance). With a system as complex as the Earth
System, the shocks include those from all known factors
(e.g. the nine planetary boundaries) as well as novel ones
(the proverbial “black swans”). In a sense, maintaining
general resilience is a sort of insurance, a means of
hedging our bets. It is an implicit acknowledgement that
the problems of the whole Earth System are “simply too
complex and contingent for scientists to make definitive
predictions” about (25).
Planetary Boundaries
The Planetary Boundaries framework seeks to define safe
limits for human impact on key Earth System processes
that will keep us from crossing the thresholds of tipping
points and to help us maintain the overall resilience
of the Earth System. The roughly 50 scientists of the
Stockholm Resilience Centre come from 19 organizations
around the world and have published their work to, “lay
the groundwork for shifting our approach to governance
and management . . . toward the estimation of the safe
space for human development. Planetary boundaries
define, as it were, the boundaries of the ‘planetary
playing field’ for humanity if we want to be sure of
avoiding major human-induced environmental change on
a global scale” (23). They propose that boundaries be set
at the lower limit of the zone of uncertainty for key Earth
System processes. Going beyond this line would take us
into the zone of uncertainty where surprises in the state
of one of the key Earth System processes could push us
over a threshold to an abrupt change in the whole
Earth system.
Staying within these limits, on the other hand,
should ensure continued stability of Holocene-like
conditions for thousands of years (22).
Unfortunately, scientists at the Stockholm
Resilience Centre believe that three of these safe
boundaries have already been passed: climate change,
rate of biodiversity loss, and changes to the global
nitrogen cycle (22). The climate change boundary
established by the group is 350 ppm atmospheric
CO2. Concentrations above this “increase the risk of
Figure 7: The Resilience Centre’s “planetary boundaries” are not clear black lines but rather zones where the risk of reaching a tipping point
must be avoided.
irreversible climate change, such as the loss of major
ice sheets, accelerated sea level rise and abrupt shifts
in forest and agricultural systems.” Current atmospheric
CO2 concentration has recently reached 400 ppm (26) and
is rising nearly 20 ppm per decade (27).
A second boundary already passed is loss of
biodiversity. While it is clear that biodiversity is an
important component of ecosystem resilience, the
authors suggest that more research is needed to define
a more certain boundary. As a provisional boundary they
propose 10 times the natural rate of extinction. However,
they are confident that the current rate of extinction is
unsustainable at between 100 to 1 000 times the
natural rate.
The third boundary that is estimated to have
already been exceeded is for the nitrogen cycle and more
generally for the nitrogen and phosphorus cycles. These
are important nutrients with central roles in both natural
and agricultural productivity. The authors estimate that
human activities currently convert around 120 million
tonnes of nitrogen from the atmosphere each year into
reactive forms (for fertilizer and from cultivation of
leguminous crops) exceeding the conversion by all land
based natural processes. An estimated 20 million tonnes
of phosphorus is mined for agricultural and industrial
use. Much of this agricultural pollution ends up in the
environment. Nitrogen pollutes “waterways and the
coastal zone, accumulating in land systems and adding
a number of gases to the atmosphere [and] . . . slowly
erodes the resilience of important Earth subsystems” (22).
As much as 45 per cent of the mined phosphorus ends
up in our oceans (22).
The Stockholm Alliance acknowledges that their
proposed framework is in many ways an extension of
past work such as the Limits to Growth systems modeling
(28), the Precautionary Principle (29), and the Tolerable
Windows Approach (30), to name a few (22). However,
they point out several ways in which the Planetary
Boundaries Framework advances from these earlier
works (23). In contrast and perhaps to some degree in
response to the criticism of non-specificity of the Limits
to Growth, the Planetary Boundaries framework has
identified the specific processes which they believe
must be kept within defined safe limits for humanity
to operate safely on planet Earth (23). Also in contrast
with the Limits to Growth, the Planetary Boundaries
framework recognizes the threat posed by non-linear
changes that could result from crossing thresholds (23).
Limits to Growth did not foresee this type of abrupt
change or non-linear system response (23).
The Stockholm Resilience Centre is not the only
organization addressing environmental limits. Another
widely known approach to conceptualizing human
pressure on the Earth System is the Global Footprint
Network. Its “Ecological Footprint” is a measure of
human impact on the planet. It is expressed as a budget
where resources consumed and waste generated are
balanced against nature’s capacity to generate new
resources and absorb waste (9). While it has many
similarities to the concept of carrying capacity, Ecological
Footprint accounting approaches the question from a
different angle. Ecological Footprints are not speculative
estimates about a potential state, but rather are an
accounting of the past. Instead of asking how many
people could be supported on the planet, the Ecological
Footprint asks the question in reverse and considers only
present and past years, using historical data sets (see
Box 2). This makes the Ecological Footprint less uncertain
7
than dynamical systems modeling; however, it avoids
that uncertainty by not trying to predict the future.
Wherever humanity chooses to look at what might lay
ahead there will be uncertainty.
The dynamical systems modeling of climate and
other natural processes which Meadows and Forester
developed and which the Planetary Boundaries approach
relies on, includes uncertainties and at best is able to
recognize and define the range and nature of those
uncertainties. Nevertheless, by understanding these
uncertainties and the appropriate applications for
models and simulations we can begin to take a qualified
look into the future. Among the greatest values of these
models is their ability to explore many ways which
the future may unfold and to develop insights into
the dynamics which affect that unfolding. Models can
help us prepare for those possible futures by testing
various responses to what they suggest and by avoiding
responses (or lack of responses) which are indicated to
have high risks.
Future Role of Technology?
One of the greatest sources of uncertainty, and a focus
of considerable disagreement, is the development of
future technologies. Many, including most mainstream
economists, are quite optimistic about human ingenuity
and technological advances to overcome challenges
posed by population growth (16,31). According to this
view, the “invisible hand” of the market system will
spur any innovations necessary to substitute for natural
capital such as land, sources of energy, minerals and
so on (32). They acknowledge that resources are limited
but assume that technology will continue to increase
our efficiency in utilizing those resources (and in finding
substitutions) such that production could keep growing
even in the presence of declining mineral resources
and other constraints (14). In the 1970s, one of the key
advocates of this point of view, Robert Solow of MIT,
stated that, “There really is no reason why we should
not think of the productivity of natural resources as
increasing more or less exponentially over time” (32).
Several environmental economists find fault
with this blind faith in innovation and technological
development (16,31,33,34). They contend that mainstream
economics tends to ignore the laws of biophysics in
its formulation of production (35). In a growth model
with environmental constraints, clean technological
development needs to be directed and encouraged while
“dirty innovation” should be discouraged (36). Globally,
there are large disparities in capacities to both generate
technology and absorb new technologies. Building
local capacity must be a central aspect of technological
development (37). Government support is essential to
8
create national systems of innovation (37). Thus, the
invisible hand is a merely theoretical concept. In reality,
markets are regulated by visible hands. Governments
have a role to play in designing the legal frameworks
within which competition takes place; setting product
standards, taxes and subsidies; and encouraging green
technology development. Nevertheless, while many
contemporary academic economists accept and address
these issues in their work, environmental constraints
continue to remain largely absent in the thinking of much
of applied economics used in formulating policy (38).
Future Demographic Transitions?
In the past, people have also argued that concerns over
world population will dissipate as countries undergo the
demographic transition. Peak global population growth
rates of 2.1 per cent occurred in the 1960s followed by
a peak in the absolute number of people being added
each year at 87 million 25 years later (2). This slowing in
global average population growth was the outcome of
a dramatic drop in birth rates among the world’s most
developed countries; many dropping to replacement
level or even below (39). It is very widely accepted that
this phenomenon, part of something demographers call
the demographic transition, reliably occurs in countries
as they become developed (Figure 8) (40,41). This
assumption is incorporated into estimates that project
world population leveling off just above nine billion by
the middle of this century (39,40). In general, projections
of future population also assume that the economic and
social development which is an important dimension of
demographic transition, can and will occur in many of
the world’s poorer countries (39,40).
This suggests a crucial dilemma for policy makers.
The prevailing assumption about population growth
rates is that as the developing countries achieve greater
development their population growth rate will slow
(the demographic transition described in Figure 8).
This would mean an easing in the number of people
putting pressure on the Earth System. So far, so good.
However, developed countries also have larger ecological
footprints and elevated levels of consumption. Thus
while population growth will decline during demographic
transition, the reduced number of consumers may have
an equally large impact on the Earth System. A further
problem is that the steady progress of global GDP, which
is taken as evidence that development will eventually
reach the entire world, has so far been built on cheap
energy—primarily oil.
Several researchers studying population
dynamics have begun to question the inevitability of
these development trends continuing and leading
most countries through demographic transition
Demographic Transition Model
schematic representation
Stage 1
Stage 2
Stage 3
po
Stage 4
la
death
rate
tio
n
in
cr
ea
se
?
birth rates drop to
near death rates,
stablizing population
death rates are lowered,
birth rates eventually follow,
period of rapidly growing population
high birth rates,
high death rates,
stable population
?
total
population
birth
rate
pu
Stage 5 ?
?
Figure 8: Demographic transition has occurred in parallel with (and presumably because of) social and economic development in the world’s
most developed countries. Most population projections assume it will occur in many currently developing nations. Source: UNEP-GRID Sioux Falls –
generalized from multiple sources.
(40,41,42,43,44,45,47).
In some countries, population
growth itself is serious challenge to economic and
social development, as an ever-increasing number of
employment opportunities and services are needed to
meet the needs of the population. A further problem
is that as the world’s supply of cheap oil declines,
increasing energy costs will hinder economic and social
development, which are presumed to be important
drivers of demographic transition (40,45,46,47). Researchers
warn that large amounts of cheap energy are needed to
Oil Production, Global Per Capita GDP and Population Growth Rates
2.0 %
1.5 %
al
G
b
lo
lO
ba
Glo
Gro
wth
Rat
e
ta
1.0 %
on
cti
u
rod
il P
i
ap
rC
9000 $US
80
8000 $US
70
7000 $US
60
6000 $US
DP
50
5000 $US
G
projected
population
growth rate
4000 $US
Pe
40
30
3000 $US
0.5 %
20
2000 $US
10
1000 $US
2040
2030
2020
2010
2000
1990
1980
1970
1960
0%
1950
million barrels per day
Glo
bal
Ann
ual
Pop
ula
tion
90
peak oil?
0
2050
annual global population growth rate
2.5 %
Figure 9: Global GDP has risen with global oil production. The global economic development reflected in per capita GDP is linked to lower birth
rates and population growth by the demographic transition concept.
9
drive development (35,40,47,48). The historical reality of
the relationship between per capita energy consumption
and per capita GDP is illustrated in the graph above. As
we reach (or have reached) “peak oil” (49), there is good
reason to question the sustainability of the current trend
of rising global per capita GDP, barring the emergence of
a cheap and abundant alternative energy source (40,45).
All of this suggests that demographic transition
may not be inevitable and that population growth and
the question of carrying capacity may still be important
concerns. Complacent reliance on demographic
transition, however politically acceptable it might be, is
highly problematic. The current population is believed
by many to overshoot the Earth’s capacity to sustainably
support it already (9,18). To bring developing countries
up to consumption levels of developed countries—and
thereby trigger demographic transition—would magnify
per capita impact on top of an increasing number
of consumers.
Prediction is Difficult, Especially
About the Future
Certainty about what the future will bring is beyond the
reach of dynamical systems modeling or economics. With
the exception of fortune tellers, most people accept that
predictions all fall along a continuum between guesses
and educated guesses. Perhaps then the best that can
be hoped for is to make well educated guesses and to
understand that that is what they are.
History teaches us that predictions are uncertain
and that they become increasingly so the further into
the future they are made. Perhaps just as importantly,
solutions extending forward to those predicted futures
are uncertain as well. Committing to those uncertain
solutions often requires trade offs and sacrifices between
haves and have-nots, between current and future
generations. As the highly respected ecologist Edward
O. Wilson, pointed out, “The human brain evidently
evolved to commit itself emotionally only to a small
piece of geography, a limited band of kinsmen, and two
or three generations into the future . . . We are innately
inclined to ignore any distant possibility not yet requiring
examination” (50).
A strategy to overcome paralysis that can prevent
addressing long-term problems has been suggested by
the analysis of an economist, a physicist, and a computer
scientist at the Rand Corporation (25). Referring to work
by Herbert A Simon, Popper suggests that rather than
choose the solution which would be optimal under
the scenario which we consider to be most likely, most
human beings tend to choose solutions which will
be sub-optimal but acceptable under several
conceivable scenarios.
10
Popper and colleagues suggest applying this insight
as we try to arrive at practical solutions to environmental
problems (25). Each side in this argument has committed
to a paradigm which at least in broad terms predicts a
distant future. Concomitant with that paradigm is an
implied range of solutions which are optimal for the
respective paradigm’s accepted scenarios of the future,
but which take no account of the outcome under the
countervailing scenario. Ironically the more detailed
(and thus actionable) these predictions are the more
likely that they will be wrong. The uncertainty of each
paradigm’s projected future and the political difficulty
of committing to either “all-in” solution paralyzes policy
makers and as a consequence “the world’s long-term
threats often get ignored altogether or are even made
worse by shortsighted decisions” (25). Popper and his
colleagues suggest a strategy which they say better suits
real-world uncertainty. They suggest a robust decision
making strategy which seeks the solution that will stand
up under most imaginable scenarios, even if it is not the
ideal solution under any single scenario. In their
own words:
Traditional predict-then-act methods treat the
computer as a glorified calculator. Analysts select
the model and specify the assumptions; the
computer then calculates the optimal strategy
implied by these inputs.
In contrast, for robust decision making the
computer is integral to the reasoning process. It
stress-tests candidate strategies, searching for
plausible scenarios that could defeat them.
No strategy is completely immune to uncertainty,
but the computer helps decision makers exploit
whatever information they do have to make
choices that can endure a wide range of trends
and surprises.
Experience tells us there is a good chance that most
predictions about the future will be wrong. However,
choosing policy that is robust for all of the plausible
scenarios we can imagine may offer our best chance
of making decisions that can “meet the challenges
presented by what actually comes to pass” (25).
Can We Work It Out?
In summary, it could be said that solutions from three
different paradigms have been put forward to resolve
the collision of population growth with resource
limitations (11). Mathematician and author Joel Cohen
characterized them as follows:
1) “a bigger pie”
This is the technological solutions approach, which finds
alternative sources of energy and materials and greater
Figure 10: How do we share the “pie”?
efficiencies to provide for a larger number people
on Earth.
2) “fewer forks”
This approach is based on the demographic transition,
the slowing or stopping of population growth to have
fewer people dividing the metaphorical pie.
3) “better manners”
This approach is to rationalize and improve the
connection between the decisions and actions taken by
people and the consequences of those actions, so we
remain within key planetary boundaries. This approach
includes such things as defining property rights to openaccess resources, elimination of economic irrationalities,
improving governance and perhaps even imposing some
of the “externalized” costs of having children on the
people making the decision to have more children, to
create a downward bias on the decision (11).
Cohen suggests that none of the solutions are
adequate in themselves and that likely all of them must
be a part of any sort of sustainable future. To arrive
at pragmatic “robust decision” strategies, we should
test solutions against the range of scenarios and find
ones that would be well suited to several possible
futures. For example, among the many factors which
drive demographic transition, increased education,
particularly for young girls, is a strategy that seems to
be robust across all three paradigms of the resources/
population issue. The “bigger pie” paradigm, which
counts on innovation and technology, would presumably
be agreeable to educating future innovators. The “fewer
forks” paradigm, which seeks to limit population, would
be on board because of the established association
between increased levels of education and lowered
birth rates. The “better manners” paradigm (or some
portion of it) would likely be open to schooling for
children in developing countries that would presumably
be accomplished by and contribute to a more
equitable distribution of global resources while
encouraging a lower birthrate. Pragmatic
strategies such as Poppers’s robust
decision making approach may allow
us to make decisions that—while not
ideal for any one future scenario—
will yield an acceptable outcome
regardless of which predictions about
the future are closest to correct.
In fact, it may be the case that
most approaches to slowing population
growth are well suited to pragmatic
compromises, acceptable among the three “pie
sharing” paradigms. Cohen summarizes the six principal
approaches to slowing population growth as: “promoting
contraceptives, developing economies, saving children,
empowering women, educating men, and doing
everything at once” (13). These approaches would seem
to offer many opportunities for action that could meet a
variety of goals and be acceptable to a range of possible
futures. As Oxford economist Robert Cassen says,
“Virtually everything that needs doing from a population
point of view needs doing anyway” (13). Perhaps in the
end, reconciling the paradigms is not as important as
accepting the limits of our ability to predict the future
with certainty, and then making robust, pragmatic
decisions that will hold up under a variety of futures.
Adopting a more humble idea of our ability to predict the
future, we can still work to build and maintain resilient
natural and social systems well suited to whatever the
future brings.
So, One Planet, How Many People?
The human footprint has grown to such a scale that it
has become a major geophysical force. While there are
many ways we might reduce our per capita footprint
on the planet, the collective impact of those footprints
will always be multiplied by global population. This
makes population an issue which cannot be ignored.
While there is an incredible range to the estimates of
Earth’s carrying capacity, the greatest concentration of
estimates falls between 8 and 16 billion people (3). Global
population is fast approaching the low end of that range
and is expected to get well into it at around 10 billion
by the end of the century. Many of us alive today will be
alive when the planet is carrying (or not carrying) nine
billion people.
Speculation about global population and carrying
capacity has existed since at least the 17th century.
This century has seen the establishment of the UN
Economic and Social Council Population Commission,
established in 1946, and the creation of the World
Population Plan of Action (51). Dennis Meadows and his
11
colleagues at Massachusetts Institute of Technology
sparked discussion about the finite nature of the planet’s
resources (28). Critics accused the authors of “Malthusian
reasoning,” failing to allow for the social and economic
feedback mechanisms that could overcome scarcity
and environmental constraints (52,53). Polarized debates
continued until the Brundtland Report, Our Common
Future, argued that environment and development were
linked (54).
So where do we go from here? Scientists and
policy-makers are working together to develop reduction
targets for pollutants to our air, water, and soil to keep
our planet below critical tipping points. However,
these international policies need to be combined with
implementable solutions at regional, local, and individual
scales (55). Continued monitoring of changes in biotic
communities and reduction of per capita human impact
are needed to avert current trajectories (56). “The
plausibility of a planetary-scale ‘tipping point’ highlights
the need to improve biological forecasting by detecting
early warning signs of critical transitions on global as well
as local scales, and by detecting feedbacks that promote
such transitions” (56). Future projections from current
trends might not account for threshold-induced state
shifts due to human-induced forcings (56).
Today, in 2012, a variety of things are clear:
1) Population growth remains a major concern for
future well-being. There are many who feel that if
humankind cannot limit the number of people weighing
on the Earth System on humanity’s terms, then the Earth
System itself will set that limit on its own terms (18,57,58).
Raising the issue of population limits directly, however,
is often met with criticism and concern that any policy
directly aimed at reducing population may be coercive
and unfair (59,60,61). Not only are there significant political
barriers to addressing human population control directly,
but according to some it may even be counterproductive
(59). However, even among those who argue that a
direct approach to population does not belong in the
environmental policy discussion (59,62), there is general
acknowledgment that, “stabilizing the global population
is, and will remain, necessary” (62).
2) Material consumption is a major concern. Humans
are consuming resources and producing waste at
a greater scale than ever before and per capita
consumption levels are projected to increase with
continued development. As reported by the Royal
Society (2012)(63), “Population and consumption are both
important: what matters is the combination of increasing
population and increasing per capita consumption.” They
also recommend “developing socio-economic systems
and institutions that are not dependent on continued
material consumption growth” (63).
12
3) Demography is not destiny. While the UN medium
variant projection is 9.3 billion people by mid century,
high and low variant projections, based on plausible
scenarios, are 10.6 billion and 8.1 billion. Future trends
depend on today’s policies.
4) We must all play a role in finding human-centered,
rights-based policies: These policies must “respectfully
the principles agreed upon at the 1992 United Nations
Conference on Environment and Development
(UNCED) and, particularly, the principle of common but
differentiated responsibilities.”
5) This requires a three-pronged approach: Developed
countries have to take the lead in changing their
production and consumption patterns. Developing
countries should maintain their development goals
but do so while adopting sustainable practices and
slowing population growth. Developed countries should
commit to enable and support the developing countries’
sustainable development through finance, technology
transfer and appropriate reforms to the global economic
and financial structures.
6) We cannot simply rely on technological innovation
(the “bigger pie”) and demographic transition (“fewer
forks”) to eliminate or solve the population problem:
However, technological innovation and the demographic
transition, when supported by the dissemination
of green technologies and the creation of green
economies, can help achieve a sustainable future. Active
development strategies must be put in place to drive the
transformation towards new dynamic green activities.
7) We have existing methods that have proven to
be effective sustainable development tools: These
include providing access to sexual and reproductive
healthcare and contraception; investment in education
beyond the primary level for all genders; empowering
women to participate in economic, social and political
life; and reducing infant mortality. These measures
enable families to better decide on the number, timing
and spacing of children. Demographic change is the
result of individual choices and opportunities, and best
addressed by enlarging, not restricting, these choices
and opportunities.
8) We also have new tools and better models that can
be used to help us develop policies: However, in order
to become effective and implementable solutions, these
models need to be further refined and elaborated.
Additional research is needed.
Box 1
1 000 Tonnes of Grass x 7 Billion People
Three hundred trout are needed to support one
man for a year. The trout, in turn, must consume
90 000 frogs, that must consume 27 million
grasshoppers that live off of 1 000 tons of grass.
— G. Tyler Miller, Jr., American Chemist (1971)(63)
Net Primary Production (NPP) is one way of
measuring that grass. Scientifically speaking, NPP
is the amount plant material produced on Earth—
the net amount of solar energy converted to plant
organic matter through photosynthesis. It is the
primary fuel for Earth’s food web, and in terms of
carbon can be measured via the photosynthesis
process (i.e. CO2 exchange between atmosphere and
biosphere). The NPP has been called the “common
currency” for climate change, ecological, and
economic assessments. The rate at which humans
consume NPP is a powerful aggregate measure of
human impact on biosphere function.
Various studies have estimated that humans
now appropriate between 24 and 32 per cent of
global NPP for our own use (65,66,67,68). That means
less NPP is available in the form of grass and other
vegetation at the bottom of the food web, but it
also changes the composition of the atmosphere,
the level of biodiversity, and alters the provision of
important ecosystem services (68).
The term Anthropoocene refers to the
scale of human impact on all of the processes of
the Earth System. Human Appropriation of Net
Primary Production is a measure of human impact
jankie/Flickr
on the biosphere in particular. That humans now
appropriate between roughly one-quarter to onethird of all NPP is further evidence of the size of the
human footprint on Earth.
The map shows the percentage of NPP being
appropriated as a percentage of local NPP. In other
words it shows the local budget of NPP—available
NPP minus NPP appropriated. Some areas with little
NPP to appropriate (such as Saudi Arabia) and other
areas with many people to do the appropriating
(such as India) have areas of incredible deficits of
200 to 400 per cent of the local NPP. Presumably,
areas of ongoing deficit will increasingly rely on
effectively importing NPP in the form of food, fiber
and materials from areas which are not in deficit.
While the ultimate ceiling of total global NPP has
not been reached, the impact of localized deficits
are transmitted to the rest of the globe by these
economic connections. In addition, the reduced
resiliency in areas of deficit (for example a reduced
ability to withstand a season of drought) reduce
global resiliency.
Human Appropriation of NPP
as percentage of local NPP
0
0 - 20 percent
20 - 40 percent
40 - 60 percent
60 - 80 percent
80 - 100 percent
100 - 200 percent
200 - 400 percent
400 - 1,000 percent
1,000 - 40,000 percent
Imhoff, M.L., Bounoua, L., Ricketts, T., Loucks, C., Harriss, R., and Lawrence, W.T. (2004)
13
Box 2
Institut Escola Les Vinyes
Ecological Footprint
Conceived in 1990 by Mathis Wackernagel and
William Rees at the University of British Columbia,
the Ecological Footprint is a widely used measure
of the demands being made on nature by human
activities. It measures how much land and water
area a human population requires to produce the
resources it consumes and to absorb its carbon
dioxide emissions, based on current technology. This
central idea of “footprint science” is in some respects
similar to carrying capacity. However, carrying
capacity estimates require assumptions about future
per-person resource consumption, standards of living
and “wants” (as distinct from “needs”), productivity
of the biosphere, and advances in technology. An
The ecological creditor and debtor map for 2007 compares the Ecological Footprint of consumption with domestic biocapacity.
Source: Ewing and others 2010
14
area’s carrying capacity for humans is thus inherently
speculative and difficult to define.
Ecological Footprint accounting approaches the
carrying capacity question from a different angle.
Ecological Footprints are not speculative estimates
about a potential state, but rather are an accounting
of the past. Instead of asking how many people
could be supported on the planet, the Ecological
Footprint asks the question in reverse and considers
only present and past years. The Footprint asks how
many planets were necessary to support all of the
people that lived on the planet in a given year, under
that year’s standard of living, biological production
and technology. This is a scientific research
and accounting question that footprint science
approaches through the analysis of documented,
historical data sets. Also the challenge lies in
the Ecological Footprint’s reliance on ecosystem
functions, which, aside from varying spatially, are
in a state of continual change with respect to their
capacities due to variations in (and interactions with)
land use, weather and climate.
A key concept of footprint science is ecological
overshoot. This occurs when humanity turns
resources into waste faster than waste can be
turned back into resources. Overshoot may not be
immediately apparent because we are able to utilize
resources accumulated over time (or imported from
elsewhere in the case of local ecological footprints).
For example, fossil fuels which took hundreds of
millions of years to form are being utilized at rates far
beyond the Earth System’s capacity to replace them.
According to Wackernagel and colleagues,
humanity uses the equivalent of 1.5 planets to
provide the resources we use and absorb our waste.
This means it now takes the Earth one year and six
months to regenerate what we use in a year. This
rate of overshoot is an average for the whole globe
and hides the fact that some countries are in
serious overshoot while some others still have
surplus biocapacity.
Adapted from Footprint Network http://www.footprintnetwork.
org/en/index.php/GFN/ Accessed: 8 June 2012.
NASA
15
Acknowledgment:
Writers: Bruce Pengraa
Reviewers: Zinta Zommersb, Ashbindu Singhab, Michael Herrmannc, Marc Imhoffd and Michelle A. Luebkee
Production and Outreach Team: Arshia Chandera, Erick Litswab, Kim Giesea, Michelle Anthonya, Reza Hussaina, Theuri Mwangib
(a UNEP GRID Sioux Falls, b UNEP GRID Nairobi, c UNFPA, d NASA/GSFC, e UNEP RONA)
References:
1. Adlaitoday (no date) Adlai Today – Adlai Quotes Accessed April 9, 2012
at: http://www.adlaitoday.org/ideas/quotes_connect.html
2. US Census Bureau (2011) U.S. Census Bureau, International Data
Base Accessed April 19, 2011 at: http://www.census.gov/ipc/www/idb/
worldpopinfo.php
3. Cohen, J. E. (2003). Human population: the next half century. [Research
Support, U.S. Gov’t, Non-P.H.S.]. Science, 302(5648), 1172-1175. doi:
10.1126/science.1088665
18. Brown, L. R. (2005). Outgrowing the Earth: the food security challenge
in an age of falling water tables and rising temperatures: Earthscan.
19. Turner, G. M. (2008). A comparison of The Limits to Growth with
30 years of reality. Global Environmental Change, 18(3), 397-411. doi:
10.1016/j.gloenvcha.2008.05.001
20. IPCC (2007) The Physical Science Basis. Contribution of Working
Group I to the Fourth Assessment Report of the Intergovernmental
Panel on Climate Change, ed. S. Solomon, D. Qin, M. Manning, Z. Chen,
M. Marquis, K. Averyt, M.M.B Tignor, H.L. Miller Jr, and Z. Chen. 996 pp.
Cambridge, UK: Cambridge University Press.
4. Crutzen, P.J. (2002) Geology of mankind. Nature 415:23.
21. MEA (2005) Ecosystems and Human Well-being: General Synthesis.
Accessed April 9, 2012 at: http://maweb.org/en/index.aspx
5. Steffen, W., Persson, Å., Deutsch, L., Zalasiewicz, J., Williams, M.,
Richardson, K., . . . Svedin, U. (2011). The Anthropocene: From Global
Change to Planetary Stewardship. Ambio, 40(7), 739-761. doi: 10.1007/
s13280-011-0185-x
22. Rockstrom, J., Steffen, W., Noone, K., Persson, A., Chapin, F. S.,
Lambin, E. F., . . . Foley, J. A. (2009b). A safe operating space for humanity.
[10.1038/461472a]. Nature, 461(7263), 472-475.
6. UNPD (2010) World Population Prospects, 2010 Revision. United
Nations Population Divisions. Accessed May 10, 2011 at: http://esa.
un.org/unpd/wpp/unpp/panel_population.htm
7. World Bank (2011) World Development Indicators & Global
Development Finance. Accessed April 20, 2011 at: http://data.worldbank.
org/data-catalog/worlddevelopment-Indicators
8. UNPD (2011) United Nations, Department of Economic and Social
Affairs, Population Division (2011). World Population Prospects: The 2010
Revision, CD-ROM Edition. Accessed April 9, 2012 at: http://esa.un.org/
unpd/wpp/Excel-Data/mortality.htm
9. Ewing, B., Reed, A., Galli, A., Kitzes, J. and Wackernagel, M. (2010)
Calculation Methodology for the National Footprint Accounts, 2010
Edition. Oakland: Global Footprint Network.
10. UNEP (2011) Decoupling natural resource use and environmental
impacts from economic growth, A Report of the Working Group on
Decoupling to the International Resource Panel. Fischer-Kowalski, M.,
Swilling, M., von Weizsäcker, E.U., Ren, Y., Moriguchi, Y., Crane, W.,
Krausmann, F., Eisenmenger, N., Giljum, S., Hennicke, P., Romero Lankao,
P., Siriban Manalang, A.
11. Cohen, J. E. (1995a). Population growth and earth’s human carrying
capacity. Science, 269(5222), 341-346. doi: 10.1126/science.7618100
12. Van Den Bergh, J. C. J. M., & Rietveld, P. (2004). Reconsidering
the Limits to World Population: Meta-analysis and Meta-prediction.
BioScience, 54(3), 195-204. doi: 10.1641/0006-3568(2004)054[0195:rtltw
p]2.0.co;2
13. Cohen, J. E. (1995b) How Many People Can the Earth Support? : W.W.
Norton.
14. Bardi, U. (2011) The Limits to Growth Revisited. Springer, New York.
DOI 10.1007/978-1-4419-9416-5
15. Schoijet, M. (1999). Limits To Growth And The Rise Of Catastrophism.
Environmental History, 4(4), 515-530.
16. Hall, C. A. S. and Klitgaard, K. A. (2012). Are There Limits to Growth?
Examining the Evidence
Energy and the Wealth of Nations (pp. 207-220): Springer New York.
17. Simmons, M. R. (2000). Revisiting The Limits to Growth Could The Club
of Rome Have Been Correct, After All? An Energy White Paper. Retrieved
from http://greatchange.org/ov-simmons,club_of_rome_revisted.html
16
23. Rockström, J., W. Steffen, K. Noone, Å. Persson, F. S. Chapin, III, E.
Lambin, T. M. Lenton, M. Scheffer, C. Folke, H. Schellnhuber, B. Nykvist, C.
A. De Wit, T. Hughes, S. van der Leeuw, H. Rodhe, S. Sörlin, P. K. Snyder,
R. Costanza, U. Svedin, M. Falkenmark, L. Karlberg, R. W. Corell, V. J.
Fabry, J. Hansen, B. Walker, D. Liverman, K. Richardson, P. Crutzen, and J.
Foley (2009a) Planetary boundaries:exploring the safe operating space
for humanity. Ecology and Society 14(2): 32. [online] URL: http://www.
ecologyandsociety.org/vol14/iss2/art32/
24. Folke, C., Carpenter, S., Walker, B., Scheffer, M., Chapin, T., and
Rockstrom, J. (2010). Resilience Thinking: Integrating Resilience,
Adaptability and Transformability. Ecology and Society, 15(4), 20.
25. Popper, S.W., Lempert, R.J. and Bankes, S.C. (2005) Shaping the Future.
Scientific American 292(4), 66-71.
26. NOAA (2012) Carbon dioxide levels reach milestone at Arctic
sites: NOAA cooperative measurements in remote, northern sites hit
greenhouse gas milestone in April. Accessed June 12, 2012 at: http://
researchmatters.noaa.gov/news/Pages/arcticCO2.aspx
27. NOAA (2011) NOAA/ESRL calculation of global means, NOAA, Earth
System Research Laboratory, Global Monitoring Division. Accessed April 9,
2012 at: http://www.esrl.noaa.gov/gmd/ccgg/about/global_means.html
28. Meadows, D., Meadows, D., Randers, J. and Behrens, W. (1972). “The
Limits to Growth”. New York: Potomac
29. Kriebel, D., Tickner, J.A., Epstein, P., Lemons, J., Levins, R., Loechler,
E.L., Quinn, M., Rudel, R., Schettler, T. and Stoto, M. (2001) The
Precautionary Principle in Environmental Science. Environmental Health
Perspectives 109:871-876.
30. German Advisory Council on Global Change (WBGU) (1995) Scenario
for the Derivation of Global
CO2 Reduction Targets and Implementation Strategies, Bremerhaven.
31. Stern, D. I. (2011). The Role of Energy in Economic Growth. Annals of
the New Yourk Academy of Sciences 1219, 26-51 (working paper version).
32. Solow, R. M. (1973). Is the End of the World at Hand? Challenge, 16(1),
39-50.
33. Daily, G. C., & Ehrlich, P. R. (1992). Population, Sustainability, and
Earth’s Carrying Capacity. BioScience, 42(10), 761-771.
34. Reijnders, L. (1998). The Factor X Debate: Setting Targets for EcoEfficiency. Journal of Industrial Ecology, 2(1), 13-22. doi: 10.1162/
jiec.1998.2.1.13
35. Hall, C., Lindenberger, D., KÜMmel, R., Kroeger, T., & Eichhorn, W.
(2001). The Need to Reintegrate the Natural Sciences with Economics.
BioScience, 51(8), 663-673. doi: 10.1641/0006-3568(2001)051[0663:tntr
tn]2.0.co;2
36. Aghion, P., Acemoglu, D., Bursztyn, L. and Hemous D. (2011) The
Environment and Directed Technical Change. GRASP Working Paper 21.
Accessed April 30, 2012 at: http://www.economics.harvard.edu/faculty/
aghion/files/Environment%20and%20Directed.pdf
37. Ocampo, J.A. (2012) The Transition to a Green Economy: Benefits,
Challenges and Risks from a Sustainable Development Perspective.
Summary of Background Papers. UN-DESA, UNEP, UN Conference on
Trade and Development.
53. Simon J and Kahn H eds. (1984). The resourceful Earth: a response to
the global 2000 report. Basil Blackwell: New York.
54. World Commission on Environment and Development (1987) Our
Common Future. Oxford University Press
55. DeFries, R., E. Ellis, F. S. Chapin III, P. Matson, B. L. Turner II, Arun
Agrawal, P. Crutzen, C. Field, P. Gleick, P. Kareiva, E. Lambin, E. Ostrom,
P. Sanchez, J. Syvitski, and D. Liverman. (2012, In press). Planetary
Opportunities: A Social Contract for Global Change Science to Contribute
to a Sustainable Future. BioScience 62(6), xxx-xxx. http://www.jstor.org/
stable/10.1525/bio.2012.62.issue-6
38. Arrow, K., Bolin, B., Costanza, R., Dasgupta, P., Folke, C., Holling, C.
S., Jansson, B.O., Levin, S., Mäler, K. G., Perrings, C., and Pimentel, D.
(1995). Economic growth, carrying capacity, and the environment. Science
268(5210), 520-521.
56. D. Barnosky, A. D., Hadly, E. A., Bascompte, J., Berlow, E. L., Brown,
J. H., Fortelius, M., Getz, W.M., Harte, J., Hastings, A., Marquet, P. A.,
Martinez, N. D., Mooers, A., Roopnarine, P., Vermeij, G., Williams, J. W.,
Gillespie, R., Kitzes, J., Marshall, C., Matzke, N., Mindell, D. P., Revilla, E.,
and A. B. Smith (2012) Approaching a state shift in Earth’s biosphere.
Nature, 486, 52–58. doi:10.1038/nature11018
39. Bongaarts, J. (2009). Human population growth and the demographic
transition. [Historical Article]. Philos Trans R Soc Lond B Biol Sci,
364(1532), 2985-2990. doi: 10.1098/rstb.2009.0137
57. Bartlett, A.A. (1997–98) ‘Reflections on sustainability, population
growth, and the environment – revisited’, Renewable Resources Journal
15(4): 6–23.
40. DeLong, J. P., Burger, O., & Hamilton, M. J. (2010). Current
demographics suggest future energy supplies will be inadequate to slow
human population growth. [Research Support, U.S. Gov’t, Non-P.H.S.].
PLoS One, 5(10). doi: 10.1371/journal.pone.0013206
58. Pimentel, D., Whitecraft, M., Scott, Z. R., Zhao, L., Satkiewicz, P., Scott,
T. J., Moe, T. L. (2010). Will Limited Land, Water, and Energy Control
Human Population Numbers in the Future? Human Ecology, 38(5), 599611. doi: 10.1007/s10745-010-9346-y
41. Myrskyla, M., Kohler, H. P., & Billari, F. C. (2009). Advances in
development reverse fertility declines. [Historical Article Research
Support, Non-U.S. Gov’t]. Nature, 460(7256), 741-743. doi: 10.1038/
nature08230
59. Sen, A. (1994). Population: Delusion and Reality. New York Review of
Books, 41(15).
42. Tuljapurkar, S. (2009) Demography: Babies make a comeback. Nature
460, 693-694.
43. Luci, A. and Thévenon, O. (2010) Does economic development
drive the fertility rebound in OECD countries? INED working paper
167. Accessed April 19, 2011 at: http://www.ined.fr/fichier/t_
publication/1514/publi_pdf1_dt_167.pdf
60. Connelly, M. (2008) Fatal Misconception: The Struggle to Control
World Population, Belknap Press of Harvard University Press, Cambridge,
MA
61. Mosher, S.W. (2008) Population Control: Real Costs, Illusory Benefits.
Transaction Publishers, New Brunswick, NJ.
62. Boersema, J. (2011). Does the population issue still have a valid place
on the environmental agenda? Journal of Integrative Environmental
Sciences, 8(1), 1-6. doi: 10.1080/1943815x.2011.561107
44. Valentine, S. V. (2010). Disarming the population bomb. International
Journal of Sustainable Development & World Ecology, 17(2), 120-132. doi:
10.1080/13504500903478769
63. Royal Society (2012) People and the planet. The Royal Society Policy
Centre Report 1/12. London.
45. Murphy, D. J. and Hall, C. A. S. (2011). Energy return on investment,
peak oil, and the end of economic growth. Annals of the New
York Academy of Sciences, 1219(1), 52-72. doi: 10.1111/j.1749
6632.2010.05940.x
64. Miller, G.T. (1971) quoted at The Flow of Energy: Higher Trophic
Levels, University of Michigan “Globalchange” website: http://www.
globalchange.umich.edu/globalchange1/current/lectures/kling/
energyflow/highertrophic/trophic2.html
46. Hall, C. A. S. and Day, J. W. (2009). Revisiting the Limits to Growth
After Peak Oil. American Scientist, 97(3).
65. Haberl, H., Erb, K. H., Krausmann, F., Gaube, V., Bondeau, A., Plutzar,
C., Gingrich, S., Lucht, W., and
M. Fischer-Kowalski. (2007). Quantifying and mapping the human appropriation of net primary production in earth’s terrestrial ecosystems. Proc.
Natl. Acad. Sci., 104(31), 12942-12947.
47. Brown, J. H., Burnside, W. R., Davidson, A. D., DeLong, J. P., Dunn,
W. C., Hamilton, M. J., . . . Zuo, W. (2011). Energetic Limits to Economic
Growth. BioScience, 61(1), 19-26. doi: 10.1525/bio.2011.61.1.7
48. Nel, W. P., & van Zyl, G. (2010). Defining limits: Energy constrained
economic growth. Applied Energy, 87(1), 168-177. doi: 10.1016/j.
apenergy.2009.06.003
49. Campbell, C. Laherrére, J. (1998). The End of Cheap Oil. Scientific
American, 3, 78-83.
66. Rojstaczer, S., Sterling, S. M., & Moore, N. J. (2001). Human Appropriation of Photosynthesis Products. Science, 294(5551), 2549-2552. doi:
10.1126/science.1064375
67. Vitousek, P. M., Ehrlich, P. R., Ehrlich, A. H., & Matson, P. A. (1986). Human Appropriation of the Products of Photosynthesis. BioScience, 36(6),
368-373.
50. Wilson, E.O. (2002) The Future of Life. Alfred A. Knopf 2002
51. WPPA (1974). World Population Plan of Action (WPPA). First World
Population
Conference: Bucharest, 19 – 30 August 1974.
68. Imhoff, M. L., Bounoua, L., Ricketts, T., Loucks, C., Harriss, R., & Lawrence, W. T. (2004). Global patterns in human consumption of net primary
production. [10.1038/nature02619]. Nature, 429(6994), 870-873.
52. Beckerman W. (1972). Economists, scientists and environmental
catastrophe. Oxford Economic Papers, 24, 327 – 344.
Information is regularly scanned, screened, filtered, carefully edited, and published for educational purposes. UNEP does not
accept any liability or responsibility for the accuracy, completeness, or any other quality of information and data published or
linked to the site. Please read our privacy policy and disclaimer for further information.
17


© Copyright 2026