
How to Test DoS Defenses
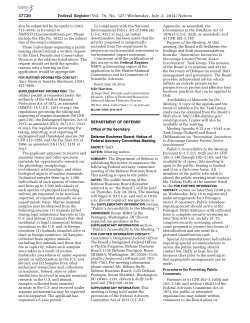
How to Test DoS Defenses∗
Jelena Mirkovic
USC/ISI
4676 Admiralty Way Ste 1001
Marina Del Rey, CA 90292
Email: [email protected]
Sonia Fahmy
Purdue University
305 N. University St
West Lafayette, IN 47907
Email: [email protected]
Peter Reiher
UCLA
4732 Boelter Hall
Los Angeles, CA 90095
Email: [email protected]
Roshan K. Thomas
Sparta, Inc.
5875 Trinity Pkwy Ste 300
Centreville, VA 20120
Email: [email protected]
Abstract
DoS defense evaluation methods influence how well test
results predict performance in real deployment. This paper
surveys existing approaches and criticizes their simplicity
and the lack of realism. We summarize our work on improving DoS evaluation via development of standardized benchmarks and performance metrics. We end with guidelines on
efficiently improving DoS evaluation, in the short and in the
long term.
1. Introduction and Motivation
Denial of service has been a pressing Internet security
problem for almost a decade. During that time, attacks
have evolved from naive and limited to sophisticated and
large-scale, and many defenses have been proposed. While
much attention has been paid to design of effective solutions, little has been done to design sound, realistic tests
to evaluate these solutions. The underlying reason is not
the researchers’ neglect, but inherent complexity of the
denial-of-service phenomenon. Realistic, thorough evaluation requires an ordinary researcher to invest more time
in test setup and design than in solution development, and
the lack of sharing means that everyone must build tests
from scratch. Consequently, many published papers contain
naive evaluation scenarios that may generate misleading results about proposed solutions.
We illustrate this problem by surveying several selected
∗ This material is based on research sponsored by the Department of
Homeland Security under contract number FA8750-05-2-0197. The views
and conclusions contained herein are those of the authors only.
recent papers, published in top venues: TVA [1], SOS
[2], DefCOM [3], Speak-Up [4], PSP [5] and StopIt [6].
These papers likely contain more sophisticated evaluation
approaches than other DoS publications, because they had
to pass rigorous reviews. Thus, our survey pool illustrates
the best evaluation practices in DoS research.
We use these selected papers to illustrate common pitfalls in DoS evaluation. Our goal is not to criticize — we
ourselves have published extensively in the DoS area and
our evaluation methods have been far from perfect. Two authors of this paper co-authored one of our surveyed papers
— DefCOM [3]. Like others, it has evaluation missteps.
Our goal is to draw on a rich experience we have built over
the years in DoS solution evaluation, to discuss all possible testing approaches and to suggest how to improve the
current situation.
Our recent work has focused on improving and standardizing DoS testing. In this paper, we summarize these efforts
and their outcomes: a set of DoS defense benchmarks and a
set of denial of service metrics. While our work on benchmarks and metrics has been extensively published [7–15],
this paper focuses on specific applications of this work to
improve the quality of DoS evaluation. Our solutions are
not the final answers in the quest for more scientific DoS defense evaluation, but they are useful steps toward that goal.
2. Evaluation Goals
Network communication involves many devices and protocols, all of which must work correctly to deliver satisfactory service. Any device, protocol or end-service in this
chain can be targeted to create denial-of-service. The attack
can be performed by a single attacking machine — DoS —
or by many machines — distributed DoS or DDoS. A victim
is a set of hosts or networks whose service the attacker aims
to deny. A successful attack prevents the victim from providing desired service quality to its legitimate clients. The
most commonly researched type of service denial is a traffic flood intended to overwhelm a limited, critical resource
at some point in the communication chain. Such a flooding
attack usually requires use of DDoS to guarantee continued
resource exhaustion at a well-provisioned target. The targeted resource could be CPU, memory (OS or application)
or bandwidth. On the other hand, a vulnerability attack invokes an undesired behavior of some element in the communication chain, leading to less-than-acceptable service
quality for victim’s clients. Examples include a crash, infinite loop, increased delay in responding to service requests,
random dropping of requests, incorrect firewall operation,
providing false replies to service requests, etc. Vulnerability attacks usually consist of a few packets, which implies
DoS rather than DDoS. Another popular DoS variant is the
reflector attack, where the attacker floods a distributed service with seemingly legitimate service requests, spoofing
the victim’s IP address. Servers (reflectors) reply to the victim, and since the requests are crafted to elicit large replies,
the reply flood causes denial of service. Reflector attacks
usually require use of DDoS to achieve volume.
In this paper, we focus on high-level evaluation strategies
that apply both to DoS and DDoS defenses, but will refer to
these collectively as “DoS defenses”, for short.
The main goal of DoS defense evaluation is to show that
it is effective. Researchers must demonstrate that a given
attack denies the service in absence of the defense, and
that the service denial is significantly reduced or eliminated
when the defense is present. Equally important is measuring
collateral damage that the defense inflicts on the legitimate
traffic, both in the presence and absence of attacks.
Most defenses take time to achieve their full effect, due
to some delay in attack detection or identification of attack
packets. Part of their evaluation is quantifying this delay.
All defenses have memory and CPU costs that must be
quantified. Distributed defenses must also quantify their effectiveness and cost in partial deployment, in terms of the
number of deployment points needed for a given effectiveness target.
Any defense must be evaluated for the scalability of its
cost and effectiveness. A defense can also be the target of
attacks or gaming attempts, and researchers must quantify
its resilience to these. Ideally, a defense’s failure should not
make the service denial any worse than it was in a legacy
network.
3. Overview of Surveyed Papers
Publication [1] proposes a DoS-limiting network architecture called TVA. Routers in TVA insert cryptographically
secure capability information into requests flowing from the
source to the destination. If the destination wants to communicate with the source, it returns the capability sequence,
and the source inserts it into all its future packets. Routers
prioritize capability-carrying traffic. To prevent the attack
when a path to the victim is flooded by capability-carrying
traffic to a colluding attacker in its vicinity, TVA shares the
bandwidth fairly per destination. To prevent DoS via capability request floods, TVA limits the bandwidth allowed for
total request traffic and shares this bandwidth fairly per path
between a source and a TVA router.
Publication [2] proposes an overlay architecture called
SOS. The overlay protects the location of the destination
server via several layers of defense: secure access points
(SOAPs) that verify a client’s identity and “goodness,” beacons that route traffic on the overlay to secret servlets, and a
firewall that only lets traffic from secret servlets through.
The overlay runs a routing protocol called Chord [16],
which helps restore routing when nodes fail. SOS also handles SOAP, beacon and servlet failures through their detection and re-election of new nodes to take over these roles.
Publication [3] proposes a framework for DDoS defense cooperation called DefCOM. The framework enables
source, core and destination defenses to securely communicate during attacks and plan a collaborative defense. Destination defenses detect attacks and raise alerts, while source
defenses differentiate legitimate from suspicious traffic and
tag legitimate packets for high-priority handling. Other
packets are tagged as low-priority, and overly aggressive
traffic is dropped. Core defenses rate-limit the traffic to the
destination under attack, but prioritize traffic according to
marks. They also re-tag traffic based on its rate and congestion responsiveness, which enables them to prioritize lowrate legitimate traffic from legacy networks and detect subtle attacks in some scenarios.
Publication [4] proposes the Speak-Up protocol where
the destination under attack invites its clients to send “payment” traffic on a separate channel to a “thinner” in front
of it. Payment traffic serves as bids in an auction for access to the destination. The underlying assumption, substantiated by some recent DDoS statistics, is that bots have
lower available bandwidth than legitimate hosts, because
they send aggressively.
Publication [5] proposes Proactive Surge Protection
(PSP) to protect traffic on ISP links from collateral damage
caused by high-volume DoS. It observes an ISP topology as
a set of origin-destination (OD) pairs. Only pairs that carry
no attack, but share the path with it — crossfire paths —- are
protected by PSP. It isolates OD pair traffic by tagging packets for each pair and fairly sharing the bandwidth between
all pairs on a path, based on historic bandwidth demand of
each.
Publication [6] compares the cost and effectiveness of
filtering versus capability-based DoS defenses. It proposes
a filtering defense called StopIt that a destination can use
to invoke filtering of traffic from sources it considers as
part of a DoS attack. StopIt deploys cryptographic identifiers to prevent spoofing at the inter-AS level. All sources
tag their packets with these “Passports,” and participating
routers prioritize Passport-carrying traffic. Destinations invoke filtering requests first to a StopIt server within their
AS. This server verifies that traffic from the source flows to
this destination and then propagates the request hop-by-hop
towards the source AS, which installs the filter.
4. Common Evaluation Approaches:
Their Advantages and Pitfalls
We now survey common evaluation approaches, pointing
out their advantages and pitfalls. No approach is inherently
good or bad, and each can answer some set of research questions. Knowing the limitations and implicit assumptions of
each approach can help researchers choose an appropriate
testing tool for their hypothesis. Inappropriate tools lead to
incorrect results.
An evaluation process consists of: (1) A testing approach, which can be a theoretical model, simulation, emulation or deployment in an operational network. (2) Test
scenarios containing legitimate and attack traffic (and implicitly user and attacker behaviors) and topology. (3) A
success metric, which should prove that a defense helps reduce or eliminate a DoS threat.
Figure 1 gives an overview of evaluation approaches in
the surveyed papers, broken into categories.
4.1. Testing Approach
Theory is well-suited to answering questions about situations that can be accurately represented by existing models, such as M/M/1 queues, state diagrams, probabilistic
models, hash tables, random selection from a set, etc. In the
DoS context, theory may be useful to evaluate robustness of
a given defense to cheating or a direct attack. Both require
some guesswork on the attacker’s part, whose success can
be evaluated via theory. Theory may also be useful in answering specific questions about a defense’s scalability, cost
and delay, again depending on the defense’s design, and if
parts of it can be accurately represented by simple models.
In general, theory is a poor choice for effectiveness evaluation. While it may be able to answer sub-questions related
to effectiveness, we lack theoretical tools powerful enough
to model the complexity of traffic mixes, their dynamics and
their interaction with the underlying hardware and network
protocols, especially in high-stress situations like DoS.
SOS [2] and Speak-Up [4] have effectively used theory
to answer robustness questions. SOS used it to evaluate the
overlay’s resiliency to several types of direct attacks, while
Speak-Up used it to evaluate the chances of a legitimate
client getting service in the presence of cheating attackers.
Simulation is highly popular for addressing network
performance questions. Network simulators must balance
a tradeoff between fidelity and scalability [17, 18]. At one
end of the spectrum, simulators can choose to sacrifice fidelity, especially at the lower layers of the protocol stack,
for scalability. For example, Internet forwarding devices,
such as switches and routers, are only modeled at a highlevel in popular packet-level simulators such as ns-2 [19].
The ranges of intra-device latencies and maximum packet
forwarding rates in commercial forwarding devices are not
incorporated. Networking researchers further find it difficult to correctly set remaining router parameters, such as
buffer size, in experiments with simulators. Hence, many
research papers report results that are highly sensitive to the
default forwarding model or the buffer size selected; these
values may not be realistic [20].
Near the other end of the spectrum lie detailed but
less scalable simulators such as OPNET [21] and OMNeT++ [22]. In OPNET, detailed models of routers,
switches, servers, protocols, links, and mainframes, are
based solely on vendor specifications [23]. Using complex
models significantly increases computational cost, hindering scalability. Further, the model base needs to be constantly updated. Validation attempts reveal that even these
detailed models are sensitive to parameters such as buffer
sizes and forwarding rates that are hard to tune to mimic
real router behavior [23].
Our comparisons between simulation and emulation results with software routers (PC and Click) and with commercial routers, all with seemingly identical configurations,
revealed key differences. Such differences occur because
simulators and emulated components abstract a number
of system attributes, and make several assumptions about
packet handling. For example, in PC routers on the Emulab [24] and DETER [25] testbeds, the CPUs, buses, devices, and device drivers may become bottlenecks that simulators do not model [26]. Results of DoS experiments are
also highly sensitive to the particular software version [26].
For example, Linux TCP flows on the testbeds were less
susceptible to DoS attacks than the SACK implementation
on ns-2. Another key result is that DoS attacks are also effective on traffic in the reverse direction in the case of lowend Cisco routers and PC routers, but not in simulations or
in emulations using Click [27].
Our experience with commercial Cisco routers has
demonstrated that some, but not all, can be similar to software PC routers in performance. Therefore, simulation and
emulation models have to account for variance in buffersizing strategies and backplane contention among routers.
An important lesson from our experiments [26, 28] is the
need to carefully configure parameters, and the importance
Defense
Test cases
Testing
approach
Legitimate traffic
Simulation with
ns-2
TVA
Emulation on
one machine
Fixed RTT = 60 ms, FTP of 20
KB file serially, abort if duration
> 64 s or more than 10 same
packet retransmissions
Attack scenarios
Bandwidth flood, colluding attacker at
the destination side, capability request
flood, imprecise authorization
Metrics
Topology
Dumbbell
Kernel packet flood
Attack on beacons, servlets and
SOAPs with and without dynamic
recovery, attack on underlying network.
Attacks arrive with Poisson distribution.
Theory
SOS
Emulation on
Planetlab
Contact 3 SSL servers
DefCOM
Emulation on
DETER
Serial, fixed length, telnet
sessions.
Theory
Speak-Up
Emulation on
Emulab
HTTP requests w Poisson
arrivals, and limit on outstanding
requests. Backlog of queued
requests and abort if > 10 s in
backlog.
PSP
Simulation with
ns-2
Traffic matrices from
measurements, simulated as
UDP with constant packet size.
StopIt
Emulation on
DETER
Simulation with
ns-2
Transfer time and
fraction of completed
transfers, average
values only
CPU cost, average
values only
Probability of
communication
failure
Varied number of
overlay hops
Time to complete
requests, average only.
Healing time, single
value.
Bottleneck link usage
over time, legitimate
traffic goodput,
operating cost in time
and number of msgs.
Probability of
Bandwidth flood
legitimate user being
served.
Fraction of server
One shared LAN resources to good
Attack traffic as legitimate but at higher
and multiple
clients, fraction of
rate and with concurrent requests,
shared LANs with good requests served,
different cost of serving requests,
different
single number. Byte
different levels of path sharing.
bandwidth
overhead and delay,
average and 90%.
Crossfire OD pairs
Bandwidth flood. Distributed attack on
suffering loss, total
Two large ISP
US topology with distribution inferred
packet loss rate of
networks, one
from real attacks. Targeted attack on
crossfire traffic, loss
US and one EU
EU topology, synthetic.
frequency, averages,
10% and 90%.
Bandwidth flood, various degrees of
path sharing and defense deployment. Tree topology
Insider attackers.
Bandwidth flood, multiplexed IPs to act
as multiple attackers. Target the victim
and target destinations in victim's
network.
Line with two AS,
two end hosts and
a router with
limited memory.
Bandwidth flood, with varied number of
Serial, fixed length, FTP transfers, attackers. Flood the destination, flood Random portion
abort if > 25 s.
its network with and without colluding
of AS map.
attackers.
Time to stop attack,
average and error bars.
Probability that an
attacker is caught after
certain number of
attacks.
Fraction of completed
transfers, transfer time,
single value.
Figure 1: Surveyed papers and their evaluation approach
of not generalizing results beyond the specific configurations used.
TVA [1], PSP [5] and StopIt [6] used ns-2 simulations
for effectiveness evaluation. Our research on ns-2 fidelity
suggests that these results may sometimes overestimate and
sometimes underestimate the attack impact, and are not predictive of performance in real deployments.
Emulation involves testing in a mini-network, such as a
lab or a shared testbed. Three testbeds have been popular for
DoS defense testing: Emulab [24], DETER [25] and Planetlab [29]. Emulab and DETER allow users to gain exclusive
access to a desired number of PCs, located at a central facility and isolated from the Internet. These can be loaded
with a user-specified OS and applications, and users obtain root privileges. Planetlab is a distributed testbed where
participating organizations contribute machines. Users gain
shared access to those machines via virtual machine software that achieves user isolation. They can organize Planetlab nodes into overlays — traffic between nodes travels
on the Internet and experiences realistic delays, drops and
interaction with cross-traffic. Users can also install applications on Planetlab nodes, but their choice of OS and their
privileges on nodes are much more limited than in Emulab
or DETER.
Emulation offers a more realistic evaluation environment
than theory and simulation, for several reasons: (1) a real
OS and applications, and real hardware are used in testing,
(2) live legitimate and DoS traffic can be generated and customized in various ways, (3) several router choices exist in
testbeds, such as PC, Click, Cisco and Juniper routers, allowing realistic forwarding behavior. Emulation also means
testing with a defense’s prototype, instead of abstracting
the defense and simulating it or developing its theoretical
model. This produces higher-fidelity results.
Emulation, however, has its own particular set of challenges that may slow down and complicate testing. We list
here several we encountered in our lengthy testing experience, but we anticipate that this is not an exhaustive list.
—
Realism, lengthy setup and reinventing the wheel
While a real OS, applications and devices provide some
degree of realism for emulation-based testing, realistic
scenarios still require recreation of realistic legitimate and
attack traffic mixes, and the choice of a realistic topology.
Often this requires a researcher to engage in a lengthy
investigation looking for sources of traffic and topology
data, and devising ways to “port” them onto the testbed.
This is very challenging, first because sources are scarce
and there is little agreement in the community which
are good ones, and second because porting often means
downscaling and learning about existing traffic generators
or writing new ones. Downscaling a topology or traffic
trace while keeping reasonable fidelity is an open research
problem. Learning how to use existing traffic generators or
writing new ones is time-consuming.
The necessity of identifying correct tools and data
sources, and deploying them on the testbed means a lengthy
setup for emulation tests. Data sources may be in the wrong
format for a given tool, source files for the tool might not
compile readily or the tool may not run as expected, which
adds delay and draws the researcher further from her task
of evaluating the defense. A related problem is lack of sharing of emulation tools and data sources in the DoS research
community. This evaluation practice of each researcher
“reinventing the wheel” (starting from scratch) is a major
factor in poor emulation test design. Sharing of tools, data
sources and testbed setup would lead to better testing approaches at a small individual time cost. We hope that this
will be the future of DoS evaluation.
Small scale — Existing testbeds have a few hundred
nodes, which seriously limits the scale of emulation tests,
compared to simulation and theory approaches. Virtualization — multiplexing many virtual hosts on one physical
host — can increase the scale and is sometimes a viable approach, but it adds another layer of artifice and thus reduces
the realism of tests. These limitations should be fully understood by a researcher. If virtualization is not an option, the
researcher must argue why and how her results on a smallscale topology can predict behavior on a larger topology.
Sometimes this argument can be easily made if a defense’s
operation does not depend on topology or user/attacker diversity. Other times, though, an investigation of how the
scale of topology or the user/attacker diversity influences a
defense’s performance is necessary.
Lack of diversity — Hardware in testbeds has a high
degree of homogeneity, which is necessary to ease maintenance but makes testbeds different from real networks.
While we cannot offer a ready solution to this problem,
researchers should attempt two prudent approaches: (1)
testing with the minimum-performance hardware that gives
them satisfactory performance, and (2) arguing why hardware that would deploy the proposed defense in the real
world will be more powerful (faster CPU, more memory,
faster NIC, etc.) than testbed hardware.
Hardware intricacies — An important observation from
our experiments on the Emulab [24] and DETER [25]
testbeds is that although the hardware and software on both
testbeds appear similar, the nodes on Emulab used in our
experiments typically experienced a higher CPU load than
the DETER nodes, for the same packet rate [26]. This
means that the same experimental setup (configuration files,
etc.) may produce widely different outcomes (in our experiments, a much more effective attack on Emulab than on DETER), as results are highly dependent on the details of un-
derlying hardware and software, and their default settings.
These different settings may not cause widely different outcomes in typical networking and operating systems experiments, but cause dramatic differences under DoS attacks
that overload the system. Our results with Click routers
have shown that we need a better understanding of intermediate queue sizes and device driver buffer sizes [26].
Complexity, fine-tuning and failures — One must carefully set up testbed experiments, as DoS attacks only succeed under certain conditions. For example, a SYN flood attack, which ties server’s memory, will not work if the source
addresses in SYN packets point to an existing host. This
is because the host’s OS will automatically send an RST
packet when it receives a SYNACK for a non-existing connection. This packet will release allocated memory at the
server, canceling the attack’s effect. The attack will also not
work if packets are sent to diverse destination ports — they
must target the same port, the one that offers a legitimate
TCP service. Further, it will not work if a SYN cookie [30]
defense is on, which is the default setting on some operating
systems. Researchers without network or system administration experience need to learn the nuances of each attack
before setting it up in a testbed.
A related issue is the need to fine-tune test parameters
to stay within resource limits while achieving a successful
attack. For example, many testbeds use PC routers which
have limited forwarding ability. Generating a high-rate attack may crash a router in the topology, while the goal was
to crash a victim host. A low-rate attack will go through but
be ineffective. Balancing this and many other parameters of
a test setup requires experience and many iterations.
Finally, testbeds include real hardware and software,
which may unexpectedly crash or misbehave. These failures may be provoked by an experiment or they may occur
at random. Without careful supervision, the researcher may
adopt results from an experiment with a failure as true ones.
Detecting failures is challenging for several reasons. First,
since the goal is to deny service, any failure on the path
between the legitimate clients and the destination on the experimental topology may mimic this effect. Second, many
researchers lack insight about testbed internals and possible
failure sources, because such information is not publicized.
In our survey, TVA [1], SOS [2], DefCOM [3], SpeakUp [4] and StopIt [6] have used emulation. TVA and SOS
used it for cost evaluation, in a limited setting — TVA on
one machine and SOS on a limited-size overlay of Planetlab nodes. This is an appropriate use of emulation, because
defense cost is often independent of traffic and topology settings, and emulator fidelity. DefCOM, Speak-Up and StopIt
used emulation both for effectiveness and for cost evaluation. We will comment on the realism of their test settings
in Section 4.2.
Deployment — Deployment of a defense in an opera-
tional network gives the most realistic test. The system sits
in a real topology, handling real traffic and attacks. The
main drawback of this approach is that it is not reproducible
by others. Another drawback is that the researcher has no
control over traffic the defense sees, which means that she
has no way of knowing the ground truth, i.e., if a packet
belongs to malicious or legitimate traffic. While this can be
inferred to some extent, there is no way to quantify or guarantee accuracy of this inference. Yet another problem is that
the network environment, legitimate traffic and attacks may
differ widely among networks. While deployment in one
network may yield good results, it is difficult to argue that
another network would see a similar benefit. Researchers
can strengthen their case by deploying the defense in a
large, popular network. They can then argue that its traffic diversity, traffic volume and size are the same or higher
than in most other networks, where similar or larger benefits should be expected. This leads us to the biggest problem
with the deployment approach — many researchers lack access to a large, popular network and enough leverage to initiate deployment of research-grade defenses in it. None of
our surveyed papers used deployment for evaluation.
4.2. Test Scenarios
In this section, we discuss choices of the legitimate traffic, attack scenarios and topology that are modeled/reproduced in theory, simulation and emulation. We
repeat a lot of wisdom stated in [20] for Internet research: it
is imperative that researchers design realistic tests, and that
they understand how variations of their settings influence
performance results. Failure to do so leads to test results
that do not reflect reality, and may be misleading.
Legitimate Traffic — Because denial of service is a
phenomenon experienced by the legitimate clients in presence of attack traffic, legitimate traffic settings will greatly
influence the success of an attack, and by extension the success of any defense. The attack’s and defense’s interactions
with legitimate traffic mostly result in continuous or sporadic packet drops and delays. Unfortunately, many DoS
research papers use overly simplistic settings for the legitimate traffic. We list below the traffic parameters that affect
sensitivity to service denial, and comment on how settings
commonly seen in research papers may influence results.
Packet sizes — The most popular variant of DoS attacks
— the bandwidth flood — overwhelms router queues. Depending on the queue implementation and attack packet
size, small legitimate packets may have a better chance of
winning queue space than larger ones. In reality, Internet traffic exhibits a variety of packet sizes, yet many DoS
tests generate legitimate traffic with a single packet size,
which may either over- or underestimate the defense’s performance. PSP [5] used a uniform, large packet size, which
may lead to an overestimate of an attack’s impact, while
other papers we surveyed let the packet size be determined
by the higher-level application.
Transport protocol mix — According to many statistics
of Internet traffic (e.g., [31]), a high percentage (80-95%)
of it is TCP traffic. TCP differs significantly from other
transport protocols because of its congestion response, and
because delays, mapped into large round-trip times (RTT),
slow down the data transfer. During sustained congestion,
however small, TCP traffic will keep on reducing its sending
rate, due to packet loss it experiences in each RTT. It is of
paramount importance to capture this behavior, as well as
TCP’s data transfer slowdown in the presence of delays.
Some publications use UDP traffic as legitimate traffic,
either in simulation or in emulation. Others may replay traffic from public traces in a non-congestion-responsive manner, e.g., by using tcpreplay [32]. Both approaches are
clearly wrong because they do not capture the changing nature of TCP’s bandwidth demand, nor do larger delays result
in a data transfer slowdown. Results thus obtained will underestimate attack and collateral damage. Of our surveyed
papers, PSP [5] used UDP as legitimate traffic in ns-2 simulations.
RTT values — TCP throughput is a function of a flow’s
RTT, which is defined by link delays in the topology. Flows
with longer RTT values last longer, and suffer more during congestion and in the presence of drop-tail queues [33].
Many simulations and emulations use a single RTT value
for all legitimate traffic, while in reality RTTs span a wide
range of values [34]. This may either under- or overestimate the service denial and the collateral damage. TVA [1],
DefCOM [3], Speak-Up [4], PSP [5] and StopIt [6] all use
topologies with ad-hoc, single-value link delays that are either explicitly set up or chosen by default by the simulator
or emulation platform. SOS [2] runs over a Planetlab overlay, thus exploiting the underlying, real link delays.
TCP connection dynamics and application mix — We
use the term “connection dynamics” to denote how bursty
a TCP connection is and how long it lasts. An application determines these dynamics to some extent, along with
data volume to be exchanged and the underlying network
properties. On one end, there are FTP-like connections on
large-bandwidth links. These connections will stay in the
slow-start stage unless there is loss, quickly sending all their
data. Any packet loss may significantly prolong their duration. On the other end, there are long-lived, Telnet-like
connections. They send traffic in small bursts, with potentially large pauses in between, and hence typically have
small congestion windows.
Simulation and emulation tests in publications tend to
use a single, simplistic parameter setting, such as consecutive FTP transfers of a single file, while Internet traffic exhibits a wide range of dynamics. This practice is likely to
result in larger service denial and collateral damage than if a
realistic connection mix were used. TVA [1], SOS [2], DefCOM [3], Speak-Up [4] and StopIt [6] all use a single application for legitimate traffic generation. TVA and StopIt use
FTP transfers of a single file, thus fixing data volume and
connection dynamics. DefCOM uses telnet sessions whose
dynamics are selected from a narrow range of values. SOS
uses SSL requests to three chosen Web servers, and SpeakUp uses same-file HTTP requests.
TCP connection arrivals — During packet loss periods,
TCP connections that are just starting have no memory of
previous loss and are thus more aggressive than existing
connections. This implies that the connection arrival process should be accurately modeled during testing. TVA [1],
SOS [2], DefCOM [3], and StopIt [6] all use serial connections that may time out after a while. Not only is this
an unrealistic setting, it also significantly reduces connection density when an attack is present, introducing bias into
percentage-based measures. Speak-Up [4] uses connections
with Poisson arrivals and a backlog limit, but sets ad-hoc
values for these parameters. This is unrealistic as shown
by Surge [35], where requests observed in Web server logs
arrive during a user’s ON periods, separated by OFF periods following a Weibull distribution. Dynamics during ON
periods depend on the number of embedded objects in the
user-requested file. None of these parameters fits a Poisson
distribution.
IP address diversity and turnover — While IP address
diversity does not determine the degree of attack-induced
damage, it may affect performance of defenses that try
to achieve per-source, per-destination or per-path fairness.
Similarly, many defenses protect those clients seen prior to
the attack, but may have problems with legitimate clients
that appear during attacks. It is thus important to simulate
or emulate realistic IP address diversity and turnover. None
of our surveyed defenses did so.
Attack Scenarios. To thoroughly evaluate a defense,
one must stress-test it. Below, we list recommended test
scenarios for some general defense categories that we identified in past and present DoS research literature. We make
no claim that this list is exhaustive, but it should serve to
illustrate our point about stress-testing. Further, some tests
can be avoided if the researcher can reason about a defense’s
performance from its design.
• Defenses that deploy path isolation mark, sample or
record packets to isolate traffic paths, for filtering or
fair sharing of resources. Such defenses should be
tested in situations with varying degrees of sharing between legitimate and attack traffic.
• Defenses with resource accounting share resources
fairly per source or destination. They should be tested
with highly distributed attacks (source fair-sharing) or
with colluding attackers that share the resource with
the attack’s victim (destination fair-sharing).
• Defenses that deploy a privileged customer approach
have legitimate users obtain “passes” that allow privileged access to the critical resource, in form of capabilities, authorization to enter a dedicated overlay, knowledge of the server’s identity, good classification, etc. A
defense prioritizes traffic with “passes.” Tests should
include three scenarios: (1) Attackers act as expected
to receive a pass, then turn bad, (2) Attackers attempt
to flood the system with pass requests, (3) Attackers
attempt to bypass pass checking.
• Defenses with behavior learning observe either traffic or legitimate user’s behavior to learn valid patterns.
During attacks, some traffic parameters or user behavior will mismatch learned models, which can be used
to devise fine-grained filters or to isolate attack packets. Such defenses should be tested with: (1) Attacks
that mimic legitimate traffic features and slowly transition to malicious behavior to deny service. (2) Attacks
that fit the model of legitimate behavior but still deny
service (e.g., flash crowd attacks).
• Defenses with resource multiplication deploy distributed resources (statically or dynamically) to sustain large attacks. They should be tested with highly
distributed, dynamic attacks.
• Defenses with legitimate traffic inflation multiply traffic amount to enhance chances to win the limited resource. They should be tested with highly distributed
attacks, where each attacker sends at a low rate and
inflates it as a legitimate client would.
In addition to the above, defenses that have collaborating
elements or control messages should be stressed with message loss and collaborators that misbehave (insider attacks).
Any defense should also be subjected to attacks on itself.
TVA [1] deploys both the privileged customer and path
isolation approaches. Its tests included good-turn-bad
clients, and pass request flooding. Attackers cannot bypass
capability checking. TVA was not tested with a realistic or
high degree of path sharing, as it should have been. In fact,
the dumbbell topology in its tests had the lowest degree of
sharing and thus likely generated better effectiveness results
than a real deployment would. SOS [1] deploys the privileged customer approach, but it was not tested with goodturn-bad clients. SOS makes an argument that pass request
flooding only has local effects but does not quantify this.
Attackers cannot bypass the defense. DefCOM [3] deploys
resource accounting per source path, path isolation and privileged customer approaches. It was tested with good-turnbad clients. Attackers cannot flood the defense with pass
requests because these are implicit in traffic; they also cannot bypass it. DefCOM was tested with distributed attacks
to stress resource accounting, and with low and high degrees of path sharing. Speak-Up [4] deploys the resource
inflation approach. While it was not tested with highly distributed attackers, an argument was made that such high
numbers of attack machines are not common in today’s Internet. PSP [5] deploys path isolation, resource accounting (per-path) and behavior modeling approaches. It was
tested with low and high degrees of path sharing, and with
focused and distributed attacks. It did not test or discuss the
effect of increasing rate attacks on model accuracy. Lowrate attacks that fit the model would not be likely to create
service denial on core networks, but this was not discussed
either. StopIt [6] deploys privileged customer and resource
accounting (per-destination) approaches. It handles goodturn-bad clients by design, and cannot be overwhelmed with
pass requests or bypassed. It tested degrees of path sharing to stress its resource accounting. All defenses we surveyed properly discussed or tested attacks on themselves,
but SOS [1] did not discuss insider attacks, while other collaborative defenses did.
Topologies — For defenses that operate on a traffic
stream at a single deployment point, without consideration
of traffic paths or distribution, the specific topology used
in testing should not affect performance. We say this with
a caveat that sufficient IP address and traffic diversity can
be achieved independently of a topology, which is sometimes the case. Other defenses must be tested with realistic
topologies, sampled from the Internet. We have seen two
approaches to such testing: (1) An ISP topology, obtained
from a private or public source, is used in full, (2) Reduction is performed on an ISP topology or AS map derived
e.g., from Routeviews [36], for scalability, and a portion
is used in tests. An ISP topology approach uses realistic
data, which is a plus, but it is only justified if a defense is
meant to be deployed at the ISP level. The reduction approach makes little sense unless the defense is meant to be
deployed in a portion of an ISP’s network. Otherwise, researchers should prove that those features that affect the defense’s performance are same in the portion portion of an
ISP topology and in the entire topology.
The performance of TVA [1], SOS [2], DefCOM [3],
PSP [5] and StopIt [6] may depend on the underlying topology. Only PSP used a realistic ISP topology, and it is a
single-ISP defense. TVA used a dumbbell topology, which
favored the defense. SOS did not discuss the used topology. DefCOM used a tree topology, which may have been
unfavorable for the defense and was certainly unrealistic.
StopIt used a random portion of an AS map, which may
have replicated realistic connectivity properties but not the
path diversity. While this would not change StopIt’s performance, it may have negatively affected the performance of
other defenses compared with StopIt [6].
4.3. Metrics
Denial of service is a subjective phenomenon perceived
by human users, which makes its precise measurement in
tests challenging. We focus here on measurement of a defense’s effectiveness, which requires accurate measurement
of service denial with and without a defense. Other defense
performance measures from Section 2 have straightforward
and well-understood metrics.
Existing DoS research has focused on measuring denial of service through selected legitimate traffic parameters: (a) packet loss, (b) traffic throughput or goodput, (c)
request/response delay, (d) transaction duration, and (e) allocation of resources. While these capture the impact of
severe attacks, they often fail in specific scenarios that we
will discuss below. Researchers have used both the simple
metrics (single traffic parameter) and combinations of these
to report the impact of an attack on the network.
Loss is defined as the number of packets or bytes lost
due to the interaction of the legitimate traffic with the attack [37] or due to collateral damage from a defense’s operation. The loss metric primarily measures the presence
and extent of congestion in the network due to flooding attacks, but cannot be used for attacks that do not continually
create congestion, or do not congest network resources at
all, e.g., [38–40]. Further, the loss metric usually does not
distinguish between the types of packets lost, whereas some
packet losses have a more profound impact than others on
service quality (for example, a lost SYN vs. data packet).
Throughput is defined as the number of bytes transferred per unit time from the source to the destination.
Goodput is similar to throughput but it does not count retransmitted bytes [38,41]. Both throughput and goodput are
meaningful for TCP-based traffic, which responds to congestion by lowering its sending rate, because they indirectly
measure this effect. They cannot be applied to applications
that are sensitive to jitter or to loss of specific (e.g., control) packets, because a high throughput level may still not
satisfy the quality of service required by the user. Further,
these metrics do not effectively capture DoS impact on traffic mixes consisting of short, low-volume connections that
already have a low throughput.
Request/response delay is defined as the interval between the time when a request is issued and the time when
a complete response is received from the destination [42].
It measures service denial of interactive applications (e.g.,
telnet) well, but fails to measure it for non-interactive applications (e.g., email), which have much larger thresholds for
acceptable request/response delay. Further, it is completely
inapplicable to one-way traffic (e.g., media traffic), which
does not generate responses but is sensitive to one-way delay, loss and jitter.
Transaction duration is defined as the time needed for
the exchange of a meaningful set of messages between a
source and a destination [1, 43, 44]. This metric heavily depends on the volume of data being transferred, and whether
the application is interactive and congestion-sensitive.
Allocation of resources is defined as the fraction of a
critical resource (usually bandwidth) allocated to legitimate
traffic vs. attack traffic [3,43]. This metric does not provide
any insight into the user-perceived service quality. It assumes the service is denied due to lack of resources, which
applies only to flooding attacks and cannot capture collateral damage of a given defense.
In summary, existing metrics suffer from two major
drawbacks: (1) They measure a single traffic parameter assuming that its degradation always corresponds to service
denial. This approach is flawed because traffic parameters
that signal service denial are application-specific and because some attacks can deny service without affecting the
monitored parameter. (2) They fail to scientifically define
the parameter range that is needed for acceptable service
quality, and that is application- and task-specific. Finally,
the existing metrics predominantly capture service denial at
the network layer, while attacks may target other layers.
TVA [1], SOS [2] and StopIt [6] use the fraction of completed requests as their main performance metric, assuming
that outstanding requests are aborted after some ad-hoc interval. They also evaluate the transaction duration. Because
a single application is used, and because the measured duration is not linked to human-expected values, these metrics
simply show an improvement when a defense is present, but
they do not accurately measure if the service denial has been
reduced and by how much. DefCOM [3] and Speak-Up [4]
measure the server resource allocation, and DefCOM also
measures the legitimate traffic goodput. None of these are
mapped into human-perceived service denial. PSP [5] measures packet loss of OD pairs, without quantifying how it
affects human-perceived service denial.
Another frequent, yet incorrect, approach in DoS defense evaluation is to show measurements from a single test,
or averages of a small number of tests. Because variability is possible in traffic and in network operations, multiple
tests should be run for the same scenario, with the number of repetitions being driven by the resulting variance.
Averages should be shown either with error bars, or with
low and high percentile values, to properly communicate
the variability in performance. TVA [1] and SOS [2] show
averages only, while DefCOM [3] and Speak-Up [4] show
single values. PSP [5] and StopIt [6] show a range of values;
PSP with averages, 10-th and 90-th percentiles; and StopIt
with averages and error bars.
5. DDoS Benchmark Overview
We now describe our efforts in developing benchmarks
for DoS defense testing. While these are far from perfect,
we believe they are a good first step towards improving DoS
defense evaluation. Due to space constraints, we summarize
our results here and refer readers to [7,8,10,12,15] for more
details.
Our original idea for benchmark development was to
sample legitimate and attack traffic and topologies from the
Internet and port these into the DETER testbed. Towards
this goal, we designed a collection of tools that harvest traffic and topology samples from the Internet. Our attack traffic sampler used a series of custom tests to detect attacks
in public traces, and infer their type, rate, level of spoofing
and duration. Our legitimate traffic sampler derived request
arrivals, connection duration and dynamics from public traffic traces. Our topology sampler used a strategy similar to
the Rocketfuel tool [45] to sample ISP topologies. We then
developed traffic generators and topology translators to port
these results onto the DETER testbed. These scenarios were
just a start, because we needed to thoroughly explore the parameter space to comprehensively test a DoS defense. Our
next goal was to understand which features of the attack, the
legitimate traffic and the topology interact with each other
and with the defense. Once isolated, these features were
varied in the scenarios.
We first collected information about all the known DoS
attacks and categorized them based on the mechanism they
deploy to deny service. We focused on attacks where denial of service is a primary goal and not a secondary effect,
i.e., attacks that target a specific resource or a service, as
opposed to DoS created by worms or e-mail viruses. We
arrived at the following attack categories: (1) packet floods,
(2) invalid header values, (3) invalid application inputs, (4)
invalid fragments, (5) large packets and (6) congestion control exploits (e.g., [38]). We then narrowed our focus to
testing of DDoS defenses only, i.e., those that aim to handle distributed attacks. These attacks are packet floods and
congestion control exploits. Table 1 lists all the attack types
in the benchmark suite, and their denial-of-service mechanisms. Although there are a few attack categories, they can
invoke a large variety of DoS conditions and challenge defenses, by varying attack features such as sending dynamics, spoofing and rates. All packet flood attacks can be converted into congestion control exploits by sending the flood
in pulses.
Attack traffic generated by the listed attacks interacts
with legitimate traffic by creating real or perceived contention at some critical resource. Table 2 lists attack features and their variations, for each attack type from Table 1.
A single feature is varied during a test, while other features
are kept at a specific default value. Table 3 lists scenario
features that are varied to stress-test a given defense, and
Table 1: Attack types in the benchmark suite
Attack type
UDP/ICMP packet flood
TCP SYN flood
TCP data packet flood
HTTP flood
DNS flood
Random fragment flood
TCP ECE flood
ICMP source quench flood
DoS mechanism
Large packets consume bandwidth, while small
packets consume CPU
Consume end-host’s connection table
Consume bandwidth or CPU
Consume Web server’s CPU or bandwidth
Consume DNS server’s CPU or bandwidth
Consume end-host’s fragment table
Invoke congestion control
Invoke congestion control
Table 2: Traffic feature variations that influence DoS impact
Feature
Rate
Dynamics
Legitimate
traffic rate
Critical
resource
Path sharing
TCP
mix
traffic
Application
mix
Variation
Low, moderate and severe.
Continuous rate vs. pulsing (vary on and off periods). Synchronous senders vs. interleaved senders
Light, moderate and high traffic load on the bottleneck link
Covered by attack rate variations
Uniform vs. log-normal location of attack machines. Legitimate
clients are distributed uniformly. Several topologies with various
degrees of path sharing.
80%/15%/5% mixes of traffic, choosing from: data transfers,
Telnet-like communication and single-message request/reply exchanges.
Create a mix of all supported applications and vary the contribution
of each application to the mix.
their range of variation.
These benchmarks are now deployed on the DETER
testbed [25] and integrated with the DETER experimentation environment called SEER [46], which offers a GUI for
test control and a point-and-click interface to engage benchmarking. In the beginning, a user is offered a set of ISP
topologies to choose from. The user can also input the script
locations that deploy, start and stop her defense. The benchmarking module then automatically deploys traffic generators on the topology and runs tests, appropriately starting
and stopping the defense during them. It then summarizes
the results using our DoS metrics, which we describe in the
next section.
Table 3: Test feature variations that interact with defense
Defense
Path
isolation, resource
multiplication
and resource
accounting
Privileged customer
Feature
Path sharing
Behavior
learning
Legitimate vs. attack traffic parameters
Legitimate user vs.
attacker network resources
Attacker
aggressiveness
Attacker dynamics
Traffic
tion
All
All
All
infla-
Variation
(1) Uniform vs. log-normal distributed
attackers. (2) Pulsing, interleaved attacks
6. DoS Metrics Overview
Our insight in developing DoS metrics was that DoS always causes degradation of service quality, and a metric that
holistically captures a human user’s QoS perception will be
applicable to all test scenarios. Our goal in this research
was to understand what traffic parameters influence human
QoS perception and in which ranges. In this quest, we relied heavily on existing QoS research. We summarize our
findings here. All metrics were thoroughly evaluated in [9].
A transaction represents a higher-level task whose completion is perceptible and meaningful to a user. A transaction usually involves a single request-reply exchange between a client and a server, or several such exchanges that
occur close in time. A transaction is considered successful if it meets all the QoS requirements of its corresponding
application. If at least one QoS requirement is not met, a
transaction failed. Transaction success/failure is at the core
of our proposed metrics.
6.1. Application QoS Requirements
We first identified traffic measurements that are important for service quality for the popular applications today,
mostly from [31, 47] statistics and 3GPP [48]. We then
leveraged current research that attempts to link user QoS
perception with traffic parameter levels for different applications [48–52].
Table 4 summarizes the application categories we propose, and their corresponding QoS requirements. For space
reasons, we omit the rationale for these selections; details
are in [9]. Should novel applications become popular in the
future, the proposed application categories will need to be
extended, but our DoS impact metrics will be immediately
applicable to new applications. In the request/reply delay
column, we differentiate between partial, full, echo delay
and RTT values. Partial delay occurs between the time a
request is sent to server, and when the first byte of a reply is
received. It also refers to the delay between pieces of a reply
being received. Whole delay occurs between sending of the
request and when the full reply is received. Echo delay occurs in telnet applications from the time that characters are
sent to the server, to when the client receives them echoed.
6.2. Measurement Approach
Resource
pattern
Legitimate
dynamics
access
client
Attacker mimics legitimate client behavior (1) prior to the attack or (2) throughout the experiment
(1) Randomized attack packets, (2) Attacker mimics legitimate client traffic,
(3) Attack with slowly increasing rate
Vary attackers’ locations
Vary number of attack machines while
keeping attack rate constant.
Engage new attackers during the attack
and retire old ones.
Engage new legitimate clients during the
attack and retire old ones.
During simulation, collection of necessary traffic measurements usually implies slight modification of the simulator. Such collection is a challenge in testbed experimentation, and we explored two possible approaches: (i)
Instrumented-clients: instrumenting each client application
to compute required measurements, or (ii) Trace-based: using real, uninstrumented applications and traffic generators,
identifying transactions in collected packet traces and computing traffic measurements. While the instrumented client
approach has the advantage that it can precisely identify
Table 4: Application categories and QoS requirements.
Category One-way delay Req/rep delay Loss Duration Jitter
email (srv/srv)
whole, RTT <4 h
Usenet
whole, RTT <4 h
chat, typing
RTT <4 s
chat, typing
some data must be sent to server
chat, audio
<150 ms
whole, RTT <4 s <3%
<50 ms
chat, video
<150 ms
whole, RTT <4 s <3%
Web
part, RTT <4 s
<60 s
Web
some data must be received from server
FTP Data
part, RTT <10 s
<300%
FTP Control
part, RTT <4 s
FTP
some data must be exchanged on data channel
FPS games
<150 ms
<3%
RTS games
<500 ms
telnet
part, RTT <250 ms
telnet
some data must be received from server
email (usr/srv)
part, RTT <4 s
<300%
DNS
whole <4 s
ping
whole <4 s
media
control
media
media
audio, conv.
<150 ms
whole, RTT <4 s <3%
<50 ms
audio, messg.
<2 s
whole, RTT <4 s <3%
<50 ms
audio, stream
<10 s
whole, RTT <4 s <1%
<50 ms
videophone
<150 ms
whole, RTT <4 s <3%
video, stream
<10 s
whole, RTT <4 s <1%
transactions, it limits the usability of our metrics to opensource clients. We thus decided to utilize the trace-based
approach, since it is easily applicable to most test scenarios and immediately usable by other researchers. In implementing trace-based QoS evaluation, we have encountered additional challenges with regard to transaction and
request/response identification, which are discussed in detail in [9].
6.3. DoS Metrics
We aggregate the transaction success/failure measures
into several intuitive composite metrics.
Percentage of failed transactions (pft) per application
type. This metric directly measures the impact of a DoS
attack on network services by quantifying the QoS experienced by end users. For each transaction that overlaps
with the attack, we evaluate transaction success or failure.
We then calculate the pft value as the difference between 1
(100%) and the ratio of the number of successful transactions divided by the number of all transactions that would
have been initiated by a given application during the same
time if the attack were not present. This approach is necessary to avoid biased results when legitimate traffic generators initiate transactions serially. In this case, timing of
subsequent requests depends on the completion of previous
requests, and transaction density changes during an attack.
The DoS-hist metric is the histogram of pft measures
across applications.
The DoS-level metric is the weighted average of pft
measures
for all applications of interest: DoS-level =
P
pft(k)·w
k , where k spans all application categories, and
k
wk is a weight associated with a category k. In some experiments, it may be useful to produce a single number that
describes the DoS impact, but we caution that DoS-level
is highly dependent on the chosen application weights and
thus can be biased.
Let QoS-ratio be the ratio of the difference between
a transaction’s traffic measurement and its corresponding
threshold, divided by this threshold. The QoS metric for
each successful transaction measures the user-perceived
service quality, in the range (0, 1], where higher numbers
indicate better quality. We compute this metric by averaging QoS-ratios for all traffic measurements of a given transaction that have defined thresholds.
For failed transactions, we compute the related QoSdegrade metric, to quantify severity of service denial. QoSdegrade is the absolute value of QoS-ratio of that transaction’s measurement that exceeded its QoS threshold by the
largest margin. This metric is in the range [0, +∞). Intuitively, a value N of QoS-degrade means that the service
of failed transactions was N times worse than a user could
tolerate.
The life diagram displays the birth and death of each
transaction during the experiment with horizontal bars. The
x-axis represents time and the bar position indicates a transaction’s birth (start of the bar) and death (end of the bar).
We display failed and successful transactions on separate
diagrams. This metric can help researchers quickly evaluate
which transactions failed and spot clusters that may point to
a common cause.
The failure ratio measures the percentage of transactions
that are alive in the current interval (we use 1-second intervals), but will fail in the future. The failure ratio is useful
for evaluation of DoS defenses, to capture the timeliness
of a defense’s response, and for time-varying attacks [38].
Transactions that are born during the attack are considered
live until they either complete successfully or fail. Transactions that are born before the attack are considered live after
the attack starts. A transaction that fails contributes to the
failed transaction count in all intervals where it was live.
We acknowledge that calculating our metrics is more
complex than obtaining legacy ones. To ease this process, we have made the program used for DoS metrics calculation from network traces freely available at
http://www.isi.edu/∼mirkovic/dosmetric.
7. Steps Forward for DoS Researchers
We have just provided a lot of information about evaluation practices, and some suggestions we made are not so
easy to follow in practice. Here, we summarize our guidelines for best practices in DoS defense testing, developed
to strike a balance between test realism and the time investment required for test setup.
• Use theory for certain research questions, but with
realistic models. As we discussed in Section 4.1, theory is a good tool for some evaluation questions. Care
should be taken, however, to use it with appropriate
models to arrive at useful results. For example, analysis of overlay resilience in SOS [2] assumes that attacks arrive with a Poisson distribution. While the
authors had to adopt some model for attack arrivals,
there is no proof that real attack arrivals indeed follow
a Poisson distribution. The authors should have argued
that either this distribution is the right choice, or that it
is the worst case scenario for their defense.
• Use emulation instead of simulation. While network simulation is easier to set up and run than emulation, we believe its fidelity in DoS cases is severely
limited. We suggest using emulation instead. Emulation has its own set of fidelity issues, especially
when router models are concerned, but in general a
testbed router model underperforms when compared
with real routers. Thus, results obtained from emulation may overestimate attack and collateral damage,
which means that realistic defense performance will be
better. This seems to be a reasonable compromise.
• Use realistic legitimate traffic features that matter.
Section 4.2 mentions many legitimate traffic features
that should be faithfully replicated in tests. This is often difficult due to the lack of reliable data sources and
appropriate traffic generators. Researchers should thus
identify those features that interact with the defense
and replicate them realistically. At the minimum, these
are: TCP transport protocol, RTT value ranges, connection arrivals, lifetimes and dynamics. An acceptable practice is to replicate selected values from ranges
(such as min, max and avg), or to replicate a worst
case scenario for the defense. Another possibility is to
replay public traffic traces in a congestion-responsive
manner, e.g., by using the Swing tool [53].
• Use realistic topologies when they matter. If topological features, such as path diversity, client and attacker locations, influence a defense’s performance,
they should be replicated realistically. Unless a strong
case for irrelevance is made, relevance should be assumed. While scaledown of large topologies (ISP or
AS map) is an open research problem in the general
case, researchers can devise appropriate scaledown
techniques to preserve a specific feature that matters
for their tests. Alternatively, they could use an existing
scaledown approach (such as taking a random branch
of a larger topology), evaluate the feature of interest
there and explain how a defense’s performance would
change if that feature took more realistic values.
• Test with all attacks of interest. Attacks should be
chosen to stress-test the defense (Section 4.2).
• Use our DoS metrics. Current DoS metrics are so adhoc that they prevent comparisons between defenses,
or any prediction of human-perceived QoS in real defense deployment. We claim that our metrics are better
and they are also easy to use since our publicly released
code works on tcpdump files that can be easily collected in emulation.
• Share tests publicly. Greater sharing of emulation
test setup and run scripts would promote better testing
practices, as well as reproduction of others’ work. Current testbeds lack mechanisms for such sharing — one
cannot share experiments selectively but must share all
of them. This should be easy to fix.
8. Conclusions and Future Work
The problem of effective evaluation of DoS attacks
and defenses is inherently complex. Many evaluation approaches exist, such as theory, simulation, emulation and
deployment. While each is beneficial to evaluate specific
research questions, emulation approach seems best suited to
evaluate a defense’s effectiveness. To address the realism of
emulation tests, we have worked to develop DDoS defense
benchmarks. Ours is just a first step towards more systematic defense testing, where we hope the research community
will head. Other future research directions we can highlight
are: (1) the creation of better emulation testbeds and highfidelity legitimate traffic mixes combined with the use of
lossless scaledown models of realistic (and large) topologies, (2) development of repositories of realistic traffic and
tools to mine relevant features from these and to reproduce
such traffic in emulation.
With respect to measuring an attack’s impact and thus
a defense’s effectiveness, most works have used low-level
traffic metrics such as packet loss, throughput, end-to-end
latency, etc. While these may capture the impact of an attack at the network layer, they do not capture user-perceived
effects of it on application-level quality of service. To address this, we have proposed DoS metrics that measure attack’s impact on user-perceptible quality of service. Our
metrics are intuitive, easy to use and applicable to many
DoS scenarios. In the future we plan to extend our set of
application categories and refine our QoS criteria for each.
We also hope our benchmarks and metrics will serve as motivation for DoS research community to focus on ways to
improve science in DoS evaluation. One large step in this
direction would be wide sharing of emulation scripts and
scenarios for each published DoS paper, so that existing
research can be replicated, improved and extended by others. Another important step is working toward a community
consensus about components of realistic test scenarios such
as legitimate traffic mixes, attack dynamics and topologies.
References
[1] Xiaowei Yang, David Wetherall, and Thomas Anderson. A DoS-limiting Network Architecture. In Proceedings of ACM SIGCOMM, pages 241 – 252, October 2005.
[2] Angelos D. Keromytis, Vishal Misra, and Dan Rubenstein. SOS: An Architecture For Mitigating DDoS Attacks. Journal on Selected Areas in Communications,
21, 2003.
[3] G. Oikonomou, J. Mirkovic, P. Reiher, and M. Robinson. A Framework for Collaborative DDoS Defense.
In Proceedings of ACSAC, December 2006.
[4] Michael Walfish, Mythili Vutukuru, Hari Balakrishnan, David Karger, and Scott Shenker. DDoS Defense by Offense. In Proceedings of ACM SIGCOMM,
September 2006.
[5] Jerry Chou, Bill Lin, Subhabrata Sen, and Oliver
Spatscheck. Proactive Surge Protection: A Defense
Mechanism for Bandwidth-Based Attacks. In Proceedings of USENIX Security Symposium, August
2008.
[12] J. Mirkovic, E. Arikan, S. Wei, S. Fahmy, R. Thomas,
and P. Reiher. Benchmarks for DDoS Defense Evaluation. In Proceedings of Micom, October 2006.
[13] J. Mirkovic, P. Reiher, S. Fahmy, R. Thomas, A. Hussain, S. Schwab, and C. Ko. Measuring Denial-ofService. In Proceedings of Quality of Protection Workshop, October 2006.
[14] J. Mirkovic, S. Fahmy, P. Reiher, R. Thomas, A. Hussain, S. Schwab, and C. Ko. Measuring Impact of DoS
Attacks. In Proceedings of DETER Workshop, June
2006.
[15] J. Mirkovic, E. Arikan, S. Wei, S. Fahmy, R. Thomas,
and P. Reiher. Benchmarks for DDoS Defense Evaluation. In Proceedings of DETER Workshop, June 2006.
[16] I. Stoica, R. Morris, D. Karger, M. F. Kaashoek, and
H. Balakrishnan. ”chord: A scalable peer-to-peer
lookup service for internet applications”. In Proceedings of ACM SIGCOMM, 2001.
[17] D. M. Nicol. Scalability of network simulators revisited. In Proceedings of the Communications Networking and Distributed Systems Modeling and Simulation
Conference, February 2003.
[6] Xin Liu, Xiaowei Yang, and Yanbin Lu. To Filter or
to Authorize: Network-Layer DoS Defense Against
Multimillion-node Botnets. In Proceedings of ACM
SIGCOMM, August 2008.
[18] D. M. Nicol. Utility analysis of network simulators.
International journal of simulation: Systems, Science,
and Technology, 2003.
[7] Erinc Arikan. Attack Profiling for DDoS Benchmarks.
Master’s thesis, University of Delaware, 2006.
[19] L. Breslau, D. Estrin, K. Fall, S. Floyd, J. Heidemann,
A. Helmy, P. Huang, S. McCanne, K. Varadhan, Y. Xu,
and H. Yu. Advances in network simulation. IEEE
Computer, 33(5):59–67, May 2000.
[8] J. Mirkovic, B. Wilson, A. Hussain, S. Fahmy, P. Reiher, R. Thomas, and S. Schwab. Automating DDoS
Experimentation. In Proceedings of DETER Workshop, August 2007.
[20] S. Floyd and E. Kohler. Internet research needs better models. In Proceedings of ACM HotNets, October
2002.
[9] J. Mirkovic, A. Hussain, B. Wilson, S. Fahmy, P. Reiher, R. Thomas, W. Yao, and S. Schwab. Towards
User-Centric Metrics for Denial-Of-Service Measurement. In In Proceedings of the Workshop on Experimental Computer Science, June 2007.
[21] OPNET.
Network
modeling
and
simulation
environment.
http://www.opnet.com/products/modeler/home.html.
[10] J. Mirkovic, S. Wei, A. Hussain, B. Wilson,
R. Thomas, S. Schwab, S. Fahmy, R. Chertov, and
P. Reiher. DDoS Benchmarks and Experimenter’s
Workbench for the DETER Testbed. In Proceedings
of Tridentcom, May 2007.
[23] B. Van den Broeck, P. Leys, J. Potemans, J. Theunis,
E. Van Lil, and A. Van de Capelle. Validation of router
models in OPNET. In Proc. of OPNETWORK, 2002.
[11] J. Mirkovic, A. Hussain, B. Wilson, S. Fahmy, W. Yao,
P. Reiher, S. Schwab, and R. Thomas. When Is Service Really Denied? A User-Centric DoS Metric. In
Proceedings of Sigmetrics, June 2007. (poster paper).
[22] OMNeT++. http://www.omnetpp.org/.
[24] B. White, J. Lepreau, L. Stoller, R. Ricci, S. Guruprasad, M. Newbold, M. Hibler, C. Barb, and
A. Joglekar. An Integrated Experimental Environment
for Distributed Systems and Networks. In Proceedings of OSDI, pages 255–270, Boston, MA, Decemeber 2002. USENIX.
[25] T. Benzel, R. Braden, D. Kim, C. Neuman, A. Joseph,
K. Sklower, R. Ostrenga, and S. Schwab. Experience
with DETER: A Testbed for Security Research. In
Proceedings of Tridentcom, March 2006.
[38] A. Kuzmanovic and E. W. Knightly. Low-Rate TCPTargeted Denial of Service Attacks (The Shrew vs. the
Mice and Elephants). In Proc. of ACM SIGCOMM,
August 2003.
[26] R. Chertov, S. Fahmy, and N. B. Shroff. Emulation
versus simulation: A case study of TCP-targeted denial of service attacks. In Proc. of TridentCom, February 2006. Extended version accepted to appear in
ACM Transactions on Modeling and Computer Simulation (TOMACS).
[39] M. Guirguis, A. Bestavros, and I. Matta. Exploiting
the Transients of Adaptation for RoQ Attacks on Internet Resources. In Proceedings of ICNP, Oct 2004.
[27] E. Kohler, R. Morris, B. Chen, J. Jannotti, and M. F.
Kaashoek. The Click modular router. ACM Transactions on Computer Systems, 18(3):263–297, August
2000.
[28] R. Chertov, S. Fahmy, and N. B. Shroff. A deviceindependent router model. In Proc. of IEEE INFOCOM, April 2008.
[29] Larry Peterson, Andy Bavier, Marc E. Fiuczynski, and
Steve Muir. Experiences building planetlab. In Proceedings of the 7th USENIX Symposium on Operating
System Design and Implementation (OSDI ’06), Seattle, WA, November 2006.
[30] D. J. Bernstein. TCP syncookies. http://cr.yp.
to/syncookies.html.
[31] WIDE Project.
MAWI Working Group Traffic
Archive. http://tracer.csl.sony.co.jp/
mawi/.
[32] Aaron Turner.
Tcpreplay tool.
tcpreplay.synfin.net/trac/.
http://
[33] Jitendra Padhye, Victor Firoiu, Don Towsley, and Jim
Kurose. Modeling TCP throughput: a simple model
and its empirical validation. SIGCOMM Comput.
Commun. Rev., 28(4):303–314, 1998.
[34] S. Shakkottai, R. Srikant, N. Brownlee, A. Broido, and
kc claffy. The RTT Distribution of TCP Flows in the
Internet and its Impact on TCP-based Flow Control.
CAIDATechnicalReport,TR-2004-02.
[35] Paul Barford and Mark Crovella. Generating representative web workloads for network and server performance evaluation. In Proceedings of SIGMETRICS,
pages 151–160, 1998.
[40] CERT CC. CERT Advisory CA-1996-21 TCP SYN
Flooding and IP Spoofing Attacks. http://www.
cert.org/advisories/CA-1996-21.html,
1996.
[41] Srikanth Kandula, Dina Katabi, Matthias Jacob, and
Arthur Berger. Botz-4-Sale: Surviving Organized
DDoS Attacks that Mimic Flash Crowds. In NSDI,
2005.
[42] Hani Jamjoom and Kang Shin. Persistent Dropping:
A Efficient Control of Traffic Aggregates. In ACM
SIGCOMM Conference, 2003.
[43] Ratul Mahajan, Steven M. Bellovin, Sally Floyd, John
Ioannidis, Vern Paxson, and Scott Shenker. Controlling high bandwidth aggregates in the network. In
ACM Computer Communication Review, July 2001.
[44] Angelos Stavrou, Angelos D. Keromytis, Jason Nieh,
Vishal Misra, and Dan Rubenstein. MOVE: An Endto-End Solution to Network Denial of Service. In
NDSS, 2005.
[45] N. Spring and R. Mahajan and D. Wetherall. Measuring ISP topologies with RocketFuel. In ACM SIGCOMM Conference, 2002.
[46] S. Schwab, B. Wilson, C. Ko, and A. Hussain. SEER:
A Security Experimentation EnviRonment for DETER. In Proceedings of the DETER Community Workshop on Cyber Security Experimentation and Test,
2007.
[47] Cooperative Association for Internet Data Analysis.
CAIDA Web page. http://www.caida.org.
[36] University of Oregon. Route Views. http://www.
routeviews.org/.
[48] Nortel Networks. QoS Performance requirements
for UMTS. The 3rd Generation Partnership Project
(3GPP). http://www.3gpp.org/ftp/tsg_
sa/WG1_Serv/TSGS1_03-HCourt/Docs/
Docs/s1-99362.pdf.
[37] A. Yaar, A. Perrig, and D. Song. SIFF: A Stateless Internet Flow Filter to Mitigate DDoS Flooding Attacks.
In Proceedings of the IEEE Security and Privacy Symposium, 2004.
[49] Nina Bhatti, Anna Bouch, and Allan Kuchinsky. Quality is in the Eye of the Beholder: Meeting Users’ Requirements for Internet Quality of Service. Technical
Report HPL-2000-4, Hewlett Packard, 2000.
[50] L. Yamamoto and J. G. Beerends. Impact of network
performance parameters on the end-to-end perceived
speech quality. In In Proceedings of EXPERT ATM
Traffic Symposium, September 1997.
[51] T. Beigbeder, R. Coughlan, C. Lusher, J. Plunkett,
E. Agu, and M. Claypool. The Effects of Loss and
Latency on User Performance in Unreal Tournament
2003. In In Proceedings of ACM NetGames 2004.
[52] Nathan Sheldon, Eric Girard, Seth Borg, Mark Claypool, and Emmanuel Agu. The Effect of Latency on
User Performance in Warcraft III. In In Proceedings
of ACM NetGames 2003.
[53] K. Vishwanath and A. Vahdat. Realistic and Responsive Network Traffic Generation. IEEE/ACM Transactions on Networking, 2009.


© Copyright 2026