
Effect of cattle genotype and feeding regime on
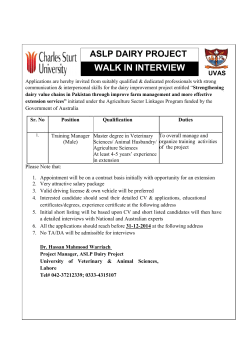
Ross, S.A., Chagunda, M.G.G., Topp, C.F.E. and Ennos, R. (2014)
Effect of cattle genotype and feeding regime on greenhouse gas
emissions intensity in high producing dairy cows. Livestock
Science, 170 pp. 158-171. ISSN 1871-1413.
NOTICE: this is the author’s version of a work that was accepted
for publication in Livestock Science. Changes resulting from the
publishing process, such as peer review, editing, corrections,
structural formatting, and other quality control mechanisms may
not be reflected in this document. Changes may have been made to
this work since it was submitted for publication. A definitive
version was subsequently published in Livestock Science, [170,
December 2014)]DOI: 10.1016/j.livsci.2014.09.011
Copyright © 2014 Elsevier B.V. All rights reserved
http://hdl.handle.net/11262/10693
Deposited on: 31 March 2015
SRUC Repository – Research publications by members of SRUC
http://openaccess.sruc.ac.uk/
1
Effect of cattle genotype and feeding regime on greenhouse gas emissions intensity in
2
high producing dairy cows
3
4
Stephen A. Rossa, Mizeck G. G. Chagunda*a, Cairistiona F. E. Toppa, Richard Ennosb
5
6
a
SRUC, King’s Buildings, West Mains Road, Edinburgh, EH9 3JG, UK
7
b
School of Biological Sciences, University of Edinburgh, King’s Buildings, Mayfield Road,
8
Edinburgh, EH9 3JR, UK
9
10
*
11
Tel: 0044 1387 263961; Fax: 044 1387 251789; E-mail: [email protected]
Corresponding author
12
13
Abstract
14
15
Improving milk production through livestock feeding and genetics is a promising approach
16
for reducing greenhouse gas emissions (GHG) from dairy production systems. This study
17
investigated emissions intensity, defined as the global warming potential (GWP) per unit
18
energy corrected milk (ECM) output, of high-producing dairy systems. Objectives of this
19
study were: to determine the effect of forage regime and cattle genetic line on GHG
20
emissions from the life cycle of four directly comparable dairy production systems; to
21
examine differences amongst contributing GHG emissions sources, and to identify key
22
parameters contributing the most uncertainty in overall GWP. Life cycle analysis (LCA) was
23
conducted based on seven years data collected from a long-term Holstein-Friesian genetic
24
and management systems project. The four dairy production systems comprised two feeding
25
regimes of High and Low Forage applied to each of two genetic lines. The Control line
1
1
represented the average UK genetics and Select line representing the top 5% of UK genetics
2
for milk fat and protein.
3
Select genetic line animals managed under Low Forage regime was estimated to hold
4
potential to reduce emissions intensity by 24% compared to Control genetic merit cows
5
managed under a High Forage regime. Individually, improving genetic merit of the herd and
6
implementing Low Forage regime hold potential to reduce emissions intensity by 9% and
7
16% respectively. Key factors in the differences amongst systems were greater off-farm
8
emissions under Low Forage regime, and greater on-farm nitrous oxide emissions associated
9
with High Forage. In contrast to overall emissions, the emissions intensity was lower in Low
10
Forage groups than in High Forage groups because of high milk yield in Low Forage groups.
11
Six key parameters contained the greatest influence on uncertainty in results. These included:
12
three Intergovernmental Panel on Climate Change (IPCC) coefficients concerning indirect
13
emissions from volatilized nitrogen (EF4), direct nitrous oxide emissions from nitrogen input
14
to soil (EF1), and emissions from direct deposition of excreta at pasture (EF3 PRP); and three
15
system-specific emissions factors for animals’ excreted nitrogen rate, enteric methane and
16
manure methane. The coefficients EF4, EF1, and EF3 PRP should be prioritized for better
17
definition in order to minimize uncertainty in future studies.
18
19
Key Words: life cycle assessment, dairy, forage, genotype, greenhouse gas, emissions
20
intensity
21
2
1
1. Introduction
2
3
1.1. Background
4
5
There has been increasing attention paid during the past decade to the contribution of food
6
production to climate change and the challenge faced by society’s current demand for
7
products such as meat and dairy. Globally, the dairy sector contributes 4% of the total
8
anthropocentric greenhouse gas (GHG) emissions (FAO, 2010). If the dairy industry is to
9
meet the growing global demand for dairy products, ways to minimize GHG emissions per
10
unit product will become increasingly important. Gerber et al. (2011) defined the GHG
11
emissions per unit physical output as the emissions intensity of dairy production. Many
12
countries have established ambitious GHG reduction targets, and the UK dairy industry has
13
identified a target of 20-30% reduction by 2020 (Dairy Roadmap, 2013) compared to 1990
14
levels. The magnitude of emissions means that any potential improvements made in the
15
global warming potential (GWP) of dairy production systems will make a substantial
16
contribution towards attaining climate change targets around the world.
17
18
1.2. Greenhouse gas emissions from dairy production systems
19
20
Component GHG contributing to the total GWP of dairy production systems arise from
21
processes both on and off the farm. Methane (CH4) arises from enteric fermentation in
22
ruminant animals, and from an aerobic fermentation of stored animal manures. Enteric CH4 is
23
influenced by the animal’s feed intake, feed composition and the type of feed consumed
24
(Chagunda et al., 2009; Garnsworthy et al., 2012). Emissions of nitrous oxide (N2O) arise
25
both directly and indirectly from multiple on farm sources (de Boer, 2003). These include the
3
1
deposition of manure and urine on pasture, application of manure and chemical fertilizers to
2
crops, and from decomposition of crop residues in the soil (IPCC, 2007). Carbon dioxide
3
(CO2) emissions derive mainly from energy use on the farm and in the processes surrounding
4
external production and transport of purchased feeds and fertilizers. The dynamic relationship
5
between the operational and natural processes of a dairy production system leads these three
6
GHG to be inexorably linked. Thus even a small shift in the balance of these GHG emissions
7
produced may lead to a substantial difference in overall GWP.
8
9
Steinfeld et al. (2006) stated that the most promising approach for reducing emissions from
10
livestock systems is by improving the efficiency of livestock production through feeding and
11
genetics. It has been shown that high yielding dairy cows with high feed intakes are
12
associated with a lower enteric CH4 output per unit milk (Garnsworthy, 2004; Casey and
13
Holden, 2005; Bell et al., 2010). However, Chagunda et al. (2009) showed that although
14
increasing milk yield was associated with a reduction in enteric CH4 per unit milk, there
15
could be an increase in excreted waste nitrogen per unit milk and per hectare of land used
16
depending on the genetic merit of animals and the specifics of the production system. It has
17
also been demonstrated that while implementing an organic system can reduce overall
18
emissions of CO2 and N2O, the reduction in GWP may be nullified by lower production and
19
an inherent overall increase in enteric CH4 (de Boer, 2003). Weiske et al. (2006) also noted
20
that, due to the trade-offs amongst dairy GHG emissions, many mitigation measures
21
suggested in the literature do not always result in the expected reduction potential when
22
evaluated at the farm level. The overall GHG pollution potential from dairy production
23
systems is therefore a dynamic process which should be assessed at a whole systems level in
24
order to optimize the balance of the total output of pollutants against milk production. This
4
1
whole system analysis can be performed using a method such as Life Cycle Assessment
2
(LCA).
3
4
Over the past decade, studies have been undertaken at system level examining the
5
relationships between GHG in dairy farms. Many studies have been aimed towards
6
demonstrating the application of the LCA method in dairy farming (van der Werf et al., 2009;
7
O’Brien et al., 2011). Furthermore, LCA studies assessing a whole farm system have been
8
conducted mainly in the context of providing a comparison between the environmental
9
efficiency of conventional and organic systems (de Boer, 2003; Thomassen et al., 2008), or
10
between typical systems at a national level (Cederberg and Flysjö, 2004; Saunders and
11
Barber, 2007). A recent study study by Kristensen et al (2011) observed the large variations
12
in GHG emissions per kg product that existed amongst farms within and not between
13
convensional and organic production systems. Studies at production system level have not
14
examined in depth the potential that exists to reduce emissions intensity within a herd through
15
maintaining cows of different genetic merit under different feeding and management regimes.
16
17
1.3. Objectives
18
19
Objectives of this research were: (1) to determine the effect of forage regime and cattle
20
genetic line on GHG emissions from the life cycle of four directly comparable dairy
21
production systems; (2) to examine differences amongst contributing GHG emissions
22
sources, and; (3) to identify key parameters contributing the most uncertainty in overall
23
GWP.
24
25
2. Materials and Methods
5
1
2
2.1. Dairy Production Systems
3
4
The study was based on Scotland’s Rural College’s (SRUC) established long-term Holstein-
5
Friesian genetic and management systems project, situated at SRUC Dairy Research Centre,
6
Crichton Royal Farm (CRF), Dumfries. Data used were collected over seven years, from
7
January 2004 to December 2010, and incorporated specifics of four distinct dairy production
8
systems within a conventional farm. Animals were maintained in two feeding regimes; High
9
Forage (HF) and Low Forage (LF). The HF regime aimed to provide 75% by dry matter
10
(DM) of the herd’s total mixed ration (TMR) diet when indoors from home grown forage
11
crops (ryegrass silage, whole-crop maize, whole-crop wheat alkalage) and the remainder of
12
the ration composition coming from purchased concentrated feeds (including: distillers
13
grains, rapeseed meal). In addition, HF cows were grazed ryegrass pasture when available,
14
typically from March to November, therefore the total home grown element of the HF cows’
15
annual diet was greater than 75%. Contrasting, the LF groups were fully housed all year
16
round and fed a TMR comprising 45% by DM of the same home grown forages, with 55%
17
from purchased concentrates (including: wheat, distillers grains, sugar beet pulp, soya meal)
18
imported onto the farm (Chagunda et al., 2009). Within each forage regime, animals
19
comprised two contrasting genetic lines. Control (C) animals were bred to be of average UK
20
genetic merit for milk fat and protein production, and Select (S) animals represented the top
21
5% of UK genetic merit (Pryce et al., 1999). The Langhill genetic lines have been
22
continuously managed as part of a long-standing dairy cow breeding study since the 1970’s.
23
The representativeness of the selection criteria was maintained in each year of the study
24
(Hinks, 1976). Maintaining the specifics of these groups in the long term genotype x feeding
25
regime project resulted in four divergent dairy production systems – HFC, HFS, LFC and
6
1
LFS (Chagunda et al., 2009). These systems were representative of the interaction between
2
forage regime and genetic line (Pryce et al., 1999), and also offer a representative cross-
3
section of existing and potential dairy production systems in the UK. Animals were managed
4
in a 3 lactations programme before moving out of the systems study, with all-year round
5
calving, and herd numbers maintained at approximately 50 cows in each group. The 3
6
lactations management was considered applicable to UK dairy systems as the average dairy
7
cow lifespan is noted to be 3.3 lactations (FAWC, 2009). Management in 3 lactations applied
8
a comparable replacement rate amongst systems, however differences existed in the
9
involuntary culling rate. Cows were milked three times daily, received equal treatment
10
regarding health and fertility and were under responsibility of the same herdsman. Select and
11
Control cows were managed together and groups retained in the same building when housed.
12
Young stock from all groups were managed together and fully housed. A selection of traits
13
and characteristics describing the four dairy production systems is presented in table 1.
14
15
2.2. Data collection
16
17
The life cycle inventory treated each of the Langhill systems as a whole farm, accounting for
18
not only the milking herd but replacement animals as well. All farm-derived data were a true
19
representation of management at CRF, and were summarized as inputs by calendar year.
20
Livestock populations were categorized by age as follows: cows (lactating or dry cows),
21
pregnant heifers older than 24 months, heifers aged between 12-24 months, and between 0-12
22
months. The average population of each livestock age category was determined as the total
23
number of animal feed days divided by 365. Bull calves were not included in this study. Milk
24
yield was recorded for individual cows at every thrice daily milking. Data on milk
25
composition (milk fat and protein) were recorded from samples collected from each cow once
7
1
a week. Live-weights were recorded daily for cows after every milking and weekly for dry
2
cows, and replacement stock. Specific diets were fed depending on animals’ production
3
system, age, and stage of pregnancy where appropriate. The formulated TMR was offered
4
once a day to each group and daily feed intake of individual lactating cows was recorded
5
using automated HOKO feeding gates (Insentec BV, Marknesse, The Netherlands). Applying
6
the estimates from Bell et al. (2010), dry matter intake (DMI) of HF cows grazing pasture
7
was 19.2 kg day-1 for Control and 20.8 kg day-1 for Select cows. Herbage intake of grazing
8
cows is difficult to predict. However, the research by Bell et al. (2010) compared several
9
leading methods for predicting herbage intake, and made robust estimates for Langhill
10
systems based on the cows’ energy balance, selecting a method which minimized uncertainty.
11
Dried-off cows were initially fed a specific drying-off diet, followed by a transition period
12
ration for the three weeks prior to predicted calving date. The transition diet comprised one-
13
third of the lactating cow TMR plus 5 kg of wheat straw. Compositions of the Langhill TMR
14
formulations are presented in table 2. All young stock were managed together on the same
15
diet irrespective of their system. A typical diet for young stock, from birth to the pre-calving
16
transition period, was derived in consultation with the senior dairyman at CRF (Kelly, 2010)
17
and the Farm Management Handbook (Craig and Logan, 2012). Samples of all forages and
18
rations were collected weekly and analyzed for DM and metabolizable energy (ME) content,
19
crude protein (CP) content and digestibility.
20
Three forage crops were grown at CRF: ryegrass silage, whole-crop wheat alkalage and
21
whole-crop maize silage. Ryegrass silage was harvested in three cuts, typically in April, July
22
and September. Harvest yields from all three crops were retained on farm to be used as
23
forages for indoor feeding, with additional improved land employed as ryegrass pasture for
24
grazing. All harvested crops were stored in covered outdoor silage clamps. Dry matter losses
25
were considered during harvesting (categorized as mechanical, respiration, wilting and
8
1
leaching losses), ensiling (surface, effluent and invisible losses) and unloading (mechanical
2
losses) of forages (Bastiman and Altman, 1985; MacDonald et al., 1991). Average crop
3
yields and on-farm land use over the period are presented in table 3. A combination of animal
4
manure and manufactured fertilizers was applied to crops, in common with conventional
5
farming system practice. Manure was applied via slurry injection, while purchased fertilizers
6
applied included urea, ammonium nitrate and a range of NPK fertilizers. The average annual
7
application of purchased nitrogen over the period is presented in table 3. Animal manures
8
were managed as either liquid storage, solid storage or deposition at pasture. Liquid system
9
manure was conta``ined in a reservoir underneath the main steading before pumping into
10
storage in two uncovered outdoor slurry tanks, while solid manure was collected daily in an
11
uncovered outdoor store. All stored slurry and manure was subsequently retained on-farm
12
and applied to land as manure fertilizer. All manure from milking parlour, and from the
13
continually housed LF milking cows was transferred into a liquid slurry storage system. The
14
proportion of manure from HF cows collected in liquid storage or deposited at pasture was
15
relative to the amount of time spent grazing. All young stock, dry and transition cows were
16
fully housed, and their manure was managed as solid storage farm yard manure (FYM).
17
Electricity invoices were obtained from CRF for the period, and all tractors and other farm
18
machinery ran on red diesel. Average data covering the livestock inputs, energy use and
19
production level of the different systems are presented in table 4.
20
21
2.3. Life Cycle Assessment
22
23
2.3.1 Goal and Scope Definition
24
9
1
The boundary of the current LCA was defined as from ‘cradle to farm gate’ (BSI, 2011),
2
covering the stages from the extraction or acquisition of raw materials up to the point at
3
which the product milk left the farm. A flow diagram displaying the on- and off-farm
4
processes included within the LCA boundary is presented in figure 1. The study did not
5
therefore account for the subsequent processing and transport of consumer dairy products.
6
However, this approach was appropriate because 80% of dairy product GHG emissions are
7
associated with the production phase (Yan et al., 2011), and the product raw milk from the
8
four systems was treated equally in post-farm processing. The study did not take account of
9
capital goods, such as the purchase and upkeep of buildings, machinery and of farm
10
personnel. Inputs such as medicines, seeds, detergents and disinfectant were excluded
11
because of their minimal impact upon the system (Cederberg, 1998). No account was made of
12
carbon sequestration or loss resulting from land-use change in this study. The time frame of
13
each assessment was one calendar year, removing any influence of seasonality.
14
The functional unit in this study was ‘one kg of energy corrected milk (ECM) leaving the
15
farm gate’. Following Sjuanja et al. (1990), the equation used in this study was:
16
ECM (kg) = 0.25M + 12.2F + 7.7P
17
where M = milk yield (kg), F = fat content (kg), P = protein content (kg).
18
All forage crops and manure were retained on the farm, and the value of surplus and culled
19
livestock was defined to be the only co-product of the systems. Therefore, the International
20
Dairy Federation (IDF) method of mass allocation between milk yield and sold stock was
21
employed (IDF, 2010). System-specific allocation values were determined for each system in
22
each year of the study. The average allocation value to milk was 83% (sd=4%), 88% (2),
23
81% (5) and 87% (4) for LFC, LFS, HFC, HFS respectively. These figures are noted to be
24
broadly consistent with the economic value of 85% allocated to milk which has been
25
employed by several previous studies (including: Cederberg and Mattsson, 2000; Basset-
10
1
Mens et al., 2005; Saunders and Barber, 2007) and the default value for physical allocation to
2
milk of 85.6% recommended by the IDF (2010).
3
4
2.3.2 Inventory Analysis
5
6
System specific emissions factors were estimated for enteric methane, methane from
7
anaerobic fermentation of manure, and animals’ excreted waste nitrogen. Daily enteric CH4
8
was estimated using the non-linear equation by Mills et al. (2003) based upon metabolizable
9
energy intake (MEI). The equation used was:
10
CH4 (MJ day-1) = 45.98 – 45.98 exp-0.003 x MEI.
11
Emissions factors for CH4 arising from deposition and management of animal manures were
12
calculated using equations by the IPCC (2006). Excreted nitrogen was determined as the
13
difference between nitrogen consumed and nitrogen utilized in milk production, growth and
14
maintenance. Nitrogen consumed was estimated from weekly averages of cows’ dry matter
15
intake (DMI) and weekly feed samples to determine crude protein (CP) content of their diet.
16
Emissions of N2O arising from manure management and deposition at pasture, application of
17
all fertilizers to the soil, and from crop residues, were estimated using IPCC (2006)
18
equations. Emissions factors employed covered direct N2O emissions, and indirect N2O
19
emissions from volatilization, leaching and run-off, and direct emissions of CO2 arising from
20
applied urea. Coefficients used for emissions associated with the production and delivery of
21
manufactured fertilizers were sourced from the Carbon Trust Footprint Expert (Carbon Trust,
22
2010b). Emissions factors employed for the production, delivery and use of energy and fossil
23
fuels were sourced from the Department for Environment, Food and Rural Affairs (DEFRA,
24
2011). The specific emissions factors employed in this study are presented in table 5.
11
1
Embedded emissions associated with the production and delivery of purchased feeds were
2
determined using Footprint Expert (Carbon Trust, 2010a; 2010b). Allocations were made
3
between co-products where they existed for imported concentrates, for example between
4
rapeseed oil and rapeseed meal. These allocations were made according to the mass
5
allocation values identified by Cederberg and Mattsson (2000), which were similarly
6
employed by Bell et al. (2011). Allocations of embedded emissions were made as follows for
7
purchased feed components: sugar beet (66% sugar, 22% beet pulp, 12% molasses); soya
8
(20% oil, 80% meal, not accounting for land use change); rapeseed (40% oil, 60% meal). A
9
breakdown of estimated land use and emissions embedded in purchased feed blends for High
10
forage (HF) and Low forage (LF) rations is presented in table 6.
11
12
2.3.3 Impact Assessment
13
14
Environmental impact assessment was conducted using a modified version of the SAC
15
Carbon Calculator (SAC Rural Business Unit, 2011), designed specifically for use in the
16
Scottish agricultural sector and implementing IPCC Tier 2 methods (IPCC, 2006). Liaising
17
closely with the developer, this study was able to implement system specific coefficients for
18
enteric and manure CH4 and excreted nitrogen, as well as calculator inputs including energy
19
use, animal production and feed intake, digestibility and crude protein content. Emissions of
20
kgCO2e for major GHG were calculated using conversion factors for a 100 year time horizon,
21
defined to be 25 and 298 for CH4 and N2O respectively (IPCC, 2007). The total GWP was
22
estimated for each of the four Langhill systems - LFC, LFS, HFC and HFS – for each of
23
seven full calendar years of the study period.
24
25
2.4. Statistical Analysis
12
1
2
The effect of forage regime and genetic line upon the impact category was assessed using
3
analysis of variance (ANOVA) employing a general linear model (GLM) procedure. The
4
model used was:
yijk = µ + Fi + Gj + (FxG)ij + Aijk + εijk,
5
6
where yijk is the impact category (global warming potential, land use) expressed per kg ECM;
7
µ is the overall mean; Fi is the fixed effect of feeding regime (Low Forage or High Forage);
8
Gj is the fixed effect of genetic line (Control or Select); (FxG)ij is the effect of production
9
system (LFC, LFS, HFC, HFS); Aijk is the random effect of calendar year (2004-2010); εijk is
10
the random error term. Significant differences between variables were determined by
11
conducting pairwise comparisons using the Tukey method. All statistical analysis was
12
conducted using Minitab 16.
13
14
2.5. Sensitivity Analysis
15
16
The SAC Carbon Calculator which was employed in this study was a deterministic model,
17
producing a single figure representing the GWP of an agricultural production system for an
18
annual period. A stochastic simulation analysis was therefore conducted in order to assess the
19
effect of statistical uncertainty in IPCC coefficients and system-specific emission factors.
20
Sensitivity Analysis determined which emissions sources, and which specific coefficients
21
within those sources, were contributing the largest uncertainty to the estimated GWP
22
Uncertainty in this analysis refers to an estimate of imprecision in the result due to the
23
different variation in the inputs, as defined by Basset-Mans et al. (2009). Monte Carlo
24
simulations were performed employing the @Risk package (Palisade Corporation, 2012a) in
25
a similar way as has previously been employed in other dairy studies (e.g. Shalloo et al.,
13
1
2004; Basset-Mens et al., 2009; Zehetmeier et al., 2014). Mean values for farm input data for
2
each system were estimated from the life cycle inventory covering the 7 year period of the
3
study. Probabilistic distributions for inventory emissions factors were applied based on the
4
uncertainty parameters specified by the source of the coefficient (IPCC, 2006; Carbon Trust,
5
2010b; DEFRA, 2011). In the absence of information about the shape of the parameters’
6
distribution, a beta-pert distribution was applied, as demonstrated by Brown et al. (2001).
7
Employing this distribution preserved any asymmetry in the parameter distribution. The
8
estimated system-specific coefficients for CH4 and excreted nitrogen were normally
9
distributed. Uncertainty in the contribution of enteric CH4, estimated using the equation of
10
Mills et al. (2003), was defined by the range of variation in MEI. The uncertainty parameters
11
and distributions applied to emissions factors were those presented in Table 5. Monte Carlo
12
simulations consisting of 10,000 iterations were performed for each of the Langhill systems.
13
The @RISK procedure employed stepwise multiple regression (Palisade Corporation,
14
2012b), and determined regression coefficients explaining how much of the observed
15
uncertainty in the resulting distributions could be attributed to the uncertainty associated with
16
each contributing emissions source. A normalized multiple regression coefficient of 0
17
indicated no relationship between the input and output, while a value of 1 or −1 indicated a 1
18
or −1 standard deviation change in the output for a 1 standard deviation change in the input.
19
Within each contributing source, regression coefficients were also determined for the
20
emissions factors listed in table 5, employed in the impact assessment calculations for each
21
production system.
22
23
3. Results
24
25
3.1. Effect of forage regime and genetic line
14
1
2
Results from ANOVA, showing the effect of forage regime and genetic line upon the GWP
3
of contributing sources, are presented in Table 7. All results presented take into account the
4
allocation of emissions between product milk and meat. Results for the effect of forage
5
regime and genetic line upon the on-farm, off-farm and total land requirement are presented
6
in Table 8.
7
8
3.1.1 Total overall global warming potential
9
10
The most GHG efficient system was defined as having the lowest emissions intensity, i.e.
11
lowest GWP per unit ECM. The effect of the interaction was significant and all four
12
production systems were different (p<0.001) from each other. The random effect of year was
13
significant (p<0.05) although accounted for a very low proportion of the overall variation.
14
LFS was the most GHG efficient system (least squares mean = 0.87 kg CO2e kg-1 ECM,
15
standard error of the mean = 0.016) (p<0.001). The HFC system had the highest emissions
16
intensity (1.14 kg CO2e kg-1 ECM). Emissions intensity of LFS was therefore 24% lower than
17
that of HFC. Within a forage regime Select was more efficient than Control, and Low Forage
18
more efficient than High Forage with the same genetic line (p<0.001). Emissions intensity
19
was observed to be 16% lower in Low Forage regime and 9% lower in the Select line
20
(p<0.001). Methane contributed the highest to the overall GWP, comprising 51-52% of the
21
total in all systems. On-farm CO2 emissions made the lowest contribution for all systems. In
22
the two HF groups, emissions of N2O (23-24%) contributed more to the overall GWP than
23
the indirect CO2e (18%) associated with off-farm processes. Off-farm emissions include
24
those embedded in production and delivery of purchased feed, bedding, and manufactured
25
fertilizers. Conversely, for the two LF groups, contribution from off-farm CO2e (21-22%)
15
1
was greater than that from N2O (19%). Average annual ECM yield per cow was observed to
2
be 9246, 10753, 7281 and 8189 kg in LFC, LFS, HFC and HFS respectively. Annual milk
3
yield per cow was 48% higher in LFS than in HFC, representing a difference of over 3000 kg
4
per cow between the systems. Milk yield per cow was therefore a key factor in this study.
5
6
3.1.2 Breakdown of contributing LCA emissions sources
7
The effect of the interaction term was significant (p<0.001) on the GWP associated with
8
fossil fuel use, purchased feed and bedding, enteric methane, and N2O emissions from
9
management and application of animal manures. HFS had the lowest GWP per unit milk
10
associated with fuel use and LFC the highest, while LFS and HFC were not significantly
11
different. Individually, fossil fuel GWP was 6% higher in Low Forage regime and 6% higher
12
in the Control line. In terms of the emissions embedded in purchased feed and bedding, HFS
13
was again the most efficient, with GWP 24% lower than the least efficient LFC. Within a
14
forage regime the Select line was 8% lower than Control with respect to purchased feed and
15
bedding, and High Forage was 17% lower than Low Forage. Global warming potential
16
associated with enteric fermentation was lowest in LFS and 32% higher in HFC. The
17
individual effects upon GWP of the Low Forage regime and Select genetic line were 16%
18
and 12% lower respectively in terms of enteric CH4. LFS was the most efficient system in
19
terms of N2O emissions from deposition and management of manures. Conversely, HFC
20
produced 63% more N2O from animal manures compared with LFS. Emissions of N2O from
21
animal manures were 30% lower in High Forage regime than Low Forage, and 13% lower in
22
the Select line.
23
24
3.1.3 Individual effects of forage regime and genetic line
25
16
1
The effect of production system was not significant upon the GWP associated with electricity
2
use or methane from animal manures. Neither was the term significant for embedded
3
emissions in production of manufactured fertilizers, N2O emissions from applied
4
manufactured fertilizers, or from crop residues. In these five emissions categories Low
5
Forage feeding regime was more efficient than High Forage feeding regime (p<0.001).
6
Amongst these categories, the individual effect of genetic line was only significant for N2O
7
emissions from crop residues, where emissions intensity was 5% lower in Select than
8
Control. Of the total CH4 produced, 88% was attributed to enteric fermentation, and this
9
proportion was consistent across all systems. Off-farm emissions associated with purchased
10
feed and bedding made the second highest contribution to GWP of the Low Forage regime
11
(16%), one third greater than the contribution of N2O from management and application of
12
animal manures (12%). In the systems managed under High Forage regime, the embedded
13
CO2e emissions in feed and bedding contributed lower (11%) than those N2O emissions
14
associated with animal manures (14-15%). All emissions associated with manufactured
15
fertilizer were higher in High Forage regime.
16
17
3.1.4 Land use
18
19
On-farm land use per kg ECM was greater for the HF groups (p<0.01), with HFC requiring
20
the most farm land (0.98 m2 kg-1 ECM) and LFS the least (0.53 m2 kg-1 ECM). However, off-
21
farm land was greater in LF groups, with LFC estimated to require the highest (0.93 m2 kg-
22
1
23
(p<0.01). Conversely, High Forage groups required 40% more land on-farm than off-farm.
24
Total combined land use, incorporating land used for forages, grazing (where appropriate)
25
and production of purchased feeds was greater in LF groups (p<0.01). LFC required the
ECM). Low Forage groups were estimated to require 57% more land off-farm than on-farm
17
1
highest total land use (1.51 m2 kg-1 ECM) to produce 1 kg ECM, followed by HFC, LFS and
2
HFS (1.39, 1.35 and 1.21 m2 kg-1 ECM, respectively).
3
4
3.2. Contributions to uncertainty in estimated GWP
5
6
3.2.1 Uncertainty in GHG emissions sources
7
8
The regression coefficients determined for the defined component LCA categories
9
contributing to the overall GWP are presented in Table 9. Nitrous oxide emissions associated
10
with the deposition and management of animal manures was the source contributing the
11
largest amount of variation in the overall GWP. Regression coefficients for uncertainty due to
12
manure N2O were considerably higher than those determined for the second highest
13
contributor, the uncertainty due to variation in enteric CH4. These hotspots were consistent
14
across all four dairy production systems. In both LFC and LFS, the CH4 from animal manures
15
was the third highest contributor of uncertainty, followed by N2O associated with applied
16
manufactured fertilizers, and then crop residues. Estimated N2O emissions from
17
manufactured fertilizers contributed the third largest amount of uncertainty to the total GWP
18
of both HFC and HFS.
19
20
3.2.2 Key coefficients contributing to uncertainty
21
22
Six coefficients were identified as key parameters contributing the most to the observed
23
uncertainty in overall GWP:
24
i.
IPCC coefficient for indirect emissions from volatilized nitrogen (EF4)
25
ii.
IPCC coefficient for direct N2O emissions (EF1) from nitrogen input to soil
18
1
iii.
2
IPCC coefficient for emissions from animals’ deposition at pasture (EF3
PRP)
(for
systems managed under High Forage regime only)
3
iv.
System-specific coefficient for excreted nitrogen rates
4
v.
System-specific coefficient for CH4 from enteric fermentation
5
vi.
System-specific coefficient for CH4 from manure management
6
Regression coefficients explaining the contribution of individual of emissions factors to the
7
categories with the highest uncertainty are presented in table 10. In all four dairy production
8
systems, the greatest contribution to uncertainty in N2O emissions from deposition and
9
management of animal manures arose from EF4, concerning indirect emissions from the
10
volatilization of nitrogen. This coefficient was thus the dominant emissions factor in the
11
category contributing the most uncertainty in the overall GWP, with system-specific excreted
12
nitrogen coefficients making the second highest contribution. The IPCC coefficient for direct
13
N2O emissions (EF1) was the dominant parameter in contributing to the uncertainty in GWP
14
from applied fertilizers and manures, and also from crop residues. In two systems (HFC and
15
HFS), the factor for N2O emissions from excreta deposited on pasture by grazing animals
16
(EF3
17
manures category. The influence of this emissions factor was not applicable to the two Low
18
Forage systems.
PRP)
also contributed a large amount of the uncertainty within the N2O from animal
19
20
4. Discussion
21
22
4.1. Effect of forage regime and genetic line on GWP
23
24
4.1.1 Emissions intensity of dairy production systems
25
19
1
The four dairy production systems in this study represent contrasting approaches to dairy
2
herd management, and reflect a range of possible dairy systems. The results for the estimated
3
GWP of the four Langhill systems are broadly in line with figures found in the literature for a
4
conventional temperate European dairy production system (Thomassen et al., 2008; van der
5
Werf et al., 2009). All four Langhill systems were estimated to have a lower GWP than the
6
British average, estimated to be 1.31 kg CO2e kg-1ECM in the recent national study covering
7
415 dairy farms (DairyCo, 2012). This is likely due in part to the higher than average milk
8
production of the Langhill herd, as well as a lower than average use of manufactured
9
fertilizers. Farms in the national study will also have employed a range of different feeding
10
regimes, diets, sources of feeds, and animal management into later lactations. Further, the
11
DairyCo study calculations used national data sources, allocation techniques and emissions
12
factors compliant with PAS:2050.
13
14
Basset-Mens (2008) noted that the strength of drawing direct comparisons between the results
15
of different studies at dairy systems level has in the past been questionable. As the four
16
systems were managed within the boundaries of the same farm, the results can confidently be
17
directly compared to each other. These results suggest that there is potential to reduce the
18
GWP per unit milk yield of a typical conventional dairy system by up to 24%. By improving
19
the genetic merit alone, a dairy herd could potentially implement 9% reduction in emissions
20
intensity. Genetic improvement is a relatively cost effective means by which to achieve
21
reductions in GHG emissions, as the effect is cumulative and permanent (Bell et al., 2012b).
22
Improvement of this nature necessarily proceeds gradually through breeding and would
23
realistically take several years to return results. Once established, however, in the Langhill
24
herd the higher genetic merit delivered an 18% increase in milk yield and contributed
25
significantly to lowering overall emissions intensity. Similarly, results suggest that switching
20
1
to the Low Forage regime holds potential for a reduction in GWP of up to 16% per unit milk.
2
These results in the present study agree with the findings of previous studies (Casey and
3
Holden, 2005; Garnsworthy et al., 2012), who found that improving the milk yield of the herd
4
would significantly reduce enteric CH4 emissions and overall emissions per unit milk.
5
Furthermore, the results of this study confirm that implementing the Low Forage regime
6
reduced GWP per kg milk irrespective of cows’ genetic merit.
7
8
4.1.2 Balance of enteric methane versus lost nitrogen
9
10
The key to reducing the overall GWP at system level lies in understanding where trade-offs
11
arise in the dynamic nature of GHG production in dairy systems. Chagunda et al. (2009)
12
showed that in dairy systems with low enteric CH4 per unit milk had high excreted nitrogen
13
and hence increased emissions from animal manures. Overall enteric CH4 production was
14
higher per cow in Low Forage regime, owing to the higher metabolizable energy (ME)
15
content of the feed. Similarly, total enteric CH4 was greater in the Select groups, attributed to
16
higher DMI and thus higher MEI. However, high total enteric CH4 was offset by the greater
17
milk yield associated with Select genetic line and Low Forage diet. These results are
18
consistent with the findings of Chagunda et al. (2009) and Bell et al. (2010). Further, the
19
results from the current study showed that emissions from deposition and management of
20
animal manures were lowest per unit milk for the highest yielding system. The HFC system
21
produced 63% more N2O per kg ECM from animal manures compared with LFS. The key to
22
this difference lies in the different management practices under which animal manures were
23
treated, and their different associated levels of emissions. Under the Low Forage regime,
24
100% of the fully housed lactating cows’ excreta was stored under anaerobic conditions as
25
liquid slurry. The default IPCC emissions factor for direct N2O emissions from animal
21
1
manures (EF3), when maintained in liquid storage without a crust as practiced at CRF, is zero
2
(IPCC, 2006). In contrast, lactating High Forage cows spent an average of 148 (sd=15) days
3
annually at pasture, where the emissions factor for deposition of animal manures (EF3PRP) is
4
0.02 kg N2O-N per kg nitrogen deposited (IPCC, 2006). This factor is also four times higher
5
than 0.005 kg N2O-N per kg stipulated for solid storage of farm manure. Thus under the High
6
Forage regime, a lower rate of excreted lost nitrogen per cow resulted in higher emissions
7
intensity from animal manures than under Low Forage.
8
9
4.1.3 Land use requirements and purchased feeds
10
11
Despite the differences in feed intake and ration composition among the dairy production
12
systems, the overall on-farm forage crop requirements and hence the overall forage crop land
13
requirements, were comparable. Although a large proportion of the High Forage TMR was
14
from homegrown silages, the ration was only fed during periods when cows were not grazing.
15
In contrast, in the Low Forage management regime, cows were provided with a low
16
proportion of homegrown forages in the TMR throughout the year. However, when on-farm
17
land use was expressed per kg ECM, the requirements were 0.59, 0.53, 0.98 and 0.88m2 kg-
18
1
19
require on average 0.37 m2 more on-farm land per kg ECM than Low Forage regime. As
20
forage crop land was comparable across systems, this difference was therefore almost
21
exclusively due to grazing land needed for lactating cows in High Forage. Select line was
22
also estimated to require 0.08 m2 kg-1 ECM more than Control, due to a higher feed intake.
23
On-farm land use by the dairy production system was a key difference in the higher
24
manufactured fertilizer N2O emissions estimated for High Forage regimes. Low forage
25
groups. Further, on-farm land not required for pasture under Low Forage could be employed
ECM for LFC, LFS, HFC and HFS, respectively. High Forage regime was estimated to
22
1
by the in an environmental scheme for woodland sequestration or energy crops, contributing
2
to further lower GWP of the dairy production system. Low Forage regime required more off-
3
farm land, and more land overall compared to High Forage. Land use requirement under Low
4
Forage was therefore inherently tied to the efficiency of crop production at national or even
5
international level. This is particularly relevant to the global dairy industry in the case of
6
South American production of soyabeans, where further off-farm emissions may also arise
7
from the conversion of forest to productive agricultural land (Flysjo et al., 2012).
8
The emissions intensity associated with purchased feeds was 20% higher in Low Forage than
9
in High Forage groups. Considering the high proportion of purchased feeds in the Low
10
Forage ration, the difference between the two management regimes was lower than expected.
11
This can partly be explained by the emissions intensity being offset by high milk yield in the
12
Low Forage groups. However, the emissions factor for by-product grain was 0.030 kg CO2e
13
per kg of grain, compared with 0.375 and 0.360 kg CO2e per kg of directly sourced wheat and
14
barley respectively (Carbon Trust, 2010a). Thus the inclusion of by-products in the cows’
15
ration led to lower embedded emissions than if all purchased feeds had been directly
16
produced for animal consumption. The sourcing of by-product feeds was a key aspect of
17
reducing emissions intensity in a Low Forage system. However, it is important to consider
18
that if an increasing number of dairy systems switch to sourcing by-product feeds, demand
19
may eventually exceed supply. The Low Forage regime is therefore more sensitive to any
20
changes in the by-product market. Bell et al (2012a) noted that a growth in bio-ethanol
21
production could lead to greater availability and competitive pricing of by-products for
22
farmers. Security of supply will improve the future sustainability of the Low Forage regime
23
which may even enable a higher inclusion of by-products in the diet, further reducing on- and
24
off-farm feed production emissions. However, implementing a Low Forage ration comprising
25
a different ratio or combination of purchased feed components could change the scale of
23
1
emissions intensities identified. Henriksson et al. (2011) noted that purchased animal feeds,
2
for example barley, may differ in how and where it was cultivated, transported and processed
3
in the feed industry. Thus when making comparisons between different studies, the GHG
4
associated with the same purchased feed components may differ.
5
6
4.2. Uncertainty in estimated GWP
7
8
4.2.1 Key parameters contributing to uncertainty
9
10
Sources contributing the most uncertainty to results were N2O emissions from management
11
of manures, and enteric fermentation. This is broadly concurrent with Basset-Mens et al.
12
(2009) and Flysjö et al, (2011) who found that, in similar analyses, the key parameter
13
contributing the highest uncertainty was the emissions factor for direct N2O emissions from
14
excreta deposited directly on grazing (EF3PRP), followed by CH4 emissions from enteric
15
fermentation. In a study of grazing systems in multiple locations, Lovett et al. (2008) found
16
that the contribution to uncertainty from estimated N20 was always greater than for CH4.
17
Both Basset-Mens et al. (2009) and Flysjö et al, (2011) employed a NZ specific emissions
18
factor for deposition at pasture, 50% lower than the IPCC default value, however this factor
19
still produced the highest uncertainty in their respective studies. Within the N2O emissions
20
from animal manures in the present study, however, the coefficient governing indirect
21
emissions from volatilized nitrogen (EF4) was the dominant factor. Under High Forage
22
regime, EF3PRP contributed the next greatest amount of variation to emissions from manures
23
after EF4 and the system specific nitrogen excretion rate. In the present study, average annual
24
grazing under High Forage regime was 148 (sd=15) full days at grass over the period. The
25
EF3PRP parameter was not applicable to Low Forage regime as no animals were permitted to
24
1
graze pasture. Difference between the studies can be explained by the observation that
2
Basset-Mens et al. (2009) based their analysis on an extensive grazing-based NZ dairy
3
production system, with greater proportion of time at pasture but lower nitrogen excretion
4
rate per cow and lower application of both stored manures and manufactured fertilizer.
5
6
4.2.2 Minimizing level of uncertainty
7
8
The overall range in estimated GWP was greater in High Forage systems, suggesting that
9
Low Forage systems were less susceptible to influence of high uncertainty in emissions
10
factors. This is supported by Gibbons et al. (2006), who stated that switching high yielding
11
cows to a higher concentrate, less grass-based diet to reduce emissions was robust to
12
uncertainty in GHG emissions. Although enteric fermentation contributed the most (44-47%)
13
to the total GWP in all systems, this source did not contribute the most uncertainty overall.
14
Enteric CH4 had an emissions intensity three times greater than N2O from animal manures
15
under the High Forage regime, and four times greater under Low Forage regime, yet animal
16
manure emissions made a larger contribution to the overall uncertainty. This goes to highlight
17
that, for as much as a LCA method may seek to minimize the variation in its farm inventory
18
data, a greater and unavoidable component of the uncertainty in LCA results will arise from
19
employing standardized emissions factors. The IPCC coefficient for indirect emissions from
20
volatilized nitrogen (EF4) was the dominant factor in the emissions category contributing
21
most to overall uncertainty. The coefficient for direct N2O emissions from nitrogen applied to
22
soil (EF1) was also a dominant factor for all systems. In a study involving a comparable
23
system (fully housed, Holstein Friesian cows, TMR with grass and maize silage and
24
concentrates, farm gate LCA boundary), Zehetmeier et al. (2014) reported that nitrogen input
25
to soil (EF1) had the highest impact on uncertainty in GHG. The coefficient for deposition at
25
1
pasture (EF3PRP) was a key contributor for High Forage systems. The uncertainty range for
2
EF4 stated in the literature amounts to a factor of 25, while uncertainties in EF1 and EF3PRP
3
range by a factor of 10 and by around 8.5 respectively (IPCC, 2006). These standardized
4
emissions factors necessarily contain a large uncertainty range as they aspire to be
5
representative of the range of natural variability and physical conditions found on a national
6
scale. In the present study, system-specific enteric CH4 emissions factors by contrast were
7
noted to have a coefficient of variation of around 7-10% across all systems. This would seem
8
to illustrate a further advantage of employing the system-specific emissions factors in the
9
present study or, more generally, employing Tier 3 values where possible in the LCA of dairy
10
production systems. Conversely, it has been reported that statistical models which correlate
11
nutrient intake with CH4 production can vary widely where predictions are obtained for
12
breeds, type of diet, nutrient intakes and environments outside those used in model
13
construction (Mills et al., 2003; Boadi et al., 2004). However, the specific enteric CH4
14
equation employed in the present study was previously determined to be most suitable for use
15
in the Langhill herd, satisfying the range of production traits and diets, following a
16
comparison of 22 equations in the literature (Bell et al., 2009). The IPCC note that variation
17
introduced by any Tier 3 emissions factors employed is likely to be minimized, while
18
uncertainties introduced by standardized emission factors are likely to dominate (IPCC,
19
2006). Lovett et al. (2008) also found that the coefficient of variation for enteric CH4 was
20
much lower than those for N2O related emissions factors covering nitrogen leaching or
21
applied fertilizers. Thus after many studies have gone to lengths to define and standardize the
22
LCA methods, perhaps the most crucial aspect for confidence in LCA results in the future lies
23
with narrowing the uncertainty parameters surrounding emissions factors, and developing
24
countries’ respective Tier 2 and Tier 3 coefficients. The present study suggests that increased
25
definition of the inventory coefficients EF1 and EF4 would increase confidence in the
26
1
estimated GWP of all dairy production systems, while minimizing uncertainty in EF3 would
2
improve confidence in LCA results for those systems which involve grazing pasture.
3
4
5. Conclusions
5
6
This study found that the LFS system, where high genetic merit cows were managed under a
7
Low Forage regime, had the lowest emissions intensity with respect to greenhouse gas
8
emissions per unit of milk production. LFS was estimated to hold potential to reduce
9
emissions intensity by 24% compared to average genetic merit cows managed under a High
10
Forage regime. Individually, improving genetic merit of the herd and implementing Low
11
Forage regime hold potential to reduce emissions intensity by 9% and 16% respectively. Key
12
factors in the differences amongst systems were greater off-farm emissions under Low
13
Forage regime, and greater on-farm nitrous oxide emissions associated with High Forage. In
14
Low Forage groups, high overall emissions were matched with increased productivity, but
15
this was not the case for the more extensive High Forage groups.
16
Three IPCC coefficients relating to nitrous oxide emissions (EF1, EF4, and EF3 PRP), and
17
system-specific emissions factors concerning cows’ excreted nitrogen rate, enteric
18
fermentation and manure methane, contributed the greatest uncertainty in results. The IPCC
19
coefficients for direct atmospheric N2O emissions (EF1), indirect emissions from volatilized
20
nitrogen (EF4), and emissions from deposition at pasture (EF3 PRP) should be prioritized for
21
better definition in order to minimize uncertainty in future studies.
22
23
Acknowledgements
24
27
1
The authors are grateful to the farm and technical staff at Crichton Royal Farm, from where
2
the data used in this study were obtained. The authors are also grateful for the contribution to
3
this study made by Gillian Reid at the SAC Rural Business Unit. This study was funded by
4
the Scottish Government.
5
6
References
7
8
Basset-Mens, C., Ledgard, S., Carran, A., 2005. First life cycle assessment of milk
9
production from New Zealand dairy farm systems. In: Proc. Aus. NZ. Soc. Ecol. Econ.
10
Conf, New Zealand, 11–13 Dec 2005. p. 258–65.
11
Basset-Mens, C., 2008. Estimating the carbon footprint of raw milk at the farm gate:
12
methodological review and recommendations. Proc. 6th Int. Conf. on LCA in the Agri-
13
Food Sector, Zurich, November 12–14, 2008. p82-91.
14
Basset-Mens, C., Kelliher, F.M., Ledgard, S., Cox, N., 2009. Uncertainty of global warming
15
potential for milk production on a New Zealand farm and implications for decision
16
making. Int. J. LCA. 14, 630–638.
17
18
Bastiman, G., Altman, J.B.F., 1985. Losses at various stages of silage making. Res. Dev.
Agric. 2, 19-25.
19
Bell, J., Morgan, C., Dick, G., Reid, G., 2012a. Distillery feed by-products briefing: An
20
AA211 Special Economic Study for the Scottish Government. Edinburgh: SAC
21
Consulting.
22
23
Bell, M. J., Wall, E., Russell G., Simm, G., 2009. Modelling methane output from lactating
and dry dairy cows. Aspects of Applied Biology. 93: 47-53.
24
Bell, M. J., Wall, E., Russell G., Morgan, C., Simm, G., 2010. Effect of breeding for milk
25
yield, diet and management on enteric methane emissions from dairy cows. Anim.
26
Prod. Sci. 50, 817-826.
27
Bell, M. J., Wall, E., Russell G., Simm, G., Stott, A.W., 2011. The effect of improving cow
28
productivity, fertility, and longevity on the global warming potential of dairy systems.
29
J. Dairy. Sci. 94, 3662–3678.
30
31
Bell, M.J., Eckard, R.J., Pryce, J.E., 2012b. Breeding dairy cows to reduce greenhouse gas
emissions. In: Javed, K. Livestock Production.
28
1
Boadi, D., Benchaar, C., Chiquette, J., Massé, D., 2004. Mitigation strategies to reduce
2
enteric methane emissions from dairy cows: Update review. Can. J. Anim. Sci. 84 (3),
3
319-335.
4
5
Brown, L., Jarvis, S.C., Headon, D., 2001. A farm-scale basis for predicting nitrous oxide
emissions from dairy farms. Nutr. Cycl. Agroecosyst. 60, 149-158.
6
BSI, 2011. PAS 2050:2011 Specification for the assessment of the life cycle greenhouse gas
7
emissions of goods and services. Publically available specification by the British
8
Standards Institution.
9
10
11
12
13
14
Carbon Trust, 2010a. Footprint Expert Feed Database version 1.1. Carbon Trust Footprinting
Company.
Carbon Trust, 2010b. Footprint Expert Crop Calculator version 3.1. Carbon Trust
Footprinting Company.
Casey, J.W., Holden, N.M., 2005. The Relationship between Greenhouse Gas Emissions and
the Intensity of Milk Production in Ireland. J. Environ. Qual. 34, 429-436.
15
Cederberg, C., 1998. Life cycle assessment of milk production – a comparison of
16
conventional and organic farming SIK, Report No.643. The Swedish Institute for Food
17
and Biotechnology, Goteborg, Sweden. pp. 1–86.
18
19
Cederberg, C., Mattsson, B., 2000. Life cycle assessment of milk production - a comparison
of conventional and organic farming. J. Cleaner Prod. 8, 49–60.
20
Cederberg, C., Flysjo, A., 2004. Life Cycle inventory of 23 dairy farms in South-Western
21
Sweden. In: 728, S.-r.N. (Ed.). The Swedish Institute for food and biotechnology, pp.
22
1–59.
23
Chagunda, M.G.G., Römer, D.A.M., Roberts, D.J., 2009. Effect of genotype and feeding
24
regime on enteric methane, non-milk nitrogen and performance of dairy cows during
25
the winter feeding period. Livest. Sci. 122, 323-332.
26
Craig, K., Logan, R., 2012. The Farm Management Handbook 2012/13 – The UK reference
27
for farm business management. 33rd Edition. SAC Farm and Rural Business Services,
28
Edinburgh.
29
30
31
32
33
34
DairyCo, 2012. Greenhouse gas emissions on British dairy farms. DairyCo carbon
footprinting study: year one. February 2012.
Dairy Roadmap, 2013. The Dairy Roadmap 2013: Environmental Sustainability Report.
Dairy Roadmap.
De Boer, I.J.M., 2003. Environmental impact assessment of conventional and organic milk
production. Livest. Prod. Sci. 80, 69–77.
29
1
DEFRA, 2011. Guidelines to DEFRA / DECC's GHG conversion factors for company
2
reporting. The Department of Energy and Climate Change (DECC) and the Department
3
for Environment, Food and Rural Affairs (DEFRA).
4
5
6
7
FAO., 2010. Greenhouse Gas Emissions from the Dairy Sector - A Life Cycle Assessment.
United Nations Food and Agriculture Organisation.
FAWC, 2009. Opinion on the welfare of the dairy cow. Farm Animal Welfare Council,
London.
8
Flysjö, A., Henriksson, M., Cederberg, C., Ledgard, S., Englund, J., 2011. The impact of
9
various parameters on the carbon footprint of milk production in New Zealand and
10
Sweden. Agri. Syst. 104, 459–469.
11
Garnsworthy, P.C., 2004. The environmental impact of fertility in dairy cows: a modelling
12
approach to predict methane and ammonia emissions. Anim. Feed Sci. & Tech. 112,
13
211–223.
14
Garnsworthy, P. C., Craigon, J. J., Hernandez-Medrano, H., Saunders, N., 2012. Variation
15
among individual dairy cows in methane measurements made on farm during milking.
16
J. Dairy Sci. 95, 3181–3189.
17
18
Gerber, P., Vellinga, T., Opio, C., Steinfeld, H., 2011. Productivity gains and greenhouse gas
emissions intensity in dairy systems. Livest. Sci. 139, 100–108.
19
Henriksson, M., Flysjo, A., Cederberg, C., Svensson, C., 2011. Variation in carbon footprint
20
of milk due to management differences between Swedish dairy farms. Animal. 5 (9),
21
pp1474–1484.
22
Hinks, C. J. M. 1976. The Langhill breeding programme. Intern. J. Dairy Tech. 29, 38-39.
23
IDF, 2010. A common carbon footprint approach for dairy: the IDF guide to a standard life
24
cycle assessment methodology for the dairy sector. Bulletin of the International Dairy
25
Federation 445/2010. Brussels, Belgium.
26
IPCC, 2006. Guidelines for National Greenhouse Gas Inventories Volume 4: Agriculture,
27
Forestry and Other Land Use. Paustian, K. Ravindranath, N.H. van Amstel, A. Gytarsk,
28
M. Kurz, W.A. Ogle, S. Richards, G. & Somogyi, Z. (Eds). Intergovernmental Panel
29
on Climate Change (IPCC).
30
31
32
IPCC, 2007. Intergovernmental Panel for Climate Change Fourth Assessment Report:
Climate Change 2007.
Kelly, P., 2010. Personal communication. Senior Dairyman – Crichton Royal Farm.
30
1
Lovett, D.K., Shalloo, L., Dillon, P., O’Mara, F.P., 2008. Greenhouse gas emissions from
2
pastoral based dairying systems: the effect of uncertainty and management change
3
under two contrasting production systems. Livest. Sci. 116: 260-274.
4
5
MacDonald, P., Henderson, A.R., Heron, S.J.E., 1991. The biochemistry of silage. Second
edition. Chalcombe Publications, Marlow, UK.
6
Mills, J.A.N., Kebreab, E., Yates, C.M., Crompton, L.A., Cammell, S.B., Dhanoa, M.S.,
7
Agnew, R.E., France, J., 2003. Alternative approaches to predicting methane emissions
8
from dairy cows. J. Anim. Sci. 81, 3141-3150.
9
NEA, 2011. Project NF0614 - Environmental assessment tool for biomaterials. Report by
10
North Energy Associates for the Department for Environment, Food and Rural Affairs
11
(DEFRA).
12
13
Nielsen, P.H., Nielsen, A.M., Weidema, B.P., Dalgaard, R., Halberg. N., 2003. LCA food
database. Danish Institute of Agricultural Sciences. http://www.lcafood.dk/database
14
O’Brien, D., Shalloo, L., Buckley, F., Horan, B., Grainger, C., Wallace, M., 2011. The effect
15
of methodology on estimates of greenhouse gas emissions from grass-based dairy
16
systems. Agric. Ecosyst. Environ. 141, 39–48.
17
18
Palisade Corporation, 2012a. Decision Tools Suite version 6.0. Palisade Corporation, Ithica,
NY, USA. www.palisade.com
19
Palisade Corporation, 2012b. Palisade Knowledge Base: Technical notes – sensitivity
20
analysis. Palisade Corporation, Ithica, NY, USA. http://kb.palisade.com/index.php
21
Pryce, J.E., Nielsen, B.L., Veerkamp, R.F., Simm, G., 1999. Genotype and feeding system
22
effects and interactions for health and fertility traits in dairy cattle. Livest. Prod. Sci. 57
23
(3), 193–201.
24
SAC Rural Business Unit, 2011. The SAC Carbon Calculator and Carbon Management
25
Services – capability statement. SAC Rural Business Unit, Bush Estate, Penicuik.
26
Saunders, C., Barber, A., 2007. Comparative Energy and Greenhouse Gas Emissions of New
27
Zealand’s and the UK’s Dairy Industry. Agribusiness and Economics Unit, Lincoln
28
University, NZ.
29
30
Shalloo, L., Dillon, P., Rath, M., Wallace, M., 2004. Description and validation of the
Moorepark Dairy System Model. J. Dairy Sci. 87:1945–1959
31
Sjaunja, L.O., Baevre, L., Junkkarinene, L., Pedersen, J., Setala, J., 1990. A Nordic proposal
32
for an energy corrected milk (ECM) formula. 27th Session of the International
33
Commission for Breeding and Productivity of Milk Animals, Paris, France.
31
1
Steinfeld, H., Gerber, P., Wassenaar, T., Castel, V., Rosales, M., de Haan, C., 2006.
2
Livestock's long shadow: environmental issues and options. Rome: Food and
3
Agriculture Organization of the United Nations.
4
Thomassen, M.A., van Calker, K.J., Smits, M.C.J., Iepema, G.L., de Boer I.J.M., 2008. Life
5
cycle assessment of conventional and organic milk production in the Netherlands.
6
Agric. Syst. 96, 95–107.
7
van der Werf, H.M.G., Kanyarushoki, C., Corson, M.S., 2009. An operational method for the
8
evaluation of resource use and environmental impacts of dairy farms by life cycle
9
assessment. J. Environ. Manage. 90, 3643–3652.
10
Weiske, A., Vabitsch, A., Olesen, J.E., Schelde, K., Michel, J., Friedrich, R., Kaltschmitt, M.,
11
2006. Mitigation of greenhouse gas emissions in European conventional and organic
12
dairy farms. Agric. Ecosyst. Environ. 112, 221-232.
13
14
Yan, M., Humphreys, J., Holden, N.M., 2011. An evaluation of life cycle assessment of
European milk production. J. Environ. Manage. 92, 372-379.
15
Zehetmeier, M., Gandorfer, M., Hoffmann, H., Müller, U.K., de Boer, I.J.M., Heißenhuber,
16
A., 2014. The impact of uncertainties on predicted GHG emissions of dairy cow
17
production systems. J. Cleaner Production. 73: 116-124.
18
32
1
Tables and figures
2
3
4
Table 1
Langhill dairy production systems described by system characteristics
Production Systema
b
Characteristic
Units
LFC
LFS
HFC
mean
-1
s.d.
mean
s.d.
mean
HFS
s.d.
mean
s.d.
-1
kg cow day
29.2 4.45
34.8 4.95
22.9 3.55
26.4 4.46
g kg-1
36
7.0
38
7.4
39
6.5
41
7.1
g kg-1
31
3.6
33
3.9
32
3.9
33
4.4
kg cow-1 day-1
3.22 0.32
3.62 0.37
2.94 0.34
3.22 0.38
days
388
53.3
407
72.3
396
57.7
407
72.5
%
18
4.5
31
7.7
10
5.0
16
6.2
a
LFC = Low Forage Control, LFS = Low Forage Select, HFC = High Forage Control, LFS = High Forage Select,
and Select = representative of top 5% UK genetic merit for milk fat plus protein, Control = average genetic merit.
b
CP = crude protein
Mik yield
Milk fat
Milk protein
Dietary CP
Calving interval
Involuntary cull
5
6
7
8
9
10
Table 2
Total Mixed Ration (TMR) components expressed as percentages (%) of the total formulation offered
to lactating cows under Low Forage and High Forage regime and to dry cows
Low Forage
High Forage
Dry Cows
%
%
%
TMR Component
Ryegrass silage
27.0
45.0
30.0
Wholecrop wheat alkalage
9.0
15.0
10.0
Wholecrop maize silage
9.0
15.0
10.0
Purchased concentrate/blend
53.9
24.2
4.1
Wheat straw
45.0
Minerals
1.1
0.8
0.9
11
12
13
33
1
2
3
4
Table 3
Mean and standard deviation (s.d.) of crop yields, land use and applied purchased nitrogen by
Langhill systemsa
Pasture
Grass silage
Maize silage Wheat Alkalage
Crop yield (dry matter) t ha-1
Land Use
ha
LFC
LFS
HFC
HFS
Purchased N applied
kg
LFC
LFS
HFC
HFS
a
mean
s.d.
mean
s.d.
mean
s.d.
mean
s.d.
10.3
1.5
11.9
2.1
11.6
2.3
10.3
1.5
18.1
18.0
18.2
18.2
4.0
4.2
4.1
4.2
4.0
4.2
4.1
4.2
0.8
0.7
0.9
0.8
3.2
3.4
3.3
3.4
0.7
0.9
0.7
0.8
11.9
12.2
2.8
3.0
2740
2716
3083
2993
393
276
777
789
47
51
48
49
26
26
24
22
224
230
239
244
84
75
102
97
876
912
464
486
LFC = Low Forage Control, LFS = Low Forage Select, HFC = High Forage Control, LFS = High Forage Select
5
6
34
1
2
Table 4
Averages of annual Life Cycle input data by Langhill production system for livestock, energy use and animal production data
Dairy Production Systema
Inputb
Units
LFC
LFS
HFC
mean
s.d.
mean
s.d.
mean
s.d.
47
632
18.0
210
515
4.1
16.3
1.02
12.0
16.8
43
651
20.2
236
580
5.6
13.0
1.24
15.0
24.6
50
605
18.1
184
469
5.9
14.7
0.65
9.5
17.6
HFS
mean
s.d.
Livestock
Cows
LW
DMI
MEI
N intake
n
kg cow-1
kg cow-1day-1
MJ cow-1day-1
g cow-1day-1
48
630
19.1
201
515
5.6
10.7
0.45
7.7
12.1
Energy use
Diesel
Electricity
Animal production
MY
F
P
DW
l
MWh
t
t
t
t
8347
19.3
429
15.3
13.5
6.3
2305
2.0
43.9
1.61
1.11
2.26
8387
21.8
485
18.5
16.2
4.7
a
2426
3.8
84.4
3.53
2.84
0.91
7230
19.4
381
14.6
12.1
6.5
2058
1.7
33.9
1.00
1.05
2.90
7162
21.6
424
17.1
14.2
4.7
2129
2.9
56.2
2.06
1.95
2.27
LFC = Low Forage Control, LFS = Low Forage Select, HFC = High Forage Control, LFS = High Forage Select, where Select = representative of top 5% UK genetic
merit for milk fat plus protein, and Control = average genetic merit.
b
Cows = average no. cows in herd, LW = liveweight, DMI= dry matter intake, MEI = metabolizable energy intake, N = nitrogen, MY = total annual milk yield, F = milk
fat, P = milk protein, DW = combined deadweight of sold livestock at 50% killout
3
4
5
6
35
1
2
3
4
Figure. 1. Flow diagram showing farm and ‘cradle-to-farm-gate’ boundaries for product life cycle of
5
Langhill dairy production systems
6
36
1
2
3
4
Table 5
Emissions factors with default values, uncertainty parameters and probabilistic distributions applied
for sensitivity analysis
Factor
EF1
EF4
EF5
FracLEACH
EF3 PRP
FracGASM
FracGASF
EF3 SS
FracSSV
EF3 LS
FracLSV
EF1CR
EFurea
EFNex
EF ent
EFman
EFN
EFP
EFK
EFdiesel
EFpetrol
EFelec
Description
a
Direct from applied fertilizer
to soil
a
Volatilization, atmospheric
deposition of nitrogen
a
Leaching and run-off
a
% lost from leaching
a
Direct from deposition of
cows’ excreta at pasture
a
Volatilization from animal
excreta at pasture
a
Volatilization from applied
fertilizers
a
Direct from solid storage of
animal manure
a
Volatilization from solid
storage of animal manure
a
Direct from liquid storage of
animal manure
a
Volatilization from liquid
storage of animal manure
a
Direct from crop residues
a
Direct emissions from applied
urea
b
Excreted Nitrogen
b
Enteric methane
b
Manure methane
c
Production of nitrogen
c
Production of phosphate
c
Production of potash
d
Associated with red diesel
d
Associated with petrol
d
Associated with electricity
Units
kgN2O-N kgN-1
Default
0.01
Range
0.003-0.03
Distribution
Beta
kgN2O-N kgN-1
0.01
0.002-0.05
Beta
kgN2O-N kgN-1
%
kgN2O-N kgN-1
0.0075
30
0.02
0.0005-0.025
10-80
0.007-0.06
Beta
Beta
Beta
%
20
5-50
Beta
%
10
3-30
Beta
kgN2O-N kgN-1
0.005
0.0025-0.01
Beta
%
30
10-40
Beta
kgN2O-N kgN-1
0
0
-
%
40
15-45
Beta
kgN2O-N kgN-1
kgCO2-C kgUrea-1
0.01
0.2
0.003-0.03
0.0-0.2
Beta
Triangular
kgN cow-1year-1
kgCH4 cow-1year-1
kgCH4 cow-1year-1
kgCO2e kgN-1
kgCO2e kgP-1
kgCO2e kgK-1
kgCO2e l-1
kgCO2e l-1
kgCO2e kWh-1
Specific to system and age
Specific to system and age
Specific to system and age
7.11
6.85-7.37
1.85
1.61-2.09
1.76
1.61-1.91
3.176
2.818-3.533
2.667
2.368-3.065
0.594
0.582-0.605
a
IPCC (2006)
System-specific calculations
c
Carbon Trust (2010b)/NEA (2011)
d
DEFRA (2011)
b
5
6
37
Normal
Normal
Normal
Beta
Beta
Beta
Beta
Beta
Normal
1
2
Table 6
3
Breakdown of estimated land use and emissions embedded in purchased feed blends for High forage (HF) and Low forage (LF) rations
Purchased component
Barley distillery grain
Wheat distillery grain
Wheat
Sugar beet pulp
Soyabean mealc
Rapeseed meal
Complete blend
Whole crop
Dry matter yielda Embedded emissionsb
t ha-1
gCO2e kg-1
5.9
7.0
7.0
10.0
3.0
3.9
30
30
354
30
220
400
Proportion in blend
LF
HF
Land use per kg feed blend Emissions per kg feed blend
LF
HF
LF
HF
m2 kg-1
%
13
34
28
25
33.3
33.3
0.18
0.46
0.06
0.75
33.3
1.44
a
Average whole crop yields derived from: Craig & Logan (2012), Scottish Government (2012), DEFRA (2011b)
Carbon Trust (2010a)
c
Value for soya land use from Nielsen et al. (2003). Assumed sourced from Brazil, excludes land use change.
b
4
5
38
gCO2e kg-1
0.43
0.43
0.70
1.55
3.9
118.0
8.4
56.8
187.0
10.0
10.0
133.3
153.3
1
Table 7
2
Breakdown of results from Analysis of Variance (ANOVA)a, showing Global Warming Potential (GWP) per kilogram energy corrected milk (ECM),
3
attributed to contributing categories of Life Cycle Assessment
Variable
Levelb
Production
system
(FxG)
LFC
LFS
HFC
HFS
sem
Low (LF)
High (HF)
sem
Control (C)
Select (S)
sem
Forage
regime (F)
Genetic
line (G)
R2 value
4
5
6
7
8
9
Fossil
fuels
Electricity
CO2
CO2
a
0.051
0.022
b
0.048
0.024
0.048b
0.025
c
0.046
0.026
0.0008
0.0008
a
0.049
0.023b
0.047b
0.026a
0.0006
0.0005
a
0.049
0.024
b
0.047
0.025
0.0006
0.0005
0.94
0.95
Manufactured Purchased
fertilizer
feed &
Enteric
Animal
production
bedding fermentation manures
CO2e
CO2e
CH4
CH4
a
c
0.048
0.154
0.451
0.052
b
d
0.045
0.143
0.393
0.049
0.074
0.129c
0.518a
0.074
d
b
0.071
0.118
0.462
0.073
0.0032
0.0030
0.0094
0.0027
b
a
b
0.046
0.149
0.422
0.051b
0.073a
0.124b
0.490a
0.073a
0.0027
0.0020
0.0067
0.0019
a
a
0.061
0.142
0.484
0.063
b
b
0.058
0.131
0.428
0.061
0.0027
0.0020
0.0067
0.0019
0.89
0.87
0.85
0.88
a
Animal
manures
N2O
0.119a
0.103b
0.168c
0.148d
0.0031
0.111a
0.158b
0.0020
0.144a
0.125b
0.0021
0.94
Manufactured
fertilizer
Crop
application residues
N2O
N2O
0.036
0.030
0.034
0.028
0.056
0.044
0.053
0.042
0.0024
0.0005
a
0.035
0.029b
0.055b
0.043a
0.0017
0.0004
0.046
0.037a
0.043
0.035b
0.0017
0.0004
0.89
0.97
Total
Overall
GWP
CO2e
0.963c
0.866d
1.136a
1.040b
0.0163
0.914b
1.088a
0.0116
1.049a
0.953b
0.0116
0.91
All results presented as least squares means (lsm) with standard errors of the mean (sem), and expressed in terms of kilograms of carbon dioxide equivalents per kilogram
Energy Corrected Milk (kg CO2e kg ECM-1). Different superscripts within a column denote significant differences between levels of same variables (p<0.001).
b
LFC = Low Forage Control, LFS = Low Forage Select, HFC = High Forage Control, LFS = High Forage Select
39
1
2
3
4
Table 8
Results from Analysis of Variance (ANOVA)a showing land use per kilogram of Energy Corrected
Milk (ECM)
Variable
Levelb
On-farm
m kgECM-1
0.59b
0.53b
0.98a
0.88a
0.037
0.56b
0.93a
0.037
0.78a
0.70
b b
0.012
0.93
2
Production system
(FxG)
Forage regime (F)
Genetic line (G)
LFC
LFS
HFC
HFS
sem
Low (LF)
High (HF)
sem
Control (C)
Select (S)
sem
R2 value
Land Usea
Off-farm
m2 kgECM-1
0.93a
0.82a
0.41b
0.33b
0.047
0.88a
0.37b
0.037
0.67a
0.58b
0.014
0.95
Total land
m2 kgECM-1
1.51a
1.35b
1.39b
1.21c
0.073
1.43a
1.30b
0.017
1.45a
1.28b
0.013
0.78
a
All results presented as least squares means (lsm) with standard errors of the mean (sem). Different superscripts
within a column denote significant differences between levels of same variables (p<0.01).
b
LFC = Low Forage Control, LFS = Low Forage Select, HFC = High Forage Control, LFS = High Forage Select
5
6
7
8
Table 9
Regression coefficients explaining contribution of variation in each emissions source to uncertainty in
estimated overall global warming potential (GWP), with respective ranges in uncertaintya
Contributing category variable
Production Systemb
LFS
HFC
LFC
HFS
Rank Coeff Range Rank Coeff Range Rank Coeff Range Rank Coeff Range
N2O animal manures
1 0.76 0.39 1 0.74 0.28 1 0.73 0.47 1 0.73 0.44
CH4 enteric fermentation
2 0.44 0.23 2 0.44 0.20 2 0.44 0.27 2 0.43 0.25
CH4 animal manures
3 0.32 0.17 3 0.35 0.14 5 0.28 0.17 4 0.31 0.18
N2O purchased fertilizer application
4 0.27 0.11 4 0.28 0.09 3 0.34 0.16 3 0.35 0.17
N2O crop residues
5 0.24 0.09 5 0.25 0.08 4 0.29 0.14 5 0.29 0.13
CO2e fossil fuels
6 0.05 0.02 6 0.05 0.01 6 0.04 0.01 6 0.04 0.01
CO2e purchased fertilizer production 7 0.01 0.01 7 0.01 0.01 7 0.02 0.01 7 0.01 0.01
CO2e electricity
8 0.01 0.01 8 0.01 0.01 8 0.01 0.01 8 0.01 0.01
Overall GWP
0.50
0.41
0.61
0.67
a
Range in overall GWP expressed in kilograms of carbon dioxide equivalents per kilogram energy corrected milk
b
LFC = Low Forage Control, LFS = Low Forage Select, HFC = High Forage Control, LFS = High Forage Select
9
10
40
1
2
3
4
Table 10
Regression coefficients explaining contribution of variation in emissions factors to uncertainty in
estimated nitrous oxide emissions from animal manures, applied purchased fertilizers and crop
residues
Source of estimated emissions
Emissions
Applied purchased
Animal manures
Crop residues
factora
fertilizers
LFC LFS HFC HFS LFC LFS HFC HFS LFC LFS HFC HFS
0.92
0.91
0.91
0.91
0.92
0.92
0.92
0.92
EF1
0.37
0.41
EF3 PRP
0.88
0.87
0.75
0.73
0.19
0.19
0.19
0.19
EF4
0.18
0.17
0.18
0.18
0.26
0.26
0.26
0.26
0.30
0.30
0.30
0.30
EF5
0.29
0.33
0.41
0.44
EFN ex
0.15
0.13
0.14
0.12
EFSS
0.11
0.11
0.11
0.11
FracGASF
0.13
0.13
0.14
0.15
FracGASM
0.12
0.11
0.12
0.12
0.20
0.20
0.20
0.19
0.23
0.22
0.22
0.22
FracLEACH
0.05
0.06
0.03
0.03
FracLSV
0.01
0.01
0.01
0.01
FracSSV
0.97
0.97
0.97
0.97
0.99
0.99
0.99
0.99
0.99
0.99
0.99
0.99
R2 value
a
EF1 = direct emissions from nitrogen input to soil, EF3 PRP = direct from deposition of cows’ excreta at pasture, EF4 =
indirect emissions from volatilised N, EF5 = emissions from leaching and runoff, EFNex = System specific nitrogen excretion
rate, EFSS = direct from solid storage, FracGASF = % volatilisation from fertiliser, FracGASM = % volatilisation from manures,
FracLEACH = % leaching, FracLSV = % volatilisation from liquid storage, FracSSV = % volatilisation from solid storage.
Where: LFC = Low Forage Control, LFS = Low Forage Select, HFC = High Forage Control, LFS = High Forage Select
5
6
41


© Copyright 2026