
Estimation EC 252 Introduction to Econometric Methods
Multiple Regression Analysis: Estimation
EC 252 Introduction to Econometric Methods
Abhimanyu Gupta
February 9, 12, 2015
1 / 46
Outline
More on interpretation
The Expected Value of the OLS Estimators
Assumptions
Result: OLS is unbiased
Potential bias from misspecification
The Variance of the OLS Estimators
Homoscedasticity assumption
Result
Interpretation
Variance in misspecified models
Estimating σ 2
Efficiency of OLS: The Gauss-Markov Theorem
Reading: Wooldridge (2009), Introductory Econometrics, Chapter 3.
2 / 46
Outline
More on interpretation
The Expected Value of the OLS Estimators
Assumptions
Result: OLS is unbiased
Potential bias from misspecification
The Variance of the OLS Estimators
Homoscedasticity assumption
Result
Interpretation
Variance in misspecified models
Estimating σ 2
Efficiency of OLS: The Gauss-Markov Theorem
3 / 46
Units of Measurement
What is the effect of changing units of x or y on our results?
I
If the dependent variable y is multiplied by some constant c, then the OLS
intercept and slope estimates are also multiplied by c.
I
If the independent variable x is multiplied by some nonzero constant c,
then the OLS slope coefficient is divided by c (intercept is not affected).
variable does not affect the intercept.
I
What happens to R 2 when the unit of measurement of either the
independent or the dependent variable changes?
4 / 46
Functional form: the log-transformation
I
Often we consider a non-linear transformation of the dep. variable.
I
Leading case: the log-transformation. Why is this useful?
Example (Wage effects of education)
log(wage) = β0 + β1 schooling + u
effect on the dependent variable?
∂ log(wage)
= β1
∂ schooling
1
∂wage
= β1
wage ∂ schooling
schooling induces an approximate percentage change (%∆) in wages of 100β1 .
We write this as follows:
%∆wage ≈ (100β1 )∆schooling
5 / 46
Example (Wage effects of education)
Re-estimating the wage equation with the dependent variables in log, we obtain:
\ = 0.58 + 0.08 schooling
log(wage)
with R 2 = 0.19.
I
An additional year of schooling increases wages by about 8 percent.
I
This model is called a log-level model (dep. variable in logs, independent
variable in levels).
I
Before, we assumed that each unit change of x has the same constant
effect on y .
I
Now we assume that each each unit change of x has the same percentage
effect on y .
I
β1 is known in this case as semi-elasticitiy.
I
Note that this interpretation is approximate – it only works well for small
changes in x.
6 / 46
The constant-elasticity model
Now consider the case where both x and y are transformed into logs:
log(y ) = β0 + β1 log(x) + u
Here we have
β1 =
∂ log(y )
x ∂y
=
∂ log(x)
y ∂x
I
This is known as the constant-elasticity model
I
β1 measures the percentage change of y to a one percent change in x.
7 / 46
Summary: different functional forms
Log-transformations of our variables affect the interpretation of the coefficient.
The following table summarizes the different cases:
Model
level-level
level-log
log-level
log-log
Dependent
Variable
y
y
log (y )
Independent
Variable
x
log (x)
x
log (y )
log (x)
Interpretation
of β1
∆y = β1 ∆x
∆y = (β1 /100)%∆x
%∆y = (100β1 )∆x
(semi-elasticity)
%∆y = β1 %∆x
(elasticity)
8 / 46
Outline
More on interpretation
The Expected Value of the OLS Estimators
Assumptions
Result: OLS is unbiased
Potential bias from misspecification
The Variance of the OLS Estimators
Homoscedasticity assumption
Result
Interpretation
Variance in misspecified models
Estimating σ 2
Efficiency of OLS: The Gauss-Markov Theorem
9 / 46
The Expected Value of the OLS Estimators
Assumption MLR.1 (Linear in Parameters)
The model in the population (the population model or true model) can be
written as:
y = β0 + β1 x1 + β2 x2 + ... + βk xk + u
where β0 , β1 , ..., βk are the unknown parameters (constants) of interest and u
is an unobservable random error or disturbance term.
10 / 46
Is the linearity assumption of MLR.1 restrictive?
I
I
Often the relationship between economic variables is not perfectly linear.
Example: effect of effort on output might be characterized by
decreasing marginal productivity.
How can we account for non-linearity in a regression model?
I the multiple regression model allows to include polynomials:
y = β0 + β1 x1 + β2 x12 + β3 x13 + u
I
I
There are other ways of incorporating non-linearities: e.g. interactions (set
x3 = x1 × x2 )
Thus, in principle the formulation is very general.
Nontheless:
I We require the functional relation we end up choosing to be appropriate...
I ...which is difficult to judge: economic theory rarely provides insights on
what the exact functional form should be.
11 / 46
The Expected Value of the OLS Estimators
Assumption MLR.2 (Random Sampling)
We have a random sample of n observations {(xi1 , xi2 , ..., xik , yi ) : i = 1, 2, ..., n},
following the population model in Assumption MLR.1.
This assumption is often fine in cross sectional data.
12 / 46
The Expected Value of the OLS Estimators
Assumption MLR.3 (No Perfect Collinearity)
In the sample (and therefore in the population), none of the independent
variables is constant, and there are no exact linear relationships among the
independent variables.
I
If an independent variable is an exact linear combination of the other
independent variables, then the model suffers from perfect collinearity,
and it cannot be estimated by OLS.
I
Note: Assumption MLR.3 does allow the independent variables to be
correlated; they just cannot be perfectly correlated.
13 / 46
When do collinearity problems crop up?
MLR.3 rules out the following cases:
I
one variable is a constant multiple of another: e.g. x1 = γx2
I
one variable can be expressed as an exact linear function of two or more of
the other variables, e.g. x1 = γ0 + γ2 x2 + γ3 x3 + ... + γk xk .
Intuition:
I
If there is an exact linear relationship, it is impossible to tell apart the
effect of one variable from the other: we have no variation to separate out
the effects.
I
There are many combinations of (β0 , β1 , ..., βk ) which all deliver the same
value from the loss function (sum of squared residuals).
I
Given the exact restriction on the relationship between the different
covariates, the ceteris paribus notion is meaningless.
14 / 46
Example (Age versus cohort effects)
Assume you are interested in estimating a wage regression for a sample of
workers, using data collected during one year (2009). You believe that workers’
productivity changes with age. You also believe that workers productivity
depends on their “vintage” (that is their cohort as measured by year-of-birth).
This motivates the following specification:
log w = β0 + β1 age + β2 cohort + u
Is assumption MLR.3 satisfied in this case?
15 / 46
Example (continued)
I
Note that the following relation is true for all individuals in the sample:
cohort + age = 2009
Conclusion:
I
We have to drop either the age effect or the cohort effect from the
specification.
I
That is, we effectively have to assume that either β1 = 0 or β2 = 0.
In this example, both age and vintage are potentially important.
I
both factors may be genuinely relevant.
I
but the data does not allow us to separate out the two effects.
16 / 46
The Expected Value of the OLS Estimators
Assumption MLR.4 (Zero Conditional Mean)
The error u has an expected value of 0 given any values of the independent
variables. In other words:
E (u|x1 , x2 , ..., xk ) = 0
I
When Assumption MLR.4 holds, people often say the xj are exogenous
explanatory variables.
I
If xj is correlated with u for any reason, people often say xj is an
endogenous explanatory variable.
17 / 46
Assumption MLR.4 is critical
A list of cases when assumption MLR.4 can fail:
1. misspecified functional form (misspecification)
2. in case of omission of a variable that is correlated with any of the
independent variables (omitted variable problem)
3. in specific forms of measurement error in an explanatory variable
(measurement error problems)
4. in case one or more of the explanatory variables is determined jointly
with y (simultaneity problems).
18 / 46
The Expected Value of the OLS Estimators
Theorem 3.1 (Unbiasedness of OLS)
Under Assumptions MLR.1 through MLR.4:
E βˆj = βj , j = 0, 1, ..., k,
for any values of the population parameter βj . In other words, the OLS
estimators are unbiased estimators of the population parameters.
19 / 46
Two remarks
1. Unbiasedness is a statement about the sampling distribution of an estimator
I
I
I
If we kept drawing fresh samples from the population, what would the
distribution of the estimator look like?
Unbiasedness says nothing about how a particular realization is related to
the true parameter value.
In a particular sample, the estimated coefficient may be far away from the
true value even though the estimator is unbiased.
2. Unbiasedness is a statement about the expected value, and not about
dispersion
I
I
An estimator can be unbiased but still have a large dispersion around the
true value.
Unbiasedness says nothing about the probability of being close to the true
parameter value.
20 / 46
When does misspecification bias OLS estimates?
We now ask if we can describe what happens in specific cases of
misspecification.
What is the effect of including irrelevant variables?
What is the effect of excluding a relevant variable?
21 / 46
What is the effect of including irrelevant variables?
I
Suppose we specify the model as:
y = β 0 + β1 x 1 + β2 x 2 + β3 x 3 + u
and this model satisfies the Assumptions MLR.1 through MLR.4.
I
Assume that x3 is irrelevant: β3 = 0.
I
Note that then: E (y |x1 , x2 , x3 ) = E (y |x1 , x2 ) = β0 + β1 x1 + β2 x2 .
I
Since we do not know that β3 = 0, we estimate the following equation:
yˆ = βˆ0 + βˆ1 x1 + βˆ2 x2 + βˆ3 x3
I
Key result: Including an irrelevant variable does not bias the OLS
estimators. However, it can affect their variance.
I
loss of efficiency: we estimate an additional parameter (β3 ).
22 / 46
What is the effect of excluding a relevant variable?
I
Suppose the true population model is:
y = β0 + β1 x1 + β2 x2 + u
and assume that this model satisfies Assumptions MLR.1 through MLR.4.
I
However, due to data availability, we estimate instead the model by
excluding x2 :
y˜ = β˜0 + β˜1 x1
23 / 46
Example (Unobserved ability in a wage regression)
Suppose that wages are determined as a function of schooling and of ability.
Thus, the appropriate model would be
[
log
w = βˆ0 + βˆ1 schooling + βˆ2 ability
If we cannot observe individuals ability, we may have to restrict ourselves to
]
log
w = β˜0 + β˜1 schooling
24 / 46
I
We use the following fact (Lecture 4, Slide 22):
β˜1 = βˆ1 + βˆ2 δ˜1
where βˆ1 and βˆ2 are the slope estimators from the multiple regression of yi
on xi1 and xi2 , and δ˜1 is the slope from the simple regression of xi2 on xi1 .
I
Now compute the expected value (noting that δ˜1 is fixed, conditional on
the x’s):
E β˜1 = E βˆ1 + βˆ2 δ˜1 = E βˆ1 + E βˆ2 δ˜1 = β1 + β2 δ˜1
I
which implies the bias in β˜1 (the omitted variable bias) is:
Bias β˜1 = E β˜1 − β1 = β2 δ˜1
Conclusion: There are two cases where β˜1 is unbiased:
1. if the unobserved covariate is irrelevant for y : β2 = 0;
2. if x1 and x2 are uncorrelated: δ˜1 = 0.
25 / 46
The sign of the bias in β˜1 depends on the signs of both β2 and δ˜1 :
β2 > 0
β2 < 0
Corr(x1 , x2 ) > 0
positive bias
negative bias
Corr(x1 , x2 ) < 0
negative bias
positive bias
Terminology:
˜1 > β1 , then β˜1 has an upward bias.
I If E β
˜1 < β1 , then β˜1 has a downward bias.
I If E β
I
The phrase biased towards zero refers to cases where E β˜1 is closer to
zero than β1 :
I
I
if β1 > 0, then β˜1 is biased towards zero if it has a downward bias;
if β1 < 0, then β˜1 is biased towards zero if it has an upward bias.
26 / 46
Omitted variable bias - more general cases
I
Suppose the true population model is:
y = β 0 + β1 x 1 + β2 x 2 + β3 x 3 + u
and this model satisfies the Assumptions MLR.1 through MLR.4.
I
However, we omit x3 and estimate:
y˜ = β˜0 + β˜1 x1 + β˜2 x2
I
It is difficult to obtain the direction of the bias in general, because x1 , x2
and x3 can all be pairwise correlated.
I
Even if x2 and x3 are uncorrelated, if x1 is correlated with x3 , coefficients
on all included regressors β˜1 and β˜2 will normally be biased.
I
It is better to start by estimating a general model – and risk including
irrelevant variables – than to omit relevant variables and risk bias.
27 / 46
Outline
More on interpretation
The Expected Value of the OLS Estimators
Assumptions
Result: OLS is unbiased
Potential bias from misspecification
The Variance of the OLS Estimators
Homoscedasticity assumption
Result
Interpretation
Variance in misspecified models
Estimating σ 2
Efficiency of OLS: The Gauss-Markov Theorem
28 / 46
The Variance of the OLS Estimators
Assumption MLR.5 (Homoscedasticity)
The error u has the same variance given any values of the explanatory variables:
Var (u|x1 , ..., xk ) = σ 2
If Assumption MLR.5 fails, then the model exhibits heteroscedasticity:
I
The variance of the error term, given the explanatory variables, is not
constant, but varies with the regressors.
I
Assumption MLR.5 is about the properties of the second moment of u.
The assumption is distinct from MLR.4 (which deals with first moments).
29 / 46
Gauss-Markov assumptions
I
Assumptions MLR.1 through MLR.5 are collectively known as the
Gauss-Markov assumptions.
I
Assumptions MLR.1 and MLR.4 can be written as:
E (y |x) = β0 + β1 x1 + β2 x2 + ... + βk xk
I
Assumption MLR.5 can be written as:
Var (y |x) = σ 2
where x is the set of all independent variables, (x1 , ..., xk ).
30 / 46
The Variance of the OLS Estimators
Theorem 3.2 (Sampling Variance of the OLS Slope Estimators)
Under Assumptions MLR.1 through MLR.5, conditional on the sample values of
the independent variables:
Var βˆj =
σ2
SSTj 1 − Rj2
for j = 1, 2, ..., k.
Pn
Notation: SSTj = i=1 (xij − x¯j )2 is the total sample variation in xj , and Rj2
is the R-squared from regressing xj on all other independent variables (including
an intercept).
The size of Var (βˆj ) is important: a larger variance means a less precise
estimator → larger confidence intervals and less powerful hypothesis tests, as we
will see in Lecture 6 (Inference in the MLR model).
31 / 46
Interpretation
Theorem 3.2 tells us that the variance of the estimator βˆj depends on three
factors:
1. The error variance σ 2 (+)
2. The extent of the linear relationship among the independent variables, Rj2
(+)
3. The total sample variation in xj , SSTj (–)
1. The error variance σ 2 : a larger σ 2 means larger variances for the OLS
estimators.
I
I
This reflects more noise in the data.
To reduce the error variance for a given y , add more explanatory variables to
the equation.
32 / 46
Interpretation
2. The total sample variation in xj , SSTj : the larger the total variation in
xj , the smaller Var (βˆj ).
I
To increase the sample variation in each of the independent variables,
increase the sample size.
3. The linear relationship among the independent variables, Rj2 :
I
Consider a limiting case:
Var βˆj → ∞ as Rj2 → 1
I
A close to perfect linear association between regressors means that
separating out the independent effect of any one of them becomes
increasingly hard.
High correlation between two or more independent variables is called
multicollinearity (perfect correlation is ruled out by MLR.3).
33 / 46
Interpretation
Remarks:
I
I
I
What ultimately matters for statistical inference is how big βˆj is in relation
to its standard deviation.
Also note that a high degree of correlation between certain independent
variables can be irrelevant as to how well we can estimate other parameters
in the model
In practice, this means that inference about a particular parameter of
interest does not rely on all the regressors in a model displaying lots
independent variation: e.g. one can include multiple correlated proxies to
control for variation in variables we are not primarily interested in.
34 / 46
Variance in misspecified models
In applications, we sometimes have little guidance on whether to include a
particular covariate or not.
I
I
I
There’s typically a tradeoff between bias and variance.
Suppose the true population model, which satisfies the Gauss-Markov
assumptions, is:
y = β0 + β1 x 1 + β 2 x 2 + u
(1)
Consider two estimators of β1 :
1.
yˆ = βˆ0 + βˆ1 x1 + βˆ2 x2
where Var βˆ1 =
σ2
.
SST1 (1 − R12 )
2.
y˜ = β˜0 + β˜1 x1
σ2
where Var β˜1 =
.
SST1
35 / 46
Variance in misspecified models
Assuming that x1 and x2 are correlated, we can draw the following conclusions:
1. When β2 6= 0, β˜1 is biased, βˆ1 is unbiased, and Var β˜1 < Var βˆ1 .
=⇒ When β2 6= 0, there are two reasons for including x2 in the model:
I
I
Any bias in β˜1 does not shrink as the sample size grows, but the variance
does;
The variance of β˜1 shown in the previous slide effectively ignores the
inflation in the error variance that occurs when x2 is omitted. This omission
a consequence of treating regressors of non-random.
2. When β2 = 0, β˜1 and βˆ1 are both unbiased, and Var β˜1 < Var βˆ1 .
=⇒ β˜1 is preferred if β2 = 0.
As we will see in Lecture 6, we can perform a statistical test of the hypothesis
β2 = 0 after running the regression (1), which may lead us to re-estimate the
model omitting x2 .
36 / 46
Estimating the error variance σ 2
To operationalize the expression for the variance of the OLS estimators given in
Theorem 3.2, we need to form an estimate of σ 2 .
I
The unbiased estimator of σ 2 in the multiple regression case is:
2
σ
ˆ =
I
Pn
uˆi2
SSR
=
(n − k − 1)
(n − k − 1)
i=1
where the degrees of freedom is:
df = n − (k + 1) = (no. observations) – (no. estimated parameters)
I
Recall: the division by n − k − 1 comes from the fact that, in obtaining the
OLS estimates, k + 1 restrictions are imposed on the OLS residuals, so that
there are only n − k − 1 df in the residuals.
I
For the SLR model (Lecture 3, Slide 42), we were dividing by n − 2, since
in that case k = 1.
37 / 46
Theorem 3.3 (Unbiased Estimation of σ 2 )
Under the Gauss-Markov Assumptions MLR.1 through MLR.5,
E σ
ˆ 2 = σ2
I
σ
ˆ is called the standard error of the regression (SER), the standard
error of the estimate or the root mean squared error.
I
It is an estimator of the standard deviation of the error term.
Note that σ
ˆ can either decrease or increase when another independent
variable is added to a regression. Why?
I
I
I
I
I
numerator: SSR goes down...
denominator: k increases, n − k − 1 goes down...
...so the overall effect is ambiguous.
But when n >> k, more likely than not σ
ˆ will fall.
38 / 46
I
For constructing confidence intervals and conducting tests, we need to
estimate the standard deviation of βˆj :
σ
sd βˆj =
[SSTj (1 − Rj2 )]1/2
I
Since σ is unknown, we replace it with its estimator σ
ˆ.
I
This gives us a feasible estimator (i.e. one that depends on no unknown or
unobserved quantities) of the standard error of βˆj :
se βˆj =
σ
ˆ
[SSTj (1 − Rj2 )]1/2
39 / 46
Outline
More on interpretation
The Expected Value of the OLS Estimators
Assumptions
Result: OLS is unbiased
Potential bias from misspecification
The Variance of the OLS Estimators
Homoscedasticity assumption
Result
Interpretation
Variance in misspecified models
Estimating σ 2
Efficiency of OLS: The Gauss-Markov Theorem
40 / 46
The Gauss-Markov Theorem: Introduction
Why should we choose OLS as our estimator?
We have already seen that it is unbiased; but:
I
What about its variance?
I
How dispersed is it around the true parameter values?
I
Are there other estimators which are less dispersed?
The Gauss-Markov Theorem tells us that under a set of specific assumptions
(the Gauss-Markov assumptions)
I
OLS has smaller variance than any other estimator within the class of linear
and unbiased estimators.
The Gauss-Markov Theorem justifies the use of OLS rather than
competing linear estimators.
41 / 46
Efficiency of OLS
Gauss-Markov Theorem
Under the following set of assumptions:
I
MLR.1 (Linear in parameters)
I
MLR.2 (Random sampling)
I
MLR.3 (No perfect collinearity)
I
MLR.4 (Zero conditional mean)
I
MLR.5 (Homoscedasticity)
The OLS estimators (βˆ0 , βˆ1 , ..., βˆk ) are best linear unbiased estimators
(BLUE) of the population parameters (β0 , β1 , ..., βk ).
Knowing this makes life easy: if any other linear estimator is proposed, and the
assumptions above hold, that estimator will be less efficient than OLS.
42 / 46
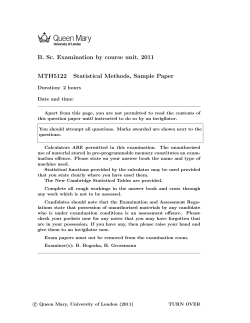
Interpretation: A comparison within a specific class
Allll estimators i
of β
I
Estimator: a rule that can be applied
to any sample of data to produce an
estimate.
I
Linear: an estimator is linear if, and
only if, it can be expressed as a linear
function of the data on the dependent
variable:
Subset of linear
estimators
β˜j =
n
X
wij yi
i=1
Subset of lilinear unbiased
estimators
OLS
I
where each wij can be a function of the
sample values of all the independent
variables.
Unbiased: β˜j is an unbiased estimator
of βj if E β˜j = βj .
43 / 46
The criterion:
I
Best: smallest variance.
=⇒ Under the assumptions MLR.1-MLR.5, we have that for any estimator β˜j
that is linear and unbiased,
Var β˜j ≥ Var βˆj
where βˆj is the OLS estimator.
Keep in mind:
I
If any of the Gauss-Markov assumptions fail, then this theorem no longer
holds.
44 / 46
Effects of heteroscedasticity
Under heteroscedasticity, the Gauss-Markov theorem no longer applies:
I
Assumption MLR.5 does not hold any longer.
I
The OLS estimator is still unbiased (MLR.5 is not required for Theorem
3.1).
I
But the Gauss-Markov theorem does not apply, so we know a more efficient
linear unbiased estimator may exist (it does!).
Intuition why OLS may not be efficient:
I
Heteroscedasticity means that some observations are more informative
(contain less noise) than others...
I
...but the OLS objective function puts equal weight on all squared residuals
uˆi2 .
I
OLS does not exploit the fact that we can extract more information from
some observations than others...
I
...it is not surprising that there may be a more efficient estimator!
We will return to this important topic in Lecture 10.
45 / 46
Outline
More on interpretation
The Expected Value of the OLS Estimators
Assumptions
Result: OLS is unbiased
Potential bias from misspecification
The Variance of the OLS Estimators
Homoscedasticity assumption
Result
Interpretation
Variance in misspecified models
Estimating σ 2
Efficiency of OLS: The Gauss-Markov Theorem
Next lecture: Multiple Regression Analysis: Inference.
46 / 46
Outline
Appendix: Numerical example to fix ideas (continued)
47 / 46
This continues the numerical exercise for the simple linear regression model
(from week 3).
Example (Wage effects of education (continued))
Table : Data
I
We estimated the coefficients as
follows (n = 10):
\
wage = −3.569 + 0.8597 schooling,
I
We can predict residuals uˆi in the
sample, and estimate the variance of
the error term:
n
X
1
95.54
= 11.94
uˆi2 =
σ
ˆ =
(n − 2)
10 − 2
2
i=1
id
1
2
3
4
5
6
7
8
9
10
wage
6
5.3
8.75
11.25
5
3.6
18.18
6.25
8.13
8.77
schooling
8
12
16
18
12
12
17
16
13
12
48 / 46
Example (Wage effects of education (continued))
I
We can also estimate R 2 from the residuals and the total sum of squares
SST:
95.54
SSR
=1−
= 0.395
R2 = 1 −
SST
157.93
Thus, our empirical model explains 39.5% of the observed variation in
wages.
49 / 46
Example (Wage effects of education (continued))
I
Plug in σ
ˆ to obtain estimates of the standard error of βˆ1 and βˆ0 :
√
σ
ˆ
11.94
ˆ
se β1 = qP
=√
= 0.376
n
2
84.40
(x
−
x
¯
)
i
i=1
q P
√
√
n
σ
ˆ n1 i=1 xi2
11.94 193.4
√
=
se βˆ0 = qP
= 5.23
2
n
84.40
(x
−
x
¯
)
i
i=1
I
We can summarize what we have learned so far about this regression by
writing
\
wage = -3.569 + 0.8597 schooling, n = 10, R 2 = 0.395
(5.23)
(0.376)
50 / 46


© Copyright 2026