
Can Plant-Driven Selection Supplement Grain Micronutrient
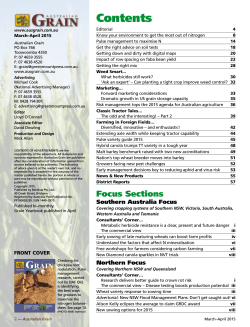
Columbia International Publishing
American Journal of Agricultural Science and Technology
(2015) Vol. 3 No. 1 pp. 1-11
doi:10.7726/ajast.2015.1001
Research Article
Can Plant-Driven Selection Supplement Grain
Micronutrient Efficiency in Wheat?
D. Mohan1* and R.K. Gupta1*
Received 17 August 2015; Published online 25 April 2015
© The author(s) 2015. Published with open access at www.uscip.us
Abstract
To establish association between important agronomic traits and grain mineral contents, data generated in
national wheat programme of India was analyzed for the period 2005-12 wherein 405 genotypes specified
for five diverse zones and two production conditions (timely and late sown) were evaluated. Iron, zinc,
copper and manganese content in the harvested grains was examined in relation to five major yield
components i.e. plant height, days to heading, grain filling duration, grain weight and grain yield. Study
highlights that short duration wheats draw more accumulation of micronutrients especially iron, copper and
manganese and this advantage is region specific. Scope of improvement in grain micronutrients can also
vary as certain region are more conducive in effective screening. Pre and post anthesis periods and plant
height was found linked with grain micronutrient content but the magnitude and direction varied in
different mineral elements. Zinc was not influenced by any of the field traits, individually or in combination.
In Indian varieties, contribution of early heading and quick grain ripening was significant in iron whereas
early flowering and short height held the key for copper. Short plant height and less grain bearing emerged
as two major field traits in case of manganese. Just with two key field indicators; R2 value of 0.38, 0.43 and
0.35 was achieved in this investigation for iron, copper and manganese content respectively. Study
advocates that just a handful field indicator can facilitate the wheat breeders in developing micronutrient
efficient genotypes.
Keywords: Agronomic traits; Indian wheats; Micronutrients; Selection criteria; Triticum aestivum
__________________________________________________________________________________________________________________
*Corresponding e-mail: [email protected] and [email protected]
1 ICAR – Indian Institute of Wheat and Barley Research, Karnal, Haryana 132001, India
1
D. Mohan and R.K. Gupta / American Journal of Agricultural Science and Technology
(2015) Vol. 3 No. 1 pp. 1-11
1.Introduction
Enhancing concentration of micronutrients has become an important aspect in wheat (Triticum
aestivum L.) research ever since substantial genetic variations were reported in major cereals
(Graham et al., 2001; Welch and Graham, 2004; Pfeiffer et al., 2007). It has special reference in
India where wheat is seen as major route to better nutrition as this staple food crop has not only
an edge over other major cereals in protein, yellow pigment and mineral contents but also
provides tremendous scope of further improvement in nutritive properties of the grain (Misra et
al., 2004). In Indian wheat varieties; copper and iron contents have been noted highly beneficial in
flour extraction (Mohan et al., 2008; Mohan et al., 2013a). Strong positive association between iron
and protein contents (Mourgounov et al., 2007; Mohan et al., 2008) is another positive aspect of
supporting bio-fortification to improve grain nutrition value of wheat grains. Recognizing
importance of micronutrient dense crop varieties, collaboration with HarvestPlus (the CGIAR
global challenge programme on bio-fortification) has been initiated in India with focus on iron and
zinc. Although mineral concentration in grains depend highly on their availability in the soil; large
genetic variations observed in Indian wheat varieties (Mohan et al., 2009 and 2013b) indicate that
opportunities exist to exploit this variability for improvement in grain micronutrient
concentration. It is a complex exercise but can be simplified if selection of efficient genotypes could
be aided by some morphological markers. If protein content in wheat grain can be altered through
grain filling period, opportunity might exist in grain micronutrients too. The present investigation
address such issues by examining eight year (2005-12) data of the All India Coordinated Wheat &
Barley Improvement Project (AICW&BIP) to understand whether i) efficiency of genotypes differ
for each micronutrient, ii) efficiency depends upon climate (region) and duration of the crop, iii)
elite genotypes have specific agronomic expressions, iv) agronomic parameters contribute in grain
mineral content and v) key traits associated with mineral concentration in wheat grains.
2.Material and Methods
Environments
Study material involved final year irrigated entries and the corresponding checks evaluated in
yield trials of AICW&BIP in five major zones i.e. northern hills zone (NHZ), north-western plains
zone (NWPZ), north-eastern plains zone (NEPZ), central zone (CZ) and peninsular zone (PZ).
Environment for wheat growth is different in each zone. NHZ that covers hills and foothills of
Himalayas has long winter with low temperature. NWPZ and NEPZ represent the Indo-Gangetic
plains where NWPZ labeled as most productive wheat land of India has the most soothing wheat
growth environment whereas adjoined NEPZ has shorter winter and humid climate. Crop in CZ
often faces soil moisture stress as climate is hot and dry. Peninsula in down south i.e. PZ has
similar temperature and soil moisture conditions but climate is not that dry. Under irrigated
conditions too, two types of wheat are grown in each zone i.e. timely-sown and late-sown and the
study material involved genotypes from both trial series. The late-sown wheats are planted 15-20
days after the sowing schedule of timely-sown wheats and get shorter life span therefore short
duration genotypes fit in this lot.
2
D. Mohan and R.K. Gupta / American Journal of Agricultural Science and Technology
(2015) Vol. 3 No. 1 pp. 1-11
Study material
In total, 405 bread wheat genotypes comprising released and the pipe-line varieties tested under
AICW&BIP during 2005-12 were analyzed for micronutrient density namely iron, zinc, copper and
manganese. The material involved 67 entries of NHZ, 96 of NWPZ, 103 of NEPZ, 73 of CZ and 66 of
PZ. Ten best genotypes at the country level were examined to note distribution of elite genotypes
in different production conditions and zones. Ten best and ten poorest genotypes of each zone
were compared to gauge magnitude of advantage in the elite group. To study relationship between
two categories of parameters i.e. agronomic vs. grain micronutrient density, only released varieties
were considered because multi-year data was available for such genotypes. To have a broader
view at the country level, an equal number of varieties representing five zones and two categories
of production conditions were involved. List of 50 varieties (ten each for every zone and five each
from timely-sown and late-sown conditions of every zone) is given below:
NHZ : VL 788, VL 804, VL 892, VL 907, HS 240, HS 295, HS 420, HS 490, HS 507 and Sonalika
NWPZ: PBW 343, PBW 550, PBW 590, DBW 621-50, HD 2967, DBW 16, DBW 17, RAJ 3765, UP 2425 and
WH 1021
NEPZ : K 307, K 9107, HD 2733, HD 2824, HUW 468, DBW 14, DBW 39, HUW 234, NW 2036 and HI 1563
CZ
: LOK 1, GW 173, GW 322, GW 366, HI 1531, HI 1544, MP 4010, DL 788-2, HD 2932 and HD 2864
PZ : GW 322, NIAW 34, NIAW 917, NI 5439, MACS 6222, RAJ 4037, RAJ 4083, HD 2189, HD 2932 and
HI 977
Observations and data analysis
Grain samples received from three to five locations of each zone were analyzed at ISO 9001-2008
certified laboratory located at Karnal for micronutrient contents as per method suggested by
Jackson (1973). Field traits examined in this investigation were plant height, days to heading, grain
filling period, 1000 grain weight and grain yield. Student t–test was applied to make comparisons
at 5% level of significance. Mean across the years was used in 50 varieties to investigate role of
agronomic traits in micronutrient and SAS software (SAS version 9.3, USA) was used for multiple
regression analysis.
3.Results and Discussion
Distribution of efficient genotypes
Assortment of 10 most superior genotypes (test entries as well as varieties) at the country level
indicated that majority of the elite material belonged to late-sown group (Table 1). Seven
genotypes in case of iron and zinc, nine in copper and the entire lot in manganese were the short
duration wheats. Results showed that early maturity provided an edge in grain micronutrient
density. It was also observed that high density grains in iron and copper mostly belonged to the
region where crop duration is generally short i.e. NEPZ, CZ and PZ. These are the regions where
timely-sown wheats mature in 105 to 120 days in comparison to 140 and 170 days maturity
3
D. Mohan and R.K. Gupta / American Journal of Agricultural Science and Technology
(2015) Vol. 3 No. 1 pp. 1-11
period observed in NWPZ and NHZ, respectively. There was no clear cut pattern in case of zinc but
manganese rich genotypes mostly belonged to NHZ and NEPZ. It indicated that besides soil status
and climate, crop duration also affects grain micronutrients density in wheat grains.
Table 1 Ten best genotypes for grain micronutrient density
Micronutrient Range Production
NHZ
NWPZ
NEPZ
(ppm) condition
Iron
56-77 Timely-sown
RAJ 4120
Late-sown
Zinc
50-58
Copper
6.2-6.5 Timely-sown
Late-sown
Manganese
52-54
-
Timely-sown
Late-sown
HS 490*
-
Timely-sown
Late-sown
HS 490*
HS 295*
HS 502
VL 892*
Sonalika*
* denote released varieties
-
PBW 585
WH 1063
WH 1061
HD 2982
-
NW 1014*
PBW 524
NW 2036*
HUW 234*
MP 3224
-
CZ
-
GW 322*
GW 366*
HUW 234*
GW 173*
HD 2932*
MP 4010*
DBW 14*
DBW 31
NW 2036*
HUW 234*
GW 173*
PZ
UAS 304*
MACS 6222*
HI 977*
NIAW 34*
UAS 304*
HP 1913
RAJ 4083*
UAS 304*
HI 1541
HD 2932*
RAJ 4083*
HI 977*
-
Advantage in short duration wheats
To confirm advantage of the shorter crop duration, the whole study material was assorted into
timely-sown (TS) and late-sown (LS) groups (Table 2). At all India level; concentration of iron,
copper and manganese was significantly higher in late-sown group. This advantage could be seen
in four zones for iron and copper, and three zones in case of manganese. There was no regional
specificity in case of zinc. In NEPZ, late-sown wheats were benefitted in all micronutrient whereas
in adjoining NWPZ advantage was restricted only to iron. Iron, copper and manganese contents
were significantly higher in late-sown wheat of CZ but this advantage ceased in manganese under
PZ conditions. In hills, iron content remained same in both categories of wheat. It indicates that
shorter crop duration benefits harness of higher mineral content in wheat grains and this
advantage varies from zone to zone.
4
D. Mohan and R.K. Gupta / American Journal of Agricultural Science and Technology
(2015) Vol. 3 No. 1 pp. 1-11
Table 2 Overall micronutrient levels (ppm) in timely and late sown wheats
Micronutrient
NHZ
NWPZ
NEPZ
CZ
PZ
All India
TS LS
TS LS
TS LS
TS LS
TS LS
TS
LS
(35) (32) (47) (49) (58) (45) (30) (43) (30) (36)
(200) (205)
Iron
35.1 34.8 37.4 42.6 41.0 48.3 35.2 37.8 45.3 49.1
38.9 42.8
Zinc
29.9 36.1 38.0 38.5 35.1 37.5 39.3 31.9 38.4 40.2
36.0 36.8
Copper
3.45 4.97 5.02 5.08 4.66 5.50 5.23 5.70 5.20 5.55
4.70 5.36
Manganese
31.8 46.0 37.5 38.0 38.1 44.9 39.0 41.9 39.5 40.4
37.2 42.0
Figure in the parenthesis indicate number of entries and bold figure denote significance at P 0.05.
Regional difference in genotype efficiency
Grain quality differences emerge at the regional level due to differences in soil/ moisture
conditions, climate and genotypes (Ereifej et al., 1999; Welch and Graham, 2002; Mohan et al.,
2011 and 2013b). Zone-wise assortment of elite genotypes illustrated that iron superior genotypes
occurred more frequently in NEPZ and PZ (Table 1). In copper also, eight genotypes belonged to
central-peninsular India whereas manganese superior genotypes were mostly confined to NHZ
and NEPZ. Zinc superior genotypes could be observed in all zones except CZ. Overall, PZ and NEPZ
emerged as mineral rich zones as number of elite lines was much higher in comparison to rest of
the zones.
Elite
Poor
Mean
50
6
Content (ppm)
40
30
5
4
3
Zn
Mn
PZ
CZ
NEPZ
PZ
CZ
NEPZ
NWPZ
NHZ
PZ
CZ
NEPZ
NWPZ
NHZ
PZ
CZ
NEPZ
NWPZ
NHZ
Fe
NWPZ
2
20
NHZ
Content (ppm)
60
Cu
Fig. 1. Difference between ten best and ten poorest genotypes
Data showed that vast differences prevailed amongst five zones in micronutrient grain density (Fig
1). Overall iron content was significantly better in PZ (47ppm) and NEPZ (44ppm) in comparison
to NWPZ (40ppm), CZ (37ppm) and NHZ (35ppm). Differences were of lower magnitude in zinc
content but NWPZ and PZ wheats (38-39ppm) did register mean value higher in comparison to
NEPZ, CZ and NHZ (33-36ppm). Differences among zones were smaller in manganese content but
NEPZ and CZ (41-42ppm) were still distinguishable from other zones (38-40ppm). Average copper
content which was 5.4ppm in wheats of central-peninsular India (CPI) and 5.0ppm in the IndoGangetic plains (IGP), dipped to 4.2ppm in NHZ.
5
D. Mohan and R.K. Gupta / American Journal of Agricultural Science and Technology
(2015) Vol. 3 No. 1 pp. 1-11
To weigh advantage in the efficient genotypes, ten best genotypes of each zone were compared
with the poorest ten. It was observed that nearly 30ppm iron, zinc and manganese could be
observed in mineral deficient genotypes throughout the country (Fig 1). When elite group was
compared for iron content, mean values were elevated to nearly 60ppm in NEPZ/ PZ, 50ppm in
NWPZ and 45ppm in CZ/ NHZ. Difference between two groups of iron was large in NEPZ and PZ
which indicates that such places are better suited to differentiate the genotypes. In contrast, CZ
was least suited to identify iron efficient grains. Such differentiation among zones was not visible
in zinc and manganese. Average zinc levels in efficient group increased to 46-48ppm in all zones
except the hills. Hills provided better platform for effective screening of test entries against
manganese content.
Grain density in copper presented a different picture. There were wide differences among the
zones even in the poor class as it was 2.7ppm in NHZ and 4.8ppm in CZ. Due to high zonal mean,
even poor category grains of CZ had mean copper content comparable with top category of NHZ.
Although efficient genotypes for this element had nearly 6.2ppm copper content in NEPZ, CZ and
PZ; the genotypes were better differentiated in NEPZ. Mohan et al. (2009) had earlier illustrated
location advantage for these micronutrients under Indian conditions and this study indicated the
areas where prospects of micronutrient augmentation are higher.
Phenology of elite materials
Variations in wheat crop duration occur due to varying vegetative and reproductive phases. Ten
best genotypes of each zone were compared with the ten poorest for pre and post anthesis
durations to search any parallelism with grain mineral concentration. Manifestation of early
flowering resulted in high concentration of three minerals i.e. iron, copper and manganese (Fig 2).
Margin of difference between elite and poor group varied according to the zones and generally this
difference was high in IGP in comparison to CPI. Grain filling period also influenced mineral
content of wheat grains but the impact was not uniform across the zones. Negative influence of
longer grain filling duration was conspicuous for iron content in NEPZ; copper content in CZ/ NHZ
and manganese content in NEPZ/ NHZ. Zinc content in wheat grains was benefitted by longer
filling duration in NWPZ and CZ.
35
25
30
Zinc
Copper
Manganese
Iron
Zinc
Copper
NHZ
NWPZ
NEPZ
CZ
PZ
50
NHZ
NWPZ
NEPZ
CZ
PZ
40
NHZ
NWPZ
NEPZ
CZ
PZ
75
NHZ
NWPZ
NEPZ
CZ
PZ
45
NHZ
NWPZ
NEPZ
CZ
PZ
100
NHZ
NWPZ
NEPZ
CZ
PZ
50
NHZ
NWPZ
NEPZ
CZ
PZ
125
Iron
Post-anthesis days
Poor
Elite
NHZ
NWPZ
NEPZ
CZ
PZ
Pre-anthesis days
Manganese
Fig. 2. Differences in crop phenology of elite and poor materials
6
D. Mohan and R.K. Gupta / American Journal of Agricultural Science and Technology
(2015) Vol. 3 No. 1 pp. 1-11
Effect of agronomic traits
Micronutrients in 405 genotypes were plotted against major yield determinants and the graphical
representation was examined for polynomial trend of degree 2 (Fig.3). Results demonstrated that
flowering had small influence on zinc and manganese contents (R2: 0.09). Influence of early
flowering was high in copper (R2: 0.38) and the declining trend became sharp when flowering
occurred after 90 days of sowing and such materials mostly belong to IGP. Iron content in wheat
grains was also related with pre-anthesis period (R2: 0.16). The association however was not as
strong as that of copper and the declining trend was also gradual. Pattern during reproductive
phase illustrated that effect of grain filling duration was negligible in grain micronutrients (Fig. 3).
Comparatively, some association with micronutrient density was detectable in iron as declining
trend appeared in the genotypes where post-anthesis period was large (more than 45 days) and
generally such pattern is observed in CZ and NHZ. Good evidence for the high reproductive
mobility of both iron and copper had been reported in wheat by Garnett and Graham (2005).
3
30
2
R² = 0.048
25
35
45
55
Post-anthesis days
70
60
R² = 0.181
50
R² = 0.175
30
80
100
Plant height (cm)
120
2
R² = 0.090
20
1
60
80
100
Pre-anthesis days
120
140
5
60
R² = 0.0406
5
50
R² = 0.119
4
40
R² = 0.002
3
30
R² = 0.103
2
1
60
30
70
2
20
3
6
3
R² = 0.063
4
40
40
4
R² = 0.094
40
1
R² = 0.164
50
65
Fe, Zn, Mn (ppm)
40
5
Cu (ppm)
R² = 0.007
6
R² = 0.377
6
20
Cu (ppm)
60
4
20
Fe, Zn, Mn (ppm)
5
Fe, Zn, Mn (ppm)
50
70
Cu (ppm)
R² = 0.023
60
6
Cu (ppm)
Fe, Zn, Mn (ppm)
70
1
10
20
30
40
Grain yield (q/ha)
50
60
Fig. 3. Micronutrient content vs. agronomic traits
Vertical growth attained during vegetative phase depends upon rooting pattern and an efficient
rooting system can also influence assimilation of soil minerals as grain nutrients. Significant
contribution of heading and height in flour recovery (Mohan and Gupta, 2014) and strongly
adverse relationship between iron and plant height (Morgounov et al., 2007) has been reported in
wheat. Graphical representation supported this viewpoint as cooper and manganese contents in
wheat grains appeared to have moderate affiliation with plant height (R2: 0.17-0.18). Study
expressed that taller plants tend to lose copper and manganese content in wheat grains and it
happens sharply when height exceeds 90cm (Fig. 3). Trend was similar in case of iron and zinc also
but association was weak. Plotting yield against grain micronutrient density did not display any
7
D. Mohan and R.K. Gupta / American Journal of Agricultural Science and Technology
(2015) Vol. 3 No. 1 pp. 1-11
pattern in case of zinc and copper (Fig. 3). Moderately negative influence of grain yield on
manganese and iron contents did emerge with R2 values 0.10-0.12. Though R2 value were similar
in these two elements, there was difference in the pattern as decline was gradual in case of
manganese whereas in case of iron, the association was positive in the productivity range 20 to
35q/ha. The decline however started emerging in manganese content once yield exceeded 40q/ha.
Relationship between grain size (1000 grain weight) and the filled micronutrients was very feeble
as the R2 value resolved between 0.00 and 0.03 only.
Scenario in Indian wheat varieties
Contribution of agronomic traits in grain mineral content was investigated in 50 Indian bread
varieties. Regression analysis revealed that collective contribution of five field traits was highly
significant in iron, copper and manganese (Table 3) but non-relevant in case of zinc. It indicates
unlike other minerals, zinc content is not altered by the agronomic traits. Analysis revealed that
contribution of agronomic traits in iron, copper and manganese (R2: 0.40 to 0.48) was higher than
grain protein (R2: 0.32), another grain quality parameter highly influenced by soil nutrients.
Table 3 Coefficients of multiple regression and contribution of component traits
Parameter
Iron
Zinc
Copper
Manganese
Multiple regression
0.636
0.370
0.696
0.634
2
R
0.405
0.137
0.484
0.402
Significance (P value)
<0.001
0.244
<0.001
<0.001
Grain protein
0.569
0.324
0.003
In regression analysis, contribution of some components stayed negative; therefore coefficients
were derived again by involving only those field attributes where individual contribution was also
significant. This exercise revealed that only two traits played significant role in grain minerals
(Table 4). Results showed that early heading was highly beneficial for iron and copper. Just like
protein, contribution of short grain filling duration was significant for iron. Contribution of plant
height appeared negative in copper and manganese. In contrast to protein content; grain weight
exerted no role in altering micronutrient density. Though some pattern between yield and iron
was observed in Indian wheats (Fig. 3), contribution of yield remained insignificant as only linear
regression is accounted in multiple regression analysis. Similarly plant height was also an
insignificant contributor in iron content.
Table 4 Key contributors for grain micronutrients
Parameter
Iron
Copper
R2 value
0.38***
0.46***
Beta value
Heading days
-0.47***
-0.47**
Grain filling days
-0.41**
Plant height
-0.28*
Grain weight
Grain yield
-
Zinc
0.14
Manganese
0.35***
-
-0.48***
-0.33**
Grain protein
0.25**
-0.29*
-0.29*
-
*, **, *** denote significance at P 0.05, 0.01 and 0.001, respectively.
8
D. Mohan and R.K. Gupta / American Journal of Agricultural Science and Technology
(2015) Vol. 3 No. 1 pp. 1-11
Study illustrated that with just two field traits, R2 value of 0.38, 0.46 and 0.35 was achievable in
iron, copper and manganese respectively. Early heading and quick grain ripening were significant
contributors in iron and role of each determinant was equally important. Contribution of two
phenology attributes in iron matched each other. R2 was reduced from 0.38 to 0.28 when pre and
post anthesis periods were replaced by a single variable i.e. crop duration which suggests that it’s
not the short crop cycle but the hastened flowering and grain filling that matters in assimilating
iron. Early heading and reduced plant height was crucial for copper content of wheat grains. Route
to manganese was totally different as short grain filling duration and fewer yields emerged as key
components. Both traits had equal importance in articulating manganese content in wheat grains.
Selection criteria
The exercise of identifying key agronomic traits indicated that phenotypic indicators can be useful
in enhancing grain mineral concentration of iron, copper and manganese in wheat. During field
selection, early heading and fast grain ripening can be preferred for iron whereas genotypes
expressing early flowering and reduced plant height shall be useful to enhance copper content.
Similarly, discard of long grain filling and heavy grain bearing might turn useful for manganese
content in bread wheats.
4.Conclusion
Improvement in grain mineral elements is a major step forward to tackle malnutrition in
developing or under-developed nations. Though it may not be difficult to identify areas better
suited for grain minerals, exploitation of location specificity still remains elusive. Karami et al.
(2009) observed that soil micronutrient concentrations alone were very poor predictors of grain
micronutrient content and emphasized to account climate variables for improving predictions.
This study broadly endorses this view point but also indicates situations, emerging due to climate
or genetic interventions, when variability in the screened materials remains small even at high
micronutrient concentration soils. Prospects of selecting micronutrient efficient genotype recede
under such situations. Scope of improvement in grain micronutrients therefore varies under
different situations. Bio-fortification even with few important micronutrients has turned highly
complex in wheat with occurrence of genotype-environment interactions (Joshi et al., 2010).
Under such conditions, it becomes utmost important to exploit the available variability in a
befitting manner. In this venture if some handy tools could be applied as selection criteria, the
approach to augment micronutrient concentration gets simplified.
In quality breeding, there is hardly any trait which is controlled by single variable. Pyramiding of
3-5 factors is a must to ensure quality of end-products and if efforts in bio-fortification can be
strengthened by exploiting two easily observed field attributes, it’s worth trying. This investigation
suggests that even if soil status is the major regulator, certain phenotypic markers can be applied
to expedite the selection process. Selection based upon early flowering and quick grain ripening
for iron, early heading and less plant height for copper and reduced plant height with less grain
bearing for manganese can supplement bio-fortification ventures. It indicates that selection for
early heading will help in faster assimilation of iron and copper, simultaneously. Murphy et al.
(2011) found several cultivars with high concentrations of two or more minerals across locations.
9
D. Mohan and R.K. Gupta / American Journal of Agricultural Science and Technology
(2015) Vol. 3 No. 1 pp. 1-11
It is generally stated that concentration of minerals in wheat grains makes no difference to grain
yield (Welch and Graham, 2002; Murphy et al., 2011). It might hold true for iron and copper but
not for manganese where concentration might recede with increasing yield. The role of individual
grain contributing factors requires some investigations supported by root studies. Handling zinc
through breeding seems to be more complex as plant-driven zinc is hardly of any use. Studies in
wheat as well rice suggest bio-fortification with zinc through soil and foliar applications of
nitrogen as remobilization becomes critical for grain zinc accumulation when its availability is
restricted during grain filling (Kutman et al., 2010; Phattarakul et al., 2012; Zou et al., 2012).
Developing wheat genotypes efficient in grain zinc shall therefore be more complex in comparison
to iron and copper and require different strategy in bio-fortification.
Acknowledgments
The work is outcome of a core project funded by the Indian Council of Agricultural Research.
Authors express thanks to researchers engaged in trial conduct and report writing of AICW&BIP.
References
Ereifej, K. I., Ajlouni, M. M., & Shibli, R. A. (1999). Cultivar and location effects on wheat quality in northern
Jordan. Dirasat Agricultural Science, 26, 216-225.
Garnett, T. P., & Graham, R. D. (2005). Distribution and remobilization of iron and copper in wheat. Annals of
Botany, 95, 817-826.
http://dx.doi.org/10.1093/aob/mci085
Graham, R. D., Welch R. M. & Bouis, H. E. (2001). Assessing micronutrient malnutrition through enhancing the
nutritional quality of staple foods: principles, perspectives and knowledge gaps. Advances in Agronomy,
70, 77-142.
http://dx.doi.org/10.1016/S0065-2113(01)70004-1
Jackson, M. L. (1973). Soil Chemical Analysis. Prentice Hall of India Pvt. Ltd., New Delhi.
Joshi, A. K, Corossa, J., Arun, B., Chand, R., Trethowan, R., Vargas, M., & Ortiz-Monasterio, I. (2010). Genotype ×
environment interaction for zinc and iron concentration of wheat grain in eastern Gangetic plains of
India. Field Crops Research, 116, 268-277.
http://dx.doi.org/10.1016/j.fcr.2010.01.004
Karami, M., Afyuni, M., Khoshgoftarmanesh, A. H., Papritz, A., & Schulin, R. (2009). Grain zinc, iron, and copper
concentrations of wheat grown in central iran and their relationships with soil and climate variables.
Journal of Agricultural & Food Chemistry, 57, 10876-82.
http://dx.doi.org/10.1021/jf902074f
Kutman, U. B., Yildiz, B., Ozturk, L., & Cakmak, I. (2010). Biofortification of durum wheat with zinc through soil
and foliar applications of nitrogen. Cereal Chemistry, 87, 1-9.
http://dx.doi.org/10.1094/CCHEM-87-1-0001
Misra, B. K., Sharma Rajiv K., & Nagarajan, S. (2004). Plant breeding: A component of public health strategy.
Current Science, 86, 1210-15.
Mohan, D., & Gupta, R. K. (2008). Approach to harness genetic improvement in important quality attributes of
Indian bread wheats. Journal of Wheat Research, 2, 52-56.
Mohan, D., Gupta, R. K., & Mishra, B. (2009). Improving nutritional quality of Indian bread wheat (Triticum
10
D. Mohan and R.K. Gupta / American Journal of Agricultural Science and Technology
(2015) Vol. 3 No. 1 pp. 1-11
aestivum L.). Indian Journal of Agricultural Sciences, 79, 29-34.
Mohan, D., Singh, S. S., Gupta, R. K. (2011). Vibrancy of the Indian wheat in upholding yield and quality under
global environmental change. In Wheat: Productivity Enhancement under Changing Climate (pp 87-94).
Narosa Publishing House, New Delhi.
Mohan, D., Gupta, R. K., & Sharma Indu (2013a). Harnessing flour recovery in the Indian wheats. Indian
Journal of Agricultural Sciences, 83, 781-787.
Mohan, D., Gupta, R. K., & Verma A. (2013b). Characterization of popular bread wheat cultivars of India for
grain quality and the stable genetic resource. Indian Journal of Genetics and Plant Breeding, 73, 14-22.
http://dx.doi.org/10.5958/j.0019-5200.73.1.002
Mohan, D., & Gupta, R. K. (2014). Exploring crop morphology to supplement augmentation of wheat flour
recovery – An analysis. Canadian Journal of Plant Breeding, 2, 44-50.
Morgounov, A., Gómez-Becerra, H. F., Abugalieva, A., Dzhunusova, M., Yessimbekova, M., Muminjanov, H.,
Zelenskiy, Y., Ozturk, L., & Cakmak, I. (2007). Iron and zinc grain density in common wheat grown in
Central Asia. Euphytica, 155, 193-203.
http://dx.doi.org/10.1007/s10681-006-9321-2
Murphy, K. M., Lori, A., Hoagland, L. A., Yan, L., Colley, M., & Jones, S. S. (2011). Genotype × environment
interactions for mineral concentration in grain of organically grown spring wheat. Agronomy Journal,
103, 1734-1741.
http://dx.doi.org/10.2134/agronj2011.0097
Phattarakul, N., Rerkasem, B., Li., L. J., Wu, L. H., Zou, C. Q., Ram, H., Sohu, V. S., Kang, B. S., Surek, H., Kalayci, M.,
Yazici, A., Zhang, F. S., & Cakmak, I. (2012). Biofortification of rice grain with zinc through zinc fertilization
in different countries. Plant Soil, 361,131-141.
http://dx.doi.org/10.1007/s11104-012-1211-x
Pfeiffer, W. H., & McClafferty, B. (2007). Biofortification: Breeding Micronutrient-Dense Crops. In Breeding
Major Food Staples (pp 61-91). Blackwell Publishing.
http://dx.doi.org/10.1002/9780470376447.ch3
Welch, R. M., & Graham, R. D. (2002). Breeding crops for enhanced micronutrient content. Plant Soil, 245, 20514.
http://dx.doi.org/10.1023/A:1020668100330
Welch, R. M., & Graham, R. D. (2004). Breeding for micronutrients in staple food crops from a human nutrition
perspective. Journal of Experimental Botany, 55, 353-364.
http://dx.doi.org/10.1093/jxb/erh064
Zou, C. Q., Zhang, Y. Q., Rashid, A., Ram, H., Savasli, E., Arisoy, R. Z., Ortiz-Monasterio, I., Simunji, S., Wang, Z. H.,
Sohu, V., Hassan, M., Kaya, Y., Onder, O., Lungu, O., Yaqub, M. M., Joshi, A. K., Zelenskiy, Y., Zhang, F. S., &
Cakmak, I. (2012). Biofortification of wheat with zinc through zinc fertilization in seven countries. Plant
Soil, 361,119-130.
http://dx.doi.org/10.1007/s11104-012-1369-2
11


© Copyright 2026