
Detecting high-grade squamous intraepithelial lesions in the cervix
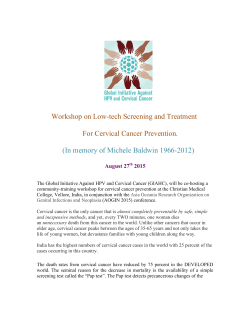
Detecting high-grade squamous intraepithelial lesions in the cervix with quantitative spectroscopy and per-patient normalization Jelena Mirkovic,1,2* Condon Lau,1 Sasha McGee,1 Christopher Crum,2 Kamran Badizadegan,3 Michael Feld,1 and Elizabeth Stier4 1 George R. Harrison Spectroscopy Laboratory, Massachusetts Institute of Technology, 77 Massachusetts Avenue, Cambridge, MA 02179, USA 2 Department of Pathology, Brigham and Women’s Hospital, 75 Francis Street, Boston, MA 02115, USA 3 Department of Pathology, Massachusetts General Hospital, Boston, MA 02114, USA 4 Department of Obstetrics and Gynecology, Boston Medical Center, 85 East Concord Street, Boston, MA 02118, USA *[email protected] Abstract: This study develops a spectroscopic algorithm for detection of cervical high grade squamous intraepithelial lesions (HSILs). We collected reflectance and fluorescence spectra with the quantitative spectroscopy probe to measure nine spectroscopic parameters from 43 patients undergoing standard colposcopy with directed biopsy. We found that there is improved accuracy for distinguishing HSIL from non-HSIL (low grade SIL and normal tissue) when we “normalized” spectroscopy parameters by dividing the values extracted from each clinically determined suspicious site by the corresponding value extracted from a clinically normal squamous site from the same patient. The “normalized” scattering parameter (A) at 700nm, best distinguished HSIL from non-HSIL with sensitivity and specificity of 89% and 79% suggesting that a simple, monochromatic instrument measuring only A may accurately detect HSIL. © 2011 Optical Society of America OCIS codes: (170.0170) Medical optics and biotechnology; (170.6510) Spectroscopy, tissue diagnostics References and links 1. M. Sideri, N. Spolti, L. Spinaci, F. Sanvito, R. Ribaldone, N. Surico, and L. Bucchi, “Interobserver variability of colposcopic interpretations and consistency with final histologic results,” J. Low. Genit. Tract Dis. 8(3), 212–216 (2004). 2. N. M. Marín, A. Milbourne, H. Rhodes, T. Ehlen, D. Miller, L. Benedet, R. Richards-Kortum, and M. Follen, “Diffuse reflectance patterns in cervical spectroscopy,” Gynecol. Oncol. 99(3 Suppl 1), S116–S120 (2005). 3. S. K. Chang, I. Pavlova, N. M. Marín, M. Follen, and R. Richards-Kortum, “Fluorescence spectroscopy as a diagnostic tool for detecting cervical pre-cancer,” Gynecol. Oncol. 99(3 Suppl 1), S61–S63 (2005). 4. S. K. Chang, N. Marin, M. Follen, and R. Richards-Kortum, “Model-based analysis of clinical fluorescence spectroscopy for in vivo detection of cervical intraepithelial dysplasia,” J. Biomed. Opt. 11(2), 024008 (2006). 5. R. J. Nordstrom, L. Burke, J. M. Niloff, and J. F. Myrtle, “Identification of cervical intraepithelial neoplasia (CIN) using UV-excited fluorescence and diffuse-reflectance tissue spectroscopy,” Lasers Surg. Med. 29(2), 118–127 (2001). 6. N. Ramanujam, M. F. Mitchell, A. Mahadevan, S. Thomsen, A. Malpica, T. Wright, N. Atkinson, and R. Richards-Kortum, “Development of a multivariate statistical algorithm to analyze human cervical tissue fluorescence spectra acquired in vivo,” Lasers Surg. Med. 19(1), 46–62 (1996). 7. R. D. Alvarez, T. C. Wright, and Optical Detection Group, “Effective cervical neoplasia detection with a novel optical detection system: a randomized trial,” Gynecol. Oncol. 104(2), 281–289 (2007). 8. W. K. Huh, R. M. Cestero, F. A. Garcia, M. A. Gold, R. S. Guido, K. McIntyre-Seltman, D. M. Harper, L. Burke, S. T. Sum, R. F. Flewelling, and R. D. Alvarez, “Optical detection of high-grade cervical intraepithelial neoplasia in vivo: results of a 604-patient study,” Am. J. Obstet. Gynecol. 190(5), 1249–1257 (2004). 9. I. Georgakoudi, E. E. Sheets, M. G. Müller, V. Backman, C. P. Crum, K. Badizadegan, R. R. Dasari, and M. S. Feld, “Trimodal spectroscopy for the detection and characterization of cervical precancers in vivo,” Am. J. Obstet. Gynecol. 186(3), 374–382 (2002). 10. Y. N. Mirabal, S. K. Chang, E. N. Atkinson, A. Malpica, M. Follen, and R. Richards-Kortum, “Reflectance spectroscopy for in vivo detection of cervical precancer,” J. Biomed. Opt. 7(4), 587–594 (2002). #150531 - $15.00 USD (C) 2011 OSA Received 11 Jul 2011; revised 1 Sep 2011; accepted 7 Sep 2011; published 29 Sep 2011 1 October 2011 / Vol. 2, No. 10 / BIOMEDICAL OPTICS EXPRESS 2917 11. J. R. Mourant, T. J. Bocklage, T. M. Powers, H. M. Greene, K. L. Bullock, L. R. Marr-Lyon, M. H. Dorin, A. G. Waxman, M. M. Zsemlye, and H. O. Smith, “In vivo light scattering measurements for detection of precancerous conditions of the cervix,” Gynecol. Oncol. 105(2), 439–445 (2007). 12. I. M. Orfanoudaki, G. C. Themelis, S. K. Sifakis, D. H. Fragouli, J. G. Panayiotides, E. M. Vazgiouraki, and E. E. Koumantakis, “A clinical study of optical biopsy of the uterine cervix using a multispectral imaging system,” Gynecol. Oncol. 96(1), 119–131 (2005). 13. S. B. Cantor, J. M. Yamal, M. Guillaud, D. D. Cox, E. N. Atkinson, J. L. Benedet, D. Miller, T. Ehlen, J. Matisic, D. van Niekerk, M. Bertrand, A. Milbourne, H. Rhodes, A. Malpica, G. Staerkel, S. Nader-Eftekhari, K. AdlerStorthz, M. E. Scheurer, K. Basen-Engquist, E. Shinn, L. A. West, A. T. Vlastos, X. Tao, J. R. Beck, C. Macaulay, and M. Follen, “Accuracy of optical spectroscopy for the detection of cervical intraepithelial neoplasia: Testing a device as an adjunct to colposcopy,” Int. J. Cancer 128(5), 1151–1168 (2011). 14. J. R. Mourant, T. M. Powers, T. J. Bocklage, H. M. Greene, M. H. Dorin, A. G. Waxman, M. M. Zsemlye, and H. O. Smith, “In vivo light scattering for the detection of cancerous and precancerous lesions of the cervix,” Appl. Opt. 48(10), D26–D35 (2009). 15. J. R. Mourant, T. J. Bocklage, T. M. Powers, H. M. Greene, M. H. Dorin, A. G. Waxman, M. M. Zsemlye, and H. O. Smith, “Detection of cervical intraepithelial neoplasias and cancers in cervical tissue by in vivo light scattering,” J. Low. Genit. Tract Dis. 13(4), 216–223 (2009). 16. C. Redden Weber, R. A. Schwarz, E. N. Atkinson, D. D. Cox, C. Macaulay, M. Follen, and R. Richards-Kortum, “Model-based analysis of reflectance and fluorescence spectra for in vivo detection of cervical dysplasia and cancer,” J. Biomed. Opt. 13(6), 064016 (2008). 17. M. Cardenas-Turanzas, J. A. Freeberg, J. L. Benedet, E. N. Atkinson, D. D. Cox, R. Richards-Kortum, C. MacAulay, M. Follen, and S. B. Cantor, “The clinical effectiveness of optical spectroscopy for the in vivo diagnosis of cervical intraepithelial neoplasia: where are we?” Gynecol. Oncol. 107(1 Suppl 1), S138–S146 (2007). 18. A. Blaustein and R. J. Kurman, Blaustein's pathology of the female genital tract (Springer, New York, 2002). 19. R. Kalluri and M. Zeisberg, “Fibroblasts in cancer,” Nat. Rev. Cancer 6(5), 392–401 (2006). 20. H. Nagase and J. F. Woessner, Jr., “Matrix metalloproteinases,” J. Biol. Chem. 274(31), 21491–21494 (1999). 21. J. Mazibrada, M. Rittà, M. Mondini, M. De Andrea, B. Azzimonti, C. Borgogna, M. Ciotti, A. Orlando, N. Surico, L. Chiusa, S. Landolfo, and M. Gariglio, “Interaction between inflammation and angiogenesis during different stages of cervical carcinogenesis,” Gynecol. Oncol. 108(1), 112–120 (2008). 22. C. K. Brookner, M. Follen, I. Boiko, J. Galvan, S. Thomsen, A. Malpica, S. Suzuki, R. Lotan, and R. RichardsKortum, “Autofluorescence patterns in short-term cultures of normal cervical tissue,” Photochem. Photobiol. 71(6), 730–736 (2000). 23. J. A. Freeberg, D. M. Serachitopol, N. McKinnon, R. Price, E. N. Atkinson, D. D. Cox, C. MacAulay, R. Richards-Kortum, M. Follen, and B. Pikkula, “Fluorescence and reflectance device variability throughout the progression of a phase II clinical trial to detect and screen for cervical neoplasia using a fiber optic probe,” J. Biomed. Opt. 12(3), 034015 (2007). 24. C. Brookner, U. Utzinger, M. Follen, R. Richards-Kortum, D. Cox, and E. N. Atkinson, “Effects of biographical variables on cervical fluorescence emission spectra,” J. Biomed. Opt. 8(3), 479–483 (2003). 25. S. K. Chang, M. Y. Dawood, G. Staerkel, U. Utzinger, E. N. Atkinson, R. R. Richards-Kortum, and M. Follen, “Fluorescence spectroscopy for cervical precancer detection: Is there variance across the menstrual cycle?” J. Biomed. Opt. 7(4), 595–602 (2002). 26. C. K. Brookner, U. Utzinger, G. Staerkel, R. Richards-Kortum, and M. F. Mitchell, “Cervical fluorescence of normal women,” Lasers Surg. Med. 24(1), 29–37 (1999). 27. E. M. Gill, A. Malpica, R. Richards-Kortum, M. Follen, and N. Ramanujam, “Collagen autofluorescence of the human cervix and menopausal status,” Lasers Surg. Med. 32(Suppl. 15), 12 (2003) (abstract). 28. S. K. Chang, Y. N. Mirabal, E. N. Atkinson, D. Cox, A. Malpica, M. Follen, and R. Richards-Kortum, “Combined reflectance and fluorescence spectroscopy for in vivo detection of cervical pre-cancer,” J. Biomed. Opt. 10(2), 024031 (2005). 29. J. Mirkovic, C. Lau, S. McGee, C. C. Yu, J. Nazemi, L. Galindo, V. Feng, T. Darragh, A. de Las Morenas, C. Crum, E. Stier, M. Feld, and K. Badizadegan, “Effect of anatomy on spectroscopic detection of cervical dysplasia,” J. Biomed. Opt. 14(4), 044021 (2009). 30. C. P. Crum, M. R. Nucci, and K. R. Lee, Diagnostic Gynecologic and Obstetric Pathology (Elsevier, Philadelphia, 2011). 31. G. Zonios, L. T. Perelman, V. M. Backman, R. Manoharan, M. Fitzmaurice, J. Van Dam, and M. S. Feld, “Diffuse reflectance spectroscopy of human adenomatous colon polyps in vivo,” Appl. Opt. 38(31), 6628–6637 (1999). 32. M. G. Müller, I. Georgakoudi, Q. G. Zhang, J. Wu, and M. S. Feld, “Intrinsic fluorescence spectroscopy in turbid media: disentangling effects of scattering and absorption,” Appl. Opt. 40(25), 4633–4646 (2001). 33. C. Lau, “Detecting cervical dysplasia with quantitative spectroscopic imaging,” Ph.D. thesis (Massachusetts Institute of Technology, Cambridge, MA, 2009). 34. D. Arifler, C. MacAulay, M. Follen, and R. Richards-Kortum, “Spatially resolved reflectance spectroscopy for diagnosis of cervical precancer: Monte Carlo modeling and comparison to clinical measurements,” J. Biomed. Opt. 11(6), 064027 (2006). 35. D. G. Ferris, Modern Colposcopy: Textbook and Atlas (Kendall/Hunt, Dubuque, Iowa, 2004). 36. W. Choi, C. C. Yu, C. Fang-Yen, K. Badizadegan, R. R. Dasari, and M. S. Feld, “Field-based angle-resolved light-scattering study of single live cells,” Opt. Lett. 33(14), 1596–1598 (2008). #150531 - $15.00 USD (C) 2011 OSA Received 11 Jul 2011; revised 1 Sep 2011; accepted 7 Sep 2011; published 29 Sep 2011 1 October 2011 / Vol. 2, No. 10 / BIOMEDICAL OPTICS EXPRESS 2918 1. Introduction The main target of the clinical management of women with suspected squamous intraepithelial lesions (SIL) is the accurate diagnosis of precancerous changes, specifically high grade SIL (HSIL). The current clinical standard for diagnosis of HSIL is colposcopy, a procedure that involves visual inspection and biopsy of at-risk tissue, followed by histopathological diagnosis. The diagnostic accuracy of colposcopy greatly depends on the physician’s expertise and even when conducted by experts, is subject to significant diagnostic variability [1]. Spectroscopy is a technique that may reduce the interobserver disagreement of colposcopy and improve its diagnostic accuracy by diagnosing HSIL in an objective manner. The effectiveness of spectroscopic techniques, specifically reflectance and fluorescence, for in vivo diagnosis of HSIL has been extensively evaluated [2–16] These studies demonstrate the potential of spectroscopy to improve the effectiveness of disease detection [17]. The spectroscopic diagnosis of cervical dysplasia is based on the contrast in tissue spectra caused by loss of differentiation of the epithelial cells [18], degradation and reorganization of stromal collagen by matrix metalloproteinase activity [19,20], increased metabolic activity, and angiogenesis [21]. Tissue spectroscopy is not only affected by disease, but also by age [15,22–26], menopausal status [15,23–27], time after the application of acetic acid [12], and normal variations in cervical anatomy [6,23,28,29]. Historically, spectroscopic studies have included clinically normal squamous sites, either non-biopsied or histopathologically confirmed, in the validation set for diagnosing HSILs [5,6,8,10,28]. Mourant et al. [11,14] and Georgakoudi et al. [9] noted an apparent increase in diagnostic power when clinically normal tissues were included in the validation set. Similarly, Freeberg et al. [23] observed that tissue type influences both reflectance and fluorescence measurements. In a recent study by our laboratory, we demonstrated that underlying differences in tissue anatomy can have a confounding effect on diagnostic spectral algorithms [29]. Normal transformation zone of the cervix, the area where the vast majority of HSILs are found [30], is anatomically, histologically, and spectroscopically different from the normal squamous mucosa. As the vast majority of the HSILs are found in the transformation zone, the spectral differences between normal squamous mucosa and HSIL are largely due to normal anatomical differences. Based on the findings of this study, a common practice of including clinically normal squamous sites into the data set which is used to develop or evaluate the performance of the algorithm for detection of HSIL is a confounding artifact that artificially increases performance values with respect to the key differentiation to be made, namely distinguishing HSILs from clinically suspicious non-HSILs. The data in this study demonstrated the confounding influence of including clinically normal squamous sites not only affects the performance levels but also the number of specific spectroscopic parameters that can be used in the diagnostic algorithm. The affected parameters included those describing the scattering, absorption, and fluorescence properties of tissue. In order to properly evaluate the accuracy of clinical disease detection, spectroscopic data must be analyzed within the appropriate anatomical context. The aim of the present study was to develop an algorithm for detection of HSILs free of the confounding effect of cervical anatomy. We studied patients undergoing colposcopic examination and used reflectance and fluorescence spectroscopy to differentiate HSILs from non-HSILs among abnormal sites identified by the clinician as needing biopsy. Physical models were used to fit the spectra and extract parameters related to tissue morphology and biochemistry. We investigated the effect of per-patient parameter normalization on diagnostic performance as well as the effect of normal anatomical variation within the transformation zone, the glandular content, on the extracted spectroscopy parameters. The spectroscopy parameters were then used to develop a spectroscopic diagnostic algorithm to distinguish HSILs from non-HSILs. #150531 - $15.00 USD (C) 2011 OSA Received 11 Jul 2011; revised 1 Sep 2011; accepted 7 Sep 2011; published 29 Sep 2011 1 October 2011 / Vol. 2, No. 10 / BIOMEDICAL OPTICS EXPRESS 2919 2. Materials and methods 2.1. Data collection Details of data collection and spectroscopic analysis of a cervical data set used in this study were previously described by Mirkovic et al. [29]. Briefly, the clinical in vivo study was conducted at the Boston Medical Center and involved 43 patients undergoing colposcopic evaluation following an abnormal Pap smear. For each patient, reflectance and fluorescence spectra were collected from a colposcopically normal squamous (CNSQ) site as well as colposcopically abnormal sites using a fiber optic based clinical device developed by our laboratory known as the Fast Excitation Emission Matrix (FastEEM). The instrument and the calibration procedures have been previously described. 20 After the application of acetic acid (5% solution) to the cervix during colposcopy, the probe which samples an area of tissue ~1 mm in diameter was brought into gentle contact with the tissue. The reflectance and fluorescence spectra were acquired in approximately three seconds. Two to three measurements were acquired for each tissue site. Colposcopically abnormal sites were then biopsied and evaluated by histopathology. Clinically normal squamous sites were not biopsied. 2.2. Histopathology Each biopsy specimen underwent standard histopathological processing. In order to minimize inter-observer diagnostic variability, hematoxylin and eosin stained tissue sections were evaluated independently by three experienced pathologists (CC, ADLM, TD) using standard diagnostic criteria. Consensus diagnosis (agreement between two of the three pathologists) was used as the diagnostic gold standard. Each biopsied site was classified as either HSIL or non-HSIL (negative for SIL or low grade squamous intraepithelial lesion, LSIL). All histologic specimens were further examined by a single pathologist (CC) for the absence or presence of features consistent with the transformation zone. If the stroma (the connective tissue underlying the epithelium) of a particular site was visible, we further performed a qualitative assessment of its glandular content. Each site was classified as having either a significant glandular content or a minimal glandular content based on whether the ratio of the area occupied by glands to area occupied by stroma was ≥0.25 or <0.25. Finally, the average epithelial thickness was measured with Zeiss Axio Imager 2.0.0.0. software and defined by an average value of three measurements across the surface epithelium. 2.3. Spectral data analysis Four patients were excluded due to instrument malfunctions during measurement (CCD camera overheat, probe damage). Raw spectra for each set of measurements were examined and those with poor overlap between repeat measurements were excluded. We excluded 3 study sites for which all sets in a measurement were inconsistent (>10% average standard deviation between measurements), as well as 4 sites for which the tissue started bleeding due to probe contact. We used physically-based models to extract the spectroscopy parameters from the tissue reflectance and fluorescence spectra. The reflectance spectra were analyzed using the diffuse scattering model developed by Zonios et al. [31], and tissue fluorescence emission spectra were analyzed by the photon-migration model developed by Muller et al. [32]. The details of spectral data analysis were further described by Mirkovic et al. [29]. As a result, we derived nine spectroscopic parameters from modeling tissue reflectance and fluorescence: scattering parameters (A [mm−1], B, and C [mm−1]), hemoglobin concentration Hb [mg/ml], oxygen saturation α, effective blood vessel radius bvr [mm], concentration of beta-carotene β-car [mg/ml], and the fractional contributions of collagen and NADH in the intrinsic fluorescence (Coll and NADH, respectively). We note that the A parameter is equivalent to the reduced scattering coefficient at 700 nm. To identify changes in spectroscopic parameters due to disease, we studied the values of extracted spectroscopy parameters from clinically suspicious sites. During colposcopy, #150531 - $15.00 USD (C) 2011 OSA Received 11 Jul 2011; revised 1 Sep 2011; accepted 7 Sep 2011; published 29 Sep 2011 1 October 2011 / Vol. 2, No. 10 / BIOMEDICAL OPTICS EXPRESS 2920 abnormal sites are identified based on contrasts in color, texture, and other features relative to normal tissue. We evaluated whether a similar procedure would be useful for a spectroscopicbased diagnostic method. Specifically, we divided the spectroscopy parameters extracted from each clinically suspicious site by the values of the corresponding spectroscopy parameters extracted from a CNSQ site collected from the same patient. Parameters derived from this procedure are subsequently referred to as normalized spectroscopy parameters. Normalized spectroscopy parameters were correlated to the histopathology diagnosis for all data collected from clinically suspicious sites. A two-sided Wilcoxon Rank Sum test was used to test the hypothesis that the extracted normalized spectroscopic parameter distributions of HSIL and non-HSIL were different. A p-value of <0.05 was considered significant. The spectral algorithms were developed using logistic regression models to identify the significant spectroscopic parameters providing the diagnostic information. The likelihood ratio test was used to assess the significance of each of the parameters in the logistic regression model. 21 A p-value <0.05 was considered to be significant. Leave-one-out cross-validation (LCV) was used to construct receiver-operator characteristic (ROC) curves for the spectral algorithms. The discrimination ability was evaluated by the area under the ROC curve (AUC), as well as the sensitivity and specificity. In the following, we report a point on the ROC curve which is the shortest distance away from the point of perfect separation (100% sensitivity and 100% specificity) defined by sensitivity 2 specificity 2 (1) min 1 − + 1 − 100 100 We refer to this point whenever we quote sensitivity and specificity values. To study the effect of tissue glandular content on the spectroscopy parameters, we divided non-HSIL sites into two groups: 1) non-HSIL sites with a gland-to-stroma ratio of <0.25 (nonGS sites), and 2) non-HSIL sites with gland-to-stroma ratio of ≥0.25 (GS sites), and compared them to all HSIL sites by using the statistical methods (two-sided Wilcoxon Rank Sum test and LCV and logistic regression) described above. 3. Results 3.1. Data set As shown in Table 1, our data set consisted of 33 CNSQ sites, which were not biopsied, and 51 clinically suspicious biopsied sites, out of which histopathology determined that 9 sites (from 6 patients) were HSILs and 42 sites were non-HSIL (30 sites negative for SIL from 19 patients and 12 LSILs from 11 patients). We emphasize that the non-HSIL sites in our data set do not include the 33 CNSQ sites. The patient age for this data set ranges from 18 to 47 years, and the mean patient age is 26 ± 7.5 years. Table 1. Data seta Clinical Category Normal (CNSQ) Histology Category No. of Sites Not biopsied 33 Negative for SIL 30 non-HSIL Suspicious LSIL 12 HSIL 9 a Clinically normal squamous, CNSQ; squamous intraepithelial lesions. SIL; high grade SIL, HSIL; low grade SIL, LSIL. 3.2. Microscopic characterization Histopathological evaluation confirmed that 36 of 51 biopsied sites were from the transformation zone. Fifteen sites could not be histologically confirmed as transformation zone (e.g., stroma was not visible on the histology slides to ensure full assessment or glandular elements were not present). All of the HSIL sites, except one for which stroma was not visible, were confirmed to be from the transformation zone. #150531 - $15.00 USD (C) 2011 OSA Received 11 Jul 2011; revised 1 Sep 2011; accepted 7 Sep 2011; published 29 Sep 2011 1 October 2011 / Vol. 2, No. 10 / BIOMEDICAL OPTICS EXPRESS 2921 Table 2 provides a description of glandular content for non-HSIL and HSIL sites. High glandular content (gland-to-stroma ratio of ≥0.25) was found in 5/8 (62.5%) of HSIL sites compared to 13/34 (38%) of non-HSIL sites, however this difference was not significant by Wilcoxon ransum test. There was no significant difference in epithelial thickness for HSIL and non-HSIL sites (171 ± 50 and 250 ± 124 μm, respectively). Table 2. Description of glandularity for non-HSIL and HSIL sites Group non-HSIL HSIL Glandular content (gland-to-stroma ratio) ≥0.25 (GS) <0.25 (non-GS) Could not be evaluated 13 21 8 5 3 1 Fig. 1. Discrimination of HSIL from non-HSIL among clinically suspicious sites. Boxplots of normalized (a) A parameter (reduced scattering coefficient at 700nm), (b) α (oxygen saturation), (c) bvr (blood vessel radius), (d) Hb (hemoglobin concentration), (e) Coll (fractional contribution of collagen to intrinsic fluorescence); (f) Receiver operator characteristic curve for the diagnostic algorithm (normalized A parameter only). Box plots: median (horizontal line within the box), upper and lower quartiles (upper and lower edges of the box, respectively), extent of the data (whiskers), and outliers (crosses, data points that are more than 1.5 times the interquartile range below the lower quartile or above the upper quartile). #150531 - $15.00 USD (C) 2011 OSA Received 11 Jul 2011; revised 1 Sep 2011; accepted 7 Sep 2011; published 29 Sep 2011 1 October 2011 / Vol. 2, No. 10 / BIOMEDICAL OPTICS EXPRESS 2922 3.3. Identifying HSILs among the clinically suspicious sites To assess the potential clinical impact of our technique, it is essential to evaluate its success in differentiating HSIL from non-HSIL sites among clinically suspicious sites, most of which are found in the transformation zone. Recent work in our laboratory, which uses the same data set described in this paper, have shown that HSIL sites were characterized by significantly lower values of the A and Coll, and significantly higher values of Hb compared to the non-HSIL sites. The AUC, sensitivity and specificity of 0.65, 78%, and 57% were achieved on the basis of A parameter. Combination of Coll and Hb parameters produced similar AUC, sensitivity and specificity (0.68, 78% and 67%, respectivelly) [29] We find that after per-patient normalization, HSIL sites are characterized by significantly lower values of the A parameter and significantly higher values of α, Hb, and bvr compared to non-HSIL sites. AUC, sensitivity and specificity of 0.84, 89% and 79%, respectively, were achieved. The positive and negative predictive values were 48% and 97%, respectively. The normalized A parameter was the most diagnostic and the only parameter retained in the logistic regression algorithm. The box plots of normalized A, α, bvr, and Hb which have statistically significant differences between non-HSIL and HSIL sites, and Coll which has no statistically significant difference between non-HSIL and HSIL are shown in Figs. 1(a)-1(e), respectively, and the ROC plot based on the normalized A parameter is shown in Fig. 1(f). CNSQ sites are significantly different from both non-HSIL and HSIL sites for all parameters shown. 3.4. Effect of glandular content on spectroscopic parameters Because the glandular content varies within the transformation zone, we also investigated the effect of gland-to-stroma ratio on the diagnostic normalized spectroscopy parameters. While all HSIL can be differentiated from non-GS sites by the lower values of A and Coll and higher values of Hb, α and bvr, only two parameters, A and α, were significantly different between HSIL sites and GS sites based on the Wilcoxon Rank Sum test. Figure 2 shows box plots of the A and α parameters. The A parameter was significantly different between GS and non-GS sites, while α was not significantly different. We also developed logistic regression models to differentiate all HSIL from non-GS and GS sites. In both cases, A alone provided the best discrimination between the two sites and the impact of other parameters was negligible. AUC, sensitivity, and specificity for differentiating all HSIL from non-GS were 0.84, 89% and 79%, respectively. AUC, sensitivity, and specificity for differentiating all HSIL from GS sites were 0.82, 89% and 70%, respectively. Fig. 2. Discrimination of HSIL from GS and non-GS sites. Box plots of normalized (a) A parameter and (b) α. #150531 - $15.00 USD (C) 2011 OSA Received 11 Jul 2011; revised 1 Sep 2011; accepted 7 Sep 2011; published 29 Sep 2011 1 October 2011 / Vol. 2, No. 10 / BIOMEDICAL OPTICS EXPRESS 2923 4. Comment Both disease and normal variations in microscopic anatomy are significant sources of spectroscopic contrast in clinically obtained tissue spectra. In order to properly evaluate the accuracy of disease detection, spectroscopic data must therefore be analyzed within the appropriate anatomical context. This study specifically focuses on differentiating HSILs from non-HSILs among clinically suspicious sites, the majority of which are found within the transformation zone. We find that after normalization by an internal standard, the A parameter alone provided the best diagnostic performance in differentiating HSIL from non-HSIL sites. AUC, sensitivity and specificity of 0.84, 89% and 79%, respectively, were achieved. Positive and negative predictive values were 48% and 97%, respectively. The high negative predictive value suggests that this technique may be useful for reducing the number of unnecessary biopsies. Even though the spectroscopy parameters including A parameter are affected by glandular content, the A parameter was the most diagnostic parameter in the discrimination of HSIL from both GS and non-GS sites. In our study HSIL sites exhibit significantly lower values of A parameter relative to the non-HSIL sites. This result is in agreement with results from similar studies in the literature. In a study of 161 patients, Mirabal et al. [10] found that there is a gradual decrease in mean reflectance intensity as the severity of dysplasia increases. In studies by Nordstrom et al. [5], and Huh et al. [8], reflectance was found to differentiate between HSIL and normal sites in the transformation zone (squamous metaplasia), while fluorescence did not yield significant differences. For both studies it is not known whether the differences in reflectance spectra were due to a higher hemoglobin concentration, lower scattering, or a combination of the two effects. Furthermore, our study cannot be directly compared to these two studies, as our study compares HSIL to all clinically suspicious non-HSIL sites, including the LSIL sites, while their studies report LSIL and squamous metaplasia sites separately. Georgakoudi et al. [9]. also report lower reduced scattering coefficient (similar to A parameter) for distinguishing SILs from biopsied non-SILs. However, we cannot directly compare their findings to those of this study as they did not discriminate HSIL from non-HSIL. Finally, the findings of the follow-up clinical in vivo study conducted with the Quantitative Spectroscopy Imaging system (manuscript in preparation) were consistent with the findings of our study. This study also observed that after normalization by an internal standard, the A parameter alone provided the best diagnostic performance in differentiating HSIL from non-HSIL sites [33]. The lower value of the A parameter for HSIL sites compared to non-HSIL sites is also physically justified. Arifler et al. [34] used Monte Carlo modeling of cervical tissue to show that the smaller stromal reduced scattering coefficient is the major cause for decreased reflectance intensity of HSIL compared to normal squamous tissue. Degradation of stromal collagen by matrix metalloproteinase activity [19,20] is the likely explanation for the lower value of A parameter for HSIL sites compared to non-HSIL sites. We also observe higher hemoglobin concentration of HSIL sites relative to the non-HSIL sites. Higher hemoglobin concentration in HSIL sites compared to other tissue types has been noted by Chang et al. [4] Additionally, Marin et al. [2] report that hemoglobin features of the reflectance tissue spectra are more prominent in abnormal tissue compared to normal squamous tissue. However, studies that considered diagnosing HSIL within clinically suspicious sites, such as Georgakoudi et al. [9], as well as Mourant et al. [11] reported no significant change in the hemoglobin concentration between HSIL and non-HSILs. Our finding of higher hemoglobin oxygenation for HSIL sites compared to non-HSIL within the clinically suspicious sites is consistent with the results of a study by Mourant et al. [11] which also looked at the difference between HSIL and clinically suspicious non-HSIL sites, 90% of which were found in the transformation zone. The source of higher hemoglobin oxygenation for HSIL sites is not well understood and needs further investigation. We find that the effective blood vessel radius is increased for HSIL sites compared to nonHSIL sites. This may be due to the presence of dilated atypical blood vessels associated with precancerous and cancerous changes [35]. #150531 - $15.00 USD (C) 2011 OSA Received 11 Jul 2011; revised 1 Sep 2011; accepted 7 Sep 2011; published 29 Sep 2011 1 October 2011 / Vol. 2, No. 10 / BIOMEDICAL OPTICS EXPRESS 2924 Finally, we observe decreased Coll for HSIL sites compared to non-HSIL sites. This observation is consistent with decreased collagen fluorescence due to degradation of collagen matrix, increased NADH fluorescence due to changes in cellular metabolism, or a combination of both. The increase in epithelial thickness is not a source of this feature, since there was no significant difference in measured epithelial thickness between HSIL and nonHSIL sites in our study. Increased NADH contribution of SILs compared to non-SILs within the transformation zone has been observed by Georgakoudi et al. [9] Chang et al. [4] report a decreased stromal collagen contribution; however, their study included clinically normal squamous sites. Studies by Nordstrom [5], and Huh [8], which utilize 340 nm fluorescence, reported no significant differences between HSIL and normal sites in the transformation zone (squamous metaplasia). A study of Ramanujam et al. reported that 340 nm excitation HSIL sites could not be differentiated from non-HSIL sites in the transformation zone (cervical intraepithelial neoplasia 2/3 (equivalent to HSIL) vs. squamous metaplasia). We found that normalization of the spectroscopy parameters enhanced the contrast between HSIL and non-HSIL sites. Normalization may reduce spectroscopic variations due to intrinsic patient-to-patient variations associated with age, hormonal contraception, and menopausal status. Furthermore, it may account for differences caused by the time-dependent effect of acetic acid on tissue scattering and absorption. The vasoconstrictive and light scattering effects of acetic acid [35,36] may affect the extracted hemoglobin concentration, effective blood vessel radius, and also the scattering parameters. Recent work in our laboratory, which uses the same data set described in this paper, showed that without parameter normalization, HSIL sites could be differentiated from non-HSIL with AUC, sensitivity, and specificity of only 0.68, 78% and 67%, respectively [29]. In the present study, we found that parameter normalization resulted in substantial improvements performance metrics, as reported above. However, we point out that per-patient normalization of Coll parameter has decreased the ability of this parameter to differentiate between non-HSIL and HSIL sites. Further investigation is required to determine the best strategy for fluorescence per-patient normalization. The finding that only the A parameter has diagnostic importance suggests that a significantly simpler, faster, and less expensive instrument which measures tissue scattering using one wavelength may be all that is required to reliably detect cervical disease. The limitation of our study is a relatively small number of patients. If the results of our study are further confirmed in the ongoing larger imaging clinical study, our laboratory will design a simplified instrument for detecting cervical dysplasia and investigate how effective this approach is in improving the accuracy of cervical dysplasia detection. In developed countries, this simple instrument could be used as an adjunct to colposcopy to reduce the number of unnecessary biopsies. However, the greatest impact of this simple and relatively inexpensive instrument would be on cervical cancer diagnosis in developing countries, where the lack of medical infrastructure precludes cytology-based cervical cancer screening program. In these settings, the common mode of cervical cancer screening is by visual inspection after application of acetic acid (VIA) followed by immediate treatment of suspicious lesions. VIA has a significant false positive rate. The simple spectroscopic instrument could be used as an adjunct to VIA to improve accuracy in the diagnosis of cervical cancer and its precursors. Acknowledgments We thank Chung-Chieh Yu and Jonathan Nazemi for valuable discussions about data modeling. We thank Jonathan Nazemi and Luis Galindo for the engineering assistance, and Victoria Feng for the technical assistance. We finally thank Teresa Darragh and Antonio de las Morenas for their valuable contribution to the pathology evaluation. This research was funded by the National Institutes of Health grant R01 CA097966 and the Laser Biomedical Research Center grant P41 RR02594. #150531 - $15.00 USD (C) 2011 OSA Received 11 Jul 2011; revised 1 Sep 2011; accepted 7 Sep 2011; published 29 Sep 2011 1 October 2011 / Vol. 2, No. 10 / BIOMEDICAL OPTICS EXPRESS 2925


© Copyright 2026