
Measurement of shielding effectiveness
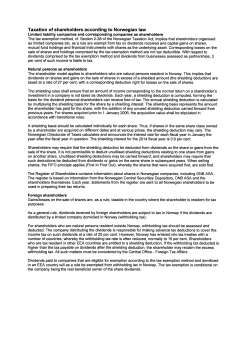
Leszek NOWOSIELSKI, Marian WNUK Military University of Technology, Faculty of Electronics doi:10.15199/48.2015.03.19 Measurement of shielding effectiveness Abstract. The shielding effectiveness (SE) measurement methodology basing on HPEM-RF DS110 pulse generator is described. The shielding effectiveness measurement results for selected enclosure are presented. During the measurement were used the worked out methodology. The obtained measurement results are compared to shielding efficiency measurement results which are obtained using standard measurement methodology basing on the selective measurement receiver and RF signal generator which is used as source of testing signal. Streszczenie. Przedstawiono metodę pomiaru efektywności ekranowania komór ekranujących wykorzystującą generator impulsów wysokoenergetycznych. Przedstawiono poziomy ekranowania otrzymane z pomiarów z wykorzystaniem powyższej metody dla przykładowej obudowy ekranującej. “Pomiar efektywności ekranowania”. Keywords: shielding effectiveness, EMC, electromagnetic compatibility. Słowa kluczowe: efektywność ekranowania, EMC, kompatybilność elektromagnetyczna. Introduction The innovative method of measuring shielding effectiveness of small shielding chambers was described here which was based on using, as probing signal, high power pulses generated by Marx generator with the value of electric field strength over 90 kV/m with maximum duration of single pulse not exceeding 5ns. The elaborated method is characterized by a large range of measurement dynamics and it can be used for measurement of shielding effectiveness of chambers with small overall dimensions below 1.5m x 1.5m x 1.5m. At the present moment the available literature describes the methods of measuring shielding effectiveness of shielding chambers with overall dimensions above 1.5m x 1.5m x 1.5m. In the article completion of measuring position was presented which consists of high power pulse generator and meter of the high power pulse level built on the basis of broad-band oscilloscope and sensor with matching block. Described in the article measuring procedure comes down to conduct of two measurements of the signal level in the function of time at the input of sensor being a part of meter of the high power pulse level. The first measurement is conducted as so called standardization measurement consisting in measuring the probing signal level in the time domain without taking into account the influence of the examined shielding chamber. After conducting standardization measurement basic measurement is made which consists in measuring the probing signal level in the time domain during which measuring sensor is being placed inside the examined shielding chamber. Spectrum of recorded probing pulses is next calculated with the use of Fast Fourier Transform (FFT) and then the difference of levels of particular components of spectrum frequency corresponding with standardization measurement and basic measurement which corresponds with shielding effectiveness is calculated. In the article the measurement results of sample shielding chamber obtained with the use of the described method were presented and they were compared with the measurement results obtained by the other measuring method. Description of the shielding effectiveness method with the use of high power electromagnetic pulse generator One of the most innovative solutions of the problem of increasing measuring dynamic range of shielding effectiveness of small shielding chambers is using, as probing signal, high power pulses generated by Marx generator. As the source of test signal in the designed laboratory stand for measuring shielding effectiveness the high power pulse generator HPEM-RF DS110 was used which is a part of equipment of Electromagnetic Compatibility Laboratory, Faculty of Electronics, Military University of Technology. The shape of test signal generated by the above generator in the time function and its spectrum were presented in Fig. 1 and Fig. 2 respectively. The shape of test signal generated by the above generator in the time function can be described by the equation: (1) b t a t E t E 0 sin 2 f t e e where: E0 - the initial value of electric field source function, a is the discharging coefficient, b – the charging coefficient, – the time constant of the charging source function. This function is the product of a charging function of the form t (2) 1 e and a discharging function of the form (3) E e o t a . The above equations (2) and (3) has physical meaning in that a source of radiant energy charges the medium at the point under consideration, while the energy radiating away from the point under consideration simultaneously discharges the medium. Due to significant levels of spectrum components of test pulse and its coverage in the frequency range it can be used as probing signal in the procedure of measuring shielding effectiveness of small shielding chambers within the frequency range from 10 MHz to 600 MHz. In order to measure shielding effectiveness values of small shielding chambers with the method using high power pulse generator a measuring set is required which includes transmitter of measuring signal and meter of electromagnetic field strength. The transmitter of measuring signal consists of high power pulse generator HPEM-RF DS110 along with transmitting antenna. The set is placed in a portable case of external dimensions not exceeding 550x450x250mm. The task of the generator is to supply pulses with minimum value of electric field strength 90 kV/m with maximum duration of a single pulse not exceeding 5 ns. The effect of its action is obtaining high power pulse at the input of transmitting antenna of the order of several hundred thousand volts for a very short period of PRZEGLĄD ELEKTROTECHNICZNY, ISSN 0033-2097, R. 91 NR 3/2015 81 time. The structure of measuring signal transmitter is shown in Fig. 5. Fig.1. The representation of high power pulse generated by HPEM-RF DS110 generator in time domain for 30 pulses Fig.2. The representation of high power pulse generated by HPEM-RF DS110 generator in frequency domain for 30 pulses a) b) The meter of electromagnetic field strength consists of: operating PC computer, oscilloscope with RF attenuator and sensor with matching block. Sensor with matching unit connected through RF attenuator to oscilloscope with the use of coaxial cable is used for monitoring generated electric field strength. Display of data collected from sensor in the time domain occurs in the oscilloscope. In order to guarantee correct measurement the oscilloscope must be placed in a special shielding casing protecting it from the high generated electric field strength level. Installed software of the operating computer allows, on the basis of high power pulse recorded in the time domain, to determine the frequency spectrum with the use of FFT. The sensors which can be used during shielding effectiveness measurements are presented in Fig. 3. The parameters of the sensors are presented in Table 1. Table 1. The parameters of the sensors AD-70 and AD-80 No Parameter Sensor AD-70 Sensor AD-80 -3 2 -4 2 1. Equivalent area 1 x 10 m 1 x 10 m 2. Freq. resp. > 3.5 GHz > 5.5 GHz 3. Rise time < 0.11 ns < 0.064 ns 4. Maximum output ± 1.5 kV ± 1 kV 5. Output connector SMA (Female) SMA (Female) Measuring shielding efficiency by the method using high power generator amounts to conduct of two measurements of signal level at the input of sensor included in the meter of the high power pulse level. The first measurement is conducted as so called standardization measurement. Block diagram of the position for standardization measurement is presented in Fig. 5. Standardization measurement takes place for a particular value of signal level generated by high power pulse generator. The electric field strength level is measured in the place of installation of sensor along with matching block. Measured values of electric field strength matching particular measuring frequencies are remembered by a computer operating the measuring process. After conducting standardization measurement basic measurement should be carried out during which sensor with matching block is placed in the examined small shielding chamber. Block diagram of the position for basic measurement is shown in Fig. 6. Basic measurement takes place for a particular value of signal level generated by high power pulse generator. The electric field strength level is measured in the place of installation of sensor along with matching unit. Measurements should be conducted in the same way as during standardization measurement. Measured values of electric field strength corresponding with particular measuring frequencies ought to be remembered. After subtracting recorded field strength levels corresponding with particular measuring frequencies, during standardization and basic measurement, we will receive the difference of levels of received signals in [dB], which is the value of shielding effectiveness of the small shielding chamber casing. Measurements of shielding effectiveness should be conducted for ten measuring points inside of the tested casing. The measuring points arrangement inside the shielding chamber are presented in Fig. 4. As the final result of shielding effectiveness measurement should be chosen the calculated shielding effectiveness with the lowest value from the set of ten values corresponding with each measuring point presented in Fig. 4 of the tested casing, for each frequency of test signal. Fig.3. The sensors AD-80 (a) and AD-70 (b) 82 PRZEGLĄD ELEKTROTECHNICZNY, ISSN 0033-2097, R. 91 NR 3/2015 tests of a sample shielding chamber designed in the form of cube being closed by adding one wall were carried out. The shielding chamber has dimensions 1 m x 1 m x 1.45 m and is made of galvanized steel sheet. To connect a sensor assembled for the time of basic measurement, inside the shielding chamber on one of the walls, a special panel providing connection of measuring probe and receiving path was made. On the panel there is also a ventilation panel made in the shape of honey comb. The view of the laboratory stand for shielding effectiveness measurement of sample shielding chamber obtained with the use of high power pulse generator HPEM-RF DS110 is presented in Fig. 7. Fig.4. The measuring points inside the shielding chamber under test Fig.7. Measuring position for measuring shielding effectiveness with the use of high power generator (arrangement of measuring position during standardization measurement) Fig.5. The block diagram of measuring position for standardization measurement Fig.6. The block measurement diagram of measuring position for basic Description of the research object In order to conduct validation of research methodology based on the high power pulse generator described above, Measurement results In order to conduct validation of the designed measuring methodology levels of shielding effectiveness obtained as a result of measurements carried out with the method using high power pulses with measurement results obtained with the use of a different measuring methodology were compared. For comparison a classic measuring methodology was used [1, 2] which uses selective measuring receiver and signal generator as the source of test signal. In Fig. 8 and 9 the frequency spectrum of probing signal respectively for standardization and basic measurement for measurement point No 3 inside of the tested casing with the use of method based on high power pulse generator were presented. In Fig. 10 the final result of shielding effectiveness measurement corresponding with results of shielding effectiveness measurements of the lowest value was presented, from the set of ten values matching each measuring point of the tested casing and for each frequency of test signal. Unfortunately due to physical limitations of measuring potentials used for validation of measuring methods, it is impossible to compare – in the full frequency range – results obtained with the method using high power pulse generator and the method using selective measuring receiver and RF signal generator as the source of test signal. The results of shielding effectiveness measurements shown in Fig. 10 obtained with the method using high power pulse generator (blue colour line) and values of shielding effectiveness obtained with the method using the selective measuring receiver and RF signal generator (green colour line) can be compared only within the range of frequency from 100 MHz to 600 MHz. Limitation of measuring range of suggested method only up to 600 MHz results from the fact that the used for measurements high power pulse generator generates probing signal with large enough spectral concentration up to 600 MHz (Fig. 2). Whereas limitation of measuring range of the method using the selective PRZEGLĄD ELEKTROTECHNICZNY, ISSN 0033-2097, R. 91 NR 3/2015 83 measuring receiver from 100 MHz results from the fact that small shielding chambers (dimensions smaller than 1.5m x 1.5m x 1.5m) do not allow to place in their interior test antennas with dimensions large enough to effectively radiate test signal with frequency smaller than 100 MHz. Fig.8. The representation of high power pulse generated by HPEM-RF DS110 generator in frequency domain for standardization measurement (measurement point No 3) Fig.9. The representation of high power pulse generated by HPEM-RF DS110 generator in frequency domain for basic measurement (measurement point No 3) (4) U 20log 10 1 2 2 2 where: Ϭ1 –the standard deviation of the probing signal level during basing measurement, Ϭ2 –the standard deviation of the probing signal level during standardisation measurement Conclusions The shielding effectiveness values obtained with the use of the method basing on high power pulse generator differs from the values measured with the use of the method using selective measuring receiver and RF signal generator in about 20 dB. The above difference results from a big influence of the difference of measuring probe location during standardization and basic measurement in both measuring methods. Difficulties with location of measuring probes in the same place inside and outside the tested shielding casing result from differences of dimensions of used measuring probes in both measuring procedures. The foregoing has the influence on uncertainty of measurement with both methods, which oscillates around the value 20 dB. The described measuring method basing on high power pulse generator has many advantages and disadvantages such as: 1) Advantages: large dynamics range of shielding effectiveness measurement, large measurement rate in comparison with traditional methods of measuring casing shielding effectiveness, measuring probe dimensions allow to conduct measurements of shielding casings of small overall dimensions (smaller than 1.5m x 1.5m x 1.5m). 2) Disadvantages: the high level of measurement uncertainty which oscillates around the value 20 dB, because of the measurement uncertainty level the measuring method basing on high power pulse generator can be used only in the bandwidth from 150 MHz to 500 MHz, because of high level of probing signal the measurement has to be conducted in anechoic chamber. Acknowledgements The project is financed from NCBiR means within the Agreement No. DOBR-BIO4/016/13071/2013 in the years 2013 – 2015. REFERENCES [1] Przesmycki R., Nowosielski L., Wnuk M., Bugaj M., Small chambers shielding effectiveness measurement. Mediterranean Microwave Symposium (MMS), Hammamet (Tunezja), 2011. [2] Przesmycki R., Nowosielski L., Wnuk M., Bugaj M., The laptop casing shielding effectiveness measurement. Mediterranean Microwave Symposium (MMS), Hammamet (Tunezja), 2011. Fig.10. Final result of shielding effectiveness for the examined shielding casing (blue colour- the results basing on high power pulse generator, red colour- measurement uncertainty for the results basing on high power pulse generator, green colour- the results basing on the method using selective measuring receiver and RF signal generator) Authors: dr inż. Leszek Nowosielski, Wojskowa Akademia Techniczna, ul. Kaliskiego 2, 00-908 Warszawa, E-mail: [email protected], prof. dr hab. inż. Marian Wnuk, Wojskowa Akademia Techniczna, ul. Kaliskiego 2, 00-908 Warszawa, E-mail: [email protected]. Presented in Fig. 10 shielding efficiency uncertainty levels (red colour line) is calculated using the fallowing equation. 84 PRZEGLĄD ELEKTROTECHNICZNY, ISSN 0033-2097, R. 91 NR 3/2015


© Copyright 2026