
NYS Early Childhood Data Report: New York State
NYS Early Childhood Data Report: The Health and Well-Being of New York’s Youngest Children New York State Council on Children and Families NYS Early Childhood Data Report: The Health and Well-Being of New York’s Youngest Children Acknowledgments The NYS Early Childhood Data Report is the product of a multi-year project that involved the attention and efforts of a number of individuals. We would like to acknowledge the significant efforts of Toni Lang, PhD, and Mary DeMasi, PhD, for sharing their knowledge and expertise. In addition, we also wish to thank Mike Medvesky, Anne Radigan, and Pam Sheehan of the Public Health Information Group of the New York State Department of Health for their data contributions and review of the report, and Lorraine Noval, Lillian Denton and Sharon Smith of the Office of Children and Family Services for their contributions to this report. Copyright © 2008 Council on Children and Families NYS Early Childhood Data Report: The Health and Well-Being of New York’s Youngest Children Permission to copy all or portions of this report is granted as long as the Council on Children and Families/ NYS Early Childhood Data Report: The Health and Well-Being of New York’s Youngest Children is acknowledged as the source in any reproduction, quotation, or use. NYS Early Childhood Data Report: The Health and Well-Being of New York’s Youngest Children Author Katrina L. Chamberlain, MS, MPH Early Childhood Comprehensive Systems Project Directors Robert G. Frawley Rachel M. de Long, MD, MPH Director, Policy, Planning and Research and NYS Headstart Collaboration Project Council on Children and Families Director, Bureau of Child and Adolescent Health New York State Department of Health Council on Children and Families C ouncil on C hildren and F amilies 52 Washington Street * West Building, Suite 99 * Rensselaer, NY 12144 * Phone (518) 473-3652 * Website: www.ccf.state.ny.us June 2008 Dear Friends, We are pleased to present the New York State Early Childhood Data Report: The Health and Well-Being of New York's Youngest Children. A product of the State Early Childhood Comprehensive Systems Planning Initiative, this data report has been created to paint a picture of the health and well-being of young children and their families in New York State. Evidence has shown us that the first five years of life are of vital importance in the physical, socialemotional, and cognitive development of children. In order to support program planning and development in this area, it is imperative to establish indicators and collect baseline data from which to measure our progress toward building a foundation for school-readiness and lifelong success. Organized according to the four focus areas of: Healthy Children, Strong Families, Early Learning and Supportive Communities, this data book provides a valuable resource for advocates, academicians, program providers, policymakers, and others interested in the well-being of young children and their families. The Council on Children and Families is committed to improving outcomes for New York State's children and families by providing critical information and facilitating policy development, planning and greater accountability across health, education and human services systems. We shall continue to work with our government and non-government partners at the state and local levels to help ensure that all children in New York State have the opportunity to grow and flourish. Sincerely, Deborah A. Benson David A. Paterson Governor Council Member Agencies State Office for the Aging * Office of Alcoholism and Substance Abuse Services Office of Children and Family Services * Division of Criminal Justice Services State Education Department * Department of Health * Department of Labor * Office of Mental Health Office of Mental Retardation and Developmental Disabilities * Division of Probation and Correctional Alternatives Commission on Quality of Care and Advocacy for Persons with Disabilities * Office of Temporary and Disability Assistance Deborah A. Benson Executive Director Council on Children and Families 52 Washington Street, West Building, Suite 99 Rensselaer, NY 12144 (518) 473-3652 www.ccf.state.ny.us The Council on Children and Families is authorized to coordinate the state health, education and human services systems as a means to provide more effective systems of care for children and families. Established as Chapter 757 of the Laws of 1977 and administratively merged with the New York State Office of Children and Family Services since 2003, the Council’s work remains true to its original intent— to be a neutral body within state government capable of negotiating solutions to interagency issues. The formal Council includes the Commissioners and Directors of the state’s twelve health, education and human services agencies. For 30 years, the Council has spearheaded cross-systems approaches that improve the effectiveness and efficiency of service delivery systems, consider new or emerging service needs, and promote coordinated, rational and consistent policies as a means to improve outcomes for children and families. Council Member Agencies: State Office for the Aging Office of Alcoholism and Substance Abuse Services Office of Children and Family Services Division of Criminal Justice Services State Education Department Department of Health Department of Labor Office of Mental Health Office of Mental Retardation and Developmental Disabilities Division of Probation and Correctional Alternatives Office of Temporary and Disability Assistance Commission on Quality of Care and Advocacy for Persons with Disabilities Mission Statement: The Council is charged with acting as a neutral body to coordinate the State health, education and human service systems to ensure that all children and families in New York State have the opportunity to reach their potential. Please Note: For information on Permissions, Disclaimers, and Acknowledgements, see page 98 Copyright © 2008 Council on Children and Families NYS Early Childhood Data Report: The Health and Well-Being of New York’s Youngest Children Table of Contents Introduction: A State of Change..................................................... vii The Demographics of Young Children in New York State......................... ix Chapter 1: Healthy Children............................................................1 Prenatal Care...............................................................................................................2 Unintended Pregnancy...............................................................................................4 Pregnancy-Related Smoking......................................................................................6 Pregnancy-Related Domestic Violence....................................................................8 Pregnancy-Related Alcohol Consumption.............................................................10 Low Birthweight........................................................................................................12 Infant Mortality.........................................................................................................14 Breastfeeding.............................................................................................................16 Immunization.............................................................................................................18 Child Mortality...........................................................................................................20 Asthma Hospitalizations.......................................................................................... 22 Injury-Related Hospitalizations...............................................................................24 Lead Screening and Poisoning................................................................................ 26 Special Health Care Needs.......................................................................................28 Weight Status............................................................................................................. 30 Oral Health................................................................................................................. 32 Insurance Status........................................................................................................34 Medical Home............................................................................................................36 Parental Mental Health.............................................................................................38 Chapter 1 References...............................................................................................40 Chapter 2: Strong Families........................................................... 45 Poverty.......................................................................................................................46 Family Structure....................................................................................................... 48 iv — NYS Early Childhood Data Report Table of Contents Grandparents as Primary Caregiver.......................................................................50 Adolescent Pregnancy..............................................................................................52 Postpartum Depression............................................................................................54 WIC Program Participation......................................................................................56 Food Insecurity......................................................................................................... 58 Parental Employment...............................................................................................60 Child Care Subsidies.................................................................................................62 Foster Care................................................................................................................ 64 Child Abuse and Maltreatment................................................................................66 Chapter 2 References...............................................................................................68 Chapter 3: Early Learning............................................................ 71 Language Development............................................................................................72 Head Start.................................................................................................................. 74 Prekindergarten........................................................................................................76 Early Intervention.....................................................................................................78 Preschool Special Education...................................................................................80 Parental Role in Early Learning.............................................................................. 82 Chapter 3 References...............................................................................................84 Chapter 4: Supportive Communities................................................ 87 Neighborhood Environment....................................................................................88 Crime Rates...............................................................................................................90 Multiple Risk Factors...............................................................................................92 Chapter 4 References...............................................................................................94 Data Sources Used in This Report.................................................. 95 Directory of Figures................................................................... 98 Permissions, Disclaimer, and Acknowledgments...............................100 NYS Early Childhood Data Report — v Introduction Framework of Priority Cross-Sector Goals and Outcomes NYS Early Childhood Comprehensive Systems Planning Initiative Pregnancies are wanted, healthy, and safe Freedom from preventable injury, illness, and disability Optimal physical, social, emotional, and cognitive development Early recognition and intervention for special needs Enrollment in public or private health insurance programs Access to a ‘medical home’ Adequate and stable employment, income, and basic needs (food, shelter, clothing) Knowledge, skills, confidence, and social supports to nurture the health and well-being of children Parents' special needs are recognized and supported Empowerment to seek, utilize, and actively participate in supportive services Safe and healthy environments free from abuse and neglect Positive, nurturing and consistent relationships Healthy Children Strong Families Early Learning Supportive Communities & Coordinated Systems Positive and consistent attachments to parents, caregivers, and educators Caregivers and other providers have the knowledge, skills, confidence, and social supports to nurture children’s positive development Access to high quality, developmentally-appropriate early care and education Families and caregivers support children's early literacy Parents, caregivers, and educators communicate regularly about children's learning and development Children, families, and other caregivers are supported by peers, workplace, community, and government Families are involved in service planning, delivery, and evaluation at state and local level Community supports and services recognize, respect and reflect strengths of families and cultures Families are aware of and able to access all the services they need Communities provide children and families with healthy environments that support their physical, social, cognitive and emotional needs Programs, policies, and infrastructure support coordinated cross-sector service delivery Health, education, and human service providers have the knowledge and skills needed to promote positive child and family development Child and family needs are anticipated to offer smooth transitions and preventive, developmentally-appropriate services Early childhood services, programs, and policies are based on evidence, theory, and best practices vi — NYS Early Childhood Data Report Introduction A State of Change N ew York has a compelling interest in the development of its youngest citizens. Evidence from both research and practice shows a strong link between early childhood and success in later life. Early experiences—beginning before birth and continuing into the first 5 years of life—are critically important for a child’s physical, social-emotional, and cognitive development. While it has long been known that the early years form a crucial period, an increasing body of research in the neurobiological, behavioral, and social sciences has recently illuminated a basis for understanding this observation. Further, the research suggests that a previous emphasis on birth to age 3 is too brief in defining the critical period for brain development. Scientific evidence instead supports the period beginning at pregnancy and extending through age 5 as the most crucial developmental phase. The research also presents a deeper understanding of the importance of early life experiences in combination with the influences of genetics and environment. Research findings inform policy and program design by elucidating the importance of early relationships, the formation of essential social skills in the earliest years of life, and the ability to increase favorable outcomes through integrated interventions and systems. To support program planning, it is important to establish indicators and collect baseline data. The NYS Early Childhood Data Report: The Health and Well-Being of New York’s Youngest Children aims to equip government and others with the tools for identifying gaps and measuring progress toward building a foundation for school readiness and life-long success for young children and their families. Origin of the Report In 2002, the federal Maternal and Child Health Bureau released a strategic plan that called upon states to convene child-focused agencies and organizations to foster planning of cross-agency early childhood systems. The NYS Early Childhood Data Report is a product of this national effort to recognize and build upon the growing body of persuasive evidence regarding the relationship between early childhood experiences, brain development, long-term developmental outcomes, and school readiness. In New York State, the planning initiative was implemented as a joint project of the state Department of Health and the Council on Children and Families. Together, they assembled representatives from more than 60 organizations, including state agencies, local governments, early care and education programs, health providers, family support service programs, academia, advocacy organizations, and parents, to articulate a vision for young children and their families in New York State. The planning committee began, in a sense, at the end: by defining the outcomes the group hoped to achieve for young children and their families. These outcomes fell into four broad focus areas: Healthy Children, Strong Families, Early Learning, and Supportive Communities. With the desired outcomes identified, the committee developed a set of strategies designed to achieve them. The resulting plan by the New York State Early Childhood Comprehensive Systems Planning Initiative contains 10 objectives and more than 30 strategies. (See facing page for “Framework of Priority Cross-Sector Goals and Outcomes” summarizing graphic.) Purpose of the Report In support of this planning effort, the NYS Early Childhood Data Report has been created to present data on the health and well-being of young children and their families in New York State. We believe this is the most comprehensive set of New York State data on children from birth up to and including age five ever assembled in a single document. The report organizes data according to indicators for each of the four broad focus areas. While NYS Early Childhood Data Report — vii Introduction the primary purpose of the NYS Early Childhood Data Report is to measure progress toward achieving outcomes identified by the NYS Early Childhood Comprehensive Systems Planning Initiative, the data provided will also be useful for advocates, academicians, program providers, policymakers, and others interested in the well-being of young children and their families. This report includes several indicators that were previously unavailable. Our hope is that the NYS Early Childhood Data Report serves as a first step toward building an even more comprehensive set of data for use at the state and local level to support early childhood program and policy development. Comments on Data Availability While serving primarily as a policy and program development tool, this report is also useful as a tool to identify needs for additional data generation. Our original intent was to provide data to measure progress toward achieving each outcome outlined by the planning initiative. It soon became clear, however, that relevant data were unavailable for many of the outcomes. Problems that we have identified include: Data not specific to the birth-to-5 age range. This report attempts to provide data for this age group that are routinely provided for broader age ranges. While more data exists on New York’s children and families than what is presented here, much of it is not age-specific and therefore cannot be analyzed to describe the conditions of children under 6. Examples include the number and percent of young children in families experiencing food insecurity, in female-headed households receiving child support, and enrolled in licensed and registered child care settings. Adequate data indicators not yet established for some outcomes. While some outcomes, such as “Wanted, healthy, safe pregnancies,” have several descriptive indicators (low birth weight, early prenatal care, smoking, alcohol and substance use during pregnancy, etc.), many do not. For outcomes such as “Families have the knowledge, skills, and social supports to nurture the health, safety, and positive development of children,” indicators have yet to be identified or data are not being collected. Data not available at the regional level. Data for several indicators are only reported at the state level, making it impossible to determine variance between New York City and the rest of the state. Given the great degree of variation between these regions in many data sets, this limitation inhibits policymaking and targeting of resources. Examples of statewide-only data include: children under 6 years in subsidized child care by setting, related children under 6 years living below poverty level by family type, and young children’s exposure to multiple risk factors. Data not available at the county level and below. Ideally, the data included in this report would be analyzable for county, community and neighborhood planning and targeting of resources. Unfortunately, most of the data either are viii — NYS Early Childhood Data Report not reported or cannot be broken down to smaller geographic levels. For some health indicators provided by the National Survey of Children’s Health, the sample size is simply too small to report any data below the statewide level. In other cases, data are not available for the birth-to-5 population at levels below regional. Concluding Observations New York State historically has been a national leader in early childhood policy and programming. Many innovative, high-quality resources are already in place to address the needs of children birth to 5 years and their families, reflecting New York’s longstanding commitment to providing a wide array of services and supports to them. Our challenge is to build on this foundation by enhancing communication and collaboration around early childhood issues to support a more comprehensive, coordinated early childhood system. Central to this effort is the development of accurate and timely data to guide us. It is our hope that this data report initiates ongoing discussion of what the core indicators are for tracking outcomes related to the health and well-being of young children, what additional data are needed at all geographic levels to adequately inform policy and program development, how this data should be collected, and what the best vehicles may be for providing and using this data. March 2008 Introduction The Demographics of Young Children in New York State New York State is a large and culturally diverse state, which ranges geographically from the New York City metropolitan area to upstate urban and suburban areas to remote rural communities. Such cultural and geographic diversity makes New York a very rich environment to grow and thrive in; however, such diversity also presents challenges to infrastructure and service delivery. New York is comprised of 62 counties and an estimated population of almost 19 million. Of the 62 counties in New York, New York City consists of five counties that are coextensive with the five New York City boroughs: Bronx borough (Bronx County), Brooklyn borough (Kings County), Manhattan borough (New York County), Queens borough (Queens County), and Staten Island borough (Richmond County). The remaining 57 counties are referred to as Rest of State. In 2005, The majority of the State’s inhabitants resided in the Rest of State area (57.4 percent; n =10,699,192) (Figure 1). Figure 1. Total Population: NYS, NYC and ROS, 2005. (Source: 2005 American Community Survey, 2007) New York State (NYS) New York City (NYC) Rest of State (ROS) 18,655,275 7,956,113 10,699,162 Figure 2. Population of Children Birth to 5 Years: NYS, 2005. (Source: 2005 American Community Survey, 2007) Ages Birth to 5, 8.1% All Other Ages, 91.9% In 2005, 1,503,852 children under the age of 6 were residing in New York State. This number of young children represents 8.1 percent of the State’s entire population (Figure 2). Introduction — ix Introduction What the Data Show Although the overall population is aging (data not shown), the number and percentage of the population that is under 6 has remained relatively stable in recent years and is expected to continue to remain relatively stable during the next decades (Figure 3). Similar to the general population in New York, a somewhat smaller percentage (46.9 percent) of young children live in the five counties of New York City than in the Rest of State counties (53.1 percent) (Figure 4). New York State has virtually the same percentage of girls and boys under age 6. In 2005, just over half of the more than 1.5 million young children were males (50.7 percent; n = 762,698) and just under half were females (49.3 percent; n = 741,154) (Figure 5). Figure 3. Estimated Population of Children Birth to 5 Years: NYS, 2000 to 2030. (Source: U.S. Census Bureau, 2007) Estimate/Projected Age 0-5 Population % of NYS Population 1,500,961 2000 7.9% 2004 1,480,405 7.7% 2005 1,487,354 7.7% 2006 1,493,668 7.7% 2007 1,489,388 7.7% 2008 1,488,162 7.7% 2009 1,489,649 7.7% 1,492,894 2010 7.7% 2015 1,516,085 7.8% 2020 1,515,510 7.7% 1,490,461 2025 1,454,857 2030 Figure 4. Population of Children Birth to 5 Years by Region: NYS, 2005. (Source: 2005 American Community Survey, 2007) New York City, 46.9% x — NYS Early Childhood Data Report Rest of State, 53.1% 7.6% 7.5% Figure 5. Population of Children Birth to 5 Years by Sex: NYS, 2005. (Source: 2005 American Community Survey, 2007) Males, 50.7% Females, 49.3% Introduction What the Data Show Among New York State’s most striking characteristics are the ever-increasing racial, ethnic, and cultural diversity of the population. Across all age groups, New York has high proportions of nonHispanic Black residents, and Hispanic and non-citizen immigrant residents from many countries. Foreign-born persons constitute 20 percent of the New York State population. Over one-fourth of the population over age 5 lives in a home where a language other than English is spoken. Young children (children birth through 5 years of age) are no exception to this. Based on the 2005 American Community Survey categories: 59 percent of young children are White; 18.8 percent are Black or African American; 6.9 percent of young children are Asian; 0.4 percent are Native American; 11.3 percent are indicated as some other race; and 3.4 percent of young children under 6 years of age are two or more races (Figure 6). In addition, 21.5 percent (323,899) of young children are Hispanic or Latino. The number of nonHispanic children under age 6 is approximately 1,179,953, or 78.5 percent of the population of young children (Figure 7). Figure 6. Population of Children Birth to 5 Years by Race: NYS, 2005. (Source: 2005 American Community Survey, 2007) 2 or More Races, 3.4% Native American, 0.4% Asian, 6.9% Some Other Race, 11.3% White Only, 59.0% Black Only, 18.8% Figure 7. Population of Children Birth to 5 Years by Ethnicity: NYS, 2005. (Source: 2005 American Community Survey, 2007) Hispanic or Latino, 21.5% Non-Hispanic, 78.5% Introduction — xi Introduction What the Data Show While the vast majority of young children in New York State are born in the state (Figure 8), the current wave of immigration is apparent when looking at the nativity status of the parents of young children (Figure 9). In fact, in the United States, children of immigrants are the fastest growing segment of the child population. In New York in 2005, only 2 percent of children under 5 years old were foreign-born (Figure 8), whereas 32 percent of parents of young children were foreign-born (Figure 9). The small proportion of foreign-born in this age group reflects that most of the children of foreign-born parents are born in the United States and are, therefore, considered native. Figure 8. Children Under 5 Years by Place of Birth: NYS, 2005. (Source: 2005 American Community Survey, 2007) Figure 9. Children Under 5 Years by Nativity Status of Parents: NYS, 2005. (Source: 2005 American Community Survey, 2007) Native, Born in NYS, 93% Foreign-Born Parents, 32% Native-Born Parents, 68% Foreign-Born, 2% Native, Not Born in NYS, 5% Summary Children under age six may only comprise 8.1 percent of New York’s population; however they also represent one of our state’s most precious resources and the more information that we have about them, the greater our ability to protect, provide for, and promote their positive growth, health, and development. A demographic assessment of the young children’s population in New York State is fundamental to an examination of their well-being. The size, geographic distribution, and demographic characteristics of this population make children more or less likely to experience a variety of events; and thus, these factors have implications for the quality of their lives. Moreover, there are implications for the public and private sectors through the involvement of children in education, substitute child care, health, legal services, and residential care. This brief demographic overview then provides a context for topics that are addressed throughout this data report. xii — NYS Early Childhood Data Report References: 2005 American Community Survey. (2007). Table S0101 Age and Sex. Retrieved October 1, 2007 from http://factfinder. census.gov. (Figure 1). 2005 American Community Survey. (2007). Special Run: Children Ages 0 to 5 Years. American Community Survey: Public Use Microdata Sample files (PUMS). (Figures 2 through 9). U.S. Census Bureau. (2007). Interim State Projections of Population by Single Year of Age: July 1, 2004 to 2030. Population Division. Interim State Population Projections, 2005; File 3. Retrieved June 22, 2007. (Figure 3). Chapter 1: Healthy Children B oth the present and future health of a society are reflected in the health of its children. Fundamental to the overall well being and vitality of not only themselves, but of their families and communities as well, the health of children can have implications that last a lifetime. Health is a comprehensive concept that encompasses prevention and management of illness, injury, and disability; as immunization, early childhood screenings, and well-child visits are efforts used to promote the overall well-being of children as well as sound economic and social investments. The foundation for a healthy childhood begins during and even prior to pregnancy. A woman’s preconception health plays an important role in determining the pregnancy outcome for herself and her baby. After delivery, women must continue to be educated and supported in the practice of healthy behaviors for themselves and their children. Preventive measures such Outcomes: Indicators: Lead Screening and Poisoning Pregnancies are wanted, healthy, and safe Adequate Prenatal Care Special Health Care Needs Unintended Pregnancy Weight Status Pregnancy-Related Smoking Oral Health Pregnancy-Related Domestic Violence Insurance Status promotion of positive healthy behaviors; and optimal development in multiple domains including physical, social, emotional, and cognitive development. Children are free from preventable injury, illness, and disability Children have optimal physical, social, emotional and cognitive development Children receive early recognition and intervention for special needs Children are enrolled in public or private health insurance programs Children’s health, mental health, and oral health services are accessible, continuous, comprehensive, family centered, coordinated, compassionate and culturally effective (medical home). Medical Home Pregnancy-Related Alcohol Consumption Parental Mental Health Low Birthweight Infant Mortality Breastfeeding Immunization Child Mortality Asthma Hospitalizations Injury-related Hospitalizations NYS Early Childhood Data Report — 1 Prenatal Care Why This Is Important Crucial development occurs very early in pregnancy and the earlier prenatal care begins the greater benefit it may provide. Women who begin prenatal care in the first trimester and continue on a regular basis until the birth of the child are less likely to deliver prematurely or to have other serious problems related to pregnancy; they are more likely to have healthier babies (March of Dimes, 2006). Adequate prenatal care allows for early detection, treatment, and management of medical and obstetric conditions, including pregnancy-induced hypertension and diabetes, as well as provides an opportunity to encourage healthy behaviors and educate mothers about potential risks including smoking, drinking, and poor nutrition (Centers for Disease Control and Prevention, 2006). While there are benefits of adequate prenatal care for mother and child, barriers can exist causing women to delay or even forego prenatal care altogether. Financial and health insurance problems are among the most common, and attitudes toward pregnancy, cultural beliefs, and lifestyle factors may also play a role (NCHS, 2002). Adequate: PNC begins by the 4th month and 80-109 percent of expected visits were received; and Obstetricians and Gynecologists (ACOG) recommendations for PNC utilization. For a full-term (40-week) pregnancy with no complications, ACOG recommends 14 visits: every 4 weeks for the first 28 weeks of pregnancy, every 2-3 weeks until 36 weeks, and weekly thereafter (Kotelchuck, 1994). Figures 10 and 11 show the percentage of mothers receiving adequate care. Data Definition The Adequacy of Prenatal Care Utilization (APNCU) Index measures prenatal care utilization (PNC) on two independent and distinctive dimensions: adequacy of initiation of PNC and adequacy of received services (Kotelchuck, 1994). The index uses four categories: Inadequate: PNC begins after the 4th month or under 50 percent of expected visits were received; Intermediate: PNC begins by the 4th month and between 50-79 percent of expected visits were received; Adequate Plus (intensive) Care: PNC begins by the 4th month and 110 percent or more of expected visits were received. (Adequate plus care can indicate the presence of serious medical problems that lead to closer medical followup and more frequent prenatal visits). This index is consistent with the 1985 American College of 2 — NYS Early Childhood Data Report Prenatal Care What the Data Show In 2005, 66.5 percent of mothers between the ages of 15 and 44 years in New York State received adequate prenatal care. This is a slight improvement over the 62.7 percent of women receiving adequate care in 1992 (Figure 10). Between 1992 and 2005, mothers in Rest of State consistently had a higher percentage receiving adequate prenatal care compared to mothers in New York City. However, the gap between the two regions became smaller as New York City showed improvement during this period while Rest of State remained relatively unchanged since 1995 (Figure 10). In 2005, 70.7 percent of White mothers aged 15 to 44 years in New York State received adequate prenatal care compared to 57.9 percent of Hispanic mothers and 53.6 percent of Black mothers receiving adequate prenatal care (Figure 11). While the percentage of adequacy of prenatal care improved for Black and Hispanic mothers between 1992 and 2005, White mothers showed little improvement. Compared to White mothers, the disparities between these groups persisted (Figure 11). Figure 10. Adequate Prenatal Care for Mothers 15 to 44 Years: NYS, NYC and ROS, 1992 to 2005. (Source: NYS Department of Health, 2007) 80% 60% 40% 20% 0% 1992 1993 1994 1995 1996 1997 NYS 1998 1999 2000 2001 NYC 2002 2003 2004 2005 ROS Figure 11. Adequate Prenatal Care for Mothers 15 to 44 Years by Race/Ethnicity: NYS, 1992 to 2005. (Source: NYS Department of Health, 2007) *Note: Total White includes Hispanic White and Non-Hispanic White; Total Black includes Hispanic Black and Non-Hispanic Black. 80% 60% 40% 20% 0% 1992 1993 1994 1995 1996 1997 Total White 1998 1999 Total Black 2000 2001 2002 2003 2004 2005 Hispanic See page 40 for references. Healthy Children — 3 Unintended Pregnancy Why This Is Important A mistimed or unwanted pregnancy can have social, economic, and medical consequences for both mother and infant. When a pregnancy is unintended, it can influence a woman’s behavior throughout her pregnancy as well as after her child is born. It may take weeks or months for women whose pregnancies are unintended to realize or accept that they are pregnant, which can lead to a delay in seeking early prenatal care (in the first trimester). Women with unintended pregnancies are also more likely not to obtain prenatal care at all compared to women with an intended pregnancy (CDC, 2005a, b; Sonfield, 2003). Women who have unintended pregnancies are less likely to adopt healthy behaviors such as quitting smoking, which has been associated with preterm delivery and low birthweight, or consuming adequate amounts of folic acid before and during pregnancy, which acts to reduce the incidence of neural tube defects and promotes healthy development (CDC, 2005a). After delivery, it is less likely that a woman will choose to breastfeed if her pregnancy was unintended (CDC, 2005a). For teenage mothers, the problems associated with an unintended pregnancy are compounded (CDC, 2000). Teenage mothers are less likely to get or stay married, less likely to complete high school or college, and more likely to require public assistance and to live in poverty than their peers that are not mothers. Children of teenage mothers, especially mothers under the age of 15, are more likely to experience low birthweight, neonatal death, and sudden infant death syndrome (The Alan Guttmacher Institute, 1994). Women across race/ethnicity groups, age, and socioeconomic and marital status report unintended pregnancies. However, unintended pregnancies are most common among young women, Black women, women with 12 or fewer years of education, and women whose prenatal care was paid by Medicaid (CDC, 2005a). Data Definition An unintended pregnancy can be categorized as either mistimed (the mother wanted to be pregnant later) or unwanted (the mother did not ever want to be pregnant) at the time of conception (CDC, 2005a, b). PRAMS determines the intent of a pregnancy by asking mothers the following questions: Thinking back to just before you got pregnant, how did you feel about becoming pregnant? (Possible answers included: I wanted to be pregnant sooner, I wanted to be pregnant later, I wanted to be pregnant then, and I did not want to be pregnant then or at any time in the future.) When you got pregnant with your new baby, were you trying to become pregnant? When you got pregnant with your new baby, were you or your husband or partner doing anything 4 — NYS Early Childhood Data Report to keep from getting pregnant (i.e. using various birth control methods)? Figures 12 and 13 present the percentage of mothers whose responses reflected the pregnancy was either mistimed or unwanted. . Unintended Pregnancy What the Data Show In 2005, about one-third of new mothers (33%) responding to the PRAMS survey indicated that their pregnancy was unwanted or mistimed. This is the same percentage of new mothers who indicated that their pregnancy was unintended over a decade earlier in 1993; however it is an improvement from 2000, when the percentage of live births resulting from unintended pregnancies peaked at 38 percent. (Figure 12). Figure 12. Live Births Resulting From Unintended Pregnancies by Race/Ethnicity: NYS Excluding NYC, 1993 to 2005. (Source: Public Health Information Group, 2007) 80% 60% 40% 20% With respect to age, education, and marital status, the groups at highest risk for unintended pregnancy in 2005 were women under the age of 20 (68%); women with less than a high school education (49%); and women who were not married (54%) (Figure 13). 1993 1994 1995 1996 1997 All Women 1998 1999 2000 Black, Non-Hispanic 2001 2002 2003 2004 2005 White, Non-Hispanic Marital Status Figure 13. Live Births Resulting From Unintended Pregnancies by Age, Education and Marital Status: NYS Excluding NYC, 2001 to 2005. (Source: Public Health Information Group, 2007) Other Married > 12 Years Education With respect to race/ethnicity, in 2005 non-Hispanic Black women were at the highest risk for a live birth resulting from unintended pregnancy (56%) (Figure 12). 0% 2005 2003 2001 12 Years 0-11 Years ≥ 35 25 -35 Age In 2005, a difference is seen between the percentage of live births resulting from unintended pregnancies in White, non-Hispanic women (29%) and Black, nonHispanic women (56%). However, the gap may not be as wide as it appears when we take into account variations due to sampling (using a 95% confidence interval, percents range from 25.6 to 33.8 and 42.5 to 68.9, respectively) (Figure 12). 20 -24 < 20 0% 20% 40% 60% 80% See page 40 for references. Healthy Children — 5 Pregnancy-Related Smoking Why This Is Important According to the Centers for Disease Control and Prevention (CDC), smoking during pregnancy is the single most preventable cause of illness and death among mothers and infants and is the most important potentially preventable cause of low birthweight in the United States (CDC, 2005). Smoking while pregnant nearly doubles a woman’s risk of having a low birthweight baby and studies suggest that smoking increases the risk of preterm delivery (CDC, 2004; March of Dimes, 2006). Premature and low birthweight babies face an increased risk of serious health problems, including chronic lifelong disabilities, such as cerebral palsy, mental retardation, and learning problems. In addition, infants of mothers who smoke during pregnancy have a reduced lung function, may have withdrawal-like symptoms similar to illicit drug use, and are up to three times as likely to die from sudden infant death syndrome (SIDS) compared to babies of non-smokers (CDC, 2004; March of Dimes, 2006). Secondhand smoke, also called environmental tobacco smoke (ETS), can have serious health implications during and after pregnancy. Secondhand smoke is a mixture of the smoke given off by the burning end of a cigarette, pipe, or cigar, and the smoke exhaled by the smokers (EPA, 2007). While exposure to secondhand smoke can cause lung cancer in adults who do not smoke, children are particularly vulnerable to its effects because they are still developing physically, have higher breathing rates than adults, and have little control over their indoor environment (EPA, 2007). Secondhand smoke decreases lung efficiency and impairs lung function in children of all ages; it increases the frequency and severity of asthma, and can aggravate sinusitis, rhinitis, cystic fibrosis, and other chronic respiratory problems (AAO-HNS, 2007). In children under two years of age, ETS exposure increases the likelihood of bronchitis and pneumonia, illnesses that often result in hospitalization (AAO-HNS, 2007). In addition, exposure to ETS can increase the number and duration of ear infections, which are the most common cause of children’s hearing loss (AAO-HNS, 2007). Data Definition To determine if a woman smoked prior to, during, and after her pregnancy, as well as the extent to which she smoked, PRAMS posed the following questions: 3 months before you got pregnant, how many cigarettes or packs of cigarettes did you smoke on an average day? (Possible responses included: less than 1 cigarette/day, I didn’t smoke, I don’t know, and an open-ended response for the number of cigarettes or packs of cigarettes smoked per day). This same question was asked for the last three months of the pregnancy and at the present time (after pregnancy). 6 — NYS Early Childhood Data Report Figure 14 presents the percentage of survey respondents who reported smoking any number of cigarettes before, during, or after pregnancy. Pregnancy-Related Smoking What the Data Show Between 1993 and 2005, the percentage of mothers who reported smoking during the three months before they became pregnant decreased from 28 percent in 1993 to 23 percent in 2005 (Figure 14). Figure 14. Smoking Before, During and After Pregnancy: NYS Excluding NYC, 1993 to 2005. (Source: Public Health Information Group, 2007) Between 1993 and 2005, the percentage of mothers who reported smoking during the last three months of their pregnancy also decreased from 20 percent in 1993 to 16 percent in 1999 to 13 percent in 2005 (Figure 14). 30% Between 1993 and 2005, the percentage of mothers who reported smoking after the birth of their child also decreased from 24 percent in 1993 to 18 percent in 2005 (Figure 14). 10% Despite the reduction in the percentage of mothers who smoke during pregnancy compared to mothers who smoked before pregnancy, some mothers return to smoking after the birth of their child. This is observed in all of the years shown. In 2005, the percentage of mothers who smoked before pregnancy (23%) dropped to 13 percent during the last three months of their pregnancy and then increased to 18 percent after the birth of their child (Figure 14). 40% 20% 0% 1993 1995 1997 Smoking 3 Months Before Pregnancy 1999 Smoking Last 3 Months of Pregnancy 2001 2003 2005 Smoking After Pregnancy Note: Depending on the subject matter, self-reported responses can reflect underreporting. See page 40 for references. Healthy Children — 7 Pregnancy-Related Domestic Violence Why This Is Important Domestic violence includes emotional, psychological, physical, or sexually abusive behavior that one person in an intimate partnership uses to control the other (New York State Coalition Against Domestic Violence, 2006). While each of these abusive behaviors is important, this report is focusing on physical abuse only. The consequences of domestic violence are serious and when a pregnant woman is involved these consequences are compounded. A woman abused during pregnancy may be more likely to miscarry, experience preterm labor, deliver a low birthweight baby, experience infections, bleeding, anemia, and other health problems that affect both mother and infant (NYSDOH, 2000). It is estimated that about 50 to 70 percent of men who abuse their female partners also physically abuse their children (Bowker et al., 1988; OPDV, 2003). Even if they are not the direct targets of abuse, children from families in which there is adult domestic violence often suffer negative consequences including health problems, sleeping difficulties, anxiety, acting out, and feelings of fear and powerlessness (Jaffe et al., 1990; NYSDOH, 2000; OPDV, 2003). These children are also at risk for later substance abuse problems, teen pregnancy, homelessness, and suicide and research suggests that boys who grow up in homes where domestic violence is prevalent have an increased risk of perpetrating domestic violence in their own adult intimate relationships (Jaffe et al., 1990; OPDV, 2003). During the 12 months before you got pregnant, did anyone else physically hurt you in any way? (Possible responses included yes or no). Figure 15 presents the percentage of survey respondents who reported physical abuse 12 months before pregnancy or during their most recent pregnancy. Data Definition PRAMS determines physical abuse by asking the following questions: During the 12 months before you got pregnant, did your husband or partner push, hit, slap, kick, choke, or physically hurt you in any other way? (Possible responses include yes or no). These two questions were asked regarding a woman’s most recent pregnancy as well. 8 — NYS Early Childhood Data Report Pregnancy-Related Domestic Violence What the Data Show Between 1996 and 2005, women were slightly less likely to report physical abuse during their most recent pregnancy than during the 12 months prior to becoming pregnant. In 2005, 3 percent of mothers surveyed reported being abused prior to their pregnancy and 3 percent reported physical abuse during their most recent pregnancy (Figure 15). Note: Depending on the subject matter, self-reported responses can reflect underreporting. Figure 15. Women Experiencing Physical Abuse Before and During Pregnancy: NYS Excluding NYC, 1996 to 2005. (Source: Public Health Information Group, 2004 and 2007) 7.5% 5.0% 2.5% 0% 1996 1997 1998 1999 2000 12 Months Before Pregnancy 2001 2002 2003 2004 2005 During Most Recent Pregnancy New York State Domestic Violence Hotlines Adult Domestic Violence 24 hours, 7 days a week English 1-800-942-6906 TTY: 1-800-818-0656 Spanish 1-800-942-6908 TTY: 1-800-780-7660 National Committee to Prevent Child Abuse Prevention information and parent help-line 1-800-342-7472 Office of Children & Family Services To report child abuse 1-800-342-3720 Safehorizon For New York City Residents, 24 hours, 7 days a week 1-800-621-HOPE (4673) If you or your child are in immediate danger, call 911 or your local police department. See page 40 for references. Healthy Children — 9 Pregnancy-Related Alcohol Consumption Why This Is Important There is no known safe amount of alcohol that a woman can drink while she is pregnant and there is no time during pregnancy when it is safe to consume alcohol (CDC, 2004; 2005a). Alcohol passes easily from mother to fetus, and because it is broken down more slowly in a fetus, the blood alcohol level can be much higher than that of the mother and remain so for long periods of time. Such exposure can have lifelong consequences. According to the Centers for Disease Control and Prevention (CDC, 2005b), prenatal exposure to alcohol during pregnancy damages the developing fetus and is a leading preventable cause of birth defects and developmental disabilities. Children exposed to alcohol during fetal development can suffer multiple negative effects ranging from subtle to serious, including physical and cognitive deficits. The birth defects and developmental disabilities that can result from maternal alcohol use during pregnancy are called fetal alcohol spectrum disorders (FASDs). FASDs present themselves in the form of abnormalities in the way a person looks, grows, thinks, and acts, and can manifest as birth defects of the heart, brain, and other major organs (CDC, 2005a). Fetal alcohol syndrome (FAS), a designated FASD, is one of the most common preventable causes of mental retardation (March of Dimes, 2006). In New York State, the FAS prevalence rate determined by the statewide birth defects registry between 1995 and 1998 was 0.28 per 1,000 live births, but would have been 0.37 per 1,000 live births if all children diagnosed before age two were included (Fox & Druschel, 2003). In different areas of the United States FAS prevalence rates range from 0.2 to 1.5 per 1,000 live births (CDC, 2006). Babies with FAS are usually born abnormally small and do not catch up on growth as they age; some organs, such as the heart and brain do not develop properly and they may also exhibit small eyes, a short, upturned nose and small, flat cheeks. In addition to FASDs, consuming alcohol during pregnancy increases the risk of miscarriage, low birthweight, and stillbirth (March of Dimes, 2006). Other prenatal alcohol-related conditions, such as alcohol-related neurodevelopmental disorder (ARND) and alcohol-related birth defects (ARBD), are thought to occur approximately three times as often as FASDs (CDC, 2006). During the last 3 months of pregnancy, how many alcoholic drinks did you have in an average week? (Possible responses are the same as above.) Figure 16 presents the percentage of mothers whose responses reflect alcohol consumption three months prior to pregnancy and alcohol consumption during the last three months of pregnancy. Data Definition PRAMS determines pregnancyrelated alcohol consumption by asking women the following questions: During the 3 months before you got pregnant, how many alcoholic drinks did you have in an average week? (Possible responses were based on a 7point scale that included: I didn’t drink then, less than 1 drink a week, 1 to 3 drinks a week, 4 to 6 drinks a week, 7 to 13 drinks a week, 14 drinks or more a week, and I don’t know.) During the 3 months before you got pregnant, how many times did you drink 5 alcoholic drinks or more in one sitting? (Possible responses include: I didn’t drink then, I don’t know, and an openended response for the number of times.) This question was also asked regarding the last 3 months of pregnancy. 10 — NYS Early Childhood Data Report Pregnancy-Related Alcohol Consumption What the Data Show Between 1993 and 2005, more than half of all mothers surveyed reported drinking alcohol in the three months before they became pregnant. There was a slight decline between 1995 (56%) and 1999 (53%) and a slight increase to 54 percent in 2003 and 2005 (Figure 16). In 2005, fewer mothers in New York State excluding New York City reported alcohol consumption during the last three months of pregnancy compared to 1993 (7% and 10%, respectively) (Figure 16). There is a significant reduction in the number of mothers who reported consuming alcohol in the three months prior to their pregnancy and those that reported drinking alcohol during the last three months of their pregnancy in 1993 through 2005 (Figure 16). Figure 16. Alcohol Consumption of Mothers Three Months Prior to Pregnancy and During Last Three Months of Pregnancy: NYS Excluding NYC, 1993 to 2005. (Source: Public Health Information Group, 2007) 60% 40% 20% 0% 1993 1995 1997 3 Months Prior to Pregnancy 1999 2001 2003 2005 During Last 3 Months of Pregnancy Note: Depending on the subject matter, self-reported responses can reflect underreporting. See page 41 for references. Healthy Children — 11 Low Birthweight Why This Is Important Low birthweight is a major cause of infant mortality. Low birthweight infants are at risk for health problems such as blindness, deafness, mental retardation, mental illness, and cerebral palsy (Alexander, 2004). As the birthweight decreases, children have a greater likelihood of these outcomes, and in general are at increased risk of lifelong health problems (Hack, Klein, & Taylor, Data Definition Infants weighing less than 2,500 grams (5.5 pounds) at birth are considered to be low birthweight. The low birthweight rate is the number of low birthweight births per 100 live births for which a birthweight is known. This rate is presented as a percentage. Figure 18 presents the percentage of low birthweight births by race and ethnicity in New York State between 1991 and 2005. Figure 19 presents the percentage of low birthweight births in singleton and total births in New York State between 1991 and 2005. 1995; March of Dimes, 2006). Ten percent of all health care costs for children can be attributed to low birthweight (Lewit et al., 1995). Low birthweight births are categorized as infants that are born too soon, known as premature, or infants that grow too slowly and are born underweight, known as intrauterine growth retardation (Kotch, 1997). In many cases, the exact cause of low birthweight is unknown, however certain factors such as smoking, poor nutrition, mother’s high blood pressure and other health problems, genetic conditions and environmental hazards have been associated with higher risk for low birthweight (March of Dimes, 2006; NYSDOH, 2006a). Multiple births are also at greater risk of being low birthweight. What the Data Show The percentage of low birthweight births in New York State has remained very consistent over the past ten years. In 2003, 19,972 babies born in New York State weighed less than 2,500 grams (7.9% of all births with a known weight). By 2005, the rate had increased to 8.3 percent (Figure 17). consistently higher in New York City as compared to Rest of State. In New York City, the low birthweight rate declined from 9.2 percent in 1993 to 8.2 percent in 2000. Since 2001, however, the rate either stayed the same or increased slightly. In Rest of State, the rate increased from 6.6 percent in 1995 to 7.3 percent in 2000. The rate declined in 2001 Low birthweight rates have been Figure 17. Low Birthweight Births: NYS, NYC and ROS, 1993 to 2005. (Source: NYS Department of Health, 2007b) 10.0% 7.5% 5.0% 2.5% 0.0% 1993 1994 1995 1996 NYS 12 — NYS Early Childhood Data Report 1997 1998 1999 NYC 2000 2001 2002 ROS 2003 2004 2005 Low Birthweight What the Data Show (cont.) to 7.0 percent but increased again between 2002 and 2005 to 7.7 percent (Figure 17). Between 1991 and 2001 the Black low birthweight rate declined steadily from 13.8 percent to 11.3 percent. In 2002, however, it increased to 12 percent and in 2004; it increased again to 12.6 percent. In 2005 the rate decreased once again to 12.1 percent (Figure 18). Among Hispanics, the low birthweight rate went from 8.3 percent in 1991 to its lowest point of 7.3 percent in 2000. Since 2000, it peaked at 8.1 percent in 2002 and went back down to 7.8 percent in 2005 (Figure 18). Among Whites, unlike the other groups, the low birthweight rate in 2004 was higher than it was in 1991. The rate has increased from about 6.2 percent in the early 1990s to 6.7 percent between 1997 and 2001. In 2002 and 2003 it was 6.8 percent and in 2005 it was 7.2 percent (Figure 18). Multiple births have contributed to the recent change in low birthweight rates. Multiples are much more likely than singleton births to be born having a low birthweight. Between 1991 and 2005, the low birthweight rate for singletons decreased from 6.7 to 6.1 percent in New York State. The percent of low birthweight for total births in New York State, while remaining relatively stable during the 1990s, increased to 8.3 percent in 2005 (Figure 19). The Healthy People 2010 goal for low birthweight is 5 percent. At 8.3 percent, New York State had not yet reached this goal by 2005. Figure 18. Low Birthweight Births by Race/Ethnicity*: NYS, 1991 to 2005. (Source: NYS Department of Health, 2007b) *Note: Total White includes Hispanic White and Non-Hispanic White; Total Black includes Hispanic Black and Non-Hispanic Black. 15% 10% 5% 0% 1991 1992 1993 1994 1995 1996 1997 1998 1999 2000 2001 2002 2003 2004 2005 Total White Total Black Hispanic Figure 19. Low Birthweight Births in Singleton and Total Births: NYS, 1991 to 2005. (Source: NYS Department of Health, 2007b) 9% 6% 3% 0% 1991 1993 1995 1997 Singleton Births 1999 2001 2003 2005 Total Births See page 41 for references. Healthy Children — 13 Infant Mortality Why This Is Important Infant deaths are a significant indicator of the general health and well-being of a population (Kotch, 1997; NYSDOH, 1995). Mortality rates are often used to infer underlying conditions or problems existing within a population that can affect birth outcomes, such as high rates of smoking, substance abuse, poor nutrition, lack of prenatal care, medical problems, and chronic illness (CDC, 2005). Although infant mortality rates have declined over the past decades due to a decrease in infectious diseases, an increase in immunization, improved sanitary conditions, and cost-effective medical treatments, there are still disparities that exist among various racial and ethnic groups in this country and in New York State (CDC, 2005). The recent decline in infant mortality rates can be attributed to improvements in birthweight and gestation-specific infant mortality rates, not to the prevention of preterm or low birthweight births (Allen et al., 2000). Improvements in obstetric and neonatal care, in particular pulmonary surfactants for preterm infants, have contributed to this decline (Allen et al., 2000). According to the CDC (2005), strategies to reduce infant mortality rates include the encouragement of healthy behaviors by pregnant women and parents of infants. For example, the reduction of smoking and substance abuse, poor nutrition, and lack of prenatal care while a woman is pregnant can reduce the likelihood of poor birth outcomes, and educating new parents about protective factors such as placing infants on their backs to sleep can reduce the risk of Sudden Infant Death Syndrome (SIDS), one of the leading causes of infant mortality. Data Definition The five leading causes of infant mortality are calculated using threeyear averages because the number of deaths to children is so low. Using a three-year average improves the reliability of the data where slight variations in the numbers can result in large fluctuations in the annual rates. Figure 21 presents the Infant Mortality Rate by Race and Ethnicity in NYS from 1991 to 2005. (This should be 2nd paragraph under this section) Figure 22 presents the leading causes of death in infants less than one year of age in NYS, NYC and ROS between 2001-2003. Between 1991 and 2005, the infant mortality rate has declined by approximately 37.6 percent in New York State. (Figure 20). Figure 20. Infant Mortality Rate: NYS, NYC and ROS, 1991 to 2005. (Source: NYS Department of Health, 2007) 12 8 Rate per 1,000 Births Infant mortality is the number of deaths to infants under one year of age (CDC, 2005; NYSDOH, 1995). Infant mortality can be further defined by two components: neonatal mortality and post-neonatal mortality. Neonatal mortality is the number of deaths to infants under 28 days of age. Post-neonatal mortality is the number of deaths to infants at 28 days of age, but under one year of age. This report focuses only on the infant mortality rate, which is the number of deaths per 1,000 live births. What the Data Show 4 0 1991 1992 1993 1994 1995 1996 1997 1998 1999 2000 2001 2002 2003 2004 2005 14 — NYS Early Childhood Data Report NYS NYC ROS Infant Mortality What the Data Show (cont.) Between 1991 and 2005, the Black infant mortality rate declined 41 percent (from 15.6 per 1,000 to 9.2 per 1,000), the White infant mortality rate declined 22 percent (from 6.3 per 1,000 to 4.9 per 1,000), and the Hispanic rate declined 18.6 percent (from 5.9 per 1,000 to 4.8 per 1,000) (Figure 21). The infant mortality rate for Hispanic infants has consistently been lower than the rate for Black infants. In contrast, the infant mortality rate for Hispanic infants between 1991 and 2004 was lower than the rate for White infants except in 1993 and 2003 (Figure 21). The Healthy People 2010 goal for infant mortality is 4.5 per 1,000 live births. At 5.8 per 1,000 live births New York State had not yet reached this goal by 2005. In 2001-2003, the leading cause of infant deaths in New York State, New York City, and Rest of State is conditions originating in the perinatal period** (57.5, 59.6, and 55.7 per 1,000, respectively) (Figure 22). In 2001-2003, the second and third leading causes of death in infants under one year of age in New York State, New York City, and Rest of State are congenital anomalies (18.4, 18.3, and 18.5 per 1,000, respectively), and Sudden Infant Death Syndrome, or SIDS (4.1, 3.3, and 4.8 per 1,000, respectively) (Figure 22). Conditions originating in the perinatal period consist of ICD-10 codes P00-P96. Low birthweight (ICD-10 code P07) is included in this category. ** Figure 21. Infant Mortality Rate by Race/Ethnicity*: NYS, 1991 to 2005. (Source: NYS Department of Health, 2007) *Note: Total White includes Hispanic White and Non-Hispanic White; Total Black includes Hispanic Black and Non-Hispanic Black. 16 12 Rate per 1,000 Births In 2001, the infant mortality rate reached 5.7 per 1,000 live births, the lowest New York State rate ever recorded. The rate increased slightly in both 2002 and 2003 (Figure 20). 8 4 0 1991 1992 1993 1994 1995 1996 1997 1998 1999 2000 2001 2002 2003 2004 2005 Total White Total Black Hispanic Figure 22. Leading Causes of Death in Infants Less than One Year of Age: NYS, NYC and ROS, 2001-2003. (Source: Kids’ Well-being Indicators Clearinghouse, 2007) New York State Conditions Originating in the Perinatal Period Congenital Anomalies Sudden Infant Death Syndrome Non-Motor Vehicle Injury Diseases of the Heart 57.5% 18.4% 4.1% 1.6% 1.4% New York City Conditions Originating in the Perinatal Period Congenital Anomalies Sudden Infant Death Syndrome Non-Motor Vehicle Injury Diseases of the Heart 59.6% 18.3% 3.3% 1.3% 1.4% Rest Of State Conditions Originating in the Perinatal Period Congenital Anomalies Sudden Infant Death Syndrome Non-Motor Vehicle Injury Diseases of the Heart 55.7% 18.5% 4.8% 1.9% 1.4% See page 41 for references. Healthy Children — 15 Breastfeeding Why This Is Important Throughout the first year of life, breast milk is the most complete form of nutrition for infants. The American Academy of Pediatricians (AAP) recommends that babies be exclusively breastfed for the first 6 months of life and breastfeeding should be continued for as long as mutually desired by mother and child (AAP, 2005). Exclusive breastfeeding can be defined as an infant’s consumption of human milk with no supplementation of any type, including water, juice, nonhuman milk, and no foods except for vitamins, minerals, and medications (AAP, 2005). According to the National Women’s Health Information Center (NWHIC), a mother’s milk has just the right amount of fat, sugar, water, and protein that is needed for a baby’s optimal growth and development. Breastfeeding provides both immediate and longterm benefits. Breastfed infants experience a decreased incidence of a wide range of infectious diseases (including ear infections, diarrhea, and respiratory illnesses), a decreased rate of sudden infant death syndrome (SIDS), and an increase in cognitive development (AAP, 2005; NWHIC, 2005). Longterm benefits for infants include a reduced risk of obesity, diabetes, and other chronic conditions in later childhood and even into adulthood (AAP, 2005). Breastfeeding mothers also experience short and long-term advantages including decreased postpartum bleeding, an earlier return to pre-pregnancy weight, increased child spacing, and a decreased risk of breast and ovarian cancers (AAP, 2005). In addition to the health benefits, breastfeeding can enrich the emotional bond between mother and infant. The act of breastfeeding increases the amount of physical contact between a mother and her baby, which increases feelings of security and comfort in the baby and confidence and closeness in the mother (NWHIC, 2005). The length of time breastfeeding continues varies for numerous reasons—from feeling that the baby is not satisfied or is having difficulty nursing, to the mother becoming ill, or her husband not wanting her to breastfeed (Bureau of Women’s Health, 2006). One reported reason that such a large percentage of new mothers discontinue breastfeeding is because they return to work shortly after the birth of their child and their work environment does not provide support for breastfeeding. Currently the NYS Family and Medical Leave Act permits employees up to 3 months of unpaid leave. Data Definition Since 1994, the CDC’s National Immunization Program, in partnership with CDC’s National Center for Health Statistics, has conducted an annual National Immunization Survey (NIS) in all 50 states, the District of Columbia, and selected geographic areas within the states. Breastfeeding questions have been asked of all survey respondents selected to participate in the NIS since January of 2003. In 2005, survey respondents were asked the following questions: Was [child’s name] ever breastfed or fed breast milk? How long was [child’s name] breastfed or fed breast milk? How old was [child’s name] when [he/she] was fed something other than breast milk? This includes 16 — NYS Early Childhood Data Report formula, juice, solid foods, cow’s milk, water, sugar water, or anything else. Figures 23 and 24 present the percentage of survey respondents who reported breastfeeding their children ever, at 6 months, 12 months or exclusively at 3 or 6 months. Breastfeeding What the Data Show In New York City, the percentage of mothers reporting exclusive breastfeeding at 6 months increased 22.4 percent between 2003 and 2005 from 16.5 percent to 20.2 percent, respectively. In Rest of State, the percentage decreased between 2004 and 2005 from 14.8 percent to 12.0 percent (Figure 24). The Healthy People 2010 goal for breastfeeding initiation, breastfeeding at 6 months and at 12 months is 75 percent, 50 percent, and 25 percent, respectively. At 75.4 percent for breastfeeding initiation, 42.3 percent at 6 months, and 25.8 percent at 12 months, New York State has reached the goals for breastfeeding initiation and for breastfeeding at 12 months, but had not yet reached the goal for breastfeeding at six months by 2005. Ever Breastfed At 6 Months NYS NYC ROS NYS NYC ROS At 12 Months In 2005, mothers in New York City (20.2%) were more likely to report exclusive breastfeeding at 6 months compared to mothers in Rest of State (12.0%). Exclusive breastfeeding at 6 months is recommended by the American Academy of Pediatrics (Figure 24). NYS NYC 2003 2004 2005 ROS 0% 20% 40% 60% 80% 100% Figure 24. Breastfeeding Exclusivity at 3 and 6 Months: NYS, NYC and ROS, 2003 to 2005. (Source: National Immunization Survey, 2006) Exclusive Breastfeeding at 3 Months In 2005, about one-half of the New York State women reporting ever breastfeeding were still breastfeeding when their babies were 6 months of age (42.3%) (Figure 23). Figure 23. Breastfeeding Initiation and Duration: NYS, NYC and ROS, 2003 to 2005. (Source: National Immunization Survey, 2006) Exclusive Breastfeeding at 6 Months In 2005, 75.4 percent of women in New York State reported ever-breastfeeding. Women in New York City were more likely (82.1%) to report ever breastfeeding as compared to women in Rest of State (69.2%) (Figure 23). NYS NYC ROS NYS NYC 2003 2004 2005 ROS 0% 10% 20% 30% 40% 50% See page 41 for references. Healthy Children — 17 Immunization Why This Is Important Vaccines work to protect infants, children, and adults from illness and death caused by once-common infectious diseases such as polio, measles, and diphtheria (AAP, 2006; CDC, 2000). According to the Institute of Medicine (2001), immunization programs in the United States have resulted in the eradication of smallpox, the elimination of polio, and the control and near elimination of once-common, often debilitating, and potentially life-threatening diseases including measles, mumps, rubella (German measles), diphtheria, pertussis (whooping cough), tetanus, and Haemophilus influenzae type b (Hib). Today there are few visible reminders of the suffering, injuries, and premature deaths caused by the diseases that are prevented with vaccines (NYSDOH, 2006). Even though the number of vaccinepreventable cases is minimal, the agents that cause these diseases do still exist and have the potential to have a costly impact—requiring doctor’s visits, hospitalizations, and premature deaths (CDC, 2000). In New York State, children in day care and school programs must remain current with their immunizations in accordance with the current schedule for immunizations established by the Department of Health (NYS OCFS, 2005). Data Definition The National Immunization Survey (NIS) provides national and state estimates of vaccination coverage of 19 to 35 month old children. In 1994, the first unified childhood immunization schedule was developed through a collaborative process between the American Academy of Pediatrics, the American Academy of Family Physicians, and the Advisory Committee on Immunization Practices, the pharmaceutical manufacturing industry and the Food and Drug Administration (CDC, 1996a). The recommended immunization schedule for children 19 to 35 months of age has since consisted of: 4 or more doses of DPT (diphtheria, tetanus, pertussis), 3 or more doses of polio, 1 or more doses of MMR (measles, mumps, rubella), 3 or more doses of Hib (Haemophilus influenzae), and 3 or more doses of hepatitis B vaccine. This series is referred to as 4:3:1:3:3. In 1996, the childhood schedule was updated to include recommendations for varicella zoster virus vaccine, or chickenpox vaccine (CDC, 1996b). This series is referred to as 4:3:1:3:3:1. Beginning with the 2005 NIS report, the series measure 4:3:1:3:3:1 is used to evaluate progress toward the Healthy People 2010 goal, because, 18 — NYS Early Childhood Data Report beginning with this survey cohort, varicella vaccination will have been recommended for universal administration for five years. Figure 25 presents the percentage of children 19 to 35 months old who were vaccinated with the 4:3:1:3:3 vaccine series in NYS, NYC and ROS between 1998 and 2005. Figure 26 presents the percentage of children 19 to 35 months old who were vaccinated with the 4:3:1:3:3:1 vaccine series in NYS, NYC and ROS between 2002 to 2005. Immunization What the Data Show In New York State, immunization rates with the 4:3:1:3:3 vaccine series for children ages 19-35 months decreased to a low of 72.3 percent in 2000. In 2001, the rates started to increase reaching 82.2 percent in 2004. A slight decrease was seen in 2005 when the immunization rate dropped to 81.6 percent (Figure 25). In 2005, Rest of State had 84.8 percent vaccination coverage with the 4:3:1:3:3 vaccine series, New York City had a lower rate of 78.1 percent. Rest of State had consistently higher rates of vaccination coverage than New York City except in 2002 when New York City had a slightly higher rate than Rest of State (78.1% vs. 77%, respectively) (Figure 25). In 2005, 74.4 percent of children ages 19-35 months in New York State had received the 4:3:1:3:3:1 immunization schedule. In New York City, 70.5 percent of children aged 19-35 months received the recommended vaccines, and in Rest of State, 78.1 percent of children were vaccinated with the 4:3:1:3:3:1 vaccination schedule (Figure 26). The Healthy People 2010 goal for immunization with the 4:3:1:3:3 vaccination series is 80 percent. At 82.2 percent, New York reached this goal in 2004 (Figure 25). The Healthy People 2010 goal for immunization with the 4:3:1:3:3:1 vaccination series is 90 percent. At 74.4 percent, New York State had not yet reached this goal by 2005 (Figure 26). Figure 25. Vaccination Coverage With 4:3:1:3:3 Among Children 19 to 35 Months: NYS, NYC and ROS, 1998 to 2005. (Source: National Immunization Survey, 2007) 100% 75% 50% 25% 0% 1998 1999 2000 2001 NYS 2002 2003 NYC 2004 2005 ROS Figure 26. Vaccination Coverage With 4:3:1:3:3:1 Among Children 19 to 35 Months: NYS, NYC and ROS, 2002 to 2005. (Source: National Immunization Survey, 2007) 80% 60% 40% 20% 0% 2002 2003 NYS 2004 NYC 2005 ROS See page 41 for references. Healthy Children — 19 Child Mortality Why This Is Important As children approach school age, the greatest threats to their lives becomes intentional and unintentional injuries, which at best can only modestly be affected by personal health care (Kotch, 1997). One way to identify threats to the health of children and youth is to examine causes of their death. The leading causes of death can be used as a tool to estimate incidence, and then to target resources and programs to focus on prevention. Infectious diseases that killed children in the past have nearly been eliminated due to widespread and low cost immunization, improved sanitary conditions, and medical treatments (Kotch, 1997). While congenital anomalies (birth defects) and malignant neoplasms Data Definition For the purposes of this report, child mortality is focusing on the total number of deaths to children between 1 and 4 years of age. The child mortality rate, calculated as a three-year average, is the average number of deaths per 100,000 children ages 1 to 4 years. The leading causes of child mortality, also calculated as a three-year average, are presented as the five leading causes of death among (cancerous tumors) are still in the top five causes of death, deaths from natural causes in general have declined. They have been replaced by external causes of death including injuries (motor vehicle and non-motor vehicle), homicide, and legal intervention. What the Data Show children ages 1 to 4 years, and the percentage they represent of all deaths. Figure 27 presents the mortality rate of children 1 to 4 years in NYS, NYC and ROS from 1995 to 2002. Figure 28 presents the leading causes of death for children 1 to 4 years by region and race/ethnicity in NYS in 2002. In 2002, an average 243 children aged 1 to 4 years died per year in New York State. The mortality rate, at 25.1 per 100,000 children aged 1 to 4, was 28 percent lower than the 1995 rate (34.9 per 100,000). Children residing in New York City were responsible for much of the decline (Figure 27). The New York City mortality rate for children aged 1 to 4 was 23.8 per 100,000 in 2002, a 44 percent decline from 1995. In Rest of State, the mortality rate for this age group declined 11 percent between 1995 and 2002 to 26.1 per 100,000 (Figure 27). The Healthy People 2010 goal for deaths of children aged 1 to 4 years is 34.6 per 100,000. At 32.9 per 100,000, New York State reached this goal in 1996 (Figure 27). Non-motor vehicle injury (15.9%) was the leading cause of death for children aged 1 to 4 years in New York State in 2002 (Figure 28). 20 — NYS Early Childhood Data Report Child Mortality What the Data Show (cont.) In 2002, AIDS and AIDS related conditions were no longer in the top five leading causes of death for children ages 1 to 4 years. AIDS and AIDS related conditions had been among the top five leading causes of death up to 1998-2000. In 1994-1996, AIDS and AIDS related conditions were the leading cause of death for Black and Hispanic children aged 1 to 4 years. It was the third leading cause of death among White children in this age group (Not shown in Figure 28). In 2002, homicide and legal intervention was the number one cause of death among Black children aged 1 to 4 years. Among Hispanic and White children in this age group it was the 3rd and 5th leading cause of death, respectively (Figure 28). Non-motor vehicle injury was the leading cause of death for White children aged 1 to 4 years (16.4%), and Hispanic children (18.5%) in 2002. Among Black children aged 1 to 4 years, non-motor vehicle injury accounted for 13.6 percent of deaths and was the 2nd leading cause of death (Figure 28). Figure 27. Mortality Rate of Children 1 to 4 Years: NYS, NYC and ROS, 1995 to 2002. (Source: Kids’ Well-being Indicators Clearinghouse, 2007c) 50 40 Rate per 100,000 In 2002, non-motor vehicle injury was the number one cause of death for children ages 1 to 4 years in New York City and Rest of State as well (14.8 percent and 16.7 percent, respectively) (Figure 28). 30 20 10 0 1995 1996 1997 1998 NYS 1999 NYC 2000 2001 2002 ROS Figure 28. Leading Causes of Death for Children 1 to 4 Years by Region and Race/Ethnicity*: NYS, 2002. (Source: Kids’ Well-being Indicators Clearinghouse, 2007a,b) *Note: Total White includes Hispanic White and Non-Hispanic White; Total Black includes Hispanic Black and Non-Hispanic Black. 20% 15% 10% 5% 0% NYS NYC ROS Motor Vehicle Injury Homicide/Legal Intervention Congenital Anomalies Total White Total Black Hispanic Malignant Neoplasms Non-Motor Vehicle Injury Diseases of the Heart See page 42 for references. Healthy Children — 21 Asthma Hospitalizations Why This Is Important According to the American Lung Association (2006), asthma is one of the most common chronic diseases of childhood. Asthma is an inflammation of the bronchial airways of the lungs which causes the normal function of the airways to be compromised and produces airway obstruction, chest tightness, coughing and wheezing (American Lung Association, 2006). Episodes of asthma are often triggered by some condition or stimulus including exercise, infections (usually respiratory), allergy (to pollen, mold, food, animals), irritants (such as cigarette smoke, air pollution, or aerosol sprays), weather (cold air), and infrequently asthma can be triggered by emotions (American Lung Association, 2006). Although there is no cure for asthma, effective management of the disease is possible by controlling exposure to environmental factors that trigger exacerbations, adequate pharmacological treatment, continual monitoring of the disease and patient (or parent) education (U.S. Department of Health and Human Services, 2000). Without proper control, asthma can become a disruptive disease that may cause unnecessary discomfort Data Definition The asthma hospitalization rate, calculated as a three-year average, is based on the number of hospitalizations for asthma per 10,000 population of children ages birth to 4 years. Figure 29 presents the rate per 10,000 of asthma hospitalizations for children birth to 4 years in NYS, NYC and ROS from 1994 to 2004. 22 — NYS Early Childhood Data Report in children, numerous visits to the emergency department, and missed days of daycare or school. Traditionally, high asthma hospitalization rates have been an indication of problems with access to or utilization of primary health care that provides such management. Thus, the New York Public Health Council has identified access to primary health care as a priority area for public health action (New York State Public Health Council, 1996). Asthma Hospitalizations What the Data Show Children living in New York City are substantially more likely to be hospitalized for asthma than are children living in Rest of State. In 2004, hospitalizations for children ages birth to 4 years were 98.7 per 10,000 compared with 38.9 in Rest of State (Figure 29). The Healthy People 2010 goal for the rate of hospitalizations due to asthma for children under five years is 25.0 per 10,000. At 67.0 per 10,000, New York State had not yet reached this goal by 2004. Figure 29. Asthma Hospitalizations for Children Birth to 4 Years: NYS, NYC and ROS, 1994 to 2004. (Source: Kids’ Well-being Indicators Clearinghouse, 2007) 160 120 Rate per 10,000 Asthma-related hospitalizations have declined in New York State from 87.5 per 10,000 children ages birth to 4 years in 1994 to 67.0 per 10,000 in 2004 (Figure 29). 80 40 0 1994 1995 1996 NYS 1997 1998 1999 NYC 2000 2001 2002 2003 2004 ROS See page 42 for references. Healthy Children — 23 Injury-Related Hospitalizations Why This Is Important According to the NYS Department of Health (NYSDOH,1998) injuries are not random, uncontrollable acts of fate, but rather they occur in highly predictable patterns, with recognizable risk factors, and among identifiable populations. Many of the deaths, disabilities, and disfigurements caused by injuries can be prevented or their severity minimized through proper injury prevention which involves education, enforcement, and proper engineering and technology (NYSDOH, 1998). Injury-related hospitalization can be categorized as intentional and unintentional. related injuries, water safety injuries, and traumatic brain injuries (CDC, 2005). Unintentional injuries are injuries that are not purposely inflicted or intended. This includes injuries resulting from child passenger safety, fireworks-related injury, playground injuries, poisoning, residential fire- Intentional injuries are injuries that are self-inflicted or develop as a result of assault or abuse. Assault / homicide hospitalization for children birth to 5 years is one measure of intentional injuries among young children. Figures 30 and 31 present the rate of hospitalizations due to unintentional injury and assault/homicide for children under 5 years by region and gender in NYS, NYC and ROS between 2001 – 2003. Violence and injuries, whether intentional or unintentional, have a great impact on the health and well-being of children. Injuries that are so serious as to cause hospitalizations may result in temporary or permanent disability. They are among the leading causes of death for children and youth and are one of the most preventable. Data Definition 24 — NYS Early Childhood Data Report Injury-Related Hospitalizations What the Data Show In 2001- 2003, the rate of assault/ homicide hospitalizations was 12.8 per 100,000 children birth to 5 years living in New York. Children living in Rest of State were more likely to be hospitalized due to assault/homicide than their peers in New York City (13.8 per 100,000 children birth to 5 years vs. 11.6 per 100,000 female children birth to 5 years) (Figure 31). In New York City in 2001-2003 male children birth to 5 years were less likely than their female peers to be hospitalized due to assault/homicide (10.9 per 100,000 male children birth to 5 years vs. 12.3 per 100,000 children birth to 5 years) (Figure 31). In Rest of State in 2001-2003, male children birth to 5 years were more likely than their female peers to be hospitalized due to assault/homicide (15.0 per 100,000 male children birth to 5 years vs. 12.5 female children birth to 5 years) (Figure 31). 500 400 Rate Per 100,000 Residents In 2001-2003, male children birth to 5 years were more likely than their female counterparts to be hospitalized for an unintentional injury (363.7 per 100,000 male children birth to 5 years vs. 270.5 per 100,000 female children birth to 5 years) (Figure 30). Figure 30. Unintentional Injury Hospitalizations for Children Birth to 5 Years by Region and Gender: NYS, NYC and ROS, 2001-2003. (Source: Bureau of Injury Prevention, 2006) 300 200 100 0 OverallRate Males NYS NYC Females ROS Figure 31. Assault/Homicide Hospitalizations for Children Birth to 5 Years by Region and Gender: NYS, NYC and ROS, 2001-2003. (Source: Bureau of Injury Prevention, 2006) 15 Rate Per 100,000 Residents In 2001-2003, the rate of unintentional injury hospitalizations was 318.3 per 100,000 children birth to 5 years. Children living in New York City were more likely to be hospitalized for an unintentional injury than their peers in Rest of State (397.3 per 100,000 children birth to 5 years vs. 256.7 per 100,000 children birth to 5 years) (Figure 30). 10 5 0 OverallRate Males NYS NYC Females ROS See page 42 for references. Healthy Children — 25 Lead Screening and Poisoning Why This Is Important According to the Department of Health’s Plan to Eliminate Childhood Lead Poisoning in New York State by 2010, lead is the leading recognized environmental poison for children in New York State (NYSDOH, 2004). Lead is a metal that was used in many materials and products, including paint, food cans, lead-glazed ceramics, china, mini-blinds, radiators, and some inks before their toxicity to young children was known (NYSDOH, 2006). The purpose of screening for blood lead levels is to provide early identification and treatment through coordinated intervention services. Children under age six are at increased risk for lead poisoning because of their fast rate of growth and their tendency to put their hands or other objects into their mouths (CDC, 2006). Lead poisoning often goes unrecognized because it has no obvious symptoms; however, it can affect nearly every system in the body and has been associated with learning disabilities, behavioral problems, and when consumed at very high levels, seizures, coma, and even death (CDC, 2006). line and those living in older houses are at an increased risk (CDC, 2006). While all children can be affected, those living at or below the poverty The New York State Department of Health (2006) suggests that the factors contributing to childhood lead poisoning in the State are complex and interrelated with other social, economic, and legal issues. New York State has the highest proportion of pre-1950’s housing in the nation and the lead paint in this older housing and the contaminated lead dust and soil that it generates are the primary sources of lead exposure in children’s environments (NYSDOH, 2006). blood lead levels at least once by 24 months, by birth year cohort, in NYS excluding NYC between 1998 and 2002. period divided by the number of children tested in that year (includes children’s screening, confirming, and follow-up tests) for blood lead. Prevalence data include the number of children with new or previously confirmed elevated blood lead levels who continue to have their blood lead levels monitored. This measure reflects both current (newly identified) and past (previously identified and ongoing) cases of children with elevated blood lead levels in the population. The incidence rate is the number of children identified for the first time with confirmed elevated blood lead levels (in a specified age range and geographic area) divided by the number of children that had screening tests in that given year. Only children who did not previously have confirmed elevated blood lead levels are included. The prevalence rate is the number of unique children who have confirmed elevated blood lead levels (in a specified age range and geographic area) with tests in a given time Figure 33 presents the prevalence and incidence rates of children under age six who have been identified as having elevated blood lead levels. Data Definition New York State regulations require health care providers to test all children for blood lead levels at or around age one and again at age two for monitoring and early detection of elevated blood lead levels (NYSDOH, 2004). Lead screening involves measuring the lead concentration in the whole body to identify elevated blood lead levels. Blood lead levels of 10 micrograms per deciliter (10 µg/ dL) or greater are considered blood lead poisoning and this level has been recognized as the level of concern and intervention for children aged six years and younger (NYSDOH, 2004). Figure 32 presents the rate of children screened for elevated 26 — NYS Early Childhood Data Report Lead Screening and Poisoning What the Data Show The incidence rate of children in 2005 with blood lead levels of 10 µg/dL or greater was 1.2 percent compared to 2.0 percent five years earlier in 2000 (Figure 33). 75% 50% 25% 0% 1998 1999 2000 2001 2002 Figure 33. Prevalence and Incidence Rates of Children Under 6 Years Identified With Elevated Blood Lead Levels (> 10 µg/dL): NYS Excluding NYC, 2000 to 2005. (Source: Bureau of Child and Adolescent Health, 2007) Prevalence Rate per100 Children Tested The Healthy People 2010 goal regarding lead poisoning is to eliminate elevated blood lead levels in children. 3.5 3.5 3.0 3.0 2.5 2.5 2.0 2.0 1.5 1.5 1.0 1.0 0.5 0.5 Incidence Rate per100 Children Screened The prevalence rate of children tested in 2005 with blood lead levels of 10 µg/dL or greater is reduced by 40 percent compared to the prevalence rate just five years prior in 2000 (1.9% and 3.3%, respectively) (Figure 33). Figure 32. Children Screened for Elevated Blood Lead Levels at Least Once by 24 Months, by Birth Year Cohort: NYS Excluding NYC, 1998 to 2002. (Source: Bureau of Child and Adolescent Health, 2007) Rate Per 100 Children Nearly two-thirds of children (62.2%) born in 2002 received at least one blood lead screen by the age of 24 months (Figure 32). 0 0 2000 2001 2002 Prevalence Rate 2003 2004 Incidence Rate 2005 See page 42 for references. Healthy Children — 27 Special Health Care Needs Why This Is Important Special health care needs affect children differently. Based on his/her need and the severity of that need, a child’s ability to complete everyday tasks and to do things that other children of the same age can do may be hindered (MCHB, 2001b). The prevalence of children with special health care needs (CSHCN) increases with age due to the fact that many children are not diagnosed or are misdiagnosed in the early years. However, early recognition, diagnosis, and proper treatment of special needs has the potential to greatly increase the child’s quality of life. Children with special health care needs are often burdened with additional health, social, emotional, and physical challenges. For example, “children with chronic conditions and disabilities are disproportionately maltreated compared to the general child population” (Kotch, 1997). Chronic illness or disability may generate secondary conditions that contribute to a further reduction in health status, functional capacity, and quality of life (Kotch, 1997). In addition, children with chronic health conditions have twice the risk for maladjustment as children without chronic conditions (Kotch, 1997). Regardless of their condition, CSHCN need a wide range of health services, they may need multiple providers, and they are at risk for poor health outcomes if they have inadequate access or inadequate coordination of needed services (Nyman & Ireys, 2004). Health insurance coverage plays an important role in ensuring that CSHCN have adequate access to care (Davidoff, 2004). When insured, CSHCN are more likely than their counterparts to have a usual source of care and to obtain needed medical care, dental care, mental health services, and prescription medications (Davidoff, 2004). By enabling access and reducing out-of-pocket expenses, the role of health insurance acts as an incentive for eligible CSHCN to enroll in public insurance programs and for parents of ineligible children to seek private coverage (Davidoff, 2004). Regardless of the benefits, ensuring that CSHCN have insurance, and more specifically adequate insurance, still poses a challenge to many families. Data Definition The United State Department of Health and Human Services (DHHS) Maternal and Child Health Bureau defines children with special health care needs (CSHCN) as “those who have or are at increased risk for a chronic physical, developmental, behavioral, or emotional condition and who also require health and related services of a type or amount beyond that required by children generally” (MCHB, 2001c). The CSHCN Screener is a validated screening instrument developed and used by the federal Maternal and Child Health Bureau to identify children with special health care needs. The Screener includes five stem questions on health care needs that could be the consequence of a chronic health condition [Child and Adolescent Health Measurement Initiative (CAHMI), 2005]. If a child currently experiences one of those consequences, follow-up questions determine whether this health care need is the result of a medical, behavioral, or other health condition that has lasted or is expected to last for 12 months or longer (CAHMI, 2005). Children with affirmative responses to the stem and follow-up questions are considered to have special health care needs. 28 — NYS Early Childhood Data Report Adequate insurance, defined by CAHMI, is coverage that offers benefits or covers services that meet CSHCN’s needs, has a reasonable level of uncovered costs, and allows CSHCN to see the health care providers they need. Figure 34 presents the percentage of children with special health care needs by age in NYS in 2003. Figure 35 presents the percentage of children with special health care needs with insurance coverage by type and adequacy in NYS in 2001. Special Health Care Needs What the Data Show In 2003, the percentage of children from birth to age five with a special health care need was 9.1 percent in New York State. The prevalence increased with age: 19.1 percent from ages 6 through 11 and 22.3 percent at ages 12 through 17 (Figure 34). In 2001, 56.7 percent of CSHCN had private insurance only, 27.7 percent had public health insurance only, and 10.8 percent had coverage from both private and public insurance. Nearly 5 percent still remained uninsured. In addition, 17.3 percent were without insurance at some point during the past year, and 30.9 percent were insured with coverage that was not adequate to meet their needs (Figure 35). Figure 34. Children With Special Health Care Needs by Age: NYS, 2003. (Source: Child and Adolescent Health Measurement Initiative, 2005a) 9.1% Age 0-5 19.1% Age 6-11 22.3% Age 12-17 Figure 35. Insurance Coverage of Children With Special Health Care Needs by Type and Adequacy: NYS, 2001. (Source: Child and Adolescent Health Measurement Initiative, 2005b) Private Insurance Only 56.7% Public Insurance Only 27.7% Both Private and Public Insurance Uninsured Without Insurance at Some Point During Past Year Currently Insured With Inadequate Coverage 10.8% 4.8% 17.3% 30.9% See page 42 for references. Healthy Children — 29 Weight Status Why This Is Important The number of obese adults and overweight children in our nation has increased so astonishingly over the past few years that an epidemic has been declared by the New York State Department of Health (NYSDOH, 2004). Of great concern is the fact that while the rate of increase may be slowing in adults, there is no sign that it is slowing in children (NYSDOH, 2004). Being overweight or at-risk for overweight as a child can pose long lasting health threats (ChildTrends, 2005). Children who are overweight or at-risk for overweight are at an increased risk for developing type 2 diabetes, cardiovascular problems, orthopedic abnormalities, gout, arthritis, and skin problems (Gidding et al., 1996). Research suggests that there are periods in life when the risks of developing overweight or obesity are higher due to a child’s biological makeup—the prenatal period, the period in early childhood prior to the adiposity rebound [the age at which BMI increases after its nadir in childhood (Dorosty et al., 2000)] and adolescence (NYSDOH, 2004). While biological factors can predispose children to becoming overweight or atrisk for overweight, parental and family factors, in addition to other environmental exposures, may also be critical in determining weight status (NYSDOH, 2004). Data Definition For preschool-age children, data on weight status for New York State as a whole are only available for children from low-income families enrolled in the Special Supplemental Nutrition Program for Women, Infants, and Children (WIC). All children enrolled in WIC are screened for height and weight upon entry into the program (USDA, 2004). For children, weight categories include: underweight, healthy weight, at-risk for overweight and overweight. Overweight and at-risk for overweight determinations are based upon the 2000 Centers for Disease Control and Prevention gender-specific growth chart percentiles. Body-mass-index (BMI) measurements are calculated from a person’s weight and height and are used as a reliable indicator of overweight and obesity. While the BMI is calculated in the same manner for children and adults, the interpretation of BMI for children is both age- and sex-specific since the amount of body fat changes with age and differs between girls and boys. Children whose BMI-for-age is at or above the 95th percentile are considered overweight, and those whose BMI-for-age falls between the 85th and 95th percentiles are considered at-risk for overweight (CDC, 2005). For example, a three- 30 — NYS Early Childhood Data Report year old boy who is 36 inches tall and weighs 31 pounds has a BMI of 16.8, which places the BMI-for-age at the 74th percentile (CDC, 2007). This child is considered to be at a healthy weight. Figure 36 presents the percentage of children 2 to 4 years in the WIC program who were overweight or atrisk for overweight in NYS between 1989 and 2005. Figure 37 presents the percentage of children 2 to 5 years in the WIC program who were overweight by race and ethnicity in NYS in 2003. Weight Status What the Data Show In 2005, 15.7 percent of the 2 to 4 year-olds participating in the WIC program were overweight. This is down 5 percent from 2004, but still reflects a 28 percent increase since 1989 (Figure 36). In 2005, 16.4 percent of the 2 to 4 year-olds participating in the WIC program were at-risk for overweight. This is down slightly over 2 percent from 2004, but still over a 21 percent increase since 1989 (Figure 36). In 2003, overweight prevalence rates among children ages 2 to 5 years in the WIC program were highest for Hispanic children (21.7%) and lowest for non-Hispanic White children (12.8%) (Figure 37). The Healthy People 2010 Goal for children ages 2 to 5 years who are overweight is 5 percent. At 15.7 percent, New York State had not yet reached this goal by 2005. Figure 36. Children 2 to 4 Years in the WIC* Program Who Are Overweight or At-Risk for Overweight: NYS, 1989 to 2005. (Source: NYS Department of Health, 2006) *Special Supplemental Nutrition Program for Women, Infants and Children (WIC) 20% 15% 10% 5% 0% 1989 1991 1993 1995 1997 At-Risk for Overweight 1999 2001 2003 2005 Overweight Figure 37. Children 2 to 5 Years in WIC Program Who Are Overweight by Race/Ethnicity: NYS, 2003. (Source: NYS Department of Health, 2004) White (Non-Hispanic) Black (Non-Hispanic) Hispanic 12.8% 15.4% 21.7% See page 43 for references. Healthy Children — 31 Oral Health Why This Is Important Oral health is a vital part of the overall health and well-being of children. According to the Centers for Disease Control and Prevention (2007), tooth decay is one of the most common preventable chronic infectious diseases among U.S. children and it can result in pain, dysfunction, underweight, and poor appearance. Good oral health starts before birth. A pregnant woman’s oral health is just as important to her baby as it is for her own well-being. Preliminary studies have shown that there may be an association between periodontal disease, which is a chronic infection of the gums, and preterm birth (delivery before 37 weeks gestation) and low birth weight (NYSDOH, 2006a). Dental decay is an infectious transmissible disease and mothers can pass on decay-causing germs to their babies, therefore improving oral health during pregnancy can also help to prevent early cavities in children (NYSDOH, 2006a). gums. When the child reaches six to eight months of age these teeth will start to erupt and come into the mouth. By age three, all 20 primary teeth should be in the mouth, and although these teeth eventually fall out, they are very important in a child’s ability to eat, speak, and hold space for permanent teeth (NYSDOH, 2006b). Babies are born with their primary teeth already formed beneath their Data Definition The National Survey of Children’s Health included oral health questions. The following question was asked to generate the data shown above: How would you describe the condition of (child’s name)’s teeth: excellent, very good, good, fair, or poor? 32 — NYS Early Childhood Data Report Figure 38 presents survey respondents’ report of the overall condition of their children’s teeth as poor, fair, good, very good, or excellent. Oral Health What the Data Show In New York State in 2003, over 80 percent of children ages 1 to 4 years had teeth whose overall condition was rated as very good or excellent, 13.2 percent had teeth in good condition, and 5.4 percent of children ages 1 to 4 years had teeth in fair or poor condition (Figure 38). Figure 38. Overall Condition of Teeth in Children 1 to 4 Years: NYS, 2003. (Source: Child and Adolescent Health Measurement Initiative, 2005) Poor, 1.9% Fair, 3.5% Good, 13.2% Excellent, 57.4% Very Good, 24.0% See page 43 for references. Healthy Children — 33 Insurance Status Why This Is Important Whether it is publicly or privately sponsored, health insurance has been found to be positively associated with children’s use of health services (Kaiser Family Foundation, 2006; Lewit, Bennett & Behrman, 2003). By reducing out of pocket expenses and cushioning families from the economic hardship that can follow illness or injury, health insurance not only facilitates greater access to health care services for acute and chronic illness, as well as preventive care, but can also reduce stress for parents and thus improve a family’s quality of life (Lewit, et al., 2003). Compared to their uninsured peers, insured children are more likely to have a regular source of medical care, to receive health care when they need it, to visit their health practitioners more often, and to have fewer unmet health care needs (Lewit et al., 2003). A lack of insurance ultimately compromises a person’s health because they are less likely to receive preventive care, are more likely to be hospitalized for avoidable health problems, and are more likely to be diagnosed in the late stages of disease (Kaiser Family Foundation, 2006). The high cost of coverage is one of the most prominent reasons many families do not have insurance (Kaiser Family Foundation, 2006). Although many low-income children (children in families with incomes below 200% of the federal poverty level) have access to employerbased insurance programs through their parents, many parents cannot afford the premiums to cover the whole family (Lewit et al., 2003). Other children may not have insurance because their parents work in low-paying jobs that do not offer health coverage and these parents cannot afford to purchase insurance on their own (Lewit et al., 2003). In these circumstances, public coverage such as Medicaid and Child Health Plus plays a critical role. Data Definition The National Survey of Children’s Health included questions regarding the type and coverage level of health insurance. The following questions were asked to generate the data shown: What type of health insurance coverage, if any, did children/youth (ages 0-5) have at the time of the survey? How many children/youth (ages 0-5) had consistent health insurance coverage during the past 12 months? Private health insurance, as defined by the U.S. Census Bureau (2005), is coverage by a health plan provided through an employer or union or purchased by an individual from a private health insurance company. Public health insurance includes plans funded by governments at the federal, state, or local level. The major categories of public insurance are Medicare, Medicaid, the State Children’s Health Insurance Program (S-CHIP), military health care, state plans, and the Indian Health Service. New York has two health insurance programs for children: Medicaid and Child Health Plus. These programs provide comprehensive health insurance for a wide range of children’s health care and dental needs (The City of New York, 2007). Depending on a family’s income level, if children are under the age of 19 and are residents of New York State they may be eligible for either Child Health Plus A (formerly called Children’s Medicaid) or Child Health Plus B. Each of these programs is available through numerous providers throughout the state and provides services such as well-child care visits, immunizations, emergency care, dental care, speech and hearing, and Hospice in addition to many other benefits (NYSDOH, 2005b). 34 — NYS Early Childhood Data Report Medicaid (now called Child Health Plus A) is the major federal and state program that finances health care and increases access to services for low-income populations, in particular children and pregnant women (NYCDOHMH, 2006). Child Health Plus B provides low or no-cost insurance for children under the age of 19 who are not eligible for Child Health Plus A. For the purpose of the National Survey of Children’s Health, private health insurance is defined as any type of health insurance, including HMO’s, other than public programs and public health insurance is defined as Medicaid or S-CHIP (which is New York’s Child Health Plus Program) (Child and Adolescent Health Measurement Initiative, 2005a). Figure 39 presents the insurance status of children birth to 5 years by type and coverage level in NYS in 2003. Insurance Status What the Data Show In 2003, 58.2 percent of children birth to 5 years had private insurance, 38.3 percent had public insurance, and 3.5 percent were uninsured at the time of the survey. Nearly 89 percent of children aged 0 to 5 years had insurance coverage all year while 11.4 percent were currently uninsured or had periods of no coverage during the past year (Figure 39). Figure 39. Insurance Status of Children Birth to 5 Years by Type and Coverage Level: NYS, 2003. (Source: Child and Adolescent Health Measurement Initiative, 2005a) Private Insurance 58.2% Public Insurance Uninsured* 38.3% 3.5% Full-Year Insurance Coverage Currently Uninsured or Gaps in Past Year 88.6% 11.4% *Fewer than 50 respondents selected this option in the survey. Use caution interpreting this data. See page 43 for references. Healthy Children — 35 Medical Home Why This Is Important A medical home is a partnership between the medical profession and the children and families that it serves. The overall goal of this partnership is to improve health outcomes and quality of life. Building on a foundation of high quality, comprehensive primary care—including preventive health services, screening and health promotion, and management of acute and chronic medical conditions—a medical home can serve as a hub for a broad range of needed supports and services for children and families. This function is especially important for children with special health care needs—those children who have a chronic physical, developmental, behavioral, or emotional condition, and who require health care and other related services more than other children. Data Definition A medical home is not a physical structure, but rather an approach to providing accessible, continuous, comprehensive, family-centered, coordinated, compassionate, and culturally effective primary care to children (American Academy of Pediatrics, 2007). The full, operational definition of the term, proposed by the American Academy of Pediatrics in 1992 is: “The medical care of infants, children and adolescents ideally should be accessible, continuous, comprehensive, family centered, coordinated, compassionate, and culturally effective. It should be delivered or directed by well-trained physicians who provide primary care and help to manage and facilitate essentially all aspects of pediatric care. The physician should be known to the child and family and should be able to develop a partnership of mutual responsibility and trust with them. These characteristics define the ‘medical home.’ In contrast to care provided in a medical home, care provided through emergency departments, walk-in clinics, and other urgent-care facilities, though sometimes necessary, is more costly and often less effective.” –American Academy of Pediatrics, 2002 The National Survey of Children’s Health included questions regarding a medical home. The following 36 — NYS Early Childhood Data Report question was asked to generate the data shown above: How many children receive health care that meets the American Academy of Pediatrics definition of medical home? Figure 40 presents the percentage of children birth to 3 years and birth to 5 years who have a primary care provider and who consistently received all needed care, including one or more preventive health care visits during the past 12 months. Medical Home What the Data Show In 2003, 64.2 percent of New York State children birth to 3 years had a medical home. This number was slightly less for children birth to 5 years (62.1%) (Figure 40). Figure 40. Children Birth to 5 Years Receiving Health Care Within a Medical Home: NYS, 2003. (Source: Child and Adolescent Health Measurement Initiative, 2005) Have a Medical Home Age 0-3 Age 0-5 64.2% 62.1% See page 44 for references. Healthy Children — 37 Parental Mental Health Why This Is Important Early childhood mental health is the social, emotional, and behavioral well-being of children birth through age five and their families. Good mental health includes developing the capacity to: experience, regulate and express emotion; form close, secure relationships; and, explore the environment and learn. The mental health of young children is greatly affected by the mental health status of their parents. The quality of adult relationships in a child’s life and a child’s caregiving environment are two of the most influential factors in determining a child’s mental health. Depression among young mothers has been shown to influence the mental health of their young children. Conditions like maternal depression, anxiety disorders, bipolar disorders, alcoholism, etc., can result in parents being less able to provide stimulation and parent-child relationships that are developmentally appropriate. Further, infants of mothers who are clinically depressed often withdraw, and this can affect their language, physical and cognitive development. Older children whose mothers are depressed demonstrate poor self-control, aggression, poor peer relationships and school difficulties. While research has been plentiful when it comes to maternal mental health, paternal mental health is equally as important. In a 2004 national longitudinal survey, it was found that a father in good mental health may buffer the influence of a mother’s poorer mental health on a child’s behavioral and emotional problems and that these problems seem to be the most severe for children who have two parents with poor mental health (Kahn, Brandt & Whitaker, 2004). These questions were asked only if a biological, step, foster, or adoptive parent lived in the same household with the child. If the respondent was the child’s mother (biological, step, foster, adoptive), she rated her own mental and emotional health status. Respondents who were not the child’s mother (e.g. father or other relative) gave a proxy rating of the mother’s mental and emotional health. If the respondent was the child’s father, he would rate his own emotional health status, and if the respondent was not the child’s father a proxy rating was given by the child’s mother or other relative. Data Definition The National Survey of Children’s Health included questions about parental mental health. The following questions were asked to generate the figures shown: Would you say that in general (child’s mother’s) mental and emotional health is excellent, very good, good, fair, or poor? Would you say that in general (child’s father’s) mental and emotional health is excellent, very good, good, fair, or poor? 38 — NYS Early Childhood Data Report Figures 41 and 42 present the percentage of children birth to 5 years living with mothers or fathers whose mental health status was reported as excellent, very good, good, fair, or poor. Parental Mental Health What the Data Show In New York State in 2003, over 75 percent of children birth to 5 years were living with mothers whose mental health status was very good (34.7%) or excellent (41.2%). Just over 5 percent of children birth to 5 years were living with mother whose mental health status was fair (4.9%) or poor (0.7%) (Figure 41). In New York State in 2003, 79 percent of children birth to 5 years were living with fathers whose mental health status was very good (31.2%) or excellent (47.8%). Fair or poor mental health status was reported in 4 percent of fathers (Figure 42). Figure 41. Children Birth to 5 Years Living With Mothers With Excellent to Poor Mental Health: NYS, 2003. (Source: Child and Adolescent Health Measurement Initiative, 2005) Poor, 0.7% Fair, 4.9% Good, 18.5% Excellent, 41.2% Very Good, 34.7% Figure 42. Children Birth to 5 Years Living With Fathers With Excellent to Poor Mental Health: NYS, 2003. (Source: Child and Adolescent Health Measurement Initiative, 2005) Poor, 0.3% Fair, 3.7% Good, 17.0% Excellent, 47.8% Very Good, 31.2% See page 44 for references. Healthy Children — 39 Chapter 1 References Prenatal Care, pages 2-3 Centers for Disease Control and Prevention (CDC). (2006). 2002 PRAMS Surveillance Report: Multistate Exhibits Prenatal Care Timing and Adequacy. Retrieved March 20, 2007 from www.cdc. gov/PRAMS/2002PRAMSSurvRepor/MultiStateExhibits/Multistates3.htm. Kotelchuck, M. (1994). Overview of Adequacy of Prenatal Care Utilization Index. Retrieved February 28, 2007 from www.mchlibrary. info/databases/HSNRCPDFs/Overview_APCUindex.pdf. March of Dimes Birth Defects Foundation. (2006). Prenatal Care. Retrieved January 25, 2006 from www.marchofdimes.com. National Center for Health Statistics (NCHS). (2002). Health, United States, 2002: With Chartbook on Trends in the Health of Americans. Hyattsville, Maryland: U.S. Government Printing Office. New York State Department of Health (NYSDOH); Center for Community Health, Division of Family Health. (2007). New York State Maternal and Child Health Services Title V Block Grant Program: 2008 Application/2006 Annual Report. Author: Albany, NY. Unintended Pregnancy, pages 4-5 Brown, S.S., & Eisenberg, L. (Eds.). (1995). The Best Intentions: Unintended Pregnancy and the Well-Being of Children and Families. Washington, DC: National Academy Press. Centers for Disease Control and Prevention (CDC). (2005a). PRAMS and Unintended Pregnancy. Retrieved February 21, 2006 from www.cdc.gov/PRAMS/PDFs/PRAMSUnintendPreg.pdf. Centers for Disease Control and Prevention (CDC). (2004). The Health Consequences of Smoking: A Report of the Surgeon General. Impact on Unborn Babies, Infants, Children and Adolescents. Retrieved January 25, 2006 from www.cdc.gov/tobacco/sgr. CDC. (2005). Maternal and Infant Health: Smoking During Pregnancy. Retrieved January 25, 2006 from www.cdc.gov/reproductivehealth/MaternalInfantHealth/. Environmental Protection Agency (EPA). (2007). Smoke Free Homes Program: Health Effects of Exposure to Secondhand Smoke. Retrieved March 7, 2007 from www.epa.gov/smokefree/healtheffects.html. March of Dimes Birth Defects Foundation. (2006). Professionals and Researchers: Smoking during Pregnancy. Retrieved January 25, 2006 from www.marchofdimes.com. NYSDOH. (2005). New York State PRAMS. Retrieved January 25, 2006 from www.health.state.ny.us. Public Health Information Group. (2007). Unpublished PRAMS Data: Smoking 3 Months Prior, During Last 3 Months, and After Pregnancy. New York State Department of Health, Center for Community Health. Pregnancy-Related Domestic Violence, pages 8-9 Bowker, L.H., Arbitell, M., & McFerron, J.R. (1988). On the Relationship Between Wife Beating and Child Abuse. In K. Yllo and M. Bograd (Eds.), Perspectives on Wife Abuse. Newbury Park, CA: Sage. CDC. (2005b). Unintended and Teen Pregnancy Prevention. Retrieved February 21, 2006 from www.cdc.gov/reproductivehealth/UnintendedPregnancy. Centers for Disease Control and Prevention (CDC). (2006). National Center for Injury Prevention and Control: Intimate Partner Violence: Fact Sheet. Retrieved February 16, 2006 from www.cdc. gov/ncipc. Piccinino, L.J. (1994). Unintended pregnancy and childbearing. Reproductive health of women. In: L.S. Wilcox, & Jaffe, P.G., Wolfe, D.A., & Wilson, S.K. (1990). Children of Battered Women. Newbury Park, CA: Sage. Piccinino, L.J., & Mosher, W.D. (1998).Trends in contraceptive use in the United States: 1982–1995. Family Planning Perspectives 30(1):4-10, 46. New York State Department of Health (NYSDOH). (2000). Are you and your baby safe? Retrieved February 16, 2006 from www.health. state.ny.us/nysdoh/baby. Public Health Information Group. (2007). Unpublished PRAMS Data: Unintended Pregnancies. New York State Department of Health, Center for Community Health. Office for the Prevention of Domestic Violence (OPDV). (2003). What is Domestic Violence?; Domestic Violence Data Sheet; and Some facts about Domestic Violence. Retrieved February 13, 2006 from www.opdv.state.ny.us. Sonfield, A. (2003). Preventing Unintended Pregnancy: The Need and Means. The Guttmacher Report on Public Policy, 6 (5). Retrieved March 6, 2007 from http://www.guttmacher.org/pubs/tgr/06/5/ gr060507.html. The Alan Guttmacher Institute. (1994). Sex and America’s Teenagers. New York, NY: The Institute. Pregnancy-Related Smoking, pages 6-7 American Academy of Otolaryngology—Head and Neck Surgery (AAO-HNS). (2007). Children and Secondhand Smoke. Retrieved March 7, 2007 from www.entnet.org/healthinfo/tobacco/secondhand_smoke.cfm. 40 — NYS Early Childhood Data Report Public Health Information Group. (2004). PRAMS Pregnancy Risk Assessment Monitoring System. 1996-1999 Surveillance Report: A Survey of the Health of Mother and Babies in Upstate New York. Vol. 2. New York State Department of Health; Center for Community Health. Author: Albany, NY. Public Health Information Group. (2007). Unpublished New York State PRAMS Data: Domestic Violence Before and During Pregnancy. New York State Department of Health, Center for Community Health. New York State Coalition Against Domestic Violence. (2006). Domestic Violence: What is Domestic Violence? Retrieved February 13, 2006 from www.nyscadv.org/domesticviolence.htm. Chapter 1 References Pregnancy-Related Alcohol Consumption, pages 10-11 Infant Mortality, pages 14-15 Centers for Disease Control and Prevention (CDC). (2004). Alcohol consumption among women who are pregnant or who might become pregnant – United States, 2002. MMWR Weekly, 53(50), 1178-1181. Retrieved January 26, 2006 from www.cdc. gov/mmwr. Allen, M.C., Alexander, G.R., Tompkins, M.E., and Hulsey, T.C. (2000). Racial differences in temporal changes in newborn viability and survival by gestational age. Paediatr Perinat Epidemiol 14:152-8. CDC. (2005a). Alcohol Use and Pregnancy: U.S. Surgeon General’s Report. Retrieved January 26, 2006 from www.cdc.gov. CDC. (2005b). Guidelines for Identifying and Referring Persons with Fetal Alcohol Syndrome. MMWR Recommendations and Reports, 54(RR11); 1-10. Retrieved March 6, 2007 from www.cdc.gov/ mmwr/preview/mmwrhtml/rr5411a1.htm. CDC. (2006). Fetal Alcohol Spectrum Disorders: Tracking Fetal Alcohol Syndrome. Retrieved July 19, 2007 from www.cdc.gov/ncbddd/ fas/fassurv.htm. Fox, D.J. & Druschel, C.M. (2003). Estimating prevalence of fetal alcohol syndrome (FAS): Effectiveness of a passive birth defects registry system. Birth Defects Res A Clin Mol Teratol, 67(9), 604-608. March of Dimes Birth Defects Foundation. (2006). Professionals and Researchers: Drinking Alcohol during Pregnancy. Retrieved January 26, 2006 from www.marchofdimes.com/professionals. Public Health Information Group. (2007). Unpublished New York State PRAMS Data: Drinking Before and During Pregnancy. New York State Department of Health, Center for Community Health. Low Birthweight, pages 12-13 Alexander, M.D. (2004). Child Health: Birth Outcomes and Infant Mortality. Bethesda, MD: National Institutes of Health. Hack, M., Klein, N., and Taylor, H. (1995). Long-Term Developmental Outcomes of Low Birthweight Infants. The Future of Children. 5(1): 176-196. Kotch, J.B. (1997). Maternal and Child Health: Programs, Problems, and Policy in Public Health. Gaithersburg, MD: Aspen Publishers, Inc. Lewit, E., Baker, L., and Shiono, P. (1995). The Direct Cost of Low Birthweight. The Future of Children. 5(1): 35-36. March of Dimes Birth Defects Foundation, (2006). Low Birthweight. Retrieved January 24, 2006 from www.marchofdimes.com. National Center for Health Statistics (NCHS). (2002). Health, United States, 2002: With Chartbook on Trends in the Health of Americans. Hyattsville, Maryland: U.S. Government Printing Office. New York State Department of Health (NYSDOH). (2006a). Healthy Pregnancy Fact Sheet. Retrieved January 24, 2006 from http:// www.health.state.ny.us./community/pregnancy/health_care/ healthy_pregnancy_fact_sheet.htm. New York State Department of Health (NYSDOH); Center for Community Health, Division of Family Health. (2007b). New York State Maternal and Child Health Services Title V Block Grant Program: 2008 Application / 2006 Annual Report. Author: Albany, NY. Centers for Disease Control and Prevention (CDC). (2005). Office of Minority Health: Eliminate Disparities in Infant Mortality. Retrieved March 15, 2006 from www.cdc.gov/omh/AMH/factsheets/infant. htm. Kotch, J.B. (1997). Maternal and Child Health: Programs, Problems, and Policy in Public Health. Gaithersburg, MD: Aspen Publishers, Inc. New York State Department of Health (NYSDOH) (1995). Maternal, Child and Adolescent Health Profile (MCAHP): New York State 1992. Albany, NY. New York State Department of Health (NYSDOH); Center for Community Health, Division of Family Health. (2007). New York State Maternal and Child Health Services Title V Block Grant Program: 2008 Application / 2006 Annual Report. Author: Albany, NY. Breastfeading, pages 16-17 American Academy of Pediatrics (AAP). (2005). Policy Statement: Breastfeeding and the use of human milk. Pediatrics, 115(2), 496-506. Bureau of Women’s Health. (2006). Unpublished New York State PRAMS data. New York State Department of Health; Albany, NY. National Immunization Survey (NIS). (2006). Breastfeeding Data and Statistics: Breastfeeding Practices – Results from the 2003, 2004 and 2005 National Immunization Surveys. Table 2: Geographicspecific breastfeeding rates. Centers for Disease Control and Prevention (CDC). Retrieved March 27, 2007 from www.cdc. gov/breastfeeding/data/NIS_data/Data_2003.htm. National Women’s Health Information Center (NWHIC). (2005). Benefits of Breastfeeding. U .S. Department of Health and Human Services, Office On Women’s Health. Retrieved March 30, 2007 from www.4woman.gov/Breastfeeding/index.cfm?page=227. New York State Department of Health (NYSDOH); Center for Community Health, Division of Family Health. (2006). New York State Maternal and Child Health Services Title V Block Grant Program: 2007 Application/2005 Annual Report. Author: Albany, NY Immunization, pages 18-19 American Academy of Pediatrics (AAP). (2006). Childhood Immunization Support Program: Immunization Initiatives - Importance of Immunization. Retrieved March 21, 2006 from www.cispimmunize.org/fam. Centers for Disease Control and Prevention (CDC). (2000). Healthy People 2010 Objective 14: Immunization and Infectious Diseases. Retrieved March 22, 2006 from www.healthypeople.gov/document/pdf/volume1/immunization.pdf. CDC. (2000). The Importance of Childhood Immunizations. Retrieved March 21, 2006 from www.chc.gov/nip/publications/fs/gen/importance.htm. Healthy Children — 41 Chapter 1 References CDC. (1996) a. MMWR Weekly: Notice to Readers Recommended Childhood Immunization Schedule – United States, January-June 1996. 45(29); 635-638. Retrieved May 8, 2007 from www.cdc. gov/mmwr/preview/mmwrhtml/00043189.htm. CDC. (1996) b. MMWR Weekly: Notice to Readers Recommended Childhood Immunization Schedule – United States, July – December 1996. 44(51&52); 940-3. Retrieved May 8, 2007 from www.cdc.gov/mmwr/preview/mmwrhtml/00039897.htm. Institute of Medicine. (2001). Immunization Safety Review: MeaslesMumps-Rubella Vaccine and Autism. Washington, DC: National Academy Press. National Immunization Survey (NIS). (2004). In MMWR: National, State, and Urban area vaccination coverage among children aged 19 – 35 months United States, 2004 (July 25, 2005) 54(29); 717-721. Retrieved October 27, 2005 from http://www.cdc. gov/mmwr/preview/mmwrhtml/mm5429a1.htm. National Immunization Survey (NIS). (2007). Data obtained from: Immunization Coverage in the U.S., NIS Data Tables. Retrieved April 13, 2007 from http://www.cdc.gov/nip/coverage/default.htm. New York State Department of Health (NYSDOH). (2006). Life Span Immunization Schedule. Retrieved from www.health.state.ny.us/ prevention/immunization on March 21, 2006. New York State Department of Health (NYSDOH). (2006). New York State Title V Application FFY 2007: Part II Needs Assessment. Author: Albany, NY. New York State Office of Children and Family Services. (OCFS). (2005). Bureau of Early Childhood Services: Day Care Regulations. Retrieved March 22, 2006 from www.ocfs.state.ny.us/ main/becs/regs. (2007). KWIC Indicator Profile: Asthma Hospitalizations 0-4 Years (Three-Year Average); Number and rate/10,000 children ages birth-4 years. Retrieved May 1, 2007 from www.nyskwic.org. New York State Public Health Council. (1996). Communities Working Together for a Healthier New York. Albany, NY: NYS Public Health Council. Public Health Information Group. (2006). National Asthma Survey—New York State Summary Report. Center for Community Healthy, New York State Department of Health. Retrieved May 15, 2007 from www.health.state.ny.us/diseases/asthma/pdf/national_asthma_survey_nys.pdf. U.S. Department of Health and Human Services. (2000). Healthy People 2010 (Conference Edition in Two Volumes). Washington, DC: U.S. Government Printing Office. Injury-Related Hospitalizations, pages 24-25 Bureau of Injury Prevention. (2006). Unpublished New York State Injury-Related Hospitalization Data. New York State Department of Health. Centers for Disease Control and Prevention (CDC). (2005). National Center for Injury Prevention and Control: Injuries among children and adolescents. Retrieved March 27, 2006 from www.cdc. gov/ncipc/factsheets/children.htm. New York State Department of Health (NYSDOH). (1998). Bureau of Injury Prevention: Spotlighting Injury in New York State: Causes, consequences, and countermeasures. Retrieved March 24, 2006 from www.health.state.ny.us/nysdoh/injury/spot2.pdf. Lead Screening and Poisoning, pages 26-27 Child Mortality, pages 20-21 Kotch, J.B. (1997). Maternal and Child health: Programs, Problems, and Policy in Public Health. Gaithersburg, MD: Aspen Publishers, Inc. New York State Kids’ Well-being Indicators Clearinghouse (KWIC). (2007a). KWIC Indicator Profile: Five Leading Causes of Death by Race/Ethnicity (Three-year average), Number and percent of deaths for each cause ages birth-19 years. Retrieved April 6, 2007 from www.nyskwic.org. New York State Kids’ Well-being Indicators Clearinghouse (KWIC). (2007b). KWIC Indicator Profile: Five Leading Causes of Death by Region (Three-year average), Number and percent of deaths for each cause ages birth-19 years. Retrieved April 6, 2007 from www.nyskwic.org. New York State Kids’ Well-being Indicators Clearinghouse (KWIC). (2007c). KWIC Indicator Profile: Mortality by Age—Children 1 to 4 years (Three-year average). Retrieved April 6, 2007 from www. nyskwic.org. Asthma Hospitalizations, pages 22-23 American Lung Association. (2006). Asthma & Allergy: Childhood Asthma Overview. Retrieved May 15, 2007 from www.lungusa.org. New York State Kids’ Well-being Indicators Clearinghouse (KWIC). 42 — NYS Early Childhood Data Report Bureau of Child and Adolescent Health. (2007). Unpublished Lead Poisoning Prevention Program Data: Preliminary 2004-2005 data. New York State Department of Health, Center for Community Health. Centers for Disease Control and Prevention (CDC). (2006). National Center for Environmental Health: Childhood Lead Poisoning Prevention Program General Lead Information: Questions and Answers. Retrieved March 13, 2006 from www.cdc.gov/nceh/ lead/faq/about.htm. NYSDOH. (2004). Eliminating Childhood Lead Poisoning in New York State by 2010. Retrieved March 10, 2006 from www.health.state. ny.us/nysdoh/environ/lead/finalplanstate.htm. NYSDOH. (2006). Lead. Retrieved March 10, 2006 from www.health. state.ny.us/environmental/lead. Special Health Care Needs, pages 28-29 Child and Adolescent Health Measurement Initiative. (2005a). National Survey of Children’s Health, Data Resource Center on Child and Adolescent health website. Retrieved April 11, 2007 from www.nschdata.org. Chapter 1 References Child and Adolescent Health Measurement Initiative (2005b). National Survey of Children with Special Health Care Needs, Data Resource Center on Child and Adolescent Health website. Retrieved April 11, 2007 from www.cshcndata.org. Davidoff, A.J. (2004). Insurance for Children with Special Health Care Needs: Patterns of Coverage and Burden on Families to Provide Adequate Insurance. Pediatrics, 114(2), 394-403. Kotch, J.B. (1997). Maternal and Child Health Programs, Problems, and Policy in Public Health. Gaithersburg, MD: Aspen Publishers, Inc. Maternal and Child Health Bureau (MCHB), Health Resources and Services Administration (HRSA). (2001a). The National Survey of Children with Special Health Care Needs Chartbook 2001: Prevalence Statistics. Retrieved March 2, 2006 from www.mchb. hrsa.gov/cshcn/pages/prevalence.htm. Maternal and Child Health Bureau (MCHB), Health Resources and Services Administration (HRSA). (2001b). The National Survey of Children with Special Health Care Needs Chartbook 2001: Health and Functional Status of Children. Retrieved March 2, 2006 from www.mchb.hrsa.gov/cshcn/pages/functional.htm. Maternal and Child Health Bureau (MCHB), Health Resources and Services Administration (HRSA). (2001c). The National Survey of Children with Special Health Care Needs Chartbook 2001: Prevalence of Children with Special Health Care Needs. Retrieved March 2, 2006 from www.mchb.hrsa.gov/cshcn/pages/prevalence.htm. New York State Department of Health (NYSDOH). (2006). New York State Title V Application FFY 2007: Part II Needs Assessment. Author: Albany, NY. Nyman, R., & Ireys, H. (2004). Trends in Health Care Quality. Children with Special Health Care Needs: building a Quality-of-Care Initiative. Mathematica Policy Research Inc.: Issue Brief, 1. Retrieved April 11, 2007 from www.mathematica-mpr.com/publications/ pdfs/cshcn.pdf. Weight Status, pages 30-31 Centers for Disease Control and Prevention (CDC). (2007). Division of Nutrition and Physical Activity, National Center for Chronic Disease Prevention and Health Promotion. BMI- Body Mass Index: BMI Percentile Calculator for Child and Teens. Retrieved march 23, 2007 from http://apps.nccd.cdc.gov/dnpabmi/Calculator.aspx. Centers for Disease Control and Prevention (CDC). (2005). Overweight and Obesity: Defining overweight and obesity. Retrieved March 1, 2006 from www.cdc.gov/nccdphp/dnpa/obesity. Centers for Disease Control and Prevention (CDC). (2007). BMIBody Mass Index: About BMI for Adults. Retrieved February 20, 2007 from www.cdc.gov/nccdphp/dnpa/bmi/adult_BMI/about_ adult_BMI.htm#Children. ChildTrends. (2005). ChildTrends Databank: Overweight Children and Youth. Retrieved March 1, 2006 from www.childtrendsdatabank. org/indicators/15OverweightChildrenYouth.cfm. Dorosty, A.R., Emmett, P.M., Cowin, I.S., Reilly, J.J. & the ALSPAC Study Team. (2000). Factors Associated with Early Adiposity Rebound. Pediatrics 105 (5), 1115-1118. Gidding, S., Liebel, R., Daniels, S., Rosenbaum, M., van Horn, L, & Marx, G., (1996). Understanding Obesity in Youth: A Statement for Healthcare Professionals from the Committee on Atherosclerosis and Hypertension in the Young of the Council on Cardiovascular Disease in the Young and the Nutrition Committee. Circulation 15;94(12):3383-7. New York State Department of Health (NYSDOH). Center for Community Health, Division of Family Health. (2006). New York State Maternal and Children Health Services Title V Block Grant Program: 2007 Application / 2005 Annual Report. Author: Albany, NY. New York State Department of Health (NYSDOH). (2004). New York State Strategic Plan for Overweight and Obesity Prevention. Retrieved February 24, 2006 from http://www.health.state.ny.us/ prevention/obesity/strategic_plan/strategic_plan_index.htm. United States Department of Agriculture (USDA). (2004). Nutrition Program Facts Food and Nutrition Service: WIC The Special Supplemental Nutrition Program for Women, Infants, and Children. Retrieved February 22, 2006 from www.usda.gov. Oral Health, pages 32-33 Centers for Disease Control and Prevention. (CDC). (2007). Children’s Oral Health. National Center for Chronic Disease Prevention and Health Promotion, Oral Health Resources. Retrieved May 15, 2007 from www.cdc.gov/OralHealth/topics/child.htm. Child and Adolescent Health Measurement Initiative. (2005). National Survey of Children’s Health (NSCH). Data Resource Center on Child and Adolescent Health website. Retrieved May 16, 2007 from www.nschdata.org. New York State Department of Health. (NYSDOH). (2006)b. Oral Health for Infants and Children. Retrieved May 16, 2007 from www.health.state.ny.us/prevention/dental/prenatal_oral_health. htm. New York State Department of Health. (NYSDOH). (2006)a. Prenatal Oral Health. Retrieved May 16, 2007 from www.health.state. ny.us/prevention/dental/prenatal_oral_health.htm. Insurance Status, pages 34-35 Child and Adolescent Health Measurement Initiative. (2005) a. National Survey of Children’s Health (NSCH). Data Resource Center on Child and Adolescent Health website. Retrieved May 16, 2007 from www.nschdata.org. Child and Adolescent Health Measurement Initiative. (2005) b. National Survey of Children’s Health (NSCH), 2003 Fast Facts about the Survey. Data Resource Center on Child and Adolescent Health website. Retrieved May 16, 2007 from www.nschdata.org. Child Trends. (2006). Child Trends DataBank: Health Care Coverage. Retrieved February 27, 2006 from www.childtrendsdatabank.org. Kaiser Family Foundation: Kaiser Commission on Medicaid and the Uninsured. (2006). The Uninsured: A Primer Key facts about Americans without health insurance. Retrieved February 27, 2006 from www.kff.org. Healthy Children — 43 Chapter 1 References Lewit, E.M., Bennett, C., & Behrman, R.E. (2003). Health Insurance for Children: Analysis and Recommendations. In The Future of Children, Health Insurance for Children 13(1) 5-29. Los Altos, CA: The David and Lucile Packard Foundation. New York City Department of Health and Mental Hygiene (NYCDOHMH). (2006). Division of Health Care Access and Improvement. From: Medicaid Managed Care Policy and Practice for New York City Health Care Providers Serving the Medicaid Population. Retrieved February 21, 2006 from www.nyc.gov/html/doh. Bureau of Quality Management and Outcomes Research. (2005). Unpublished New York State Medicaid Data. Medicaid Encounter Data Unit, New York State Department of Health. NYSDOH. (2005b). Medicaid. Retrieved February 17, 2006 from www. health.state.ny.us/health_care/medicaid. NYSDOH. (2006). Operation Protocol – Definitions and Acronyms. Retrieved February 17, 2006 from www.health.state.ny.us/health_ care/managed_care/partner/operation/def-acr.htm. New York State Kids’ Well-being Indicators Clearinghouse (NYS KWIC). (2006). KWIC Indicator Profile: Births to Women with Primary Financial Coverage of Medicaid or Self-Pay. Retrieved February 17, 2006 from www.nyskwic.org. The City of New York. (2007). Health Insurance for Children: Child Health Plus A and B. Office of Citywide Health Insurance Access. Retrieved June 15, 2007 from http://home2.nyc.gov/html/hia/ html/public_insurance/children.shtml. U.S. Census Bureau. (2005). Housing and Household Economic Statistics Division. Health Insurance: CPS Health Insurance Definitions. Retrieved June 5, 2007 from www.census.gov/hhes/ www/hlthins/hlthinstypes.html. 44 — NYS Early Childhood Data Report Medical Home, pages 36-37 American Academy of Pediatrics. (2002). The Medical Home. Policy Statement from the Medical Home Initiatives for Children with Special Needs Project Advisory Committee. Pediatrics, 110(1), 184-186. American Academy of Pediatrics. (2007). Children’s Health Topics: Medical Home. Retrieved May 18, 2007 from www.aap. org/healthtopics/medicalhome.cfm. Child and Adolescent Health Measurement Initiative. (2005). National Survey of Children Health, Data Resource Center on Child and Adolescent Health website. Retrieved May 18, 2007 from www. nschdata.org. Parental Health, pages 38-39 Child and Adolescent Health Measurement Initiative. (2005) a. National Survey of Children’s Health (NSCH). Data Resource Center on Child and Adolescent Health website. Retrieved May 16, 2007 from www.nschdata.org. Kahn, R.S., Brandt, D., & Whitaker, R.C. (2004). Combined Effects of Mothers’ and Fathers’ Mental Health Symptoms on Children’s Behavioral and Emotional Well-being. Arch Pediatr Adolesc Med. 158: 721-729. U.S. Department of Health and Human Services. (1999). Mental Health: A Report of the Surgeon General. Rockville, MD. U.S. Department of Health and Human Services, Substance Abuse and Mental Health Services Administration, Center for Mental Health Services, National Institutes of Health, National Institute of Mental Health. Chapter 2: Strong Families F amily and the role that parents play in a child’s early life are the foremost influential factors on development. Thus, the presence of strong families that provide consistent and supportive relationships is a most vital element in the healthy development of children. During the early years, when children are the most vulnerable to developmental risks, they are also the most open to protective and supportive influences. Positive developmental interactions with parents and families have the ability to improve young children’s social competencies and their overall capacity to learn. Children are also more apt to thrive in the context of close and dependable relationships such as those that exist within a family. The presence of these consistent, supportive, and appropriate relationships can lay the foundation for positive social and emotional development throughout the early years. Outcomes: Families are empowered to seek, utilize, and actively participate in supportive services. Families have adequate and stable employment, income, and basic needs (food, shelter, and clothing). Families have the knowledge, skills, confidence, and social supports to nurture the health, safety, and positive development of children. Parents’ special needs are recognized and supported, including health, mental health, and substance abuse. Beyond receiving the necessary care to survive, children also depend on parents for the care necessary for them to thrive. For many families, the realization of health outcomes is hindered due to the presence of numerous financial, physical, or emotional burdens. However, in early childhood, the course of development may be altered by effective interventions that change the balance between risk and protection, thereby shifting odds in favor of more adaptive outcomes.* Grandparents as Primary Caregiver Adolescent Pregnancy Families provide children with safe and healthy environments free from abuse and neglect. Postpartum Depression Families provide children with positive, nurturing, consistent relationships. Food Insecurity Indicators: Poverty Family Structure WIC Program Participation Parental Employment Child Care Subsidies Foster Care Child Abuse and Maltreatment *Shonkoff, J.P. and Phillipps, D.A. (Eds.). (2003). From Neurons to Neighborhoods: The Science of Early Childhood Development. National Academy Press: Washington, D.C. NYS Early Childhood Data Report — 45 Poverty Why This Is Important To live in poverty means to not have enough income to meet the basic needs for food, clothing, and shelter (Brooks-Gunn & Duncan, 1997). Childhood poverty is associated with a range of social, health, educational, and employment problems later in life (NYS Council on Children and Families, 2005). A family’s income can impact children’s physical health, cognitive abilities, school achievement outcomes, emotional and behavioral outcomes, and teenage out-of-wedlock childbearing rates (Brooks-Gunn & Duncan, 1997). For example, compared with non-poor children, poor children experience diminished physical health in the form of low birthweight, congenital infection, and lead poisoning; they are more likely to experience learning disabilities and developmental delays, suffer from emotional-behavioral problems more frequently, and to be limited in their school achievement (Brooks-Gunn & Duncan, 1997; NYS Council on Children and Families, 1988). There is not one answer to the question of what causes child poverty. However, children live with adults and primarily depend on those adults for their well-being. Thus, in a sense, children are poor because they live with adults who are poor (Lewit et al., 1997). In order to understand child poverty, a greater understanding of adult poverty and the factors that may contribute to it, such as age, educational level, job status, and income is required. While such a discussion extends beyond the scope of this publication, it should be noted that the determinants of adult poverty are usually classified into two categories: 1) the macroeconomic and demographic forces which affect the overall income distribution and 2) factors that affect an individual’s earning capacity, such as education, age, and race (Betson & Michael, 1997). Data Definition According to the American Community Survey, whose definitions mirror that of the U.S. Census, children are considered to be living in poverty if their family income, before taxes, falls below the poverty thresholds set by the federal government for families of different sizes*. The Federal and State Earned Income Tax Credit (EITC) as well as the value of non-cash benefits such as public housing, food stamps, Medicaid, or school meals are not included when calculating family income; in addition, certain costs such as taxes and work-related expenses are not subtracted from family income in determining the number of children who are poor. The poverty thresholds are adjusted each year for changes in the cost of living. In 2005, the poverty threshold for a single parent with one related child under the age of 18 was $13,461; for a family of four with two parents and two related children under the age of 18 the poverty threshold was $19,806 (U.S. Census Bureau, 2007). A household includes all the people who occupy a housing unit as their usual place of residence. The householder is a person, or one of the people, in whose name the home is owned, being bought, or rented. If there is no such person present, any household member 15 years old and over can serve as the householder for the purposes of the census. Two types of householders are distinguished: a family householder and a nonfamily householder. A family householder is a householder living with one or more people related to him or her by birth, marriage, or adoption. The householder and all people in the household related to him are family members. A nonfamily householder is a householder living alone or with nonrelatives only. 46 — NYS Early Childhood Data Report Related children include all people in a household under the age of 18, regardless of marital status, who are related to the householder. This does not include householder’s spouse or foster children, regardless of age. A family is a group of two or more people who reside together and who are related by birth, marriage, or adoption. * Note: There is much controversy concerning where the poverty line should be drawn and what family income and resources should count in determining if a family is above or below that line. As a result, the number of children in poverty should not be considered a precise measure of how many children lack the income and resources required to meet basic needs. Instead, the poverty measure should be used to assess the relative differences between geographic areas in the number of children near or below the minimum required to meet basic needs, as well as to examine trends over time within geographic areas in the number of children with minimal economic resources (KWIC, 2007). Poverty What the Data Show In New York State in 2005, 21 percent of children birth to 5 years were living in households with incomes below the poverty level. The percentage of children living in households with incomes below the poverty level is considerably greater in New York City (27.3 percent) in comparison to Rest of State (15.3 percent) (Figure 43). In New York State in 2005, the greatest percentage of related children under six years living below poverty level were found in households headed by female householders with no husband present (52.3 percent); 22.5 percent of children under six years living below poverty level were in male-headed households with no wife; and 9.7 percent of related children under six years old living below poverty were in marriedcouple families (Figure 44). Figure 43. Children Birth to 5 Years Living in Households with Incomes Below the Poverty Level: New York State, New York City and Rest of State, 2005. (Source: 2005 American Community Survey, 2007a) 21.0% New York State 27.3% New York City 15.3% Rest of State Figure 44. Related Children Under Six Years Living Below Poverty Level by Family Type: New York State, 2005. (Source: 2005 American Community Survey, 2007b) Female Householder (no husband) 52.3% Male Householder (no wife) Married-Couple Families 25.5% 9.7% See page 68 for references. Strong Families — 47 Family Structure Why This Is Important Although more marked among the poor, changing family structure is a trend which cuts across class, race, and religion (Ooms, 2002). It has led to an increase in the numbers and proportions of children born outside of marriage, a rise in divorce rates and the resulting increase in single-parent households; it has also spawned research regarding the effects of these changes on the overall well-being of children. Much of this research supports that when raised by their two, married, biological parents who have low-conflict relationships, children are most successful (Ooms, 2002). While there are benefits to marriage that impact upon children, such as increased access to health insurance and tax advantages, the quality of that marriage (Ooms, 2002), or any two-parent committed relationship, whether biological or not, matters. A low-conflict, financially responsible and cooperative two-parent home has been shown to have the most positive impact on the overall development and well-being of children (Ooms, 2002; Parke, 2003). In a 1994 research study involving four nationally representative data sets, it was found that children not living with both biological parents were about twice as likely to be poor, to have a birth outside of marriage, to not graduate from high school, and to have behavioral and psychological problems (Ooms, 2002). Other studies have found that children living in single-parent households are more likely to experience health problems in addition to other negative social and emotional outcomes (Parke, 2003). Although most children not living with their married, biological parents grow up without serious problems, a healthy, stable, two-parent family provides the best opportunity for positive childhood outcomes. Research has shown that, regardless of the form that it comes in, supportive networks are major contributors to a parent’s ability to raise his or her child (Ooms, 2002). For example, when programs and services reach parents early, children benefit; when parents are more connected to other families in their communities, their children benefit; and when people feel responsible for what happens in their neighborhoods, children benefit (Ooms, 2002). Data Definition The National Survey of Children’s Health included questions about family structure and children’s living situations. The following question was asked to generate the data shown opposite: What are the family structure characteristics of the child’s household at the time of the survey? Responses were classified into one of four family structure categories: Two-parent household (biological/ adoptive); Two-parent stepfamily household; Mother only household with no father present; and other family structure. To protect confidentiality, a single measure of family structure was created by the National Center for Health Statistics for inclusion in the publicly released data file. For the purpose of this survey, family structure refers to parents living in the household. Any of the four family structure categories may include other people who act as parents, such as grandparents, aunts, uncles, or unmarried partners of the parents. Legal guardians were not considered to be mothers or fathers. Households identified as having two mothers of the same type (biological, step, foster, or adoptive) were classified as other family structure; however, because of this ambiguity about whether the respondent was also counted as another parent in the household, these households may actually 48 — NYS Early Childhood Data Report be single mother households. Other households with ambiguous structure (e.g. where a father refused to indicate whether he was the biological father) were also coded as other family structure. (Child and Adolescent Health Measurement Initiative, 2005). Figure 45 presents the percent of children under six who were living in two-parent (biological/adoptive) households, two-parent stepfamily households, a mother only household with no father present, or other family structure in New York State in 2003. Family Structure What the Data Show In New York State in 2003, just over 76 percent (76.5 percent) of children under the age of six lived in a twoparent situation; 21.5 percent lived in a home with a mother only and no father present; and 2.1 percent lived in a home with another form of family structure (Figure 45). Figure 45. Family Structure Characteristics of Children Under 6 Years: NYS, 2003. (Source: Child and Adolescent Health Measurement Initiative, 2005) Note: Due to rounding, sum is greater than 100 percent. Other Family Structure, 2.1% Two-Parent (Stepfamily), 0.5% Mother Only/ No Father Present, 21.5% Two-Parent (Biological/Adoptive), 76.0% See page 68 for references. Strong Families — 49 Grandparents as Primary Caregiver Why This Is Important Research documents that two-parent families have the greatest protective impact on the economic, physical, emotional and social well-being of children. Recent trends in fertility and mortality, as well as increased parental substance abuse, incarceration and unemployment; family violence; and HIV/AIDS, jeopardize that family structure. Grandparents, who have often raised grandchildren in times of family crisis, have experienced an increased responsibility for their grandchildren as the proportion of families in crisis increases. With an increase in life expectancy, the pool of potential grandparent caregivers is growing. This is not to say that grandparents are always able, willing or need to care for their grandchildren. In fact, there are two different grandparent cohabitation trends happening: grandparent-maintained households and parent-maintained households with co-resident grandparents who may be contributing to or relying on their children. Researchers have reported grandparent caregivers are 60 percent more likely to live in poverty than are grandparents not raising grandchildren. In addition to financial concerns, grandparents raising grandchildren are apt to face many of the problems associated with care giving, including: depression, functional health limits, respite, childcare needs and social isolation. Data Definition In 2000, a new subject was added to the Census: grandparents as caregivers. There are two different grandparent cohabitation trends happening: grandparent-maintained households and parent-maintained households with co-resident grandparents who may be contributing to or relying on their children. Figure 46 presents the percentage of children under the age of six who are living with their grandparents and whose grandparents have primary responsibility for their care in New York and in the United States in 2005. 50 — NYS Early Childhood Data Report According to the Administration on Aging, grandparent caregivers often neglect their own physical and emotional health as they prioritize the needs of their grandchild—who frequently require special assistance with physical, emotional and developmental needs. While hardships can exist in intergenerational households, grandparent households also exhibit strengths and rewards as well as generate positive outcomes for both grandparents and grandchildren. It is important to acknowledge the positive effects and benefits of grandparent caregivers as well as the challenges they face. Grandparents as Primary Caregiver What the Data Show In New York State in 2005, just fewer than 5 percent (4.98 percent) of children under the age of six are living with a grandparent who has primary responsibility for their care. (Figure 46). Figure 46. Children Under 6 Years Who Are the Primary Responsibility of Their Grandparents: US and NYS, 2005. (Source: 2005 American Community Survey, 2007) NYS US 4.98% 5.24% See page 68 for references. Strong Families — 51 Adolescent Pregnancy Why This Is Important Adolescent pregnancy is associated with a number of serious health, educational, and economic consequences. During the pregnancy itself, teenage mothers are often more likely than their older counterparts to experience complications including anemia and prolonged labor. While complications like these can be alleviated through early and adequate prenatal care, teenage mothers are not often likely to obtain such care (Rosengard et al., 2006).Teen mothers are also less likely to complete high school and to marry. They are more likely to have large families and to live in poverty. A child born to a teen mother has a greater risk of infant mortality, having lower cognitive development, worse educational outcomes, higher rates of behavioral problems, higher rates of adolescent childbearing themselves, as well as poor health in general. Adolescent childbearing also places a greater financial burden on society in terms When teenagers give birth, their future prospects and those of their children decline (Centers for Disease Control and Prevention (CDC), 2007). Assuming the responsibilities of parenthood before one is financially, socially, or emotionally prepared to do so carries an increased risk of later difficulties for the parent, the child, and the community. What the Data Show Data Definition Pregnancies are the sum of the number of live births, reported induced terminations of pregnancies, and reported fetal deaths of all gestations. The adolescent pregnancy rate is the number of pregnancies per 1,000 females in the stated age group. of the increased supports required to assist these families (Kirby, 1997). Figure 47 presents the rate per 1,000 adolescent pregnancies for the age groups 10 to 14 years, 15 to 17 years, and 15 to 19 years. In 2004 in New York State, the pregnancy rate for young women ages 15 to 19 years was 60.2 per 1,000. This is a substantial decline from a rate of 94.7 per 1,000 in 1994 (Figure 47). In 2004, pregnancy rates for New York State’s youngest teens remained fairly low at 1.6 per 1,000 girls aged 10 to 14 years. Pregnancy among young women aged 15 to 17 years declined from 65.5 per 1,000 in 1994 to 36.5 per 1,000 in 2004 (Figure 47). The decline in the adolescent pregnancy rate in New York State occurred among young women in both New York City and Rest of State. The rate of pregnancies for women outside of New York City declined from 61.5 per 1,000 women ages 15 to 19 in 1995 to 43.2 per 1,000 in 2003. Adolescent pregnancy rates in New York City also declined between 1995 and 2003 (134.9 and 95.4, respectively; data not shown). 52 — NYS Early Childhood Data Report Adolescent Pregnancy What the Data Show (cont.) Figure 47. Adolescent Pregnancy Rate by Age: NYS, 1994 to 2004. (Source: Kids’ Well-being Indicators Clearinghouse, 2006) 100 75 Rate per 1,000 Healthy People 2010 objectives call for a national reduction in the adolescent pregnancy rate to 46 pregnancies per 1,000 females ages 15 to 17 years (U.S. Department of Health and Human Services, 2000). The New York State Public Health Council has also identified adolescent sexual activity as a priority area for public health action. As such, it set an objective to reduce, by 2006, the adolescent pregnancy rate to no more than 2 per 1,000 girls aged 10 to 14 and to no more than 50 per 1,000 girls aged 15 to 17 (New York State Public Health Council, 1996). At 1.6 per 1,000 and 36.5 per 1,000, respectively, New York State reached both Healthy People 2010 and New York State Public Health Council goals for 10 to 14 years and 15 to 17 years by 2004. 50 25 0 1994 1995 1996 1997 10-14 Years 1998 1999 15-17 Years 2000 2001 2002 2003 2004 15-19 Years See page 68 for references. Strong Families — 53 Postpartum Depression Why This Is Important Often, women who have just had a baby experience mood swings, difficulty sleeping and eating, or feeling a bit depressed. This is commonly referred to as the baby blues and symptoms usually alleviate within a week or two and then the new mother returns to feeling fine. Postpartum depression is not just the baby blues, but rather a more serious depressive illness that affects 10 to 15 percent of women any time from a month to a year after childbirth (NIH, 2005). While the exact cause of postpartum depression is unknown, it is believed that the hormonal changes that occur in a woman’s body in the first 24 hours after childbirth may trigger symptoms of depression (National Institutes of Health (NIH), 2005; The National Women’s Health Information Center, 2005). Postpartum depression can happen anytime within the first year after childbirth. Symptoms include sadness, lack of energy, restlessness, trouble concentrating, anxiety, feelings of guilt and worthlessness, and often a feeling of disinterest in her new baby (NIH, 2005; The National Women’s Health Information Center, 2005). Thus, postpartum depression can affect a mother’s ability to care for, interact with, and fulfill her child’s need for love and affection (Moline et al., 2001; The National Women’s Health Information Center, 2005). When interactions between mother and child are impaired, there can be significant negative effects on the baby that may persist into childhood (Moline et al., 2001). Delays in language development, problems with emotional bonding to others, behavioral problems, lower activity levels, sleep problems, and distress are some of the ways than an infant is affected (The National Women’s Health Information Center, 2005). Fortunately, postpartum depression is a treatable illness. The earlier it is identified and treated, the better the outcome for both mother and child. Data Definition To determine if a woman was experiencing postpartum depression in the months following the birth of her child, PRAMS posed the following question: In the months after your delivery, would you say that you were: Not depressed at all, A little depressed, Moderately depressed, Very depressed, or Very depressed and had to get help. Women were asked to check only one response. Women are considered not depressed if they responded Not depressed at all or A little depressed and considered depressed if they responded 54 — NYS Early Childhood Data Report Moderately depressed, Very depressed or Very depressed and had to get help. Figure 48 presents the percentage of survey respondents who reported feeling Not or A little depressed, Moderately depressed, Very depressed, or Very depressed and had to get help. Postpartum Depression What the Data Show In 2003 in New York State excluding New York City, 83 percent of mothers reported feeling not depressed at all or a little depressed in the months after delivery. Twelve percent reported being moderately depressed in the postpartum period, three percent reported being very depressed, and two percent reported being depressed to the point that they needed help (Figure 48). Figure 48. Mothers Reporting Postpartum Depression Shortly After Birth: NYS Excluding NYC, 2003. (Source: Public Health Information Group, 2006) Very Very Depressed/ Depressed, Needed Help, 3% 2% Moderately Depressed, 12% Not Depressed or A Little Depressed, 83% See page 68 for references. Strong Families — 55 WIC Program Participation Why This Is Important The Special Supplemental Nutrition Program for Women, Infants, and Children (WIC) acts to improve the health of pregnant women, new mothers, and their infants by allowing for the provision of foods that are a good source of essential nutrients that are often missing from the diets of women and young children. In turn, it has also been shown to improve birth outcomes including infant mortality and low birth weight, infant feeding practices, immunization rates and having a regular source of medical care, cognitive development, preconceptional nutritional status, diet and diet-related outcomes, as well as acting to contain health care costs (USDA, 2004). Since 1974, WIC has become one of the most successful federally-funded nutrition programs in the U.S. and it has provided numerous children with a healthy and strong start in life. risk, such as failure to meet the dietary guidelines or inappropriate nutrition practices (USDA, 2006). woman must be either pregnant, breastfeeding, postpartum or have an infant. She must also be a New York State resident, determined to be a nutritional or medical risk by a WIC professional authority, and she must meet income guidelines (NYS Department of Health, 2005). Data Definition WIC serves low-income pregnant, postpartum and breastfeeding women, and infants and children up to age five who are at nutrition risk (USDA, 2006). Nutrition risk is either a medicallybased risk such as anemia, underweight, overweight, history of pregnancy complications, or poor pregnancy outcomes, or a dietary WIC provides nutritious foods, milk, juice, formula, nutrition education, and referrals to health and other social services to participants at no charge (NYS Department of Health, 2005; USDA, 2006). In order to be eligible for WIC, a 56 — NYS Early Childhood Data Report WIC Program Participation What the Data Show In New York State in 2006, the estimated number of children under age five eligible for WIC was 600,306. Of this number, 38 percent, or 230,322 children, were served by the program (Figure 49). In New York City in 2006, 357,160 children under age five were eligible for the WIC program and 140,016 (29 percent) were served; In Rest of State, 243,246 children were eligible and 90,306 (37 percent) were served (Figure 49). Figure 49. Children Birth to 4 Years Eligible for and Served by the Special Supplemental Nutrition Program for Women, Infants and Children (WIC): NYS, NYC and ROS, 2006. (Source: NYS Department of Health, 2007) 600,306 NYS 230,322 38% of Eligible 357,160 NYC 140,016 39% of Eligible 243,146 ROS 90,306 37% of Eligible Number of Children Eligible Number of Children Served See page 69 for references. Strong Families — 57 Food Insecurity Why This Is Important Since 1995, the U.S. Census Bureau has conducted an annual survey of food security among a nationally representative sample of people living in the United States using a food security module. According to the Food Research and Action Center’s results of this survey, pertaining to children, households that are classified as food insecure with hunger are those in which children’s food intake has been reduced due to lack of family financial resources to the point that children are likely to be hungry on a regular basis (Food Research and Action Center, 2005). When hunger is not present, adults in food insecure households are unable to buy food due to limited resources and thus are running out of food, reducing the quality of food their family consumes, or they are feeding their children unbalanced diets (Food Research and Action Center, 2005). Household food insecurity is a concern because of its association with adverse health and developmental outcomes for children. This includes an inadequate intake of key nutrients, academic and social developmental delays, an increase in behavior problems, and poor school performance (Cook et al., 2004; Wunderlich & Norwood, 2006). Other adverse health outcomes in children include impaired immunity and wound healing due to micronutrient and proteinenergy deficits, which results in an increased risk of serious illness (Cook et al., 2004). Independent of nutritional deficits, the inability to purchase enough food for a household and the resulting emotional and psychological stress that this presents may negatively impact the overall sense of well-being that exists within a household. Data Definition Household food security is defined as having access at all times to enough nutritious food for an active and healthy life, whereas food insecurity results whenever the availability of nutritionally adequate and safe foods or the ability to acquire acceptable foods in socially acceptable ways is limited or uncertain (Wunderlich & Norwood, 2006). Measured in the United States, food insecurity also refers to the “social and economic problem of lack of food due to resource or other constraints, not voluntary fasting or dieting, or because of illness, or for other reasons” (Wunderlich & Norwood, 2006, p. 43). 58 — NYS Early Childhood Data Report Figure 50 presents the prevalence of food-insecure households and food insecure-with-hunger households in New York State from 1996-1998 to 2002-2004. Three-year averaging was used to improve the reliability of the data. Food Insecurity What the Data Show In New York State, the prevalence of food insecurity declined from 11.9 percent in 1996-1998 to 9.6 percent in 1999-2001 and increased slightly to 10.5 percent in 2002-2004 (Figure 50). Similarly, the prevalence of food insecurity with hunger also declined from 4.1 percent in 19961998 to 3.1 percent in 199-2001 and then rose again very slightly to 3.2 percent in 2002-2004 (Figure 50). Figure 50. Prevalence of Food-Insecure Households*: NYS, 1996-1998 to 2002-2004. (Source: Nord, Andrews & Carlson, 2005; *Includes all households; not limited to households with children) 12% 8% 4% 0% 1996-1998 1999-2001 Food Insecure (with or without hunger) 2002-2004 Food Insecure with Hunger See page 69 for references. Strong Families — 59 Parental Employment Why This Is Important Over the past couple of decades, there has been significant growth in the number of employed mothers; specifically, there has been a large increase in the frequency with which mothers of young children are employed (Harvey, 1999). Parental employment is a strong determinant of financial stability and well-being for families (ChildTrends, 2006). It may also increase a child’s psychological well-being and improve family functioning by decreasing the stress and other negative effects that unemployment and underemployment may have on parents (Federal Interagency Forum on Child and Family Statistics, 2005). For example, parental employment has been shown to be a protective factor that may lessen the risk of child abuse and maltreatment (Centers for Disease Control and Prevention, 2006). Poverty, 2004). Having a secure job not only positively affects children’s development by increasing family income; it can also mean having access to health care due to the fact that parents who obtain health insurance for themselves and their children do so through an employer (Federal Interagency Forum on Child and Family Statistics, 2005). Most children in low-income families have parents who are employed full-time and year round (National Center for Children in Data Definition The U.S. Census Bureau defines children under age six with all parents in the labor force as the percentage of children under age six living in families where all resident parents are in the civilian labor force. For those children living with one parent, this means that the resident parent is in the civilian labor force. For those children living with two parents, this means that both resident parents are in the civilian labor force. The civilian labor force includes persons who are employed and those who are unemployed, but looking for work (Annie E. Casey, 2006). Children under six with no parent in the labor force is defined as the percentage of children under age six living in families where no parent is in the civilian labor force. For those children living with one parent, this means that the resident parent is not in the civilian labor force. For those children living with two parents, this means that neither resident parent is in the civilian labor force (Annie E. Casey, 2006). one parent worked 50 or more weeks in the 12 months prior to the survey and the family income was less than twice the federal poverty level, as determined by the U.S. Office of Management and Budget. The federal poverty definition consists of a series of thresholds based on family size and composition. In calendar year 2004, a family of two adults and two children fell in this category if their annual income fell below $38,314. Children under age six in workingpoor families (income below 200% of poverty level) measures the percentage of children under age six living in families where at least Figure 51 presents the parental employment status of children under six in the US and NYS in 2004. 60 — NYS Early Childhood Data Report Parental Employment What the Data Show In New York State in 2004, over half (56 percent) of children under age six were living in families where all resident parents were employed in the civilian labor force; this is slightly less than the U.S. percentage (59 percent) (Figure 51). In New York State in 2004, 13 percent of children under age six were living in families where no parent was employed in the civilian labor force. This is slightly greater than the percent of children in the U.S. under age six living in families where no parent worked (Figure 51). In New York State in 2004, 19 percent of children under age six were living in families where at least one parent worked 50 or more weeks in the 12 months prior to the survey and the family income was less than twice the federal poverty level (Figure 51). Figure 51. Parental Employment Status of Children Under 6 Years: US and NYS, 2004. (Source: The Annie E. Casey Foundation, 2006) All Parents in the Labor Force 56% NYS US 59% No Parent in the Labor Force NYS US 13% 10% In Working-Poor Families NYS US 19% 21% See page 69 for references. Strong Families — 61 Child Care Subsidies Why This Is Important While research on child care subsidy use is not extensive, a recent literature review (Schaefer et al., 2005) discovered several correlations between a number of demographic characteristics and the use of subsidies. For example, families with preschool-age children (birth to age 5) were more likely to receive subsidies than families with older children. In addition, several studies showed that single- parent families were more likely to use subsidies than two-parent families and others showed that African-American mothers appear more likely to use subsidies than mothers from other racial/ethnic backgrounds (Schaefer et al., 2005). While there is no direct evidence at this time indicating that the use of child care subsidies is correlated with better health and development outcomes for children, one can infer that there is a indirect relationship due to the fact that subsidies allow parental employment to continue and progress, and parental employment has been correlated with positive health and development outcomes in children (ChildTrends, 2006). Data Definition Child care subsidies enable lowincome families to pay for the care and education their children need while parents work and/or participate in education and training (Kreader, 2005). Funded largely, though not exclusively, through federal and state funds in the Child Care and Development Fund, child care subsidies are designed to support both parental employment and children’s development (Kreader, 2005). Additional funding for child care subsidies comes from Temporary Assistance for Needy Families (TANF) (Lawrence and Kreader, 2005). Federal law allows states to assist families with child care costs when their incomes fall below 85 percent of the State’s median income and when they need child care to support their employment, education and training (Kreader, 2005). 62 — NYS Early Childhood Data Report Figure 52 presents the percent of children served in day care centers, family home care (which includes children served in group home care), relative care, and in the child’s home by age regardless of whether the provider is licensed/ regulated or legally operating without a license. Child Care Subsidies What the Data Show In New York State in 2004, the primary setting in which children birth to 2 years received subsidized care was family home care (46 percent); 28 percent of children 2 and under received subsidized care in day care centers, 20 percent in relative care, and just 6 percent in the child’s home (Figure 52). In New York State in 2004, the primary setting in which children 3 to 5 years received subsidized care was day care centers (53 percent) followed by family home care (28 percent), relative care (14 percent), and 5 percent of children received subsidized care within their own home (Figure 52). Figure 52. Children Under 6 Years in Subsidized Child Care by Setting: NYS, 2004. (Source: National Center for Children in Poverty, 2007) 6% 5% 14% 20% 28% 46% 53% Child’s Home Relative Care 28% Family Home Center Birth to 2 Years Ages 3 to 5 years See page 69 for references. Strong Families — 63 Foster Care Why This Is Important Children are placed into foster care for a wide variety of reasons including: neglect or abuse, safety issues, their families are at least temporarily unable to care for them, specialized care or treatment is needed, or behavioral problems have lead to a placement. Since children in foster care make up a majority of those in out-of-home care in New York State, this measure also provides insight into the extent to which children are removed from their homes and placed in out-of-home care in New York State. To minimize the trauma of placement to children, the court seeks to place children in a foster care setting that is least disruptive and most family-like, and consistent with a child’s needs. Decisions are based on the best interests of the child. The court then assumes the responsibility of continuing oversight until a permanent home is found. The court is charged with directing the local Department of Social Services to implement a service plan that identifies problems to be resolved, changes in parental behavior to be achieved, services to be provided to the family, special needs of the child and services to meet these needs, visitation, and deadlines for achieving plan goals. Regardless of the type of placement a child is in, placement in foster care presents children with change and loss, (e.g., loss of parents, siblings, school, friends, and community). Many children face multiple placements, which call upon children to enter and leave multiple relationships at a time in their development when consistency and stability are paramount. Many children entering the child welfare system have been exposed to health and developmental risk factors, including poverty and substance abuse, and parental neglect and abuse (Halfon et al., 1995; Silver et al., 1999; Wulczyn et al., 1997; Wulczyn et al., 2005). Societal and familial risk factors, including parental incarceration and HIV/AIDS, are also related to children entering the child welfare system (Chipungu & Bent-Goodley, 2004). Moreover, these risk factors tend to coexist and interact; presenting a complex family dynamic and a complicated set of service needs (Chipungu & Bent-Goodley, 2004). Compared to the general child population, children involved in the child welfare system are more likely to have physical, learning, and mental health conditions that limit their daily activities, to be living in high-risk parental care (Green et al., 2005), and to be living in households with incomes below poverty (Wulczyn et al., 2005). 64 — NYS Early Childhood Data Report Note: Children are placed in foster care either by order of a court (involuntary) or because their parents are willing to have them cared for outside the home (voluntary). An involuntary placement occurs when a child has been abused or neglected (or may be at risk of abuse or neglect) by his or her parent or someone else in the household, or because a court has determined that the child is a “person in need of supervision” or a juvenile delinquent. The court orders the child removed from the home and determines the length of the placement. A voluntary placement occurs when parents decide that they are temporarily unable to care for their child for reasons other than abuse or neglect. For example, the family is experiencing a serious medical, emotional, and/or financial problem. The parents sign a voluntary placement agreement that lists the responsibilities of the parents and the agency during the child’s placement. In the case of a voluntary surrender, the parents voluntarily and permanently give up all parental rights and transfer “custody and guardianship” to an authorized agency. Foster Care Data Definition Children in foster care are children and youth who are in the care and custody of the Commissioner of the local Department of Social Services on December 31 of a given year. The foster care settings for this “24-hour substitute care for children placed away from their parents or guardians” (U.S. DHHS, 2005) include, but are not limited to: Other care: Emergency Shelters, Residential Treatment Facilities (RTF) and Intermediate Care Facilities (ICF). Home care: nonrelative foster family homes and pre-adoptive homes; Relative care: relative foster homes; Congregate care: group homes, emergency shelters, residential facilities, Agency Operated Boarding Homes, Group Residences, Supervised Independent Living Programs; and, Figure 53 presents a “point in time” percentage of children birth to 17 years in the care and custody of the Commissioner of the local Department of Social Services on December 31, 2004. What the Data Show In New York State in 2004, 26.1 percent of children in foster care were under the age of 6. They represent 7,355 of the 28,229 children in foster care at that time (Figure 53). In New York City in 2004, 27.4 percent of foster care children were under 6 years old. This represents 4,797 of the 17,525 children in placement at that time (Figure 53). Figure 53. Children in Foster Care by Age: NYS, NYC and ROS, 2004. (Source: Bureau of Management Information, 2006) 73.9% 72.6% 26.1% 27.4% NYS NYC 76.1% 23.9% ROS Greater Than 5 Years Old 5 Years Old or Younger See page 69 for references. Strong Families — 65 Child Abuse and Maltreatment Why This Is Important Child abuse and neglect is not discriminatory—it crosses all social, ethnic, and economic lines. However, according to the Centers for Disease Control and Prevention’s National Center for Injury Prevention and Control (2006), children younger than four years of age are at the greatest risk for severe injury or death due to abuse or maltreatment. Most cases of child abuse are not caused by inherently violent or evil people, but by parents or caregivers who are unable to cope with their tempers in a time of crisis (Prevent Child Abuse New York, 2006). Protective factors such as a supportive family environment, nurturing parenting skills, stable family relationships, parental employment, adequate housing, and access to health care and social services act to lessen the risk of child abuse and maltreatment (CDC, 2006). In addition to the immediate trauma of abuse and neglect on children, the Child Welfare Information Gateway (2006) identified some of the long-term consequences for the children, families, and societies, including: Physical—Severe physical abuse or neglect can result in chronic health problems, broken bones, brain trauma, or even death. Psychological—Emotional effects can include fear, inability to trust, depression, anxiety, and difficulties in forming relationships. Behavioral—Studies have found that abused and neglected children are at increased risk of experiencing such problems as delinquency, teen pregnancy, low academic achievement, and substance abuse (Kelley et al., 1997), to be arrested as a juvenile and involved in adult or violent crime (Widom & Maxfield, 2001), and to eventually victimize their own children (Prevent Child Abuse NY, 2006). Societal—The direct costs (e.g., law enforcement, child welfare system and health costs) and indirect costs (e.g., juvenile and adult criminal activity) were recently estimated at more than $94 billion per year for the United 66 — NYS Early Childhood Data Report States and more than $2.4 billion per year for New York State (Prevent Child Abuse America, 2001). As noted by the National Scientific Council on the Developing Child (2005), persistent stress resulting from child maltreatment for young children can disrupt early brain development and impair development of the nervous and immune response systems. It is, however, difficult to distinguish the extent to which these effects are caused by the child’s experience with abuse and neglect, the disruptions that often accompany service interventions (such as multiple residential placements), or the presence or absence of other factors in the child’s developmental experiences (Chalk, Gibbons & Scarupa, 2002). Child Abuse and Maltreatment Data Definition Child abuse and maltreatment represent an impairment or imminent danger of impairment of a child’s physical, mental or emotional condition due to the failure of a parent, guardian or other person legally responsible for the child to exercise a minimum degree of care toward the child. This can involve the failure to provide a minimum degree of care regarding a child’s basic needs, such as food, clothing, shelter, medical care, education, or proper supervision or guardianship. It can also involve the parent or other legally responsible person’s use of excessive corporal punishment, the abuse or misuse of drugs or alcohol, and abandonment of a child (U.S. DHHS, 2006). In New York State, children who are suspected of being abused or maltreated become the subject of a report to the State Central Registry (SCR). Reports to the SCR are transmitted electronically to local Social Services District (SSD) child protective service (CPS) units for investigation and assessment of risk of harm and services needed. The CPS caseworker determines whether a child named in an SCR report has been abused or maltreated and whether the child is at imminent risk of harm by remaining in the home and at immediate risk of foster care placement. If deemed necessary, CPS may remove children on an emergency basis, at or before submitting a petition of abuse and neglect to Family Court, or after the Court investigates the evidence and issues a disposition (decision) ordering the removal. Removal, based on the perceived threat to a child’s safety and well-being, can occur at any time while a child abuse and neglect case is open. Figure 54 presents the percentage of unique children. This unique number, within New York City or Rest of State, means that a child is counted only once during a year even if that child has more than one indicated abuse or maltreatment. What the Data Show In New York City in 2004, just fewer than 33 percent (32.9 percent) of unique children indicated in confirmed allegations of abuse or maltreatment were five years old or younger. (Figure 54). In Rest of State in 2004, 34.3 percent of unique children indicated in confirmed allegations of abuse or maltreatment were five years old or younger. (Figure 54). Figure 54. Unique Children With Confirmed Allegations of Abuse or Maltreatment by Age: NYC and ROS, 2004. (Source: Office of Children and Family Services Data Warehouse, 2007) 67.1% 65.7% 32.9% 34.3% NYC ROS Greater Than 5 Years Old 5 Years Old or Younger See page 70 for references. Strong Families — 67 Chapter 2 References Poverty, pages 46-47 2005 American Community Survey. (2007a). Table B17001 Poverty Status in the past 12 months by sex by age—Universe: Population for whom poverty status is determined. U.S. Census Bureau. Retrieved June 20, 2007 from http://factfinder.census.gov. 2005 American Community Survey. (2007b). Table B17006 Poverty Status in the past 12 months of related children under 18 years by family type by age of related children under 18 years—Universe: Related children under 18 years. U.S. Census Bureau. Retrieved June 20, 20067 from http://factfinder.census.gov. Betson, D.M., and Michael, R.T. (1997). Why so many children are poor. In: The Future of Children: Children and Poverty (Vol. 7 No. 2, pp 25-39). Center for the Future of Children, The David and Lucile Packard Foundation. USA. Brooks-Gunn, J., and Duncan, G.J. (1997). The effects of poverty on children. In: The Future of Children: Children and Poverty (Vol. 7 No. 2, pp 55-71). Center for the Future of Children, The David and Lucile Packard Foundation. USA. Lewit, E.M., Terman, D.L., and Behrman, R.E. (1997). Children and poverty: Analysis and recommendations. In: The Future of Children: Children and Poverty (Vol. 7 No. 2, pp.4-24). Center for the Future of Children, The David and Lucile Packard Foundation. USA New York State Kids’ Well-being Indicators Clearinghouse (KWIC). (2007). KWIC Indicator and Narrative for: Children and Youth Living Below Poverty. Retrieved June 26, 2007 from www.nyskwic. org/access_data/demo_profile.cfm. NYS Council on Children and Families. (1988). State of the Child in New York State. Albany, NY: Author. NYS Council on Children and Families. (2005). New York State Touchstones: KIDS COUNT 2005 Data Book. Albany, NY: Author. U.S. Census Bureau. (2007). Poverty Thresholds 2005: Poverty Thresholds for 2005 by Size of Family and Number of Related Children Under 18 Years (Dollars). Retrieved June 20, 2007 from http://www.census.gov/hhes/www/poverty/threshld/thresh05. html. Family Structure, pages 48-49 Child and Adolescent Health Measurement Initiative. (2005). National Survey of Children’s Health, Data Resource Center on Child and Adolescent Health website. Retrieved July 26, 2007 from www. nschdata.org. Ooms, T. (2002). Couples and Marriage Series: Marriage and Government: Strange Bedfellows? Center for Law and Social Policy; Policy Brief. No.1. Retrieved July 26, 2007 from www.clasp.org. Parke, M. (2003). Are married parents really better for children? What research says about the effects of family structure on child well-being. Center for Law and Social Policy. Available at www. clasp.org. Grandparents as Primary Caregiver, pages 50-51 NYS Council on Children and Families. (2003). Grandparents as Caregivers: A NYS Census 2000 Brief. Author: Albany, NY. 68 — NYS Early Childhood Data Report 2005 American Community Survey. (2007). Special Data Run from American Community Survey Public Use Data File. Personal Communication with Population Reference Bureau, August 6, 2007. Note: In 2003, the NYS Council on Children and Families published a Special TouchstonesReport titled ‘Grandparents as Caregivers’. The text for this section was extracted from this publication. For the full report go to: http://www.ccf.state.ny.us/resources/Touchstones/GPCensusBrief.pdf Adolescent Pregnancy, pages 52-53 Centers for Disease Control and Prevention (CDC). (2007). Adolescent Reproductive Health: Teen Pregnancy. Retrieved May 24, 2006 from www.cdc.gov/reproductivehealth.AdolescentReproHealth/index.htm. Kirby. D. (1997). No Easy Answers: Research Findings on Programs to Reduce Teen Pregnancy. Washington, DC: The National Campaign to Prevent Teen Pregnancy. New York State Kids’ Well-being Indicator’s Clearinghouse. (2006). KWIC Indicator Profiles: Adolescent Pregnancies by Age: 10-14 Years, 15-17 Years, and 15-19 Years. Retrieved May 24, 2006 from www.nyskwic.org/access_data/ind_profile.cfm?/. Rosengard, C., Pollock, L., Weitzen, S., Meers, A., & Phipps, M.G. (2006). Concepts of the advantages and disadvantages of teenage childbearing among pregnant adolescents: A qualitative analysis. Pediatrics, 118(2), 503-510. Postpartum Depression, pages 54-55 Centers for Disease Control and Prevention. United States Department of Health and Human Services. (2006). Pregnancy Risk Assessment Monitoring System (PRAMS): Methodology. Retrieved May 24, 2006 from www.cdc.gov/PRAMS/methodology.htm. Moline, M. L., Kahn, D.A., Ross, R.W., Altshuler, L.L., and Cohen, L.S. (2001). Postpartum depression: A guide for patients and families. A Postgraduate Medicine Special Report: Expert Consensus Guideline Series. March 2001, 112-113. National Institutes of Health. United States Department of Health and Human Services. (2005). Understanding Postpartum Depression: Common but Treatable. News In Health, December 2005. Retrieved May 22, 2006 from www.newsinhealth.nih.gov. New York State Department of Health. (2005). Pregnancy Risk Assessment Monitoring System (PRAMS). Retrieved May 25, 2006 from www.health.state.ny.us/statistics/prams/index.htm. Public Health Information Group. (2006). Unpublished PRAMS Data: Postpartum Depression. New York State Department of Health, Center for Community Health. The National Women’s Health Information Center. United States Department of Health and Human Services, Office of Women’s Health. (2005). Depression during and after pregnancy. Retrieved May 24, 2006 from www.womenshealth.gov/faq/postpartum.htm. Chapter 2 References WIC Program Participation, pages 56-57 New York State Department of Health. (2005). WIC Program— Women, Infants, Children. Retrieved May 31, 2006 from http:// www.health.state.ny.us/prevention/nutrition/wic/index.htm. New York State Department of Health. (2007). Children Eligible and Served by WIC: Special Data Run. Personal Communication with WIC Program Evaluation and Analysis Unit September 4, 2007. United States Department of Agriculture (USDA). Food and Nutrition Service. (2004). About WIC: How WIC Helps. Retrieved May 31, 2006 from http://www.fns.usda/wic/aboutwic/howwichelps.htm. United States Department of Agriculture (USDA). Food and Nutrition Service (2006). Food and Nutrition Service: Nutrition Program Facts: WIC The Special Supplemental Nutrition Program for Women, Infants, and Children. Retrieved May 31, 2006 from http://www.fns.usda.gov/fns. Food Insecurity, pages 58-59 Cook, J.T., et al. (2004). Food insecurity is associated with adverse health outcomes among human infants and toddlers. [Electronic version]. Journal of Nutrition. 134:1432-1438. Food Research and Action Center. (2006). State of the States: 2006, A Profile of Food and Nutrition Programs across the Nation. Retrieved May 12, 2006 from www.frac.org. National Center for Children in Poverty (NCCP). (2004). Parental Employment in Low-Income Families. Retrieved May 4, 2006 from www.nccp.org. Child Care Subsidies, pages 62-63 ChildTrends. (2006). ChildTrends Data Bank: Secure Parental Involvement. Retrieved May 4, 2006 from www.childtrendsdatabank.org. Kreader, J.L. (2005). Introduction to Child Care Subsidy Research. Child Care and Early Education Research Connections: Reviews of Research, October 2005. Retrieved August 10, 2007 from www. childcareresearch.org. Lawrence, S., and Kreader J.L. (2005). Predictors of Child Care Subsidy Use – Research Brief. Child Care and Early Education Research Connections, December 2005. Retrieved June 5, 2006 from www.childcareresearch.org. National Center for Children in Poverty. (2007). State Early Childhood Policies: Highlights from the Improving the Odds for Young Children Project. Retrieved July 6, 2007 from www.nccp.org. Schaefer, S.A., Kreader, J.L., and Collins, A.M. (2005) Predictors of Child Care Subsidy Use—Literature Review. Child Care and Early Education Research Connections, October 2005. Retrieved June 6, 2006 from www.childcareresearch.org. Wunderlich, G.S. & Norwood, J.L. (Eds.). (2006). Food Insecurity and Hunger in the United States: An Assessment of the Measure. Panel to Review the U.S. Department of Agriculture’s Measurement of Food Insecurity and Hunger, Committee on National Statistics, Division of Behavioral and Social Sciences and Education, National Research Council. Washington, DC: The National Academies Press. Foster Care, pages 64-65 Nord, M., Andrews, M., & Carlson, S. (2005). Household Food Security in the United States, 2004. A Report from the Economic Research Service. United States Department of Agriculture; Economic Research Report, Number 11. Retrieved July 26, 2007 from www.ers.usda.gov. Chipungu, S.S. & Bent-Goodley, T.B. (2004). Meeting the challenges of contemporary foster care. In S. Bass (Ed.), Children, Families, and Foster Care (pp. 75-93). From The Future of Children, a publication of the David and Lucile Packard Foundation. Parental Employment, pages 60-61 Halfon, N.G., Mendonca, A., & Berkowitz, G. (1995). Health status of children in foster care: The experience of the center for the vulnerable child. Archives of Pediatrics & Adolescent Medicine 149: 386-192. Annie E. Casey Foundation. (2006). Kids Count Data Book 2005: State Profiles of Child Well-Being. Baltimore, MD: Author. Centers for Disease Control and Prevention (CDC). (2006). National Center for Injury Prevention and Control. Child maltreatment: Fact sheet. Retrieved May 2, 2006 from www.cdc.gov/ncipc/factsheets/cmfacts.htm. ChildTrends. (2006). ChildTrends Data Bank: Secure Parental Involvement. Retrieved May 4, 2006 from www.childtrendsdatabank.org. Federal Interagency Forum on Child and Family Statistics. (2005). America’s Children: Key National Indicators of Well-Being, 2005. Federal Interagency Forum on Child and Family Statistics, Washington, DC: U.S. Government Printing Office. Harvey, E. (1999). Short-term and long-term effects of early parental employment on children of the National Longitudinal Survey of Youth. Developmental Psychology, 35 (2), 445-459. American Academy of Child & Adolescent Psychiatry. (2002). Facts for Families: Foster Care, No. 64. Retrieved May 25, 2006 from www.aacap.org/publications/factsfam/64.htm. Bureau of Management Information. (2006). Unpublished New York State Foster Care Data. Office of Children and Family Services. Green, R, Summers, A., & Cohen, M. (2005). Medicaid spending on children in foster care. Washington, DC: The Urban Institute. U.S. Department of Health and Human Services (DHHS). (2005). Child Maltreatment 2003. Administration on Children, Youth and Families. Washington, DC: U.S. Government Printing Office. Silver, J. A., Amster, B.J., & Haecker, T. (Eds). (1999). Young children and foster care. Baltimore, MD: Paul H. Brookes Publishing Co. Wulczyn, F., Barth, R.P., Yuan, Y.T., Harden, B.J., & Landsverk, J. (2005). Beyond common sense: Child welfare, child well-being, and the evidence for policy reform. New Brunswick, NJ: Transaction Publishers. Wulczyn, F., Zeidman, D., & Svirsky, A. (1997). Homebuilders: A family reunification demonstration project. In J.D. Berrick, R.P. Barth, & N. Gilbert (Eds). Child Welfare Research Review, Volume II. New York: Columbia University Press. Strong Families — 69 Chapter 2 References Child Abuse and Maltreatment, pages 66-67 Centers for Disease Control and Prevention (CDC). (2006). National Center for Injury Prevention and Control. Child Maltreatment: Fact Sheet. Retrieved June 22, 2006 from www.cdc.gov/ncipc/factsheets/cmfacts.htm. Chalk, R., Gibbons, A., & Scarupa, H.J. (2002). The multiple dimensions of child abuse and neglect: New insights into an old problem. Child Trends Research Brief. Washington, DC: Child Trends. Child Welfare Information Gateway. (2006). Long-term consequences of child abuse and neglect. Retrieved July 2006 from www. childwelfare.gov/pubs/factsheets/long_term_consequences.cfm. Kelley, B.T., Thornberry, T.P. & Smith, C.A. (1997). In the wake of childhood maltreatment. Washington, DC: National Institute of Justice. National Scientific Council on the Developing Child. (2005). Excessive stress disrupts the architecture of the developing brain. Working Paper No. 3. Waltham, MA: National Scientific Council on the Developing Child. Office of Children and Family Services Data Warehouse. (2007). Unpublished New York State Child Abuse and Maltreatment Data. Office of Children and Family Services. Prevent Child Abuse America. (2001). Total estimated cost of child abuse and neglect in the United States. Retrieved June 2006 from http://member.preventchildabuse.org/site/DocServer/cost_analysis.pdf?docID="144”. Prevent Child Abuse New York. (2003). The Costs of Child Abuse and the Urgent Need for Prevention. Retrieved June 27, 2007 from www.pca-ny.org/pdf/cancost.pdf . Prevent Child Abuse New York. (2006). About Child Abuse. Retrieved June 20, 2006 from www.preventchildabuseny.org. U.S. Department of Health and Human Services (DHHS). (2006). 2006 Child Abuse Prevention Community Resource Packet, Section 1012(f) of the Family Court Act. Administration for Children and Families. Washington, DC: National Clearinghouse on Child Abuse and Neglect Information. Widom, C.S. & Maxfield, M.G. (2001) An update on the ‘cycle of violence’. Washington, DC: National Institute of Justice. 70 — NYS Early Childhood Data Report Chapter 3: Early Learning T he years from birth through five are the most extraordinary period of growth and development in a child’s lifetime. Children enter the world completely dependent on adults, and within a critical five year period, they are shaped and molded into individuals capable of communicating with, learning from, and interacting with those around them. Early experiences set a critical foundation for future learning. While parents remain children’s earliest and most important teachers, the significance of early care and education services —including both center-based and family-based child care, Early Head Start, Head Start, and Universal prekindergarten programs, preschool programs, and other settings—continues to grow as parents of young children spend more time in the workforce. The arrangements that families make for their children can vary tremendously depending on the needs of the child Outcomes: Indicators: Children have positive and consistent attachments to parents, caregivers, and educators. Language Development Caregivers and other providers have the knowledge, skills, confidence, and social supports to nurture the health, safety, and positive development of children. Prekindergarten Early learning includes cognitive development and skills as well as social-emotional development, emphasizing the essential roles and relationships with parents and other caregivers; it also includes physical and motor development, approaches to learning and language, communication and literacy. Families have access to high quality, developmentally-appropriate early care and education. and the family. However, each of the care arrangements that a child experiences should be of high quality and should help promote healthy development. Early brain research is clear: a child’s dayto-day experiences affect brain development and these early experiences influence every child’s development. Head Start Early Intervention Preschool Special Education Parental Role in Early Learning Families and caregivers support children’s early literacy. Parents, caregivers, and educators communicate regularly about children’s learning and development. NYS Early Childhood Data Report — 71 Language Development Why This Is Important Over the past two decades, the number of Americans who speak a language other than English at home has increased, as has the number of individuals with limited English proficiency (The Commonwealth Fund, 2005; U.S. Census Bureau, 2000). Limited English proficiency has an effect on the health and well-being of children. Previous research has shown that there is an association between having limited English proficiency and disparities in children’s health and health care (The Commonwealth Fund, 2005). For example, in a 2005 study by Flores and colleagues (2005), it was discovered that parents limited in English are three times more likely than parents who report speaking English very well to have a child in fair or poor health. In addition, parents with the lowest language proficiency may be less aware that their child’s status or care is not optimal, or they may feel less entitled to care due to recent immigration status or prior discrimination (The Commonwealth Fund, 2005). are the extent to which their household is linguistically isolated and their mother’s ability to speak English. they spoke a language other than English were asked to indicate their ability to speak English in one of the following categories: very well, well, not well, or not at all. Children of parents with limited English ability often face barriers when obtaining needed medical care such as cost, transportation, difficulty making appointments, insurance status, and physicians’ office staff not understanding the family’s culture (Flores et al., 2005; The Commonwealth Fund, 2005). Children living in linguistically isolated households are likely to experience these same disparities. Data Definition Language acquisition and development is the gradual process by which there is an expansion in complexity, meaning, perception, and interpretation of symbols and sounds. Occurring in the context of social interaction within a child’s family structure, language development begins with the production of recognizable sounds around the age of one year and continues intensively throughout the preschool period (Tabors, 1997). Most of the basic skills of oral language are acquired by the time a child is about five years old, though more advanced uses of language may continue to be acquired into adulthood (Tabors, 1997). Two factors which play a role in children’s language development A linguistically isolated household is one in which no member 14 years old and over: 1) speaks only English or 2) speaks a non-English language and speaks English very well. In other words, all members 14 years old and over have at least some difficulty with English (U.S. Census Bureau, 2000). An individual with limited English proficiency is one who does not speak English as her primary language and has a limited ability to read, write, speak, or understand English. The data on ability to speak English is drawn from the U.S. Census. Persons who reported 72 — NYS Early Childhood Data Report Figure 55 presents the percentage of children birth to 5 years living in linguistically isolated households in New York State, New York City and Rest of State for 2000. Figure 56 presents the percentage of mothers of children birth to 5 years rating their own ability to speak English as not well or not at all in NYS, NYC and ROS in 2000. Language Development What the Data Show In New York State in 2000, almost 10 percent of children ages birth to 5 years were living in a linguistically isolated household. With 18.6 percent of children birth to 5 years living in a linguistically isolated household, New York City accounted for much of this. In Rest of State, just under 4 percent of children birth to 5 years were living in a linguistically isolated household (Figure 55). In New York State in 2000, almost 8 percent of mothers with children under the age of six rated their own ability to speak English as not well or not at all. In New York City, 15 percent of mothers rated their ability to speak English as not well or not at all. At less than 3 percent, Rest of State had a considerably lower percentage of mother’s rating their own ability to speak English as not well or not at all (Figure 56). Figure 55. Children Birth to 5 Years Living in Linguistically Isolated Households: NYS, NYC and ROS, 2000. (Source: U.S. Census Bureau, 2000) NYS 9.8% NYC ROS 18.6% 3.6% Figure 56. Mothers of Children Birth to 5 Years Rating Own Ability to Speak English as Not Well or Not at All: NYS, NYC and ROS, 2000. (Source: U.S. Census Bureau, 2000) NYS 7.9% NYC ROS 15.0% 2.9% See page 84 for references. Early Learning — 73 Head Start Why This Is Important Research has shown that early experiences set a critical foundation for future learning (Bassok et al., 2004; Center for Early Care and Education, 2004). While parents remain children’s earliest and most important teachers, the significance of early care and education services continues to grow. Starting at very young ages, early care and education environments can greatly affect children and their families. Stable, high quality early care and education can prepare children cognitively and socially for school and it can help parents find and keep jobs, which in and of itself, affects the health and well-being of young children (Behrman, 1996). There are numerous types of early care and education settings that serve children under the age of 6— center-based or family-based child care, Early Head Start and Head Start programs, prekindergarten and kindergarten, among other settings. While all settings provide care and education, some are designed solely as educational interventions to promote children’s cognitive and social development, and others are designed primarily to care for children so parents can work (Bassok et al., 2003). According to the National Center for Infant and Early Childhood Health Policy, it is no longer meaningful to distinguish between early care and education settings that emphasize nurturing and those that promote learning (Bassok et al., 2004). All early care and education settings play a role in promoting development, safety, nurturing and dependable relationships, and interactions that promote learning (Bassok et al., 2004). The Head Start Impact Study, a federally-mandated study which quantifies the impact of Head Start separately for 3- and 4-year-old children across child cognitive, social-emotional, and health domains as well as on parenting practices, has found small to moderate effects favoring children enrolled in Head Start for some outcomes in each domain (U.S. DHHS, 2005). More specifically, some of the preliminary results from the first year of data collection include positive effects on prereading skills, parent-reported perceptions of literacy, the receipt of oral health care, the extent to which parents reported reading to children and exposing them to a variety of cultural enrichment activities, and a reduction in the frequency and severity of problem behaviors in 3-year-olds enrolled in Head Start (U.S. DHHS, 2005). Early Head Start impact studies have had similar findings. For example, 2-year-old children with at least one year of Early Head Start performed better on measures of cognitive, language, and socioemotional development than their peers who did not participate (Hamm and Ewen, 2006). Parents of children enrolled in Early Head Start also performed better on measures of parenting, the home environment, and knowledge of child development, they were more likely to participate in job training and education and to be employed in comparison to families not involved in Early Head Start (Hamm and Ewen, 2006). Data Definition Since 1965, Head Start has provided comprehensive developmental services to low-income children 3 to 5 years of age and their families (U.S. DHHS, 2003). In 1994, the Early Head Start program was established to extend services to pregnant women and child birth to 3 years of age. Adhering to specific program performance standards, Head Start and Early Head Start programs are designed to foster healthy development in low-income children aged 3 to 5. Head Start programs provide a full range of individualized services in the areas of education and early childhood development, medical, dental, and mental health, nutrition, and parent involvement (U.S. DHHS, 2003). Early Head Start Programs, which target low-income pregnant women and families with children up to age 3, promote healthy 74 — NYS Early Childhood Data Report prenatal outcomes, enhance the development of infants and toddlers, and encourage healthy family functioning (U.S. DHHS, 2003). In addition to Head Start and Early Head Start programs, there are also American Indian Head Start and Early Head Start programs and Migrant Head Start programs (Kids Count, 2007). While services Head Start Data Definition (cont.) are identical to Head Start programs, American Indian Head Start programs are encouraged to integrate language and native cultures into their curriculum and program goals and Migrant Head Start programs structure their services and programs to meet the specific needs of migrant farm worker families (Kids Count, 2007). All Head Start and Early Head Start programs are administered through the U.S. Department of Health and Human Services, Administration for Children and Families. Figure 57 represents children of each age group (<1-, 1-, 2-, 3-, 4-, and 5- years old) as a percentage of the total actual enrollment of children in Head Start and Early Head Start programs in New York State during the 20052006 enrollment year. Figure 58 represents children of each race/ethnicity (Hispanic/Latino, African American/Black, White, American Indian/Alaskan Native, Asian, Bi-racial/multi-racial, Native Hawaiian/Pacific Islander, Other, and Unspecified) as a percent of total actual enrollment in Head Start and Early Head Start Programs in New York State during the 2005-2006 enrollment year. Beginning in the 2004-2005 enrollment year, Head Start and Early Head Start Program Information Reports (an extensive, annual, federally mandated survey of all Head Start and Early Head Start programs in the United States) used a new definition of race, which is now consistent with the terminology used by the U.S. Census Bureau (Kids Count, 2007). Unspecified race means that no racial information was available for these enrollees. The data presented in Figure 57 and Figure 58 incorporates information from all Head Start and Early Head Start programs, including American Indian Head Start and Migrant Head Start program data. What the Data Show Over 56,000 children (56,732) were enrolled in Head Start and Early Head Start programs in New York during the 20052006 enrollment year (data not shown). The majority of children enrolled in Head Start and Early Head Start programs were between the ages of 3 and 4 (38.8 percent and 50.4 percent, respectively) (Figure 57). In 2005-2006, over 32 percent of Head Start and Early Head Start enrollees in New York State were identified as being of Hispanic or Latino origin. Enrollees who were identified as African American/ Black or White comprise over half of Head Start and Early Head Start enrollees (31.2 percent and 27.3 percent, respectively) (Figure 58). Figure 57. Total Actual Enrollment of Children in Head Start and Early Head Start by Age of Child Served: NYS, 2005-2006 Enrollment Year. (Source: Annie E. Casey Foundation, 2007) 4 Years, 50.4% 3 Years, 38.8% 5 Years, 3.2% < 1 Year, 1.8% 1 Year, 2.3% 2 Years, 3.4% Figure 58. Total Actual Enrollment in Head Start and Early Head Start by Race/Ethnicity of Enrollee: NYS, 2005-2006 Enrollment Year. (Source: Annie E. Casey Foundation, 2007) 32.4% Hispanic/Latino 31.2% Black/African American 27.3% White Bi-racial/Multi-racial 3.8% Asian 3.8% American Indian/Alaskan Native 0.6% Native Hawaiian/Pacific Islander 0.4% Other 0.3% Unspecified 0.2% See page 84 for references. Early Learning — 75 Prekindergarten Why This Is Important Evidence from numerous evaluations of high quality early education programs has shown that children who attend preschool advance in intellectual, social and emotional competence in the short-term, do better academically in both reading and math, and socially in school, and generally live more productive lives as adults in comparison to children who have no preschool education or have a poor early educational experience (Center for Early Care and Education, 2004). Long-term effects have shown that on average, children provided with high quality early childhood education have higher academic achievement, lower grade retention rates in school, lower special education placement in school, higher graduation rates, and lower delinquency rates (Bassok et al., 2003). Universal Prekindergarten can be provided in a number of settings including public schools, Head Start programs, day care centers, nursery schools, nonpublic schools, family child care environments, and approved special education providers. The 2007-2008 State budget saw a substantial increase in Universal Prekindergarten funding with $145 million dollars being approved to continue to serve 4year-olds and to add to the number of children served by the program. Such an investment supports recent research showing that Universal Prekindergarten returns about half of its costs in later savings to school systems while at the same time significantly benefiting children and their parents (Belfield, 2004). Data Definition In 1997, the Universal Prekindergarten, or UPK, Program was established in New York State. This program makes prekindergarten accessible to all 4-year-olds in the State (National Child Care Information Center, 2005). Local communities decide what criteria to use in selecting ageeligible children for enrollment, for example, from school year 1999 to 2002, economically disadvantaged children were given preference (National Child Care Information Center, 2005). Targeted prekindergarten offers services to a more specific population of those children in greatest need. Resources are often designated for children with particular characteristics or risk factors, such as living in a low-income family, being the child of a single or teen parent, having parents with low levels 76 — NYS Early Childhood Data Report of education, having a language other than English as their first language, or being born with a low birthweight (University of North Carolina at Chapel Hill, 2004). Figure 59 represents the number of children served by universal and targeted prekindergarten programs in New York State during the 20062007 school year. Prekindergarten What the Data Show In New York State during the 20062007 school year, 71,964 children were served by the Universal Prekindergarten program. Targeted prekindergarten programs served 13,908 children during 2006-2007 school year (Figure 59). Figure 59. Children Served by Universal and Targeted Prekindergarten Programs: NYS 2006-2007. (Source: NYS Education Department, 2007) 71,964 Universal Targeted 13,908 See page 84 for references. Early Learning — 77 Early Intervention Why This Is Important Early intervention services provide families with the skills necessary to care for their child, support and promote their child’s development, and include their child in family and community life (NYS Department of Health, 2000). In 2004, the National Early Intervention Longitudinal Study completed an assessment of family outcomes at the end of their involvement in Early Intervention and they found positive impacts for the children as well as their families. Children were found to have positive outcomes in functioning, general health and health care, behavior and developmental accomplishments (The National Early Intervention Longitudinal Study, 2002). Families of children receiving services have reported a high degree of satisfaction with early intervention programs and services and they perceive that the program is having a major impact on their child’s development as well as the healthy functioning of their family (Bailey et al., 2004). development” (Early Intervention Program, 1999). The program acts to empower families to meet their child’s and their own needs, and by entitling children, regardless of race, ethnicity, or income to services through the program (NYC Department of Health and Mental Hygiene, 2006). Early Intervention does this by offering a variety of services such as family education and counseling, home visits, parent support groups, speech pathology and audiology, physical therapy, psychological services, nursing services, nutrition services, social work services, vision services, and assistive technology devices and services (NYS Department of Health, 2006). To be eligible for services, children must be under the age of 3 and have a confirmed disability or established developmental delay in one or more areas of development. In some situations, the child may continue to receive services until they are 3 years and 8 months old. Data Definition The New York State Early Intervention Program is a statewide program that provides early intervention services to infants and toddlers with disabilities and developmental delay and their families (NYS Department of Health, 2000). First created by Congress in 1986 under the Individuals with Disabilities Education Act (IDEA), Early Intervention is administered by the New York State Department of Health (NYS Department of Health, 2006). The mission of the program is to “identify and evaluate as early as possible those infants and toddlers whose healthy development is compromised and to provide for appropriate interventions to improve child and family 78 — NYS Early Childhood Data Report Figure 60 presents the number of children under the age of 3 years and 8 months who have received at least one early intervention service through the Early Intervention Program between July 2005 and June 2006 in New York State, New York City, and Rest of State. Early Intervention What the Data Show In New York State, almost 73,000 children under the age of 3 years and 8 months received at least one Early Intervention service between July 2005 and June 2006. Just over half (38,178/52.5 percent) of these children were New York City residents (Figure 60). Figure 60. Children 3 Years, 8 Months and Under Receiving at Least One Early Intervention Service: NYS, NYC and ROS, July 2005-June 2006. (Source: Bureau of Early Intervention, 2007) 72,762 NYS NYC ROS 38,178 34,584 See page 84 for references. Early Learning — 79 Preschool Special Education Why This Is Important The goal of preschool special education is to provide a full continuum of preschool special education programs and services to students with disabilities and to include parents as full partners in the educational process for their child (NYS Education Department, 2003). Students are guaranteed these services in a least restrictive environment, which is an environment in which the needed instruction, services, and developmentally appropriate activities are delivered to meet the special education needs of the child while still allowing him to be educated with non-disabled peers to the maximum extent possible (NYS Education Department, 2003). These services may be provided at an approved or licensed prekindergarten, Head Start, work-site of a provider, the student’s home, a hospital, a state facility, or a child care location. Many children enrolled in the preschool special education program may have received early intervention services up until the age of 3 through the NYS Department of Health’s Early Intervention Program. Preschool special education begins where early intervention left off if a child is still in need of special education; or services begin with the preschool special education program if a child of preschool age did not receive early intervention services but has some delays or lags in development, such as difficulty in talking, moving around, thinking, learning, or is facing physical or behavioral challenges (NYS Education Department, 2006). Intervening early allows for an opportunity to enhance the child’s development, to provide support and assistance to the family, and to maximize the child’s and family’s benefit to society (U.S. Department of Education, 2006). Early intervention such as that exemplified by the Early Intervention and Preschool Special Education programs has been shown to increase the developmental and educational gains for the child, improve the functioning of the family, and reap long-term benefits for society (U.S. Department of Education, 2006). Data Definition The Preschool Special Education Program in New York State is overseen by the New York State Education Department’s Office of Vocational and Education Services for Individuals with Disabilities. The program provides evaluations and specially-designed individual and group instructional services or programs for eligible children who have a disability that affects their learning (NYS Education Department, 2006). A child of preschool age (3-5 years old) is eligible for special education services when he has a disability and exhibits a significant delay or disorder in one or more functional areas related to cognitive, language, and communicative, adaptive, socioemotional, or motor development which adversely affects his ability to 80 — NYS Early Childhood Data Report learn (NYS Education Department, 2005b). Figure 61 presents the number of children aged 3 to 5 years old enrolled in preschool special education programs in New York State, New York City, and Rest of State for the 2003-2004 school year. Preschool Special Education What the Data Show During the 2005-2006 school year in New York State, there were just over 67,000 children aged 3 to 5 receiving preschool special education (Figure 61). The majority of these children were enrolled in Rest of State preschool special education programs (43,492), and in New York City, 23,667 children aged 3 to 5 years received preschool special education during the 2005-2006 school year (Figure 61). Figure 61. Children 3 to 5 Years Receiving Preschool Special Education: NYS, NYC and ROS, 2005-2006. (Source: NYS Education Department, 2005a) 67,159 NYS NYC ROS 23,667 43,492 See page 85 for references. Early Learning — 81 Parental Role in Early Learning Why This Is Important Children’s success in learning is grounded by a family environment that encourages learning. Even when young children spend most of their waking hours in childcare, parents remain the most influential adults in their lives (Shonkoff & Phillips, 2000). Families provide the important relationships and experiences that stimulate and nurture young children’s learning, including cognitive and language development and emerging literacy. Because young children’s learning experiences unfold in the context of relationships, they are linked to, and dependent on, social-emotional development. Families with young children who are experiencing developmental delays or disabilities may require additional specific information, education, and support to enhance their children’s cognitive, language, and social development as a foundation for early learning. beginning in infancy. Children who experience literacy activities, such as frequent and varied book reading, and interesting conversations with new and unfamiliar words with adults have been shown to demonstrate higherlevel skills in language and literacy development at the kindergarten level (Dickinson & Tabors, 2001). Early literacy encompasses all the experiences children have had with language, books, and print, Data Definition The National Survey of Children’s Health included questions about the roles parents may play in a child’s early learning and development. Questions about daily reading habits and parental concern regarding a child’s learning, development, or behavior were included. The respondent was the parent or guardian in the household who was most knowledgeable about the health and health care of the children under 18 years of age. Data were collected between January 29, 2003 and July 1, 2004. Figure 62 presents the reported percentage of children under age 6 in New York State who are read aloud to by a parent or family member every day, 1 or 2 days, 3 or 4 days, 5 or 6 days, or no days at all during the week. 82 — NYS Early Childhood Data Report Figure 63 presents the percentage of children under age 6 in New York State whose parents reported they had at least one concern about their child’s learning, development or behavior. Parental Role in Early Learning What the Data Show In New York State in 2003, under 50 percent (48.4 percent) of parents of children under age 6 reported that their children are read to every day. Over 20 percent of parents of children under age 6 reported that they read aloud to their child two or fewer days per week, with nearly 10 percent reporting not reading to their child any days (Figure 62). In New York State between 2003 and 2004, 38.3 percent of parents with children under age 6 reported having a concern about their child’s learning, development, behavior, or ability to get along with others. The majority of respondents (61.7 percent) reported not having a concern (Figure 63). Figure 62. Number of Days a Week Children Under 6 Years Are Read Aloud to by a Parent or Family Member: NYS, 2003. (Source: Child and Adolescent Health Measurement Initiative, 2005) No Days, 9.9% 5 or 6 Days, 12.4% Every Day, 48.4% 3 or 4 Days, 17.9% 1 or 2 Days, 11.4% Figure 63. Children Under 6 Years Whose Parents Reported Having at Least One Concern About Their Child’s Learning, Development, Behavior or Ability to Get Along With Others: NYS, 2003-2004. (Source: U.S. Department of Health and Human Services, 2005) Have Concern(s), 38.3% Do Not Have Concern(s), 61.7% See page 85 for references. Early Learning — 83 Chapter 3 References Language Development, pages 72-73 Prekindergarten, pages 76-77 Flores, G., Abreau, M., and Tomany-Korman, S.C. (2005). Limited English Proficiency, Primary Language at Home, and Disparities in Children’s Health Care: How Language Barriers are Measured Matters. Public Health Reports, 120(4): 418-430. Bassok, D., Stipek, D., Inkelas M., and Kuo., A. (2003). Building State Early Childhood Comprehensive Systems Series, No. 11: Building Community Systems for Young Children: Early Childhood Education. National Center for Infant and Early Childhood Health Policy. Los Angeles, CA. The Commonwealth Fund. (2005). In the Literature: Limited English Proficiency, Primary Language at Home, and Disparities in Children’s Health Care: How Language Barriers are Measured Matters. Commonwealth Fund Pub. #845, July 2005. Tabors, P.O. (1997). One Child, Two Languages: A guide for preschool educators of children learning English as a second language. Baltimore, MD: Paul H. Brookes Publishing Co. United State Census Bureau. (2000). Census 2000: Summary File 3 Linguistically Isolated Households. Retrieved December 2005 from http://factfinder.census.gov. United States Census Bureau. (2004). American Community Survey: Household English Proficiency. Retrieved December 2005 from http://factfinder.census.gov. Head Start, pages 74-75 Annie E. Casey Foundation. (2007). Head Start and Early Head Start Data: Available Through the KIDS COUNT 2007 Head Start Excel File. Unpublished raw data. Bassok, D., Stipek, D., Inkelas M., and Kuo., A. (2003). Building State Early Childhood Comprehensive Systems Series, No. 11: Building Community Systems for Young Children: Early Childhood Education. National Center for Infant and Early Childhood Health Policy. Los Angeles, CA. Bassok, D., Stipek, D., Kuo, A., and Inkelas, M. (2004). Building State Early Childhood Comprehensive Systems Series: Early Childhood Education. National Center for Infant and Early Childhood Health Policy. Los Angeles, CA. Behrmann, R. (1996). Statement of Purpose. In: The Future of Children: Financing Child Care (Vol. 6, No. 2). The Center for the Future of Children, The David and Lucile Packard Foundation, Summer/Fall 1996. Center for Early Care and Education. (2004). Winning Beginning: New York’s Action Plan for Young Children and Families. Author: Albany, NY. Hamm, K, and Ewen, D. (2006). Head Start Series: From the Beginning Early Head Start Children, Families, Staff, and Programs in 2004. Policy Brief: Center for Law and Social Policy, Brief No. 7. United States Department of Health and Human Services (U.S. DHHS). (2003). Administration for Children and Families: Head Start Bureau. General Information. Retrieved June 28, 2006 from www.acf.hhs.gov/programs/hsb. United State Department of Health and Human Services (U.S. DHHS). (2005). Head Start Impact Study: First Year Findings. Administration for Children and Families: Washington, DC. 84 — NYS Early Childhood Data Report Belfield, C.R. (2004). Early Childhood Education: How Important are the Cost-Savings to the School System? In Research Briefing: The Pre-K Payback. Summary of research prepared for the Center for Early Care and Education, March 2004. Center for Early Care and Education. (2004). Winning Beginning: New York’s Action Plan for Young Children and Families. Author: Albany, NY. National Child Care Information Center. (2005). State and Locally Funded Universal Prekindergarten Initiatives. Retrieved July 17, 2006 from www.nccic.org/poptopics/univprek.html. New York State Education Department. (2007). Unpublished New York State Prekindergarten data. New York State Education Department. University of North Carolina at Chapel Hill. (2004). Prekindergarten Policy Framework. Section 6: Children Served. Retrieved August 18, 2006 from www.fpg.unc.edu. Early Intervention, pages 78-79 Bailey, D., Scarborough, A., Hebbeler, K., Spiker, D, and Mallik, S. (2004). National Early Intervention Longitudinal Study: Family Outcomes at the end of Early Intervention. NEILS Data Report No. 6. SRI International: Menlo Park, CA. Bureau of Early Intervention. (2007). Unpublished New York State Early Intervention Data. New York State Department of Health. NYS Department of Health. (2000). The Early Intervention Program: A Parent’s Guide. Albany, NY: Author. NYS Department of Health. (2006). Early Intervention Program. Retrieved June 30, 2006 from www.health.state.ny.us. Early Intervention Program. (1999) Clinical Practice Guideline: Report of the Recommendations. Communication Disorders, Assessment and Intervention for Young Children (Age 0-3 Years). New York State Department of Health. Albany, NY: Author. pp.: iv. New York City Department of Health and Mental Hygiene. (2006). Early Intervention. Retrieved June 30, 2006 from www.nyc.gov. The National Early Intervention Longitudinal Study. (2002). Results Experienced by Children and Families 1 Year after beginning Early Intervention. Section IV of 24th Annual Report to Congress. SRI International: Menlo Park, CA. Retrieved June 30, 2006 from http://www.ed.gov/about/reports/annual/osep/2002/section-iv.pdf. Chapter 3 References Preschool Special Education, pages 80-81 NYS Education Department. (2003). Office of Vocational and Educational Services for Individuals with Disabilities. Guide for Determining Eligibility and Special Education Programs and/or Services for Preschool Students with Disabilities: January 2003. Retrieved July 3, 2006 from www.vesid.nysed.gov.specialed/publicationss/preschool/guide. NYS Education Department. (2005)a. Unpublished New York State Preschool Special Education Data. System to Track and Account for Children (STAC) and Special Aids Unit: New York State Education Department. NYS Education Department. (2005)b. Office of Vocational and Educational Services for Individuals with Disabilities. The Transition of Children from The New York State Department of Health Early Intervention Program to The State Education Department Preschool Special Education Program or Other Early Childhood Services: February 2005. Retrieved July 3, 2006 from www.vesid. nysed.giv/specialed/publications/preschool/transition. NYS Education Department. (2006). Information for Parents of Preschool Students with Disabilities Ages 3-5. Retrieved July 3, 2006 from www.vesid.nysed.gov/specialed/publications/preschool/brochures. U.S. Department of Education. (2006). From: KidSource Online, Inc.: What is Early Intervention? Retrieved July 3, 2006 from www. kidsource.com. Parental Role in Early Learning, pages 82-83 Child and Adolescent Health Measurement Initiative (2005). National Survey of Children’s Health, Data Resource Center on Child and Adolescent Health website. Retrieved 11/30/06 from www. nschdata.org Dickinson D. and Tabors P. (Eds.). (2001). Beginning Literacy with Language: Young Children at Home and School. Baltimore, MD: Paul H. Brookes Publishing Co. Shonkoff, J.P. and Phillips, D.A. (Eds.). (2000). From Neurons to Neighborhoods: The Science of Early Childhood Development. Washington, D.C.: National Academy Press. United States Department of Health and Human Services. (2005). Health Resources and Services Administration, Maternal and Child Health Bureau. The National Survey of Children’s Health, 2003. Rockville, MD: United States Department of Health and Human Services. Retrieved June 2006 from www.mchb.hrsa. gov/thechild/states/newyork.htm. Early Learning — 85 Chapter 4: Supportive Communities B y age 5, most children have acquired the fundamental skills critical for school readiness and future developmental success. Essential to this foundation is the interrelationship between family, community, and state-level support systems. While family and the role that parents play in a child’s early life are the foremost influential factors on development, the support and positive reinforcement that external elements can provide enables parents to build and maintain the most secure, nurturing and learning environment for their children. At the community level, decisions are made, action is taken, and services are delivered to the children and families in need of Outcomes: Children, families, and other caregivers are supported by peers, workplace, community, and government. Families are involved in service planning, delivery, and evaluation at state and local level. Community supports and services recognize, respect and reflect strengths of families and cultures. Families are aware of and able to access all the supports and services they need. Communities provide children and families with healthy, safe and thriving environments to support their needs for physical, social, cognitive and emotional growth. them. It is not enough to have available a set of supports and services designed to address the needs of young children and their families. These services need to be easily accessible, coordinated, and most importantly, effective. Community characteristics, such as safety, social capital, and the presence of and access to quality health care and early learning services have a significant impact on children’s development. Thus, community assets, in the form of facilities, programs, and interested parties can provide children and families in need with an environment that supports and promotes healthy and ready-to-learn children. Programs, policies, and infrastructure support coordinated cross-sector service delivery. Indicators: Health, education, and human service providers that serve children and families have the knowledge and skills needed to promote positive child and family development. Crime Rates Neighborhood Environment Exposure to Risk Factors Child and family needs are anticipated and supports and services are available that focus on preventive and developmentally appropriate services. Early childhood services, programs, and policies are based on evidence, theory, and best practices. NYS Early Childhood Data Report — 87 Neighborhood Environment Why This Is Important The environment in which young children reside has a significant influence on the way that they live, learn, and grow. A community is a group of people who have common characteristics, and communities may be defined by location, race, ethnicity, age, occupation, interest in particular problems or outcomes, or other common bonds (McKenzie, Pinger, & Kotecki, 2002). A neighborhood is simply a community defined by location—it is the people who live near one another in a particular area or region. Thus, most, if not all, children are a member of a community or a neighborhood. Although research regarding the impact of neighborhoods and communities on young children is not extensive at this time, it is a growing area of interest due to young children’s increased exposure to and interaction with settings other than their home and with caregivers other than their parents. Neighborhood safety and support are qualities that parents with resources often spend a significant amount of time and energy looking into prior to a move or relocation to a new area. They look for good schools, housing options, safe parks, libraries, the availability of children’s programs and other elements within the community that they believe will affect their child’s safety, achievement, and friendships (Shonkoff and Phillips, 2000). Such efforts suggest that community and neighborhood conditions are important determinants of children’s experiences, opportunities, and therefore life chances (Shonkoff and Phillips, 2000). As it turns out, neighborhoods rich in these opportunities are often those that play a positive role in young children’s healthy development. Resource-poor areas, such as those with high-poverty rates, have been associated with environmental hazards (such as lead paint), violence, poor employment prospects for parents, a poor marriage pool, and high mobility into and out of an area—all characteristics which act against not only the perceived level of safety of the neighborhood, but the overall health and well-being of children (Shonkoff and Phillips, 2000). Research has shown that when moving from a high-poverty area to a low-poverty area the physical and psychological health of children is enhanced. In addition, youth living in poor neighborhoods are more likely to be arrested than those living in more affluent neighborhoods and there is also a reduction in the violent crime committed by adolescents (NYS Council on Children and Families, 1988; Shonkoff and Phillips, 2000). Although there are many more differences in children and families within neighborhoods than between them, it appears that neighborhoods matter most when there are other risk factors present for young children, such as family poverty or mental health problems that exist within the family (Shonkoff and Phillips, 2000). Therefore, when it comes to 88 — NYS Early Childhood Data Report children’s health and development, safe neighborhoods can act as protective factors. The term social capital can be used to describe the resources that are available to individuals through their membership in a community. High social capital has been found to have positive effects on the health and well-being of community members and, in areas with low levels of social capital, high mortality rates and poor health status have been consistently found (Kawachi, 2000). At the community level, social capital acts to promote health and well-being by providing a stress-buffer and social support through extra-familial networks, as well as informal social control over deviant health behaviors such as underage drinking and alcohol abuse (Kawachi, 2000). Neighborhoods in which parents and families are involved with one another and the community, where they share similar values and come into contact with one another are more likely to monitor the behavior of and potential dangers to children (Shonkoff and Phillips, 2000). Such contact among parents and families has the potential to increase community and neighborhood activities, which in turn, further connects them to the community in which they live, making for a safe and secure community environment that benefits young children and their families. Neighborhood Environment Data Definition The National Survey of Children’s Health included questions about the safety and supportiveness of children’s communities and neighborhoods. To determine the safety of a child’s community or neighborhood the following question was asked: How often do you feel (child’s name) is safe in your community or neighborhood? Figure 64 presents the percentage of survey respondents who reported that they felt their children were never safe, sometimes safe, or usually/always safe. Neighborhood supportiveness was derived from questions based on the following concepts: Do people in children’s neighborhoods help each other out? grouped as living in a supportive neighborhood. Do people in children’s neighborhoods watch out for each other’s children? Figure 65 represents the percentage of survey respondents who, based on the questions above, felt that their children lived or did not live in supportive neighborhoods. Are there people in children’s neighborhoods whom parents can count on? Are there adults in children’s neighborhoods who parents trust to help their children? Results for all of these questions were weighted to reflect the population of children ages birth to 5 years old, not the population of parents. Children of respondents who reported unfavorably (somewhat disagree or definitely disagree) to three of the four questions were identified as not living in supportive neighborhoods. Others were What the Data Show In 2003 in New York State, almost 77 percent of children birth to 5 years had parents that felt that their child was usually or always safe in their community or neighborhood, 18.6 percent had parents who felt that their child was sometimes safe in their community or neighborhood, and close to 5 percent had parents that felt that their child was never safe in their community or neighborhood (Figure 64). In 2003 in New York State, 73.3 percent of children birth to 5 years had parents who felt that they lived in a supportive neighborhood; almost 27 percent of children had parents who felt that they did not live in a supportive neighborhood (Figure 65). Figure 64. Perceptions of Children’s Safety in Communities Among Parents With Children Under 6 Years: NYS, 2003. (Source: Child and Adolescent Health Measurement Indicator, 2005) Figure 65. Children Under 6 Years Whose Parents Reported Living in Supportive Neighborhoods: NYS 2003. (Source: Child and Adolescent Health Measurement Indicator, 2005) Never Safe, 4.8% Do Not Live In Supportive Neighborhood, 26.7% Sometimes Safe, 18.6% Usually or Always Safe, 76.6% Live In Supportive Neighborhood, 73.3% See page 94 for references. Supportive Communities — 89 Crime Rates Why This Is Important Exposure to gun violence can have a serious impact on young children. Young children exposed to gun violence may experience negative short- and long- term psychological effects including anger, withdrawal, sleep disruption, post-traumatic stress, and desensitization to violence (Garbarino et al., 2002). Children who live in communities where violence is a common occurrence also experience a negative impact on their development—even if they are not directly exposed to violent activity. Similar to the effects of direct exposure to violence, the effects of high levels of violence in the community include nervousness, sleep problems, intrusive thoughts, anxiety, stress, loneliness, depression, grief, and antisocial behavior (Garbarino et al., 2002). These children may also experience a decline in cognitive performance and school achievement. Figure 66 presents the firearm- related index crime rate in NYS, NYC and ROS between 1993 and 2002. the best official indicators of the relative level of criminal activity throughout New York State. A distinction is made between violent and property offenses because crime trends for these two categories generally differ. Data Definition Index crimes include serious property and violent crimes reported or otherwise known to the police. Burglary, larceny, and motor vehicle theft are property index crimes and violent index crimes include murder, non-negligent manslaughter, forcible rape, robbery and aggravated assault (NYS Kids’ Well-being Indicators Clearinghouse, 2007b). New York State Uniform Crime Report (UCR) Index Crimes track whether a firearm was present during the commission of a murder, forcible rape, robbery or aggravated assault. A reported crime is recorded in the jurisdiction where it occurs, and only the most serious offense that was committed during a criminal incident is recorded. The firearm-related crime rate is the number of reported UCR crimes of murder, forcible rape, robbery or aggravated assault where a firearm was present divided by an estimate of the population of persons of all ages in the general population and multiplied by 1,000. Violent index crimes include murder, non-negligent manslaughter, forcible rape, robbery and aggravated assault. Property index crimes include burglary, larceny and motor vehicle theft. Similar to firearmrelated crime, a reported crime is recorded in the jurisdiction where it occurs, and only the most serious offense that was committed during a criminal incident is recorded. The crime rate is the number of report ed UCR index crimes divided by an estimate of the general population and multiplied by 1,000. There are no county-level victimization measures. This is not a measure of victimization because some crimes are not reported or otherwise known by the police. The number of property and violent UCR index offenses reported or otherwise known to the police are 90 — NYS Early Childhood Data Report Figures 67 and 68 present the property and violent index crimes known to police in NYS, NYC and ROS between 1993 and 2006. Crime Rates What the Data Show The violent index crime rate also decreased between 1993 and 2006. In New York State, the rate dropped from 10.6 per 1,000 in 1993 to 4.3 per 1,000 in 2006. Similar to the firearm-related index crime rate, much of the decline can be attributed to New York City rates which fell from 21.0 per 1,000 in 1993 to 6.3 per 1,000 in 2006 (Figure 68). 8 Rate per 1,000 6 4 2 0 1993 1994 1995 NYS 1996 1997 1998 NYC 1999 2000 2001 2002 ROS Figure 67. Property Index Crimes Known to Police: NYS, NYC and ROS, 1993 to 2006. (Source: Kids’ Well-being Indicators Clearinghouse, 2007c) 80 60 Rate per 1,000 Between 1993 and 2006, the rate of property index crime known to the police dropped from 45.1 per 1,000 persons to 20.2 per 1,000 in New York State. In New York City the rate dropped from 61.0 per 1,000 in 1993 to 18.7 per 1,000 in 2006, and Rest of State also showed a decline from 34.3 per 1,000 in 1993 to 21.3 per 1,000 in 2006 (Figure 67). Figure 66. Firearm-Related Index Crime Rate: NYS, NYC and ROS, 1993 to 2002. (Source: Kids’ Well-being Indicators Clearinghouse, 2007a) 40 20 0 1993 1994 1995 1996 1997 1998 1999 2000 2001 2002 2003 2004 2005 2006 NYS NYC ROS Figure 68. Violent Index Crimes Known to Police: NYS, NYC and ROS, 1993 to 2006. (Source: Kids’ Well-being Indicators Clearinghouse, 2007d) 24 18 Rate per 1,000 In New York State, the rate of firearm-related crimes dropped from 3.1 per 1,000 persons to 0.5 per 1,000 persons between 1993 and 2002. Much of this decline is due to the significant drop in New York City firearm-related index crime rates—from 6.8 per 1,000 in 1993 to 0.7 per 1,000 in 2002 (Figure 66). 12 6 0 1993 1994 1995 1996 1997 1998 1999 2000 2001 2002 2003 2004 2005 2006 NYS NYC ROS See page 94 for references. Supportive Communities — 91 Multiple Risk Factors Why This Is Important Research has shown that aspects of children’s behaviors, such as temperament, are established during the first five years of life (Wasserman et al., 2003). This foundation, coupled with children’s exposure to certain risk and protective factors influences the likelihood of children becoming delinquent at a young age (Wasserman et al., 2003). Risk factors such as having a single parent, living in poverty, having parents that do not speak English well or do not have a high school education, and living in a household where parents have no paid employment has been found to increase the likelihood that young children may encounter problems and may not reach their optimum potential. Risk factors act in a cumulative fashion; that is, the greater the number of risk factors, the greater the likelihood that a child will engage in delinquent or other risky behavior (Helping America’s Youth, 2007). Evidence also shows that problem behaviors associated with risk factors tend to cluster; for example, delinquency and violence cluster with other problems such as drug abuse, teen pregnancy and school misbehavior (Helping America’s Youth, 2007). New York State data representing the percentage of children experiencing multiple risks was collected from the 2006 American Community Survey. Risk factors for this data can be defined as any combination of the following: having a single parent, living in poverty, parents not speaking English well, parents having less than a high school education, and parents having no paid employment (NCCP, 2007). Data Definition A risk factor is any circumstance that increases the likelihood that a child will experience non-optimal outcomes, such as engaging in risky behaviors like substance abuse or delinquent conduct. Risk factors are not necessarily causal of such outcomes, but correlational (Helping America’s Youth, 2007). 92 — NYS Early Childhood Data Report Figure 69 presents the percentage of children under age 6 that are exposed to 0 risks, 1-2 risks, and 3 or more risks. Multiple Risk Factors What the Data Show In 2006, the majority of young children in New York State (57 percent) were exposed to zero risks. Thirty-three percent of young children were exposed to 1 or 2 risks, and 10 percent of young children in New York State were exposed to 3 or more risks (Figure 69). Figure 69. Young Children’s Exposure to Multiple Risk Factors: NYS, 2006. (Source: National Center for Children in Poverty, 2007) 3 or More Risks, 10 % 1-2 Risks, 33% 0 Risks, 57% See page 94 for references. Supportive Communities — 93 Chapter 4 References Neighborhood Environment, pages 88-89 Multiple Risk Factors, pages 92-93 Child and Adolescent Health Measurement Indicator (CAHMI). (2005). National Survey of Children’s Health. Data Resource Center on Child and Adolescent Health website. Retrieved September 21, 2005 from www.nschdata.org. Helping America’s Youth. (2007). Introduction to Risk Factors and Protective Factors. Community Guide: Risk and Protective Factors Program Tool. Retrieved October 21, 2007 from http://guide.helpingamericasyouth.gov/programtool.cfm. Kawachi, I. (2000). Social Capital. John D. and Catherine T. MacArthur Research Network on Socioeconomic Status and Health, University of California, San Francisco. Retrieved July 7, 2007 from www.macses.ucsf.edu. National Center for Children in Poverty. (2007). Improving the Odds: New York Early Childhood Profile. Retrieved October 17, 2007 from www.nccp.org. McKenzie, J.F., Pinger, R.R. & Kotecki, J.E. (2002). An Introduction to Community Health, Fourth Edition. Sudbury, MA: Jones and Bartlett Publishers. National Center for Health Statistics. (2006). State and Local Area Integrated Telephone Survey: National Survey of Children’s Health. Retrieved July 6, 2006 from www.cdc.gov/nchs. NYS Council on Children and Families. (1988). State of the Child in New York State. Albany, NY: Author. Shonkoff, J.P. and Phillips, D.A. (Eds.). (2000). From Neurons to Neighborhoods: The Science of Early Childhood Development. Washington, D.C.: National Academy Press. Crime Rates, pages 90-91 Garbarino, J., Bradshaw, C.P., and Vorrasi, J.A. (2002). Mitigating the Effects of Gun Violence on Children and Youth. In: The Future of Children Summer/Fall 2002: Children, Youth, and Gun Violence, 12(2). Retrieved July 7, 2006 from www.futureofchildren. org/pubs-info2825. NYS Kids’ Well-being Indicators Clearinghouse. (2007b). KWIC Indicator Narrative For: Property and Violent Index Crimes Known to the Police. Retrieved July 7, 2007 from www.nyskwic. org/u_indicators. NYS Kids’ Well-being Indicators Clearinghouse. (2007a) KWIC Indicator Profile: Crimes Known to the Police—Firearm Related Index Crimes, General Population. Retrieved July 7, 2007 from www. nyskwic.org/access_data. NYS Kids’ Well-being Indicators Clearinghouse. (2007c). KWIC Indicator Profile: Crimes Known to the Police—Property Index Crime, General Population. Retrieved July 7, 2007 from www.nyskwic. org/access_data. NYS Kids’ Well-being Indicators Clearinghouse. (2007d). KWIC Indicator Profile: Crimes Known to the Police—Violent Index Crimes, General Population. Retrieved July 7, 2007 from www.nskwic. org/access_data. 94 — NYS Early Childhood Data Report Wasserman, G.A., Keenan, K., Tremblay, R.E., Cole, J.D., Herrenkohl, T.I. Loeber, R. & Petechuk, D. (2003). Risk and Protective Factors of Child Delinquency. Child Delinquency Bulletin Series: Office of Juvenile Justice and Delinquency Prevention, Office of Justice Programs, U.S. Department of Justice. Retrieved October 18, 2007 from www.ojjdp.ncjrs.org. Data Sources Data Sources Used in This Report New York State Department of Health The Department of Health (DOH) ensures that high quality appropriate health services are available to all New York State residents at a reasonable cost. Department functions and responsibilities include: Promoting and supervising public health activities throughout the State; Ensuring high quality medical care in a sound and cost effective manner for all residents; Reducing infectious diseases such as food and waterborne illnesses, hepatitis, HIV, meningitis, sexually transmitted infections, tuberculosis, vaccine-preventable diseases and chronic disabling illnesses such as heart disease, cancer, stroke and respiratory diseases; and Directing a variety of health-related homeland security measures in conjunction with the Governor’s Office of Public Security. As part of this mission, the Department works with the State’s health care community to ensure appropriate readiness and response to potential public health threats. The Department of Health is also the principal State agency that interacts with the Federal and local governments, health care providers and program participants for the State’s Medicaid program. For more information about the New York State Department of Health: http://www.health.state.ny.us/. Maternal and Child Health Block Grant The New York State Maternal and Child Health Service Title V Block Grant Application and Annual Report has the primary purpose of making application to the Federal government for New York’s appropriation under the Maternal and Child Health Services Block Grant (Title V). Part of this application is a needs assessment which is a continuous and ongoing process that is critical to program development, accurate program planning and targeting of services and to monitoring the effectiveness of interventions. The needs assessment requires ongoing sources of information about maternal and child risk factors, access to appropriate health care and capacity of the health care system, and pregnancy and health outcomes. Data are available on statewide, countywide, and local levels. For more information about the Maternal and Child Health Block Grant Program: http://www.health.state.ny.us/nysdoh/ mchbg/index.htm/. Pregnancy Risk Assessment Monitoring System (PRAMS) The Pregnancy Risk Assessment Monitoring System (PRAMS) was developed in 1987 by the Centers for Disease Control and Prevention (CDC) as part of their initiative to reduce poor pregnancy outcomes. PRAMS is an ongoing, population-based surveillance system of maternal behaviors and experiences before and during pregnancy and shortly after delivery of a live-born infant. PRAMS provides an important supplement to data from vital records for planning and assessing perinatal health programs on a state level. Much of the data available from PRAMS are not obtainable from other sources and, therefore, provide unique insight into maternal and infant health issues in our state. The PRAMS questionnaire is sent out two to six months after delivery to a sample of approximately 150 mothers per month who are selected from the state’s live birth registry. A stratified random sampling approach is followed to ensure that the data are representative of the population and to permit comparisons among certain population subgroups. The sample is stratified by birth weight (<2500 g/>=2500g) with oversampling of low birth weight births. Only mothers residing outside New York City are included in the sample. Each woman is sent up to three copies of the questionnaire by mail. If a response is not received, attempts are made to contact the mother by telephone. For more information about the New York State Pregnancy Risk Assessment Monitoring System: http://www.health.state. ny.us/statistics/prams/index.htm. New York State Education Department The State Education Department (SED) is the administrative agency of the Board of Regents. The Department’s primary mission is to oversee public elementary and secondary education programs throughout New York and promote educational excellence, equity and cost-effectiveness. For more information about the New York State Education Department: http://www.nysed.gov/. Data Sources Used in This Report — 95 Data Sources New York State Office of Children and Family Services The Office of Children and Family Services (OCFS) was established in 1998 to improve the integration of services for New York’s children, youth, families and vulnerable populations and to promote their development and protect them from violence, neglect, abuse and abandonment. OCFS oversees the foster care system, adoption and adoption assistance, child protective services, preventive services for children and families, services for pregnant adolescents, child care and referral programs and protective programs for vulnerable adults. For more information about the Office of Children and Family Services in New York State: http://www.ocfs.state.ny.us/main/. Kids’ Well-being Indicators Clearinghouse (KWIC) The Kids’ Well-being Indicators Clearinghouse (KWIC) is a tool to gather, plot and monitor NYS children’s health, education and well-being indicator data in order to improve outcomes for children and families. KWIC provides a holistic approach as it cuts across all service sectors and allows individuals and organizations with diverse missions to come together to improve outcomes for children and families. KWIC uses the Touchstones framework that was established by the Council on Children and Families and its 12 member agencies. Touchstones is organized by six major life areas where each life area has a set of goals and objectives— representing expectations about the future, and a set of indicators—reflecting the status of children and families. For more information about KWIC: www.nyskwic.org. National Immunization Survey The National Immunization Survey (NIS) is sponsored by the National Immunization Program (NIP) and conducted jointly by NIP and the National Center for Health Statistics (NCHS), Centers for Disease Control and Prevention. The National Immunization Survey is a list-assisted random-digit-dialing telephone survey followed by a mailed survey to children’s immunization providers that began data collection in April 1994 to monitor childhood immunization coverage. Since July of 2001, breastfeeding questions have been asked on the NIS to assess the population’s breastfeeding practices. Children between the ages of 19 and 35 months living in the United States at the time of the interview are the target population for the National Immunization Survey. Data from NIS are used to produce timely estimates of vaccination coverage rates for all childhood vaccinations recommended 96 — NYS Early Childhood Data Report by the Advisory Committee on Immunization Practices (ACIP). Estimates are produced for the nation and for each of 78 Immunization Action Plan (IAP) areas, consisting of the 50 states, the District of Columbia, and 27 large urban areas. For more information on the National Immunization Survey: www.cdc.gov/nis/. For more information pertaining to the National Immunization Survey and breastfeeding questions: www.cdc.gov/breastfeeding/data/index.htm. National Survey of Children’s Health: Child and Adolescent Health Measurement Initiative The National Survey of Children’s Health is a bilingual telephone survey that was conducted during 2003-2004. Sponsored by the Maternal and Child Health Bureau, U.S. Department of Health and Human Services provided the primary funding for the Survey and the National Center for Health Statistics of the Centers for Disease Control and Prevention oversaw the sampling and telephone interviews for the survey. The Survey is a project of the Child and Adolescent Health Measurement Initiative. The sampling and data collection for the National Survey of Children’s Health was conducted using the State and Local Area Integrated Telephone Survey (SLAITS) program. SLAITS, developed by the National Center for Health Statistics, is a quick and consistent way to collect information on a variety of health topics at the state and local levels. Telephone numbers were dialed at random to identify households with one or more children under 18 years of age. In each household, one child was randomly selected to be the subject of the interview. Approximately 2,000 surveys were collected per state and survey results are weighted to represent the population of non-institutionalized children ages 0-17 nationwide and in each state. The survey serves to estimate national and state-level prevalence for numerous physical, emotional, and behavioral child health indicators in combination with information on the child’s family context and neighborhood environment as well as to generate information about children and their families to help guide policymakers, advocates, and researchers. For more information about the Child and Adolescent Health Measurement Initiative: www.nschdata.org. Data Sources National Center for Children in Poverty The National Center for Children in Poverty (NCCP) was founded in 1989 as a division of the Mailman School of Public Health at Columba University and is a nonpartisan, public interest research organization. NCCP is the nation’s leading public policy center dedicated to promoting the economic security, health and well-being of low-income families and children. NCCP uses research to inform policy and practice with the one goal of ensuring positive outcomes for the next generation. NCCP promotes family-oriented solutions at the state and national levels. For more information about the National Center for Children in Poverty: www.nccp.org. United States Census Bureau The United States Census Bureau serves as the leading source of quality data about the nation’s people and economy. Part of the mission of the U.S. Census Bureau is to honor privacy, protect confidentiality, share expertise globally and conduct their work openly with the goal of providing the best mix of timeliness, relevancy, quality and cost for the data that is collected and the services provided. For more information about the U.S. Census Bureau and the decennial survey: http://www.census.gov/. Data users can access this detailed demographic and housing data annually online instead of waiting 10 years for decennial census data, helping them make more accurate, timely and informed decisions. The American Community Survey began in 1996 and has expanded each subsequent year. The full implementation began in January 2005, and the 2005 Survey data are available for all geographic areas with a population of 65,000 or more. By 2008, data will be available for all areas of 20,000 or more. For smaller areas, it will take 5 years to accumulate a large enough sample to provide estimates with accuracy similar to the decennial. For more information about the American Community Survey: http://www.census.gov/acs/www/. Annie E. Casey Foundation The Annie E. Casey Foundation was founded in 1948 with the primary mission to foster public policies, human-service reforms, and community supports that more effectively meet the needs of today’s vulnerable children and families. In order to achieve this goal, the Foundation makes grants that help states, cities, and neighborhoods fashion more innovative, cost-effective responses to these needs. The Casey Foundation provides funding and technical assistance for nationwide network of KIDS COUNT grantee projects. For more information about the Annie E. Casey Foundation: http://www.aecf.org/. American Community Survey The American Community Survey (ACS) is a new nationwide survey designed to provide communities a fresh look at how they are changing. It is a critical element in the Census Bureau’s reengineered 2010 census plan. The ACS collects and produces population and housing information such as age, race, income, commute time to work, home value, veteran status, and other important data from U.S. households every year instead of every 10 years. About three million households are surveyed each year, from across every county in the nation. Collecting data every year reduces the cost of the official decennial census and provides more up-to-date information throughout the decade about trends in the U.S. population at the local community level. As with the official decennial census, information about individuals will remain confidential. United States Department of Agriculture: Economic Research Service The Economic Research Service is a primary source of economic information and research in the U.S. Department of Agriculture (USDA). Economic Research Service conducts a research program to inform public and private decision making on economic and policy issues involving food, farming, natural resources, and rural development. For more information about USDA’s Economic Research Service: http://www.ers.usda.gov/. Data Sources Used in This Report — 97 Directory of Figures Framework of Priority Cross-Sector Goals and Outcomes, page vi Introduction: A State of Change, Page vii The Demographics of Young Children in New York State, page ix Figure 1. Total Population: NYS, NYC and ROS, 2005 Figure 2. Population of Children Birth to 5 Years: NYS, 2005 Figure 3. Estimated Population of Children Birth to 5 Years: NYS, 2000 to 2030 Figure 4. Population of Children Birth to 5 Years by Region: NYS 2005 Figure 5. Population of Children Birth to 5 Years by Sex: NYS, 2005 Figure 6. Population of Children Birth to 5 Years by Race: NYS, 2005 Figure 7. Population of Children Birth to 5 Years by Ethnicity: NYS, 2005 Figure 8. Children Under 5 Years by Place of Birth: NYS, 2005 Figure 9. Children Under 5 Years by Nativity Status of Parents: NYS, 2005 Chapter 1: Healthy Children, Page 1 Prenatal Care, Page 2 Figure 10. Adequate Prenatal Care for Mothers 15 to 44 Years: NYS, NYC and ROS,1992 to 2005 Figure 11. Adequate Prenatal Care for Mothers 15 to 44 Years by Race/Ethnicity: NYS, 1992 to 2005 Unintended Pregnancy, Page 4 Figure 12. Live Births Resulting From Unintended Pregnancies by Race/Ethnicity: NYS Excluding NYC, 1993 to 2005 Figure 13. Live Births Resulting From Unintended Pregnancies by Age, Education and Marital Status: NYS Excluding NYC, 2001 to 2005 Pregnancy-Related Smoking, Page 6 Figure 14. Smoking Before, During and After Pregnancy: NYS Excluding NYC, 1993 to 2005 Pregnancy-Related Domestic Violence, Page 8 Figure 15. Women Experiencing Physical Abuse Before and During Pregnancy: NYS Excluding NYC, 1996 to 2005 Pregnancy-Related Alcohol Consumption, Page 10 Figure 16. Alcohol Consumption of Mothers Three Months Prior to Pregnancy and During Last Three Months of Pregnancy: NYS Excluding NYC, 1993 to 2005 Low Birthweight, Page 12 Figure 17. Low Birthweight Births: NYS, NYC and ROS, 1993 to 2005 Figure 18. Low Birthweight Births by Race/Ethnicity: NYS, 1991 to 2005 Figure 19. Low Birthweight Births in Singleton and Total Births: NYS, 1991 to 2005 Infant Mortality, Page 14 Figure 20. Infant Mortality Rate: NYS, NYC and ROS, 1991 to 2005 Figure 21. Infant Mortality Rate by Race/Ethnicity: NYS, 1991 to 2005 98 — NYS Early Childhood Data Report Figure 22. Leading Causes of Death in Infants Less than One Year of Age: NYS, NYC and ROS, 2001-2003 Breastfeeding, Page 16 Figure 23. Breastfeeding Initiation and Duration: NYS, NYC and ROS, 2003 to 2005 Figure 24. Breastfeeding Exclusivity at 3 and 6 Months: NYS, NYC and ROS, 2003 to 2005 Immunization, Page 18 Figure 25. Vaccination Coverage With 4:3:1:3:3 Among Children 19 to 35 Months: NYS, NYC and ROS, 1998 to 2005 Figure 26. Vaccination Coverage With 4:3:1:3:3:1 Among Children 19 to 35 Months: NYS, NYC and ROS, 2002 to 2005 Child Mortality, Page 20 Figure 27. Mortality Rate of Children 1 to 4 Years: NYS, NYC and ROS, 1995 to 2002 Figure 28. Leading Causes of Death for Children 1 to 4 Years by Region and Race/Ethnicity: NYS, 2002 Asthma Hospitalizations, Page 22 Figure 29. Asthma Hospitalizations for Children Birth to 4 Years: NYS, NYC and ROS, 1994 to 2004 Injury-Related Hospitalizations, Page 24 Figure 30. Unintentional Injury Hospitalizations for Children Birth to 5 Years by Region and Gender: NYS, NYC and ROS, 2001-2003 Figure 31. Assault/Homicide Hospitalizations for Children Birth to 5 Years by Region and Gender: NYS, NYC and ROS, 2001-2003 Lead Screening and Poisoning, Page 26 Figure 32. Children Screened for Elevated Blood Lead Levels at Least Once by 24 Months, by Birth Year Cohort: NYS Excluding NYC, 1998 to 2002 Figure 33. Prevalence and Incidence Rates of Children Under 6 Years Identified With Elevated Blood Lead Levels (> 10 µg/dL): NYS Excluding NYC, 2000 to 2005 Special Health Care Needs, Page 28 Figure 34. Children With Special Health Care Needs by Age: NYS, 2003 Figure 35. Insurance Coverage of Children With Special Health Care Needs by Type and Adequacy: NYS, 2001 Weight Status, Page 30 Figure 36. Children 2 to 4 Years in the WIC Program Who Are Overweight or At-Risk for Overweight: NYS, 1989 to 2005 Figure 37. Children 2 to 5 Years in WIC Program Who Are Overweight by Race/Ethnicity: NYS, 2003 Oral Health, Page 32 Figure 38. Overall Condition of Teeth in Children 1 to 4 Years: NYS, 2003 Insurance Status, Page 34 Figure 39. Insurance Status of Children Birth to 5 Years by Type and Coverage Level: NYS, 2003 Medical Home, Page 36 Figure 40. Children Birth to 5 Years Receiving Health Care Within a Medical Home: NYS, 2003 Directory of Figures Parental Mental Health, Page 38 Figure 41. Children Birth to 5 Years Living With Mothers With Excellent to Poor Mental Health: NYS, 2003 Figure 42. Children Birth to 5 Years Living With Fathers With Excellent to Poor Mental Health: NYS, 2003 Chapter 2: Strong Families, Page 45 Poverty, Page 46 Figure 43. Children Birth to 5 Years Living in Households with Incomes Below the Poverty Level: New York State, New York City and Rest of State, 2005 Figure 44. Related Children Under Six Years Living Below Poverty Level by Family Type: New York State, 2005 Family Structure, Page 48 Figure 45. Family Structure Characteristics of Children Under 6 Years: NYS, 2003 Grandparents as Primary Caregiver, Page 50 Figure 46. Children Under 6 Years Who Are the Primary Responsibility of Their Grandparents: US and NYS, 2005 Adolescent Pregnancy, Page 52 Figure 47. Adolescent Pregnancy Rate by Age: NYS, 1994 to 2004 Postpartum Depression, Page 54 Figure 48. Mothers Reporting Postpartum Depression Shortly After Birth: NYS Excluding NYC, 2003 WIC Program Participation, Page 56 Figure 49. Children Eligible for and Served by the Special Supplemental Nutrition Program for Women, Infants and Children (WIC): NYS, NYC and ROS, 2006 Food Insecurity, Page 58 Figure 50. Prevalence of Food-Insecure Households: NYS, 1996-1998 to 2002-2004 Parental Employment, Page 60 Figure 51. Parental Employment Status of Children Under 6 Years: US and NYS, 2004 Child Care Subsidies, Page 62 Figure 52. Children Under 6 Years in Subsidized Child Care by Setting: NYS, 2004 Foster Care, Page 64 Figure 53. Children in Foster Care by Age: NYS, NYC and ROS, 2004 Head Start, Page 74 Figure 57. Total Actual Enrollment of Children in Head Start and Early Head Start by Age of Child Served: NYS, 20052006 Enrollment Year Figure 58. Total Actual Enrollment in Head Start and Early Head Start by Race/Ethnicity of Enrollee: NYS, 20052006 Enrollment Year Prekindergarten, Page 76 Figure 59. Children Served by Universal and Targeted Prekindergarten Programs: NYS 2006-2007 Early Intervention, Page 78 Figure 60. Children 3 Years, 8 Months and Under Receiving at Least One Early Intervention Service: NYS, NYC and ROS, July 2005-June 2006 Preschool Special Education, Page 80 Figure 61. Children 3 to 5 Years Receiving Preschool Special Education: NYS, NYC and ROS, 2005-2006 Parental Role in Early Learning, Page 82 Figure 62. Number of Days a Week Children Under 6 Years Are Read Aloud to by a Parent or Family Member: NYS, 2003 Figure 63. Children Under 6 Years Whose Parents Reported Having at Least One Concern About Their Child’s Learning, Development, Behavior or Ability to Get Along With Others: NYS, 2003-2004 Chapter 4: Supportive Communities, Page 87 Neighborhood Environment, Page 88 Figure 64. Perceptions of Children’s Safety in Communities Among Parents With Children Under 6 Years: NYS, 2003 Figure 65. Children Under 6 Years Whose Parents Reported Living in Supportive Neighborhoods: NYS 2003 Crime Rates, Page 90 Figure 66. Firearm-Related Index Crime Rate: NYS, NYC and ROS, 1993 to 2002 Figure 67. Property Index Crimes Known to Police: NYS, NYC and ROS, 1993 to 2006 Figure 68. Violent Index Crimes Known to Police: NYS, NYC and ROS, 1993 to 2006 Multiple Risk Factors, Page 92 Figure 69. Young Children’s Exposure to Multiple Risk Factors: NYS, 2006 Child Abuse and Maltreatment, Page 66 Figure 54. Unique Children With Confirmed Allegations of Abuse or Maltreatment by Age: NYC and ROS, 2004 Chapter 3: Early Learning, Page 72 Language Development, Page 73 Figure 55. Children Birth to 5 Years Living in Linguistically Isolated Households: NYS, NYC and ROS, 2000 Figure 56. Mothers of Children Birth to 5 Years Rating Own Ability to Speak English as Not Well or Not at All: NYS, NYC and ROS, 2000. Directory of Figures — 99 Permission to copy all or portions of this report is granted as long as the Council on Children and Families/NYS Early Childhood Data Report: The Health and Well-Being of New York’s Youngest Children is acknowledged as the source in any reproduction, quotation, or use. Disclaimer: This document contains URLs to information created and maintained by other public and private organizations. These URLs are provided for the user’s convenience. The Council on Children and Families does not control or guarantee the accuracy, relevance, timeliness, completeness, accessibility and currency of this outside information. Moreover, the inclusion of URLs is not intended to be all inclusive, reflect their importance, nor is it intended to endorse any views expressed, or products or services offered, on these outside sites, or the organizations sponsoring the sites. Acknowledgments: The NYS Early Childhood Data Report is the product of a multi-year project that involved the attention and efforts of a number of individuals. We would like to acknowledge the significant efforts of Toni Lang, PhD and Mary DeMasi, PhD for sharing their knowledge and expertise. In addition, we also wish to thank Mike Medvesky, Anne Radigan, and Pam Sheehan of the Public Health Information Group of the New York State Department of Health for their data contributions and review of the report, and Lorraine Noval, Lillian Denton and Sharon Smith of the Office of Children and Family Services for their contributions to this report. 100 — NYS Early Childhood Data Report Disclaimer: This document contains URLs to information created and maintained by other public and private organizations. These URLs are provided for the user’s convenience. The Council on Children and Families does not control or guarantee the accuracy, relevance, timeliness, completeness, accessibility and currency of this outside information. Moreover, the inclusion of URLs is not intended to be all inclusive, reflect their importance, nor is it intended to endorse any views expressed, or products or services offered, on these outside sites, or the organizations sponsoring the sites. Council on Children and Families 52 Washington Street West Building, Suite 99 Rensselaer, NY 12144 (518) 473-3652 www.ccf.state.ny.us

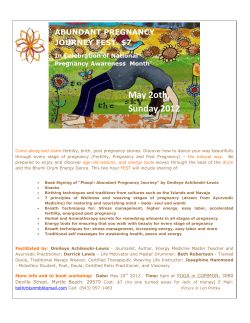

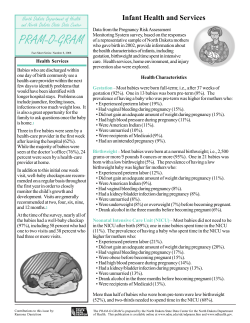
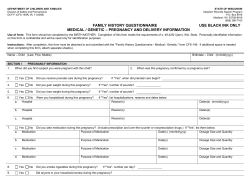


© Copyright 2026