
Ph 20.1 â Introduction to Python â Lissajous figures and beats
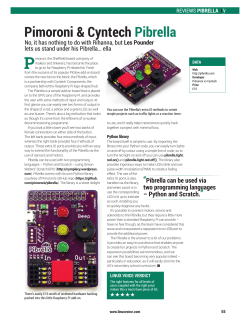
Ph 20.1 – Introduction to Python – Lissajous figures and beats
-v20131001-
Overview
The Ph20,21,22 sequence is organized around a “toolkit” approach to scientific computing. Rather
than emphasize one particular language, e.g. C or C++, Ph20 introduces a variety and range of
useful tools. The toolkit approach is well-represented by the website, Software Carpentry, that
contains a wealth of useful information, lectures, etc. Among the topics covered are:
• Python (the subject of this assignment)
• The Shell (something you are already beginning to use. Software Carpentry provides additional detail)
• Version Control (a topic we will explore a bit later in the course)
The primary purpose of this assignment is to familiarize you with the edit/run/edit cycle typical
of scripting languages, and of Python in particular. (By contrast, the cycle of compiled languages
such as C or C++ could be described as edit/compile/debug/run.) Once you are done, you should
have a working knowledge of the operating system (Linux), of basic shell operations (copying,
moving, editing files), of the Python interpreter, and of graphing tools.
Visualizing trigonometry: Lissajous figures and beats
Sine and cosine functions (sinusoids) are fundamental in the analysis of many physical systems, and
in particular of those that undergo periodic motion. A reasonable (and venerable) introduction
to the subject of periodic functions is given in Chapter 2 of A. P. French, Vibrations and Waves
(Norton, New York, 1971). You will be studying (or must have studied) these topics exhaustively
in Sophomore Physics.
Lissajous figures are named after the French physicist Jules Antoine Lissajous (1822–1880),
who studied the mechanics of tuning forks,1 and who developed a method to calibrate a new
´
tuning fork against a reference tuning fork [“Etude
Optique des Mouvements Vibratoires,” Annales de Chimie et de Physique 51 (1857)]. Lissajous attached mirrors to the two forks, which
were positioned orthogonally, and shone a beam of light on a screen, via the two mirrors (see
illustration). On the screen, the vibrations of the two mirrors are translated into the horizontal
and vertical motion of the point of light, and a closed elliptical pattern results if the frequencies of
the two forks are in agreement. In modern laboratories, at least before the age of computers and
acquisition boards, Lissajous figures were familiar sights on the screens of oscilloscopes, because
they allowed quick comparisons of frequencies and phases.
The phenomenon of beating originates from the sum of two sinusoids of different frequencies.
The resulting signal is a sinusoid of frequency given by the average of the two original frequencies, but whose amplitudes oscillates with a frequency given by the difference of the two original
frequencies: in formulas,
ω + ω ω − ω 1
2
1
2
cos(ω1 t) + cos(ω2 t) = 2 cos
t cos
t .
(1)
2
2
1
Among other things, Lissajous recommended that the standard “A” note be set to 435 Hertz (periods per
second). The modern value is 440 Hertz, at the end of an arms race where competing orchestras would tune their
instruments higher and higher to sound sharper and more incisive.
1
Figure 1:
Lissajous’ fork-tuning
EarlyApparatus/index.html).
apparatus
(from
http://physics.kenyon.edu/
Beats have many applications in music, optics, and communication. In the technique of amplitude
modulation, used for radio transmission in the AM band, a carrier signal is multiplied by the
content signal (i.e., music and words) before being transmitted. Usually the carrier frequency is
rather large (in the MHz range), while the content signal can be characterized as the superposition
of many sinusoids with frequencies within the audible range, 20–20,000 Hz (we shall learn more
about frequency components in Ph22, when we work with Fourier transforms). The amplitudemodulated signals would then contain a superposition of sinusoids with frequencies scattered
around the carrier frequency, within a bandwidth of 2×20,000 Hz. Radio receivers use various
schemes to demodulate AM signals: the simplest are based on tunable resonant circuits followed
by diode rectifiers and low-pass filters.
The Assignment
1. Browse the website Software Carpentry to familiarize yourself with its contents. Look in
particular at the information about Python. The computation laboratory has various Python
references for additional information.
2. Write a program to compute sequences of the simple trigonometric functions
X(t) = AX cos(2πfX t),
(2)
Y (t) = AY sin(2πfY t + φ),
(3)
Z(t) = X(t) + Y (t),
(4)
at the equally spaced times t = n∆t, with n = 0, . . . , N . The program should take as input
the parameters fX , fY , AX , AY , φ, ∆t, and N ; it should output the X, Y , and Z sequences
to one or more ASCII files.
Construct two versions of the program: one that uses python lists to store the X, Y , and Z
sequences, and another version that uses numpy arrays.
You will then use xmgrace, gnuplot, Mathematica, pyplot, or another program of your
choice to plot the three functions, as directed in the next two parts of the assigment. Be
2
mindful of Tufte’s principles mentioned in this week’s reading. You can find plotting help
by looking up matplotlib (one of the standard python plotting packages), looking among
the “Resources” on the ph20 homepage, or asking your TA.
3. Lissajous figures. Create these figures by plotting X against Y . Then:
(a) convince yourself that the figures are closed curves if fX /fY is a rational number, and
produce plots showing that this is true;
(b) investigate the relation between the ratio fX /fY and the shape of the resulting curve,
write your conclusions, and print some examples for your TA;
(c) for fX = fY , investigate the relation between the phase shift φ and the shape of the
curve, write your conclusions, and print some examples (how can this relation be used
to tune an electronic circuit, using an oscilloscope?).
Always choose values of fX , fY , and ∆t such that your figures are not too cluttered, and
that curves look. . . curvy.
4. Beats. Demonstrate the phenomenon of beats by setting nearby (but different) fX and fY ,
and plotting Z(t) as a function of t. Choose the frequencies so that your plots display many
cycles at the carrier frequency (ω1 + ω2 )/2, and a few modulation cycles at the frequency
(ω1 − ω2 ), where ω1 = 2πfX and ω2 = 2πfY . [question: why not (ω1 − ω2 )/2?]
5. Write two paragraphs about this week’s experience (perhaps your first) programming in
Python. How does it compare to your experiences using other programming languages? Do
you agree with Guido van Rossum (see this week’s readings) in his evaluation of his own
language? [If you prefer, instead of writing two paragraphs of prose, you may jot down a
checklist and discuss it verbally with your TA.]
Python Hints
First of all, we suggest you use emacs to edit your Python programs. If correctly configured, it
will load a Python mode that will give you syntax highlighting (meaning that your keywords,
variables, etc. will be shown in different colors, making it easier to browse your code) and help
you with indentation, which in Python is important for the execution of the code. See the reading
for this week for emacs help.
It is a good idea to use ipython rather than the very basic python. You can add -pylab for
useful numerical and plotting packages. Your output will look something like this:
% ipython -pylab
IPython 0.13
?
->
%quickref ->
help
->
object?
->
-- An enhanced Interactive Python.
Introduction and overview of IPython’s features.
Quick reference.
Python’s own help system.
Details about ’object’, use ’object??’ for extra details.
Welcome to pylab, a matplotlib-based Python environment [backend: MacOSX].
For more information, type ’help(pylab)’.
3
You might also want to try using python notebooks, the command line being (for example):
>>>
ipython notebook --pylab
You do not need much Python to get through this week’s assignment. Here’s what you should
know: you can go find it in your Python tutorials and manuals.
• You should have an understanding of the assignment of variables, of writing simple mathematical expressions, and of coding a for loop using range.
• You should know that your Python script (say, lissajous.py) will run from the shell if its
first line is
#!/usr/bin/python
and if you make it executable (chmod u+x lissajous.py).
• You should know that cos, sin, and pi reside in the math module, so you can access them
as math.cos, etc. after doing import math. Alternatively (and preferably) use np.cos, etc.
after doing e.g. import numpy as np. We encourage you to use numpy arrays because
of the flexible indexing and slicing operations that are possible . See, for example, http:
//wiki.scipy.org/Tentative_NumPy_Tutorial.
• You should know how to get arguments into your script from the command line. If you
import sys, then sys.argv is a list of strings giving, in order, the name with which your
script was called, and its arguments. I said they’re strings, so you will need to do things like
N = int(argv[1])
dt = float(argv[2])
to get numerical values. You can check how many strings you’re passing from len(sys.argv).
This is primarily a unix feature, not python. Often, you will be using python in interpretive
mode and not calling python code from the unix shell.
• You should know how to get numbers out of your script and into an ASCII file from which
you can then plot. For the purpose of this assignment, you can use print (which will go to
the console), and redirect the output to a file, as in
python lissajous.py [arguments. . . ] > output.txt
Finally, we will discuss python installations later in Ph20. It is often somewhat tricky to
correctly install python modules and ensure complementarity among different modules. If you are
interested in installing python on one of your own computers, we suggest that you take a look at
http://www.vallis.org/salon/summary-2.html. As of 2012, it was a very useful description
for techniques to set up python and download modules.
4


© Copyright 2026