
Articles Mortality risk attributable to high and low
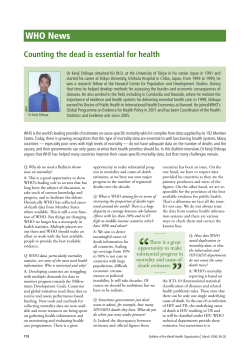
Articles Mortality risk attributable to high and low ambient temperature: a multicountry observational study Antonio Gasparrini, Yuming Guo, Masahiro Hashizume, Eric Lavigne, Antonella Zanobetti, Joel Schwartz, Aurelio Tobias, Shilu Tong, Joacim Rocklöv, Bertil Forsberg, Michela Leone, Manuela De Sario, Michelle L Bell, Yue-Liang Leon Guo, Chang-fu Wu, Haidong Kan, Seung-Muk Yi, Micheline de Sousa Zanotti Stagliorio Coelho, Paulo Hilario Nascimento Saldiva, Yasushi Honda, Ho Kim, Ben Armstrong Summary Background Although studies have provided estimates of premature deaths attributable to either heat or cold in selected countries, none has so far offered a systematic assessment across the whole temperature range in populations exposed to different climates. We aimed to quantify the total mortality burden attributable to non-optimum ambient temperature, and the relative contributions from heat and cold and from moderate and extreme temperatures. Methods We collected data for 384 locations in Australia, Brazil, Canada, China, Italy, Japan, South Korea, Spain, Sweden, Taiwan, Thailand, UK, and USA. We fitted a standard time-series Poisson model for each location, controlling for trends and day of the week. We estimated temperature–mortality associations with a distributed lag non-linear model with 21 days of lag, and then pooled them in a multivariate metaregression that included country indicators and temperature average and range. We calculated attributable deaths for heat and cold, defined as temperatures above and below the optimum temperature, which corresponded to the point of minimum mortality, and for moderate and extreme temperatures, defined using cutoffs at the 2·5th and 97·5th temperature percentiles. Findings We analysed 74 225 200 deaths in various periods between 1985 and 2012. In total, 7·71% (95% empirical CI 7·43–7·91) of mortality was attributable to non-optimum temperature in the selected countries within the study period, with substantial differences between countries, ranging from 3·37% (3·06 to 3·63) in Thailand to 11·00% (9·29 to 12·47) in China. The temperature percentile of minimum mortality varied from roughly the 60th percentile in tropical areas to about the 80–90th percentile in temperate regions. More temperature-attributable deaths were caused by cold (7·29%, 7·02–7·49) than by heat (0·42%, 0·39–0·44). Extreme cold and hot temperatures were responsible for 0·86% (0·84–0·87) of total mortality. Interpretation Most of the temperature-related mortality burden was attributable to the contribution of cold. The effect of days of extreme temperature was substantially less than that attributable to milder but non-optimum weather. This evidence has important implications for the planning of public-health interventions to minimise the health consequences of adverse temperatures, and for predictions of future effect in climate-change scenarios. Funding UK Medical Research Council. Copyright © Gasparrini et al. Open Access article distributed under the terms of CC BY. Introduction Many epidemiological studies have provided evidence for the association between ambient temperature and mortality or morbidity outcomes.1,2 Interest in this topic has increased after episodes of extreme weather and in response to reports about climate change.3–5 Although consensus exists among researchers that both extremely cold and extremely hot temperatures affect health, their relative importance is a matter of current debate and other details of the association remain unexplored. For example, little is known about the optimum temperatures that correspond to minimum effects for various health outcomes. Furthermore, most research has focused on extreme events and no studies have comparatively assessed the contribution of moderately high and low temperatures. The underlying physiopathological mechanisms that link exposure to non-optimum temperature and mortality risk have not been completely elucidated. Heat stroke on hot days and hypothermia on cold days only account for small proportions of excess deaths. High and low temperatures have been associated with increased risk for a wide range of cardiovascular, respiratory, and other causes, suggesting the existence of multiple biological pathways.6–9 Ambient temperature represents an impor tant risk factor and further investigation is needed to strengthen understanding of the associated health effects. This infor mation is essential for planning of suitable public health interventions and for provision of reliable predictions for the effects of climate change. Epidemiological studies of the topic face important challenges in modelling of temperature–health depen dencies. First, the dose-response association, which is inherently non-linear, is also characterised by different lag periods for heat and cold—ie, excess risk caused by heat is typically immediate and occurs within a few days, www.thelancet.com Published online May 21, 2015 http://dx.doi.org/10.1016/S0140-6736(14)62114-0 Published Online May 21, 2015 http://dx.doi.org/10.1016/ S0140-6736(14)62114-0 See Online/Comment http://dx.doi.org/10.1016/ S0140-6736(15)60897-2 Department of Medical Statistics (A Gasparrini PhD) and Department of Social and Environmental Health Research (Prof B Armstrong PhD), London School of Hygiene & Tropical Medicine, London, UK; Department of Epidemiology and Biostatistics, School of Population Health, University of Queensland, Brisbane, QLD, Australia (Y Guo PhD); Department of Pediatric Infectious Diseases, Institute of Tropical Medicine, Nagasaki University, Nagasaki, Japan (Prof M Hashizume PhD); Interdisciplinary School of Health Sciences, University of Ottawa, Ottawa, ON, Canada (E Lavigne PhD); Department of Environmental Health, Harvard School of Public Health, Boston, MA, USA (A Zanobetti PhD, Prof J Schwartz PhD); Institute of Environmental Assessment and Water Research (IDAEA), Spanish Council for Scientific Research (CSIC), Barcelona, Spain (A Tobias PhD); School of Public Health and Social Work, Queensland University of Technology, Brisbane, QLD, Australia (Prof S Tong PhD); Department of Public Health and Clinical Medicine, Umeå University, Umeå, Sweden (J Rocklöv PhD, Prof B Forsberg PhD); Department of Epidemiology, Lazio Regional Health Service, Rome, Italy (M Leone MS, M De Sario MS); School of Forestry and Environmental Studies, Yale University, New Haven, CT, USA (Prof M L Bell PhD); Department of Environmental and Occupational Medicine (Y-L L Guo MD) and Department of Public Health (C-f Wu PhD), 1 Articles National Taiwan University, Taipei, Taiwan; Department of Environmental Health, Fudan University, Shanghai, China (Prof H Kan PhD); Graduate School of Public Health & Institute of Health and Environment, Seoul National University, Seoul, Republic of Korea (Prof S-M Yi PhD, Prof Ho Kim PhD); Department of Pathology, School of Medicine, University of São Paulo, São Paulo, Brazil (M de Sousa Zanotti Stagliorio Coelho PhD, Prof P H N Saldiva PhD); and Faculty of Health and Sport Sciences, University of Tsukuba, Tsukuba, Japan (Prof Y Honda PhD) Correspondence to: Dr Antonio Gasparrini, Department of Medical Statistics, London School of Hygiene & Tropical Medicine, London WC1E 7HT, UK [email protected] See Online for appendix For a reproducible example see http://www.ag-myresearch.com/ while the effects of cold have been reported to last up to 3 or 4 weeks.6,7 Second, the association is heterogeneous between populations because of acclimatisation, different adaptation responses, and variability in susceptibility factors.10–12 Modelling of such complex patterns needs a sophisticated statistical approach. Although studies have quantified the association in terms of relative risk (RR), few have given estimates of the attributable burden, either as absolute excess (numbers) or relative excess (fractions) of deaths.13–19 The evidence for the attributable risk of temperature is very often restricted to extreme events, especially heatwaves,17,18 although few investi gations have reported values from dose-response associations estimated in models with temperature as a continuous variable.13,14 We aimed to quantify total mortality burden attributable to non-optimum ambient temperature, and the relative contributions from heat and cold and from moderate and extreme temperatures. We based our analysis on recent advances in statistical modelling to account for the complex and heterogeneous temperature–mortality dependency. Methods Study design and data We collected time-series daily data, including mortality, weather variables, and air pollution measures, from 384 locations in 13 countries: Australia (three cities, 1988–2009), Brazil (18 cities, 1997–2011), Canada (21 cities, 1986–2009), China (15 cities, 1996–2008), Italy (11 cities, 1987–2010), Japan (47 prefectures, 1985–2012), South Korea (seven cities, 1992–2010), Spain (51 cities, 1990–2010), Sweden (one county, 1990–2002), Taiwan (three cities, 1994–2007), Thailand (62 provinces, 1999–2008), UK (ten regions, 1993–2006), and USA (135 cities, 1985–2009). Mortality was represented by daily counts of deaths for either all causes or, where not available, non-external causes only (International Classification of Locations Study period Total deaths 3 1988–2009 1 177 950 18·1 (15·7–20·3) 18 1997–2011 3 401 136 24·2 (17·7–27·4) Canada 21 1986–2009 2 521 586 6·5 (2·6–10·7) China 15 1996–2008 950 130 15·1 (7·4–23·7) 15·4 (12·2–18·4) Australia Brazil Italy 11 1987–2010 820 390 Japan 47 1985–2012 26 893 197 7 1992–2010 1 726 938 13·7 (12·5–14·9) 51 1990–2010 3 479 910 15·5 (10·9–21·6) South Korea Spain 15·3 (9·1–23·1) Sweden 1 1990–2002 190 092 7·5 (7·5–7·5) Taiwan 3 1994–2007 765 893 24·0 (23·2–25·2) Thailand 62 1999–2008 1 827 853 27·6 (25·1–29·3) UK 10 1993–2006 7 573 716 10·4 (9·5–11·7) USA 135 1985–2006 22 896 409 14·9 (7·9–25·5) Temperatures are mean location-specific temperature (range). Table 1: Descriptive statistics by country 2 Temperature (˚C) Diseases [ICD]-9 0-799, ICD-10 A00-R99). We chose mean daily temperature as the exposure index, calculated from central monitor stations, either as the average between maximum and minimum values or the 24 h average. We did a sensitivity analysis by modifying the modelling choices, replacing all-cause with non-external mortality, and controlling for air pollution and humidity in the subset of countries that provided such information. The appendix contains details of the exact study periods, further information on data collection, additional results, and results from the sensitivity analysis. Statistical analysis We did all analysis with R software (version 3.0.3) using the packages dlnm and mvmeta. The code is available on request, and a reproducible example is included at the personal website of the first author. We first applied a standard time-series quasi-Poisson regression separately in each location to derive estimates of location-specific temperature–mortality associations, reported as RR. Specific tutorials explain the technical details and terminology.20 Briefly, this first-stage regression included a natural cubic B-spline of time with 8 degrees of freedom per year to control for seasonal and long-term trends, and an indicator of day of the week. We modelled the association with temperature using a distributed lag non-linear model.21 This class of models can describe complex non-linear and lagged dependencies through the combination of two functions that define the conventional exposure-response association and the additional lagresponse association, respectively. The lag-response association represents the temporal change in risk after a specific exposure, and it estimates the distribution of immediate and delayed effects that cumulate across the lag period. Specifically, we modelled the exposure-response curve with a quadratic B-spline with three internal knots placed at the 10th, 75th, and 90th percentiles of locationspecific temperature distributions, and the lag-response curve with a natural cubic B-spline with an intercept and three internal knots placed at equally spaced values in the log scale. We extended the lag period to 21 days to include the long delay of the effects of cold and to exclude deaths that were advanced by only a few days (harvesting effect). We tested these modelling choices in sensitivity analysis. We then reduced the association to the overall temperature–mortality association, cumulating the risk during the lag period.22 This step reduces the number of parameters to be pooled in the second-stage meta-analysis, and preserves the complexity of the estimated dependency, thus avoiding unnecessary simplification. We pooled the estimated location-specific overall cumulative exposure-response associations using a multivariate meta-analytical model.22,23 Previous studies have reported how climatological, socioeconomic, demo graphic, and infrastructural factors have a role in modification of the association between temperature and mortality.10 To account for the main features of such www.thelancet.com Published online May 21, 2015 http://dx.doi.org/10.1016/S0140-6736(14)62114-0 Articles Sydney, Australia São Paulo, Brazil 2·5 2·0 600 400 200 0 RR 0·5 0 0 10 15 20 Toronto, Canada 25 30 600 400 Number of deaths 1·0 Number of deaths 1·5 200 0 10 15 Beijing, China 20 0 25 Rome, Italy 2·5 2·0 RR 0 –20 –10 0 10 20 30 800 600 400 200 0 –5 Tokyo, Japan 0 5 10 15 20 25 30 60 40 20 0 0 Seoul, South Korea 5 10 15 20 25 30 600 400 200 0 Number of deaths 0·5 Number of deaths 1·0 Number of deaths 1·5 Madrid, Spain 2·5 2·0 RR 0 0 5 10 15 20 25 30 –10 Stockholm, Sweden 0 10 20 600 400 200 0 30 0 Taipei, Taiwan 5 10 15 20 25 30 600 400 200 0 Number of deaths 600 400 200 0 0·5 Number of deaths 1·0 Number of deaths 1·5 Bangkok, Thailand 2·5 2·0 RR 0 –15 –10 –5 0 5 10 15 20 25 400 300 200 100 0 10 15 20 25 London, UK 400 300 200 100 0 30 18 20 22 24 26 28 30 32 34 600 400 200 0 Number of deaths 0·5 Number of deaths 1·0 Number of deaths 1·5 New York, NY, USA 2·5 2·0 RR 0·5 0 0 5 10 15 20 25 Temperature (°C) 30 400 300 200 100 0 –10 0 10 20 Temperature (°C) 30 800 600 400 200 0 Number of deaths 1·0 Number of deaths 1·5 Figure 1: Overall cumulative exposure–response associations in 13 cities Exposure–response associations as best linear unbiased prediction (with 95% empirical CI, shaded grey) in representative cities of the 13 countries, with related temperature distributions. Solid grey lines are minimum mortality temperatures and dashed grey lines are the 2·5th and 97·5th percentiles. RR=relative risk. www.thelancet.com Published online May 21, 2015 http://dx.doi.org/10.1016/S0140-6736(14)62114-0 3 Articles effect modification, we included location-specific average temperature, temperature range, and indicators for country as meta-predictors in a multivariate meta-regression. We tested these effects through a multivariate Wald test. We tested residual heterogeneity and reported it by the multivariate extension of Cochran Q test and I² statistic.23,24 We used the fitted meta-analytical model to derive the best linear unbiased prediction of the overall cumulative exposure-response association in each location. The best linear unbiased prediction represents a trade-off between the location-specific association provided by the first-stage regression and the pooled association. This approach allows areas with small daily mortality counts or short series, usually characterised by very imprecise estimates, to borrow information from larger populations that share similar characteristics.13,23,25 The minimum mortality temperature, which corresponds to a minimum mortality percentile between the first and the 99th percentiles, was derived from the best linear unbiased prediction of the overall cumulative exposure-response association in each location. We referred to this value as the optimum temperature, and deemed it the reference for calculating the attributable risk by re-centring the quadratic B-spline that models the exposure-response. For each day of the series, in each location, we used the overall cumulative RR corresponding to each day’s temperature to calculate the attributable deaths and fraction of attributable deaths in the next 21 days, using a previously described method.26 The total attributable number of deaths caused by non-optimum temperatures is given by the sum of the contributions from all the days of the series, and its ratio with the total number of deaths provides the total attributable fraction. We calculated the components Minimum Total mortality percentile Cold Heat Australia 83th 6·96% (4·27 to 9·51) 6·50% (3·91 to 8·94) 0·45% (0·20 to 0·70) Brazil 60th 3·53% (3·00 to 4·01) 2·83% (2·34 to 3·30) 0·70% (0·45 to 0·93) Canada 81st 5·00% (3·83 to 6·07) 4·46% (3·39 to 5·48) 0·54% (0·39 to 0·66) China 83rd 11·00% (9·29 to 12·47) 10·36% (8·72 to 11·77) 0·64% (0·47 to 0·79) Italy 79th 10·97% (8·03 to 13·43) 9·35% (6·59 to 11·72) 1·62% (1·24 to 1·98) Japan 86th 10·12% (9·61 to 10·56) 9·81% (9·32 to 10·22) 0·32% (0·27 to 0·36) South Korea 89th 7·24% (4·45 to 9·73) 6·93% (4·12 to 9·44) 0·31% (0·15 to 0·45) Spain 78th 6·52% (5·82 to 7·16) 5·46% (4·79 to 6·07) 1·06% (0·96 to 1·16) Sweden 93rd 3·87% (–6·20 to 12·93) 3·69% (–6·31 to 12·61) 0·18% (–0·47 to 0·65) Taiwan 62nd 4·75% (3·26 to 6·06) 3·89% (2·50 to 5·31) 0·86% (0·12 to 1·50) Thailand 60th 3·37% (3·06 to 3·63) 2·61% (2·31 to 2·88) 0·76% (0·65 to 0·86) UK 90th 8·78% (8·00 to 9·54) 8·48% (7·72 to 9·25) 0·30% (0·25 to 0·36) USA 84th 5·86% (5·50 to 6·17) 5·51% (5·17 to 5·82) 0·35% (0·30 to 0·39) Total 81st 7·71% (7·43 to 7·91) 7·29% (7·02 to 7·49) 0·42% (0·39 to 0·44) Attributable mortality computed as total and as separate components for cold and heat. Data are median percentile or % (95% empirical CI). Table 2: Attributable mortality by country 4 attributable to cold and heat by summing the subsets corresponding to days with temperatures lower or higher than the minimum mortality temperature. We further separated these components into moderate and extreme contributions by defining extreme cold and heat as temperatures lower than the 2·5th locationspecific percentile (extreme cold) and higher than the 97·5th location-specific percentile (extreme heat). These cutoffs are consistent with previous definitions of extreme weather, such as heatwaves.7,14,18,19 We defined moderate temperatures as the ranges between the optimum temperature and these cutoffs. We defined other ranges using cutoffs at the 10th, 25th, 50th, 75th, and 90th percentiles. We calculated empirical CIs (eCIs) using Monte Carlo simulations, assuming a multivariate normal distribution of the best linear unbiased predictions of the reduced coefficients. We reported algebraic equations and details elsewhere,26 and they are summarised in the appendix. Role of the funding source The funder of the study had no role in study design, data collection, data analysis, data interpretation, or writing of the report. The corresponding author had full access to all the data in the study and had final responsibility for the decision to submit for publication. Results Table 1 shows the descriptive statistics from each country. The dataset included 74 225 200 deaths. As expected, the populations in different countries experienced a broad range of temperatures, with country-specific averages ranging from 6·5°C in Canada to 27·6°C in Thailand. These temperatures are illustrative of regions characterised by different climates: from cold countries (Canada, Sweden, and to a lesser extent UK), through temperate latitudes in the Mediterranean (Spain and Italy), east Asia (South Korea and Japan), and southern-hemisphere areas (Australia), to tropical and subtropical areas (Brazil, Taiwan, and Thailand). Other large countries (China and USA) included locations with more heterogeneous climates. Figure 1 shows overall cumulative exposure-response curves (best linear unbiased predictions) for 13 cities selected to represent each country, with the corresponding minimum mortality temperature and the cutoffs to define extreme temperatures. The corresponding graphs for all 384 locations are reported in the appendix. The temperature distributions emphasise how the hot temperature range, although characterised by a high RR, consists of only a small proportion of days. The median minimum mortality percentile ranges were at about the 80th and 90th percentiles for most countries, with the exception of the tropical and subtropical areas of Brazil, Taiwan, and Thailand, where it seemed to be near the 60th percentile (table 2). Risk increases slowly and linearly for cold temperatures below the minimum mortality www.thelancet.com Published online May 21, 2015 http://dx.doi.org/10.1016/S0140-6736(14)62114-0 Articles Attributable fraction (%) 10 8 Extreme cold Moderate cold Moderate heat Extreme heat 6 4 2 0 Australia Brazil Canada China Italy Japan South Korea Country Spain Sweden Taiwan Thailand UK USA Figure 2: Fraction of all-cause mortality attributable to moderate and extreme hot and cold temperature by country Extreme and moderate high and low temperatures were defined with the minimum mortality temperature and the 2·5th and 97·5th percentiles of temperature. distribution as cutoffs. temperature, although some locations (eg, London and Madrid) showed a higher increase for extreme cold than did the others. By contrast, risk generally escalated quickly and non-linearly at high temperatures. Results from our multivariate meta-regression suggest that, although significant, residual heterogeneity is low after country indicators, average temperature, and temperature range had been included as meta-predictors, with an I² of 36·3%. Although all three predictors significantly modify the temperature– mortality association, either in single-predictor or full models, the country indicators account for a much higher proportion of heterogeneity than do average temperature or temperature range (appendix). The main results (table 2) were the estimated attributable fraction calculated as total and as separated components caused by cold and hot temperatures in each country (see appendix for location-specific figures). Overall, the total fraction of deaths caused by both heat and cold was 7·71% (95% eCI 7·43–7·91), although this fraction varied substantially between countries, with the highest attributable risk in Italy, China, and Japan, and the lowest estimates in Thailand, Brazil, and Sweden (table 2). Although the CI for Sweden was not significant, the results seemed more likely to be caused by the small dataset than by a different pattern. Cold was responsible for most of the burden (total estimate 7·29%, 95% eCI 7·02–7·49%), while the fraction attributable to heat was small (0·42%, 0·39–0·44). This difference was mainly caused by the high minimum-mortality percentile, with most of the mean daily temperatures being lower than the optimum value. The attributable risk can be separated into components related to moderate and extreme temperatures (figure 2). The appendix contains estimates for different temperature percentile ranges. In all countries, most of the mortality risk attributable to temperature was related to moderate cold, with an overall estimate of 6·66% (95% eCI 6·41–6·86). Extreme temperatures (either cold or hot) were responsible for a small fraction, corresponding to 0·86% (0·84–0·87%). These results are consistent with the exposure-response associations and temperature distributions in figure 1. Although the range corres ponding to moderate cold had a comparatively low RR, it included the most days in the series. Our sensitivity analysis suggested that our results were not dependent on modelling assumptions (appendix). Discussion Our findings show that temperature is responsible for advancing a substantial fraction of deaths, corresponding to 7·71% of mortality in the selected countries within the study period. Most of this mortality burden was caused by days colder than the optimum temperature (7·29%), compared with days warmer than the optimum temperature (0·42%). Furthermore, most deaths were caused by exposure to moderately hot and cold temperatures, and the contribution of extreme days was comparatively low, despite increased RRs. The study was based on the largest dataset ever collected to assess temperature–health associations, and included more than 74 million deaths from 13 countries (panel). The analysis of data from 384 locations provides evidence for temperature-related mortality risk in a wide range of climates and populations with different demographic, socioeconomic, and infrastructural characteristics. A strength of the study was the application of new, flexible statistical models to characterise the temperaturemortality association and pool estimates across locations. In particular, while previous studies relied on simplification of the exposure-response or lag structure, the approach we used here enabled us to estimate and pool non-linear and delayed dependencies and to identify the temperature of minimum mortality. Comparison with previous studies that reported data for attributable deaths is limited by several factors, particularly the variation in study designs and modelling approaches and the use of alternative definitions of attributable risk measures. Findings from studies that focused on specific events or periods with extreme www.thelancet.com Published online May 21, 2015 http://dx.doi.org/10.1016/S0140-6736(14)62114-0 5 Articles Panel: Research in context Systematic review We searched the literature to identify articles that reported estimates of the effect of non-optimum ambient temperature on mortality and used attributable risk measures as the main effect summary. We searched PubMed using combinations of the terms “temperature” or “heat” or “cold”, and “mortality” or “death*”, and “attributable” or “impact”. We searched papers written in English from inception to Dec 31, 2013. We then manually selected relevant articles by reading the abstracts. Although several studies13–19 reported estimates of attributable risk, they used different definitions of summary measures and used various designs and analytical methods, which made the comparison difficult. Most of these investigations focused on heat-related health effects, and few assessed the attributable component caused by cold temperatures. More importantly, these studies restricted their assessments to single cities or countries, and no study has so far provided a comprehensive assessment across populations exposed to different climates by use of consistent statistical approaches. Interpretation We report that non-optimum ambient temperature is responsible for substantial excess in mortality, with important differences between countries. Although most previous research has focused on heat-related effects, most of the attributable deaths were caused by cold temperatures. Despite the attention given to extreme weather events, most of the effect happened on moderately hot and moderately cold days, especially moderately cold days. This evidence is important for improvements to public health policies aimed at prevention of temperature-related health consequences, and provides a platform to extend predictions on future effects in climate-change scenarios. temperatures suggest a mortality increase of 8·9–12·1% during heat waves and 12·8% during cold spells.16,17 Investigators who extended the analysis to the whole summer season report estimates of 1·6–2·0% for attributable mortality caused by heat.13,19 Studies that include attributable risk measures for whole-year mortality, and thus adopt a comparable denominator, report values close to ours: Hajat and colleagues reported that the all-cause mortality attributable to heat was between 0·37% and 1·45% in three European cities,14 and Carson and colleagues15 estimated that 5·4% of deaths were attributable to cold but none to heat in London. Various underlying mechanisms have been postulated to explain the increased mortality risk associated with exposure to high and low ambient temperature. Physiological effects leading to heat-related deaths are not well known yet, and probably vary for different mortality causes. In the case of the association of heat with cardiovascular mortality, the cause accounting for the greatest burden, acute events seem to be triggered when the body exceeds its thermoregulatory threshold, after changes in heart rate, blood viscosity and coagulability, reductions in cerebral perfusion, and attenuated vasoconstrictor responsiveness.27 Heat also increases mortality risk for other causes: a suggested mechanism is through the alteration of fluid and electrolytic balance in people affected by chronic diseases or in people with impaired responsiveness to environmental conditions.1,8 These sudden physiological responses are consistent with the steep, supralinear increase in risk above the optimum 6 temperature (figure 1, appendix), which was associated with a comparatively high burden attributable to extremely high temperature. The biological processes that underlie cold-related mortality mainly have cardio vascular and respiratory effects. Exposure to cold has been associated with cardiovascular stress by affecting factors such as blood pressure and plasma fibrinogen, vasoconstriction and blood viscosity, and inflammatory responses.28,29 Similarly, cold induces bronchoconstriction and suppresses mucociliary defences and other immunological reactions, resulting in local inflammation and increased risk of respiratory infections.30 These physiological responses can persist for longer than those attributed to heat,28 and seem to produce mortality risks that follow a smooth, close-to-linear response, with most of the attributable risk occurring in moderately cold days. Some limitations must be acknowledged. First, although this investigation includes populations with markedly different characteristics and living in a wide range of climates, the findings cannot be interpreted as globally representative. We did not include entire regions, such as Africa or the Middle East, and the assessment was mainly restricted to urban populations. Although our results suggest substantial intercountry variation in attributable risk for both heat and cold, the analysis did not characterise these differences to identify determinants of susceptibility or resilience to the effects of temperature. These limitations can be addressed in future research by extension of the dataset to populations living in other regions, and by collection of standardised measures of meta-variables for locationspecific characteristics to be included in the secondstage meta-regression. Results from these analyses would complement the evidence provided in this study. We identified a substantial effect of heat and cold on mortality, with attributable figures that varied by country. The optimum temperature at which the risk is lowest was well above the median, and seemed to be increased in cold regions. Cold was responsible for a higher proportion of deaths than was heat, while moderate hot and cold temperatures represented most of the total health burden. Research on the association between human health and ambient temperature has so far focused mainly on the effects of extreme heat, and public health plans have implemented policies and interventions designed almost exclusively for heatwave periods. Our results suggest that public-health policies and adaptation measures should be extended and refocused to take account of the whole range of effects associated with temperature, although further research is needed to clarify how much of the excess mortality related to each component is preventable. Our study also provides a platform to improve and extend predictions of the effects of climate change; our findings emphasise how a comprehensive assessment is needed to provide an appropriate estimate of the health consequences of various climate-change scenarios. www.thelancet.com Published online May 21, 2015 http://dx.doi.org/10.1016/S0140-6736(14)62114-0 Articles Contributors AG, YG, MH, and BA set up the collaborative network. AG designed the study, collected and standardised the data, and coordinated the work. AG, BA, and ML developed the statistical methods. AG did the statistical analysis and took the lead in drafting of the manuscript and interpretation of the results. BA provided substantial scientific input in interpretation of the results and drafting of the manuscript. YG, MH, EL, AZ, JS, AT, ST, JR, BF, ML, MDS, MLB, Y-LLG, C-fW, HKa, S-MY, MdSZSC, PHNS, YH, and HKi provided the data, and contributed to the interpretation of the results and the submitted version of the manuscript. Declaration of interests We declare no competing interests. Acknowledgments This study and AG were supported by the UK Medical Research Council (grant G1002296). YG was supported by a University of Queensland Research Fellowship. AT was supported by the Ministry of Education of the Spanish Government (Salvador Madariaga’s grant PRX12/00515). ST was supported by an NHMRC research fellowship (#553043) and an ARC Discovery Grant (DP110100651). YH was supported by the Environment Research and Technology Development Fund (S-8 & S10) of the Ministry of the Environment, Japan. MH, Y-LLG, C-fW, S-MY, YH, and HKi were supported by the Global Research Laboratory (grant K21004000001-10A0500-00710) through the National Research Foundation of Korea (NRF). We thank Benjawan Tawatsupa and Kornwipa Punnasiri for providing data for the 62 provinces in Thailand. References 1 Basu R, Samet JM. Relation between elevated ambient temperature and mortality: a review of the epidemiologic evidence. Epidemiol Rev 2002; 24: 190–202. 2 Ye X, Wolff R, Yu W, Vaneckova P, Pan X, Tong S. Ambient temperature and morbidity: a review of epidemiological evidence. Environ Health Perspect 2012; 120: 19–28. 3 Le Tertre A, Lefranc A, Eilstein D, et al. Impact of the 2003 heatwave on all-cause mortality in 9 French cities. Epidemiology 2006; 17: 75–79. 4 Semenza JC, Rubin CH, Falter KH, et al. Heat-related deaths during the July 1995 heat wave in Chicago. N Engl J Med 1996; 335: 84–90. 5 IPCC. Climate change 2013: the physical science basis. Working group I contribution to the fifth assessment report of the intergovernmental panel on climate change. Cambridge, UK and New York, USA: Cambridge University Press, 2013. 6 Analitis A, Katsouyanni K, Biggeri A, et al. Effects of cold weather on mortality: results from 15 European cities within the PHEWE Project. Am J Epidemiol 2008; 168: 1397. 7 Anderson BG, Bell ML. Weather-related mortality: how heat, cold, and heat waves affect mortality in the United States. Epidemiology 2009; 20: 205–13. 8 Gasparrini A, Armstrong B, Kovats S, Wilkinson P. The effect of high temperatures on cause-specific mortality in England and Wales. Occup Environ Med 2012; 69: 56–61. 9 The Eurowinter Group. Cold exposure and winter mortality from ischaemic heart disease, cerebrovascular disease, respiratory disease, and all causes in warm and cold regions of Europe. Lancet 1997; 349: 1341–46. 10 Zanobetti A, O’Neill MS, Gronlund CJ, Schwartz JD. Susceptibility to mortality in weather extremes: effect modification by personal and small-area characteristics. Epidemiology 2013; 24: 809–19. 11 Hajat S, O’Connor M, Kosatsky T. Health effects of hot weather: from awareness of risk factors to effective health protection. Lancet 2010; 375: 856–63. 12 McMichael AJ, Wilkinson P, Kovats RS, et al. International study of temperature, heat and urban mortality: the ‘ISOTHURM’ project. Int J Epidemiol 2008; 37: 1121–31. 13 Baccini M, Kosatsky T, Analitis A, et al. Impact of heat on mortality in 15 European cities: attributable deaths under different weather scenarios. J Epidemiol Community Health 2011; 65: 64–70. 14 Hajat S, Armstrong B, Baccini M, et al. Impact of high temperatures on mortality: is there an added heat wave effect? Epidemiology 2006; 17: 632–38. 15 Carson C, Hajat S, Armstrong B, Wilkinson P. Declining vulnerability to temperature-related mortality in London over the 20th century. 16 Huynen MM, Martens P, Schram D, Weijenberg MP, Kunst AE. The impact of heat waves and cold spells on mortality rates in the Dutch population. Environ Health Perspect 2001; 109: 463–70. 17 Rooney C, McMichael AJ, Kovats RS, Coleman MP. Excess mortality in England and Wales, and in Greater London, during the 1995 heatwave. J Epidemiol Community Health 1998; 52: 482–86. 18 Peng RD, Bobb JF, Tebaldi C, McDaniel L, Bell ML, Dominici F. Toward a quantitative estimate of future heat wave mortality under global climate change. Environ Health Perspect 2011; 119: 701–06. 19 Basagana X, Sartini C, Barrera-Gomez J, et al. Heat waves and cause-specific mortality at all ages. Epidemiology 2011; 22: 765–72. 20 Bhaskaran K, Gasparrini A, Hajat S, Smeeth L, Armstrong B. Time series regression studies in environmental epidemiology. Int J Epidemiol 2013; 42: 1187–95. 21 Gasparrini A. Modeling exposure-lag-response associations with distributed lag non-linear models. Stat Med 2014; 33: 881–99. 22 Gasparrini A, Armstrong B. Reducing and meta-analyzing estimates from distributed lag non-linear models. BMC Med Res Methodo 2013; 13: 1. 23 Gasparrini A, Armstrong B, Kenward MG. Multivariate meta-analysis for non-linear and other multi-parameter associations. Stat Med 2012; 31: 3821–39. 24 Higgins JPT, Thompson SG. Quantifying heterogeneity in a meta-analysis. Stat Med 2002; 21: 1539–58. 25 Post E, Hoaglin D, Deck L, Larntz K. An empirical Bayes approach to estimating the relation of mortality to exposure to particulate matter. Risk Anal 2001; 21: 837–42. 26 Gasparrini A, Leone M. Attributable risk from distributed lag models. BMC Med Res Methodol 2014; 14: 55. 27 Keatinge WR, Coleshaw SR, Easton JC, Cotter F, Mattock MB, Chelliah R. Increased platelet and red cell counts, blood viscosity, and plasma cholesterol levels during heat stress, and mortality from coronary and cerebral thrombosis. Am J Med 1986; 81: 795–800. 28 Keatinge WR, Coleshaw SR, Cotter F, Mattock M, Murphy M, Chelliah R. Increases in platelet and red cell counts, blood viscosity, and arterial pressure during mild surface cooling: factors in mortality from coronary and cerebral thrombosis in winter. BMJ 1984; 289: 1405–08. 29 Woodhouse PR, Khaw KT, Plummer M, Foley A, Meade TW. Seasonal variations of plasma fibrinogen and factor VII activity in the elderly: winter infections and death from cardiovascular disease. Lancet 1994; 343: 435–39. 30 Eccles R. An explanation for the seasonality of acute upper respiratory tract viral infections. Acta Oto-laryngol 2002; 122: 183–91. www.thelancet.com Published online May 21, 2015 http://dx.doi.org/10.1016/S0140-6736(14)62114-0 7 Comment Climate and health: mortality attributable to heat and cold Gasparrini and colleagues4 report that, first, cold-related deaths outnumbered heat-related deaths by a factor of nearly 20, overall. Second, deaths attributable to moderately non-optimum temperatures substantially outnumbered those attributable to extreme temperatures; and third, the minimum mortality temp erature was usually well above the median temperature. In the study, most attributable deaths were associated with cold (7·29%, 95% empirical CI 7·02–7·49), while only 0·42% (0·39–0·44) of deaths were attributable to heat, a large disparity between the effects of high and low temperatures compared with previous studies.5,6 The investigators mention that their results could be extended to projections of temperature-related mortality in climate-change scenarios. In 2014, the Intergovernmental Panel on Climate Change7 reported that, although climate change will lead to an increase in heat-related mortality and a decrease in cold-related mortality in some parts of the world, the current health burden of climate change was insufficiently known and the magnitude of such effects had not been addressed globally. The high proportion of deaths attributable to cold rather than heat seems to offer an alternative perspective on global warming and human health. However, if—as the data seem to show—extreme cold is relatively unimportant, then a few degrees of warming will not yield a large reduction in cold-related mortality. Moreover, if extreme heat is important, then the same www.thelancet.com Published online May 21, 2015 http://dx.doi.org/10.1016/S0140-6736(15)60897-2 Published Online May 21, 2015 http://dx.doi.org/10.1016/ S0140-6736(15)60897-2 See Online/Articles http://dx.doi.org/10.1016/ S0140-6736(14)62114-0 Doctor Stock/Science Faction/Corbis The European heatwave of 2003 showed the potentially disastrous effects of heatwaves. About 70 000 premature deaths resulted, notably in France, and a series of lethal heatwaves have subsequently occurred in several countries.1 However, less well appreciated is the similar burden of mortality from moderately hot weather, which, depending on definitions, could be greater than that of mortality attributable to extreme heat in some places.2 Evidence is accumulating about the health risks of abnormal ambient temperatures. Conventionally, studies either focus on the effects of extreme temperature events, or aim to define exposure–response associations between temperature and mortality.1,2 However, whether data that are collected at country, or even city, level are relevant to other climatic settings is doubtful. Moreover, a focus on extreme weather (such as heatwaves) might ignore the incremental risk of moderately unusual temperatures. Both high and low temperatures have been reported to be associated with mortality and morbidity from causes such as cardiovascular disease and respiratory disease.3 Although deaths attributable to cold are substantially more common in most places than are those attributable to heat, they attract far less public attention.3 In The Lancet, Antonio Gasparrini and colleagues4 use a very large multicountry database and novel methods to present a quantitative analysis of the attributable risk of ambient temperature for mortality. They collected data for daily mortality, temperature, and other confounding variables from 13 countries, which included more than 74 million deaths recorded in 384 locations across temperate and tropical climates (roughly a third of locations were in the USA). The investigators analysed the data with a time series quasi-Poisson model to obtain the cumulative exposure–response association of temperature and mortality for each location. The total effect of a given day’s temperature on the death rate was defined as the sum of the effect on that day and 21 subsequent days. These associations were adjusted for average temperature, range of temperature, and country indicator; the minimum mortality temperature—or optimum temperature—and the fraction of deaths attributable to non-optimum temperature were calculated for each country. The effect on mortality was divided into cold versus heat, and moderate versus extreme. 1 Comment few additional degrees might cause a substantial increase in heat-related mortality.8,9 Gasparrini and colleagues4 also report that moderately non-optimum temperatures accounted for nearly 7% of the overall mortality, while extreme temperatures accounted for less than 1%, which suggests that efforts related to adaptation to temperature risk should focus on moderate non-optimum conditions instead of record-breaking weather. However, this finding applies more to cold than to heat, and, crucially, depends on the definition of extreme. The definition used by Gasparrini and colleagues for extreme cold was daily average temperature less than the 2·5th percentile for each location, while they used the 97·5th percentile to define extreme heat. Because the minimum mortality temperature tends to be near the 80th or even 90th percentile, extreme heat occurs on a large proportion— possibly as many as a quarter—of days that have temperatures higher than the minimum mortality temperature, while extreme cold occurs on a much smaller fraction of cool days—only about one in 30. Moreover, the mortality–temperature response functions tend to become increasingly steep at high temperatures, but become less steep at low temperatures in most places, with London, UK, and Madrid, Spain, being notable exceptions. Overall, deaths attributable to extreme heat are roughly as frequent as those attributable to moderate heat, while those attributable to extreme cold are negligible compared with those caused by moderate cold. To address the different risks for heat and cold and to develop adaptation strategies according to local conditions, it would be more helpful to treat the two extremes separately. The reported results4 have remarkably narrow confidence intervals: eg, the overall mortality attributed to non-optimum temperature was reported to be 7·71% (95% empirical CI 7·43–7·91). Although such narrow confidence intervals reflect the very large dataset used, it is worth considering what random process gave rise to this minimum uncertainty, and whether other random inputs that would increase it have been ignored. In fact, empirical CIs depend on the structure of the available data, and so show only the random (Poisson-distributed) occurrence of deaths in these locations over the measured time spans. As the investigators explain, their results are not globally representative, so should be interpreted with caution when applied to other regions that were not 2 included in the database, especially by policy makers. How representative the results are of temperature-attributable mortality worldwide would be interesting to know. The CIs would certainly be much wider if the analysis took into account the process of sampling countries, but the main results might still be robust. Other limitations exist, and further work is needed. As Gasparrini and colleagues4 admit, factors such as susceptibility or resilience have not been included in the analysis, including socioeconomic status, age, and confounding air pollutants.10 For example, although the authors used each country as a proxy to control for regional characteristics in the meta-analysis, the reported total attributable mortality fraction of each country is still positively associated with the proportion of the population aged 60 years or older in 2013.11 China and Sweden are exceptions to the trend, possibly because of their extreme population and development situations. Since high or low temperatures affect susceptible groups such as unwell, young, and elderly people the most,12–14 attempts to mitigate the risk associated with temperature would benefit from in-depth studies of the interaction between attributable mortality and socioeconomic factors, to avoid adverse policy outcomes and achieve effective adaptation. Nonetheless, despite these limitations, the methods and results of Gasparrini and colleagues’ study set a benchmark and starting point for future research. *Keith Dear, Zhan Wang Global Health Research Center, Duke Kunshan University, Kunshan, Jiangsu 215316, China [email protected] We declare no competing interests. Copyright © Dear, et al. Open Access article distributed under the terms of CC BY-NC-ND. 1 2 3 4 5 6 Christidis N, Jones GS, Stott PA. Dramatically increasing chance of extremely hot summers since the 2003 European heatwave. Nat Clim Chang 2015; 5: 46–50. Bull G, Morton J. Environment, temperature and death rates. Age Ageing 1978; 7: 210–24. Basu R, Samet JM. Relation between elevated ambient temperature and mortality: a review of the epidemiologic evidence. Epidemiol Rev 2002; 24: 190–202. Gasparrini A, Guo Y, Hashizume M, et al. Mortality risk attributable to high and low ambient temperature: a multicountry observational study. Lancet 2015; published online May 21. http://dx.doi.org/10.1016/ S0140-6736(14)62114-0. Anderson BG, Bell ML. Weather-related mortality: how heat, cold, and heat waves affect mortality in the United States. Epidemiology 2009; 20: 205–13. Guo Y, Barnett AG, Pan X, Yu W, Tong S. The impact of temperature on mortality in Tianjin, China: a case-crossover design with a distributed lag non-linear model. Environ Health Perspect 2011; 119: 1719–25. www.thelancet.com Published online May 21, 2015 http://dx.doi.org/10.1016/S0140-6736(15)60897-2 Comment 7 IPCC. Climate Change 2014: synthesis report: contribution of working groups I, II and III to the fifth assessment report of the Intergovernmental Panel on Climate Change. Core Writing Team, Pachauri RK, Meyer LA, eds. Geneva: Intergovernmental Panel on Climate Change, 2014: 151. 8 Staddon PL, Montgomery HE, Depledge MH. Climate warming will not decrease winter mortality. Nat Clim Chang 2014; 4: 190–94. 9 Bennett CM, Dear KBG, McMichael AJ. Shifts in the seasonal distribution of deaths in Australia, 1968–2007. Int J Biometeorol 2014; 58: 835–42. 10 Dear K, Ranmuthugala G, Kjellström T, Skinner C, Hanigan I. Effects of temperature and ozone on daily mortality during the August 2003 heat wave in France. Arch Environ Occup Health 2005; 60: 205–12. 11 United Nations, Department of Economic and Social Affairs, Population Division. World Population Ageing 2013. New York: United Nations, 2013. 12 McGeehin MA, Mirabelli M. The potential impacts of climate variability and change on temperature-related morbidity and mortality in the United States. Environ Health Perspect 2001; 109 (suppl 2): 185–89. 13 Basu R. High ambient temperature and mortality: a review of epidemiologic studies from 2001 to 2008. Environ Health 2009; 8: 40. 14 Yu W, Mengersen K, Wang X, et al. Daily average temperature and mortality among the elderly: a meta-analysis and systematic review of epidemiological evidence. Int J Biometeorol 2012; 56: 569–81. www.thelancet.com Published online May 21, 2015 http://dx.doi.org/10.1016/S0140-6736(15)60897-2 3


© Copyright 2026