
acculturation and health experiences among young immigrant
ACCULTURATION AND HEALTH EXPERIENCES AMONG YOUNG IMMIGRANT CANADIANS by Atif Azam Kukaswadia A thesis submitted to the Graduate Program in Epidemiology in conformity with the requirements for the degree of Doctor of Philosophy Queen’s University Kingston, Ontario, Canada (April, 2015) Copyright ©Atif Azam Kukaswadia, 2015 Abstract This thesis investigates the measurement of acculturation, and the effects of acculturation on obesity, physical activity and sedentary behaviour, among Canadian youth. It consists of four manuscripts. The first manuscript developed a short, 16-item questionnaire that measures acculturation among youth in Canada; named the “Bicultural Youth Acculturation Questionnaire.” The questionnaire was pilot tested on a sample of Canadian young people aged 18-25. The BYAQ demonstrated good internal consistency (Cronbach’s alphas > .75), and convergent validity with immigrant generation. The second manuscript examined the relationship between immigrant generation and race/ethnic group on BMI, using data from the 2009/10 Canadian Health Behaviour in School Aged Children (HBSC) study. This study found that foreign-born youth had lower mean BMI percentiles than youth born in Canada, and this did not differ by time since immigration. Within the same ethnic group, foreign-born Arab/West Asian and East Indian/South Asian youth had lower BMIs than peers born in Canada. The third manuscript examined the relationship between time since immigration and ethnic group with physical activity using the Canadian HSBC study data. Youth who immigrated within the last 1-2 years were less likely to meet the physical activity guidelines of 7 days a week of at least 60 minutes of MVPA compared to peers born in Canada. Conversely, no differences were observed between youth who immigrated 6+ years previously and Canadian born peers. Finally, East and South-East Asian youth were less likely to meet the physical activity guidelines than Canadian host culture peers, regardless of time since immigration. The fourth manuscript examined the relationship between immigrant generation and ethnic group on screen time, and how screen time changed over two years of follow-up, using the National Longitudinal ii Survey of Children and Youth (NLSCY). Screen time increased in all groups over follow-up. The unique finding of this study was that 1st generation immigrants reported the largest increase in screen time. This increase was enough that the low levels of screen time observed among 1st generation immigrants at baseline was consistent with 3rd generation peers at follow up. iii Co-Authorship This thesis presents the work of Atif Kukaswadia in collaboration with his co-authors. Atif Kukaswadia was responsible for the study design, implementation, analysis, and writing the initial drafts of all manuscripts. His supervisors, Dr. Will Pickett and Dr. Ian Janssen, were co-authors on all four manuscripts that form this thesis, provided feedback on the research methods, and editorial feedbacks on all manuscripts and thesis chapters. In addition, Dr. Ian Pike provided technical advice on the Delphi process in Chapter 3. Chapter 3: Development and validation of the Bicultural Youth Acculturation Questionnaire This manuscript is presented as it was submitted to BMJ Open. Funding for this manuscript was provided through the research allowance provided by the Frederick Banting and Charles Best Canada Graduate Scholarship from the Canadian Institutes of Health Research (CIHR). The idea of using the Delphi method to generate consensus was Atif Kukaswadia’s, Ian Janssen’s and Will Pickett’s. Atif Kukaswadia oversaw the Delphi process, and Dr. Ian Pike provided specific feedback on the Delphi methods proposed. Atif Kukaswadia coordinated the Delphi process, and analyzed the results. The Delphi panelists reviewed the proposed questions to identify those important to the study of acculturation. The idea to use an online panel for pilot testing was Dr. Janssen’s, and Atif Kukaswadia identified potential vendors. Atif Kukaswadia ran all associated analyses following data collection and drafted the final manuscript. All coauthors reviewed the final manuscript prior to submission. Chapter 4: The influence of country of birth and ethnicity on BMI among Canadian youth: A national survey This manuscript was formatted for submission to CMAJ Open. All authors conceived the study design. Atif Kukaswadia conducted the statistical analyses, interpreted the findings and wrote the initial draft of the paper with feedback from Dr. Ian Janssen and Dr. Will Pickett. Funding for this manuscript was iv provided by research contracts with the Public Health Agency of Canada and Health Canada as well as operating grants from the Canadian Institutes of Health Research and the Heart and Stroke Foundation of Canada. Reference Kukaswadia A, Pickett W, Janssen I. 2014. The influence of country of birth and ethnicity on BMI among Canadian youth: A national survey. CMAJ Open. DOI: 10.9778/cmajo.20130088 Chapter 5: Time since immigration and ethnicity as predictors of physical activity among Canadian youth: A cross-sectional study This manuscript was formatted for submission to PLOS ONE. All authors conceived the study design. Atif Kukaswadia proposed the use of a nominal regression and conducted the statistical analyses. Atif Kukaswadia interpreted the findings and wrote the initial draft of the paper with feedback from Dr. Ian Janssen and Dr. Will Pickett. Funding for this manuscript was provided by research contracts with the Public Health Agency of Canada and Health Canada as well as operating grants from the Canadian Institutes of Health Research and the Heart and Stroke Foundation of Canada. Reference Kukaswadia A, Pickett W, Janssen I. 2014. Time since immigration and ethnicity as predictors of physical activity among Canadian youth: A cross-sectional study. PLOS ONE. DOI: 10.1371/journal.pone.0089509 Chapter 6: The effects of immigrant generation and ethnicity on screen time among young Canadians: A two year longitudinal study This manuscript is presented as it was submitted to the Journal of Epidemiology and Community Health. Atif Kukaswadia led the design of the study, conducted the statistical analysis, and wrote the initial draft of the manuscript. Dr. Ian Janssen and Dr. Will Pickett provided input on the design of the study, oversaw v the statistical analysis, and provided input on manuscript drafts. All authors have reviewed and approved the final manuscript that was submitted. The National Longitudinal Survey of Children and Youth was conducted by Statistics Canada and sponsored by Human Resources and Skills Development Canada (HRSDC). Both agencies provided funding for the NLSCY, as well as jointly contributed to the development of survey content, research, and dissemination of findings. vi Acknowledgements I would like to start by thanking my supervisors, Dr. Will Pickett and Dr. Ian Janssen. I am grateful to have had the opportunity to learn from you both, and appreciate your support through my PhD journey. Your honesty, integrity, and willingness to always provide me feedback and support was always appreciated. Will, I look forward to our teams meeting in the playoffs again (hopefully with better results for me this time!) I would also like to thank those in the Department of Community Health and Epidemiology/Public Health Sciences and the Clinical Research Centre for their support, with a special thank you to Lee Watkins and Deb Emerton for their help. Thank you also to the Clinical Research Centre Student Group. Your antics, customized t-shirts, snack breaks, and random dance parties always kept me entertained, and it’s been a pleasure working with all of you. The Thought Tub is richer for having you. This work would not have been possible without the financial support of Queen’s University, the Ministry of Colleges, Training and Universities Ontario Graduate Scholarship, and the Canadian Institutes of Health Research Frederick Banting and Charles Best Canada Graduate Scholarships Doctoral Award. I would also like to thank my friends and colleagues, especially Anne, Kim, Raymond, Sarah, Alison, Hidé and Marion who have been unwavering in their support over the years. I also owe a special debt of gratitude to Rim, Lydia, Liam, Hoefel, Brian and the Gong Show/Danger Zone family for ensuring that I always get some physical activity, and that yes, I do even lift. Finally, thank you to my family. Your love, support, guidance, and willingness to listen to me at all times of the day have allowed me to complete this project. Thank you. vii Table of Contents Abstract ......................................................................................................................................................... ii Co-Authorship.............................................................................................................................................. iv Acknowledgements ..................................................................................................................................... vii List of Figures ............................................................................................................................................ xiv List of Tables .............................................................................................................................................. xv List of Abbreviations ................................................................................................................................. xvi Chapter 1 Introduction .................................................................................................................................. 1 1.1 General overview ................................................................................................................................ 1 1.1.1 Acculturation and immigration .................................................................................................... 1 1.1.2 Acculturation and health outcomes .............................................................................................. 2 1.2 Thesis Aim .......................................................................................................................................... 3 1.2.1 Methodological objective ............................................................................................................. 4 1.2.2 Descriptive and etiologic objectives ............................................................................................ 4 1.3 Thesis organization ............................................................................................................................. 4 1.4 References ........................................................................................................................................... 6 Chapter 2 Literature Review ....................................................................................................................... 11 2.1 Key definitions .................................................................................................................................. 12 2.2 Immigration in Canada ..................................................................................................................... 14 2.3 Acculturation..................................................................................................................................... 15 2.3.1 Criticisms of the bidimensional framework ............................................................................... 16 2.3.2 Acculturation research internationally ....................................................................................... 18 2.3.3 Measurement of acculturation .................................................................................................... 20 2.3.4 Alternative measures of acculturation........................................................................................ 21 2.4 Population health approach ............................................................................................................... 22 2.5 Obesity .............................................................................................................................................. 22 2.5.1 Background ................................................................................................................................ 22 2.5.2 Obesity and acculturation........................................................................................................... 23 2.5.3 Obesity and alternative measures of acculturation..................................................................... 23 2.5.4 Obesity – Important covariates .................................................................................................. 25 2.5.5 Obesity – Summary.................................................................................................................... 26 2.6 Physical activity and acculturation ................................................................................................... 26 2.6.1 Background ................................................................................................................................ 26 viii 2.6.2 Physical activity and acculturation ............................................................................................ 26 2.6.3 Physical activity and alternative measures of acculturation....................................................... 27 2.6.4 Physical activity – Important covariates .................................................................................... 28 2.6.5 Physical activity – Summary...................................................................................................... 29 2.7 Sedentary Behaviour ......................................................................................................................... 29 2.7.1 Background ................................................................................................................................ 29 2.7.2 Sedentary behaviour and acculturation ...................................................................................... 30 2.7.3 Sedentary behaviour and alternative measures of acculturation ................................................ 30 2.7.4 Sedentary behaviour – Important covariates .............................................................................. 31 2.7.5 Sedentary behaviour – Summary ............................................................................................... 32 2.8 Summary ........................................................................................................................................... 32 2.9 References ......................................................................................................................................... 33 Chapter 3 Development and validation of the Bicultural Youth Acculturation Questionnaire .................. 46 3.1 Abstract ............................................................................................................................................. 47 3.2 Background ....................................................................................................................................... 49 3.3 Methods and Results ......................................................................................................................... 50 3.3.1 Part A: Literature Review .......................................................................................................... 51 3.3.1.1 Methods............................................................................................................................... 51 3.3.1.2 Results ................................................................................................................................. 52 3.3.2 Part B: Delphi Process to Select Questionnaire Items ............................................................... 54 3.3.2.1 Methods............................................................................................................................... 54 3.3.2.2 Results ................................................................................................................................. 55 3.3.3 Part C: Item reduction, pilot testing and calculation of psychometrics ..................................... 55 3.3.3.1 Methods............................................................................................................................... 55 3.3.3.2 Results ................................................................................................................................. 57 3.4 Discussion ......................................................................................................................................... 59 3.5 Conclusion ........................................................................................................................................ 63 3.6 Acknowledgements ........................................................................................................................... 63 3.7 References ......................................................................................................................................... 65 3.8 Supplemental Material ...................................................................................................................... 76 Chapter 4 The influence of country of birth and ethnicity on BMI among Canadian youth: A national survey .......................................................................................................................................................... 79 4.1 Abstract ............................................................................................................................................. 80 4.2 Introduction ....................................................................................................................................... 82 ix 4.3 Methods............................................................................................................................................. 83 4.3.1 Data Sources .............................................................................................................................. 83 4.3.2 Primary Exposures – Country of birth and ethnicity.................................................................. 84 4.3.3 Outcome – BMI percentile......................................................................................................... 85 4.3.4 Covariates .................................................................................................................................. 85 4.3.5 Analysis Plan ............................................................................................................................. 85 4.4 Results ............................................................................................................................................... 86 4.5 Discussion ......................................................................................................................................... 87 4.6 Conclusions ....................................................................................................................................... 89 4.7 Acknowledgements ........................................................................................................................... 90 4.8 References ......................................................................................................................................... 92 Chapter 5 Time since immigration and ethnicity as predictors of physical activity among Canadian youth: A cross-sectional study ............................................................................................................................. 102 5.1 Abstract ........................................................................................................................................... 103 5.2 Background ..................................................................................................................................... 105 5.3 Methods........................................................................................................................................... 107 5.3.1 Data Sources ............................................................................................................................ 107 5.3.2 Ethics Statement....................................................................................................................... 108 5.3.3 Primary Exposures – Immigrant generation and ethnicity ....................................................... 109 5.3.4 Outcome – Moderate-to-Vigorous Physical Activity (MVPA) ............................................... 109 5.3.5 Covariates ................................................................................................................................ 110 5.3.6 Analysis Plan ........................................................................................................................... 110 5.4 Results ............................................................................................................................................. 112 5.5 Discussion ....................................................................................................................................... 113 5.6 Conclusion ...................................................................................................................................... 116 5.7 Acknowledgements ......................................................................................................................... 117 5.8 References ....................................................................................................................................... 118 Chapter 6 The effects of immigrant generation and ethnicity on screen time among young Canadians: A two year longitudinal study ....................................................................................................................... 129 6.1 Abstract ........................................................................................................................................... 130 6.2 Background ..................................................................................................................................... 132 6.3 Methods........................................................................................................................................... 133 6.3.1 Data source and survey administration .................................................................................... 133 6.3.2 Exposures (immigrant generation and ethnicity) ..................................................................... 135 x 6.3.3 Outcome (screen time) ............................................................................................................. 135 6.3.4 Covariate selection ................................................................................................................... 136 6.3.5 Analysis plan ............................................................................................................................ 136 6.4 Results ............................................................................................................................................. 137 6.5 Discussion ....................................................................................................................................... 141 6.6 Conclusion ...................................................................................................................................... 144 6.7 References ....................................................................................................................................... 147 Chapter 7 General Discussion ................................................................................................................... 151 7.1 Overview ......................................................................................................................................... 151 7.2 Summary of Key Findings .............................................................................................................. 152 7.3 Strengths of the thesis ..................................................................................................................... 156 7.3.1 Strengths of the methodologic manuscript ............................................................................... 156 7.3.2 Strengths of the etiologic manuscripts ..................................................................................... 156 7.4 Limitations of the thesis .................................................................................................................. 157 7.4.1 Information bias and measurement error ................................................................................. 157 7.4.2 Confounding ............................................................................................................................ 159 7.4.3 Selection bias ........................................................................................................................... 160 7.4.4 External validity and generalizability ...................................................................................... 162 7.4.5 Causation.................................................................................................................................. 163 7.4.5.1 Plausibility ........................................................................................................................ 163 7.4.5.2 Temporality ....................................................................................................................... 164 7.4.5.3 Consistency and coherence ............................................................................................... 164 7.4.6 Sample size and power ............................................................................................................. 165 7.5 Changes from original thesis proposal ............................................................................................ 166 7.6 Public health contributions.............................................................................................................. 169 7.7 Methodological contributions ......................................................................................................... 170 7.8 Directions for future research ......................................................................................................... 171 7.8.1 Future methodological research – Further testing of the Bicultural Youth Acculturation Questionnaire .................................................................................................................................... 171 7.8.2 Future etiologic research – Cohort study of health outcomes among immigrants ................... 172 7.8.3 Future methodological research - Measurement of screen time among youth......................... 173 7.9 Suitability as a doctoral thesis in Epidemiology ............................................................................. 174 7.9.1 Methodologic objectives .......................................................................................................... 174 7.9.2 Etiologic Objectives ................................................................................................................. 175 xi 7.9.3 Model building assumptions .................................................................................................... 175 7.9.4 Use of sample weights ............................................................................................................. 176 7.9.5 Administrative responsibilities ................................................................................................ 177 7.9.6 Knowledge translation ............................................................................................................. 177 7.10 Conclusions ................................................................................................................................... 178 7.11 References ..................................................................................................................................... 179 Project Approvals ................................................................................................................. 184 HBSC Survey Methodology ................................................................................................. 188 Overview ............................................................................................................................................... 188 Sampling strategy.................................................................................................................................. 188 Questionnaire description ..................................................................................................................... 189 Consent ................................................................................................................................................. 190 Response rate ........................................................................................................................................ 191 Survey weights ...................................................................................................................................... 191 Distribution of residuals ........................................................................................................................ 191 Key survey items used in this thesis ..................................................................................................... 193 Ethnicity ............................................................................................................................................ 193 Immigrant generation ........................................................................................................................ 193 Time since immigration .................................................................................................................... 193 Height and weight ............................................................................................................................. 193 Physical activity ................................................................................................................................ 194 Screen time........................................................................................................................................ 194 References ............................................................................................................................................. 195 NLSCY Survey Methodology .............................................................................................. 196 Sampling strategy.................................................................................................................................. 196 Questionnaire administration ................................................................................................................ 197 Response rate and sample weights ........................................................................................................ 198 Key survey items................................................................................................................................... 198 Ethnicity ............................................................................................................................................ 198 Immigrant generation ........................................................................................................................ 199 Screen time........................................................................................................................................ 199 References ............................................................................................................................................. 199 Survey Monkey Audience .................................................................................................... 200 Sampling strategy.................................................................................................................................. 200 xii Questionnaire description ..................................................................................................................... 200 Consent ................................................................................................................................................. 202 Response rate ........................................................................................................................................ 203 Key survey items................................................................................................................................... 203 References ............................................................................................................................................. 203 Power Calculations ............................................................................................................... 204 xiii List of Figures Figure 2-1: Acculturation strategies at the individual and societal level (adapted from Sam, 2010) ......... 16 Figure 3-1: Flowchart for literature review................................................................................................. 69 Figure 3-2: Flowchart for selecting items for inclusion in the questionnaire ............................................. 70 Figure 3-3: Bland-Altman Plot of differences between baseline and follow up over the mean response value for each domain ................................................................................................................................. 75 Figure 4-1: Study flow diagram .................................................................................................................. 97 Figure 5-1: Study flow diagram of exclusion criteria used to eliminate observations from the original HBSC sample ............................................................................................................................................ 123 xiv List of Tables Table 3-1: Description of the sample used for pilot testing ........................................................................ 71 Table 3-2: Results of factor analyses, psychometric properties of subscales ............................................. 72 Table 3-3: Means and confidence of subscales by immigrant generation and age at immigration ............ 73 Table 3-4: Reliability of domains ............................................................................................................... 74 Table 4-1: Description of mean BMI percentile by immigrant status and additional covariates, 2010 Canadian HBSC (weighted n = 19,272)...................................................................................................... 98 Table 4-2: Mean BMI percentiles predicted by the three proposed models ............................................. 100 Table 4-3: Exploration of the interaction between ethnicity and immigration generation ....................... 101 Table 5-1: Description of key variables by level of physical activity (n = 23,124). ................................. 124 Table 5-2: Nominal regression modeling of determinants of moderate-to-vigorous physical activity..... 126 Table 5-3: Investigations of interactions between ethnicity and time since immigration. ........................ 127 Table 6-1: Description of the study sample (weighted n =2 943 000) ...................................................... 138 Table 6-2: Mean screen time (hours/day) at baseline, follow up and mean difference for select exposure categories .................................................................................................................................................. 139 Table 6-3: Weighted linear regressions of the associations between the exposures of interest and average screen time (hours/day) ............................................................................................................................. 140 xv List of Abbreviations BMI Body mass index BYAQ Bicultural Youth Acculturation Questionnaire CCHS Canadian Community Health Survey CI Confidence interval CIHR Canadian Institutes of Health Research FAS Family affluence scale HBSC Health Behaviour in School-Aged Children ICC Intraclass correlation coefficient METs Metabolic equivalent of task MVPA Moderate-to-vigorous physical activity NLSCY National Longitudinal Survey of Children and Youth OR Odds ratio RDC Research Data Centre RR Relative risk SD Standard deviation SES Socio-economic status SSHRC Social Sciences and Humanities Research Council xvi Chapter 1 General Introduction 1.1 General overview Acculturation occurs when two cultures meet, and is a multidimensional process of behavioural and psychological change.1 Acculturation commonly occurs when someone immigrates to a new country as, after immigration, individuals have to strike a balance between their heritage culture and the dominant culture of the country they are moving to.1 The bidimensional theory of acculturation hypothesizes that acculturation occurs over two main dimensions, with individuals finding an independent balance between their heritage cultural norms and values, along with the norms and values of the dominant culture.1,2 The process of acculturation may result in changes in health and health-promoting behaviours (e.g., physical activity) as individuals adopt health behaviours and norms of the dominant culture.3–10 While there has been research examining the changing health behaviours of young immigrants to the US11 and Europe12,13 and adult immigrants to Canada,14,15 there is little research on the health of immigrant youth to Canada.16–22 Of particular interest are differences between ethnic groups, especially given differences between the dominant immigrant groups between the US (Hispanic/Latino) and Canada (Asia and the Pacific).23–29 The relationship between immigrant generation and health outcomes may differ by ethnic group, as has been seen in previous studies.12,19,30–35 Canada provides a unique context to explore these potential differences. 1.1.1 Acculturation and immigration Since 1991, Canada has admitted over 200,000 new immigrants annually, and of these, 20% were below the age of 14.23 As a result, a large proportion of Canadians are immigrants; 19.8% of 1 Canadians are first generation Canadians, i.e., born abroad and moved to Canada, and this is expected to rise to 25%-28% by 2031.36 Acculturation is often used synonymously with measures relating to immigration in the literature. These measures include time since immigration, as well as immigrant generation, i.e., born abroad (1st generation), born in the native country to parents born abroad (2nd generation) or being born in the native country to parents born in the native country (3rd generation).37–49 These variables assume that those who have been in the native country for longer, e.g., those who report a greater time since immigration, or who are of a higher immigrant generation, are more accultured to the native country. These measures are considerably easier to obtain through selfreport questions, i.e., “Where were you/your parents born?” than complex questionnaires focusing on acculturation. They can also highlight priority populations for public health professionals, such as recent immigrants (i.e., those who immigrated within the last 5 years), if these groups report being at higher risks of adverse health behaviours and outcomes. Multiculturalism ensures that all Canadians can take pride in their ancestry and have a sense of belonging in Canada.50 This impacts both first and second generation Canadians.23 A large proportion of Canadians are therefore undergoing acculturation; 22.7% and 15.9% of Canadians above the age of 15 are first and second generation, respectively.36 Despite the large number of Canadians undergoing acculturation, very little research has focused on how aspects of the health of new youth immigrants change as they acculturate to being in Canada. 1.1.2 Acculturation and health outcomes Several markers of health act as important predictors of future health outcomes among youth. Childhood obesity is one outcome of contemporary interest.51–53 Obesity is prevalent in Canada; 2 10% of 11-17 year old youth suffer from obesity, and even at this early age, obesity is associated with physical, mental, and social health problems.51,53–55 Elucidating the mechanisms behind childhood obesity are important, as youth who suffer from obesity are likely to grow to become obese as adults.56 At age 12, a boy with a BMI in the 85th percentile has a 27% chance of being obese, and a 63% chance of being overweight, at age 35.56 Similar trends exist for girls.56 Understanding determinants of childhood obesity can help inform interventions and programs aimed at combatting rising childhood obesity levels. Two important determinants of obesity are insufficient moderate-to-vigorous physical activity 57–59 and excessive sedentary behaviour.31,60,61 It is hypothesized that those who moved to the West when they were younger have adopted Western behaviours, and this manifests as a higher prevalence in childhood obesity.62,63 However, this is complicated by differences in the prevalence of obesity by ethnic group.43,64 Further study is required on whether all immigrant youth, regardless of ethnic group, are equally susceptible to increases in body weight. There is a lack of research on potential differences between immigrant and Canadian-born youth, and whether health experiences of these immigrant youth change as they acculturate to the Canadian environment. In particular, there is a lack of research comparing immigrant generation and these health outcomes by ethnic group. These are important gaps in the literature, and represent areas that public health initiatives can focus on for change. 1.2 Thesis Aim In this thesis I investigate the effects of acculturation on obesity, and obesity-related behaviours of physical activity and sedentary behaviour, among Canadian youth. It includes methodological, descriptive and etiological objectives. 3 1.2.1 Methodological objective The methodological objective of this thesis was to develop and validate a short questionnaire that could measure acculturation among Canadian young people. Currently, instruments that have been developed are either targeted towards specific ethnic groups or adults.65 In addition, they have typically been developed for use in the US.25–28 This study aims to develop and test an instrument that has utility for bicultural youth from a variety of ethnic groups, i.e., those who identify as being members of two separate cultural groups. 1.2.2 Descriptive and etiologic objectives The descriptive objective of this thesis was to describe how obesity and obesity-related behaviours differ according to acculturation. Specifically, we sought to examine 1) how location of birth, i.e., Canadian- vs Foreign-born, impacts body mass index (BMI) among Canadian youth, and 2) how location of birth and physical activity was modified by time since immigration. Both of these studies included secondary objectives of examining the effect of ethnicity on these relationships, and potential effect modification by ethnicity on the main relationship of interest. Finally, this thesis sought to examine the relationship between immigrant generation and ethnicity as predictors of screen time. This was addressed by assessing changes in screen time among youth over a two-year period. 1.3 Thesis organization This thesis follows the regulations outlined by the Queen’s University School of Graduate Studies and Research “General Forms of Theses” and is a manuscript-based thesis. Prior to the manuscripts, there is a literature review chapter that provides an overview of the literature surrounding acculturation, obesity and related behaviours among youth. Following this, four manuscripts have been included. The first manuscript (Chapter 3) describes the development and 4 validation of a short questionnaire module aimed at measuring acculturation in Canadian youth, and is formatted for submission to BMJ Open. The second manuscript (Chapter 4) investigates the role of country of birth and ethnicity on BMI percentile among Canadian youth, and is formatted for submission to CMAJ Open.66 The third manuscript (Chapter 5) explores the relationship between time since immigration and ethnicity as predictors of physical activity among Canadian youth. This is formatted for submission to the journal PLOS One.67 The final manuscript (Chapter 6) is a longitudinal study that examines the relationship between immigrant generation and ethnicity as predictors of screen time over a two year follow-up period, and is formatted for submission to the Journal of Epidemiology and Community Health. The thesis ends with a discussion chapter (Chapter 7) that summarizes the results and findings of this thesis, and implications for public health. 5 1.4 References 1. Sam, D. L. & Berry, J. W. Acculturation: When Individuals and Groups of Different Cultural Backgrounds Meet. Perspect. Psychol. Sci. 5, 472–481 (2010). 2. Berry, J. W. A Psychology of Immigration. J. Soc. Issues 57, 615–631 (2001). 3. Grayson, J. P. Language Background, Ethno-Racial Origin, and Academic Achievement of Students at a Canadian University. Int. Migr. 47, 33–67 (2009). 4. Corak, M. Age at immigration and the education outcomes of children. Anal. Stud. Branch Res. Pap. Ser. (2011). at <http://ftp.iza.org/dp6072.pdf> 5. Taylor, A. & Krahn, H. Aiming high: Educational aspirations of visible minority immigrant youth. Can. Soc. Trends 79, 8–12 (2005). 6. Newbold, B. The short-term health of Canada’s new immigrant arrivals: evidence from LSIC. Ethn. Health 14, 315–36 (2009). 7. Setia, M. S., Quesnel-Vallee, A., Abrahamowicz, M., Tousignant, P. & Lynch, J. Different outcomes for different health measures in immigrants: evidence from a longitudinal analysis of the National Population Health Survey (1994-2006). J. Immigr. Minor. Health 14, 156–65 (2012). 8. De Maio, F. G. & Kemp, E. The deterioration of health status among immigrants to Canada. Glob. Public Health 5, 462–78 (2010). 9. Perez, D. F., Ritvo, P. G., Brown, P. E., Holowaty, E. & Ardern, C. Perceived walkability, social support, age, native language, and vehicle access as correlates of physical activity: a cross-sectional study of low-socioeconomic status, ethnic, minority women. J. Phys. Act. Health 8, 1098–107 (2011). 10. Newbold, K. B. Health Care Use and the Canadian Immigrant Population. Int. J. Heal. Serv. 39, 545–565 (2009). 11. Perreira, K. K. M. & Ornelas, I. J. I. The Physical and Psychological Well-Being of Immigrant Children. Futur. Child. 21, 195–218 (2011). 12. Hansen, A. R., Ekholm, O. & Kjøller, M. Health behaviour among non-Western immigrants with Danish citizenship. Scand. J. Public Health 36, 205–10 (2008). 13. Bischoff, A. & Wanner, P. The self-reported health of immigrant groups in Switzerland. J. Immigr. Minor. Health 10, 325–35 (2008). 14. Raphael, D. Escaping from the Phantom Zone: social determinants of health, public health units and public policy in Canada. Health Promot. Int. 24, 193–8 (2009). 15. Ley, D. & Smith, H. Relations between Deprivation and Immigrant Groups in Large Canadian Cities. Urban Stud. 37, 37–62 (2000). 6 16. Dogra, S., Meisner, B. a & Ardern, C. I. Variation in mode of physical activity by ethnicity and time since immigration: a cross-sectional analysis. Int. J. Behav. Nutr. Phys. Act. 7, 75 (2010). 17. Tremblay, M. S., Bryan, S. N., Pérez, C. E., Ardern, C. I. & Katzmarzyk, P. T. Physical Activity and Immigrant Status: Evidence From the Canadian Community Health Survey. Can. J. Public Heal. 97, 277–282 (2006). 18. Liu, R. et al. Cardiovascular risk factors in ethnic populations within Canada: results from national cross-sectional surveys. Open Med. 4, e143–53 (2010). 19. O’Loughlin, J., Paradis, G., Kishchuk, N., Barnett, T. & Renaud, L. Prevalence and correlates of physical activity behaviors among elementary schoolchildren in multiethnic, low income, inner-city neighborhoods in Montreal, Canada. Ann. Epidemiol. 9, 397–407 (1999). 20. Ali, J. Mental health of Canada’s immigrants. Heal. Rep. 13, 101–107 (2002). 21. Bruce Newbold, K. & Danforth, J. Health status and Canada’s immigrant population. Soc. Sci. Med. 57, 1981–1995 (2003). 22. Setia, M. S., Quesnel-Vallee, A., Abrahamowicz, M., Tousignant, P. & Lynch, J. Convergence of body mass index of immigrants to the Canadian-born population: evidence from the National Population Health Survey (1994-2006). Eur. J. Epidemiol. 24, 611–23 (2009). 23. Citizenship and Immigration Canada. Facts and Figures: Immigration Overview Permanent and Temporary Residents. Transition (2011). at <http://www.cic.gc.ca/english/resources/statistics/menu-fact.asp> 24. Cuellar, I., Arnold, B. & Maldonado, R. Acculturation Rating Scale for Mexican Americans-II: A Revision of the Original ARSMA Scale. Hisp. J. Behav. Sci. 17, 275– 304 (1995). 25. Bauman, S. The Reliability and Validity of the Brief Acculturation Rating Scale for Mexican Americans-II for Children and Adolescents. Hisp. J. Behav. Sci. 27, 426–441 (2005). 26. Marin, G. & Gamba, R. J. A New Measurement of Acculturation for Hispanics: The Bidimensional Acculturation Scale for Hispanics (BAS). Hisp. J. Behav. Sci. 18, 297– 316 (1996). 27. Tsai, J. L., Ying, Y.-W. & Lee, P. a. The Meaning of ‘Being Chinese’ and ‘Being American’: Variation among Chinese American Young Adults. J. Cross. Cult. Psychol. 31, 302–332 (2000). 28. Barry, D. T. Development of a new scale for measuring acculturation: the East Asian Acculturation Measure (EAAM). J. Immigr. Health 3, 193–7 (2001). 7 29. Ryder, A. G., Alden, L. E. & Paulhus, D. L. Is acculturation unidimensional or bidimensional? A head-to-head comparison in the prediction of personality, self-identity, and adjustment. J. Pers. Soc. Psychol. 79, 49–65 (2000). 30. Choi, J. W., Wilbur, J. E., Miller, A., Szalacha, L. & McAuley, E. Correlates of leisuretime physical activity in Korean immigrant women. West. J. Nurs. Res. 30, 620–638 (2008). 31. Singh, G. K., Yu, S. M., Siahpush, M. & Kogan, M. D. High levels of physical inactivity and sedentary behaviors among US immigrant children and adolescents. Arch. Pediatr. Adolesc. Med. 162, 756–63 (2008). 32. Daniel, M. & Wilbur, J. Physical activity among South Asian Indian immigrants: an integrative review. Public Health Nurs. 28, 389–401 (2011). 33. Sagatun, A. et al. Three-year follow-up of physical activity in Norwegian youth from two ethnic groups: associations with socio-demographic factors. BMC Public Health 8, 419 (2008). 34. Kahlin, Y., Werner, S., Romild, U. & Alricsson, M. Self-related health, physical activity, BMI and musculoskeletal complaints: a comparison between foreign and Swedish high school students. Int. J. Adolesc. Med. Health 21, 327–41 (2009). 35. Dassanayake, J., Dharmage, S. C., Gurrin, L., Sundararajan, V. & Payne, W. R. Are Australian immigrants at a risk of being physically inactive? Int. J. Behav. Nutr. Phys. Act. 8, 53 (2011). 36. Caron Malenfant, É., Lebel, A. & Martel, L. Projections of the Diversity of the Canadian Population. Stat. Canada. Cat. (2010). 37. Noh, S., Beiser, M., Kaspar, V. & Hou, F. Perceived racial discrimination, depression, and coping: A study of Southeast Asian refugees in Canada. J. Health Soc. Behav. 40, 193–207 (1999). 38. Beiser, M. et al. Predictors of emotional problems and physical aggression among children of Hong Kong Chinese, Mainland Chinese and Filipino immigrants to Canada. Soc. Psychiatry Psychiatr. Epidemiol. 45, 1011–21 (2010). 39. Strohmeier, D., Spiel, C. & Gradinger, P. Social relationships in multicultural schools: Bullying and victimization. Eur. J. Dev. Psychol. 5, 262–285 (2008). 40. McKenney, K. & Pepler, D. Peer victimization and psychosocial adjustment: The experiences of Canadian immigrant youth. Electron. J. Res. Educ. Psychol. 4, 239–264 (2006). 41. Park, J., Myers, D., Kao, D. & Min, S. Immigrant obesity and unhealthy assimilation: alternative estimates of convergence or divergence, 1995-2005. Soc. Sci. Med. 69, 1625– 33 (2009). 8 42. Akresh, I. R. Overweight and obesity among foreign-born and U.S.-born Hispanics. Biodemography Soc. Biol. 54, 183–99 (2008). 43. Singh, G. K., Kogan, M. D. & Yu, S. M. Disparities in obesity and overweight prevalence among US immigrant children and adolescents by generational status. J. Community Health 34, 271–81 (2009). 44. Harris, K. M. K., Perreira, K. K. M. & Lee, D. Obesity in the transition to adulthood: predictions across race/ethnicity, immigrant generation, and sex. Arch. Pediatr. Adolesc. Med. 163, 1022–1028 (2009). 45. Kirchengast, S. & Schober, E. To be an immigrant: a risk factor for developing overweight and obesity during childhood and adolescence? J. Biosoc. Sci. 38, 695–705 (2006). 46. Oza-Frank, R. & Narayan, K. M. V. Overweight and diabetes prevalence among US immigrants. Am. J. Public Health 100, 661–8 (2010). 47. Grossmann, F. F., Leventhal, M. E., Auer-Böer, B., Wanner, P. & Bischoff, A. Selfreported cardiovascular risk factors in immigrants and Swiss nationals. Public Health Nurs. 28, 129–39 (2010). 48. Oza-Frank, R. & Narayan, K. M. V. Effect of length of residence on overweight by region of birth and age at arrival among US immigrants. Public Health Nutr. 13, 868–75 (2010). 49. Balistreri, K. S. & Van Hook, J. Trajectories of overweight among US school children: a focus on social and economic characteristics. Matern. Child Health J. 15, 610–9 (2011). 50. Citizenship and Immigration Canada. Canadian Multiculturalism: An Inclusive Citizenship. (2012). at <http://www.cic.gc.ca/english/multiculturalism/citizenship.asp> 51. Han, J. C., Lawlor, D. A. & Kimm, S. Y. S. Childhood obesity. Lancet 375, 1737–48 (2010). 52. Shepherd, A. Obesity: prevalence, causes and clinical consequences. Nurs. Stand. 23, 51– 58 (2009). 53. Harriger, J. A. & Thompson, J. K. Psychological consequences of obesity: weight bias and body image in overweight and obese youth. Int. Rev. Psychiatry 24, 247–53 (2012). 54. Roberts, K., Shields, M., de Groh, M., Aziz, A. & Gilbert, J. Overweight and obesity in children and adolescents: Results from the 2009 to 2011 Canadian Health Measures Survey. Heal. Reports 23, 3–7 (2012). 55. Cole, T. J. Establishing a standard definition for child overweight and obesity worldwide: international survey. BMJ 320, 1240–1240 (2000). 9 56. Guo, S. S., Wu, W., Chumlea, W. C. & Roche, A. F. Predicting overweight and obesity in adulthood from body mass index values in childhood and adolescence. Am. J. Clin. Nutr. 76, 653–658 (2002). 57. Janssen, I. & Leblanc, A. G. Systematic review of the health benefits of physical activity and fitness in school-aged children and youth. Int. J. Behav. Nutr. Phys. Act. 7, 40 (2010). 58. Kirkcaldy, B. D., Shephard, R. J. & Siefen, R. G. The relationship between physical activity and self-image and problem behaviour among adolescents. Soc. Psychiatry Psychiatr. Epidemiol. 37, 544–50 (2002). 59. Ortega, F. B., Ruiz, J. R., Castillo, M. J. & Sjöström, M. Physical fitness in childhood and adolescence: a powerful marker of health. Int. J. Obes. (Lond). 32, 1–11 (2008). 60. Taverno, S. E., Rollins, B. Y. & Francis, L. A. Generation, language, body mass index, and activity patterns in Hispanic children. Am. J. Prev. Med. 38, 145–53 (2010). 61. Yang, C., Wu, H., Zhu, M., Brian, G. & Southwell. Tuning in to fit in? Acculturation and media use among Chinese students in the United States. Asian J. Commun. 14, 81–94 (2004). 62. Renzaho, A. M. N. A. M. N., Gibbons, C., Swinburn, B., Jolley, D. & Burns, C. Obesity and undernutrition in sub-Saharan African immigrant and refugee children in Victoria, Australia. Asia Pac. J. Clin. Nutr. 15, 482–90 (2006). 63. Strickman-Stein, N., Gervais, M. & Ludwig, D. Body mass index as a function of length of United States residency among Haitian immigrant children. Ethn. & Dis. 20, (2010). 64. Van Hook, J. & Balistreri, K. S. Immigrant generation, socioeconomic status, and economic development of countries of origin: a longitudinal study of body mass index among children. Soc. Sci. Med. 65, 976–89 (2007). 65. Celenk, O. & Van de Vijver, F. J. R. Assessment of Acculturation: Issues and Overview of Measures. Online Readings Psychol. Cult. 1–22 (2011). at <http://scholarworks.gvsu.edu/orpc/vol8/iss1/10/> 66. Kukaswadia, a., Pickett, W. & Janssen, I. Influence of country of birth and ethnicity on body mass index among Canadian youth: a national survey. C. Open 2, E145–E152 (2014). 67. Kukaswadia, A., Pickett, W. & Janssen, I. Time since immigration and ethnicity as predictors of physical activity among Canadian youth: a cross-sectional study. PLoS One 9, e89509 (2014). 10 Chapter 2 Literature Review This chapter provides an overview of the concept of acculturation as a determinant of health within populations of immigrant Canadian youth. The specific health focus of my thesis is on obesity and its behavioural determinants of physical inactivity and sedentary behaviours. The first section of this chapter defines key terms and concepts that are used throughout the thesis. Next, important concepts that surround issues of immigration within Canada are explored as are immigration processes and trends within Canada. The next section discusses acculturation, as well as provides a discussion of the bi-dimensional acculturation framework that underpins this thesis, and the limitations of this approach. Problems and issues with the measurement of acculturation will also be reviewed. While this section will focus on the measurement of acculturation as a construct in itself, much of the research has used immigrant generation and time since birth to provide indications of acculturation in populations. While these do not measure acculturation directly, they are used frequently as proxy measures, and their strengths and limitations as measures of acculturation will be included in the thematic review. Following this discussion, evidence that connects acculturation and the three major health outcomes of interest to this thesis will be outlined. These outcomes are 1) obesity, 2) physical activity, and 3) sedentary behavior. Each of these sections will describe, in turn, the importance of that health outcome, published evidence of relationships between acculturation and that health outcome, and covariates to be considered when examining such relationships. Notable gaps in the literature will also be identified. 11 2.1 Key definitions The terms child, youth, adolescent and young person will be used to describe the populations under study within this thesis. Child refers to those below the age of 19.1 Youth will be used to define those aged 15 to 24, and refers to the transition from childhood dependence to adulthood independence.2 Adolescent will be used to refer to those aged 12-19, and this term relates to the (developmental) transition from childhood to adulthood. Young person refers to those below the age of 25. In Berry’s original bidimensional framework, the heritage or original culture refers to the culture of an immigrant’s country of origin while the host culture refers to the dominant culture in the country the immigrant is moving to.3 However, the term host culture, as defined by Berry, has been criticized as Canada has no official culture. Thus the term dominant culture is more appropriate for the Canadian context, and is used in this thesis. Heritage country will refer to the country the person has emigrated from, while host country will refer to the country the person has immigrated to. Immigrant status will be used synonymously with place of birth in this document, and will refer to those born in the host country vs those born abroad. Immigrant generation is used to classify immigrants to the host country. A first generation immigrant was born abroad and moved to the host country, while a second generation immigrant was born in the host country to at least one first generation parent. A third generation immigrant is born in the host country to parents born in the host country. Note that while this term is used in this thesis when referring to previously published literature, the term “second generation 12 immigrant” can be considered a misnomer as these individuals were born in Canada.4 Thus, the terms first generation Canadian, second generation Canadian, and third generation Canadian will be used in this thesis, with the same definitions as above. Physical activity refers to movement that increases heart rate and breathing, or energy expenditure by bodily movement.5 Moderate intensity physical activity refers to activity where youths’ energy expenditure levels are 4.0 – 6.9 times resting levels and would typically be associated with moderate increases in breathing, heart rate, and body temperature.5 Examples of common moderate intensity activities are brisk walking, chores or gardening. Vigorous intensity activity refers to activities where youth energy expenditure levels are ≥7.0 times above resting levels and would typically be associated with heavy breathing, substantial increases in heart rate, and sweating. Examples of vigorous intensity activities are jogging, playing basketball or soccer, or jumping rope.5 Current Canadian guidelines are that youth should accumulate at least 60 minutes of moderate-to-vigorous physical activity every day.6,7 Self-report measures used in this thesis define physical activity as “any activity that increases your heart rate and makes you get out of breath some of the time,” for more than 60 minutes.8,9 Physical activity can be broadly grouped into three domains: activity at work, travel, e.g., active transportation, and recreational activities, e.g., organized sports and active play.10 Any combination of these can be used to obtain 60 minutes of moderate-to-vigorous physical activity every day. While accelerometers are the most accurate way to determine physical activity levels, self-report data can be used to provide a measure of physical activity and have demonstrated validity.11 Overweight and obesity will be defined using the body mass index (BMI), a ratio of height to weight. BMI is a commonly used method of evaluating a person’s health risks based on their excess weight.12 Youth BMI cut points were used that are age-and-gender-specific and culture13 and-nation-independent.13–15 BMI can be used for surveillance purposes to identify changes at the population level in the prevalence of obesity.16 It can also be used in the clinical setting to identify obese patients. Sedentary behaviour refers to activities performed in a sitting or lying position where energy expenditure is less than 50% above resting levels.17 For this thesis, only screen-based sedentary behaviours are considered as a proxy for the full definition. Screen time is defined as time spent using a computer, playing video games or watching television. Canadian guidelines for screen time are that youth should not accumulate more than 2 hours of recreational screen time per day.18,19 Sedentary behaviour and physical inactivity are often used interchangeably, although these refer to different health behaviours.20 Physical inactivity refers to lack of moderate-tovigorous physical activity while sedentary behaviour refers to insufficient low intensity activity. 17 2.2 Immigration in Canada Canada’s immigration policy, currently governed by the Immigration and Refugee Protection Act, is built on principles of multiculturalism.21–23 Multiculturalism ensures that all Canadians can take pride in their ancestry and have a sense of belonging in Canada.21,22,24 This has been a necessary policy to assume given the changing demographics of immigrants to Canada. In recent decades, new immigrants to Canada are predominantly from Asia and the Pacific (48.1%) and Africa (23.8%), although a significant portion are from Europe and the UK (14.1%).25 These individuals are coming from regions that have different cultural norms, attitudes and behaviours compared to Canada, where the predominant culture is European in origin.26 Research is required on the health of people from these diverse countries as they acculturate to the Canadian environment.27–29 14 2.3 Acculturation Acculturation is a multidimensional process of socialization and occurs when two societies meet, affecting both the dominant and nondominant group.21 Two frameworks exist to evaluate acculturation: the unidimensional framework and the bidimensional framework. The unidimensional framework suggests that acculturation exists on a continuum, with retention of the heritage culture at one extreme and adoption of the dominant culture at the other.30 Under this framework, as people become more acculturized to the dominant culture, they relinquish their heritage culture.30,31 However, this model promotes assimilation of the host culture and alienates bicultural individuals who may identify with both the host and heritage cultures. The bidimensional framework addresses many of these concerns. The bidimensional framework suggests that acculturation occurs over two dimensions and can include retention or rejection of 1) the host and 2) the heritage cultures. Acculturation is defined as “phenomena which result when groups of individuals having different cultures come into continuous first-hand contact, with subsequent changes in the original patterns of either or both groups”.32 This definition serves as a point of reference within Berry’s acculturation framework and subsequent acculturation models.33–36 At the societal level, effects vary depending on strategies of the host society, as countries can promote or discourage retention of the dominant culture through official policies (Figure 1).22,37,38 At the individual level, the acculturation process can thus result in one of four outcomes: integration, where both groups retain their identity, marginalization, where the individual feels attached to neither group, and separation or assimilation, where individuals feel excluded by either the host or heritage culture, respectively (Figure 1-1).21,22 15 Figure 2-1: Acculturation strategies at the individual and societal level (adapted from Sam, 2010) 2.3.1 Criticisms of the bidimensional framework The bidimensional model provides a framework for conceptualizing acculturation. However, it is not without its own problems, including general criticisms, debate as to its utility, and specific limitations to the study of acculturation in a multicultural society such as Canada. General criticisms of the model include: 1) a lack of all four strategies in all populations, 2) a lack of a priori cut offs to define individuals as high or low on measures of acculturation, making comparisons between studies difficult, and 3) a lack of consideration of specific covariates, such as language, ethnicity and immigrant generation.39–42 The bidimensional model also requires the cultures be orthogonal, i.e., uncorrelated with each other, in order for two distinct scales to emerge. In addition to these general criticisms, there is debate in the acculturation community as to whether this is an appropriate framework to use. The bidimensional framework, as postulated by 16 Berry, assumes that acculturative processes share universal commonalities that can be uncovered and used to predict future outcomes. It is often used by those who wish to generalize conclusions from a sample to the larger population.43–46 This process is most useful when trying to develop quantitative measures.44 The second approach is to consider the dynamics involved in the changes of “culture” and examine these changes following immigration.46 This approach is focused on disentangling the mechanisms associated with these processes, and requires qualitative methodologies such as ethnographies, focus groups and interviews, as it provides a more contextual understanding of a population and their associated behaviours.46 The advantages of the latter approach are evident when one considers the complex interplay of how immigrants act both as individuals and as communities in their new country.44,47 These issues would not be captured within the bidimensional framework. The bidimensional framework also has some specific limitations when considered in the Canadian context. Primarily, the concept of the “host culture” is not one that resonates with the official policy of multiculturalism, as while Canada has two official languages, there is no official culture. As a result, the concept of biculturalism is problematic, as the Canadian population is diverse, and, as part of a policy of multiculturalism, all Canadians contribute to the concept of “being Canadian.” Finally, the bicultural notion of acculturation assumes there is one dominant culture, and does not consider the relationship that one might have with several different groups.48 These are important issues to consider when interpreting quantitative research findings in Canada. These concerns form important limitations when considering the theoretical underpinnings of this thesis. One approach is to view these “opposing” viewpoints as complimentary rather than antagonistic as studies of acculturation, both quantitative and qualitative, can supplement each other. While the first can highlight population-level differences, qualitative and mixed-methods research can then disentangle the mechanisms that underlie these differences in health behaviours 17 and outcomes.45,48 Before quantitative research can be used for policy purposes, discussions with stakeholders such as cross-cultural counselors, health workers, and social workers, as well as members of these communities, are needed in order to determine how best to use findings of acculturation research and to determine if the interpretation of these findings reflects their experiences accurately.45 2.3.2 Acculturation research internationally Acculturation researchers are particularly interested in situating Canadian research within that of the international community. Much of the previous literature has focused on the relationships between acculturation and health in the US context, and there may be relationships here that may generalize to Canada in certain situations. In addition, Europe is another research context where acculturation research is of particular interest. The applicability of US research to the Canadian context is mixed, and differs based on 1) the ethnic groups under study, and 2) the immigration process in both countries. In the US the major non-White ethnic groups are Black and Hispanic Americans, who have unique relationships with health, possibly due to differences in education and income.49–51 Thus, the relationships observed in the US may be unique to the US context. In Canada, the major non-White ethnic groups are East and South East Asian, as well as South Asian.25 In addition, Canadian immigration policies select for immigrants with post-secondary education through the use of the points system, or those who can provide evidence of sufficient finances to set up their own business in Canada.52 Thus, these visible minority groups have significant advantages compared to peers in the US. Europe is also an important location for the study of acculturation. However, acculturation in Europe is different to that within the US and Canada. Within the European Union, citizens are able to move freely between countries, and there is considerable more heterogeneity in language 18 and cultural norms within a (comparatively) small geographic area as compared to the US or Canada. This also leads to differences in the major foreign-born groups in each country.53 International comparisons therefore can be considered, but need to be evaluated on a case-by-case basis. For certain groups, such as Asian-Americans and Asian-Canadians, comparisons may be drawn as they both report higher levels of education compared to peers, despite being in different countries. For example, 57.6% of Asian Americans aged 18-24 were enrolled in colleges and universities, compared to the national average of 39.6%.54 Similarly, data from Canada show that 59.4% of Chinese-Canadian young adults have a university degree, compared to the national average of 37.6%.55 International comparisons need to be considered within the population health approach, as the generalizability of observed differences in health may be the result of differences in education, the social or physical environment, or other factors in these different countries. There is also considerable variation in the ethnic and racial composition of immigrants to Canada, and, depending on the population of interest, the unidimensional or bidimensional framework can be applicable to studies of acculturation and health. For example, among European immigrants to North America, the unidimensional model may be appropriate due to similarities between the dominant and heritage cultures.56 In this example, assimilation and separation may not exist due to comparable cultural norms and practices. This may not be the case for other groups, such as Asian immigrants, whose health may be better explained via the bidimensional framework as they balance retention of their heritage culture with integration with their dominant culture.57 Furthermore, acculturation occurs over several domains, such as language, social norms, or diet, and the level of acculturation can differ depending on the domain chosen.57–59 For example, while someone might be fluent in English and their heritage language, i.e., integration on the language domain, they may prefer to socialize with those of their own heritage group, i.e., separation on the 19 social domain (Figure 1).59 This can help explain the mechanisms underlying specific health behaviours that might change following immigration. 2.3.3 Measurement of acculturation Acculturation is a difficult construct to measure as it is composed of several domains. Due to the cultural sensitivity of acculturation measures, scales have been developed for use among specific populations; a recent review found that 60.9% of publically available acculturation scales were developed for a specific ethnicity or cultural subgroup.60,61 Development of a scale that can be used in a multicultural environment among diverse populations of youth is important for three reasons. First, a bidimensional scale is needed to study acculturation in Canada.58 While unidimensional scales may be appropriate elsewhere, Canadian multiculturalism promotes retention of heritage culture in conjunction with integration into the dominant culture, and these should be assessed independently of each other. Second, although bidimensional instruments have been developed for use in the US, these may not be appropriate for use in Canada.61 Official government policies within the US and Canada differ significantly in their approach towards heritage cultures. While the former discourages retention of the heritage culture as part of the “melting pot” philosophy, the latter promotes it through their official policies and practices as part of the multicultural approach (Figure 1).62 This may result in different domains being “important” in order to feel accultured to the new host environment. Finally, the Canadian immigrant population is from a range of backgrounds and have concomitant diversity in beliefs, both religious and cultural. Scales developed in US have focused on their immigrant and minority groups, in particular the Hispanic/Latino community, while the major immigrant groups to Canada are from East and South East Asia, and South Asia.25,63–65 While one scale, the Stephenson Multigroup Acculturation Scale, has been developed for use among a 20 diverse sample of US adults, it has not been tested among Canadian young adults.56 One Canadian measure, the Vancouver Index of Acculturation, was developed for use among ChineseAmerican/Canadian youth.59 However, it was developed to evaluate culturally specific outcomes, such as taijin kyofusho, a Japanese construct similar to social anxiety and how individuals from collectivist societies adapt to individualistic societies. Thus, its utility is unknown in broader populations.59 A scale needs to be developed that is applicable to people from diverse and heterogeneous backgrounds, such as Asia and the Pacific, as they form a large proportion of the global migrant stock.66,67 2.3.4 Alternative measures of acculturation Due to the difficulty of measuring acculturation, many studies use other measures as approximate indicators of this construct. These may include: country of birth,68–88 immigrant generation,29,68,77,78,89–92 time since immigration76,79,86,93–101 and age at arrival.86,102 It is hypothesized that foreign-born youth are less accultured to the dominant culture than native-born peers, while greater immigrant generation, i.e., third vs. first generation, increased time since immigration and decreased age at arrival are all associated with increased levels of acculturation with the dominant culture. While proxy measures of acculturation, such as immigrant generation, have been used in previous studies and can have high validity, these measures have been criticized for lacking sensitivity and being limited in scope.41,42,103 Even though these measures are easy to quantify, simple to understand, and have clear relevance to public health professionals, evidence for the convergent validity of these measures, i.e., if the constructs of immigrant generation and acculturation, which should be related, are actually related, is mixed.41,42,104 21 2.4 Population health approach This thesis uses the population health approach in order to contextualize the determinants of health. The population health approach posits that health is influenced by the social, economic and physical environments, as well as individual level factors.105 An important consequence of such an approach is that it recognizes that “health” is the consequence of biological, behavioural, environmental and socioeconomic factors. A population health approach to research therefore takes into account the individual determinants of health, the contexts that these individuals live in, as well as the relationships between these variables.105 Therefore, to understand the determinants of important contemporary health outcomes and behaviours such as obesity, physical and sedentary behaviour, covariates at the individual and societal level need to be considered. In particular, the population health approach stresses the importance how individual level associations may be mediated by contextual factors. The original HBSC grant collected data on neighbourhoods surrounding schools as it was theorized that these could be potentially modified for prevention purposes by public health programs. 2.5 Obesity 2.5.1 Background Obesity is a serious health concern in Canada, as 31% of boys and 25% of girls aged 15-19 are overweight or obese.106 Determinants of childhood obesity are multifaceted, and include factors at both individual and contextual levels.107–110 Consequences of childhood obesity are widespread, and include type 2 diabetes, raised blood pressure and asthma,111 as well as mental health problems such as body dissatisfaction and decreased self-esteem.112 If acculturation is associated with adverse health behaviours that lead to childhood obesity, then this can be targeted by public health interventions. 22 2.5.2 Obesity and acculturation It has been hypothesized that as an individual acculturates to a new country, their health profile, and in particular their risk of being overweight and obese, will approximate that of those born there.95 This has been suggested to occur as quickly as over the course of one generation.113 Explanations for this include dietary,86,114 and lifestyle changes,113 although dietary acculturation can be prevented if ethnocultural foods are easily available.115 No studies of the determinants of childhood obesity have investigated the role of acculturation, instead focusing on specific components of acculturation. 2.5.3 Obesity and alternative measures of acculturation Immigrant status has been commonly used as a measure of acculturation when studying the acculturation-obesity relationship.73–86 Youth studies suggest that the prevalence of obesity is higher among immigrants.87,88 Two studies have been performed using the Early Childhood Longitudinal Study Kindergarten Cohort database (ECLS-K), a national sample of US children. The first found that male child immigrants had a higher prevalence of overweight and risk of overweight at each grade level (Kindergarten to Grade 5) (p < .001).88 However, this relationship was not observed among girls: the prevalence of overweight was 18% vs 19% for first generation and native-born peers respectively. A second study analyzed this database longitudinally, and found that male children of immigrants had 1.44 (95% CI: 1.1 to 1.8) the relative odds of being always overweight or at risk of being overweight, i.e., BMI above the 85th percentile using Centers for Disease Control and Prevention growth curves, compared to children of those born in the US from Kindergarten through to eighth grade.87 Three main factors may modify the immigrant status-obesity relationship. These include: immigrant generation, age at arrival and time since immigration. Immigrant generation has been 23 shown to be associated with obesity in several countries. First generation Swedish youth were more likely to report being overweight or obese than Swedish born youth (18.3% vs 8.7%, p = .028).89 Investigation of the relationship between immigrant generation and obesity has yielded mixed results in the US, as the relationship between immigrant generation and obesity varies in strength depending on the ethnic group under study.77,78,90–92 In Canada, immigrant generation has been shown to be associated with increased weight gain during adolescence (ages 12-17) but not childhood (ages 6-11).28 Lower weight gain by immigrants relative to Canadian born children was also observed in a group of Montreal youth aged 9-12 years.29 This may be because younger immigrants are more accultured to the Canadian lifestyle and thus gain weight at the same rate as their Canadian-born peers, regardless of generational status. The latter hypothesis is supported by the finding that lower age at arrival is associated with increased odds of overweight and obesity.86,102 Age at arrival is hypothesized to be associated with acculturation as youth who immigrated to the host country when they were younger likely have closer health behaviours, and thus risks, to their native-born peers. In a study of US adults who immigrated when they were younger than 20, those who immigrated to the US more than 15 years prior to survey administration were 11.0 (95% CI: 5.3-22.6) times more likely to be overweight or obese compared to those who moved within the last year.86 The relationship between immigrant status and obesity may be modified by time since immigration.86,93,94 The benefit conferred to certain immigrant groups has been shown to decrease the longer they have been in the host country as they acculturate to the host country’s norms.95 This has been investigated among adult immigrants to the US,76,96–98 Spain,99 sub-Saharan African youth immigrants to Australia,100 and Haitian youth immigrants to the US.79 One study has investigated this in Canada.101 For Canadian adults, among recent immigrants (< 10 years since 24 immigration) there were significantly increased odds of overweight and obesity observed among Latin American immigrants (OR: 95% CI; 1.6: 1.0 – 2.5), and decreased odds for East and Southeast Asian immigrants (OR: 95% CI; 0.3: 0.3 – 0.4) compared to White immigrants.101 This association persisted among immigrants who had been in Canada for 11 years or longer.101 2.5.4 Obesity – Important covariates Region of origin and ethnicity are associated with obesity among immigrants in the US82,83,85,116 and Canada.28,101,117–119 In Canada, East/Southeast Asian and South Asian adult immigrants have lower odds of overweight or obesity than their White peers.101 Among youth, this relationship was only found among East Asian Canadian immigrants.28 However, this relationship may be modified by socio-economic status (SES). While low SES is associated with increased obesity among White adolescents, no such relationship was observed for Black or Mexican Americans. 120 In addition to individual-level factors, race and ethnicity as determinants of obesity can be modified by parent-level factors. For example, while increased parental income is negatively associated with child BMI among Hispanic and white US-born parents, it is positively associated among Hispanic immigrants.121 Similar results have been observed among Mexican youth.122 Other factors have been shown to be independent predictors of obesity. At the individual level, these include gender77,87,88 and age.87 Higher order factors can exist at the parental level, such as parental education,121 family SES,87,123 acculturation,123 and English language proficiency,88 the socio-environmental level, which includes parental factors as well as peers, school and the community,107,118,124,125 and finally the physical environment, which includes support for healthy eating,126 and active transportation programs.107 25 2.5.5 Obesity – Summary No clear relationship between acculturation and obesity has been demonstrated in either the international or Canadian literatures.27–29,73–89,119 Due to the long-term health impacts of obesity, factors that affect the proposed relationship between acculturation and obesity demand further study in Canada. In particular, differences between ethnicities have been shown to be important.28,29 Ethnicity is also important to investigate due to other relationships with weight, including maternal perceptions of their child’s weight status,127 the type of weight being gained,128,129 and a lower likelihood to discuss diet and exercise with clinicians.94 2.6 Physical activity and acculturation 2.6.1 Background Physical activity has two major areas of benefit: physical and psychosocial. Physical benefits from regular physical activity include lower levels of hypercholesterolemia, healthier blood pressure, lower odds of metabolic syndrome and decreased risks of overweight and obesity.130 Psychosocial benefits can include improve self-image,131 lower anxiety, and low depressive symptomology.131,132 In order to reap these benefits, it is suggested that Canadian youth accumulate at least 60 minutes of moderate-to-vigorous physical activity every day.6,7 Unfortunately, in Canada only 9% of boys and 4% of girls meet this criterion.133,134 2.6.2 Physical activity and acculturation The evidence for the existence of associations between acculturation and physical activity is mixed, and to my knowledge no Canadian findings have been published. Thus, this section is based on findings from other countries. Compared to “separated” or traditional peers (Figure 1), integrated sub-Saharan youth immigrants to Australia were active for an additional 46.9 (95% CI: 26 19.0 – 74.8) minutes per day.135 However, in a study of Hispanic and Asian-American adolescents in the US, increased acculturation was associated with a modest decrease in physical activity (standardized beta coefficient B = -.089, p = .001).136 A recent systematic review of acculturation and physical activity among both adults and youth conducted by Gerber et al. identified 44 studies and showed a mixed association between acculturation and physical activity.137 Nine studies supported the hypothesis that increased acculturation is associated with higher leisure time physical activity, while an additional 16 showed partial support. However, 19 studies did not confirm any such relationship, and, of these, four reported a negative association between higher acculturation and physical activity.137 A challenge in interpreting the findings from this review is that the included studies conceptualized acculturation in different ways, ranging from a bidimensional scale of acculturation,135 to length of stay in the host country.27 These were all deemed measures of “acculturation,” despite the variation in validity of these measures.137 2.6.3 Physical activity and alternative measures of acculturation A commonly used proxy for acculturation in the physical activity literature is immigrant generation, and especially time since immigration.138–140 Analyses of adults aged 20 and older in three cycles of the Canadian Community Health Survey reported that recent immigrants (< 10 years) are 2.68 (95% CI: 2.54 – 2.83) times more likely to get no meaningful physical activity compared to non-immigrants.138 Even established immigrants (> 10 years) have increased odds of no physical activity (OR: 1.30, 95% CI: 1.26 – 1.35) compared to Canadian-born peers.138 However, when considering immigrant generation as a predictor of physical activity among adults, ethnicity emerges as an important effect modifier, as the relationship between immigrant 27 generation and physical activity differs between ethnicities.95,141–146 White immigrants to Canada are generally more physically active than other immigrant ethnicities.27 Another way of conceptualizing physical activity is to look at those who were physically inactive. It should be noted that this is distinct from sedentary behaviour, as sedentary behaviour is time spent sitting, while physical inactivity refers to a lack of moderate-to-vigorous physical activity.17 Data from the Canadian Community Health Survey has found that people from visible minorities were more likely to be physically inactive than White respondents, with inactivity defined as expending less than 1.5 kilocalories per kilogram of weight per day. Increased odds of physical inactivity were reported by Chinese (OR: 1.6; 95% CI: 1.58; 1.41–1.78), South Asian (1.66; 1.48–1.85), Filipino or South East Asian (1.54; 1.35–1.77), Black (1.27; 1.15–1.41) and Arab or West Asian (1.24; 1.06–1.45) individuals.117 Among youth, children of Asian origin in Montreal were found to be less active than those of other ethnicities.119 This was also found in studies of youth in the US,147–149 Europe,89,150,151 and Australia.152 The findings above may be partly due to participation in sports. While 55% of children of Canadian-born parents participated in sports, only 32% of children of parents who immigrated to Canada in the last 10 years participated.139,140 Additional data from the Canadian Community Health Survey supports this finding, and suggests that recent and established immigrants to Canada were less likely to participate in sports compared to non-immigrant peers (OR (95% CI): 0.66 (0.62 – 0.69) and 0.81 (0.78 – 0.84) respectively).138 2.6.4 Physical activity – Important covariates Regular involvement in physical activity is affected by several characteristics, with higher levels of involvement among boys vs. girls, older vs. younger youth, and by attitudes towards physical 28 activity.139,153,154 Factors at the family level may also influence physical activity involvement, such as parental values, income or language spoken at home.155–158 2.6.5 Physical activity – Summary Regular involvement in physical activity is associated with health benefits among youth.130–132 The evidence for a relationship between acculturation and physical activity is mixed, as indicated by the systematic review conducted by Gerber et al.137 However, this may be due to studies not accounting for differences between ethnicity, and instead considering immigrants as a homogenous group. It may be that ethnicity is responsible for this relationship, and cultural norms are responsible for observed differences.95,141–146 Potential interactions between ethnicity and acculturation requires further study in order to elucidate the mechanism underlying this proposed relationship. 2.7 Sedentary Behaviour 2.7.1 Background While physical activity is important, sedentary behaviour, or time typically spent: 1) reading, 2) watching television, 3) playing video games, or, 4) using a computer, is also of interest to researchers and public health initiatives.159 While not in itself a totally negative behaviour, excessive sedentary behaviour is associated with negative physical and mental health outcomes, including risk taking behaviours,160 such as drinking,161 smoking,161,162 and interpersonal aggression.163 Screen time is one form of sedentary behaviour, and refers to items 2) through 4) above. 29 Studies of sedentary behaviour have revealed associations with physical outcomes including obesity, blood pressure, metabolic syndrome, all-cause mortality and lower physical activity among Canadian adolescents.20,164–167 Of interest to this thesis is how sedentary behaviour in childhood is associated with overweight and obesity in childhood, and adulthood.166–169 In addition to these physical health outcomes, increased television watching has also been shown to be associated with lower self-esteem and worse academic achievement.168 To combat increasing screen time, Canadian guidelines have been developed that suggest no more than 2 hours of screen time per day among youth.18,19 Despite these guidelines, only 18% of girls and 14% of boys met the recommendations of 2 hours or less of screen time per day.170 2.7.2 Sedentary behaviour and acculturation A study of 3- to 12- year old sub-Saharan African migrants to Australia found those who were “integrated” and “assimilated” (Figure 1) to Australian culture participated in an extra 43 (95% CI: 4.4 – 81.5) and 57.5 (95% CI: 15.0 – 100.0) daily minutes of sedentary behaviours, respectively, compared to “separated” peers.135 To my knowledge, no studies have investigated acculturation as a determinant of screen time among Canadian youth. 2.7.3 Sedentary behaviour and alternative measures of acculturation Studies in the US suggest that screen time may be modified by immigrant generation and ethnicity. First and second generation Hispanic youth in the US, who did not speak English at home, were reported to be 0.40 (95% CI: 0.18 – 0.91) and 0.53 (95% CI: 0.31 – 0.92) times less likely to watch more than two hours of television a day, respectively, compared to thirdgeneration English speaking peers.91 Another study of immigrant youth reported similar findings for three hours of television a day.148 This is supported by a study by Singh et al., who reported 30 that first and third generation Hispanic and third generation non-Hispanic Black youth were more likely to watch more than three hours of television a day than non-Hispanic, white, US-born peers.148 These within-ethnicity differences were also reported in a study by Gordon-Larsen et al., who found that first generation Mexican American youth watched less television than second and higher generation peers (16.7 vs 22.0 hours/week, p < .05).120 Among adults, findings from the Canadian Community Health Survey showed that the prevalence of viewing television more than 15 hours a week was lower among those who moved to Canada 0-9 years previously than Canadian born peers. However, the opposite association was observed for computer use, with those who had only been in Canada for 0-9 years reporting 2.0-fold (95% CI: 1.7 – 2.3) increased odds of using a computer for 11 or more hours a week compared to Canadian-born peers.169 Among youth, differences between Canadian-born youth and immigrant peers have not been investigated. 2.7.4 Sedentary behaviour – Important covariates Several covariates may affect the type of sedentary behaviour youth are involved in and subsequent health outcomes. Age may relate to the type of screen time youth are engaging in, as TV use decreases with age, while computer use increases with age.170 Gender is associated with different types of sedentary behaviour among Canadian youth. While males are more likely to play video games, girls are more likely to read.20 Finally, a child’s ethnicity may impact the type of screen time that youth engage in.91,120,148 Predictors of sedentary behaviour can also exist at higher levels; neighbourhood disorder, neighbourhood SES, and urban/rural status have been shown to be associated with screen time in a national sample of Canadian youth.171 31 2.7.5 Sedentary behaviour – Summary Acculturation has rarely been investigated as a determinant of sedentary behaviour. Research in the US suggests that sedentary behaviour, in particular screen time, will differ depending on the level of acculturation of the youth.91,148,172 However, this remains to be explored among Canadian youth. 2.8 Summary Given the rising numbers of new immigrants in Canada, and the different health outcomes that these youth face as they acculturate to Canada, there is a surprising lack of research among new immigrant youth. Immigrants form a very heterogeneous population,173–175 with unique preventive health behaviours,146 different baseline levels of knowledge,176 and cultural norms.177,178 The acculturative process may help disentangle the determinants of these behaviours, and explain why ethnic groups have different health outcomes following immigration. 32 2.9 References 1. United Nations. United Nations Convention on the Rights of the Child. at <http://www.hakani.org/en/convention/Convention_Rights_Child.pdf> 2. United Nations. Definition of Youth. at <http://www.un.org/esa/socdev/documents/youth/fact-sheets/youth-definition.pdf> 3. Berry, J. W., Phinney, J. S., Sam, D. L. & Vedder, P. Immigrant Youth in Cultural Transition: Acculturation, Identity, and Adaptation Across National Contexts. (Lawrence Erlbaum Associates Publishers, 2006). 4. Policy Horizons Canada. Concepts and Definitions. A story Reefs Ocean. (2013). at <http://www.horizons.gc.ca/eng/content/concepts-and-definitions> 5. Canadian Society for Exercise Physiology. Canadian Physical Activity Guidelines Glossary of Terms. (2011). at <http://www.csep.ca/CMFiles/Guidelines/PAGuidelinesGlossary_E.pdf> 6. Canadian Society for Exercise Physiology. Canadian Physical Activity Guidelines for Youth 12-17 years. (2011). at <http://www.csep.ca/CMFiles/Guidelines/CSEPInfoSheets-youth-ENG.pdf> 7. Canadian Society for Exercise Physiology. Canadian Physical Activity Guidelines for Children 5-11 years. 1 (2011). at <http://www.csep.ca/CMFiles/Guidelines/CSEPInfoSheets-child-ENG.pdf> 8. Freeman, J. G. et al. The Health of Canada’s Young People: a mental health focus. phacaspc.gc.ca (The Public Health Agency of Canada, 2011). doi:978-1-100-19335-9 9. Prochaska, J. J., Sallis, J. F. & Long, B. A physical activity screening measure for use with adolescents in primary care. Arch. Pediatr. Adolesc. Med. 155, 554–9 (2001). 10. World Health Organization. Global Physical Activity Surveillance. (2011). at <http://www.who.int/chp/steps/GPAQ/en/> 11. Ridgers, N. D., Timperio, A., Crawford, D. & Salmon, J. Validity of a brief self-report instrument for assessing compliance with physical activity guidelines amongst adolescents. J. Sci. Med. Sport 15, 136–141 (2012). 12. World Health Organization. Obesity: preventing and managing the global epidemic: Report of a WHO consultation. WHO Tech. Rep. Ser. (2000) 13. Cole, T. J. Establishing a standard definition for child overweight and obesity worldwide: international survey. BMJ 320, 1240–1240 (2000). 14. De Onis, M. et al. BMI-for-age (5 - 19 years). Bull. World Health Organ. 85, 660–7 (2007). 33 15. De Onis, M. et al. Development of a WHO growth reference for school-aged children and adolescents. Bull World Heal. Organ. 85, 660–7 (2007). 16. Wijnhoven, T. M. a et al. WHO European Childhood Obesity Surveillance Initiative: body mass index and level of overweight among 6-9-year-old children from school year 2007/2008 to school year 2009/2010. BMC Public Health 14, 806 (2014). 17. Sedentary Behaviour Research Network. Letter to the Editor: Standardized use of the terms ‘sedentary’ and ‘sedentary behaviours’. Appl. Physiol. Nutr. Metab. 37, 540–542 (2012). 18. Canadian Society for Exercise Physiology. Canadian Sedentary Behaviour Guidelines for Children 5-11 years. 23 (2011). at <http://www.csep.ca/CMFiles/Guidelines/CSEPInfoSheets-ENG-Children FINAL.pdf> 19. Canadian Society for Exercise Physiology. Canadian Sedentary Behaviour Guidelines for Children 12-17 years. (2011). at <http://www.csep.ca/CMFiles/Guidelines/CSEPInfoSheets-ENG-Teen FINAL.pdf> 20. Koezuka, N. et al. The relationship between sedentary activities and physical inactivity among adolescents: results from the Canadian Community Health Survey. J. Adolesc. Health 39, 515–22 (2006). 21. Berry, J. W. A Psychology of Immigration. J. Soc. Issues 57, 615–631 (2001). 22. Sam, D. L. & Berry, J. W. Acculturation: When Individuals and Groups of Different Cultural Backgrounds Meet. Perspect. Psychol. Sci. 5, 472–481 (2010). 23. Government of Canada. Bill C-11: The Immigration and Refugee Protection Act. (2002). at <http://publications.gc.ca/collections/Collection-R/LoPBdP/LS/371/c11e.htm#GENERALtxt> 24. Citizenship and Immigration Canada. Canadian Multiculturalism: An Inclusive Citizenship. (2012). at <http://www.cic.gc.ca/english/multiculturalism/citizenship.asp> 25. Citizenship and Immigration Canada. Facts and Figures: Immigration Overview Permanent and Temporary Residents. Transition (2011). at <http://www.cic.gc.ca/english/resources/statistics/menu-fact.asp> 26. Statistics Canada. Population by selected ethnic origins, by province and territory (2006 Census). 1 (2009). at <http://www.statcan.gc.ca/tables-tableaux/sumsom/l01/cst01/demo26a-eng.htm> 27. Tremblay, M. S., Bryan, S. N., Pérez, C. E., Ardern, C. I. & Katzmarzyk, P. T. Physical Activity and Immigrant Status: Evidence From the Canadian Community Health Survey. Can. J. Public Heal. 97, 277–282 (2006). 28. Quon, E. C., McGrath, J. J. & Roy-Gagnon, M.-H. M.-H. Generation of immigration and body mass index in Canadian youth. J. Pediatr. Psychol. 37, 1–11 (2012). 34 29. Maximova, K., O’Loughlin, J. & Gray-Donald, K. Healthy weight advantage lost in one generation among immigrant elementary schoolchildren in multi-ethnic, disadvantaged, inner-city neighborhoods in Montreal, Canada. Ann. Epidemiol. 21, 238–44 (2011). 30. Phinney, J. Ethnic identity in adolescents and adults: Review of research. Psychol. Bull. (1990). at <http://psycnet.apa.org/journals/bul/108/3/499/> 31. Huynh, Q.-L., Howell, R. T. & Benet-Martinez, V. Reliability of Bidimensional Acculturation Scores: A Meta-Analysis. J. Cross. Cult. Psychol. 40, 256–274 (2009). 32. Redfield, R., Linton, R. & Herskovits, M. Memorandum for the study of acculturation. Am. Anthropol. 38, 149–152 (1936). 33. Berry, J. W. Immigration, Acculturation, and Adaptation. Appl. Psychol. 46, 5–34 (1997). 34. Bourhis, R. Y., Moise, L. C., Perreault, S. & Senecal, S. Towards an Interactive Acculturation Model: A Social Psychological Approach. Int. J. Psychol. 32, 369–386 (1997). 35. Navas, M. et al. Relative Acculturation Extended Model (RAEM): New contributions with regard to the study of acculturation. Int. J. Intercult. Relations 29, 21–37 (2005). 36. Safdar, S., Lay, C. & Struthers, W. The Process of Acculturation and Basic Goals: Testing a Multidimensional Individual Difference Acculturation Model with Iranian Immigrants in Canada. Appl. Psychol. An Int. Rev. 52, 555–579 (2003). 37. Sabatier, C. & Berry, J. W. The role of family acculturation, parental style, and perceived discrimination in the adaptation of second-generation immigrant youth in France and Canada. Eur. J. Dev. Psychol. 5, 159–185 (2008). 38. Berry, J. W. & Sabatier, C. Acculturation, discrimination, and adaptation among second generation immigrant youth in Montreal and Paris. Int. J. Intercult. Relations 34, 191– 207 (2010). 39. Schwartz, S. J., Unger, J. B., Zamboanga, B. L. & Szapocznik, J. Rethinking the concept of acculturation: implications for theory and research. Am. Psychol. 65, 237–51 (2010). 40. Rudmin, F. Constructs, measurements and models of acculturation and acculturative stress. Int. J. Intercult. Relations 33, 106–123 (2009). 41. Hunt, L. M., Schneider, S. & Comer, B. Should ‘acculturation’ be a variable in health research? A critical review of research on US Hispanics. Soc. Sci. Med. 59, 973–986 (2004). 42. Woloshin, S., Schwartz, L. & Katz, S. Is language a barrier to the use of preventive services? J. Gen. Intern. Med. 472–477 (1997). at <http://onlinelibrary.wiley.com/doi/10.1046/j.1525-1497.1997.00085.x/abstract> 35 43. Berry, J. W. & Sam, D. L. Accuracy in scientific discourse. Scand. J. Psychol. 44, 65–68 (2003). 44. Chirkov, V. Introduction to the special issue on Critical Acculturation Psychology. Int. J. Intercult. Relations 33, 87–93 (2009). 45. Chirkov, V. Summary of the criticism and of the potential ways to improve acculturation psychology. Int. J. Intercult. Relations 33, 177–180 (2009). 46. Chirkov, V. Critical psychology of acculturation: What do we study and how do we study it, when we investigate acculturation? Int. J. Intercult. Relations 33, 94–105 (2009). 47. Bhatia, S. & Ram, A. Theorizing identity in transnational and diaspora cultures: A critical approach to acculturation. Int. J. Intercult. Relations 33, 140–149 (2009). 48. Rudmin, F. W. & Ahmadzadeh, V. Psychometric critique of acculturation psychology: The case of Iranian migrants in Norway. Scand. J. Psychol. 42, 41–56 (2001). 49. Krieger, N., Chen, J. T., Coull, B., Waterman, P. D. & Beckfield, J. The unique impact of abolition of Jim Crow laws on reducing inequities in infant death rates and implications for choice of comparison groups in analyzing societal determinants of health. Am. J. Public Health 103, 2234–44 (2013). 50. US Census Bureau. Table 695. Money Income of Families - Number and Distribution by Race and Hispanic Origin: 2009. Stat. Abstr. United States 2012 at <http://www.census.gov/compendia/statab/2012/tables/12s0695.pdf> 51. Krieger, N. et al. 50-year trends in US socioeconomic inequalities in health: US-born Black and White Americans, 1959-2008. Int. J. Epidemiol. 1294–1313 (2014). doi:10.1093/ije/dyu047 52. Bodvarsson, O. B. & Van den Berg, H. in Econ. Immigr. 379–394 (Springer-Verlag, 2009). doi:10.1007/978-3-540-77796-0_14 53. Vasileva, K. Population and Social Conditions. (2011). at <http://epp.eurostat.ec.europa.eu/cache/ITY_OFFPUB/KS-SF-11-034/EN/KS-SF-11034-EN.PDF> 54. Aud, S., Fox, M. A. & KewalRamani, A. Status and Trends in the Education of Racial and Ethnic Groups. U.S. Dep. Educ. Natl. Cent. Educ. Stat. NCES 2010-, (2010). 55. Abada, T., Hou, F. & Ram, B. Ethnic Differences in Educational Attainment among the Children of Canadian Immigrants. Can. J. Sociol. 34, 1–28 (2009). 56. Stephenson, M. Development and validation of the Stephenson Multigroup Acculturation Scale (SMAS). Psychol. Assess. 12, 77–88 (2000). 36 57. Tsai, J. L., Ying, Y.-W. & Lee, P. a. The Meaning of ‘Being Chinese’ and ‘Being American’: Variation among Chinese American Young Adults. J. Cross. Cult. Psychol. 31, 302–332 (2000). 58. Zea, M. C., Asner-Self, K. K., Birman, D. & Buki, L. P. The Abbreviated Multidimentional Acculturation Scale: Empirical validation with two Latino/Latina samples. Cultur. Divers. Ethnic Minor. Psychol. 9, 107–126 (2003). 59. Ryder, A. G., Alden, L. E. & Paulhus, D. L. Is acculturation unidimensional or bidimensional? A head-to-head comparison in the prediction of personality, self-identity, and adjustment. J. Pers. Soc. Psychol. 79, 49–65 (2000). 60. Van Hemert, D. A., Baerveldt, C. & Vermande, M. Assessing cross-cultural item bias in questionnaires: Acculturation and the Measurement of Social Support and Family Cohesion for Adolescents. J. Cross. Cult. Psychol. 32, 381–396 (2001). 61. Celenk, O. & Van de Vijver, F. J. R. Assessment of Acculturation: Issues and Overview of Measures. Online Readings Psychol. Cult. 1–22 (2011). at <http://scholarworks.gvsu.edu/orpc/vol8/iss1/10/> 62. Berry, J., Kim, U., Minde, T. & Mok, D. Comparative studies of acculturative stress. Int. Migr. Rev. 21, 491–511 (1987). 63. Cuellar, I., Arnold, B. & Maldonado, R. Acculturation Rating Scale for Mexican Americans-II: A Revision of the Original ARSMA Scale. Hisp. J. Behav. Sci. 17, 275– 304 (1995). 64. Bauman, S. The Reliability and Validity of the Brief Acculturation Rating Scale for Mexican Americans-II for Children and Adolescents. Hisp. J. Behav. Sci. 27, 426–441 (2005). 65. Marin, G. & Gamba, R. J. A New Measurement of Acculturation for Hispanics: The Bidimensional Acculturation Scale for Hispanics (BAS). Hisp. J. Behav. Sci. 18, 297– 316 (1996). 66. Pew Research. Origins and Destinations of the World’s Migrants, from 1990-2013. at <http://www.pewglobal.org/2014/09/02/global-migrant-stocks/> 67. United Nations Population Division. International Migration and Development. (2013). at <http://esa.un.org/unmigration/TIMSA2013/migrantstocks2013.htm?mtotals> 68. Shetgiri, R., Kataoka, S., Ponce, N., Flores, G. & Chung, P. J. Adolescent fighting: racial/ethnic disparities and the importance of families and schools. Acad. Pediatr. 10, 323–9 (2010). 69. Noh, S., Beiser, M., Kaspar, V. & Hou, F. Perceived racial discrimination, depression, and coping: A study of Southeast Asian refugees in Canada. J. Health Soc. Behav. 40, 193–207 (1999). 37 70. Beiser, M. et al. Predictors of emotional problems and physical aggression among children of Hong Kong Chinese, Mainland Chinese and Filipino immigrants to Canada. Soc. Psychiatry Psychiatr. Epidemiol. 45, 1011–21 (2010). 71. Strohmeier, D., Spiel, C. & Gradinger, P. Social relationships in multicultural schools: Bullying and victimization. Eur. J. Dev. Psychol. 5, 262–285 (2008). 72. McKenney, K. & Pepler, D. Peer victimization and psychosocial adjustment: The experiences of Canadian immigrant youth. Electron. J. Res. Educ. Psychol. 4, 239–264 (2006). 73. Tzotzas, T. et al. Epidemiological survey for the prevalence of overweight and abdominal obesity in Greek adolescents. Obesity (Silver Spring). 16, 1718–1722 (2008). 74. Méjean, C. et al. Influence of socio-economic and lifestyle factors on overweight and nutrition-related diseases among Tunisian migrants versus non-migrant Tunisians and French. BMC Public Health 7, 265 (2007). 75. Park, J., Myers, D., Kao, D. & Min, S. Immigrant obesity and unhealthy assimilation: alternative estimates of convergence or divergence, 1995-2005. Soc. Sci. Med. 69, 1625– 33 (2009). 76. Akresh, I. R. Overweight and obesity among foreign-born and U.S.-born Hispanics. Biodemography Soc. Biol. 54, 183–99 (2008). 77. Au, L., Kwong, K., Chou, J. C., Tso, A. & Wong, M. Prevalence of overweight and obesity in Chinese American children in New York City. J. Immigr. Minor. Health 11, 337–41 (2009). 78. Singh, G. K., Kogan, M. D. & Yu, S. M. Disparities in obesity and overweight prevalence among US immigrant children and adolescents by generational status. J. Community Health 34, 271–81 (2009). 79. Strickman-Stein, N., Gervais, M. & Ludwig, D. Body mass index as a function of length of United States residency among Haitian immigrant children. Ethn. & Dis. 20, (2010). 80. Harris, K. M. K., Perreira, K. K. M. & Lee, D. Obesity in the transition to adulthood: predictions across race/ethnicity, immigrant generation, and sex. Arch. Pediatr. Adolesc. Med. 163, 1022–1028 (2009). 81. Dannemann, A. et al. Ethnicity and comorbidities in an overweight and obese multiethnic childhood cohort in Berlin. Acta Paediatr. 100, 578–584 (2011). 82. Kirchengast, S. & Schober, E. To be an immigrant: a risk factor for developing overweight and obesity during childhood and adolescence? J. Biosoc. Sci. 38, 695–705 (2006). 38 83. Oza-Frank, R. & Narayan, K. M. V. Overweight and diabetes prevalence among US immigrants. Am. J. Public Health 100, 661–8 (2010). 84. Grossmann, F. F., Leventhal, M. E., Auer-Böer, B., Wanner, P. & Bischoff, A. Selfreported cardiovascular risk factors in immigrants and Swiss nationals. Public Health Nurs. 28, 129–39 (2010). 85. Oza-Frank, R. & Narayan, K. M. V. Effect of length of residence on overweight by region of birth and age at arrival among US immigrants. Public Health Nutr. 13, 868–75 (2010). 86. Roshania, R., Narayan, K. M. & Oza-Frank, R. Age at arrival and risk of obesity among US immigrants. Obesity 16, 2669–75 (2008). 87. Balistreri, K. S. & Van Hook, J. Trajectories of overweight among US school children: a focus on social and economic characteristics. Matern. Child Health J. 15, 610–9 (2011). 88. Van Hook, J. & Baker, E. Big Boys and Little Girls: Gender, Acculturation, and Weight among Young Children of Immigrants. J. Health Soc. Behav. 51, 200–214 (2010). 89. Kahlin, Y., Werner, S., Romild, U. & Alricsson, M. Self-related health, physical activity, BMI and musculoskeletal complaints: a comparison between foreign and Swedish high school students. Int. J. Adolesc. Med. Health 21, 327–41 (2009). 90. Liu, J., Probst, J. C., Harun, N., Bennett, K. J. & Torres, M. E. Acculturation, physical activity, and obesity among Hispanic adolescents. Ethn. Health 14, 509–25 (2009). 91. Taverno, S. E., Rollins, B. Y. & Francis, L. A. Generation, language, body mass index, and activity patterns in Hispanic children. Am. J. Prev. Med. 38, 145–53 (2010). 92. Calzada, P. J. & Anderson-Worts, P. The obesity epidemic: are minority individuals equally affected? Prim. Care 36, 307–17 (2009). 93. Oza-Frank, R. & Cunningham, S. A. The weight of US residence among immigrants: a systematic review. Obes. Rev. 11, 271–280 (2010). 94. Goel, M. S., McCarthy, E. P., Phillips, R. S. & Wee, C. C. Obesity among US immigrant subgroups by duration of residence. JAMA 292, 2860–7 (2004). 95. Chiu, M., Austin, P. C., Manuel, D. G. & Tu, J. V. Cardiovascular risk factor profiles of recent immigrants vs long-term residents of Ontario: a multi-ethnic study. Can. J. Cardiol. 28, 20–6 (2012). 96. Wolin, K. Y., Colangelo, L. a, Chiu, B. C.-H. & Gapstur, S. M. Obesity and immigration among Latina women. J. Immigr. Minor. Health 11, 428–431 (2009). 97. Yeh, M.-C. et al. Body weight and length of residence in the US among Chinese Americans. J. Immigr. Minor. Health 11, 422–7 (2009). 39 98. Koya, D. L. & Egede, L. E. Association between length of residence and cardiovascular disease risk factors among an ethnically diverse group of United States immigrants. J. Gen. Intern. Med. 22, 841–846 (2007). 99. Gutiérrez-Fisac, J. L. et al. Length of residence and obesity among immigrants in Spain. Public Health Nutr. 13, 1593–8 (2010). 100. Renzaho, A. M. N. A. M. N., Gibbons, C., Swinburn, B., Jolley, D. & Burns, C. Obesity and undernutrition in sub-Saharan African immigrant and refugee children in Victoria, Australia. Asia Pac. J. Clin. Nutr. 15, 482–90 (2006). 101. Tremblay, M. S., Perez, C. E., Ardern, C. I., Bryan, S. N. & Katzmarzyk, P. T. Obesity, overweight and ethnicity. Heal. Reports 16, 23–34 (2005). 102. Hervey, K. et al. Overweight among refugee children after arrival in the United States. J. Health Care Poor Underserved 20, 246–256 (2009). 103. Nordahl, H., Krølner, R., Páll, G., Currie, C. & Andersen, A. Measurement of ethnic background in cross-national school surveys: agreement between students’ and parents' responses. J. Adolesc. Health 49, 272–7 (2011). 104. Porta, M. A Dictionary of Epidemiology. (Oxford University Press, 2008). 105. Public Health Agency of Canada. What is the Population Health Approach? (2013). at <www.phac-aspc.gc.ca/ph-sp/approach-approche/appr-eng.php> 106. Tremblay, M. S. et al. Fitness of Canadian children and youth: results from the 20072009 Canadian Health Measures Survey. Health Rep. 21, 7–20 (2010). 107. Lytle, L. A. Examining the etiology of childhood obesity: The IDEA study. Am. J. Community Psychol. 44, 338–49 (2009). 108. Monasta, L. et al. Early-life determinants of overweight and obesity: a review of systematic reviews. Obes. Rev. 11, 695–708 (2010). 109. Shrewsbury, V. & Wardle, J. Socioeconomic Status and Adiposity in Childhood: A Systematic Review of Cross-sectional Studies 1990-2005. Obesity 16, 275–84 (2008). 110. Xu, L., Dubois, L., Burnier, D., Girard, M. & Prud’homme, D. Parental overweight/obesity, social factors, and child overweight/obesity at 7 years of age. Pediatr. Int. 53, 826–31 (2011). 111. Han, J. C., Lawlor, D. A. & Kimm, S. Y. S. Childhood obesity. Lancet 375, 1737–48 (2010). 112. Harriger, J. A. & Thompson, J. K. Psychological consequences of obesity: weight bias and body image in overweight and obese youth. Int. Rev. Psychiatry 24, 247–53 (2012). 40 113. Hauck, K., Hollingsworth, B. & Morgan, L. BMI differences in 1st and 2nd generation immigrants of Asian and European origin to Australia. Health Place 17, 78–85 (2011). 114. Désilets, M.-C., Rivard, M., Shatenstein, B. & Delisle, H. Dietary transition stages based on eating patterns and diet quality among Haitians of Montreal, Canada. Public Health Nutr. 10, 454–63 (2007). 115. Adekunle, B., Filson, G., Sethuratnam, S. & Cidro, D. Acculturation and consumption: Examining the consumption behavior of people of Afro-Caribbean descent in Canada. J. Agric. Food Syst. Community Dev. 2, 297–313 (2011). 116. Van Hook, J. & Balistreri, K. S. Immigrant generation, socioeconomic status, and economic development of countries of origin: a longitudinal study of body mass index among children. Soc. Sci. Med. 65, 976–89 (2007). 117. Liu, R. et al. Cardiovascular risk factors in ethnic populations within Canada: results from national cross-sectional surveys. Open Med. 4, e143–53 (2010). 118. McDonald, J. T. & Kennedy, S. Is migration to Canada associated with unhealthy weight gain? Overweight and obesity among Canada’s immigrants. Soc. Sci. Med. 61, 2469–81 (2005). 119. O’Loughlin, J., Paradis, G., Kishchuk, N., Barnett, T. & Renaud, L. Prevalence and correlates of physical activity behaviors among elementary schoolchildren in multiethnic, low income, inner-city neighborhoods in Montreal, Canada. Ann. Epidemiol. 9, 397–407 (1999). 120. Gordon-Larsen, P., Harris, K. M., Ward, D. S. & Popkin, B. M. Acculturation and overweight-related behaviors among Hispanic immigrants to the US: The National Longitudinal Study of Adolescent Health. Soc. Sci. Med. 57, 2023–2034 (2003). 121. Balistreri, K. S. & Van Hook, J. Socioeconomic status and body mass index among Hispanic children of immigrants and children of natives. Am. J. Public Health 99, 2238– 2246 (2009). 122. Rosas, L. G. et al. Factors associated with overweight and obesity among children of Mexican descent: results of a binational study. J. Immigr. Minor. Health 13, 169–180 (2011). 123. Chen, J.-L. Household income, maternal acculturation, maternal education level and health behaviors of Chinese-American children and mothers. J. Immigr. Minor. Heal. 11, 198–204 (2009). 124. Oliver, L. N. & Hayes, M. V. Effects of neighbourhood income on reported body mass index: an eight year longitudinal study of Canadian children. BMC Public Health 8, 16 (2008). 41 125. Moffat, T., Galloway, T. & Latham, J. Stature and adiposity among children in contrasting neighborhoods in the city of Hamilton, Ontario, Canada. Am. J. Hum. Biol. 17, 355–67 (2005). 126. Veugelers, P., Sithole, F., Zhang, S. & Muhajarine, N. Neighborhood characteristics in relation to diet, physical activity and overweight of Canadian children. Int. J. Pediatr. Obes. 3, 152–9 (2008). 127. De Hoog, M. L. a, Stronks, K., van Eijsden, M., Gemke, R. J. B. J. & Vrijkotte, T. G. M. Ethnic differences in maternal underestimation of offspring’s weight: the ABCD study. Int. J. Obes. (Lond). 36, 53–60 (2012). 128. Wang, M. & Crespi, C. The influence of childhood and adolescent environmental exposure to a westernized environment on the relation between body mass index and adiposity in young Asian American women. Am. J. Clin. 93, 1168–1174 (2011). 129. WHO Expert Consultation. Appropriate body-mass index for Asian populations and its implications for policy and intervention strategies. Lancet 363, 157–163 (2004). 130. Janssen, I. & Leblanc, A. G. Systematic review of the health benefits of physical activity and fitness in school-aged children and youth. Int. J. Behav. Nutr. Phys. Act. 7, 40 (2010). 131. Kirkcaldy, B. D., Shephard, R. J. & Siefen, R. G. The relationship between physical activity and self-image and problem behaviour among adolescents. Soc. Psychiatry Psychiatr. Epidemiol. 37, 544–50 (2002). 132. Ortega, F. B., Ruiz, J. R., Castillo, M. J. & Sjöström, M. Physical fitness in childhood and adolescence: a powerful marker of health. Int. J. Obes. (Lond). 32, 1–11 (2008). 133. Colley, R. C. et al. Physical activity of Canadian children and youth: Accelerometer results from the 2007 to 2009 Canadian Health Measures Survey. Heal. Reports 22, 15– 23 (2011). 134. Janssen, I. et al. Comparison of overweight and obesity prevalence in school-aged youth from 34 countries and their relationships with physical activity and dietary patterns. Obes. Rev. 6, 123–32 (2005). 135. Renzaho, A. M. N., Swinburn, B. & Burns, C. Maintenance of traditional cultural orientation is associated with lower rates of obesity and sedentary behaviours among African migrant children to Australia. Int. J. Obes. 32, 594–600 (2008). 136. Unger, J. B. et al. Acculturation, physical activity, and fast-food consumption among Asian-American and Hispanic adolescents. J. Community Health 29, 467–81 (2004). 137. Gerber, M., Barker, D. & Pühse, U. Acculturation and physical activity among immigrants: a systematic review. J. Public Health (Bangkok). 1–29 (2011). doi:10.1007/s10389-011-0443-1 42 138. Dogra, S., Meisner, B. a & Ardern, C. I. Variation in mode of physical activity by ethnicity and time since immigration: a cross-sectional analysis. Int. J. Behav. Nutr. Phys. Act. 7, 75 (2010). 139. Clark, W. Kids’ sports. Can. Soc. Trends (2008). 140. Cragg, S., Cameron, C., Craig, C. L. & Russell, S. Canada’s Children and Youth: A Physical Activity Profile. Spec. Rep. Ser. Can. Fit. Lifestyle Res. Inst. (1999). at <http://64.26.159.200/pdf/e/98NLSCY.pdf> 141. Oza-Frank, R., Stephenson, R. & Narayan, K. M. V. Diabetes prevalence by length of residence among US immigrants. J. Immigr. Minor. Health 13, 1–8 (2011). 142. Urquia, M. L., Frank, J. W., Moineddin, R. & Glazier, R. H. Immigrants’ duration of residence and adverse birth outcomes: a population-based study. BJOG 117, 591–601 (2010). 143. Smith, P. M. & Mustard, C. a. Comparing the risk of work-related injuries between immigrants to Canada and Canadian-born labour market participants. Occup. Environ. Med. 66, 361–7 (2009). 144. Newbold, B. The short-term health of Canada’s new immigrant arrivals: evidence from LSIC. Ethn. Health 14, 315–36 (2009). 145. Lindström, M. & Sundquist, J. Immigration and Leisure-Time Physical Inactivity: A population-based study. Ethn. Health 6, 77–85 (2010). 146. Allen, M. L. et al. Adolescent participation in preventive health behaviors, physical activity, and nutrition: differences across immigrant generations for Asians and Latinos compared with Whites. Am. J. Public Health 97, 337–43 (2007). 147. Choi, J. W., Wilbur, J. E., Miller, A., Szalacha, L. & McAuley, E. Correlates of leisuretime physical activity in Korean immigrant women. West. J. Nurs. Res. 30, 620–638 (2008). 148. Singh, G. K., Yu, S. M., Siahpush, M. & Kogan, M. D. High levels of physical inactivity and sedentary behaviors among US immigrant children and adolescents. Arch. Pediatr. Adolesc. Med. 162, 756–63 (2008). 149. Daniel, M. & Wilbur, J. Physical activity among South Asian Indian immigrants: an integrative review. Public Health Nurs. 28, 389–401 (2011). 150. Sagatun, A. et al. Three-year follow-up of physical activity in Norwegian youth from two ethnic groups: associations with socio-demographic factors. BMC Public Health 8, 419 (2008). 151. Hansen, A. R., Ekholm, O. & Kjøller, M. Health behaviour among non-Western immigrants with Danish citizenship. Scand. J. Public Health 36, 205–10 (2008). 43 152. Dassanayake, J., Dharmage, S. C., Gurrin, L., Sundararajan, V. & Payne, W. R. Are Australian immigrants at a risk of being physically inactive? Int. J. Behav. Nutr. Phys. Act. 8, 53 (2011). 153. Spence, J. C. & Lee, R. E. Toward a comprehensive model of physical activity. Psychol. Sport Exerc. 4, 7–24 (2003). 154. Aizlewood, A., Bevelander, P. & Pendakur, R. Recreational Participation Among Ethnic Minorities and Immigrants in Canada and the Netherlands. J. Immigr. Refug. Stud. 4, 1– 32 (2006). 155. Ramanathan, S. & Crocker, P. R. E. The influence of family and culture on physical activity among female adolescents from the Indian diaspora. Qual. Health Res. 19, 492– 503 (2009). 156. Ferreira, I. et al. Environmental correlates of physical activity in youth - a review and update. Obes. Rev. 8, 129–54 (2006). 157. Crespo, C. J., Smit, E., Carter-Pokras, O. & Andersen, R. Acculturation and leisure-time physical inactivity in Mexican American adults: results from NHANES III, 1988-1994. Am. J. Public Health 91, 1254–1257 (2001). 158. Springer, A. E. et al. Physical activity participation by parental language use in 4th, 8th, and 11th grade students in Texas, USA. J. Immigr. Minor. Heal. 12, 769–80 (2010). 159. Katzmarzyk, P. T. Physical activity, sedentary behavior, and health: paradigm paralysis or paradigm shift? Diabetes 59, 2717–25 (2010). 160. Carson, V., Pickett, W. & Janssen, I. Screen time and risk behaviors in 10- to 16-year-old Canadian youth. Prev. Med. (Baltim). 52, 99–103 (2011). 161. Iannotti, R. J., Kogan, M. D., Janssen, I. & Boyce, W. F. Patterns of adolescent physical activity, screen-based media use, and positive and negative health indicators in the U.S. and Canada. J. Adolesc. Health 44, 493–9 (2009). 162. Wakefield, M., Flay, B., Nichter, M. & Giovino, G. Role of the media in influencing trajectories of youth smoking. Addiction 98, 79–103 (2003). 163. Janssen, I., Boyce, W. F. & Pickett, W. Screen time and physical violence in 10 to 16year-old Canadian youth. Int. J. Public Health 57, 325–31 (2012). 164. Martinez-Gomez, D., Tucker, J., Heelan, K. A., Welk, G. J. & Eisenmann, J. C. Associations between sedentary behavior and blood pressure in young children. Arch. Pediatr. Adolesc. Med. 163, 724–30 (2009). 165. Mark, A. E. & Janssen, I. Relationship between screen time and metabolic syndrome in adolescents. J. Public Health (Bangkok). 30, 153–60 (2008). 44 166. Wong, S. L. & Leatherdale, S. T. Association between sedentary behavior, physical activity, and obesity: inactivity among active kids. Prev. Chronic Dis. 6, 1–13 (2009). 167. Hume, C., Singh, A., Brug, J., Mechelen, W. Van & Chinapaw, M. Dose-response associations between screen time and overweight among youth. Int. J. Pediatr. Obes. 4, 61–4 (2009). 168. Tremblay, M. S. et al. Systematic review of sedentary behaviour and health indicators in school-aged children and youth. Int. J. Behav. Nutr. Phys. Act. 8, 98 (2011). 169. Shields, M. & Tremblay, M. S. Sedentary Behaviour and Obesity Among Canadian Adults. Statistics (Ber). 19, (2008). 170. Mark, A. E., Boyce, W. F. & Janssen, I. Television viewing, computer use and total screen time in Canadian youth. Paediatr. Child Health 11, 595–9 (2006). 171. Carson, V. & Janssen, I. Neighborhood disorder and screen time among 10-16 year old Canadian youth: A cross-sectional study. Int. J. Behav. Nutr. Phys. Act. 9, 66 (2012). 172. Yang, C., Wu, H., Zhu, M., Brian, G. & Southwell. Tuning in to fit in? Acculturation and media use among Chinese students in the United States. Asian J. Commun. 14, 81–94 (2004). 173. Pottie, K. et al. Evidence-based clinical guidelines for immigrants and refugees. Can. Med. Assoc. J. 183, E824–925 (2011). 174. Dinca-Panaitescu, S. et al. Diabetes prevalence and income: Results of the Canadian Community Health Survey. Health Policy 99, 116–23 (2011). 175. Mathews, R. & Zachariah, R. Coronary heart disease in South Asian immigrants: synthesis of research and implications for health promotion and prevention in nursing practice. J. Transcult. Nurs. 19, 292–9 (2008). 176. Råberg Kjøllesdal, M. K., Hjellset, V. T., Bjørge, B., Holmboe-Ottesen, G. & Wandel, M. Perceptions of risk factors for diabetes among Norwegian-Pakistani women participating in a culturally adapted intervention. Ethn. Health 16, 279–97 (2011). 177. Higginbottom, G. M. et al. Food choices and practices during pregnancy of immigrant and Aboriginal women in Canada: a study protocol. BMC Pregnancy Childbirth 11, 100 (2011). 178. Oliffe, J. et al. Connecting masculinities and physical activity among senior South Asian Canadian immigrant men. Crit. Public 19, 383–397 (2009). 45 Chapter 3 Development and validation of the Bicultural Youth Acculturation Questionnaire 46 3.1 Abstract Objectives: Acculturation is a multidimensional process involving changes in behaviour and beliefs. Questionnaires developed to measure acculturation are typically designed for specific ethnic populations and adult experiences. This study developed a questionnaire that measures acculturation among ethnically diverse populations of youth. Setting: Canada Participants: 249 Canadians aged 18-25 were recruited using an online system. Participants identified as East and South East Asian (27.8%), South Asian (17.7%) and Black (13.7%). The majority were 1st (33.5%) or 2nd generation (52.0%). Methods: Questionnaires measuring acculturation in youth were identified in the literature. The importance of items from the existing questionnaires was determined using a Delphi process and this informed the development of our questionnaire. Our questionnaire was then pilot tested and redundant items were eliminated. Using exploratory factor analysis, items were grouped into domains, and, for each domain, internal consistency, and convergent validity with immigrant generation then age at immigration estimated. A subset of participants re-completed the questionnaire for reliability estimation. Results: The literature review yielded 117 articles that used 13 questionnaires with a total of questions. The Delphi process reduced these to 32 questions. Pilot testing occurred in 249 Canadians aged 18-25. Following item reduction, 16 questions in three domains remained: dominant culture, heritage language, and heritage culture. All had good internal consistency (Cronbach’s alphas > .75). The mean dominant domain score increased with immigrant 47 generation (1st generation: 3.69 (95% CI: 3.49 – 3.89), 2nd: 4.13 (4.00 – 4.26), 3rd: 4.40 (4.19 – 4.61)), and mean heritage language score was higher among those who immigrated after age 12 than before (p = .0001), indicative of convergent validity. Conclusions: This Bicultural Youth Acculturation Questionnaire has demonstrated validity. It can be incorporated into population health surveys to elucidate the impact of acculturation on health outcomes among bicultural youth. Strengths of this study The Bicultural Youth Acculturation Questionnaire is a short and effective questionnaire that can measure acculturation among young people aged 18-25 It was developed using scientific rigor and achieved through consensus from both experts and the target population It can be used among ethnically diverse populations Limitations of this study In creating a short measure, not all domains of acculturation may have been included The questionnaire needs to be further tested in younger populations, especially marginalized youth, and in other countries to ensure it has external validity 48 3.2 Background Acculturation occurs when two cultures meet, such as when an individual immigrates to a new country.[1] This is a multidimensional process of behavioural and psychological change that may give rise to changes in health and health-related behaviours.[2–6] However, measurement of acculturation in a quantitative manner is difficult. The bidimensional theory of acculturation hypothesizes that this process occurs over two dimensions, with individuals finding a balance between retention of heritage culture and, separately, adoption of dominant culture norms and values along a series of domains.[1,7,8] Because of this complexity, proxy indicators for acculturation such as “immigrant generation” or “age at immigration” are often used as they are easier to obtain.[9,10] However, they have limited content validity and do not capture the full spectrum over which acculturation can occur.[11,12] A number of questionnaires have been developed to capture various dimensions and domains of acculturation among youth. However, approximately 61% were developed with a specific population in mind, such an ethnic or cultural group.[8] Indeed, many acculturation scales have been tailored towards the Hispanic/Latino community within the US.[13–16] Experiences within these groups may not be representative of other countries and ethnicities. In Canada and the United States, a large percentage of recent immigrants are from East and South East Asia, and South Asia (over 50% of all new immigrants to Canada).[17–19] Questionnaires need to be able to measure acculturation in individuals having diverse heritage culture norms and values in order to be practical, understandable, and informative. Once developed, these questionnaires can be used in large, population-based surveys to assess the impact of acculturation on health behaviours and outcomes. 49 The objective of this study was to develop and validate a short, self-reported questionnaire that could be used to assess acculturation amongst ethnically diverse, bicultural, youth. Canada is a proponent of multiculturalism and a fitting research setting since multiculturalism supports the retention of an individual’s heritage culture, while encouraging integration into the dominant culture.[20] Canada also has a large proportion of young immigrants: almost 20% of all new immigrants to Canada are below the age of 14 and come from diverse regions of the world.[17,21] Thus, a questionnaire developed in Canada could have wide applicability to a broad range of countries and contexts. 3.3 Methods and Results Study Overview This study consists of three parts. Part A was a systematic literature review conducted in order to identify self-report questionnaires that have been used to measure acculturation among youth. Based on the review, a master list of candidate items that measure acculturation in young people was produced. In Part B, this list was reduced using a modified Delphi process to obtain consensus. Part B thus resulted in a brief acculturation questionnaire. Part C involved pilot testing of the newly developed questionnaire on a sample of 18-25 year old Canadians. Based on the results of pilot testing, the questionnaire was further refined by eliminating redundant items. Convergent validity and reliability estimates are reported for the final questionnaire. The methods and results from each part are presented consecutively below. Panel Selection Two panels were assembled to provide input during the questionnaire development process. The expert panel (n = 5) reviewed the relevance of all studies identified by Part A, and ensured that the questionnaire developed in Part B had content validity i.e., that important domains of 50 acculturation were included. Members of this panel included researchers with expertise in acculturation. The panel consisted of three clinical psychologists and two with training in social psychology. A student panel was also selected (n = 6). These students were selected to comment on whether the identified domains in Part B accurately reflected their acculturation experiences. Panelists were identified through cultural and religious clubs and societies at Queen’s University, Canada, and were sanctioned by the Queen’s University Alma Mater Society (student government). Inclusion criteria for the student panel were: 1) students could not be international students, and 2) had to be pursuing undergraduate education. It was believed that these students would be highly engaged with both their own and the Queen’s University community and thus be able to comment candidly and appropriately about acculturation. 3.3.1 Part A: Literature Review 3.3.1.1 Methods The review identified existing studies that included measurement of acculturation using selfreport questionnaire administered to youth. Questionnaires were identified by searching academic databases (MEDLINE, EMBASE, PsycINFO, Social Science Citation Index and the Education Resource Information Center). Studies that used the word “acculturation” as a keyword or search term were linked to those that used the search terms “self-report,” “questionnaire,” or “survey” using an “AND” operator. Results were limited to English-language studies, published from 1990-2013, and of youth (< 18 years of age). To identify unpublished questionnaires in the grey literature, the websites of the World Health Organization, the Public Health Agency of Canada, Health Canada, EuroStat and the US Centers for Disease Control and Prevention were searched. 51 After removal of duplicates, titles and abstracts were screened, and studies included if they: 1) measured acculturation using a self-report questionnaire, and 2) were of youth < 18 years of age. Studies were excluded if they: 1) measured acculturation in adults, 2) used a proxy measure of acculturation such as immigrant generation, time since immigration, or compared ethnic/cultural groups, 3) used qualitative methods, or 4) were unrelated to the measurement of acculturation, such as studies that validated an existing measure in a new population. If the population under study and/or the measure of acculturation used was unclear, the study was (conservatively) included for full text review using the same criteria as above. Questionnaires used for measuring acculturation in more than one study were identified and obtained. If the questionnaire was not available publicly, the corresponding author was sent an email to try to obtain a copy. Items from these questionnaires were extracted to form a master list of acculturation items. Duplicative items were collapsed into a single item and those inappropriate for a youth audience (e.g., items about marriage) were removed. These questions were then grouped into dominant/heritage culture pairs, and into domains using previous questionnaires and theory as a guide. The review was conducted by AK with input on the search strategy given by a Queen’s University librarian, the expert panel, and co-authors. 3.3.1.2 Results The search identified 5492 studies, of which 943 were duplicates, leaving 4549 unique studies. Of these, 4266 were excluded based on a review of the title and abstract, leaving 283 studies for full text review (Figure 1). Full text review excluded 170 studies. The search of the grey literature revealed an additional 4 studies. A total of 117 articles met the inclusion criteria (Figure 1). These used 39 different questionnaires to measure acculturation, while 7 studies created their own 52 questions to measure acculturation. Only 16 questionnaires were used in more than one study, and 13 were available to researchers (Figure 1).[20,22–33] Items from each of these questionnaires were extracted, yielding 440 items. Of these, 240 remained after removal of identical (n = 88) and uni-dimensional items, i.e., those with response scales ranging from dominant culture to heritage culture, (n = 112) (Figure 2). Questions deemed inappropriate for youth (n = 11) and deemed duplicative, i.e., referring to the same underlying construct (n = 81), were also removed. If necessary the wording of items was changed to ensure consistency of style within this questionnaire. The items on the Canadian, i.e., dominant culture, scale, were all changed to identify affinity for Canadian culture, while the items on the heritage scale were changed to say “my heritage culture.” This was necessary as some of the scales were developed for specific groups, such as Hispanic-Americans.[23,24,32] Finally, question response options were modified, if necessary, so that they all used the same 5 point Likert scale ranging from “strongly disagree” to “strongly agree.” Following this process, 148 items remained; 136 items in both scales, as well as 8 dominant-culture specific and 4 heritage-culture specific items (Figure 2). The questions were grouped into dominant/heritage culture dyads, which resulted in 80 total items, i.e., 68 with dominant and heritage culture analogues, 8 specific to the dominant culture, and 6 specific to the heritage culture. These 80 items were grouped into four domains: 1) Personal, 2) Family, 3) Language, and 4) Social. The personal domain explores how much the respondent identifies with both Canadian, as well as their heritage cultures. The family domain explores the family’s level of acculturation. Language proficiency explores how comfortable the individual is speaking English as well as their heritage language. Lastly, the social domain asks individuals about those with whom they spend their free time, and how comfortable they are with individuals of the dominant culture and 53 their heritage culture. The suitability of these domains was presented to the expert panel and universally approved. The end result of Part A was thus 80 questions covering 4 domains. 3.3.2 Part B: Delphi Process to Select Questionnaire Items 3.3.2.1 Methods The Delphi method was then used to refine and reduce the list of 80 potential questionnaire items developed in Part A.[34] The Delphi technique is a way of systematically eliciting and refining group judgements to build consensus and is particularly useful when consulting with experts and stakeholders with varied opinions and perspectives.[34,35] The 80 items were sorted by domain and uploaded to an online questionnaire system (FluidSurveys™, Ottawa, ON). All 11 panelists were asked to score each question on a nine-point scale from 1 (highly inappropriate) to 9 (extremely appropriate). Items were included if: 1) the median response was between 7-9, i.e., the top three response options, and 2) after discarding the highest and lowest responses for each item, the remaining nine responses were within a three point range.[36] Remaining items then were subject to a pairwise comparison process. Each item was compared to all other items within the same domain and for each comparison panel members chose which item is more important to the study of acculturation among youth. The panelists’ responses were combined to form a master list, where items at the top were ranked the most important. A priori, it was decided that the top five items from each of the four domains would be retained for Part C in order to create a 40 item questionnaire. 54 3.3.2.2 Results Of the 80 items presented to the Delphi panelists, 29 met both criteria. Sixteen items were in the personal domain, 8 were in the language domain, 3 were in the family domain, and 2 were in the social domain. The 5 items in the family and social domains were included for consideration in Part C as they were the only items in those domains that met the inclusion criteria. For the remaining 24 items, there were 148 head-to-head comparisons (120 in the personal domain; 28 in the language domain). From this, the top 5 rank ordered items were retained. Because there was a tie for the 5th and 6th top items in the language domain, 6 items were retained. Thus, 32 questions were retained for consideration in Part C (Figure 2). 3.3.3 Part C: Item reduction, pilot testing and calculation of psychometrics 3.3.3.1 Methods The 32 questions identified in Part B were pilot tested on a sample of young adults from Canada. The purposes of Part C were twofold. First, if items had high (> 0.8) correlations with other items, only one was retained, while those that had or low (<0.2) correlations with other items were removed. Using the remaining items the psychometric properties, i.e., convergent validity and test-retest reliability, as well as underlying the factor structure, were determined. Part C received ethics approval from the Queen’s University Health Sciences and Affiliated Teaching Hospitals Research Ethics Board (File # 6010933). Description of the sample The sample was recruited using “Survey Monkey Contribute”; Survey Monkey’s proprietary database of respondents.[37,38] Our sample was drawn from their Canadian partner network.[39] For this study, inclusion criteria were that respondents had to be: 1) residents of Canada; 2) identified as non-Caucasian, and 3) aged 18-25 years. This age group was a convenience sample, 55 chosen to determine if the questionnaire demonstrated validity and reliability in young adult population, before proposing pilot testing among school-aged youth. Respondents, in exchange for their time, could either 1) donate $0.50 to a charity of their choice, or 2) receive one entry for a weekly draw for a $100 gift card (See Appendix D for a full description).[37] Item reduction Polychoric correlations were used to eliminate items that had very high correlations (r > 0.8) or very low correlations (r < 0.2).[40] Polychoric correlations are used when it is theorized that the underlying distribution of a variable is normally distributed, however, the variable itself is ordinal.[40] Response categories for the questionnaire exist on a 5 point Likert scale ranging from “strongly disagree” to “strongly agree” and thus this approach was appropriate. Factor analysis After elimination of items, exploratory factor analyses were conducted to determine the number of factors within which the items clustered. Factor analysis was conducted in SAS 9.4 using PROC FACTOR, the maximum likelihood method and varimax rotation. For each domain, internal consistency was evaluated using Cronbach’s alpha. Convergent validity To test the convergent validity of the survey, the mean score for each domain was calculated by immigrant generation and age at immigration.[41] Immigrant generation was defined as: 1) born abroad (1st generation), 2) born in Canada to at least one parent born abroad (2nd generation), and 3) born in Canada to both parents born in Canada (3rd generation). Age at immigration was dichotomized to those who immigrated before age 12, and those who immigrated at the age of 12 or older. This was chosen as it is the age at which the ability to learn new languages starts to 56 decline.[30] It was hypothesized that dominant culture score will be positively associated with increasing immigrant generation, while heritage culture score will be negatively associated with increasing immigrant generation and higher among those who immigrated after age 12. Test-retest reliability To assess test-retest reliability of the questionnaire items, participants were invited to complete the survey again after two weeks. In addition to comparing the mean baseline and follow-up scores, reliability measures calculated included intra-class correlation and Pearson correlation coefficients. Finally, Bland Altman plots were used to confirm that the findings were reliable over the range of response values.[42–44] All statistical analyses were conducted in SAS 9.4 (SAS Institute, Cary, NC), while Bland Altman plots were created in Excel 2013 (Microsoft Corporation, Redmond, WA). 3.3.3.2 Results Sample Characteristics Two hundred and eighty two people responded to the survey. Of these, 248 had complete information (87.9%). Of these 248 respondents, a further 101 completed the survey again two weeks later. The baseline sample (n = 248) included more females than males (54.8%), and reported a mean age of 20.9 years (SD: 2.5) (Table 1). They identified mainly as East and South East Asian (27.8%), South Asian (17.7%) and Black (13.7%). The majority were 1st (33.5%) or 2nd generation (52.0%). Of those who were born abroad, the mean age at immigration was 10.8 years (SD: 6.0). Approximately half spoke a language that they identified as their heritage language (53.6%) and answered the questions on heritage language ability. 57 The baseline sample was similar to those who responded at follow-up, with no differences by gender (54.8% vs 54.5% female), or age (20.9 (sd: 2.5) vs (21.2 (sd: 2.4) years old) (Table 1). The baseline sample included fewer people who identified as East and South East Asian (27.8%) compared to follow-up (38.6%), and more 2nd generation respondents (33.5% vs 26.7%). Item reduction Of the 32 items that were tested, the responses for 12 correlated highly (r > .80) with other items, while the responses for 4 did not (r < .20). These items were eliminated and 16 items remained in the Bicultural Youth Acculturation Questionnaire (See Section 3.8: Supplemental Material). Factor analysis The results of the factor analysis performed on the 16 items are shown in Table 2. The scree test indicated that a three factor solution was appropriate and resultant factors were named: 1) dominant culture, 2) heritage language and 3) heritage culture. The dominant and heritage culture factor loadings and Cronbach’s alpha were calculated using the full sample (n = 248). The language domain loadings were calculated from those who completed all three sections (n = 130) (Table 1). All items reported factor loadings higher than 0.5, and all domains had high internal consistency with Cronbach’s alpha values of > 0.83 (Table 2). The factor pattern for the dominant culture and heritage culture domains were identical when comparing the sample who indicated a heritage language and those who did not, with minor differences in factor loadings. For example, the factor loading for “I believe in Canadian values” was 0.74 in the three factor solution, compared to 0.81 in the two factor solution. 58 Convergent validity Dominant domain score increased with increased generational status, with third generation youth reporting the highest mean score (third generation: 4.40 (95% CI: 4.19 – 4.61) vs first generation: 3.69 (3.49 – 3.89)). Mean heritage language score was lowest among second generation immigrants compared to first and third generation peers (3.05 (2.84 - 3.26) vs. 3.43 (3.17 - 3.69) and (3.94 (3.17 - 4.71) respectively). Mean heritage domain score was high among all three immigrant generation groups (Table 3). Table 3 shows the mean score by age at immigration. There was no difference in the dominant or heritage domain by age at immigration. However, youth who immigrated above the age of 12 reported significantly higher mean scores on the heritage language domain compared to those who immigrated below age 12 (3.97 (3.64 - 4.30) vs 3.03 (2.70 - 3.35) respectively) (Table 3). Test-retest reliability Two measures of test-retest reliability were calculated for the participants who completed the survey again after two weeks (n = 101). All three domains reported acceptable reliability with Pearson correlations and intra-class correlations above .60 (Table 4). Finally, Bland-Altman plots were created for each domain. The 95% limits of agreement were approximately ± 1 on a 5 point scale (Figure 3). 3.4 Discussion In this study we describe the development and validation of the Bicultural Youth Acculturation Questionnaire. The final questionnaire that was developed had good psychometric properties, as well as convergent validity with immigrant generation and age at immigration. An important and 59 unique finding of this study was that English language ability could not be used to identify high and low acculturated youth due to ceiling effects. An additional objective of this study was to determine the convergent validity of this questionnaire using two common proxy indicators of acculturation: immigrant generation and age at immigration. Our study found convergent validity with these indicators, with some caveats. While mean dominant domain score increased with higher immigrant generation, showing stronger affinity for the Canadian dominant culture, mean heritage domain score did not change with increasing immigrant generation. Integration into the dominant culture and retention of heritage cultural norms is the hope of multiculturalism.[20] For first generation immigrants, dominant domain scores were comparable between those who immigrated before and after age 12, while both heritage domains reported higher mean scores for those participants who immigrated at the age of 12 years or older, indicating a higher affinity for the heritage culture. This has particular relevance for those studying health outcomes among youth. Depending on the proposed mechanism underlying the health behaviour, i.e., whether the health outcome is a result of heritage cultural norms or the result of the adoption of dominant culture norms, the use of either immigrant generation or age at immigration may be appropriate. We found that generational status can be used as a proxy for dominant domain adoption, while age at immigration can be used as a proxy for heritage domain retention. Rationale would need to be provided for the appropriateness of these measures, if they are being used as a proxy for acculturation, in future studies. We had two unique findings in the use of language as a measure of acculturation. The first was that using English language proficiency as a proxy measure of acculturation is not particularly effective among youth, even though it has been shown to have utility among adults.[45] In our 60 sample, almost all respondents reported being comfortable with the English language, and thus this could not be used as a way of separating youth into high vs low acculturated groups. This is not surprising as over half of our sample immigrated to Canada when they were quite young (< 12 years of age) and would have completed English as part of their high school education. There may also be response bias driving this observation, with those with higher English language ability responding to the survey. A second important finding was around heritage language. Of those youth who reported having a heritage language, second generation youth reported the lowest mean language score. Two potential explanations exist for this finding. The first possibility for this is due to the small number of youth in the third generation category (7 reported having a heritage language). A second related explanation is residual confounding as a result of self-selection by respondents to answer these questions. Third generation youth who responded to these questions may have received formal training or instruction in their heritage language, and thus report a high level of competence. In contrast, third generation youth who did not receive such instruction may not have responded to these questions as these youth do not speak their heritage language. This would manifest as a higher mean heritage language score among third generation youth. Future use of a more precise assessment of acculturation could allow researchers and public health professionals to further disentangle the mechanisms behind health changes that occur with acculturation, and why discrepancies exist between groups under study. Currently, immigrant generation and age at immigration are used, and provide a crude, but useful, indicator of acculturation with clear public health relevance.[9] Measurement of health behaviours among new immigrants or by race and ethnic groups allows for high priority populations to be identified. Our research supports the use of these proxy measures, but notes that there is considerable heterogeneity within these groups, supporting previous studies.[11,12] Use of a more precise 61 measure will determine whether there is a cultural explanation for health differences, or whether this is because of an issue associated with immigration, such as knowledge of health services.[46] Our questionnaire provides a short and practical method of collecting this information. This study has several strengths. The rigorous methodology applied has created a questionnaire with high content and convergent validities for the measure of youth acculturation, with input from both experts and young people. The domains showed convergent validity with immigrant generation and age at immigration. Finally, the pilot testing process used a sample of youth from across Canada of different ethnicities, linguistic abilities and immigrant generations, showing it has broad applicability. The study also has some limitations. In trying to create a short measure of acculturation, we may have excluded some domains. For example, dietary acculturation was not included in the list of final questions. The results for test-retest reliability suggest that while the instrument has moderate ICC and Pearson correlations, this may be the result of the lack of variation in the dominant and heritage domains. The Bland-Altman plot shows that the results almost all exist in the 3-5 point range, with only the heritage language domain utilizing the full range of response options. This is of concern, as the 95% limits of agreement are ±1, encompassing half of the responses. The lack of variation may have been the result of response bias of those choosing to be included in our sample. For someone to participate, they needed to have access to the internet, be signed up for Survey Monkey Audience, respond in English, and have time to respond. These individuals may be more integrated into Canadian society and their heritage culture, and thus respond to a questionnaire on acculturation. This would result in high scores on each domain, and so the scores may not be generalizable to the immigrant population. A related limitation was the sample used for pilot testing. Youth in our sample were aged 18-25, and were a convenience 62 sample recruited through Survey Monkey. Thus, a future goal would be to pilot test the survey among other populations, especially marginalized and younger youth, to address these two limitations and determine if the psychometric properties remain consistent. The survey was only available in English. Consequences of this were twofold. In addition to the reasons stated before, there may be a lack of variability in the dominant domain questions as these individuals are already comfortable speaking English. Furthermore, since the official languages of Canada are English and French, the survey needs to be translated into French in order to be used across Canada. 3.5 Conclusion We have developed and pilot tested a short and effective questionnaire that measures acculturation among Canadian young people. It reported concurrent validity with other indicators of acculturation. If included in general health surveys of youth, our questionnaire can help capture the process of acculturation more completely, and improve the understanding of the mechanisms underlying the health of ethnic minorities and immigrants to Canada. 3.6 Acknowledgements Atif Kukaswadia was supported by a Canadian Institutes of Health Research Frederick Banting and Charles Best Canada Graduate Scholarships Doctoral Award and Ian Janssen was supported by a Tier 2 Canada Research Chair in Physical Activity and Obesity. Katholiki Georgiades is supported by a New Investigator Award from the Canadian Institutes of Health Research and holds the David R. (Dan) Offord Chair in Child Studies. We would like thank Gillian Akenson and Michele Chittenden for their assistance with designing the literature search strategy. We also thank Andrew Day for feedback and input with the factor analysis process. Finally, we thank 63 Tuba Chishti, Carli Fink, Raymond Lee, Alana Spira, Tanya Tran and Reyhan Viceer for participating as the student panel. 64 3.7 References 1 Sam DL, Berry JW. Acculturation: When Individuals and Groups of Different Cultural Backgrounds Meet. Perspect Psychol Sci 2010;5:472–81. doi:10.1177/1745691610373075 2 Redfield R, Linton R, Herskovits M. Memorandum for the study of acculturation. Am Anthropol 1936;38:149– 52.http://onlinelibrary.wiley.com/doi/10.1525/aa.1936.38.1.02a00330/full (accessed 23 Nov2014). 3 Berry JW. Immigration, Acculturation, and Adaptation. Appl Psychol 1997;46:5–34. doi:10.1080/026999497378467 4 Bourhis RY, Moise LC, Perreault S, et al. Towards an Interactive Acculturation Model: A Social Psychological Approach. Int J Psychol 1997;32:369–86. doi:10.1080/002075997400629 5 Navas M, García MC, Sánchez J, et al. Relative Acculturation Extended Model (RAEM): New contributions with regard to the study of acculturation. Int J Intercult Relations 2005;29:21–37. doi:10.1016/j.ijintrel.2005.04.001 6 Safdar S, Lay C, Struthers W. The Process of Acculturation and Basic Goals: Testing a Multidimensional Individual Difference Acculturation Model with Iranian Immigrants in Canada. Appl Psychol An Int Rev 2003;52:555–79. doi:10.1111/1464-0597.00151 7 Berry JW. A Psychology of Immigration. J Soc Issues 2001;57:615–31. doi:10.1111/0022-4537.00231 8 Celenk O, Van de Vijver FJR. Assessment of Acculturation: Issues and Overview of Measures. Online Readings Psychol Cult 2011;:1– 22.http://scholarworks.gvsu.edu/orpc/vol8/iss1/10/ (accessed 25 Apr2012). 9 Nordahl H, Krølner R, Páll G, et al. Measurement of ethnic background in cross-national school surveys: agreement between students’ and parents' responses. J Adolesc Health 2011;49:272–7. doi:10.1016/j.jadohealth.2010.12.013 10 Corak M. Age at immigration and the education outcomes of children. Anal Stud Branch Res Pap Ser Published Online First: 2011.http://ftp.iza.org/dp6072.pdf (accessed 27 Feb2012). 11 Woloshin S, Schwartz L, Katz S. Is language a barrier to the use of preventive services? J Gen Intern Med 1997;:472–7.http://onlinelibrary.wiley.com/doi/10.1046/j.15251497.1997.00085.x/abstract (accessed 4 May2012). 12 Hunt LM, Schneider S, Comer B. Should “acculturation” be a variable in health research? A critical review of research on US Hispanics. Soc Sci Med 2004;59:973–86. doi:10.1016/j.socscimed.2003.12.009 65 13 Bauman S. The Reliability and Validity of the Brief Acculturation Rating Scale for Mexican Americans-II for Children and Adolescents. Hisp J Behav Sci 2005;27:426–41. doi:10.1177/0739986305281423 14 Marin G, Gamba RJ. A New Measurement of Acculturation for Hispanics: The Bidimensional Acculturation Scale for Hispanics (BAS). Hisp J Behav Sci 1996;18:297– 316. doi:10.1177/07399863960183002 15 Tsai JL, Ying Y-W, Lee P a. The Meaning of “Being Chinese” and “Being American”: Variation among Chinese American Young Adults. J Cross Cult Psychol 2000;31:302– 32. doi:10.1177/0022022100031003002 16 Barry DT. Development of a new scale for measuring acculturation: the East Asian Acculturation Measure (EAAM). J Immigr Health 2001;3:193–7. doi:10.1023/A:1012227611547 17 Citizenship and Immigration Canada. Facts and Figures: Immigration Overview Permanent and Temporary Residents. Ottawa, Ontario: 2011. http://www.cic.gc.ca/english/resources/statistics/menu-fact.asp 18 Vasileva K. Population and Social Conditions. Luxembourgh: 2011. http://epp.eurostat.ec.europa.eu/cache/ITY_OFFPUB/KS-SF-11-034/EN/KS-SF-11-034EN.PDF 19 Monger R, Yankay J. US Legal Permanent Residents: 2012. 2013. http://www.dhs.gov/sites/default/files/publications/ois_lpr_fr_2012_2.pdf (accessed 23 May2013). 20 Berry JW, Phinney JS, Sam DL, et al. Immigrant Youth in Cultural Transition: Acculturation, Identity, and Adaptation Across National Contexts. Mahwah, NJ, US: : Lawrence Erlbaum Associates Publishers 2006. 21 Pew Research. Origins and Destinations of the World’s Migrants, from 1990-2013. http://www.pewglobal.org/2014/09/02/global-migrant-stocks/ 22 Chavez D V., Moran VR, Reid SL, et al. Acculturative Stress in Children: A Modification of the SAFE Scale. Hisp J Behav Sci 1997;19:34–44. doi:10.1177/07399863970191002 23 Cuellar I, Arnold B, Maldonado R. Acculturation Rating Scale for Mexican AmericansII: A Revision of the Original ARSMA Scale. Hisp J Behav Sci 1995;17:275–304. doi:10.1177/07399863950173001 24 Marin G, Gamba RJ. A New Measurement of Acculturation for Hispanics: The Bidimensional Acculturation Scale for Hispanics (BAS). Hisp J Behav Sci 1996;18:297– 316. doi:10.1177/07399863960183002 25 Marin G, Sabogal F, Marin B V., et al. Development of a Short Acculturation Scale for Hispanics. Hisp J Behav Sci 1987;9:183–205. doi:10.1177/07399863870092005 66 26 Phinney JS. The Multigroup Ethnic Identity Measure: A New Scale for Use with Diverse Groups. J Adolesc Res 1992;7:156–76. doi:10.1177/074355489272003 27 Ryder AG, Alden LE, Paulhus DL. Is acculturation unidimensional or bidimensional? A head-to-head comparison in the prediction of personality, self-identity, and adjustment. J Pers Soc Psychol 2000;79:49–65. doi:10.1037//0022-3514.79.1.49 28 Suinn R, Ahuna C, Khoo G. The Suinn-Lew Asian self-identity acculturation scale: Concurrent and factorial validation. Educ Psychol Meas Published Online First: 1992.http://epm.sagepub.com/content/52/4/1041.short (accessed 12 Dec2013). 29 Szapocznik J, Kurtines W, Fernandez T. Bicultural involvement and adjustment in Hispanic-American youths. Int J … 1980;4:353– 65.http://www.sciencedirect.com/science/article/pii/0147176780900103 (accessed 22 Dec2013). 30 Tsai JL, Ying Y-W, Lee P a. The Meaning of “Being Chinese” and “Being American”: Variation among Chinese American Young Adults. J Cross Cult Psychol 2000;31:302– 32. doi:10.1177/0022022100031003002 31 Unger JB, Gallaher P, Shakib S, et al. The AHIMSA Acculturation Scale:: A New Measure of Acculturation for Adolescents in a Multicultural Society. J Early Adolesc 2002;22:225–51. doi:10.1177/02731602022003001 32 Cuellar I, Harris LC., Jasso R. An acculturation scale for Mexican American normal and clinical populations. Hisp J Behav Sci 1980;2:199–217. 33 Suarez-Morales L, Dillon FR, Szapocznik J. Validation of the acculturative stress inventory for children. Cultur Divers Ethnic Minor Psychol 2007;13:216–24. doi:10.1037/1099-9809.13.3.216 34 Hsu C, Sandford BA. The Delphi Technique: Making Sense of Consensus. Pract Assessment, Res Eval 2007;12. 35 Dalkey NC. The Delphi method: An experimental study of group opinion. Santa Monica, California: 1969. http://192.5.14.43/content/dam/rand/pubs/research_memoranda/2005/RM5888.pdf (accessed 24 Dec2012). 36 Fitch K, Bernstein SJ, Aguilar MD, et al. The RAND/UCLA Appropriateness Method User’s Manual. Santa Monica, CA: : RAND Health 2001. http://www.dtic.mil/cgibin/GetTRDoc?Location=U2&doc=GetTRDoc.pdf&AD=ADA393235 37 SurveyMonkey. Who is the SurveyMonkey Audience? 2014.http://help.surveymonkey.com/articles/en_US/kb/Who-is-the-SurveyMonkeyAudience 38 SurveyMonkey Audience. Data Quality: Measuring the Quality of Online Data Sources. 2012.http://clearslide.com/view/mail?iID=HJW5SSTZQ8VWUJXQ5DUP 67 39 SurveyMonkey. SurveyMonkey Audience’s Global Partner Network. 2014.http://help.surveymonkey.com/articles/en_US/kb/SurveyMonkey-Audience-sGlobal-Partner-Network 40 Drasgow F. Polychoric and polyserial correlations. In: Kotz L, Johnson NL, eds. Encyclopedia of statistical sciences. New York, NY, US: : Wiley 1988. 69–74. 41 Porta M. A Dictionary of Epidemiology. 5th editio. New York, New York: : Oxford University Press 2008. 42 Bland JM, Altman DG. Statistical methods for assessing agreement between two methods of clinical measurement. Lancet 1986;327:307– 10.http://www.ncbi.nlm.nih.gov/pubmed/2868172 43 Bland J, Altman D. Comparing methods of measurement: why plotting difference against standard method is misleading. Lancet 1995;346:1085– 7.http://www.sciencedirect.com/science/article/pii/S0140673695917489 (accessed 18 Aug2014). 44 Bland J, Altman D. Measuring agreement in method comparison studies. Stat Methods Med Res 1999;8:135–60. doi:10.1177/096228029900800204 45 Lee S, Nguyen HA, Tsui J. Interview language: a proxy measure for acculturation among Asian Americans in a population-based survey. J Immigr Minor Health 2011;13:244–52. doi:10.1007/s10903-009-9278-z 46 McDonald JT, Kennedy S. Insights into the “healthy immigrant effect”: health status and health service use of immigrants to Canada. Soc Sci Med 2004;59:1613–27. doi:10.1016/j.socscimed.2004.02.004 68 Figure 3-1: Flowchart for literature review Total number of articles: 5492 Number of duplicates: Records after duplicates removed: 943 4549 Records excluded: 4266 Studies of acculturation in adults Proxy measure of acculturation: Ethnicity/culture Immigrant generation/nativity Measured time since immigration Other measure of acculturation* Additional reasons: Excluded due to methods** Unrelated study question*** Full text articles assessed: Grey literature: 283 4 Studies included in synthesis: 117 Number of eligible questionnaires: 16 Full Text Articles Excluded: 170 Studies of acculturation in adults Proxy measure of acculturation: Ethnicity/culture Immigrant generation/nativity Measured time since immigration Other measure of acculturation* Additional reasons: Excluded due to methods** Unrelated study question*** Unavailable questionnaire: Final number of questionnaire: 637 1721 176 73 168 497 994 71 13 2 1 42 15 26 3 13 *These studies used a combination of measures to assess a proxy of acculturation, such as language of survey administration, or some combination of ethnicity, language and/or nativity **These studies were excluded based on methodological grounds. They were either qualitative, mixed-methods, interview administered questionnaires or commentaries in journals ***These studies were unrelated to the current study. These included validating a questionnaire in a new population or did not investigate acculturation 69 Figure 3-2: Flowchart for selecting items for inclusion in the questionnaire Total number of items: Number remaining Number remaining Total number of items In both scales Dominant-culture specific Heritage-culture specific 440 88 112 Total removed 92 Inappropriate for youth*** Duplicative questions**** 11 81 Items Excluded 64 Round 1 (Delphi) Round 2 (Head to head) 51 13 240 148 135 Number of dyads used for Delphi: Final number of dyads: Final number of questions: Total removed 200 Identical questions* Unidimensional items** 68 8 4 80 16 32 Items Excluded 16 Correlated highly with other items (>0.8) 12 Did not correlate with other items (<0.2) 4 Final number of questions: 16 *These questions were identical between questionnaires, i.e. “How well do you speak English” **Theses questions were unidimensional, i.e. “Do you prefer to speak English or Spanish” ***These questions asked about items that would be beyond the scope of youth aged 10-16, such as “I communicate with my spouse in English” ****These questions were duplicative, such as “I speak English 1) at home, 2) at work, 3) with my mother, 4) with my father” etc. 70 Table 3-1: Description of the sample used for pilot testing Baseline 248 Follow up 101 N (%) N (%) 112 (45.2) 136 (54.8) 46 (45.5) 55 (54.5) 15 (6.0) 10 (4.0) 44 (17.7) 13 (5.2) 69 (27.8) 34 (13.7) 7 (2.8) 56 (22.6) 5 (5.0) 5 (5.0) 17 (16.8) 4 (4.0) 39 (38.6) 11 (10.9) 0 (0.0) 20 (19.8) Immigrant Generation 1st generation 2nd generation 3rd generation 83 (33.5) 129 (52.0) 36 (14.5) 27 (26.7) 57 (56.4) 17 (16.8) Speak a language in addition to English Yes No 130 (52.4) 118 (47.6) 56 (55.4) 45 (44.6) Mean (SD) 20.9 (2.5) 10.8 (6.0) Mean (SD) 21.2 (2.4) 10.0 (5.7) N Categorical Measures Gender Male Female Ethnicity White Aboriginal South Asian Arab/West Asian East/SE Asian Black Latin American Other Age Current age Age at immigration 71 Table 3-2: Results of factor analyses, psychometric properties of subscales Factor Loading* Dominant culture Domain In general, I feel comfortable speaking English I believe in Canadian values I have a lot of pride in Canadian culture and its accomplishments I was raised in a way that was consistent with Canadian culture When I was growing up, I was exposed to Canadian culture. I am interested in having Canadian friends outside of my heritage culture Heritage Language Domain In general, I feel comfortable speaking my heritage language With my friends, I feel comfortable speaking my heritage language I enjoy watching TV programs in my heritage language I enjoy reading books in my heritage language My thinking is done in my heritage language Heritage Culture Domain I believe in the values of my heritage culture I have a lot of pride in my heritage culture and its accomplishments I was raised in a way that was consistent with my heritage culture When I was growing up, I was exposed to my heritage culture I am interested in having friends from my heritage culture. .74 Test Statistics Eigenvalue: 12.10/ 8.15 Cronbach’s α: 0.85 .74 .76 .53 .57 .79 .58 Eigenvalue:3.00 / ---Cronbach’s α: 0.86 .77 .62 .68 .84 .64 Eigenvalue: 6.10/ 4.79 Cronbach’s α: 0.83 .73 .69 .72 .58 * Factor loadings are for the 3 factor solution Note: Eigenvalues are for: 3 factor solution/2 factor solution 72 Table 3-3: Means and confidence of subscales by immigrant generation and age at immigration Dominant domain Heritage language Heritage domain n Mean (95% CI) n Mean (95% CI) n Mean (95% CI) 1st Generation 83 3.69 (3.49 - 3.89) 58 3.43 (3.17 - 3.69) 83 4.02 (3.85 - 4.20) 2nd Generation 129 4.13 (4.00 - 4.26) 73 3.05 (2.84 - 3.26) 128 3.97 (3.84 - 4.10) 3rd Generation 36 4.40 (4.19 - 4.61) 7 3.94 (3.17 - 4.71) 36 3.94 (3.71 - 4.18) Immigrant generation p-value <.0001 .0011 .85 Age at Immigration < 12 years old 50 3.64 (3.34 - 3.95) 33 3.03 (2.70 - 3.35) 50 3.89 (3.64 - 4.14) > 12 years old 33 3.77 (3.55 - 3.98) 25 3.97 (3.64 - 4.30) 33 4.23 (4.01 - 4.46) p-value .5 .0001 .056 73 Table 3-4: Reliability of domains Dominant Heritage Heritage Domain Language Domain n 97 64 96 Pearson Correlation .62 .81 .62 Intra-Class Correlation .62 .81 .66 74 Figure 3-3: Bland-Altman Plot of differences between baseline and follow up over the mean response value for each domain Difference between two measures 4 3 2 1 0 1 2 3 4 5 -1 -2 Average of the two scores (dominant domain) Difference between two measures 4 3 2 1 0 1 2 3 4 5 -1 -2 Average of the two scores (heritage language) Difference between two measures 4 3 2 1 0 1 2 3 4 5 -1 -2 Average of the two scores (heritage domain)) 75 3.8 Supplemental Material The Bicultural Youth Acculturation Questionnaire The purpose of this questionnaire is to measure acculturation in Canada. Acculturation is the process of change due to contact between people from different cultures. First, you will be asked a series of question about how you relate to the dominant culture (Canada). You will then be asked about your heritage culture. Dominant culture Questions The “dominant culture” refers to Canadian values, norms and beliefs. For each question, please select one of the six response options. Strongly disagree Disagree Neutral Agree answer Strongly Agree Prefer not to Not applicable 1 In general, I feel comfortable speaking English o o o o o o o 2 I believe in Canadian values o o o o o o o 3 I have a lot of pride in Canadian culture and its o o o o o o o o o o o o o o o o o o o o o o o o o o o o accomplishments 4 I was raised in a way that was consistent with Canadian culture 5 When I was growing up, I was exposed to Canadian culture. 6 I am interested in having Canadian friends outside of my heritage culture 76 Heritage Culture Questions The “heritage culture” refers to your country of origin, or the ethnic group you identify with. Examples include Chinese, Indian, Filipino or another culture. 7. Do you speak a language that you consider to be the primary language of your heritage culture? If you speak multiple languages, please pick the one you speak most often with family and friends. If yes, please click here If no, (Go to Question 8) please click here (Go to Question 14) 8. Do you speak a language that you consider to be the primary language of your heritage culture? If you speak multiple languages, please pick the one you speak most often with family and friends. Arabic Japanese Armenian Korean Chinese Persian English Polish French Portuguese French Creole Russian German Spanish Greek Tagalog Gujarati Urdu Hindi Vietnamese Italian Other (please specify) 77 For each question, please select one of the six response options. Disagree Neutral Agree answer Agree Strongly Prefer not to Not applicable In general, I feel comfortable speaking my heritage Strongly disagree 9 o o o o o o o o o o o o o o o o o o o o o language 10 With my friends, I feel comfortable speaking my heritage language 11 I enjoy watching TV programs in my heritage language 12 I enjoy reading books in my heritage language o o o o o o o 13 My thinking is done in my heritage language o o o o o o o For each question, please select one of the six response options. Strongly disagree Disagree Neutral Agree answer Agree Strongly Prefer not to Not applicable 14 I believe in the values of my heritage culture o o o o o o o 15 I have a lot of pride in my heritage culture and its o o o o o o o o o o o o o o o o o o o o o o o o o o o o accomplishments 16 I was raised in a way that was consistent with my heritage culture 17 When I was growing up, I was exposed to my heritage culture 18 I am interested in having friends from my heritage culture. 78 Chapter 4 The influence of country of birth and ethnicity on BMI among Canadian youth: A national survey 79 4.1 Abstract Background Body mass indices (BMI) of youth often change when they immigrate to a new country. This occurs by the adoption of new behaviours and skills; a process called acculturation. We investigated whether differences existed in BMI by country of birth (Canadian-born vs foreignborn) and ethnicity, both individually and together. We also examined whether time since immigration and health behaviours explained any observed BMI differences. Methods Data sources were the Canadian Health Behaviour in School-Aged Children Study and the Canada Census of Population. Participants were youth in grades 6-10 (weighted n = 19,272). Sociodemographic characteristics, height and weight, were assessed by questionnaire. WHO growth references were used to determine BMI percentiles. Results Foreign-born youth reported lower BMI percentiles than youth born in Canada (-4 percentage points: 95% confidence interval: -6, -2). This did not decrease with increased time since immigration. East and South East Asian youth reported slightly lower BMI percentiles than Canadian dominant culture peers (-2.1%: -4.3, 0.2). Finally, foreign-born Arab/West Asian and East Indian/South Asian youth reported lower BMI percentiles than Canadian-born peers of the same ethnicity (-14%: -22, -7 and -8%: -14, -3). Interpretation Immigrant generation and ethnicity were associated with BMI among Canadian youth both independently and together. Some ethnic groups showed differences by country of birth, i.e. East 80 Indian and South Asian, while others showed no such difference, i.e. East and South East Asian. Our findings reinforce the need to investigate country of birth and ethnicity when considering the determinants of childhood BMI. 81 4.2 Introduction When a person immigrates to a new country their health changes, eventually approximating that of those born in the host country via a process called acculturation.(1) One outcome that could be influenced by acculturative changes in diet and physical activity is BMI.(2–5) This is important due to the high prevalence of obesity and its subsequent health problems.(6–9) In Canada, immigrants have a lower body mass index (BMI) than Canadian-born peers.(10,11) Findings from international studies have been inconsistent.(12–19) Two proposed explanations exist for these discrepancies. The “time since immigration” hypothesis proposes that those who immigrated more recently are less acculturated than established immigrants who have had time to adopt the norms and behaviours of the dominant culture.(17,20) The second posits that this relationship is driven by ethnic differences. Ethnicity is a determinant of BMI, with increased risks for overweight and obesity observed among Hispanic and Black individuals,(13,21) and lower risks among those of East and South East Asian descent.(10–14) It is thus difficult to establish the etiological pathway between birth status and BMI from existing literature because studies 1) have not considered time since immigration, 2) have been of specific ethnic groups and 3) have not explored interactions between immigration and ethnicity. Using a national sample of Canadian school-aged youth, the objective of this study was therefore to examine the independent and joint effects of country of birth and ethnicity on BMI. Subsequent analyses investigated the effect of time since immigration, and if differences in BMI persisted after controlling for important area level covariates. We hypothesized that foreignborn youth would have a lower BMI than Canadian-born peers, this difference would diminish over time, and differences in BMI would exist by ethnicity. 82 4.3 Methods 4.3.1 Data Sources Data from young people were obtained from Cycle 6 (2010) of the Canadian Health Behaviour in School-Aged Children (HBSC) Study. HBSC is a self-reported general health survey conducted under the auspices of the World Health Organization, and completed by students in classrooms.(22) The 2010 Canadian HBSC collected information from 26,078 youth in grades 6 through 10 in 436 schools from 8 provinces and 3 territories.(22) (New Brunswick and Prince Edward Island could not participate). In each province, a systematic, multi-stage cluster sample approach was used, with whole classes selected from a list of eligible and consenting schools. Conversely, in the three Canadian territories, a census of all students in Grades 6 through 10 was attempted. Survey weights were applied to ensure generalizability of estimates nationally. This study received ethics approval from the Queen’s University General Research Ethics Board and Health Sciences Research Ethics Board (File #GEDUC-430-09 and #6007743). Consent was obtained at the school board, school, parent and child levels. Approximately 57% of schools approached agreed to participate, and 77% of the estimated students in schools that gave consent participated in the study. Less than 10% declined to participate or spoiled their questionnaires intentionally, and remaining non-participants generally either failed to return consent forms, failed to receive parental consent, or were absent on the day of the survey.(22) From the original sample of 26,078 youth, 7295 were excluded due to missing data (Figure 1). This left a final unweighted sample of 18,783 (weighted sample of 19,272). Included participants were slightly older (14.0 vs. 13.4 years of age, p < .0001). More second than first generation youth filled out all relevant covariate information (76% vs. 66%, p < .0001), and differences in response rates by ethnicity ranged from 64% to 76% (data not shown). No other differences were found between those included and excluded from the analyses. 83 Area-level measures of population demographics were obtained from the 2006 Canada Census of Population.(23) Census responses were linked to schools to describe the neighbourhoods in the 1 km radius around each school, a distance that has been previously shown to represent social constructs accurately.(24) 4.3.2 Primary Exposures – Country of birth and ethnicity The primary exposure permitted categorization of youth by country of birth. This was assessed in the HBSC survey by asking “In which country were you born?” Youth born outside of Canada were categorized as “foreign-born,” while youth born in Canada were classified as “Canadianborn.” Second, youth were categorized into five groups by the length of time they had been in Canada by asking “How many years have you lived in Canada?” Response options were: “I was born in Canada,” “1 to 2 years,” “3 to 5 years” “6 – 10 years” and “11 or more years.” Due to small numbers in the fifth group, the last two responses were combined to form a “6 + years” group. Finally, youth were categorized into seven ethnic groups by asking “How do you describe yourself?” with 16 possible response options. Youth were able to select up to 3 response categories. Responses were used to create the following ethnic groups: “Canadian dominant culture,” “Arab and West Asian,” “African,” “East Indian and South Asian,” “East and South East Asian,” “Latin American” and “Other.” These groups were based on ethnic groupings defined by the 2006 Canadian Census of Population, with three modifications.(23) First, European, North American and Aboriginal youth were combined to create a “Canadian dominant culture” group (Note: ethics restrictions prohibited separate study of Aboriginal youth).(25) Second, West Asian and South Asian youth were combined due to small numbers of West Asian 84 youth. Finally, an additional group was created (“Other”) that included youth who identified with multiple ethnic groups, i.e. “African” and “Latin American.” 4.3.3 Outcome – BMI percentile Youth self-reported their weight and height in metric or imperial units, as per previously validated precedents.(26) From these, BMI was calculated (kg/m2). To account for growth and maturation, participants’ BMI values were converted to age- and sex-specific BMI percentile scores using World Health Organization growth references.(27) These criteria define overweight and obese as +1 and +2 standard deviations, respectively (27). 4.3.4 Covariates Individual-level covariates collected via the student survey were age, gender, and perceived family wealth. These are known predictors of BMI among youth.(14,28–32) At the school-level, covariates included: population centre category,(33) percentage of immigrants in the community, and median income quartile. 4.3.5 Analysis Plan All analyses used a multi-level approach due to the clustered nature of these data and the inclusion of school-level covariates. Level 1 refers to individual-level and Level 2 refers to school-level variables.(34) Cross-tabulations were used to explore youth BMI percentile by each of the exposure variables. All p-values calculated for associated statistical tests used the RaoScott chi-square test to control for clustering at the school-level. Multi-level linear regression was used to explore the relationship between country of birth and BMI percentile. Country of birth and ethnicity were included in the modeling process; time since 85 immigration was not as it is collinear with country of birth. Five hierarchical regression models were built with the outcome of BMI percentile, following established precedents.(34) First, an empty model was built. This investigated the random effect of school on BMI percentile.(34) Second, the “base model” was created that included country of birth and ethnicity as predictors of BMI percentile. The third and fourth models controlled for individual-level and school-level covariates respectively. The fifth model included all covariates found to be significant in models 3 and 4, using a liberal value of p<.20 to indicate significance. We also investigated the interaction between country of birth and ethnicity. This stratified each ethnicity into 2 groups: Canadian-born, and foreign-born, while controlling for covariates identified in the fifth model. All analyses were conducted using SAS v9.3 using PROC SURVEYFREQ for cross-tabulations and PROC MIXED for regression models. All analyses considered the sample weights and accounted for clustering at the school-level (SAS Institute, Cary, NC). 4.4 Results Our sample was comprised predominantly of youth born in Canada (91.6%). Most self-identified as being part of the Canadian dominant culture (78.2%). Other major ethnic groups included East and South East Asian (5.7%), African (3.8%), and East Indian and South Asian (2.9%) (Table 1). The intra-class correlation revealed that the school-level accounted for 2.7% of the variation in BMI percentile. Differences in BMI percentile were observed by country of birth. The BMI of foreign-born youth was 3 percentile points lower (95% CI: -5, -1) than Canadian-born youth. Stratification of the 86 foreign-born group showed changes in BMI percentile were not linearly associated with time since immigration, and only youth who immigrated 6+ years previously were significantly different from those born in Canada (Table 1). BMI differed by ethnicity. After adjusting for relevant covariates, the BMI of the East Indian and South Asian group and the East and South East Asian group was 2 to 3 percentile points lower than that of the Canadian dominant culture (Table 2). Findings from the country of birth by ethnicity interaction analyses are shown in Table 3. This interaction was statistically significant (p = .0002). When compared to Canadian-born youth of the same ethnicity, foreign-born Canadian dominant culture, Arab and West Asian, and East Indian and South Asian youth had a lower BMI, with differences ranging from -6 to -14 percentile points (Table 3). 4.5 Discussion The most important finding of this study was that the BMI of foreign-born youth was lower than Canadian-born peers, and this association was not linear with time since immigration. This goes against the theory of acculturation. BMI also differed by ethnicity, with East and South East Asian youth having lower BMIs than youth of the Canadian dominant culture, irrespective of country of birth. Finally, the relationship between country of birth and BMI appeared to be modified by ethnicity. Previous research that has examined the association between immigration status and obesity measures within youth has reported mixed findings. Studies of youth in Sweden and the US both found that immigrants are more likely to be overweight and obese.(29,35) In Canada, boys who 87 spent their entire life in Canada had 1.6-fold increased odds of being overweight (95% CI:1.22.3).(12) However, another Canadian study found no difference between by country of birth.(10) This is likely due to demographic differences in the samples being investigated. We were surprised to find that BMI did not change linearly with increased time since immigration. As per previous research of Canadian,(36) and US adults,(3) we anticipated that differences in BMI would disappear over time. However, this was not the case, and the opposite relationship was observed in our sample. This counters the theory of acculturation and may be due to methodological explanations such as inadequate measurement or uncontrolled confounding. Age at immigration could not be controlled for due to the wide response categories. This has been shown to be associated with BMI.(3) In addition, family factors, such a parental country of birth, were not measured in this survey. The family is a key predictor of the health of youth during this developmental stage, and could impact childhood BMI. Finally, our measure of acculturation may not have been precise enough to see a relationship. This remains a provocative and interesting finding, and in light of our conclusions, needs to be examined by ethnic group to ascertain the reason for this relationship. Compared to Canadian youth, we found that East and South East Asian youth reported heights and weights consistent with lower BMI irrespective of country of birth, a finding supported by others.(10–13) Immigrant and ethnic differences in other determinants of obesity, such as insufficient sleep and smoking,(37) may explain these relationships. We examined ethnicity and country of birth together to determine the effect of their possible interaction and found that foreign-born Canadian dominant culture, Arab/West Asian, and East Indian/South Asian youth had lower reported BMIs compared to Canadian-born youth of the same ethnicity. This may be due to the latter having an unhealthier dietary pattern compared to foreign-born peers, as 88 previously shown in Asian and Hispanic youth living in the US.(38) Interestingly, we observed no such relationship among these ethnic groups. An interaction between country of birth and ethnicity has been shown in studies of US children and adolescents, and, similar to our studies, found a protective relationship for Asian immigrant youth. They also found an increased risk for 2nd and 3rd generation Black youth, i.e. youth were US-born but parents or grandparents were born abroad. These differences may be attributable to different sociodemographic factors at play in the US and Canada.(13) Limitations We did not measure acculturation directly and used country of birth and time since immigration as proxy measures. This may have resulted in misclassification of youth, biasing any effect estimates observed. In addition, there were differences in the number of people who completed the entire survey by country of birth and ethnicity. It could be that youth of low acculturation did not complete the entire questionnaire, biasing the results towards no effect. Another limitation was our use of self-reports of height and weight and therefore BMI. Previous research found that youth will overestimate their height and underestimate their weight, although they found no differences by ethnic group.(26) Finally, potential mediators of this relationship, such as physical activity, diet, and screen time, were not examined. Techniques such as structural equation modelling can be used to examine the independent effects of ethnicity and race on BMI, after controlling for these potential mediators. 4.6 Conclusions Country of birth and ethnicity act as determinants of BMI, individually and synergistically. For those in public health, our findings stress the importance of considering both ethnicity and 89 country of birth when designing and implementing interventions.(39–42) Given the high proportion of Canadians that are immigrants, uncovering reasons for weight gain will lead to a better understanding of the determinants of childhood BMI. 4.7 Acknowledgements The HBSC is a WHO/Euro collaborative study; International Coordinator of the 2009–2010 study is Candace Currie, St. Andrews University, Scotland; Data Bank Manager is Oddrun Samdal, University of Bergen, Norway. The Canadian HBSC study (PI: John Freeman, William Pickett) was funded by the Public Health Agency of Canada and Health Canada. This analysis was supported by the Canadian Institutes of Health Research and the Heart and Stroke Foundation of Canada (MOP 97961; PCR 101415). We thank Mr. Andrei Rosu for the collection of geographic information integral to this analysis and feedback and support regarding the geographical variables, and Mr Andrew Day for statistical support and feedback. Atif Kukaswadia was supported by a Canadian Institutes of Health Research Frederick Banting and Charles Best Canada Graduate Scholarships Doctoral Award and Ian Janssen was supported by a Tier 2 Canada Research Chair in Physical Activity and Obesity. The funders did not have any role in the design and conduct of the study; collection, management, analysis, and interpretation of the data; and preparation, review, or approval of the manuscript; and decision to submit the manuscript for publication. Contributors Statement All authors conceived the study design. AK conducted the statistical analyses and had full access to all of the data in the study and takes responsibility for the integrity of the data and the accuracy of the data analysis. All authors interpreted the findings, were involved in writing the paper and 90 had final approval of the submitted and published versions. The authors report no conflicts of interest. 91 4.8 References 1. Berry JW. A Psychology of Immigration. J Soc Issues 2001; 57: 615–31 2. Désilets M-C, Rivard M, Shatenstein B, Delisle H. Dietary transition stages based on eating patterns and diet quality among Haitians of Montreal, Canada. Public Health Nutr 2007; 10: 454–63 3. Roshania R, Narayan KM, Oza-Frank R. Age at arrival and risk of obesity among US immigrants. Obesity 2008; 16: 2669–75 4. Hauck K, Hollingsworth B, Morgan L. BMI differences in 1st and 2nd generation immigrants of Asian and European origin to Australia. Health Place 2011;17: 78–85. 5. Adekunle B, Filson G, Sethuratnam S, Cidro D. Acculturation and consumption: Examining the consumption behavior of people of Afro-Caribbean descent in Canada. J Agric Food Syst Community Dev 2011; 2: 297–313 6. Roberts K, Shields M, de Groh M, Aziz A, Gilbert J. Overweight and obesity in children and adolescents: Results from the 2009 to 2011 Canadian Health Measures Survey. Health Rep 2012; 23: 3–7 7. Cole TJ. Establishing a standard definition for child overweight and obesity worldwide: international survey. BMJ 2000; 320: 1240–1240 8. Han JC, Lawlor DA, Kimm SYS. Childhood obesity. Lancet 2010; 375: 1737–48 9. Harriger JA, Thompson JK. Psychological consequences of obesity: weight bias and body image in overweight and obese youth. Int Rev Psychiatry 2012; 24: 247–53 10. Quon EC, McGrath JJ, Roy-Gagnon MH. Generation of immigration and body mass index in Canadian youth. J Pediatr Psychol 2012; 37: 1–11 11. Maximova K, O’Loughlin J, Gray-Donald K. Healthy weight advantage lost in one generation among immigrant elementary schoolchildren in multi-ethnic, disadvantaged, inner-city neighborhoods in Montreal, Canada. Ann Epidemiol 2011; 21: 238–44 92 12. O’Loughlin J, Paradis G, Renaud L, Meshefedjian G, Gray-Donald K. Prevalence and correlates of overweight among elementary schoolchildren in multiethnic, low income, inner-city neighbourhoods in Montreal, Canada. Ann Epidemiol 1998; 8: 422–32. 13. Singh GK, Kogan MD, Yu SM. Disparities in obesity and overweight prevalence among US immigrant children and adolescents by generational status. J Community Health 2009; 34: 271–81. 14. Au L, Kwong K, Chou JC, Tso A, Wong M. Prevalence of overweight and obesity in Chinese American children in New York City. J Immigr Minor Health 2009; 11: 337–41. 15. Kirchengast S, Schober E. To be an immigrant: a risk factor for developing overweight and obesity during childhood and adolescence? J Biosoc Sci 2006; 38: 695–705. 16. Taverno SE, Rollins BY, Francis LA. Generation, language, body mass index, and activity patterns in Hispanic children. Am J Prev Med 2010; 38: 145–53. 17. Strickman-Stein N, Gervais M, Ludwig DA, Messiah SE, Lipshultz SE, Miller TL. Body mass index as a function of length of United States residency among Haitian immigrant children. Ethn Dis 2010;20:22-8 18. Harris KM, Perreira KM, Lee D. Obesity in the transition to adulthood: predictions across race/ethnicity, immigrant generation, and sex. Arch Pediatr Adolesc Med 2009; 163: 1022–8. 19. Tzotzas T, Kapantais E, Tziomalos K, et al. Epidemiological survey for the prevalence of overweight and abdominal obesity in Greek adolescents. Obesity 2008; 16: 1718–22. 20. Renzaho AMN, Gibbons C, Swinburn B, Jolley D, Burns C. Obesity and undernutrition in sub-Saharan African immigrant and refugee children in Victoria, Australia. Asia Pac J Clin Nutr 2006; 15: 482–90. 93 21. Van Hook J, Balistreri KS. Immigrant generation, socioeconomic status, and economic development of countries of origin: a longitudinal study of body mass index among children. Soc Sci Med 2007; 65: 976–89. 22. Freeman JG, King M, Pickett W, et al. The Health of Canada’s Young People: A Mental Health Focus. The Public Health Agency of Canada; Ottawa, Canada 2011. 23. Statistics Canada (2006) 2006 Canadian Census of Population [WWW document]. URL: http://www12.statcan.gc.ca/census-recensement/2006/index-eng.cfm (accessed 5 December 2013) 24. Simpson K, Janssen I, Craig WM, Pickett W. Multilevel analysis of associations between socioeconomic status and injury among Canadian adolescents. J Epidemiol Community Health 2005; 59: 1072–7. 25. Canadian Institutes of Health Research, Natural Sciences and Engineering Research Council of Canada, and Social Sciences and Humanities Research Council of Canada. Tri-Council Policy Statement: Ethical Conduct for Research Involving Humans. 2010. 26. Brener N, Mcmanus T, Galuska D, Lowry R, Wechsler H. Reliability and validity of selfreported height and weight among high school students. J Adolesc Heal. 2003; 32 (4): 281–7. 27. de Onis M, Onyango AW, Borghi E, Siyam A, Nishida C, Siekmann J. Development of a WHO growth reference for school-aged children and adolescents. Bull World Health Organization 2007; 85: 660-7. URL: http://www.who.int/growthref/growthref_who_bull/en/index.html (accessed 5 December 2013) 28. Balistreri KS, Van Hook J. Trajectories of overweight among US school children: a focus on social and economic characteristics. Matern Child Health J 2011; 15: 610–9. 94 29. Van Hook J, Baker E. Big Boys and Little Girls: Gender, Acculturation, and Weight among Young Children of Immigrants. J Health Soc Behav 2010; 51: 200–14. 30. Gordon-Larsen P, Harris KM, Ward DS, Popkin BM. Acculturation and overweightrelated behaviors among Hispanic immigrants to the US: The National Longitudinal Study of Adolescent Health. Soc Sci Med 2003; 57: 2023–34. 31. Schnohr CW, Kreiner S, Due EP, Currie C, Boyce W, Diderichsen F. Differential Item Functioning of a Family Affluence Scale: Validation Study on Data from HBSC 2001/02. Soc Indic Res 2007; 89: 79–95. 32. Liu J, Probst JC, Harun N, Bennett KJ, Torres ME. Acculturation, physical activity, and obesity among Hispanic adolescents. Ethn Health 2009; 14: 509–25. 33. Statistics Canada (2011) From urban areas to population centres [WWW document]. URL: http://www.statcan.gc.ca/subjects-sujets/standard-norme/sgc-cgt/notice-avis/sgccgt-06-eng.htm (accessed 5 December 2013) 34. Merlo J, Yang M, Chaix B, Lynch J, Råstam L. A brief conceptual tutorial on multilevel analysis in social epidemiology: investigating contextual phenomena in different groups of people. J Epidemiol Community Health 2005; 59: 729–36. 35. Kahlin Y, Werner S, Romild U, Alricsson M. Self-related health, physical activity, BMI and musculoskeletal complaints: a comparison between foreign and Swedish high school students. Int J Adolesc Med Health 2009; 21: 327–41. 36. Tremblay MS, Perez CE, Ardern CI, Bryan SN, Katzmarzyk PT. Obesity, overweight and ethnicity. Health Rep 2005; 16: 23–34. 37. Keith SW, Redden DT, Katzmarzyk PT, et al. Putative contributors to the secular increase in obesity: exploring the roads less traveled. Int J Obes 2006; 30: 1585–94. 95 38. Unger JB, Reynolds K, Shakib S, Spruijt-Metz D, Sun P, Johnson CA. Acculturation, physical activity, and fast-food consumption among Asian-American and Hispanic adolescents. J Community Health 2004; 29: 467–81. 39. Kriemler S, Meyer U, Martin E, van Sluijs EMF, Andersen LB, Martin BW. Effect of school-based interventions on physical activity and fitness in children and adolescents: a review of reviews and systematic update. Brit J Sport Med 2011; 45:923–30 40. Gentile DA, Welk G, Eisenmann JC, Reimer RA, Walsh DA, et al. Evaluation of a multiple ecological level child obesity prevention program: Switch what you Do, View, and Chew. BMC Med 2009; 7: 49 41. Haerens L, De Bourdeaudhuij I, Maes L, Cardon G, Deforche B School-based randomized controlled trial of a physical activity intervention among adolescents. J Adolesc Health 2007; 40: 258–265. 42. Simon C, Schweitzer B, Oujaa M, Wagner A, Arveiler D, et al. Successful overweight prevention in adolescents by increasing physical activity: a 4-year randomized controlled intervention. Int J Obes 2008; 32: 1489–1498 96 Figure 4-1: Study flow diagram Original Sample (n = 26078) Missing study reports on main effects (n = 6201) Weight Class (n= 5522) Implausible BMI z-score( > ±5 SD) (n = 66) Place of Birth (n = 258) Ethnicity (n= 244) Time since immigration (n = 115) Sample remaining (n = 19877) Missing individual level covariate information (n = 698) Material wealth (n = 698) Sample remaining (n = 19179) Missing area level covariate information (n = 396) Percentage of school neighbourhood that are first generation immigrants (n = 256) Area level income (n= 140) Final (unweighted) sample (n = 18783) Final (weighted) sample (n = 19272) 97 Table 4-1: Description of mean BMI percentile by immigrant status and additional covariates, 2010 Canadian HBSC (weighted n = 19,272) Total Main Effects Weighted n % BMI Percentile Difference from referent group Mean (95% CI) Mean (95% CI) p-value Country of birth Canadian-born Foreign-born 17659 91.6 58 (57 , 58) Referent 1613 8.4 54 (52 , 55) -4 (-6, -2) 17659 91.6 58 (57 , 58) Referent <.0001 Time since immigration Canadian born 6+ years 891 4.6 52 (50 , 54) -6 (-8 , -4) <.0001 3-5 years 396 2.1 56 (53 , 59) -2 (-5 , +1) .30 1-2 years 325 1.7 55 (52 , 59) -2 (-6 , +1) .23 78.2 57 (57 , 58) Referent Ethnicity Canadian dominant culture 15071 Arab and West Asian 300 1.6 58 (54 , 61) +1 (-3 , +4) .78 African 737 3.8 60 (58 , 62) +3 (0 , +5) .028 East Indian and South Asian 559 2.9 52 (49 , 55) -5 (-8 , -3) .0001 1089 5.7 53 (51 , 56) -4 (-6 , -2) .0003 187 1.0 60 (56 , 65) +3 (-2 , +7) .24 1330 6.9 59 (57 , 60) +1 (+3 , 0) .15 Male 9567 49.6 61 (60 , 62) Referent Female 9705 50.4 53 (52 , 54) -8 (-9 , -7) East and South East Asian Latin American Other Individual Level Covariates Gender <.0001 98 Table 4-1: Description of mean BMI percentile by immigrant status and additional covariates, 2010 Canadian HBSC (weighted n = 19,272) (continued) SES – Individual (Material wealth) Well off 11064 57.4 56 (55 , 57) Referent Average 6436 33.4 58 (57 , 59) +2 (+1 , +3) <.0001 Worse off 1772 9.2 61 (59 , 63) +5 (+6 , +3) <.0001 Quartile 4 (> $67,605) 4512 23.4 56 (55 , 58) Referent Quartile 3 ($53,112 - $67,605) 4440 23.0 56 (54 , 58) 0 (-2 , +2) .85 Quartile 2 ($43,571 - $53,117) 4311 22.4 56 (55 , 58) 0 (-2 , +2) .99 Quartile 1 (< $43,571) 6008 31.2 59 (58 , 61) +3 (+1 , +5) .002 Quartile 4 (> 17%) 6399 33.2 55 (54 , 56) Referent Quartile 3 (9% - 17%) 5095 26.4 58 (57 , 60) +3 (+1 , +5) .0007 Quartile 2 (3% - 9%) 4319 22.4 58 (57 , 60) +3 (+1 , +5) .0007 Quartile 1 (< 3%) 3459 18.0 58 (56 , 60) +3 (+1 , +5) .008 Large Urban Centre 6275 32.6 56 (54 , 57) Referent Medium Centre 3501 18.2 57 (55 , 59) +1 (+3 , -1) .24 Small Centre 8898 46.2 58 (57 , 59) +2 (+4 , 0) .015 597 3.1 60 (57 , 64) +5 (+8 , +1) .019 Area Level Covariates Median Household Income per year Percentage of Immigrants in the Community Statistics Canada Population Centre Category Rural Note: N values presented were weighted as per the HBSC protocol (22). SAS PROC MIXED was used to compare the levels of the variables for significant differences while controlling for the clustering effect of school. The “other” ethnic group includes youth who identified with more than one of the six identified ethnic groups. 99 Table 4-2: Mean BMI percentiles predicted by the three proposed models Base Model Adjusted Model BMI percentile BMI percentile Mean (95% CI) p-value Mean (95% CI) p-value Canadian-born 58 (57 , 59) Referent 60 (58 , 61) Referent Foreign-born 54 (53 , 56) <.0001 56 (54 , 58) .0003 Canadian dominant culture 56 (55 , 57) Referent 57 (56 , 59) Referent Arab and West Asian 57 (54 , 61) .36 59 (56 , 63) .29 African 59 (57 , 61) .01 60 (58 , 63) .007 East Indian and South Asian 51 (49 , 54) .003 54 (51 , 57) .016 East and South East Asian 53 (51 , 55) .023 55 (53 , 58) .073 Latin American 60 (55 , 64) .076 62 (57 , 66) .066 Other 57 (55 , 59) .097 59 (57 , 61) .077 Main Effects Country of birth Ethnicity Note: The base model did not control for any covariates. The adjusted model controlled for gender, age, individual level SES, median neighborhood income, percentage of immigrants in the community and Statistics Canada Population Centre Category. 100 Table 4-3: Exploration of the interaction between ethnicity and immigration generation Mean BMI Percentile Difference between Canadian and foreign-born youth Country of Ethnicity birth Canadian dominant culture Canadian-born Arab and West Asian African Latin American Mean (95% CI) Mean (95% CI) 14650 59 (58 , 60) Referent Foreign-born 421 54 (51 , 57) -6 (-8 , -3) Canadian-born 182 65 (61 , 70) Referent Foreign-born 118 50 (45 , 56) -15 (-22 , -8) Canadian-born 569 62 (59 , 65) Referent Foreign-born 168 59 (55 , 64) -3 (-8 , 3) Canadian-born 102 61 (55 , 67) Referent 85 64 (57 , 70) 3 (-6 , 12) Canadian-born 344 57 (53 , 60) Referent Foreign-born 214 49 (45 , 54) -7 (-13 , -2) Canadian-born 615 54 (51 , 57) Referent Foreign-born 475 56 (53 , 60) 3 (-1 , 6) 1206 60 (58 , 62) Referent 124 62 (57 , 68) 2 (-3 , 8) Foreign-born East Indian and South Asian East and South East Asian Other Canadian-born Foreign-born n p-value .0003 <.0001 .32 .53 .006 .15 .45 Note: The model controlled for gender, age, individual level SES, median neighborhood income, percentage of immigrants in the community and Statistics Canada Population Centre Category. 101 Chapter 5 Time since immigration and ethnicity as predictors of physical activity among Canadian youth: A cross-sectional study 102 5.1 Abstract Background Little is known about patterns of physical activity engaged in by youth after they immigrate to a new country. This study aims to investigate relationships between immigrant generation and ethnicity with physical activity, and to determine if the relationship between immigrant generation and physical activity was modified by ethnicity. Methods The data sources were Cycle 6 (2009-2010) of the Canadian Health Behaviour in School-Aged Children Study and the 2006 Canada Census of Population. Participants (weighted n = 23,124) were young people from grades 6-10 in 436 schools. Students were asked where they were born, how long ago they moved to Canada, their ethnicity, and how many days a week they accumulated at least 60 minutes of moderate-to-vigorous physical activity (MVPA). Results Youth born outside of Canada were less likely to be active than peers born in Canada; 11% vs 15% reported 7 days/week of at least 60 minutes of MVPA (p = .001). MVPA increased with time since immigration. Compared to Canadian-born youth, youth who immigrated within the last 1-2 years were less likely to get sufficient MVPA on 4-6 days/week (odds ratio: 0.66, 95% confidence interval: 0.53 – 0.82) and 7 days/week (0.62; 0.43 – 0.89). East and South-East Asian youth were less active, regardless of time since immigration: 4-6 days/week (0.67; 0.58 – 0.79) and 7 days/week (0.37; 0.29 – 0.48). 103 Conclusion Time since immigration and ethnicity were associated with MVPA among Canadian youth. Mechanisms by which these differences occur need to be uncovered in order to identify barriers to physical activity participation among youth. 104 5.2 Background An important determinant of the health of young people is involvement in regular physical activity.[1] It is recommended that youth accumulate at least 60 minutes of moderate-to-vigorous physical activity (MVPA) daily.[2–4] In Canada, only 9% of boys and 4% of girls meet this criterion.[5] Gender, age, and socio-economic status are well documented correlates of physical activity.[6,7] Despite its potential importance, the role of immigration as a determinant of physical activity is understudied. A migrant refers to someone who has moved to a new country.[8] When an individual immigrates to a new country, two different cultures meet and acculturation occurs.[9] Acculturation refers to behavioural and psychological changes that occur as individuals adopt the norms and values of their new or dominant culture, while balancing these norms with those of their heritage culture.[9] These may manifest as changes in health and healthrelated behaviours, such as physical activity.[10,11] Acculturation can manifest in two types of health outcomes: psychological outcomes[12] and behavioural adaptation.[13] Psychological outcomes refer to internal adjustments made, and include emotional and psychological issues such as life satisfaction.[12,14] Behavioural adaptations are external changes made, and refer to acquiring culturally appropriate skills and knowledge, obtained through interaction with the dominant culture.[13] These changes can be associated with both positive and negative health outcomes. While youth who do not integrate have lower rates of obesity and higher levels of active transportation,[15,16] they are also more likely to be in physical fights and have higher levels of alcohol consumption.[16,17] These differences are especially noticeable when the dominant culture, i.e. Canada or the US, and the heritage culture, i.e. where the youth and their parents immigrated from, are very different. This is relevant to the US and Canada as immigrants from Asia and the Pacific account for over 40% of 105 all new immigrants, and also in Europe where Asian immigrants are the fourth largest immigrant group, and have different cultural norms and values compared to European peers.[18–20] One methodological problem faced by researchers is that acculturation is a multidimensional process that is difficult to measure. Immigrant generation or time since immigration are often used as proxy measures of acculturation, with the assumption that higher immigrant generation or longer time since immigration are associated with increased acculturation. With the exception of one study,[21] studies of the experiences of immigrant youth have concluded that physical activity levels are lower among foreign-born youth compared with those born in the dominant country.[16,22–26] However, this relationship may be confounded by time since immigration. Time since immigration may more accurately capture acculturation as a determinant of health. This has been explored among Canadian adults aged 20 and older in the Canadian Community Health Survey. This study found that recent immigrants (< 10 years) are 2.68 (95% CI: 2.54 – 2.83) times more likely to get no meaningful physical activity compared to non-immigrants, which is far greater than the risk observed in established immigrants (> 10 years) (OR: 1.30, 95% CI: 1.26 – 1.35).[27] However, prior research has focused on changes in adult physical activity over time. Youth are different than adults, and the etiology and determinants of physical activity among youth may be unique. In addition, due to the rapidly growing size of the immigrant youth population, this group warrants specific study. Previous studies have typically focused on the experiences of a specific ethnic group living within a single geographical area, thus limiting their generalizability.[16,21–24,26,28] One study examined a diverse national sample of US youth, and it found that immigrants are less active than those born in the dominant country.[25] These studies of differences between ethnic groups have limited generalizability to Canada as immigrants to the US and Europe are from different 106 geographical regions than Canadian immigrants, and ethnicity is an important determinant of physical activity.[18–20,29] A Canadian study examined the relationship between immigrant generation and physical activity among youth from low-income, inner city neighbourhoods in Montreal, Quebec, found that youth who had spent less than 25% of their life in Canada were less active.[30] However, this study did not consider ethnicity or interactions between time youth lived in Canada or ethnicity, which could mitigate this relationship.[31] Thus, studies are needed that compare how different ethnicities adapt to new cultures and contexts. Our aim was to investigate differences in MVPA levels between immigrant youth and their Canadian-born peers. Subanalyses investigated whether this relationship differs by time since immigration and ethnicity. We hypothesize that immigrant youth would have lower MVPA than non-immigrants, and that this differs by ethnicity. 5.3 Methods 5.3.1 Data Sources Individual-level data were obtained from Cycle 6 (2010) of the Canadian Health Behaviour in School-Aged Children (HBSC) Study. HBSC is an international survey conducted in affiliation with the World Health Organization. It is a self-reported general health survey completed by students in the classroom setting.[32] The 2010 Canadian HBSC collected information from 26,078 youth in grades 6 through 10 in 436 schools from all provinces and territories, with the exception of Prince Edward Island and New Brunswick.[32] Different recruitment strategies were used in the participating Canadian provinces and territories. In each province, a systematic, multistage cluster sample approach was used. A list of schools within eligible and consenting boards was created, and classes within schools were randomly sampled from this list. When a school refused participation, the sampling protocol involved selecting a school that was similar as possible to the originally selected school. For the three territories, a census of all students in 107 Grades 6 through 10 was attempted. Due to the sampling methods and coverage, sample weights were developed to promote generalizability of estimates nationally. Approximately 57% of schools approached agreed to participate, and 77% of the estimated students in schools that gave consent participated in the study. Less than 10% declined to participate or spoiled their questionnaires intentionally, and remaining non-participants generally either failed to return consent forms, failed to receive parental consent, or were absent on the day of the survey.[32] From the original sample of 26,078 youth, 3292 were excluded due to missing data (Figure 1). This left a final unweighted sample of 22,786 (weighted sample of 23,124). Area-level data were obtained from the 2006 Canada Census of Population.[33] Census-based measures included median neighbourhood income, percentage of immigrants in the community, and Statistics Canada Population Centre Category.[33] Census responses were linked to schools to describe the neighbourhoods in the 1 km radius around each school. 5.3.2 Ethics Statement The Canadian HBSC received ethics approval from the Queen’s University General Research Ethics Board (File # GEDUC-430-09). The analyses for this paper received additional ethics approval from the Queen’s University Health Sciences Research Ethics Board (File # 6007744). Consent was sought at multiple levels. First, school jurisdictions were approached for permission to invite their students and schools to participate. Second, school principals were approached to participate. Finally, both active parent consent, in the form of a signed consent form, and passive parent consent, where students were allowed to participate if they did not return the parent consent form indicating their parents refused participation, were used. Participating school 108 jurisdictions and schools selected the consent type that was consistent with local norms, as per ethics agreements at Queen’s University. 5.3.3 Primary Exposures – Immigrant generation and ethnicity The primary exposure permitted categorization of youth by immigrant generation. This was assessed in the HBSC survey by asking “In which country were you born?” Youth born abroad were categorized as “foreign-born,” while youth born in Canada were classified as “Canadianborn.” Youth were then categorized into five groups by the length of time they have been in Canada by asking “How many years have you lived in Canada?” Response options were: “I was born in Canada,” “1 to 2 years,” “3 to 5 years” “6 to 10 years” and “11 or more years.” Due to small numbers, the last two responses were combined to form a “6 + years” group. Youth were categorized into seven ethnic groups by asking “How do you describe yourself?” with 16 possible response options. Youth were able to select up to 3 response categories. Responses were used to create the following ethnic groups: “Canadian,” “Arab,” “African,” “South Asian,” “East and South East Asian,” “Latin American” and “Other.” These groups were based on ethnic groupings defined by the 2006 Canadian Census of Population, with three modifications.[33] First, European and North American immigrant youth were combined with Aboriginal youth to create a “Canadian” dominant culture group (Note: ethics restrictions prohibited separate study of Aboriginal youth).[34] Second, West Asian and South Asian youth were combined due to small numbers of West Asian youth. Finally, an additional group was created (“Other”) that included youth who identified with multiple ethnic groups. 5.3.4 Outcome – Moderate-to-Vigorous Physical Activity (MVPA) MVPA was measured by taking an average of the responses to the questions: “Over the past 7 days, on how many days were you physically active for a total of at least 60 minutes per day?” 109 and “Over a typical or usual week, on how many days are you physically active for a total of at least 60 minutes per day?”[35] Prior to being asked these questions, the questionnaire provided students with a description of MVPA and a list of common physical activities of this intensity. MVPA was categorized into three groups of: 0-3 days/week, 4-6 days/week and 7 days/week. Only the highest category (7 days/week) meets Canadian physical activity guidelines.[2,3] This measure is reasonably valid: Using a 7 day/week cut off, percent agreement is 69.6% between this self-reported measure and objective measures of MVPA determined using accelerometers.[36] This measure was developed using a diverse sample of US adolescents, and has been shown to be appropriate for use in different ethnic groups.[35] 5.3.5 Covariates Individual-level covariates were age, gender and perceived family wealth, the latter measured through the Family Affluence Scale.[37] These were all found to be important predictors of physical activity among youth.[6,7,38,39] These variables were all obtained via self-report, and measured as part of the 2010 HBSC student questionnaire.[37,40] School-level covariates were obtained from the 2006 Canadian Census of Population, and were based on a 1 km radius buffer around the school. Previous research using the HBSC survey has found this to be an appropriate buffer by which to make inferences about other social constructs, such as neighbourhood socioeconomic status.[41] At the area level, covariates included: Statistics Canada population centre category, percentage of immigrants in the community, and median income quartile.[33] 5.3.6 Analysis Plan All analyses used a multi-level approach due to the clustered nature of these data and the inclusion of school-level covariates; Level 1 includes individual-level factors and Level 2 includes school-level variables.[42] Cross-tabulations of youth physical activity levels by the 110 exposure categories were performed. All p-values calculated for associated statistical tests used the Rao-Scott chi-square test to control for clustering at the school-level. Second, etiologic analyses were used to explore the relationship between time since immigration and physical activity using multi-level nominal regressions. Only time since immigration and ethnicity were included in the modelling process, as immigrant generation and time since immigration are collinear. A nominal regression model was built with three outcomes: 0-3 days/week (referent), 4-6 days/week, and 7 days/week of 60 minutes or more of MVPA. Several models were built, following the approach of Merlo et al.[42] First, an empty model was built. This investigated the random effect of school on the outcome of interest, and explains how much of the variation in MVPA is explained by school alone.[42] Second, a bivariate model was created that only included time since immigration and ethnicity as predictors of physical activity. The third and fourth models controlled for individual-level and school-level covariates respectively. The final model thus included all covariates found to be statistically significant in models three and four. Percentage changes in odds ratios were then calculated for the three iterative models compared to the base model, to determine the impact of these covariates on the effect estimates. Surprisingly, very few covariates created changes in estimates of the primary exposures of greater than 5%. Thus, all variables originally considered were included in the final model. A third exploratory analysis was conducted that investigated the interaction between time since immigration and ethnicity. This stratified each ethnicity into 4 groups: Canadian-born, 1-2 years, 3-5 years and 6+ years. No variables were controlled for in these models due to insufficient cell sizes. 111 All analyses were conducted using SAS v9.3 using PROC SURVEYFREQ for cross-tabulations and PROC GLIMMIX for regression models. All analyses considered the sample weights and accounted for clustering at the school-level (SAS Institute, Cary, NC). The intra-class correlation revealed that the school-level accounted for 4.9% of the variation in MVPA, thereby justifying the use of multi-level models.[42] 5.4 Results Our sample was comprised of predominantly Canadian-born youth (90.9%) (Table 1). Most selfidentified as Canadian (77.3%). The other major ethnic groups were East and South East Asian (5.8%), African (4.3%), and East Indian and South Asian (3.1%). Only 14.6% of youth reported accumulated 60 minutes of MVPA every day of the week (Table 1), meeting Canadian guidelines and hence were classified as “active.” The distribution of the sample across the three physical activity groups implied that foreign-born youth were less physically active than Canadian-born peers (Table 1). After controlling for relevant covariates, youth who immigrated within the last 1-2 years reported being less likely to accumulate at least 60 minutes of MVPA on 4-6 days/week (OR: 0.66 (95 % CI: 0.53 – 0.83)) and 7 days/week (0.62 (0.43 – 0.89)) in comparison to Canadian born youth (Table 2). Reported MVPA was not significantly different across Canadian born youth and youth who immigrated in the past 3-5 years and 6+ years (Table 2). Differences in MVPA were also observed by ethnicity. East and South East Asian, Latin American, and African ethnic groups had lower physical activity levels, with 32-39% accumulating the recommended 60 minutes of MVPA on only 0-3 days/week, compared to 112 26.8% within the Canadian ethic group (Table 1). These differences persisted after controlling for important covariates (Table 2). Exploratory analyses tested the potential interaction between ethnicity and time since immigration (Table 3). Tests for interaction were not statistically significant (p = .12). Irrespective of their time since immigration, East/ South East Asian youth were less active than Canadian-born youth who identified as Canadian. For other ethnicities no trends emerged, although different relationships were seen with increased time since immigration. 5.5 Discussion The most important findings of the study of immigrant generation, ethnicity and physical activity among young people were as follows. First, immigrant youth in Canada are less active than their Canadian-born peers. Second, reported physical activity increases with increased time since immigration. Third, reported physical activity differs by ethnicity. Finally, exploratory tests of possible interactions between immigrant generation and ethnicity were generally negative, but do suggest that East and South East Asian youth have reduced physical activity levels irrespective of their immigration status and the length for which they have resided in Canada. Our primary finding that the observed reduction in physical activity levels in immigrant youth decreased as time since immigration increased supports the theory of acculturation. That is, as immigrants live longer in a country, their physical activity behaviours more closely approximate those of the dominant culture. This finding is consistent with research findings for Canadian adults. Cross-sectional analyses of 400,055 adult participants in the Canadian Community Health Survey (2000-2005) indicate that recent immigrants (< 10 years) are 2.68 (95% CI: 2.54 – 2.83) times more likely to get no meaningful physical activity compared to non-immigrants whereas 113 established immigrants (> 10 years) are only marginally more likely to get no meaningful physical activity (OR: 1.30, 95% CI: 1.26 – 1.35).[27] Our findings echo these results, except that they showed that immigrant youth match the physical activity behaviours of their Canadian-born peers within a few years. Findings of similar size and direction have been reported among a national sample of US youth. Foreign born youth had 1.39-fold (95% CI: 1.13 - 1.70) increased odds of obtaining no physical activity compared to US-born peers of US-born parents, i.e. 2nd (and higher) generation youth.[25] Studies of Swedish youth found similar findings, with foreignborn youth being less physical active in sports than Swedish born peers (54.4% vs 41.1%, p = .003) [43] Our results suggest these findings may be driven by certain ethnic groups, and are not generalizable to all immigrant youth. We found that East and South East Asian youth had drastically reduced odds of being physical active regardless of time since immigration. These findings and the magnitude of these associations are supported by other Canadian studies.[30,31] A study of youth in Montreal found increased odds of no physical activity of similar effect sizes to our study, with Asian boys and girls reporting odds of 2.1 (1.4–3.1) and 1.8 (1.2–2.6), respectively, for no physical activity.[30] This difference remains consistent regardless of time since immigration. A study of Canadian adults reported slightly smaller effect sizes compared to our study, with established (> 10 years) and recent (< 10 years) East and South East Asian immigrant adults reporting odds of 0.6 (0.5 – 0.8) and 0.7 (0.6 – 0.9) for moderate-to-high physical activity, compared to White immigrants within the same time since immigration category.[31] These differences between East and South East Asian immigrants and Canadian adult peers may be due to 1) being involved in different forms of physical activity, 2) cultural differences in what constitutes physical activity, and 3) ethnic differences in extracurricular activity involvement.[27,44,45] Studies of youth in the US have reported similar findings, although they focused on Hispanic and non-Hispanic Black youth. 114 In both cases, they found that foreign born youth with both parents born abroad had increased odds of obtaining no physical activity (OR: 2.13 (95% CI: 1.67 – 2.71) and 1.46 (95% CI: 0.88 – 2.41) respectively).[25] Studies in the US have focused on Korean and South Asian adults, and have reported similar findings, corroborating what we saw in our study among East and South East Asian youth.[46,47] Finally, studies in Europe have report ethnic minority adolescents are less active than Norwegian peers.[48] These findings reinforce the potential importance of tailoring physical activity immigrant-specific interventions by ethnicity, and including those born in Canada. A systematic review of studies of youth have found that multi-component interventions, incorporating the school environment, family and child have been most effective.[49] This has been shown among interventions performed in the US,[50] as well as similar programs in Europe.[51–53] Previous interventions have focused on youth as a homogenous group, and our findings support the hypothesis that ethnic differences exist within youth, and specifically the immigrant youth population. These differences have been shown to be barriers to participation in physical activity.[47] Thus acknowledging cultural norms and values as part of interventions may further their effectiveness. These findings have significant implications for health promotion efforts in Canada. A large proportion (19.8%) of Canadians were born abroad.[33] One potential mechanism by which immigrant youth may be less active than Canadian-born peers is due to participation in sports. While 55% of children of Canadian-born parents participated in sports, only 32% of children of parents who immigrated to Canada in the last 10 years participate.[38] A second important implication is that a large number of European, Canadian and US immigrants are from Asia and the Pacific. [18–20] Our finding that these youth have drastically lower odds of obtaining sufficient MVPA, a finding that is supported by national studies of Canadian adults, suggests that 115 these individuals may have lower physical activity levels throughout the life course.[29,31] The potential reasons for these differences demand further study and suggest the need for tailored and culturally sensitive interventions. The main strength of this study is its novelty within the physical activity literature. Methodologically, we controlled for the potential confounding effects of both area and individual level factors. In addition, this study investigated both the main effects of ethnicity and time since immigration on physical activity, as well as the interaction between the two. However, this study also has several limitations. First, since this is a cross-sectional study, we cannot confirm the temporal sequence of the observed associations. Second, we cannot determine the levels of physical activity the youth may have had in their heritage country. Third, the individual-level measures were all obtained via self-report, although they have demonstrated reliability and validity.[35,37,40] In addition, this analysis could not compare 1st, 2nd and 3rd generation youth, as there was no information available on parents’ country of birth, and this has been shown to be associated with child sport involvement in Canada.[38] Finally, we were unable to investigate Aboriginal youth separately from our “Canadian dominant culture” group, due to ethics restrictions. This is a group with unique health behaviours, attitudes and culture. 5.6 Conclusion This study indicates that both immigration and ethnicity play important roles as determinants of physical activity in populations of young people. Future research should investigate mechanisms by which ethnic groups differ in physical activity levels, as these differences will provide tangible areas for interventions. These studies could include longitudinal analyses of specific ethnic groups to determine factors that change following immigration, mixed-methods or qualitative research with specific groups to uncover mechanisms responsible for these changes, or parent116 child studies that investigate the role of the parent in child physical activity levels following immigration. For public health professionals, our findings suggest that creating ethnicity-specific interventions may be important, especially for the East and South East Asian population in Canada. These interventions can focus on both increasing activity and reducing sedentary behaviours, but require evidence to ensure they are effective. It is important to determine how best to encourage these youth to adopt healthy lifestyles and behaviours, as these behaviours may stay with them through the life course. 5.7 Acknowledgements We thank Mr. Andrei Rosu for the collection of geographic information integral to this analysis and feedback and support regarding the geographical variables, and Mr Andrew Day for statistical support and feedback. 117 5.8 References 1. Janssen I, Leblanc AG (2010) Systematic review of the health benefits of physical activity and fitness in school-aged children and youth. Int J Behav Nutr Phy 7(40):1-16 2. Canadian Society for Exercise Physiology (2011) Canadian Physical Activity Guidelines for Youth 12-17 years [Internet] Available: http://www.csep.ca/CMFiles/Guidelines/CSEP-InfoSheets-youth-ENG.pdf. Accessed January 27 2014 3. Canadian Society for Exercise Physiology (2011) Canadian Physical Activity Guidelines for Children 5-11 years [Internet] Available: http://www.csep.ca/CMFiles/Guidelines/CSEP-InfoSheets-child-ENG.pdf. Accessed January 27 2014 4. Janssen I (2007) Physical activity guidelines for children and youth. Appl Physiol Nutr Metab 32:S109–S121 5. Colley RC, Garriguet D, Janssen I, Craig CL, Clarke J, et al (2011) Physical activity of Canadian children and youth: Accelerometer results from the 2007 to 2009 Canadian Health Measures Survey. Health Reports 22:15–23 6. Ferreira I, Van Der Horst K, Wendel-Vos W, Kremers S, Van Lenthe FJ, et al (2006) Environmental correlates of physical activity in youth - a review and update. Obes Rev 8:129–54 7. Spence JC, Lee RE (2003) Toward a comprehensive model of physical activity. Psychol Sport Exer 4:7–24 8. United Nations Department of Economic and Social Affairs Population Division (2008) Trends in International Migrant Stock: The 2008 Revision [Internet] Available: http://esa.un.org/migration/index.asp?panel=1. Accessed January 27 2014 9. Sam DL, Berry JW (2010) Acculturation: When Individuals and Groups of Different Cultural Backgrounds Meet. Perspect Psychol Sci 5:472–81. 10. Newbold B (2009) The short-term health of Canada’s new immigrant arrivals: evidence from LSIC. Ethnic Health 14:315–36. 11. Singh Setia M, Quesnel-Vallee A, Abrahamowicz M, Tousignant P, Lynch JW (2012) Different outcomes for different health measures in immigrants: evidence from a longitudinal analysis of the National Population Health Survey (1994-2006). J Immigr Minor Health 14:156–65 12. Schwartz SJ, Unger JB, Zamboanga BL, Szapocznik J (2010) Rethinking the concept of acculturation: implications for theory and research. Am Psychol 65: 237–251. doi:10.1037/a0019330. 118 13. Celenk O, Van de Vijver FJR (2011) Assessment of Acculturation: Issues and Overview of Measures. Online Readings in Psychology and Culture 8:1–22. 14. Van Selm K, Sam DL, Van Oudenhoven JP (1997) Life satisfaction and competence of Bosnian refugees in Norway. Scand J Psychol 38: 143–149. doi:10.1111/14679450.00020. 15. Gil A, Wagner E (2000) Acculturation, familism, and alcohol use among Latino adolescent males: Longitudinal relations. J Community Psychol 28: 443–458. 16. Carvajal SC, Hanson CE, Romero AJ, Coyle KK (2002) Behavioural risk factors and protective factors in adolescents: a comparison of Latinos and non-Latino whites. Ethnic Health 7:181–93 17. Smokowski PR, Rose RA, Bacallao M (2009) Acculturation and aggression in Latino adolescents: modeling longitudinal trajectories from the Latino Acculturation and Health Project. Child Psychiatry Hum Dev 40: 589–608. doi:10.1007/s10578-009-0146-9. 18. Citizenship and Immigration Canada (2011) Facts and Figures: Immigration Overview Permanent and Temporary Residents [Internet] Available: http://www.cic.gc.ca/english/pdf/research-stats/facts2011.pdf. Accessed January 27 2014 19. Vasileva K (2011) Population and Social Conditions [Internet] Available: http://epp.eurostat.ec.europa.eu/cache/ITY_OFFPUB/KS-SF-11-034/EN/KS-SF-11-034EN.PDF. Accessed January 27 2014 20. Monger R, Yankay J (2013) US Legal Permanent Residents: 2012 [Internet] Available: http://www.dhs.gov/sites/default/files/publications/ois_lpr_fr_2012_2.pdf. Accessed January 27 2014 21. Unger JB, Reynolds K, Shakib S, Spruijt-Metz D, Sun P, et al (2004) Acculturation, physical activity, and fast-food consumption among Asian-American and Hispanic adolescents. J Commun Health 29:467–81 22. Hosper K, Klazinga NS, Stronks K (2007) Acculturation does not necessarily lead to increased physical activity during leisure time: a cross-sectional study among Turkish young people in the Netherlands. BMC Public Health 7:230 23. Liu J, Probst JC, Harun N, Bennett KJ, Torres ME (2009) Acculturation, physical activity, and obesity among Hispanic adolescents. Ethnic Health 14(5):509–25 24. Taverno SE, Rollins BY, Francis LA (2010) Generation, language, body mass index, and activity patterns in Hispanic children. Am J Prev Med 38:145–53 25. Singh GK, Yu SM, Siahpush M, Kogan MD (2008) High levels of physical inactivity and sedentary behaviors among US immigrant children and adolescents. Arch Pediatr Adolesc Med 162(8):756–63 119 26. Renzaho AM, Swinburn B, Burns C (2008) Maintenance of traditional cultural orientation is associated with lower rates of obesity and sedentary behaviours among African migrant children to Australia. Int J Obes 32:594–600 27. Dogra S, Meisner BA, Ardern CI (2010) Variation in mode of physical activity by ethnicity and time since immigration: a cross-sectional analysis. Int J Behav Nutr Phys Act 7: 75. doi:10.1186/1479-5868-7-75. 28. Martinez SM, Ayala GX, Arredondo EM, Finch B, Elder J (2008) Active transportation and acculturation among Latino children in San Diego County. Prev Med 47:313–8 29. Bryan SN, Tremblay MS, Pérez CE, Ardern CI, Katzmarzyk PT (2006) Physical Activity and Ethnicity: Evidence from the Canadian Community Health Survey. Can J Public Health 97:271–6 30. O’Loughlin J, Paradis G, Kishchuk N, Barnett, T, Renaud, L (1999) Prevalence and correlates of physical activity behaviors among elementary schoolchildren in multiethnic, low income, inner-city neighborhoods in Montreal, Canada. Ann Epidemiol 9:397–407 31. Tremblay MS, Bryan SN, Pérez CE, Ardern CI, Katzmarzyk PT (2006) Physical Activity and Immigrant Status: Evidence from the Canadian Community Health Survey. Can J Public Health 97:277–82 32. Freeman JG, King M, Pickett W, Craig W, Elgar F, et al (2011) The Health of Canada’s Young People: a mental health focus [Internet] Available: http://www.phacaspc.gc.ca/hp-ps/dca-dea/publications/hbsc-mental-mentale/assets/pdf/hbsc-mentalmentale-eng.pdf. Accessed January 27 2014 33. Statistics Canada (2006) 2006 Census of Population [Internet] Available: http://www12.statcan.gc.ca/census-recensement/2006/index-eng.cfm. Accessed January 27 2014 34. Canadian Institutes of Health Research, Natural Sciences and Engineering Research Council of Canada, and Social Sciences and Humanities Research Council (2010) Research Involving the First Nations, Inuit and Métis Peoples of Canada. Tri-Council Policy Statement: Ethical Conduct for Research Involving Humans. Available: http://www.ethics.gc.ca/pdf/eng/tcps2/TCPS_2_FINAL_Web.pdf. Accessed January 27 2014 35. Prochaska JJ, Sallis JF, Long B (2001) A physical activity screening measure for use with adolescents in primary care. Arch Pediat Adol Med 155:554–9 36. Ridgers ND, Timperio A, Crawford D, Salmon J (2012) Validity of a brief self-report instrument for assessing compliance with physical activity guidelines amongst adolescents. J Sci Med Sport 15:136–41 37. Schnohr CW, Kreiner S, Due EP, Currie C, Boyce W, et al (2007) Differential Item Functioning of a Family Affluence Scale: Validation Study on Data from HBSC 2001/02. Soc Indic Res 89:79–95 120 38. Clark W (2008) Kids’ sports. Can Soc Trends 85:54-61 39. Aizlewood A, Bevelander P, Pendakur R (2006) Recreational Participation Among Ethnic Minorities and Immigrants in Canada and the Netherlands. J Immigr Refug Stud 4:1–32 40. Griebler R, Molcho M, Samdal O, Inchley J, Dür W, et al (2010) Health Behaviour in School-Aged Children: A World Health Organization Cross National Study, Research Protocol for the 2009/2010 Survey. Vienna: LBIHPR and Edinburgh: CAHRU 41. Simpson K, Janssen I, Craig WM, Pickett W (2005) Multilevel analysis of associations between socioeconomic status and injury among Canadian adolescents. J Epidemiol Community Health 59:1072–7 42. Merlo J, Yang M, Chaix B, Lynch J, Råstam L (2005) A brief conceptual tutorial on multilevel analysis in social epidemiology: investigating contextual phenomena in different groups of people. J Epidemiol Community Health 59:729–36 43. Kahlin Y, Werner S, Romild U, Alricsson M (2009) Self-related health, physical activity, BMI and musculoskeletal complaints: a comparison between foreign and Swedish high school students. Int J Adolesc Med Health 21: 327–341. 44. Tortolero SR, Masse LC, Fulton JE, Torres, I, Kohl III HW. (1999) Assessing physical activity among minority women: Focus group results. Health Iss 9:135–42 45. Darling N. (2005) Participation in Extracurricular Activities and Adolescent Adjustment: Cross-Sectional and Longitudinal Findings. J Youth Adolescence 34:493–505 46. Choi JW, Wilbur JE, Miller A, Szalacha L, McAuley E (2008) Correlates of leisure-time physical activity in Korean immigrant women. West J Nurs Res 30: 620–638. 47. Daniel M, Wilbur J (2011) Physical activity among South Asian Indian immigrants: an integrative review. Public Health Nurs 28:389–401 48. Sagatun A, Kolle E, Anderssen SA, Thoresen M, Sogaard AJ, et al. (2008) Three-year follow-up of physical activity in Norwegian youth from two ethnic groups: associations with socio-demographic factors. BMC Public Health 8: 419. doi:10.1186/1471-2458-8419. 49. Kriemler S, Meyer U, Martin E, van Sluijs EMF, Andersen LB, et al. (2011) Effect of school-based interventions on physical activity and fitness in children and adolescents: a review of reviews and systematic update. Brit J Sport Med 45:923–30 50. Gentile DA, Welk G, Eisenmann JC, Reimer RA, Walsh DA, et al. (2009) Evaluation of a multiple ecological level child obesity prevention program: Switch what you Do, View, and Chew. BMC Med 7: 49. doi:10.1186/1741-7015-7-49. 121 51. Haerens L, De Bourdeaudhuij I, Maes L, Cardon G, Deforche B (2007) School-based randomized controlled trial of a physical activity intervention among adolescents. J Adolesc Health 40: 258–265. doi:10.1016/j.jadohealth.2006.09.028. 52. Simon C, Schweitzer B, Oujaa M, Wagner A, Arveiler D, et al (2008) Successful overweight prevention in adolescents by increasing physical activity: A 4-year randomized controlled intervention. Int J Obes 32: 1489–1498. doi:10.1038/ijo.2008.99. 53. De Meij JSB, Chinapaw MJM, Kremers SPJ, Van der Wal MF, Jurg ME, et al (2010) Promoting physical activity in children: The stepwise development of the primary schoolbased JUMP-in intervention applying the RE-AIM evaluation framework. Br J Sports Med 44: 879–887 122 Figure 5-1: Study flow diagram of exclusion criteria used to eliminate observations from the original HBSC sample Original Sample (n = 26078) Missing main effects (n = 1356) Country of birth (n = 258) Time since immigration (n = 115) Ethnicity (n = 244) Physical activity (n = 743) Sample remaining (n =24722) Missing individual level covariate information (n = 1448) Gender (n = 16) Age (n = 141) Individual level SES (n = 1291) Sample remaining (n = 23274) Missing area level covariate information (n = 488) Median neighbourhood income (n = 488) Final (unweighted) sample (n = 22786) Final (weighted) sample (n = 23124) 123 Table 5-1: Description of key variables by level of physical activity (n = 23,124). Total % n (col) 23124 100.0 Days/week with more than 60 minutes of moderate-to-vigorous physical activity 0-3 days/week 4-6 days/week 7 days/week % % Rao-Scott n % (row) n (row) n (row) Chi-square 6455 27.9 13282 57.4 3387 14.6 Canadian-born Foreign-born 21025 90.9 2099 9.1 5777 27.5 678 32.3 12091 57.5 1191 56.7 3157 15.0 230 11.0 Ref .0010 Time Since Immigration Canadian-born 6+ years 3-5 years 1-2 years 21025 1134 523 442 5777 345 159 174 12091 663 309 219 3157 126 55 49 Ref .065 .12 .0015 Ethnicity Canadian Arab and West Asian African East Indian and South Asian East and South East Asian Latin American Other 17883 77.3 387 1.7 990 4.3 Male Female 11235 48.6 11890 51.4 2580 23.0 3875 32.6 Well Off Average Worse off 13171 57.0 7762 33.6 2191 9.5 3354 25.5 2368 30.5 732 33.4 Total n Main Effects Immigrant Generation Individual Level Covariates Gender Perceived family wealth 706 1348 238 1571 90.9 4.9 2.3 1.9 3.1 5.8 1.0 6.8 27.5 30.4 30.5 39.3 4789 26.8 116 29.9 321 32.4 183 526 90 430 25.9 39.0 37.9 27.4 57.5 58.4 59.0 49.6 10353 57.9 212 54.8 526 53.1 406 722 128 937 57.4 53.5 53.6 59.6 15.0 11.2 10.5 11.1 2741 15.3 59 15.2 143 14.4 118 101 20 204 Ref .66 .065 16.7 7.5 8.5 13.0 .81 < .0001 .007 .24 6472 57.6 6811 57.3 2183 19.4 1204 10.1 Ref < .0001 7728 58.7 4401 56.7 1153 52.6 2089 15.9 993 12.8 306 13.9 Ref < .0001 < .0001 124 Area-Level Covariates Median Neighbourhood Income Percentage of Immigrants in Community Quartile 4 (> $67,546) Quartile 3 ($52,650 $67,500) Quartile 2 ($43,192 $52,635) Quartile 1 (< $43,176) 5366 23.2 1390 25.9 3179 59.2 797 14.8 Ref 5361 23.2 1401 26.1 3137 58.5 823 15.3 .94 5188 22.4 7210 31.2 1572 30.3 2092 29.0 2970 57.3 3996 55.4 646 12.4 1122 15.6 .08 .24 Quartile 4 (> 17%) Quartile 3 (9% - 17%) Quartile 2 (3% - 9%) Quartile 1 (< 3%) 7868 5992 5181 4083 2232 1417 1367 1439 4532 3650 2931 2169 1104 925 883 475 Ref .009 .18 .0037 34.0 25.9 22.4 17.7 28.4 23.6 26.4 35.2 57.6 60.9 56.6 53.1 14.0 15.4 17.0 11.6 Large Urban Centre 7637 33.0 2289 30.0 4327 56.7 1021 13.4 Ref Medium Centre 4181 18.1 1207 28.9 2379 56.9 595 14.2 .77 Small Centre 10604 45.9 2817 26.6 6132 57.8 1655 15.6 .08 Rural 703 3.0 142 20.2 444 63.1 117 16.6 <.0001 Note: N values presented were weighted as per the HBSC protocol.[32] The Rao-Scott chi square test controls for the clustering effect of school. Statistics Canada Population Centre Category The “other” ethnic group includes youth who identified with more than one of the six identified ethnic groups. 125 Table 5-2: Nominal regression modeling of determinants of moderate-to-vigorous physical activity. 4-6 days/week Unadjusted Main Effects OR (95% CI) 7 days/week Adjusted p OR (95% CI) Unadjusted p OR (95% CI) Adjusted p OR (95% CI) p Time Since Immigration Ethnicity Canadian-born 1.00 (ref) 1.00 (ref) 1.00 (ref) 6+ years 1.04 (0.88 - 1.22) .67 1.01 (0.86 - 1.19) .91 0.85 (0.67 - 1.10) .22 0.82 (0.63 - 1.05) .12 3-5 years 0.97 (0.78 - 1.22) .81 0.92 (0.73 - 1.16) .49 0.89 (0.63 - 1.26) .53 0.81 (0.57 - 1.15) .24 1-2 years 0.69 (0.55 - 0.86) .001 0.66 (0.53 - 0.83) .0003 0.67 (0.47 - 0.96) .029 0.62 (0.43 - 0.89) .010 Canadian 1.00 (ref) Arab and West Asian 0.87 (0.65 - 1.15) .32 0.81 (0.61 - 1.08) .15 1.01 (0.68 - 1.50) .96 0.93 (0.62 - 1.39) .72 African 0.80 (0.68 - 0.95) .012 0.77 (0.65 - 0.92) .003 0.86 (0.68 - 1.10) .24 0.82 (0.64 - 1.05) .12 0.97 (0.78 - 1.21) .81 0.89 (0.71 - 1.12) .32 1.09 (0.80 - 1.47) .59 0.97 (0.71 - 1.32) .85 Asian 0.71 (0.61 - 0.83) <.0001 0.67 (0.58 - 0.79) <.0001 0.40 (0.31 - 0.52) <.0001 0.37 (0.29 - 0.48) <.0001 Latin American 0.80 (0.58 - 1.11) .19 0.76 (0.55 - 1.06) .10 0.57 (0.34 - 0.97) .037 0.53 (0.31 - 0.91) .022 Other 0.99 (0.88 - 1.12) .91 1.00 (0.89 - 1.12) .97 0.88 (0.74 - 1.04) .13 0.90 (0.76 - 1.07) .24 1.00 (ref) 1.00 (ref) 1.00 (ref) 1.00 (ref) East Indian and South Asian East and South East Note: The reference group in both models was “0-3 days/week.” Both models (unadjusted and adjusted) control for clustering at the school level. The adjusted models control at the individual level for age, gender and perceived family wealth. At the area level the models control for median neighbourhood income, percentage of immigrants in the community and Statistics Canada Population Centre category. 126 Table 5-3: Investigations of interactions between ethnicity and time since immigration. Total Ethnicity Canadian Arab and West Asian African East Indian and South Asian East and South East Asian Latin American Time since Immigration Canadian-born n 17358 % (col) 99.5 0-3 days/week n 4655 % (row) 26.8 4-6 days/week n 10028 % (row) 57.8 7 days/week n 2675 % (row) 15.4 Rao-Scott Chi-square Ref 6+ years 332 35.2 85 25.7 199 60.1 47 14.2 .85 3-5 years 105 11.2 21 19.5 71 67.9 13 12.6 .20 1-2 years 88 0.5 28 32.0 54 61.4 6 6.6 .15 Canadian-born 228 82.4 69 30.3 119 51.9 40 17.7 .53 6+ years 103 27.5 25 24.0 71 69.6 7 6.4 .06 3-5 years 42 10.7 15 36.7 17 39.5 10 23.8 .19 1-2 years 14 2.9 7 46.3 6 39.6 2 14.1 .44 Canadian-born 740 83.3 234 31.6 393 53.1 113 15.3 .17 6+ years 123 13.4 41 33.1 69 56.2 13 10.7 .37 3-5 years 55 4.6 14 25.6 36 64.2 6 10.2 .68 1-2 years 71 6.3 32 45.4 28 39.7 11 14.8 .087 Canadian-born 423 64.6 104 24.7 240 56.8 78 18.5 .47 6+ years 135 20.7 41 30.3 77 56.6 18 13.2 .87 3-5 years 96 14.7 23 24.0 64 66.5 9 9.5 .40 1-2 years 52 7.9 14 27.8 25 47.5 13 24.8 .36 Canadian-born 749 79.5 287 38.3 404 54.0 58 7.7 < .0001 6+ years 279 63.5 99 35.7 157 56.5 22 7.8 .011 3-5 years 160 36.5 63 39.1 86 53.6 12 7.3 .005 1-2 years 160 36.5 77 47.7 74 46.1 10 6.2 < .0001 Canadian-born 128 50.2 44 34.2 73 57.0 11 8.8 .12 6+ years 61 28.2 29 46.7 29 46.6 4 6.7 .023 3-5 years 28 9.7 13 46.7 11 40.3 4 13.0 .20 1-2 years 21 4.2 5 23.2 15 71.6 1 5.3 .38 127 Other Canadian-born 1410 96.2 391 27.7 838 59.4 181 12.9 .19 6+ years 95 6.2 20 21.2 60 63.3 15 15.6 .64 3-5 years 33 2.2 8 24.5 24 70.6 2 4.9 .39 1-2 years 33 1.9 11 33.1 15 46.7 7 20.2 .69 Note: N values presented were weighted as per the HBSC protocol.[32] The Rao-Scott chi square test controls for the clustering effect of school. 128 Chapter 6 The effects of immigrant generation and ethnicity on screen time among young Canadians: A two year longitudinal study 129 6.1 Abstract Background Screen time is a form of sedentary behaviour with adverse consequences for the health of youth. Ethnicity and immigrant generation have been shown to be associated with screen time in crosssectional studies of Hispanic and Black populations in the US. Research is required of other ethnic groups, in other countries, and utilizing longitudinal designs. This study examined differences in screen time by immigrant generation and ethnicity among young people in Canada over a two year period. Methods Data were obtained from the self-report National Longitudinal Survey of Children and Youth (NLSCY), a survey administered at two year intervals from 1994/95 to 2008/09. Youth were categorized as 1st, 2nd and 3rd generation Canadians, and into six ethnic groups: “White”, “Aboriginal”, “East and South East Asian”, “East Indian and South Asian”, “Black”, and “Other.” Participants reported screen time at baseline, and again two years later. Results Mean age at baseline was 11.1 years (range: 9 to 14 years). Screen time increased by an average of 0.36 (95% CI: 0.31, 0.40) hours/day over follow-up and did not differ by ethnic group. However, the increase in screen time observed among first generation immigrants (+1.05 hours/day, 95% CI: +0.70, +1.41) was larger than that observed amongst second and third generation peers and this persisted after controlling for covariates. 130 Conclusion This study contradicts previous studies that have reported differences in screen time by ethnicity. Our findings stress the importance of immigrant generation as a determinant of screen time. 131 6.2 Background Sedentary behaviour is defined as any waking behaviour characterized by an energy expenditure ≤1.5 METs (metabolic equivalent of task) while in a seated or reclined position.[1] One subtype of sedentary behaviour is “screen time,” which refers to time spent watching television, playing video games, or using a computer.[2,3] Screen time is of interest among young people as it is associated with indicators of physical, social and mental health.[4–7] To counter these effects, evidence-based public health guidelines recommend that school-aged children and youth accumulate no more than two hours of screen time per day.[8] These are rarely met and, in Canada, only 18% of girls and 14% of boys aged 11-15 meet these guidelines.[9] In order to create effective interventions to tackle this health problem, focused study of screen time and its determinants require study in different cultures and contexts. Immigrant generation and ethnicity are two determinants of screen time among youth. Previous studies among youth have typically employed cross-sectional designs and have been based out of the US. These studies report that screen time is lower among youth born abroad (1st generation) and youth born in the US to foreign-born parents (2nd generation) compared to youth born in the US to US-born parents (3rd generation).[10,11] For instance, in a national study of US youth, 17.3% of 3rd generation youth watched over 3 hours of television a day, compared to 15.5% of 1st generation youth.[10] This aligns with a study of Hispanic youth immigrants, which found that 20.5% and 11.9% of 3rd and 1st generation youth watched more than 2 hours/day of television, respectively.[11] Ethnic differences in screen time have also been reported. Previous research has consistently noted that screen time is higher among African American children and youth than amongst Whites and Hispanics living in the US.[12–14] However, these studies have all been cross-sectional in nature. A longitudinal study of youth in London, England, found that 132 screen time increased in all race and ethnic groups, although despite this increase, Black youth again reported the highest television and video game levels at baseline and follow up.[15] The health experiences of immigrants from Asia and the Pacific warrants greater consideration. This region accounts for a large proportion of new immigrants and the ethnic minority population in many European and North American countries.[16–18] While China, India and the Philippines are the second through fourth largest sources of migrants to both the US and Canada, China and India are also the third and fourth largest sources of migrants to Australia.[19] In addition, India is the single largest source of migrants to the United Kingdom.[19] These individuals are moving to countries with different cultural and social norms, as well as different health behaviours. These differences may manifest in diverse health experiences and outcomes, especially among youth. The objective of our current study was thus to examine changes in screen time over a two year period among young people in Canada by immigrant generation and ethnicity. If changes in screen time vary by immigrant generation and/or ethnicity, interventions may need to be tailored for these specific groups in Canada, as has been done successfully for physical activity.[20] 6.3 Methods 6.3.1 Data source and survey administration The data source was the National Longitudinal Survey of Children and Youth (NLSCY), a longitudinal study of Canadian youth.[21] The NLSCY was initiated in 1994/95, with representative samples of parents and youth administered the survey at 2-year intervals. The NLSCY was designed to collect information on the determinants of a child’s development, and to monitor changes over time. The initial NLSCY sample was drawn from the 1994 Canadian Labour Force Survey, with children aged 0 to 11 years in 1994 selected from households. At 133 Cycle 1, the “person most knowledgeable,” i.e., either the parent or guardian, was interviewed using a computer-assisted telephone interview, with a second administered to a spouse if available. These children and their parents were subsequently asked to complete a questionnaire at two year intervals for eight cycles. Thus, children aged 0 to 1 at the start of the original cohort were 14 to 15 years of age at Cycle 8. The original NLSCY study was registered with Statistics Canada (Registration #: STC/HLD-040-75020). This secondary analysis of the NLSCY received ethics approval from the Queen’s University Health Sciences Research Ethics Boards (File#: 6010744) and Statistics Canada (File#: CISS-RDC-628408). To protect the privacy of research participants and ensure stability in estimation, the NLSCY has specific criteria surrounding minimal sample sizes on which analyses can be based. As a consequence of the relatively small number of immigrants and ethnic minorities in the sample, we restructured the NLSCY dataset to maximize the number of records for immigrants and ethnic minorities that could be used in a longitudinal analysis. In the NLSCY survey, youth were asked questions on screen time when they were between 10-15 years of age. Thus, for each participant we denoted the first cycle that they reported screen time as a “baseline assessment.” We then denoted a subsequent cycle that they had screen time measures taken as their “follow-up assessment”. This was done for all eight cycles of the NLSCY. For 90.7% of participants, followup was two years post-baseline, i.e., the next administration of the survey. The remaining 9.3% provided responses after four years (two cycles). The NLSCY was not a random sample of the population, and sample weights, created by Statistics Canada researchers, were applied in order to generalize our findings to the Canadian population.[22] Three steps were taken to create the sample weights. The first step accounted for the sampling frame at Cycle 1.[23] The second step accounted for non-response over follow-up. 134 In the third step the sample was stratified by age, sex, and province. This study uses data from 7,107 responses with valid screen time data at both baseline and follow-up, corresponding to 2,943,000 weighted observations. 6.3.2 Exposures (immigrant generation and ethnicity) Exposures were measured in Cycle 1. At that time, parents were asked what country their child and they themselves were born. Youth born abroad were classified as “first generation Canadian.” Youth born in Canada to at least one foreign-born parent were classified as “second generation Canadian.” Youth born in Canada to Canadian-born parents were classified as “third or higher generation Canadian”. The NLSCY provided 12 choices for participants with respect to ethnic group. To foster model stability, these 12 groups were collapsed into six categories: “White”, “Aboriginal”, “East and South East Asian”, “East Indian and South Asian”, “Black”, and “Other.” The latter category included those who identified with another group, or more than one of the previously listed groups, as per prior precedents.[24] 6.3.3 Outcome (screen time) Screen time was assessed in Cycles 2 through 8 by asking youth the following: “On average, about how many hours a day do you watch TV or videos, or play video games?” Response categories were “I don't watch TV or videos or play video games,” “Less than 1 hour a day,” “1 to 2 hours a day,” “3 to 4 hours a day,” “5 to 6 hours a day,” and “7 or more hours.” This was considered as a continuous outcome with the first response option as “0 hours”, the final response option as “7.5 hours.”, and the mid-point of the remaining response options. Analogous items 135 have been shown to correlate with a detailed log of screen time (r = 0.47), although these estimates slightly underestimate the truth (-0.09 hours for average television over the week).[25] 6.3.4 Covariate selection Gender, age, and parental education (as a proxy measure of socio-economic status) were included as confounding variables based upon their known relationships to screen time, immigrant generation, and ethnicity.[9,26] Follow-up time (e.g., number of years between baseline and follow-up) and survey cycle were included as covariates to account for potential changes over time. We limited our covariates to those that were included in all NLSCY cycles to maximise available response. 6.3.5 Analysis plan All analyses were conducted using SAS v9.3 (SAS Institute, Cary, NC). Average screen time at baseline, at follow-up, and the difference between the two were explored to estimate differences between groups of youth defined by immigrant generation and ethnicity. Differences between groups were evaluated using analyses of variance and Tukey’s post hoc test. Screen time measurements are presented as mean hours/day (95% confidence interval (CI)). A series of four linear models were constructed using PROC GLM. The first model explored bivariate relations between each of the exposures (immigrant generation and ethnicity) and screen time at follow-up. The second model repeated the examination of these relationships, but controlled for baseline screen time. The third model included both exposures and baseline screen time in a single model. The fourth model included both exposures, baseline screen time, as well as age, gender, parental education and survey cycle. Covariates were selected based on two criteria. First, we required that they had demonstrated associations with screen time as evident in 136 past literature.[9,26] Second, we required that their inclusion in a model caused a change in effect estimate of greater than 10% to at least one of the levels of the exposures of interest. Survey cycle was included as a measure of year of survey administration, as it was suspected that calendar year might be an independent predictor of changes in screen time. 6.4 Results Our sample was comprised predominantly of youth who were born in Canada to Canadian-born parents (88.8%), and who identified as “White” (88.7%) (Table 1). At baseline, the average age of the participants was 11.1 years (range 9 to 14 years). Youth reported, on average, 2.21 (2.17, 2.25) hours/day of screen time at baseline and 2.56 (2.52, 2.61) hours/day at follow- up (Table 2). The follow-up length was 2 years for 90.7% of the sample and 4 years for the remaining 9.3%. Immigrant generation predicted baseline screen time and change in screen time. At baseline, 1st generation youth reported significantly lower screen time compared to 2nd and 3rd generation youth (Table 2). However, this was not the case at follow-up. While all three immigrant generation groups reported increases in mean screen time, 1st generation youth increased by more than 2nd and 3rd generation youth. Thus, at follow-up, all three groups reported comparable levels of screen time (Table 2). This persisted after controlling for covariates. First generation youth reported the largest change in screen time, increasing their screen time by +0.54 (+0.16, +0.93) hours/day more than 3rd generation peers over the follow-up period (Table 3). 137 Table 6-1: Description of the study sample (weighted n =2 943 000) Weighted n (000s) % Gender Female 1,480 50.3 Male 1,463 49.7 Ethnicity White East and South East Asian 2,611 88.7 12.8 0.4 South Asian 1.8 0.1 Black 8.3 0.3 Aboriginal 107 3.6 Other 202 6.9 Immigrant Generation 3rd generation 2,613 88.8 2nd generation 281 9.5 1st generation 49.2 1.7 Follow-up duration 2 years 2,671 90.7 4 years 272 9.3 138 Table 6-2: Mean screen time (hours/day) at baseline, follow up and mean difference for select exposure categories Screen time at baseline Screen time at follow up Mean difference (hours/day) (hours/day) (hours/day) 2.21 (2.17 , 2.25) 2.56 (2.52 , 2.61) 0.36 (0.31 , 0.40) White 2.22 (2.17 , 2.26) 2.60 (2.56 , 2.64) 0.38 (0.33 , 0.43) Aboriginal 2.38 (2.17 , 2.59) 2.42 (2.21 , 2.64) 0.04 (-0.20 , 0.28) Black 2.26 (1.50 , 3.02) 2.04 (1.26 , 2.82) -0.22 (-1.08 , 0.65) East and South East Asian 1.85 (1.24 , 2.47) 1.87 (1.24 , 2.49) 0.01 (-0.69 , 0.71) South Asian 3.35 (1.70 , 4.99) 3.52 (1.84 , 5.21) 0.18 (-1.70 , 2.06) Other 2.02 (1.87 , 2.18) 2.24 (2.08 , 2.40) 0.22 (0.04 , 0.39) 3rd generation 2.22 (2.18 , 2.27) 2.58 (2.53 , 2.62) 0.35 (0.31 , 0.40) 2nd generation 2.21 (2.08 , 2.34) 2.46 (2.33 , 2.60) 0.25 (0.10 , 0.40) 1st generation 1.32 (1.01 , 1.63) 2.37 (2.05 , 2.69) 1.05 (0.70 , 1.41) Overall Ethnicity Immigrant Generation 139 Table 6-3: Weighted linear regressions of the associations between the exposures of interest and average screen time (hours/day) Model 1 Model 2 Model 3 Model 4 Beta (95% CI) Beta (95% CI) Beta (95% CI) Beta (95% CI) White Ref Ref Ref Ref Aboriginal -0.18 (-0.40 , 0.04) -0.24 (-0.44 , -0.03) -0.24 (-0.44 , -0.03) -0.17 (-0.40 , 0.06) Black -0.56 (-1.34 , 0.22) -0.58 (-1.30 , 0.15) -0.69 (-1.43 , 0.05) -0.64 (-1.52 , 0.23) East and South East -0.73 (-1.36 , -0.11) -0.60 (-1.18 , -0.01) -0.62 (-1.22 , -0.03) -0.28 (-1.08 , 0.53) South Asian 0.92 (-0.76 , 2.61) 0.50 (-1.07 , 2.07) 0.54 (-1.04 , 2.11) 0.78 (-0.87 , 2.43) Other -0.36 (-0.52 , -0.19) -0.29 (-0.44 , -0.13) -0.30 (-0.46 , -0.14) -0.27 (-0.45 , -0.08) Beta (95% CI) Ethnicity Asian Immigrant Generation 3rd generation Ref Ref Ref Ref 2nd generation -0.11 (-0.26 , 0.03) -0.11 (-0.24 , 0.02) -0.04 (-0.17 , 0.10) -0.10 (-0.26 , 0.06) 1st generation -0.21 (-0.53 , 0.12) 0.13 (-0.17 , 0.43) 0.31 (-0.01 , 0.62) 0.54 (0.16 , 0.93) 0.37 (0.35 , 0.40) 0.37 (0.35 , 0.40) 0.41 (0.39 , 0.44) Baseline level of screen 0.37 (0.35 , 0.39) time Model 1 is the independent relationship between each of the exposures of interest (immigrant generation and ethnicity) and screen time at follow up. Model 2 extends these relationships by controlling for baseline screen time. Model 3 includes both exposures and baseline screen time in one model. Model 4 includes both exposures and baseline screen time, as well as age, gender, parental education and survey cycle. 140 At baseline, mean screen time was lowest among East and South East Asian youth and highest among South Asian youth, although differences in screen time were not significantly different across ethnic groups. The “White” and “Other” ethnic groups were the only groups to report significant increases in screen time during the follow-up period (Tables 1 and 2). Differences in the change in screen time in comparison to White peers ranged from +0.78 (-0.87, +2.43) to -0.64 (-1.52, +0.23) hours/day for South Asian and Black youth respectively; however, these differences were not statistically significant (Table 3). Finally, baseline level of screen time was consistently a significant predictor of changes in screen time during follow-up. After controlling for relevant covariates, each hour at baseline was associated with an increase of +0.41 (+0.39, +0.44) hours at follow-up after controlling for relevant covariates (Table 4). 6.5 Discussion Our study had two major findings. The first was that 1st generation youth reported the lowest levels of screen time at baseline, although this increased to levels comparable to youth born in Canada over the 2 to 4 year follow-up period. Second, we observed no differences in screen time across the different ethnic groups at baseline or follow-up. At baseline, 1st generation youth reported lower levels of screen time than their 2nd and 3rd generation peers. In the US, similar observations have been made among both national and Hispanic samples.[10,11] A review of European studies of youth (< 18 years old) found that immigrants to Europe, while reporting lower BMI than non-immigrant peers, reported higher sedentary behaviours.[27] However, this review acknowledged that heterogeneous ethnic categories, such as the term “Asian” encompassing both South Asian and East and South East 141 Asian, might mitigate any differences.[27] Our study supports this conclusion, as we found that differences (albeit not statistically significant) existed between these groups. A unique contribution of our study was that 1st generation youth reported the largest increase in screen time and, that by the end of the follow-up period, screen time was not different across immigrant generation groups. This is consistent with the theory of acculturation, defined as the adoption of behaviours and norms of the new country.[28] Changes in adults have been shown to take longer, such as 10+ years for physical activity.[29] We found that these changes occurred rapidly among youth. Thus, if interventions aimed at reducing screen time are to target new immigrants, they may only have a small critical period where this is possible. Further research will elucidate whether this is a feasible and effective strategy. The second major finding was that there were no differences in screen time between the ethnic groups under study. This is a contrast to previous research which has reported racial and ethnic differences, possibly attributable to three factors.[10] First, much of the existing research has been performed in the US. The history of race and ethnicity relations in the US has led to unique circumstances, especially among the non-Hispanic black and Hispanic population.[30] This has manifested in a strong associations between race and ethnicity with health in the US, largely attributable to differences in income and education between race and ethnic groups.[31,32] Thus, the influence of ethnicity on behaviours such as screen time may be different in the US than other countries. A second related explanation could be in the ethnic groups under study. Studies of race and ethnicity and screen time in the US have focused on differences between non-Hispanic white, non-Hispanic black, and Hispanic populations.[10,11] While a small number of Hispanic youth were included in the NLSCY, we were underpowered to look at this specific ethic group to corroborate these findings in our context. A systematic review of correlates of screen time among young children (< 7 years old) also found differences by ethnicity and race; again almost all of 142 their findings were based on differences between African American and White youth.[33] Outside of the US, very little literature examines ethnic differences in screen time. A study following students in the UK from age 11-12 to 15-16 also found differences by race and ethnicity, and in particular found a larger increase in sedentary behaviour among Asian girls compared to White peers.[15] We did not observe such an increase, although this may have been due to lack of power. For public health professionals, our study suggests that focusing on baseline levels of screen time, and targeting those who have high levels of screen time, irrespective of ethnic group, might help to reduce future screen time among Canadian youth. A systematic review of interventions to reduce screen time found that they can be effective, with 62% reporting statistically significant reductions.[34] The most successful interventions incorporated electronic TV monitoring devices, feedback systems with positive support, and clinic-based counseling. These interventions can take place in settings ranging from the school to the home, and have been shown to be effective for both decreasing screen time and improving physical health.[35,36] Our research suggests targeting of these programs to new immigrants. However, this would have to be evaluated, as the evidence for the efficacy of tailored interventions that tackle obesity and related behaviours in defined populations is mixed. Existing evaluations of these tailored studies are either underpowered or lacking appropriate measurements at baseline.[37] It is unknown whether screen time would benefit from culturally tailored interventions or if population-level approaches would be more successful. The main strength of this study was its longitudinal design. This allowed for the control of baseline levels of screen time, and assessment of changes over time. A second strength is the 143 ethnically diverse sample. Finally, this study used a large, population-based sample that facilitated the generalizability of our findings. However, this study has limitations. First, the screen time measures used in the NLSCY may be somewhat dated now given recent changes in how youth obtain screen time, such as through tablets, laptops, mobile phones, etc. This information bias might have led to underreported screen time in the most recent cycles. Second, only variables collected as part of the NLSCY survey were available for analysis. We were therefore not able to control for a number of potential confounding variables including family rules, and neighbourhood characteristics.[33,38,39] It is possible that these may explain part of the observed differences. Third, the external validity of our findings may be limited across time and place. The sample was drawn from the 1994 Labour Force’s Survey sample of respondent households.[21] If there have been demographic shifts in the Canadian youth population, this would have effects on its generalizability. Finally, potential interactions between ethnicity and immigrant generation could not be explored due to insufficient sample size. As has been shown for physical activity among Canadian youth, this relationship may differ between groups under study.[40] 6.6 Conclusion This study adds to a growing literature about the health of young new Canadians, as well as the ethnic groups that make up the Canadian social fabric. We found first generation youth reported lower screen time than second and third generation peers, although this benefit disappeared at follow-up. We also report no differences in screen time between the different ethnic groups under study. Our findings stress the important of considering both the child’s and the parent’s country of birth, in addition to previous screen time when designing interventions. 144 What is already known on the subject? Ethnicity and immigrant generation have been shown to be associated with screen time in crosssectional studies of Hispanic and Black populations in the US. Research is required of other ethnic groups, in other countries, utilizing longitudinal designs. What this study adds? Findings from this study contradict previous studies that have reported differences in screen time by ethnicity. Our findings stress the importance of immigrant generation as a determinant of screen time. Acknowledgements We thank Bin Hu and Dr. Lenka Mach for their assistance with the technical aspects of accessing and analyzing the NLSCY data at the Queen’s University Statistics Canada Research Data Centre. Competing interests None of the authors have any conflicts of interest to declare. Funding Atif Kukaswadia was supported by a Canadian Institutes of Health Research Frederick Banting and Charles Best Canada Graduate Scholarships Doctoral Award and Ian Janssen was supported by a Tier 2 Canada Research Chair in Physical Activity and Obesity. 145 Contributorship statement AK assisted with the design of the study, led and conducted the statistical analysis, and wrote the initial draft of the manuscript. IJ and WP assisted with the design of the study, oversaw the statistical analysis, and revised the manuscript for intellectual content. All authors have reviewed and approved the final manuscript that was submitted. 146 6.7 References 1 Sedentary Behaviour Research Network. Letter to the Editor: Standardized use of the terms “sedentary” and “sedentary behaviours.” Appl Physiol Nutr Metab 2012;37:540–2. doi:10.1139/H2012-024 2 Committee on Public Education. Children, Adolescents, and Television. Pediatrics 2001;107:423–6. doi:10.1542/peds.107.2.423 3 Canadian Paediatric Society. Impact of media use on children and youth. Paediatr Child Health 2003;8:301– 17.http://www.pubmedcentral.nih.gov/articlerender.fcgi?artid=2792691&tool=pmcentrez &rendertype=abstract 4 Iannotti RJ, Kogan MD, Janssen I, et al. Patterns of adolescent physical activity, screenbased media use, and positive and negative health indicators in the U.S. and Canada. J Adolesc Health 2009;44:493–9. doi:10.1016/j.jadohealth.2008.10.142 5 Janssen I, Boyce WF, Pickett W. Screen time and physical violence in 10 to 16-year-old Canadian youth. Int J Public Health 2012;57:325–31. doi:10.1007/s00038-010-0221-9 6 Hume C, Singh A, Brug J, et al. Dose-response associations between screen time and overweight among youth. Int J Pediatr Obes 2009;4:61–4. doi:10.1080/17477160802199992 7 Mark AE, Janssen I. Relationship between screen time and metabolic syndrome in adolescents. J Public Health (Bangkok) 2008;30:153–60. doi:10.1093/pubmed/fdn022 8 Tremblay MS, Leblanc AG, Janssen I, et al. Canadian sedentary behaviour guidelines for children and youth. Appl Physiol Nutr Metab 2011;36:59–64; 65–71. doi:10.1139/H11012 9 Mark AE, Boyce WF, Janssen I. Television viewing, computer use and total screen time in Canadian youth. Paediatr Child Health 2006;11:595– 9.http://www.pubmedcentral.nih.gov/articlerender.fcgi?artid=2528654&tool=pmcentrez &rendertype=abstract 10 Singh GK, Yu SM, Siahpush M, et al. High levels of physical inactivity and sedentary behaviors among US immigrant children and adolescents. Arch Pediatr Adolesc Med 2008;162:756–63. doi:10.1001/archpedi.162.8.756 11 Taverno SE, Rollins BY, Francis LA. Generation, language, body mass index, and activity patterns in Hispanic children. Am J Prev Med 2010;38:145–53. doi:10.1016/j.amepre.2009.09.041 12 Sisson SB, Church TS, Martin CK, et al. Profiles of sedentary behavior in children and adolescents: the US National Health and Nutrition Examination Survey, 2001-2006. Int J Pediatr Obes 2009;4:353–9. doi:10.3109/17477160902934777 147 13 Anderson SE, Economos CD, Must A. Active play and screen time in US children aged 4 to 11 years in relation to sociodemographic and weight status characteristics: a nationally representative cross-sectional analysis. BMC Public Health 2008;8:366. doi:10.1186/1471-2458-8-366 14 Dennison B a., Erb T a., Jenkins PL. Television Viewing and Television in Bedroom Associated With Overweight Risk Among Low-Income Preschool Children. Pediatrics 2002;109:1028–35. doi:10.1542/peds.109.6.1028 15 Brodersen NH, Steptoe A, Boniface DR, et al. Trends in physical activity and sedentary behaviour in adolescence: ethnic and socioeconomic differences. Br J Sports Med 2007;41:140–4. doi:10.1136/bjsm.2006.031138 16 Citizenship and Immigration Canada. Facts and Figures: Immigration Overview Permanent and Temporary Residents. Ottawa, Ontario: 2011. http://www.cic.gc.ca/english/resources/statistics/menu-fact.asp 17 Monger R, Yankay J. US Legal Permanent Residents: 2012. 2013. http://www.dhs.gov/sites/default/files/publications/ois_lpr_fr_2012_2.pdf (accessed 23 May2013). 18 Vasileva K. Population and Social Conditions. Luxembourgh: 2011. http://epp.eurostat.ec.europa.eu/cache/ITY_OFFPUB/KS-SF-11-034/EN/KS-SF-11-034EN.PDF 19 Pew Research. Origins and Destinations of the World’s Migrants, from 1990-2013. http://www.pewglobal.org/2014/09/02/global-migrant-stocks/ 20 Kriemler S, Meyer U, Martin E, et al. Effect of school-based interventions on physical activity and fitness in children and adolescents: a review of reviews and systematic update. Br J Sports Med 2011;45:923–30. doi:10.1136/bjsports-2011-090186 21 Statistics Canada. National Longitudinal Survey of Children: Overview of Survey Instruments for 1994-95 Data Collection Cycle 1. Ottawa, Ontario: 1995. 22 Statistics Canada. Microdata User Guide: National Longitudinal Survey of Children and Youth - Cycle 8. http://www23.statcan.gc.ca/imdb-bmdi/document/4450_D4_T9_V8eng.pdf 23 Statistics Canada. National Longitudinal Survey of Children and Youth: Survey Overview for the 2008/2009 Data Collection Cycle 8. 2010.http://www23.statcan.gc.ca/imdb-bmdi/document/4450_D2_T9_V4-eng.pdf 24 Quon EC, McGrath JJ, Roy-Gagnon M-HM-H. Generation of immigration and body mass index in Canadian youth. J Pediatr Psychol 2012;37:1–11. doi:10.1093/jpepsy/jss037 25 Schmitz K, Harnack L, Fulton J. Reliability and validity of a brief questionnaire to assess television viewing and computer use by middle school children. J Sch 2004;74:370– 148 7.http://onlinelibrary.wiley.com/doi/10.1111/j.1746-1561.2004.tb06632.x/abstract (accessed 28 Feb2012). 26 Koezuka N, Koo M, Allison KR, et al. The relationship between sedentary activities and physical inactivity among adolescents: results from the Canadian Community Health Survey. J Adolesc Health 2006;39:515–22. doi:10.1016/j.jadohealth.2006.02.005 27 Labree LJW, van de Mheen H, Rutten FFH, et al. Differences in overweight and obesity among children from migrant and native origin: a systematic review of the European literature. Obes. Rev. 2011;12:e535– 47.http://ovidsp.ovid.com/ovidweb.cgi?T=JS&PAGE=reference&D=medl&NEWS=N& AN=21348926 28 Berry JW, Phinney JS, Sam DL, et al. Immigrant Youth in Cultural Transition: Acculturation, Identity, and Adaptation Across National Contexts. Mahwah, NJ, US: : Lawrence Erlbaum Associates Publishers 2006. 29 Tremblay MS, Bryan SN, Pérez CE, et al. Physical Activity and Immigrant Status: Evidence From the Canadian Community Health Survey. Can J Public Heal 2006;97:277–82. 30 Krieger N, Chen JT, Coull B, et al. The unique impact of abolition of Jim Crow laws on reducing inequities in infant death rates and implications for choice of comparison groups in analyzing societal determinants of health. Am J Public Health 2013;103:2234–44. doi:10.2105/AJPH.2013.301350 31 US Census Bureau. Table 695. Money Income of Families - Number and Distribution by Race and Hispanic Origin: 2009. Stat. Abstr. United States 2012. http://www.census.gov/compendia/statab/2012/tables/12s0695.pdf 32 Krieger N, Kosheleva A, Waterman PD, et al. 50-year trends in US socioeconomic inequalities in health: US-born Black and White Americans, 1959-2008. Int J Epidemiol 2014;:1294–313. doi:10.1093/ije/dyu047 33 Hoyos Cillero I, Jago R. Systematic review of correlates of screen-viewing among young children. Prev Med (Baltim) 2010;51:3–10. doi:10.1016/j.ypmed.2010.04.012 34 Schmidt ME, Haines J, O’Brien A, et al. Systematic review of effective strategies for reducing screen time among young children. Obesity 2012;20:1338–54. doi:10.1038/oby.2011.348 35 DeMattia L, Lemont L, Meurer L. Do interventions to limit sedentary behaviours change behaviour and reduce childhood obesity? A critical review of the literature. Obes Rev 2007;8:69–81. doi:10.1111/j.1467-789X.2006.00259.x 36 Maniccia DM, Davison KK, Marshall SJ, et al. A meta-analysis of interventions that target children’s screen time for reduction. Pediatrics 2011;128:e193–210. doi:10.1542/peds.2010-2353 149 37 Renzaho AMN, Mellor D, Boulton K, et al. Effectiveness of prevention programmes for obesity and chronic diseases among immigrants to developed countries - a systematic review. Public Health Nutr 2010;13:438–50. doi:10.1017/S136898000999111X 38 Ramirez ER, Norman GJ, Rosenberg DE, et al. Adolescent screen time and rules to limit screen time in the home. J Adolesc Heal 2011;48:379–85. doi:10.1016/j.jadohealth.2010.07.013 39 Carson V, Spence JC, Cutumisu N, et al. Association between neighborhood socioeconomic status and screen time among pre-school children: a cross-sectional study. BMC Public Health 2010;10:367. doi:10.1186/1471-2458-10-367 40 Kukaswadia A, Pickett W, Janssen I. Time since immigration and ethnicity as predictors of physical activity among Canadian youth: a cross-sectional study. PLoS One 2014;9:e89509. doi:10.1371/journal.pone.0089509 150 Chapter 7 General Discussion 7.1 Overview The overall purpose of this thesis was to examine methodologic and etiologic issues surrounding the concept of acculturation and its proxy indicators of immigrant generation and time since immigration, as potential determinants of obesity, physical activity, and screen time within different ethnic populations of Canadian youth. This thesis consisted of four manuscripts, with the following objectives: 1. Chapter 3: To develop and validate a short, self-reported questionnaire that can be used to assess acculturation in population studies of youth (the Bicultural Youth Acculturation Questionnaire); 2. Chapter 4: To examine the independent and joint effects of country of birth and ethnicity on body mass index; 3. Chapter 5: To investigate differences in moderate-to-vigorous physical activity levels between immigrant youth and their Canadian-born peers, and if such relationships are modified by ethnicity; 4. Chapter 6: To examine changes in screen time over a two year period among young people in Canada by immigrant generation and ethnicity. For brevity, the phrase “methodologic manuscript” will be used to refer to Chapter 3, while the phrase “etiologic manuscripts” will refer to Chapters 4-6. 151 7.2 Summary of Key Findings Chapter 3: To develop and validate a short, self-reported questionnaire that can be used to assess acculturation in population studies of youth In this study I developed a short, 16-item questionnaire that measures acculturation among bicultural youth in Canada that we named the “Bicultural Youth Acculturation Questionnaire.” The questionnaire was shown to have good internal consistency (Cronbach’s alphas > .75). It also showed convergent validity, with mean “dominant domain” score increasing with higher immigrant generation (1st generation: 3.69 (95% CI: 3.49, 3.89), 2nd: 4.13 (4.00, 4.26), 3rd: 4.40 (4.19, 4.61)). Mean dominant domain score did not differ by age at immigration with a mean score of 3.64 (3.34 - 3.95) for those who immigrated before age 12, and a mean score of 3.77 (3.55 - 3.98) for those who immigrated after age 12. On the other hand both heritage domains reported higher mean scores for those who immigrated after age 12, compared to those who immigrated below age 12. For example, mean heritage language score was 3.03 (2.70 - 3.35) for those who immigrated before age 12, compared to 3.97 (3.64 - 4.30) for those who immigrated after age 12. This study created a questionnaire that can be used to assess acculturation among youth who identify as having a dominant and heritage culture. Findings from this study suggest that generational status can be used as a proxy measure of adoption of dominant domain behaviours, as there was a noticeable and consistent increase in mean dominant domain score with increased immigrant generation. Meanwhile, our findings suggest that age at immigration can be used as a proxy for heritage domain retention, as youth who immigrated after age 12 reported higher mean heritage language and heritage domain scores. Finally, this study found that use of English language proficiency to gauge acculturation was not effective among youth, as almost all 152 respondents reported being comfortable with the English language. Therefore, English language ability could not be used as a way of separating youth into high vs low acculturated groups. Chapter 4: To examine the independent and joint effects of country of birth and ethnicity on body mass index This study examined the relationship between immigrant generation (Canadian-born vs foreignborn) and ethnic group (“Canadian dominant culture,” “Arab and West Asian,” “African,” “East Indian and South Asian,” “East and South East Asian,” “Latin American” and “Other”) on body mass index (BMI), both independently and together. This study found that foreign-born youth had lower mean BMI percentiles than youth born in Canada, and this was not modified by time since immigration. The findings by immigrant generation added to a growing body of research in Canada comparing immigrant youth to their Canadian-born peers.1,2 Contrary to the findings of previous Canadian research, no statistically significant relationship was observed between time since immigration and BMI.3 This may be because we were examining youth, while the previous study was of Canadian adults.3 Another finding of this study was that East and South East Asian youth had a lower mean BMI than Canadian dominant culture peers. The observed ethnic differences are consistent with previous research.1,2,4,5 What was most unique about this study were observed intra-ethnic differences based on immigrant generation. Foreign-born Arab/West Asian and East Indian/South Asian youth had lower BMIs than peers of the same ethnic group born in Canada, with differences in mean BMI percentile of -15 (95% CI: -22, -8) and -7 (95% CI: -13, -2) respectively. These findings stress the importance of considering both ethnicity and immigrant generation when evaluating the potential effects of acculturation on child health outcomes. 153 Chapter 5: To investigate differences in moderate-to-vigorous physical activity (MVPA) levels between immigrant youth and their Canadian-born peers, and if the relationship is modified by ethnicity This study examined the relationship between time since immigration and ethnic group with physical activity, measured by the number of days per week of at least 60 minutes of MVPA. The independent and joint effects of the two exposures were examined as predictors of the outcome. This study found that youth who immigrated within the last 1-2 years were less likely to meet the physical activity guidelines of 7 days a week of at least 60 minutes of MVPA (OR 0.62, 95% CI: 0.43, 0.89) compared to peers born in Canada. They were also less likely to obtain 4 – 6 days per week of at least 60 minutes of MVPA (OR: 0.66, 95% CI: 0.53, 0.83). However, over time, physical activity increased to levels reported by youth born in Canada, with no significant differences observed between youth who immigrated more than six years previously and Canadian born peers (OR for 7 days per week: 0.82 (0.63, 1.05) and 4-6 days per week: 1.01 (0.86, 1.19)). This is consistent with the findings of research conducted with populations of Canadian adults.6 A second finding of this study was that East and South-East Asian youth were less likely to meet the physical activity guidelines (OR: 0.37 (0.29, 0.48)) than Canadian dominant culture peers, and this persisted regardless of time since immigration. These findings were similar to findings in other Canadian studies.7,8 Finally, this study found that tests of possible interactions between immigrant generation and ethnicity were generally negative, but do suggest that East and South East Asian youth have reduced physical activity levels irrespective of whether they were born in Canada or abroad, and the length for which they have resided in Canada. 154 Chapter 6: To examine changes in screen time over a two year period among young people in Canada by immigrant generation and ethnicity This study examined the relationship between immigrant generation and ethnic group on average levels of screen time at baseline. It then examined how average levels of screen time changed after two years of follow-up. Immigrant generation was categorized into three groups (1st, 2nd, and 3rd generation), while youth were placed into one of six racial and ethnic groups (“White,” “Aboriginal,” “East and South East Asian,” “East Indian and South Asian,” “Black,” and “Other”). This study found that screen time increased in all groups over the two year follow-up period, with an average increase of 0.36 (95% CI: 0.31, 0.40) hours/day. The unique finding of this study was that 1st generation immigrants reported larger increase in screen time (+1.05 (+0.70, +1.41) hours/day). This increase was enough that the low levels of screen time observed among 1st generation immigrants at baseline increased enough within the follow-up period, to be consistent with 3rd generation peers at follow up (2.37 (2.05, 2.69) vs. 2.58 (2.53, 2.62) hours/day). A second unique finding of this study was that no differences in screen time were observed by ethnic group, contrary to the findings of previous research.9,10 However, previous research was primarily performed in the US, using populations of interest to US public health researchers, i.e., the non-Hispanic Black and Hispanic populations.9–11 Especially in the US, the history of these groups has perhaps led to stronger relationships between race and ethnicity as determinants of health, which may not be comparable to the Canadian context.12,13 155 7.3 Strengths of the thesis 7.3.1 Strengths of the methodologic manuscript Chapter 3 resulted in the creation of a new questionnaire that adapted existing questions and items into what we call “The Bicultural Youth Acculturation Questionnaire.” I followed a rigorous development process during this process. This included a literature review, followed by a Delphi process used in order to identify items important to the measurement of acculturation.14,15 The panelists involved in the Delphi process included both experts in acculturation as well as youth who identified as being both Canadian and of another culture, i.e., the target population. Thus, the questionnaire has content validity for core acculturation concepts. Finally, this study was pilot tested using a sample from across Canada, and the findings indicate that it may have broad applicability. 7.3.2 Strengths of the etiologic manuscripts The etiologic analyses were novel. All three studies used large, population-based data sets. Previous research in this field has typically focused on specific ethnic groups, or taken place in specific cities within Canada, although some national studies of Canadian youth do exist.1,5,9,10,16– 18 As a result, our findings should be applicable to the Canadian population of young people as a whole, and have external validity with respect to the relations of interest. A wide range of important covariates were controlled for in our analysis, thus minimizing the impact of these variables in distorting the relations of interest. In addition, Chapters 4 and 5 investigated potential interactions between ethnicity and immigrant generation/time since immigration respectively on BMI and physical activity, which yielded novel findings. Such findings highlighted important differences in the potential acculturative process by ethnic groups. The multi-level analyses used for these data allowed for area-level 156 covariates to be considered as potential determinants of the health outcome and both manuscripts controlled for salient covariates.19 Finally, a unique strength of Chapter 6 was that it was a longitudinal study, which allowed for an examination of changes in screen time over a two year period of follow-up. This led to the observation that rapid and statistically significant increases in screen time mitigated any baseline differences observed by immigrant generation. 7.4 Limitations of the thesis 7.4.1 Information bias and measurement error Information bias typically results from flawed measurement, i.e., inaccuracy, or imprecise collection of a variable in an etiological or experimental study, and it can be either differential or non-differential in nature.20 Measurement error is a specific kind of information bias that refers to inaccurate measurement or classification of subjects on a variable.20 Each of the three outcomes (physical activity, BMI, and screen time), may have been subject to differential information bias by ethnic group or immigrant generation. While the measures have been developed using diverse samples, it is unknown whether there are differences in accuracy between groups.21–23 There may be measurement error present for the exposures of interest (immigrant generation, and time since immigration) in Chapters 4 and 5. While we would suspect that youth aged 10-16 could remember whether they were born in Canada or not with good accuracy, and whether they moved to Canada within the last 1-2, 3-5 or 6+ years, this is speculative. It is possible that youth would be more likely to identify as being born in Canada, even if they were not, and so this may 157 bias our results towards no association as this would make the foreign-born and Canadian-born groups more similar. We suspect that this would be less of a concern for Chapter 6, as for the NLSCY study, parents were asked these questions. However, there is still the chance that this could be misreported, even by parents. Generally speaking, physical activity may be subject to measurement error. Since this is a selfreport measure, social desirability is a concern, where youth report they participate in healthy behaviours (or higher levels of healthy behaviours), even when they do not.20 While this selfreport measure does have high sensitivity (71%), i.e., it can correctly identify those who obtain 7 days/week of physical activity with good accuracy, the specificity is lower (40%), and thus it may incorrectly classify those who do not meet the requirements as meeting the requirements.21 Thus, the prevalence estimates for physical activity would be overestimated, i.e., fewer youth actually met the physical activity requirements than were reported to, this would bias our etiologic relationships towards no difference. Body mass index is often collected through self-reports of height and weight, due to feasibility and ethical concerns. On average, youth will over-report height and under-report weight, resulting in lower BMI values than the truth.24 This is similar to that seen among adults, as shown by a systematic review of studies of those aged 18 and older.25 Measurement error is therefore present and a concern for our study. The third outcome of interest was screen time. Measurement error may take two forms for this manuscript. The question used asked “On average, about how many hours a day do you watch TV or videos, or play video games?”26 These self-report questions have been validated against detailed logs of how youth were spending their time, with moderate correlations (r = 0.5).22,23 158 Thus, measurement error is a concern for this outcome. In addition, recently there have been changes in the way that youth consume media, and with multiple screens being used simultaneously, e.g., watching television while also using a phone and tablet. These questions would not have been able to discern these changes, and indeed, there is a need for adaptations of existing measures to capture how youth are now obtaining their screen time. However, all youth would be subject to the same underlying issue of a measure of screen time that may need to be updated, and we believe that it is unlikely that this would impact any one group more than another. For a discussion on how this measure could be updated see Section 7.8: Directions for future research. 7.4.2 Confounding Confounding can take two forms that can become limitations to a study: residual confounding and uncontrolled confounding. Residual confounding can result from the improper categorization of continuous variables.20 In this situation, there may still be differences within each of these categories. For example, if age was collected as a continuous variable, it can be collapsed into 10 year age groupings. If an age group encompasses those aged 20-30, there may still be important differences between a 21 year old and a 29 year old, both of whom would be in the same group. One form of residual confounding that may impact our studies was how race and ethnic group were collected. A group such as “South Asian” may not be homogeneous, with disparate cultural, health, and religious beliefs within this group that may manifest in different health behaviours and outcomes. However, it is anticipated that these within-group differences, i.e., between Pakistani and Indian youth (both of whom would identify as South Asian), would be smaller than between group differences, i.e., differences between South Asian and East and Black youth. There may also be residual confounding in the way that covariates were collected. In all three 159 etiologic manuscripts, all variables were collected through self-report and categorized using either quantiles, i.e., tertiles or quartiles, or by using pre-determined cut-points. This may also introduce residual confounding. This was a limitation in how these data were collected, and the original questions used (See Appendix B: Relevant HBSC Items and Appendix C: Relevant NLSCY items for the original questions used). Uncontrolled confounding refers to variables that might influence the findings, but was not collected by the study investigators. As the etiologic analyses were secondary analyses of existing data, only those variables collected by past surveys could be used for analysis. Thus, they share some common limitations relating to uncontrolled confounding. Parental country of birth is a main source of uncontrolled confounding as this was unknown for Chapters 4 and 5. Thus, immigrant generation was used synonymously with country of birth, i.e., “Canadian-born” vs “foreign-born.” However, children of recent immigrants may have different health behaviours than those who have parents born in Canada, such as lower participation in organized sports.27 Thus, there may be different relationships between born in Canada to parents born abroad (i.e., second generation), and those with parents born in Canada (i.e., third generation), which could not be explored in Chapters 4 or 5. 7.4.3 Selection bias Selection bias can occur when there are systematic differences in how exposed and unexposed individuals are recruited or participate in a study. This can result in the distortion of the focal relationship between the exposure and outcome, as a result of the relationship being influenced by the factors influencing participation, as well as the exposure of interest. Selection bias is a concern for Chapters 3 and 6. Chapters 4 and 5 used the same source survey (the HBSC). This is a general health survey of youth, and not specific to my study questions. Thus, participants would 160 not have known this when they were deciding whether or not to participate in the study. In addition, due to the sampling approach and high response rates reported in Chapters 4 and 5 (~ 77%), it is less likely that selection bias will be a concern for these manuscripts. Chapter 3: To develop and validate a short, self-reported questionnaire that can be used to assess acculturation in population studies of youth For Chapter 3 specifically, selection bias may be a concern. This study used a convenience sample of 18-25 year old youth, and while it demonstrated validity and reliability in this population, there may be selection forces present. Generally speaking, those who responded to the survey needed to have internet access, be part of “Survey Monkey Audience,” be able to read English, and have time to respond. These individuals also may identify more strongly with Canadian society and their dominant culture than individual who are not part of the Survey Monkey Audience or who were part of the audience and chose not to participate, and thus be motivated to respond to a questionnaire on acculturation and provide different responses than the target population. The likely result of this would be higher scores on each of the three identified domains. Chapter 6: To examine changes in screen time over a two year period among young people in Canada by immigrant generation and ethnicity For Chapter 6, selection bias may manifest from differential loss to follow-up over time. If immigrant or ethnic minority youth are more likely to watch move television than peers, and if they are also more likely to drop out, then this may distort the relationship of interest (or vice versa). However, the NLSCY uses weights that account for loss to follow up, minimizing this concern. 161 7.4.4 External validity and generalizability External validity refers to the extent to which the results of a study can be generalized to other situations and populations. These are of particular concern for Chapters 3 and 6. Chapters 4 and 5 used proportional weights to obtain a representative sample of all youth in Grades 6 through 10 in participating provinces and territories, thus external validity and generalizability is less of a concern for these two manuscripts. Chapter 3: To develop and validate a short, self-reported questionnaire that can be used to assess acculturation in population studies of youth For Chapter 3, the pilot testing process used a convenience sample of young people aged 18-25, recruited using Survey Monkey Audience, an online panel.28 Since these individuals are a sample who have self-selected to be included in this database, they are likely not representative of the population of immigrant youth to Canada. A second concern with the sample was the age chosen. The recruitment strategy chosen (an online panel) meant that youth could only be as young as 18, as the vendor chosen could not sample from younger children and adolescents. As a result, while the questionnaire was developed with younger children in mind (10-16 years old), it is unknown whether the factor structure and findings apply to this age group. Chapter 6: To examine changes in screen time over a two year period among young people in Canada by immigrant generation and ethnicity The original sample was drawn from the 1994 Labour Force Survey sample of respondent households. If there have been demographic shifts in the population, these prevalence estimates may no longer be accurate. However, the sample weights calculated by Statistics Canada researchers weight the sample so that the sample in Cycle 8 generalizes to the 2008/09 Canadian population.29 162 7.4.5 Causation The Bradford-Hill criteria for causation are often used in epidemiologic studies to determine causality, and can be applied to the three etiologic manuscripts. Five of these criteria are not appropriate for our research questions, due to the nature of the variables under study. The exposures of interest (immigrant generation, time since immigration and racial/ethnic identity) are fixed and unique, and “analogy,” i.e., is the claim supported by similar associations, and “experiment” i.e., are there any clinical studies to support the evidence, are inappropriate criteria by which to evaluate causation in this context.30 Similarly, the nature of the underlying biopsychosocial framework means that other criteria (i.e., “specificity,” and “strength”) cannot be used as there are several determinants of the health outcome, and this is not a 1:1 relationship. While these studies have attempted to minimize the impact of other determinants of these health outcomes analytically, there may still be uncontrolled confounding. In addition, the strength of these associations will be relatively small, due to other factors that may also drive this relationship. One could make the argument that increased immigrant generation and/or time since immigration could be used to establish a “biological gradient,” with higher immigrant generation and longer time since immigration associated with an increased “dose.” However, there are other factors that may also be associated with increased immigrant generation and time since immigration, and thus the utility of these criteria as measures of “biological gradient” in the traditional sense is tenuous. Of the nine criteria, “plausibility,” “temporality,” “consistency” and “coherence” are relevant to this thesis. 7.4.5.1 Plausibility The criteria of “plausibility,” which states that there must be a mechanism or theoretical framework that could explain the proposed relationships, is supported through previous literature and studies examining the relationship between ethnicity, immigrant generation and time since 163 immigration as predictors of these health outcomes. For example, ethnic differences in sleep and smoking could help explain differences observed by race and ethnic group for obesity, while involvement in organized sport may explain differences in physical activity levels.27,31 While more research is required into the precise mechanism by which these changes occur, there is a theoretical explanation for why these relationships may exist. 7.4.5.2 Temporality A common limitation of cross-sectional studies relates to temporality, as the investigator does not know if the (presumed) exposure came before the outcome under study. Both Chapters 4 and 5 were cross-sectional, and thus an inability to establish a temporal sequence may be considered a limitation of these studies. However, it must be noted that these studies conceptualized immigration in two ways: country of birth and time since immigration. For country of birth, temporality was not a concern as this is a fixed characteristic and thus will always precede the health outcome. On the other hand, time since immigration was used as a proxy measure of the impact of longer time in Canada, and thus a proxy measure of temporality. While this is an imperfect measure and, ideally, individual youth would be followed to determine changes over time, this does provide evidence for a temporal relationship between time since immigration and physical activity. 7.4.5.3 Consistency and coherence “Consistency” of findings asks whether the same results have been observed among different populations using different designs, while “coherence” is whether the association fits within current theory and knowledge. For the BMI and physical activity manuscripts (Chapters 4 and 5), this was the case. For Chapter 4, our observed relationship between immigrant generation and BMI was consistent with previous research in the US and Canada, as were the observed 164 differences between ethnic groups.1,2,4,5,18,32 However, we also found that BMI was not associated with time since immigration, contradicting previous research.3,33 For Chapter 5, the observed relationships between immigrant generation and time since immigration as predictors of physical activity mirror those reported among Canadian youth,7,8 Canadian adults,6 American adults,10 American youth,34,35 and Swedish youth.36 Finally, for screen time (Chapter 6), we reported that 1st generation youth reported lower levels of screen time than their 2nd and 3rd generation peers, similar to previous studies. 37 However, this study found no differences by ethnic group, which contradicts previous research performed in the US and England, which also have very different ethnic mixes in their populations.9,10,38 Thus, the etiologic manuscripts add to an existing body of research and suggests that the immigrant generation relationships are consistent between countries, but findings surrounding the ethnicity-health behavior/outcome relationships may be more country-specific. 7.4.6 Sample size and power Sample size was a concern in the development of the questionnaire as part of Chapter 3. Due to the small number of youth sampled, there was an inability to perform confirmatory factor analysis with this sample. Methods such as the “split-half” method propose that data be divided into two samples: a training set and a test set. With this method, data are divided a priori, and one sample used to develop a factor structure that is subsequently tested on the second sample. This is to avoid performing confirmatory factor analysis on the same sample that was used to develop the factor structure. The lack of a large enough sample meant that stable estimates of psychometrics, such as fit indices, could not be calculated using the split-half method. In order to perform confirmatory factor analysis on a separate sample to that used to develop the original factor structure, approximately 320 additional participants would be required, almost a doubling of the obtained sample.39–42 165 Power refers to the ability of a test to reject the null hypothesis when it is false and is commonly a result of small sample size. This could manifest in two ways for the etiologic manuscripts, for the main effects and for the interactions. For the main effects of interest, i.e., relationships between ethnicity and (independently) immigrant generation and time since immigration, as predictors of the health outcomes, the manuscripts were sufficiently powered to detect odds ratios of 1.4 or greater (See Appendix E: Power Calculations). Power and sample size limitations had ramifications for the exploration of interactions between ethnicity and immigrant generation/time since immigration. This impacted the manuscripts to different degrees. While the interaction between ethnicity and time since immigration could be explored for physical activity outcomes (Chapter 5), “time since immigration” had to be collapsed to “1st generation immigrant” for BMI (Chapter 4), due to smaller cell sizes within more refined categories of time since immigration. Meanwhile, for Chapter 6, no interactions could be explored due to insufficient sample sizes within each racial and ethnic group by immigrant generation. Given the finding that ethnicity and immigrant generation have important joint effects in Chapters 4 and 5, this is an important limitation of Chapter 6. 7.5 Changes from original thesis proposal Chapter 3: Development and validation of the Bicultural Youth Acculturation Questionnaire For Chapter 3, the split-half approach to scale validation was not performed due to an insufficient sample size, and so confirmatory factor analysis could not be conducted. In addition, the original proposed sample was of Queen’s University undergraduate students who are members of cultural and religious groups, as defined by the Alma Mater Society (student government). However, the sample proposed originally had several limitations. First, the sample of students coming to Queen’s University is very unlikely to be representative of the immigrant youth population in Canada. Queen’s University may also attract different students as compared to other universities 166 based on location, available financial aid, or programs offered, which may result in a further biased sample. To mitigate these concerns, Survey Monkey Audience was used. This sampled from youth aged 18-25 from across Canada, and thus it was believed that the sample would be more representative of youth within this age group although this sample does have limitations (see Section 7.4.4: External Validity and Generalizability). Chapter 4: The influence of country of birth and ethnicity on BMI among Canadian youth: A national survey Chapter 4 was not included in the original proposal, and was added as a separate study to the thesis document. This manuscript added depth and complexity to the thesis. The inclusion of this manuscript meant that I had to familiarize myself with another body of literature (immigrant generation and race/ethnic group as determinants of BMI) in order to conduct this study. It also required the use of multi-level modelling with continuous outcomes, and the use of SAS macros developed by the World Health Organization in order to create age-and-sex-specific BMI zscores.43 Finally, it required that the manuscript be written and submitted for publication.44 Chapter 5: Time since immigration and ethnicity as predictors of physical activity among Canadian youth: A cross-sectional study This chapter originally proposed using ordinal multi-level modelling to model the association between immigrant generation/ethnicity with days of physical activity. Using ordinal regression, this study would compare, first, 0-3 days/week to 4-6 days/week of physical activity, and second, 0-3 days/week and 4-6 days/week with 7 days/week. Ordinal regression relies on increases between categories, i.e., 0-3 days/week to 4-6 days/week to 7 days/week, to be proportionally the same (the proportional odds assumption).45 When these data were modelled, this assumption was not met. Thus, proportional odds ratios could not be used. 167 In addition, the comparison category of “0-6 days/week” was not appropriate given our objectives. One objective of this study was to determine if certain groups were more likely to be meeting the physical activity guidelines, i.e., 7 days/week of 60 minutes or more of physical activity, and if some groups were likely to get some physical activity, but not meet the guidelines, i.e., 4-6 days/week of physical activity. Thus, there had to be three outcome categories. Nominal regression modelling provided two odds ratios corresponding to 1) low (0 – 3 days/week) vs medium (4 – 6 days/week) and 2) low (0 – 3 days/week) vs high (7 days/week). Therefore nominal multi-level regression modelling was used for this manuscript. Chapter 6: The effects of immigrant generation and ethnicity on screen time among young Canadians: A two year longitudinal study Two changes were made to Chapter 6: the outcome of interest and the proposed modelling strategy. Both of these were a consequence of the way data were collected for the NLSCY. The original proposed manuscript planned to use growth curve modelling to investigate changes in the odds of participation in organized sport over 8 cycles of the NLSCY collected at two-year intervals, i.e., 16 years of follow up. However, this was because I thought, based on the documentation that was available to me at the time, that the same questions would be asked of all respondents for every cycle of the NLSCY. Thus there would be 8 cycles of follow up data on each respondent, tracking their screen time over a 16 year period. However, once these data were accessed and I had full access to all of the documentation, it was found that the questions on organized sport involvement were only asked of youth aged 10-13, and thus there was very little follow-up data available for this outcome. As a result, the outcome and analytic strategy both had to be changed. 168 Screen time was chosen as an alternative outcome as it fit thematically with the other outcomes of BMI and physical activity. Excess screen time has also been shown to be associated with increased BMI, and sedentary behaviour is distinct from physical activity.46–48 Thus, it fit within the broader theme of this thesis.48,49 In addition, the questions about screen time were asked of youth aged 10-15 in each cycle, which meant that while growth curve modelling could not be performed as there were only 2 cycles of data. Changes over a 2 year follow-up period could be examined, thus providing an opportunity to use a longitudinal study design within my thesis. 7.6 Public health contributions The methodologic manuscript provides a quick, self-report measure of acculturation that can help disentangle the mechanism underlying changes in health following immigration. In addition, Chapter 3 supports the use of proxy measures of acculturation, such as immigrant generation and time since immigration, but notes that there is considerable heterogeneity within these groups. The question remains as to whether there is a cultural explanation for these differences, or an issue related to immigration itself.50 The findings of the etiologic manuscripts fit within the Population Health Approach used by the Public Health Agency of Canada. In Chapter 4 and 5, both individual and community level covariates were controlled for in the analyses, and thus the association that remained was the main effect of the exposures of interest on the specific outcomes. For public health professionals, our findings provide evidence for the importance of ethnicity and immigrant generation as potential determinants of BMI, physical activity, and screen time. Further research can examine the role of the environment as a potential mediator of the observed relationships, and if important differences emerge by the exposure groups of interest. Existing randomized trials aimed at increasing physical activity and reducing obesity among youth suggest that such interventions 169 will be more successful if a homogeneous target group is selected. Our findings suggest that these interventions may require further tailoring by ethnicity and/or immigrant generation to be successful.51–54 For example, the findings of Chapter 4, that certain ethnic groups (Arab and West Asian, East Indian and South Asian), have significantly different mean BMI levels depending on whether they were born in Canada or not, suggests the need for applied public health research examining the specific determinants of BMI in such focused populations and determining what differs between those born in Canada and those born abroad. 7.7 Methodological contributions This thesis resulted in the creation of a short questionnaire that can measure acculturation among youth. This measure can be used by future research to help elucidate the mechanism behind specific health outcomes. It also provides justification for the use of immigrant generation or age at immigration as a proxy measure of acculturation.55–57 The etiologic manuscripts report on the relationship between immigrant generation, ethnicity and health outcomes among national samples of Canadian youth. Previous studies in Canada have typically been of adults, or of youth in specific cities or regions, although two national studies of youth have been performed.1,5,9,10,16–18 In particular, Chapters 4 and 5 highlight the importance of considering immigrant generation and ethnicity individually and together when examining health outcomes. If researchers have a large enough sample, our findings suggest that stratifying by ethnicity or creating interaction terms may result in novel findings that would be obscured by treating ethnic and racial groups as homogenous. 170 7.8 Directions for future research The methodologic manuscript (Chapter 3), and the etiologic manuscripts (Chapters 4-6), suggest the need for two future research studies. In addition, Chapter 6 points to the need for a third study aimed at measuring screen time among youth. These three studies are outlined below. 7.8.1 Future methodological research – Further testing of the Bicultural Youth Acculturation Questionnaire To further establish the reliability and validity of the Bicultural Youth Acculturation Questionnaire, as well as its generalizability, further testing is needed among both marginalized populations and younger, school-based, youth. Generalizability of the sample is a concern for two reasons. First, the sample was of youth aged 18-25, and the questionnaire was developed for youth aged 11-15 years. Second, marginalized youth may have been less likely to respond to the survey, and thus it is unknown whether this questionnaire can be used among this population. Future studies could build on our work by purposefully sampling school-aged youth, and separately, marginalized populations, to determine if the psychometric properties of the questionnaire are consistent in these populations and if the same questions remain important to the measurement of acculturation as in Chapter 3. To recruit marginalized populations who may not be captured by these methods, respondentdriven sampling, an extension of snowball sampling, could be used. This relies on youth nominating peers to participate in the study. This would identify youth at varying levels of acculturation and be able to capture the full spectrum of acculturative experiences. Once this sample has been identified and recruited, the questionnaire can then be pilot tested to determine its psychometric properties and whether the factor loading remains the same. This will ensure the 171 questionnaire can provide a quick and valid measure of acculturation that can be incorporated into future national health surveys of youth. 7.8.2 Future etiologic research – Cohort study of health outcomes among immigrants There were three important limitations of the etiologic manuscripts that could be addressed in a comprehensive future study. These are: 1) causality, due to the inability to establish temporality in the cross-sectional manuscripts; 2) uncontrolled confounding, because of the lack of information on potential confounders of the immigrant generation/race and ethnic group – health outcome (i.e., physical activity, BMI, screen time) relationship, and; 3) measurement error due to all measures of the outcome variables of interest being obtained via self-report. These three concerns can be addressed through a cohort study of both parents and children examining the first five years post-immigration. A cohort study would allow for an analysis of changes in behaviours and outcomes over time, addressing concerns about causality. A five-year follow-up period is proposed as my findings suggest that important health changes occur within the first five years post immigration, and are at the levels of Canadian-born peers within 3-5 years. To address uncontrolled confounding, this study would survey parents and children. By surveying parents, parental country of birth could be obtained, and thus children could be categorized as first, second, or third or higher generation. In addition, by measuring parental knowledge, attitudes and/or behaviours, the mechanism underlying these changes in health could be determined. It remains unknown whether differences in physical activity levels, for example, are a result of lower involvement in organized sports, economic barriers, or because of cultural value structures, where physical activity is not deemed “important” by parents.6,58,59 This would help explore the mechanisms by which ethnicity and immigration impact health behaviours, which can be used when designing interventions for these 172 groups. Finally, the ideal study would include objective measures of height, weight, physical activity and screen time, in order to minimize measurement error. This proposed cohort study would provide valid, clear, and actionable information on which public health interventions and policies could be developed, and subsequently evaluated. This approach could also be complemented by the use of qualitative methodologies such as focus groups in order to understand the mechanisms by which these changes occur, and the role of culture and ethnicity in these health changes. This would address limitations inherent in a purely qualitative approach to acculturation. 7.8.3 Future methodological research - Measurement of screen time among youth A specific area for future research that emerged from our interpretation of the findings from Chapter 6 surrounds the assessment of screen time. Youth are now acquiring screen time differently, through multiple media sources (often simultaneously), and this requires further study to reduce measurement error. Self-report items need to be created that can measure multiple forms of screen time accurately. Research is required to determine how best to quantify these different forms of screen time, i.e., does each hour of screen time count as one hour, regardless of the number of screens being used, or is there an additive effect with more screens being used simultaneously, i.e., a measure such as “screen-hours” would be more accurate where using a laptop and watching TV simultaneously for one hour would yield two “screen-hours.” This study would also need to determine if asking in hourly increments is the best way to obtain information about screen time to reduce the potential for residual confounding. While this is useful for television shows or movies, where they have a defined start and end point, screens such as cellphones, might be used for 20-30 seconds at a time, but intermittently, over several hours. 173 Updating this measure to be consistent with contemporary screen time behaviours would address concerns about measurement error currently present in this item. 7.9 Suitability as a doctoral thesis in Epidemiology This thesis meets the criteria for a doctoral thesis in Epidemiology through the completion of methodologic and etiologic objectives, as well as through administrative responsibilities and knowledge translation activities. 7.9.1 Methodologic objectives The methodologic objective required that I lead a project to develop a questionnaire to measure acculturation in young people. This required conceptualizing the project, conducting a literature review, extracting relevant items from existing questionnaires, coordinating the Delphi process to identify important items, identifying and conducting a feasible pilot testing strategy, and analyzing the final data to determine the psychometric properties of the instrument. This required learning a new method (the Delphi process), which was uniquely positioned to efficiently identify important items and minimize bias associated with obtaining group consensus.14,15,60 To ensure this was performed to a high standard and using appropriate techniques, an advisor familiar with the Delphi process was sought (Dr. Ian Pike). I then had to identify and recruit scientific experts and university-aged youth, and manage their conflicting and busy timelines to complete this section of the project in a timely manner. Finally, I had to select an appropriate pilot testing sample that was 1) feasible to recruit, and 2) racially and ethnically diverse. This required exploring several options, as well as liaising with potential vendors to determine the strengths and limitations of each approach. Finally, these data had to be analyzed using factor analysis, and decision rules regarding which variables to retain in the final questionnaire determined. 174 7.9.2 Etiologic Objectives The etiologic analyses required using advanced statistical methods to test hypotheses identified through a review of prior literature. This included multi-level modelling for different outcome types, as well as using macros and weights to ensure the results were generalizable to the Canadian population. Epidemiologic methods were used to minimize bias, confounding, as well as to explore effect modification in order to quantify effects with validity and precision. The use of Statistics Canada data for Manuscript 4 required the use of sample weights, designed by Statistics Canada researchers, in order to generalize these findings to the Canadian population, as well as the challenge of accessing data within the Queen’s University Research Data Centre (RDC). This study also required learning Statistics Canada processes both for importing SAS syntax, merging and cleaning large datasets, as well as procedures and policies for reporting results obtained from the RDC. Analyses were performed using SAS v9.3 and v9.4 (SAS Institute, Cary, NC), or IBM SPSS Statistics v20 (IBM Corporation, Armonk, NY). 7.9.3 Model building assumptions As part of the model building process in Chapter 4, the assumptions for linear models had to be considered. These assumptions are independence, normality, homoscedasticity. The observations were not truly independent, as it was theorized that observations within a school would be more similar than those between schools, i.e., students within the same school would share similar health behaviours and attitudes. Thus, multi-level models were used to account for clustering of these data at the school level. The intra-class correlations accounted for less than 5% of the variation in both Chapters 4 and 5, indicating clustering was present, albeit to a small degree. For the second assumption, the distribution of residuals was examined and found to be normally distributed using QQ plots and univariate statistics. Influence statistics were also calculated, and found to be within appropriate limits (all DFFITS < 0.30, and all Cook’s D values < 0.008).61 175 Finally, the variation in the residuals was examined over the range of predicted response values, and was found to be constant, satisfying the assumption of constant variance (homoscedasticity) (see Appendix B: Distribution of residuals). 7.9.4 Use of sample weights Sample weights were used in Chapters 4-6. Weights are used when the sample is not a truly random sample from the population, and thus individuals may be over- or under-represented in the sample. For the HBSC manuscripts, each grade was given a weight (by province and territory). This was done to ensure that the responses were weighted proportional to the national grade group population (Appendix B). For the NLSCY manuscript, the weights used were for those who responded to Cycle 8 and at least one other cycle to account for the sampling procedure, and loss to follow up (Appendix C).29 In both cases, weights are used to ensure that means and percentages approximate population estimates. The SAS statement “weight” uses these weights to calculate mean values for each group.62,63 However, it should be noted that for the calculation of degrees of freedom, unweighted values are used.63 Thus, even though the weighted values in Chapter 6 total almost three million observations, only the 7,107 responses are used for the calculation of confidence intervals, with the variance proportional to the weight of each observation. This results in confidence intervals of appropriate width. Note that while it is possible that the use of weights is associated with a decrease in statistical efficiency, especially when individual-level error terms are clustered within a group, given the small amount of clustering present in these data (ICC’s < 5%), this loss of efficiency is not a concern in these analyses.64 176 7.9.5 Administrative responsibilities Through a critical review and synthesis of the available literature, I gained an understanding of the field and the current state of research in the area of acculturation. This allowed me to develop, design, and conduct the four novel studies that comprise this thesis document. I was responsible for the administrative responsibilities underlying all manuscripts, which included applying and coordinating ethics applications to boards within Queen’s University (all manuscripts), and Statistics Canada (Chapter 6) (See Appendix A: Project Approvals). In addition, I identified and conducted all analyses, and led the writing and submission of all manuscripts, two of which are already published.44,65 These manuscripts contribute to the understanding of the health of immigrant youth to Canada, and provide useful information for both researchers and public health professionals. 7.9.6 Knowledge translation To disseminate study findings, I conducted several knowledge translation activities. These included presentations at departmental seminars (Queen’s University Public Health Sciences Seminar Series, 2013) and national conferences (Canadian Obesity Summit 2013, Vancouver, BC; Canadian Public Health Association 2013, Ottawa, ON; Canadian Public Health Association 2014, Toronto, ON). In addition, with assistance from the Queen’s University Communications Office, press releases were drafted for both published studies to be released on the Queen’s University and CMAJ OPEN websites. This resulted in interviews with newspapers (The Toronto Star,66 Kingston Whig-Standard,67), radio (AM 980 CKNW Vancouver,68), and local television stations (CKWS). I also presented my research at the Queen’s University Three Minute Thesis competition. 177 7.10 Conclusions This thesis involved creation of a questionnaire that can measure acculturation among youth and highlights specific aspects of validity associated with common proxy measures of acculturation. It also provides important insight into the health of young immigrant Canadians, as it relates to obesity, physical activity and screen time. Relationships were demonstrated between immigrant generation and ethnicity as determinants of health outcomes, and novel analyses explored the interaction between these two variables on BMI and physical activity. Understanding the role of these two important predictors of health among youth can help mitigate adverse health outcomes before they manifest. There is a need for further study however, in order to determine the validity of the questionnaire in other populations, as well as to understand the mechanisms behind the health outcomes observed. 178 7.11 References 1. Quon, E. C., McGrath, J. J. & Roy-Gagnon, M.-H. M.-H. Generation of immigration and body mass index in Canadian youth. J. Pediatr. Psychol. 37, 1–11 (2012). 2. O’Loughlin, J., Paradis, G., Renaud, L., Meshefedjian, G. & Gray-Donald, K. Prevalence and correlates of overweight among elementary schoolchildren in multiethnic, low income, inner-city neighbourhoods in Montreal, Canada. Ann. Epidemiol. 8, 422–32 (1998). 3. Tremblay, M. S., Perez, C. E., Ardern, C. I., Bryan, S. N. & Katzmarzyk, P. T. Obesity, overweight and ethnicity. Heal. Reports 16, 23–34 (2005). 4. Singh, G. K., Kogan, M. D. & Yu, S. M. Disparities in obesity and overweight prevalence among US immigrant children and adolescents by generational status. J. Community Health 34, 271–81 (2009). 5. Maximova, K., O’Loughlin, J. & Gray-Donald, K. Healthy weight advantage lost in one generation among immigrant elementary schoolchildren in multi-ethnic, disadvantaged, inner-city neighborhoods in Montreal, Canada. Ann. Epidemiol. 21, 238–44 (2011). 6. Dogra, S., Meisner, B. A. & Ardern, C. I. Variation in mode of physical activity by ethnicity and time since immigration: a cross-sectional analysis. Int. J. Behav. Nutr. Phys. Act. 7, 75 (2010). 7. Tremblay, M. S., Bryan, S. N., Pérez, C. E., Ardern, C. I. & Katzmarzyk, P. T. Physical Activity and Immigrant Status: Evidence From the Canadian Community Health Survey. Can. J. Public Heal. 97, 277–282 (2006). 8. O’Loughlin, J., Paradis, G., Kishchuk, N., Barnett, T. & Renaud, L. Prevalence and correlates of physical activity behaviors among elementary schoolchildren in multiethnic, low income, inner-city neighborhoods in Montreal, Canada. Ann. Epidemiol. 9, 397–407 (1999). 9. Taverno, S. E., Rollins, B. Y. & Francis, L. A. Generation, language, body mass index, and activity patterns in Hispanic children. Am. J. Prev. Med. 38, 145–53 (2010). 10. Singh, G. K., Yu, S. M., Siahpush, M. & Kogan, M. D. High levels of physical inactivity and sedentary behaviors among US immigrant children and adolescents. Arch. Pediatr. Adolesc. Med. 162, 756–63 (2008). 11. Gordon-Larsen, P., Harris, K. M., Ward, D. S. & Popkin, B. M. Acculturation and overweight-related behaviors among Hispanic immigrants to the US: The National Longitudinal Study of Adolescent Health. Soc. Sci. Med. 57, 2023–2034 (2003). 12. US Census Bureau. Table 695. Money Income of Families - Number and Distribution by Race and Hispanic Origin: 2009. Stat. Abstr. United States 2012 at <http://www.census.gov/compendia/statab/2012/tables/12s0695.pdf> 179 13. Krieger, N. et al. 50-year trends in US socioeconomic inequalities in health: US-born Black and White Americans, 1959-2008. Int. J. Epidemiol. 1294–1313 (2014). doi:10.1093/ije/dyu047 14. Hsu, C. & Sandford, B. A. The Delphi Technique: Making Sense of Consensus. Pract. Assessment, Res. Eval. 12, (2007). 15. Dalkey, N. C. The Delphi method: An experimental study of group opinion. (1969). at <http://192.5.14.43/content/dam/rand/pubs/research_memoranda/2005/RM5888.pdf> 16. Renzaho, A. M. N., Swinburn, B. & Burns, C. Maintenance of traditional cultural orientation is associated with lower rates of obesity and sedentary behaviours among African migrant children to Australia. Int. J. Obes. 32, 594–600 (2008). 17. Balistreri, K. S. & Van Hook, J. Trajectories of overweight among US school children: a focus on social and economic characteristics. Matern. Child Health J. 15, 610–9 (2011). 18. Van Hook, J. & Baker, E. Big Boys and Little Girls: Gender, Acculturation, and Weight among Young Children of Immigrants. J. Health Soc. Behav. 51, 200–214 (2010). 19. Statistics Canada. 2006 Canadian Census of Population. (2006). at <http://www12.statcan.gc.ca/census-recensement/2006/index-eng.cfm> 20. Porta, M. A Dictionary of Epidemiology. (Oxford University Press, 2008). 21. Prochaska, J. J., Sallis, J. F. & Long, B. A physical activity screening measure for use with adolescents in primary care. Arch. Pediatr. Adolesc. Med. 155, 554–9 (2001). 22. Bryant, M. J., Lucove, J. C., Evenson, K. R. & Marshall, S. Measurement of television viewing in children and adolescents: a systematic review. Obes. Rev. 8, 197–209 (2007). 23. Schmitz, K., Harnack, L. & Fulton, J. Reliability and validity of a brief questionnaire to assess television viewing and computer use by middle school children. J. Sch. 74, 370– 377 (2004). 24. Brener, N., Mcmanus, T., Galuska, D., Lowry, R. & Wechsler, H. Reliability and validity of self-reported height and weight among high school students. J. Adolesc. Heal. 32, 281–287 (2003). 25. Connor Gorber, S., Tremblay, M., Moher, D. & Gorber, B. A comparison of direct vs. self-report measures for assessing height, weight and body mass index: a systematic review. Obes. Rev. 8, 307–26 (2007). 26. Statistics Canada. National Longitudinal Survey of Children: Overview of Survey Instruments for 1994-95 Data Collection Cycle 1. (1995). 27. Clark, W. Kids’ sports. Can. Soc. Trends (2008). 180 28. SurveyMonkey. Who is the SurveyMonkey Audience? (2014). at <http://help.surveymonkey.com/articles/en_US/kb/Who-is-the-SurveyMonkeyAudience> 29. Statistics Canada. Microdata User Guide: National Longitudinal Survey of Children and Youth - Cycle 8. at <http://www23.statcan.gc.ca/imdb-bmdi/document/4450_D4_T9_V8eng.pdf> 30. Kelsey, J. L., Whittemore, A. S., Evans, A. S. & Thompson, W. D. Methods in Observational Epidemiology. (Oxford University Press, 1996). 31. Keith, S. W. et al. Putative contributors to the secular increase in obesity: exploring the roads less traveled. Int. J. Obes. 30, 1585–94 (2006). 32. Liu, J., Probst, J. C., Harun, N., Bennett, K. J. & Torres, M. E. Acculturation, physical activity, and obesity among Hispanic adolescents. Ethn. Health 14, 509–25 (2009). 33. Roshania, R., Narayan, K. M. & Oza-Frank, R. Age at arrival and risk of obesity among US immigrants. Obesity 16, 2669–75 (2008). 34. Choi, J. W., Wilbur, J. E., Miller, A., Szalacha, L. & McAuley, E. Correlates of leisuretime physical activity in Korean immigrant women. West. J. Nurs. Res. 30, 620–638 (2008). 35. Daniel, M. & Wilbur, J. Physical activity among South Asian Indian immigrants: an integrative review. Public Health Nurs. 28, 389–401 (2011). 36. Kahlin, Y., Werner, S., Romild, U. & Alricsson, M. Self-related health, physical activity, BMI and musculoskeletal complaints: a comparison between foreign and Swedish high school students. Int. J. Adolesc. Med. Health 21, 327–41 (2009). 37. Labree, L. J. W., van de Mheen, H., Rutten, F. F. H. & Foets, M. Differences in overweight and obesity among children from migrant and native origin: a systematic review of the European literature. Obes. Rev. 12, e535–47 (2011). 38. Brodersen, N. H., Steptoe, A., Boniface, D. R. & Wardle, J. Trends in physical activity and sedentary behaviour in adolescence: ethnic and socioeconomic differences. Br. J. Sports Med. 41, 140–4 (2007). 39. Maccallum, R. C., Widaman, K. F., Zhang, S. & Hong, S. Sample Size in Factor Analysis. Psychol. Methods 4, 84–99 (1999). 40. Maccallum, R. C., Widaman, K. F., Preacher, K. J. & Hong, S. Sample Size in Factor Analysis : The Role of Model Error. Multivariate Behav. Res. 36, 611–637 (2001). 41. Preacher, K. J. & Maccallum, R. C. Exploratory Factor Analysis in Behavior Genetics Research: Factor Recovery with Small Sample Sizes. Behav. Genet. 32, 153–161 (2002). 181 42. Mundfrom, D. J., Shaw, D. G. & Ke, T. L. Minimum Sample Size Recommendations for Conducting Factor Analyses. Int. J. Test. 5, 159–168 (2009). 43. De Onis, M. et al. BMI-for-age (5 - 19 years). Bull. World Health Organ. 85, 660–7 (2007). 44. Kukaswadia, a., Pickett, W. & Janssen, I. Influence of country of birth and ethnicity on body mass index among Canadian youth: a national survey. C. Open 2, E145–E152 (2014). 45. Hedeker, D. Multilevel models for ordinal and nominal variables. Handb. multilevel Anal. 237–274 (Springer. New York, 2008). 46. Hume, C., Singh, A., Brug, J., Mechelen, W. Van & Chinapaw, M. Dose-response associations between screen time and overweight among youth. Int. J. Pediatr. Obes. 4, 61–4 (2009). 47. Mark, A. E. & Janssen, I. Relationship between screen time and metabolic syndrome in adolescents. J. Public Health (Bangkok). 30, 153–60 (2008). 48. Sedentary Behaviour Research Network. Letter to the Editor: Standardized use of the terms ‘sedentary’ and ‘sedentary behaviours’. Appl. Physiol. Nutr. Metab. 37, 540–542 (2012). 49. De Jong, E. et al. Association between TV viewing, computer use and overweight, determinants and competing activities of screen time in 4- to 13-year-old children. Int. J. Obes. (Lond). 37, 47–53 (2013). 50. McDonald, J. T. & Kennedy, S. Insights into the ‘healthy immigrant effect’: health status and health service use of immigrants to Canada. Soc. Sci. Med. 59, 1613–27 (2004). 51. Kriemler, S. et al. Effect of school-based interventions on physical activity and fitness in children and adolescents: a review of reviews and systematic update. Br. J. Sports Med. 45, 923–30 (2011). 52. Gentile, D. a et al. Evaluation of a multiple ecological level child obesity prevention program: Switch what you Do, View, and Chew. BMC Med. 7, 49 (2009). 53. Haerens, L., De Bourdeaudhuij, I., Maes, L., Cardon, G. & Deforche, B. School-based randomized controlled trial of a physical activity intervention among adolescents. J. Adolesc. Health 40, 258–65 (2007). 54. Simon, C. et al. Successful overweight prevention in adolescents by increasing physical activity: a 4-year randomized controlled intervention. Int. J. Obes. (Lond). 32, 1489–98 (2008). 55. Nordahl, H., Krølner, R., Páll, G., Currie, C. & Andersen, A. Measurement of ethnic background in cross-national school surveys: agreement between students’ and parents' responses. J. Adolesc. Health 49, 272–7 (2011). 182 56. Woloshin, S., Schwartz, L. & Katz, S. Is language a barrier to the use of preventive services? J. Gen. Intern. Med. 472–477 (1997). at <http://onlinelibrary.wiley.com/doi/10.1046/j.1525-1497.1997.00085.x/abstract> 57. Hunt, L. M., Schneider, S. & Comer, B. Should ‘acculturation’ be a variable in health research? A critical review of research on US Hispanics. Soc. Sci. Med. 59, 973–986 (2004). 58. Tortolero, S. R., Masse, L. C., Fulton, J. E., Torres, I. & Kohl III, H. W. Among Minority Women: Focus Group Results. Women’s Heal. Issues 9, 135–142 (1999). 59. Darling, N. Participation in Extracurricular Activities and Adolescent Adjustment: CrossSectional and Longitudinal Findings. J. Youth Adolesc. 34, 493–505 (2005). 60. Linstone, H. & Turoff, M. The Delphi method: Techniques and applications. Futur. Res. Methodol. (2002). at <http://is.njit.edu/pubs/delphibook/> 61. SAS Institute. Influence Statistics. SAS/STAT 9.2 User’s Guid. Second Ed. at <http://support.sas.com/documentation/cdl/en/statug/63033/HTML/default/viewer.htm#st atug_reg_sect040.htm> 62. SAS Institute. WEIGHT Statement. SAS/STAT 9.2 User’s Guid. Second Ed. at <http://support.sas.com/documentation/cdl/en/statug/63347/HTML/default/viewer.htm#st atug_freq_sect012.htm> 63. SAS Institute. The GLM Procedure: WEIGHT Statement. at <http://support.sas.com/documentation/cdl/en/statug/63347/HTML/default/viewer.htm#st atug_glm_sect025.htm> 64. Lee, J. Y. & Solon, G. The Fragility of Estimated Effects of Unilateral Divorce Laws on Divorce Rates. B. E. J. Econom. Anal. Policy 11, (2011). 65. Kukaswadia, A., Pickett, W. & Janssen, I. Time since immigration and ethnicity as predictors of physical activity among Canadian youth: a cross-sectional study. PLoS One 9, e89509 (2014). 66. The Toronto Star. BMI lower in kids born outside of Canada, study says. (2014). at <http://www.thestar.com/life/2014/08/19/bmi_lower_in_kids_born_outside_of_canada_s tudy_says.html> 67. The Kingston Whig-Standard. Study looks at immigrant youth. (2014). at <www.thewhig.com/2014/02/27/study-looks-at-immigrant-youth> 68. CKNW AM 980. The CKNW Morning News with Philip Till - February 27, 2014. at <http://www.cknw.com/2014/02/27/the-cknw-morning-news-with-philip-till-february27-2014/> 183 Project Approvals Chapter 3: EPID-444-13: Development of a questionnaire module to assess acculturation in a diverse sample of Canadian youth 184 Chapter 4: EPID-415-13 A cross-sectional analysis of immigrant status and its relation to obesity 185 Chapter 5: EPID-416-13 A cross-sectional analysis of immigrant status and its relation to physical activity 186 Chapter 6: EPID-440-13: The effect of immigrant generation and ethnicity on screen time among young Canadians: A two year longitudinal study 187 HBSC Survey Methodology Overview The Health Behaviour in School-Aged Children (HBSC) study is a cross-national survey that is conducted in collaboration with the World Health Organization (WHO) Regional Office for Europe. This survey is performed every four years in 44 countries and regions across Europe and North America. The HBSC study has been ongoing since 1982, with the first survey taking place in 1985/86, and collects data on the health and health-related behaviours of youth aged approximately 10-15 years through school-based self-report general health surveys. The survey covers multiple health-related domains, including bullying and fighting, obesity, physical activity, and the school environment (among others). Through the use of a common core set of items, used by all member countries, international comparisons can be made, and by successive survey cycles, trends can be examined at both the national and cross-national level. The International Coordinator of the 2009–2010 study is Candace Currie, St. Andrews University, Scotland and the Data Bank Manager is Oddrun Samdal, University of Bergen, Norway. The Canadian HBSC study (PI: John Freeman, William Pickett) was funded by the Public Health Agency of Canada, Health Canada, the Canadian Institutes of Health Research and the Heart and Stroke Foundation of Canada (MOP 97961; PCR 101415). Data collection was coordinated by the Social Program Evaluation Group at Queen’s University, under the organization and supervision of Matthew King. Sampling strategy The 2009/10 Canadian Health Behaviour in School Aged Children (HBSC) Survey sampled youth in grades 6-10 (approximately aged 10-15 years) from public and Catholic school boards in 188 consenting provinces. The sampling frame included all students in Canada with the exception of those in Prince Edward Island, New Brunswick, private schools and attending a school on a First Nations reserve. In addition, those who were not present on the day of survey administration due to truancy or illness, who are home-schooled, or those who are incarcerated, would not be captured by this survey. In Nunavut, the Northwest Territories and the Yukon, all students in Grades 6 through 10 were invited to participate. This is therefore a census of students in this age range in these three territories. In the remaining provinces, schools were ordered according to school jurisdiction, language of instruction, public/Catholic designation, community size and location within a province. From this list, schools are proportionally distributed based on these characteristics. From each selected school, one or two classes were randomly selected by the school administrator to participate in the survey although for some smaller schools, all youth were sampled. If a school refused to participate, a replacement school was chosen that was matched on the criteria above. Questionnaire description The HBSC survey was developed by the international HBSC network, with the questionnaire and protocol ratified at semi-annual meetings of the research network. The Canadian HBSC survey consists of three sets of items. The first are mandatory items used by all participating countries, to allow for cross-national comparisons. Second, the HBSC network has optional packages that can be used by researchers that are consistent throughout the HBSC network. Thus, international comparisons can be made between countries that choose to include these items. Finally, there are items developed specifically for the Canadian survey. The latter two sets of items were decided 189 on based on the interests of the HBSC Canada research team, input from staff at the Public Health Agency of Canada, and priorities identified by the Joint Consortium for School Health. Teachers were provided with written instructions on how to administer the questionnaire. It was administered in one class period, ranging from 45 to 75 minutes in length. In the event that the class could not complete the survey independently, a concern among younger grades or in classes where literacy levels were low, questions were read out loud by the teacher, and students followed along at the same pace. The questionnaire was available in English, French and Inuktitut. Two questionnaires were administered, one to students in grades 9 and 10, and one to students in grades 6 through 8. Certain questions were only asked to older youth, such as those on sexual behaviour (not considered in this thesis). In the event that the students could not complete the questionnaire themselves, due to literacy concerns, teachers could read the survey aloud and students could respond to the survey items themselves. Students returned completed questionnaires in sealed envelopes to the teacher. Completed questionnaires were then returned to Queen’s University for data entry. The only exception was in the Yukon, where the Yukon Bureau of Statistics conducted the survey. Consent Consent was sought at multiple levels. First, the school board had to approve participation. Second, principals at selected schools had to provide permission for their school to participate in the study. Third, parental or guardian consent or assent, depending on the school jurisdiction, had to be provided. Finally, the child had to provide consent or assent to participate in the study. Active consent required parents to explicitly provide consent for their child to participate, while 190 passive consent required parents to respond stating that they did not want their child to participate. The form of consent was chosen based on school-board norms and guidelines. Response rate Approximately 77% of the estimated number of students who were sampled ended up participating in the study. Only 10% of students refused to participate or returned spoiled forms. The remainder were unable to participate for several reasons, including absence from school on the day of survey administration, failure to return consent forms, or failure to receive parent consent to participate. Survey weights Each grade within each province or territory is weighted. Within each province or territory, each grade received a weight to ensure that the responses are proportional to the actual student population for the province and grade present within the national grade group population. In the event that a province or territory is overrepresented in the sample, they are given a weight less than one. If a province or territory is underrepresented, they are given a weight greater than one. Distribution of residuals The distribution of residuals was examined for Chapter 4, and they were found to be approximately normally distributed. In addition, the variation in the residuals was examined over the range of predicted response values, and was found to be constant, satisfying the assumption of constant variance (homoscedasticity). 191 Figure 1: Distribution of studentized residuals Figure 2: Distribution of studentized residuals over the range of predicted values 192 Key survey items used in this thesis Ethnicity 5. How do you describe yourself? (You may choose one answer, or more than one) 01 White 09 Métis 02 Chinese 10 Inuit 03 South Asian (e.g. East Indian, Pakistani, Sri Lankan, etc.) 11 Dene 04 Black 12 First Nations 05 Filipino 13 Japanese 06 Latin American 14 Korean 07 Southeast Asian (e.g., Cambodian, Indonesian, Vietnamese, etc.) 15 West Asian (e.g., Afghan, Iranian, etc.) 08 Arab 16 Other (please specify) ____________________ Immigrant generation 6. In which country were you born? 1 Canada 2 Other, (please specify)_______________ 3 Don’t know Time since immigration 7. How many years have you lived in Canada? 1 I was born in Canada 2 1 to 2 years 3 3 to 5 years 4 6 to 10 years 5 11 or more years Height and weight 33. How much do you weigh? Answer using pounds or kilograms. _____ pounds 34. OR _____ kilograms How tall are you? Answer using feet and inches or centimetres. ____ feet ____ inches OR _____ centimetres 193 Physical activity Screen time 68. About how many hours a day do you usually watch television (including videos and DVDs) in your free time? (Please mark one box for weekdays and one box for weekend) Weekdays 1 2 3 4 5 6 7 8 9 Weekend None at all 1 About half an hour a day 2 About half an hour a day About 1 hour a day 3 About 1 hour a day About 2 About 3 About 4 About 5 About 6 About 7 4 hours a day hours a day hours a day hours a day hours a day or more hours a day 5 6 7 8 9 None at all About 2 About 3 About 4 About 5 About 6 About 7 hours a day hours a day hours a day hours a day hours a day or more hours a day 194 69. About how many hours a day do you usually play games on a computer or games console (Playstation, Xbox, GameCube etc.) in your free time? (Please mark one box for weekdays and one box for weekend) Weekdays 1 2 3 4 None at all About half an hour a day 2 About half an hour a day About 1 hour a day 3 About 1 hour a day About 2 hours a day None at all About 2 hours a day 4 6 7 8 About 3 About 4 About 5 About 6 hours a day hours a day hours a day hours a day 5 6 7 8 About 3 About 4 About 5 About 6 9 About 7 or more hours a day 9 About 7 or more hours a day 5 70. Weekend 1 hours a day hours a day hours a day hours a day About how many hours a day do you usually use a computer for chatting on-line, internet, emailing, homework etc. in your free time? (Please mark one box for weekdays and one box for weekend) Weekdays None at all About half an hour a day 2 About half an hour a day About 1 hour a day 3 About 1 hour a day About 2 hours a day 2 3 4 Weekend 1 1 None at all About 2 hours a day 4 6 7 8 About 3 About 4 About 5 About 6 hours a day hours a day hours a day hours a day 5 6 7 8 About 3 About 4 About 5 About 6 9 About 7 or more hours a day 9 About 7 or more hours a day 5 hours a day hours a day hours a day hours a day References 1. Freeman, J. G., King, M. A., Pickett, W., Craig, W., Elgar, F., Janssen, I., & Klinger, D. (2011). The health of Canada's young people: a mental health focus. Public Health Agency of Canada. Ottawa, Canada. 2. Griebler R, Molcho M, Samdal O, Inchley J, Dur W, Currie CE. Health Behaviour in School-Aged Children: A World Health Organization Cross National Study, Research Protocol for the 2009/2010 Survey. (2010) Vienna: LBIHPR and Edinburgh: CAHRU. 195 NLSCY Survey Methodology Sampling strategy The National Longitudinal Survey of Children and Youth (NLSCY) is a longitudinal study of Canadian youth conducted by Statistics Canada, in partnership with Human Resources and Skills Development Canada. The sample for the NLSCY was drawn from the 1994 Labour Force Survey (LFS) list of respondents. The LFS is a monthly survey that collects labour market data from a national sample of adults, and is representative of the civilian, non-institutionalized population aged 15 and over in 10 provinces. The three territories, those living on Indian Reserves, full-time members of the Canadian Forces and institutionalized individuals are all excluded from the sample. This sample of the LFS was used to recruit the approximately 25,000 youth that comprise Cycle 1 of the NLSCY. This 25,000 was divided into seven age groupings: 011 months, 1, 2-3, 4-5, 6-7, 8-9, and 10-11 years, in order to provide stable estimates within each of these age groupings. The NLSCY collected data over eight cycles every two years from 1994/95 onwards. Parents and youth were administered the survey at 2-year intervals. Of the original 25,000 participants, longitudinal data have been collected every 2 years from approximately 16,900, representing 11 age-based cohorts of approximately 1,500 participants each. Cross-sectional data from Cycles 1 – 3 are available as a Public Use Microdata File (PUMF), while Cycles 4 – 8 can only be access through the Research Data Centres (RDC) Program. This requires submitting a project proposal that has to be approved by Statistics Canada researchers, completing RDC training and obtaining Government of Canada Reliability Status security clearance. 196 Questionnaire administration The NLSCY used computer-assisted interviewing (CAI) methods, as well as paper questionnaires. Two types of CAI were used: Computerized Personal Interviewing (CAPI), and Computer Assisted Telephone Interviewing (CATI). At Cycle 1, a Statistics Canada researcher conducted a CAPI in the home of the respondent; CATI were used in subsequent samples. The questions were identical in both situations, and for both the interviewer read questions provided by a computer, and entered the results into the system. The major difference is while the CAPI is conducted in person, the CATI is conducted over the phone. The child survey was a pen-andpaper questionnaire that the child completed themselves. Verbal parental consent was obtained prior to beginning the interview. If permission was granted, then the interviewer was able to administer the test to the child in their home. After completing the survey, consent was also sought: 1) to share data with Human Resources and Development Canada, 2) for two contact people who could facilitate tracking respondents for follow up, and 3) written consent for the child to participate in the survey and for the researchers to contact the child’s school principal and teacher. This study used a question first introduced in Cycle 2, and kept until Cycle 8. This asked youth aged 10-15 in each cycle “On average, about how many hours a day do you watch TV or videos, or play video games?” with answers ranging from “I don't watch TV or videos, or play video games” to “7 or more hours a day.” For each respondent, their first response was considered as their baseline response, and their next response was considered the follow-up observation. For the vast majority of the sample (90.7%), this occurred after two years. 197 Response rate and sample weights Approximately 44% of the sample responded to all eight cycles, and 62% of the sample responded to at least Cycle 1 and Cycle 8. For longitudinal studies, response rates at each cycle have to be considered to account for loss to follow-up. To address this concern, two sample weights were created by Statistics Canada researchers, named “funnel weights” and “longitudinal” weights, and differ based on number of cycle responses. “Funnel weights” were weights assigned to children who have responded at every cycle, while longitudinal weights are assigned to children who responded at the most recent cycle, but not necessarily at all previous cycles.2 For this study, the longitudinal weights were used, i.e., youth who responded at Cycle 8 and at least one other cycle. This weight was chosen as it was non-zero for the maximum number of individuals who responded to the variables required in this analysis, and was zero/missing for most of the individuals who did not provide responses to the screen time variables. These criteria were defined after consultation with statisticians at Statistics Canada Key survey items Ethnicity 198 Immigrant generation This question was asked of both parents (if known), and the child. These data were combined to classify youth as 1st, 2nd or 3rd generation. Screen time References 1. Statistics Canada. (2010). National Longitudinal Survey of Children and Youth: Survey Overview for the 2008/2009 Data Collection Cycle 8. Retrieved from http://www23.statcan.gc.ca/imdb-bmdi/document/4450_D2_T9_V4-eng.pdf 2. Statistics Canada. (n.d.). Microdata User Guide: National Longitudinal Survey of Children and Youth - Cycle 8. Retrieved from http://www23.statcan.gc.ca/imdbbmdi/document/4450_D4_T9_V8-eng.pdf 199 Survey Monkey Audience Sampling strategy The sample was recruited using “Survey Monkey Audience”; Survey Monkey’s proprietary database of respondents.1 Individuals are recruited to be part of this database using several methods. These include through the Survey Monkey home page, at the end of Survey Monkey surveys, as well as when people sign up for a Survey Monkey account (i.e., when they sign up to create their own surveys). In addition, online advertisements, TV advertisements, billboards and in-game advertising are used to recruit respondents. Our sample was drawn from their Canadian partner network. For this study, inclusion criteria were that respondents had to be: 1) residents of Canada; 2) identified as non-Caucasian, and 3) aged 18-25 years. This age group was a convenience sample, chosen to determine if the questionnaire demonstrated validity and reliability in young adult population, before proposing pilot testing among school-aged youth. Respondents, in exchange for their time, could either 1) donate $0.50 to a charity of their choice, or 2) receive one entry for a weekly draw for a $100 gift card. Questionnaire description The questionnaire development process consisted of three components. First, a literature review identified a master list of 80 questions that have been used to measure acculturation among youth. Second, this list was presented to a panel of 11 individuals, consisting of 5 experts in acculturation and 6 youth. Using the Delphi method to obtain consensus, the relative importance of each of these items was determined. Through the elimination of non-important items, 32 questions were retained for pilot testing. Third, this questionnaire was pilot tested on a sample of 200 18-25 year old youth in Canada. Based on the results of this pilot testing, redundant items were eliminated (n = 16) and psychometrics calculated on the final list of 16 questions. The questionnaire was administered electronically using SurveyMonkey. A screenshot of the first page is available below, the full survey is available at the end of Chapter 3, and it is available online (and can be completed) at https://www.surveymonkey.com/s/CdnAccSurvey. 201 Consent Consent was sought prior to participants completing the questionnaire. The letter below preceded the questionnaire, and participants had to check a box indicating that they agreed to participate prior to starting the study. 202 Response rate Completed surveys are “purchased” from Survey Monkey directly. Therefore, enrolment into the study continues until a specified number is reached. A total of 450 responses were purchased from Survey Monkey, over two waves (300 in Wave 1, 150 in Wave 2). This corresponded to 282 unique respondents. Of these, 32 were excluded because they reported different responses at baseline and follow up for: ethnicity (n = 2), immigrant generation (n = 9), or date of birth (n = 17). An additional 4 people had more than one of the above. This left a final sample of 250 individuals (89%), corresponding to 349 observations (77.4%). Key survey items See Chapter 3 for a full list of all questionnaire items. References 1. SurveyMonkey. (2014a). SurveyMonkey Audience’s Global Partner Network. Retrieved from http://help.surveymonkey.com/articles/en_US/kb/SurveyMonkey-Audience-sGlobal-Partner-Network 2. SurveyMonkey. (2014b). Who is the SurveyMonkey Audience? Retrieved from http://help.surveymonkey.com/articles/en_US/kb/Who-is-the-SurveyMonkey-Audience 3. SurveyMonkey Audience. (2012). Data Quality: Measuring the Quality of Online Data Sources. Retrieved from http://clearslide.com/view/mail?iID=HJW5SSTZQ8VWUJXQ5DUP 203 Power Calculations Chapter 3: Development and validation of the Bicultural Youth Acculturation Questionnaire Sample size estimations for factor analysis follow two main approaches. The first is a “rule of thumb” approach, the most popular of which is based on the ratio of the number of subjects to the number of observed variables, suggested to be higher than 5:1. Commonly used scales of acculturation such as the Vancouver Index of Acculturation, Stephenson Multigroup Acculturation Scale, and ARMSA-II have 20, 32 and 47 items respectively; it is anticipated that the measure to be developed will be approximately the same length (target length: 20 questions) and thus 200-250 participants will be required based on this method. A second approach to calculate sample size has also been developed using Monte Carlo simulations. This method suggests that samples of 200 and larger are sufficient with 20 items and 3 factors under study. This study was therefore sufficiently powered for the Host and Heritage culture domains (n = 248), although it was underpowered for the Heritage language domain (n = 130). Chapter 4: The influence of country of birth and ethnicity on BMI among Canadian youth: A national survey Power calculations were calculated for continuous outcomes. Using standard methods to calculate power with a continuous outcome, this planned study is sufficiently powered. Based on an effective sample size of 16764 youth, and using a design effect of 1.4, this study is powered to detect differences as small as 3.1% among males and females separately with at 80% power at a level of significance of 5%. 204 Chapter 5: Time since immigration and ethnicity as predictors of physical activity among Canadian youth: A cross-sectional study No standard methods for calculating power for ordinal multi-level regressions exist. However, minimum sample size requirements for ordinal hierarchical modelling have been estimated to obtain stable parameter estimates. Monte Carlo simulations suggest 50+ level two clusters are required for three outcomes. The HBSC should be sufficiently powered to obtain stable estimates as there are 436 clusters (i.e., schools). Power calculations were calculated for these outcomes assuming they were dichotomized as yes/no, due to the lack of formal statistical processes for calculating power for ordinal regressions. The percentage of “exposed” youth was 18.4%, as this is the percentage of Canadians who are first generation immigrants. Using standard methods to calculate power with a dichotomous outcome, this planned study is sufficiently powered. Based on an effective sample size of 16764 youth, for physical activity, dichotomized as “7 days of physical activity” vs “less than 7 days,” it is powered to detect odds ratios larger than 1.3 among males and 1.4 among females. Chapter 6: Development and validation of the Bicultural Youth Acculturation Questionnaire Power calculations were calculated for continuous outcomes. Using standard methods to calculate power with a continuous outcome, this planned study is sufficiently powered. Based on an effective sample size of 3000 youth (obtained via personal communication with the RDC analyst prior to study initiation), this study is powered to detect differences as small as 5.1% among males and females separately with at 80% power at a level of significance of 5%. 205 Power calculation for Chapter 4 Difference 10.0% 5.0% 2.5% p1 0.50 0.50 0.50 p2 0.60 0.55 0.53 n1 4191 4191 4191 n2 4191 4191 4191 z 7.28 2.63 0.33 Power 1.00 1.00 0.63 Power was calculated using a design effect of 1.4 and assuming 10% non-response. The effective sample size for the HBSC manuscripts was therefore 26,078 /1.4 x 0.9 = 16764 youth; resulting in 8382 youth of each gender. Conservatively, all power calculations were performed at 50% prevalence of the outcome. Power calculations were performed for minimum detectable differences of 10%, 5% and 2.5% (presented above). Power calculation for Chapter 5 % exposed* N Nexposed r OR p po p1 d za/2 Z(1-b) Power Physical Activity Males OR = 1.30 18.4% 8382 1542 4 1.30 0.0900 0.0853 0.1109 0.0256 1.96 1.21 89% Males OR = 1.20 18.4% 8382 1542 4 1.20 0.0900 0.0868 0.1042 0.0174 1.96 0.19 58% Females OR = 1.40 18.4% 8382 1542 4 1.40 0.0400 0.0373 0.0522 0.0149 1.96 0.74 77% Power was calculated using a design effect of 1.4 and assuming 10% non-response. The effective sample size for the HBSC manuscripts was therefore 26,078 /1.4 x 0.9 = 16764 youth; resulting in 8382 youth of each gender. Power calculations were performed for odds ratios of 1.4, 1.3, 1.2 and 1.1. The minimum OR required is presented above, or the power associated with an odds ratio of 1.4 if the study was underpowered. Odds ratios refer to immigrant youth meeting the CSEP Physical Activity Guidelines.53,54 206 Power calculation for Chapter 6 Difference 10.0% p1 0.50 p2 0.60 n1 1500 n2 1500 z 3.56 Power 1.00 5.1% 0.50 0.55 1500 1500 0.84 0.80 5.0% 0.50 0.55 1500 1500 0.78 0.78 Power was calculated using a design effect of 1.4 and assuming 10% non-response. The effective sample size for the HBSC manuscripts was therefore 26,078 /1.4 x 0.9 = 16764 youth; resulting in 8382 youth of each gender. Conservatively, all power calculations were performed at 50% prevalence of the outcome. Power calculations were performed for minimum detectable differences of 10%, 5% and 2.5% (presented above). 207


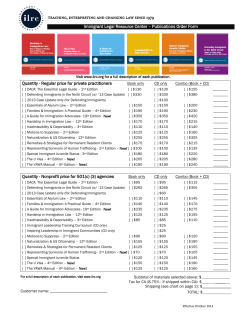


© Copyright 2026