
Local Minimum Wage Laws: Impacts on Workers, Families and Businesses
Local Minimum Wage Laws: Impacts on
Workers, Families and Businesses
Report prepared for the Seattle Income Inequality Advisory Committee
March 2014
Michael Reich
UC Berkeley Professor of Economics and Director, Institute for Research on Labor and
Employment, UC Berkeley
Ken Jacobs
UC Berkeley, Chair, Center for Labor Research and Education, Institute for Research on Labor
and Employment
Annette Bernhardt
UC Berkeley Visiting Professor of Sociology and Visiting Researcher, Institute for Research on
Labor and Employment
Acknowledgments: We thank Miranda Dietz and Jenifer MacGillvary for their contributions to
the research and writing of this report.
Contents
Executive Summary....................................................................................................................................... 1
1. Introduction ............................................................................................................................................. 4
2. Profile of existing local minimum wage laws ........................................................................................... 4
3. How San Francisco enforces its minimum wage law ............................................................................... 7
4. The research literature on minimum wage effects................................................................................ 10
5. The effects of minimum wage laws on workers and families ................................................................ 10
6. The effects of minimum wage laws on businesses ................................................................................ 17
7. Conclusion .............................................................................................................................................. 26
References .................................................................................................................................................. 28
Figures
Tables
Executive Summary
As cities and counties across the country increasingly debate whether to establish their own
minimum wage laws, policymakers are understandably asking a host of questions. How are
existing laws designed? What do we know about the impacts of local wage mandates on
workers and their families? What does research tell us about the effect of local wage mandates
on employment, and, in particular, do businesses move outside city or county borders in
response? In this report, we address these and related questions.
Existing local minimum wage laws
•
•
•
•
•
Nine localities in the United States currently have enacted minimum wage laws:
Albuquerque, NM; Bernalillo County, NM; Montgomery County, MD; Prince George's
County, MD; San Francisco, CA; San Jose, CA; Santa Fe, NM; Santa Fe County, NM; and
Washington DC. (Richmond, CA, just voted to raise its minimum wage to $12.30 an hour by
2017, and a final vote is pending to pass the law.)
Current mandated wage levels range from $8.50 in Bernalillo County to $10.74 an hour in
San Francisco. (New wage mandates in Washington DC and Santa Fe, Montgomery, and
Prince George’s Counties go into effect later this year.)
On average, the existing local minimum wage laws have mandated total wage increases of
41.4 percent, many of them in multiple steps and the majority indexed to inflation
thereafter. Localities with larger increases have been more likely to implement them in
several steps. Across the localities, the average per-step minimum wage increase is 16.7
percent.
The nine laws are similar in covering the large majority of work that is performed within the
boundaries of their cities or counties. San Francisco delayed coverage of nonprofits and
small businesses (less than 10 employees) for one year. Santa Fe initially exempted small
businesses but later amended its law to cover all establishments.
Two of the nine laws (San Francisco and San Jose) follow their state’s law in treating tipped
workers the same as non-tipped workers, maintaining a uniform minimum wage for both
groups. The other seven laws follow their states’ laws in maintaining a lower minimum
wage for tipped workers (even as some increased the base wage for tipped workers).
Several of the laws make similar provisions for commissioned workers.
How San Francisco enforces its minimum wage law
•
San Francisco uses a variety of high-impact enforcement and education strategies to ensure
that the city’s minimum wage law has its intended effect.
1
•
•
•
From the beginning of 2004 to mid-2012, San Francisco’s enforcement agency processed
616 worker complaints related to the minimum wage and recovered $5.8 million in back
wages on behalf of 3,004 workers. These are higher benchmarks than typically achieved by
state and federal enforcement agencies.
San Francisco’s Office of Labor Standards Enforcement assigns 7.5 compliance officers to
minimum wage enforcement on behalf of approximately 611,000 people employed in the
city. These officers share responsibility for enforcement of the city’s paid sick leave law as
well.
Approximately $979,000 supports the 7.5 positions devoted to minimum wage
enforcement. In addition, $462,125 is contracted to community organizations that provide
education, outreach, and case referrals, largely focused on minimum wage violations.
Effects of minimum wage laws on workers and families
•
•
•
•
•
Researchers consistently find that minimum wage laws raise pay for workers at the bottom
rungs of the labor market. These increases include both directly affected workers (those
earning between the old and the new minimum wage) as well as those indirectly affected
(those earning above, but near, the new minimum wage).
Raising the minimum wage also pushes up the wage floor relative to the median wage,
thereby reducing pay inequality.
Researchers consistently find that the affected workers are largely adults and
disproportionately women and people of color.
New research on the effect of minimum wage increases documents important reductions in
family poverty rates and enrollments in public assistance programs, such as food stamps.
Researchers have not estimated the amount of economic stimulus actually created by the
new spending power of low-wage workers after minimum wage increases. We do know
that low-wage workers and their families are likely to spend a significant portion of those
increased earnings.
Effects of minimum wage laws on businesses
Economists have increasingly recognized that raising the minimum wage does not automatically
mean that employment will fall. Increased labor costs can be absorbed through a variety of
other channels, including savings from reduced worker turnover and improved efficiency,
higher prices, and lower profits. Modern economics therefore regards the employment effect
of a minimum wage increase as a question that is not decided by theory, but by empirical
testing.
2
•
•
•
•
•
•
•
Labor economists continue to debate the actual impacts of the minimum wage on
employment and hours. We discuss in our assessment the most rigorous studies and offer a
non-technical explanation of the nature of the disagreements in the research literature.
To date, three rigorous studies have examined the employment impacts of San Francisco’s
and Santa Fe’s local minimum wage laws. Each finds no statistically significant negative
effects on employment or hours (including in low-wage industries such as restaurants).
A larger body of economic research investigates the effects of state and federal minimum
wage increases. These studies compare employment trends for states or counties that have
different minimum wages. The best studies make comparisons to nearby states or counties
to control for regional economic trends. These studies also find no statistically significant
negative effects on employment or hours at an aggregate level or for low-wage industries
such as restaurants and retail stores, or for specific groups of workers such as teens. These
studies also do not find substitution effects (such as shifts in hiring away from black and
Latino teens).
Studies of the impact of minimum wage increases on restaurants’ operating costs find that
an increase of 10 percent in the minimum wage increases operating costs by about 1 to 2
percent.
Researchers find small one-time price increases in the restaurant industry (of about 0.7
percent following a 10 percent minimum wage increase), but not in other industries.
Researchers find that increases in the minimum wage reduce employee turnover,
translating into a reduction in direct costs (recruitment, selection, and training of new
workers) and a reduction in indirect costs (lost sales, lower quality service, and lost
productivity as the new workers learn on the job). Some studies have also identified
additional benefits of higher wages, including improved morale, improved work
performance, and reductions in absenteeism.
Researchers have not found evidence that employers absorbed minimum wage increases by
reducing health benefits or pensions.
In summary, our assessment of the research evidence indicates that minimum wage mandates
raise the incomes of low-wage workers and their families, and that the costs to businesses are
absorbed largely by reduced turnover costs and by small price increases among restaurants.
That said, it is important to emphasize that existing research is necessarily limited to the range
of minimum wage increases that have been implemented to date. While these studies are
suggestive, they cannot tell us what is likely to happen when minimum wages are increased
significantly beyond current local, state, or general mandates.
3
1. Introduction
As cities and counties across the country increasingly debate whether to establish their own
minimum wage laws, policymakers are understandably asking a host of questions. How are
existing laws designed? What do we know about the impact on workers and their families?
What does research tell us about the effect of local wage mandates on employment, and in
particular, do businesses move outside city or county borders in response?
In this report, we address these and related questions. We first provide an overview of the nine
existing local minimum wage laws in the United States. We summarize their wage levels and
policy design features, such as phase-ins, coverage and exemptions, and treatment of tipped
workers. Our assessment is that, taken together, these laws represent a consistent public
policy model that establishes strong local wage standards covering the overwhelming majority
of work performed within city or county boundaries. We also provide a case study of how one
city, San Francisco, has enforced its minimum wage law.
Economists agree that minimum wage laws have large positive effects on workers’ pay and
their families’ living standards. Raising the minimum wage increases earnings for workers at
the low end of the labor market, the majority of whom are adults. Women and workers of
color benefit disproportionately. In addition, new research on the effect of minimum wage
increases documents important reductions in family poverty rates. Moreover, low-wage
workers and their families are often forced to rely on public assistance programs; new research
on food stamps finds that raising the minimum wage reduces their reliance on this program.
We then review the economic research on the impact of minimum wage laws workers, families,
and businesses. In our assessment, the weight of the evidence suggests that moderate
minimum wage increases have insignificant to non-existent negative effects on employment
and hours, reduce worker turnover and increase worker retention, and result in small, one-time
price increases in heavily-affected industries, such as restaurants. We also explain how
conflicting findings on the employment impact of the minimum wage can be traced to
differences in the rigor of the research methods.
2. Profile of existing local minimum wage laws
In this section, we give an overview of existing local minimum wage laws in the United States.
Currently, there are nine such laws, with the majority passed in recent years. In this group, we
include minimum wage laws passed by cities or counties that broadly cover most businesses
and workers within their jurisdictions. We do not include local wage mandates with narrow
4
coverage, such as living wage laws restricted to city contractors or laws targeting airports or
specific industries such as hotels. These are important policy models in their own right, but
they are less relevant to assessing the economic impacts of local minimum wage laws that
affect the large majority of employers and workers in a city or county.
We want to flag several important caveats. Given the short timeline for this report, we were
not able to examine any regulatory interpretations of the laws; the below tables summarize
statutory provisions. Similarly, we were not able to itemize provisions in the localities’
respective state minimum wage laws that are implicitly followed by the city or county statutes.
Finally, while we have done our best to be as accurate as possible in these tables, we are not
lawyers and encourage verification by the City’s legal staff.
Our overall assessment is that despite some variation in policy design, existing local minimum
wage laws represent a consistent public policy model that establishes strong local wage
standards and covers the majority of work performed within city or county boundaries.
The wage mandates
Table 1 provides an overview profile of the nine existing local minimum wage laws. (Richmond,
CA, just voted to raise its minimum wage to $12.30 an hour by 2017, and a final vote is pending
to pass the law.) Note that the table summarizes current laws. In Albuquerque, Bernalillo
County, and Washington DC, those laws updated older existing laws.
Six of the nine laws were enacted by a legislative process. The San Francisco, Albuquerque, and
San Jose laws were enacted using ballot measures. The gaps between the enactment dates and
initial implementation dates range from two months to one year. Current mandated wage
levels range from $8.50 in Bernalillo County to $10.74 in San Francisco. (The more recent wage
mandates in Washington DC and Santa Fe, Montgomery, and Prince George’s Counties shown
in Table 1 are not yet in effect). Seven of the nine localities increase their wage floors annually
according to changes in a consumer price index.
Table 2 details the wage increases mandated by each of the laws, showing the variation in
policy design. In this table, we include both current laws as well as older laws that have been
superseded.
Some localities established their minimum wage in one step, while others phased in their
mandate. For example, San Jose established its minimum wage in 2013, raising it from the
state minimum wage (of $8.00 an hour) to $10.00 an hour in one step. San Francisco adopted
5
a hybrid model; it established its minimum wage in one step, going from $6.75 to $8.50 an hour
in 2004, but delayed its mandate by one year for nonprofits and businesses with fewer than ten
employees. Santa Fe combined those strategies, establishing its minimum wage in two steps
(to $8.50 an hour in 2004 and $9.50 an hour in 2006) and initially exempting businesses with
fewer than 25 employees, who were then covered in 2008.
Several localities recently updated their existing laws via new legislation or ballot initiatives.
Washington DC’s 2004 minimum wage law was implemented in several steps. It then passed a
new law in 2014, at about the same time as neighboring Montgomery and Prince George’s
Counties. Albuquerque and Bernalillo County (Albuquerque’s surrounding county) recently
passed new ordinances superseding their older existing laws.
Table 3 summarizes the total mandated percentage wage increases for each of the nine laws,
calculated to encompass all of the phase-in steps (these percentages do not include subsequent
indexing to cost-of-living increases). Total increases range from a low of 13.3 percent in
Albuquerque (2012) and Bernalillo County (2013) to a high of 84.5 percent in Santa Fe (2003). 1
On average, the nine local minimum wage laws increased their wage floors by 41.4 percent. As
Tables 1 and 2 show, many of those increases occurred in multiple steps, and seven out of nine
indexed to inflation thereafter. In general, localities with larger increases were somewhat more
likely to implement them in several steps. Across the localities, the average per-step minimum
wage increase was 16.7 percent.
Coverage and exemptions
Table 4 summarizes the businesses that are covered/exempted under the nine local minimum
wage laws. The laws are similar in covering the large majority of work that is performed within
the boundaries of their cities or counties. The laws vary in the reach of coverage to outside
businesses that perform work in the city or county and how that coverage is specified.
In addition, San Francisco delayed coverage of nonprofits and small businesses for one year.
Santa Fe initially exempted small businesses from its 2003 law, but in 2007 amended the law to
cover all establishments regardless of size (it continues to exempt nonprofits whose primary
source of funding is from Medicaid waivers). Several of the localities exempt state and federal
agencies to varying degrees.
The first Santa Fe increase, 65 percent, was followed by a smaller increase two years later. The large initial
increase may overstate the impact of the law on wages. A small share of covered workers had wages at or near the
minimum wage at the time of the increase (Pollin and Wicks-Lim 2005).
1
6
Table 4 also summarizes coverage and exemptions for workers. Several laws explicitly state
that undocumented workers and various types of contingent workers (e.g., part-time and
temporary agency workers) are covered. Groups of workers that are exempted by some
localities include employers’ family members; workers exempt under state minimum wage law;
interns working for academic credit; workers enrolled in apprenticeship programs; persons
working fewer than two hours a week in the city or county; and various other groups of
workers.
Treatment of other forms of compensation
Table 5 summarizes treatment of tipped workers under the nine laws. Two of the nine laws
(San Francisco and San Jose) follow their state’s law and treat tipped workers the same as nontipped workers, maintaining a uniform minimum wage for both groups. The other seven laws
follow their states’ laws in maintaining a lower minimum wage for tipped workers (even as
some increased the base wage for tipped workers above the state level). These laws allow the
employer to count the workers’ tips in meeting the full minimum wage requirement (often
called a “tip credit”). If a worker’s tips do not suffice to meet the full minimum wage
requirement, the employer must make up the difference. Several of the local minimum wage
laws also make provisions for commissioned workers, along similar lines.
Finally, Table 5 lists provisions in a number of the laws pertaining to other forms of
compensation. For example, three localities (Albuquerque, Bernalillo County, and Santa Fe)
allow employers to include some or all of their payment of health benefits and childcare in the
calculation of wages paid. Data are not available on the extent to which employers have made
use of these provisions. In general, low-wage workers are less likely than higher-wage workers
to have health coverage through an employer.
We were not able to find any references in the laws to how profit-sharing compensation
systems should be treated in calculating hourly wages.
3. How San Francisco enforces its minimum wage law
In this section, we summarize an in-depth study of San Francisco’s enforcement of its minimum
wage law. Our summary draws from a more complete analysis by Dietz, Levitt, and Love
(2014).
7
A. The Office of Labor Standards Enforcement
San Francisco’s Office of Labor Standards Enforcement (OLSE), originally created to enforce the
city’s prevailing wage laws, expanded its scope as San Francisco passed new labor standards.
After the city’s minimum wage was passed by ballot initiative in 2003, four of five positions
previously assigned to enforce the city’s living wage law were reassigned to enforce the new
minimum wage law. As of February 2014, 7.5 contract compliance officers are assigned to
minimum wage enforcement on behalf of approximately 611,000 people employed in the city
of San Francisco. Each of these compliance officers share responsibility for enforcement of the
city’s paid sick leave law as well.
B. Strategies for minimum wage enforcement
OLSE investigates minimum wage cases by engaging in company-wide investigations. When a
worker files a complaint, either directly with the office or through one of the community
partners under contract with OLSE, an officer interviews the employee first. The officer arrives
at the employer unannounced; he or she then interviews the employer and other employees,
audits payroll records, and reviews other relevant documents to determine if the employer
violated the labor rights of the original claimant or any other employee. If the officer finds a
violation, he or she develops a case against the employer on behalf of all employees whose
rights were violated and sends a letter of determination to the employer. If the employer
disagrees with the OLSE findings or simply ignores the letter, the office must initiate a formal
hearing process, which can take months to complete. 2 However, such a hearing process can
result in hefty additional fines for the employer. As a result, in most cases OLSE reaches a
settlement with the employer without resorting to the lengthy formal process.
This strategy contrasts with the common state and federal enforcement practice of acting as an
arbiter rather than investigator. In many cases, these other enforcement agencies’ main role is
to engage in reconciliation (often a phone call to the employer) or set up an informal
settlement conference between the employer and the individual employee. The San Francisco
strategy of investigating all labor standards and on behalf of all workers can be more time
consuming, but it has a better chance of recovering full back wages for the worker. This
strategy focuses on fixing business practices in the long-run, rather than fixing one-off issues
quickly.
Other strategies that OLSE considers important for its effectiveness include:
2
Subsequent laws were written such that employers must take action within 15 days if they disagree with OLSE’s
determination by filing a request for a hearing; otherwise OLSE’s determination is final.
8
•
Engaging in education and outreach to employers and workers. Posters announce the
new inflation-adjusted minimum wage on public transport at the beginning of every
year, and all city businesses with employees are sent the required notices for posting.
All OLSE staff spend time responding to questions from hotlines and emails, and setting
up meetings to educate workers and employers. Multilingual outreach and
announcements are especially important given the linguistic diversity in San Francisco.
•
Building trust with workers. The same officer handles a case from start to finish,
building trust and ensuring that workers are not lost in the process. The office collects
back-up contact information from a friend or relative, and has successfully maintained
contact with and provided back wages to workers who have moved, even when they
move across international borders.
•
Working with other departments. OLSE has worked with the city and district attorneys’
offices to prosecute particularly egregious labor standards violators. OLSE also works
with the city’s Department of Health, which conducts investigations and administrative
hearings related to restaurant health permits. The threat of revoking a health permit
has helped OLSE enforce existing agreements for back pay and to resolve disputes with
intransigent employers engaged in negotiations with the office.
C. Measures of effectiveness
From the beginning of 2004 to mid-2012, OLSE received 616 worker complaints related to the
minimum wage and recovered $5.8 million in back wages on behalf of 3,004 workers. In just
2011, OLSE opened 77 cases and collected $638,171 in back wages. While the amount
collected in that year was not necessarily for cases opened in that year, this measure still
provides a useful metric to compare to other jurisdictions. Wages collected per case opened in
2011 were $8,288, or $2,041 per claimant. In comparison, Washington DC collected $766 per
claim, and California’s Department of Labor Standards Enforcement (DLSE) collected $995 per
case opened. Two factors explain OLSE’s high average amount collected: (a) OLSE investigates
on behalf of all workers and often ends up including more than the original worker(s) who filed
the claim, and (b) in all but a handful of cases OLSE successfully recovered all of the back wages
owed. In other enforcement offices, the amount of wages due often differs significantly from
the wages collected.
Penalties may be levied against employers found to be in violation of minimum wage laws. To
reach settlements with employers the office never negotiates away back wages, but may forgo
penalties or recovering the cost of investigations. As a result, actual penalties collected are
9
relatively low: about $310,000 in penalties have been collected for minimum wage and paid
sick leave violations since FY 2008-09.
D. Fiscal cost to San Francisco
In FY 2013-14, the budget for OLSE totaled $3.7 million. This amount supports 19 positions and
three professional services contracts, including one for web-based certified payroll reporting.
However, the office is also tasked with enforcing a number of other labor standards beyond the
minimum wage: for city contractors—prevailing wage, living wage and living health, sweat-free
contracting, and the displaced worker protection act; for all employers—paid sick leave, a
health spending requirement, and a family-friendly workplace ordinance. OLSE estimates that
approximately $979,000 supports the 7.5 positions devoted to minimum wage enforcement—
about $753,000 in salaries and benefits and $226,000 in overhead, not including clerical
support. In addition to this cost, $462,125 goes to community organizations that provide
education, outreach, and referrals to OLSE, largely focused on minimum wage violations.
4. The research literature on minimum wage effects
In the following two sections, we summarize the empirical evidence on the effects of minimum
wage laws on workers, families, and businesses. Where possible, we highlight research on local
minimum wage laws. However, since most of the existing local laws have been in place a short
time, the data that are needed for rigorous research on the recent laws are not yet available. To
date, rigorous economic impact studies exist only for San Francisco and Santa Fe (UC Berkeley
researchers are currently studying the impact of San Jose’s law). The San Francisco impact
study (Dube, Naidu and Reich 2007, 2014) in particular stands out as well-designed and wellsuited to informing the City of Seattle’s Advisory Committee, given the many similarities
between Seattle and San Francisco.
We also draw upon the much larger body of research on the impacts of state and federal
minimum wage increases. Recent studies that compare adjacent counties from different states
with different minimum wages are especially relevant. The findings from these studies speak
directly to policymakers’ concerns that businesses might relocate employment outside their
city’s borders in response to a local minimum wage law.
5. The effects of minimum wage laws on workers and families
The primary goal of raising the minimum wage is, of course, to raise the pay of low-wage
10
workers. A broad consensus in the economic research literature agrees that minimum wage
laws raise pay for workers on the bottom rungs of the labor market (for an extensive review,
see Belman and Wolfson 2014). Researchers also consistently find that the affected workers
are largely adults and disproportionately women and people of color. In addition, new research
on the effect of minimum wage increases shows important reductions in family poverty rates,
especially among working families. Finally, we review what is known about reliance on public
assistance programs by low-wage workers and their families.
This section focuses on summarizing what we have learned about the effects of minimum wage
increases on workers and families.
A. Impact on low-wage workers’ earnings
In assessing the impact of a minimum wage increase on low-wage workers’ earnings, it is
important to keep two facts in mind. First, many low-paid workers earn wages somewhere
above the old minimum wage level but below the new level. Consequently, not all workers
who are directly affected by an increase will receive the full amount of that increase. Second,
researchers have also documented a “ripple effect” from minimum wage increases in which
employers give raises to workers who are earning above, but near, the new minimum wage.
(Wicks-Lim 2006). As a result, it is not completely straightforward to estimate either how many
workers benefit from minimum wage increases or the policy’s impact on their earnings.
Evidence from local minimum wage laws
Dube, Naidu and Reich (2007) assessed San Francisco's minimum wage law when it was first
implemented in 2004, using a before-and-after survey of restaurant employers in San Francisco
and in nearby parts of neighboring Alameda County. They found that the average wage of
workers at surveyed restaurants rose from $10.22 before to $11.01 after the increase, with pay
rising twice as much among fast-food restaurants compared to table-service restaurants. They
also found evidence that the increase compressed the wage distribution among restaurant
workers by raising the bottom of the distribution (not by hurting pay for higher-wage workers).
Before the policy, 49.7 percent of restaurant workers earned less than $8.50; afterward, only 5
percent did. The authors also tested whether compliance with minimum wage laws decreased
after the law passed. They found no evidence of decreased compliance.
Jacobs and Reich (2014) recently conducted a longer-term assessment of San Francisco’s
minimum wage law. They estimate that 55,000 workers in the city receive higher pay because
of the ordinance, amounting to a cumulative increase of $1.2 billion in wages in the ten years
11
since the laws’ inception. They also found additional evidence that the law had a significant
impact on workers’ earnings over time. As shown in Figure 1, the wages of San Francisco
workers earning at the bottom of the distribution (the 10th percentile) jumped in 2004, when
the law was implemented. This wage, when measured to take account of inflation, did not
change even during the recession that began in December 2007 because the city’s minimum
wage standard is indexed to inflation. By contrast, the 10th percentile wage in the surrounding
counties, without an indexed minimum wage, declined over that same time period.
Additional lessons can be gleaned from Santa Fe, the other city whose minimum wage law has
been extensively studied. Pollin’s (2004) detailed prospective study of the city’s 2004 law
estimated that 17,000 workers would be directly or indirectly affected and that the directly
affected workers would see an average increase of $2,647 in annual earnings. In a more recent
prospective study, Reich (2012) estimated that San Jose's minimum wage increase from $8 to
$10 would lead to higher pay for about 69,000 of the city’s 388,000-person workforce (18.9
percent).
Schmitt and Rosnick (2011) studied the wage impacts of both the San Francisco and Santa Fe
laws. These authors found that wages increased in a range of low-wage industries in both
cities. 3 In San Francisco, for example, the average wage of fast-food workers increased 9 to 11
percent by the third year of the ordinance, and as much as 12 percent in low-wage industries
overall. Pay for fast-food workers in Santa Fe increased by similar amounts, together with
wage increases of 2 to 9 percent in the retail industry and 5 to 15 percent for low-wage
industries overall. (See also Reynis, Segal and Bleeker (2005) for similar findings.)
Finally, a broader literature has looked at state and federal minimum wage increases and
estimated their impact on workers’ earnings. In their comprehensive review of existing
research, Belman and Wolfson (2014) estimate that changes in the minimum wage typically
affect about 10 to 20 percent of the labor force (and sometimes as much as 30 percent),
counting both direct and indirect effects. The average wage increase per impacted worker
depends on the size of the minimum wage increase and what the average worker was earning
beforehand. As a concrete example, Schmitt (2013) analyzed federal minimum wage increases
from 1989 to 2009 and estimates that impacted workers’ wages rose between 8.4 and 13.6
percent. Research consistently finds that the pay of both adults and teens is affected by
minimum wage increases (Allegretto, Dube and Reich 2011; Giuliano 2013).
3
The authors also examined the impact of the 1993 minimum wage law in Washington DC, but found that the size
of the increase was too small to raise wages in those industries (too few workers were affected). They conclude
that the law therefore did not constitute a meaningful policy experiment.
12
We also note broad agreement among economists that raising the minimum wage reduces
income inequality, by pushing up the wage floor relative to the median wage (Lee 1999; Autor,
Manning and Smith 2010).
B. Demographics of affected workers
Evidence on who benefits from minimum wage increases comes mainly from prospective
studies (conducted when a minimum wage law is first being considered). In these studies,
researchers analyze government survey data and estimate the number and characteristics of
workers likely to be affected, given wage thresholds being considered by law makers.
For example, drawing on results in Reich and Laitinen (2003), Lantsberg (2003) conducted a
prospective study of San Francisco’s first minimum wage increase in 2004 (from $6.75 to
$8.50). He estimated that about 55,700 workers (14 percent of private sector workers) would
benefit from the law, with 70 percent age 26 or older. Lantsberg also found differences by race
and ethnicity. He estimated that while 9 percent of white workers would be affected, the
corresponding figures were 18 percent of African American workers, 21 percent of Asian
workers, and 22 percent of Hispanic workers. In his prospective study of Santa Fe’s 2004
minimum wage law, Pollin (2004) similarly found that the increase would benefit mainly adult
workers (many of them primary bread-winners) and especially workers of color.
More recently, the Council of Economic Advisers (2014) analyzed the likely effects of the
Harkin/Miller bill to raise the current federal minimum wage from $7.25 to $10.10 by 2016.
The CEA found that the proposal would raise wages for 28.2 million workers (19 million directly,
the remainder indirectly), or 21.4 percent of the U.S. workforce. CEA estimates that the
majority of affected workers are women (55 percent) and aged 20 or older (88 percent). The
CEA also estimates that black and Hispanic workers will benefit more than white workers, and
that 46 percent of affected families have incomes under $35,000 a year.
In an earlier study, Bernstein and Schmitt (1998) examined the characteristics of workers and
families that benefitted from the federal minimum wage increase in the mid-1990s (from $4.25
to $4.75 in 1996 to $5.15 in 1997). The researchers found that the two-step increase raised the
wages of 9.9 million workers, largely adults (71 percent) and disproportionately women and
black and Hispanic workers. About half of the beneficiaries worked full time, and an additional
third worked 20-34 hours a week. Moreover, the average affected worker contributed 54
percent of his or her household earnings. In aggregate, 58 percent of the benefits from the
minimum wage increase were received by households in the bottom 40 percent of the family
income distribution.
13
C. Effects on poverty and use of public assistance programs
Impact on poverty
Compared to the large volume of research on the employment effects of minimum wage laws,
few studies have examined the impact on poverty. A recent paper by Arindrajit Dube shows
important reductions in family poverty rates from minimum wage laws.
Specifically, Dube (2013) finds that higher minimum wages increase incomes at the bottom of
the family income distribution, reduce the percent of individuals living below the poverty line,
and, in particular, reduce extreme poverty (families with incomes less than one-half the poverty
line). The reductions in poverty are somewhat larger for black and Latino individuals, for those
with less education, and for children under 18.
Based on state-of the-art econometric methods, Dube’s estimates predict that the Harkin-Miller
proposal (to raise the federal minimum wage from $7.25 to $10.10 an hour) would reduce the
number of people living in poverty in the U.S. by 4.6 million. These Americans constitute about
a fifth of the working poor. Other recent studies, using less sophisticated statistical methods,
also show that raising the minimum wage reduces poverty. The Council of Economic Advisers
(2014) predicts that the proposal would raise incomes for an estimated 12 million now in
poverty, lifting 2 million of them out of poverty. The Congressional Budget Office (2014)
estimates that the Harkin-Miller proposal would lift 900,000 people out of poverty.
Impact on use of public assistance programs
Until recently, economists have typically not assessed the impact of minimum wage increases
on the use of public assistance programs by low-wage workers and their families.
Across several years in the 2000s, researchers in four states used a consistent methodology to
estimate the portion of working poor families enrolled in public assistance programs. The
research teams considered major programs such as Medicaid, EITC (Earned Income Tax Credit),
Food Stamps, SCHIP (State Children’s Health Insurance Program), TANF (Temporary Aid to
Needy Families), and subsidized child care. Their findings were remarkably consistent across
the four states:
14
•
•
•
•
New York: In 2001-2004, an estimated 890,000 working families were enrolled in at
least one public assistance program, accounting for 33 percent of all public benefits
spending in the state, or $5.2 billion annually (Bernhardt, Chaddha and McGrath 2008).
Illinois: In 2001-2004, an estimated 475,000 working families were enrolled in at least
one public assistance program, accounting for 37 percent of all public benefits spending
in the state, or $2.2 billion annually (Theodore and Doussard 2006).
Wisconsin: In 2001-2004, an estimated 178,000 working families were enrolled in at
least one public assistance program, accounting for 45 percent of all public benefits
spending in the state, or $837 million annually (Center on Wisconsin Strategy 2006).
California: In 2002, an estimated 2 million working families were enrolled in at least one
public assistance program, accounting for 48 percent of all public benefits spending in
the state, or $10.1 billion annually (Zabin, Dube and Jacobs 2004).
In all four states, low wages were the leading predictor of enrollment in public assistance
programs by working families.
More recently, researchers using a similar methodology found that 60 percent of spending on
food stamps and 47 percent of spending on TANF nationally is provided to members of working
families. The researchers further found that more than half (52 percent) of families of fast-food
workers are enrolled in one or more public programs, at an annual cost of nearly $7 billion.
Again, low wages were the main predictor of public program enrollment (Allegretto, Doussard,
Graham-Squire, et al. 2013).
Does raising the minimum wage reduce reliance on means-tested public assistance programs?
The answer may seem obvious, but West and Reich (2014) point out that the research question
is more complex. If, for example, raising the minimum wage causes increased unemployment,
more workers and families would have to rely on programs such as food stamps. The authors
analyze state and federal minimum wage increases from 1990-2012 and find that, on average, a
10 percent increase in the minimum wage reduces food stamp program enrollment by between
2.4 and 3.2 percent, and reduces program expenditures by 1.9 percent. 4 They predict that an
increase of the federal minimum wage to $10.10 would reduce enrollment in the food stamp
Several studies have examined the relationship between the minimum wage and the Earned Income Tax Credit,
or EITC. Neumark and Wascher (2011) find that a higher minimum wage increases EITC benefits for families in
deep poverty, while reducing EITC benefits for some subgroups. Lee and Saez (2012) argue that the minimum
wage and EITC are complementary policies, not substitutes. The Congressional Budget Office (2014) argues that a
minimum wage increase will not have a substantial effect on EITC spending, while Rothstein (2010) examines
whether the positive effect of the EITC on female labor supply has lowered wages. While these studies are of
interest, the EITC is quite different from programs such as food stamps. The EITC has a substantial phase-in period
during which benefits increase and a long phase-out period, with eligibility ending completely at an annual income
of about $48,000 for a family of four—quite a bit above the reach of the minimum wage.
4
15
program by about 3.5 million people and reduce federal expenditures on food stamps by about
$4.2 billion per year.
More generally, since eligibility for programs such as SNAP and Medicaid are tied to the federal
poverty level, Dube’s (2013) finding that higher minimum wages reduce the poverty rate
suggests that we might also expect reductions in enrollments in public assistance programs.
D. Effects on the economy
A common question is whether raising the minimum wage might act as an economic stimulus
and engine of job growth, as low-wage workers spend their increased earnings in local
communities. Unfortunately, the economic research literature has not addressed this question.
Consequently it is not possible to make a confident assessment of these broader economic
impacts of minimum wage laws.
A few studies have attempted such estimates with prospective studies. For example, Lantsberg
(2003) estimated that the first minimum wage increase in San Francisco would result in $45
million in additional spending by low-income families on food, clothing, and other items, likely
in local neighborhood businesses. Similarly, Pollin (2004) estimated that Santa Fe’s 2004
minimum wage increase would result in an additional $15 million of spending, potentially
boosting retail sales in local neighborhoods by 5 percent.
More recently, researchers at the Federal Reserve Bank of Chicago analyzed how a future
federal minimum wage increase would affect aggregate household spending. The authors
calculate that a $1.75 increase in the federal minimum wage (from $7.25 to $9.00 an hour)
would raise aggregate household spending by roughly $48 billion in the short term, increasing
GDP by 0.3 percent (Aaronson and French 2013). In a similar vein, the Economic Policy Institute
recently estimated that the Harkin/Miller bill would result in an additional $35 billion in wages
paid to affected workers by 2016. This projected rise in consumer spending would provide a
net increase in GDP of $22.1 billion, creating roughly 85,000 new jobs (Cooper 2013).
These prospective estimates require a series of assumptions about the future behaviors of
workers, owners, and consumers and their interactions that are difficult to validate. For local
laws, the size of the locality and the proportion of workers who live and spend their income in
the locality are also important. We do know that low-wage workers and their families are likely
to spend a significant portion of their increased earnings from a minimum wage increase
(Johnson, Parker and Soueles 2004).
16
6. The effects of minimum wage laws on businesses
The impact of the minimum wage on businesses—how many workers they hire, whom they
hire, the prices they charge for their goods and services, their location decisions—is one of the
most researched topics in economics, with hundreds of studies published over the decades.
We do not attempt to summarize the full literature in this report; for recent reviews see Brown
(1999), Neumark and Wascher (2006), Schmitt (2013), and Belman and Wolfson (2014).
Economists’ understanding of minimum wage effects has undergone significant changes over
the past 20 years. This shift began with the groundbreaking work of Card and Krueger (1994),
who analyzed employment in fast-food restaurants near the New Jersey and Pennsylvania
border after New Jersey increased its state minimum wage. Card and Krueger found no
measurable negative impact on employment.
Since then, economists have increasingly recognized that raising the minimum wage does not
automatically mean that employment will fall. Increased labor costs can be absorbed through a
variety of other channels. For example, if turnover declines, employers save on recruiting and
training costs at the same time that they reap the benefits of more experienced workers who
are more productive. When a cost increase affects all firms in an industry, firms can also raise
their prices rather than reduce the number of employees. They may also experience lower
profits. Modern economics therefore regards the employment effect of a minimum wage
increase as a question that is not decided by theory, but by empirical testing.
In what follows we summarize the research that in our opinion is best suited to assessing the
effects of minimum wage increases on businesses; we also give an intuitive explanation of the
nature of the disagreements in the research literature about those effects.
Before proceeding, it is important to mention that existing research has only studied moderate
increases in the minimum wage, of the size discussed in previous sections. These studies can
only be suggestive of what might occur when minimum wages are increased significantly
beyond existing local, state, or federal mandates.
A. Impact on employment and hours
Evidence from local minimum wage laws
To our knowledge, there are three rigorous studies of the employment impacts of existing city
minimum wage laws. Dube, Naidu and Reich (2007) studied the impact of San Francisco’s
17
minimum wage law after it increased from $6.75 to $8.50 an hour in 2004, using a unique
quasi-experimental research design. They surveyed a sample of restaurants before the wage
increase, and then re-surveyed the same businesses nine to ten months after. The sample
included restaurants from San Francisco as well as neighboring East Bay cities that were not
covered by the policy, allowing the researchers to compare outcomes at restaurants affected by
the minimum wage mandate with those that were not. The study also was able to compare
outcomes at fast-food restaurants with outcomes at full-service restaurants.
After controlling for a variety of potential confounding factors, the authors found no
statistically significant negative effects on either employment or the proportion of full-time jobs
as a result of the San Francisco law. This finding holds for both full-service and fast-food
restaurants (one might expect more sensitivity to a higher minimum wage in the latter). We
show in Figure 2 the results from a follow-up study (Jacobs and Reich 2014). Restaurant
employment in San Francisco rose slightly faster than in surrounding counties after the
minimum wage increase, and again after San Francisco implemented two additional policies
(paid sick leave and a health spending requirement). 5
Potter (2006) studied the impact of Santa Fe’s minimum wage law after it increased from $5.15
to $8.50 in 2004, a substantial increase of 65 percent (at that time, only businesses with 25 or
more employees were covered). Potter also uses a quasi-experimental research design to
compare changes in employment at Santa Fe businesses before and after the ordinance went
into effect and to changes in employment in nearby Albuquerque over the same time period.6
Potter found no statistically significant negative impact of Santa Fe’s minimum wage increase
on Santa Fe employment, both at an absolute level and relative to Albuquerque. This finding
held for the most affected industries of accommodation and food services, which had the
highest proportion of minimum wage workers. Potter did find a decline in construction
employment in both cities, with the decline stronger in Santa Fe; he ascribes this finding to
differences in the timing of an overall slowing of the region’s construction boom.7
Finally, Schmitt and Rosnick (2011) studied the impact of the above two laws, comparing
employment trends in these cities before and after their minimum wage increases to control
Trends in overall employment in San Francisco closely matched those in the surrounding counties during the
same time period, indicating that the differential trends in restaurant employment were not caused by differences
in economic growth between the two areas. Restaurant closed in San Francisco at a 2.8 percent lower rate than in
nearby areas not covered by the law. This difference, however, was not statistically significant.
6
Albuquerque did not have a city minimum wage law at that time.
7
In Santa Fe, net store closings were 1.1 percent higher in businesses covered by the law than among those that
were not. This difference was not statistically significant.
5
18
groups of surrounding suburbs and nearby metropolitan areas. 8 The authors found no
discernible negative effects on employment, even three years after the respective ordinances
were implemented. The authors focused on fast-food restaurants, food services, retail trade,
and other low-wage industries.
Several additional studies of Santa Fe and San Francisco have been produced by the restaurant
industry-backed Employment Policies Institute. In a study of Santa Fe, Yelowitz (2005a, 2005b)
found an increase in the probability of unemployment for low-skilled workers and evidence of
replacement of low-skilled adults by teens. In his study of San Francisco, Yelowitz (2012) found
the opposite result: a decrease in teen work hours and no discernible effect on overall
employment.
Unfortunately, both studies suffer from serious methodological problems that make the results
unreliable.9 Since higher wages are likely to increase the labor supply, unemployment rates can
increase even as the number of people who are employed also increases. Pollin and Wicks-Lim
(2005) replicate Yelowitz’s (2005a) study but look at employment, rather than unemployment.
They find no negative impact on employment. Furthermore, even if the reported results for
each of the studies held, total compensation for teens and low-skilled workers would still have
increased. Any employment or hours reductions would be more than offset by the increase in
hourly earnings (Pollin and Wicks-Lim 2005; National Employment Law Project 2012).
Evidence from state and federal minimum wage laws
If the findings of the small number of case studies discussed above are taken on their own, it
would be difficult to draw broad conclusions about the impact of minimum wage laws.
However, the results from studies of city and county minimum wage laws are corroborated by
detailed research on state and federal minimum wage laws that provide a much larger sample
of events to study.
The authors also examined the impact of the 1993 minimum wage law in Washington DC, but found that the size
of the increase was too small to raise wages in those industries (too few workers were impacted). They conclude
that the law therefore does not constitute a meaningful policy experiment.
9
Detailed critiques of the studies were made by Pollin and Wicks-Lim (2005) and the National Employment Law
Project (2012). Among other issues, the data used in the San Francisco study starts one year after the law was
implemented and fails to capture pre-trends or the first year of implementation. The study compares San Francisco
to 20 other "superstar" cities. As with Neumark and Wascher (2008), the results may be biased by underlying
regional differences that are unrelated to minimum wage policies. Colla, Dow and Dube (2014) solve this problem
by comparing trends in earnings and employment between a similar group of central cities and their peripheral
counties from 2002 to 2010. They find no evidence that increasing the minimum compensation standard led to a
decrease in employment in San Francisco.
8
19
Two innovative studies conducted by researchers from UC Berkeley, University MassachusettsAmherst, and UNC-Chapel Hill are especially relevant (Dube, Lester and Reich 2010, 2013;
Allegretto, Dube, Reich and Zipperer 2013). This research team looked at every state and
federal minimum wage increase in the U.S. between 1990 and 2011 and identified several
hundred pairs of adjacent counties that were located on different sides of a state border with a
minimum wage difference.
This research design compares the employment trends of the most affected groups – teens and
restaurants – across adjacent counties that were exposed to different minimum wage levels. It
is therefore an excellent test of whether businesses relocate employment outside county
borders to avoid being subject to a higher minimum wage. Using this research design, Dube,
Lester and Reich (2010, 2013) and Allegretto, Dube, Reich and Zipperer (2013) find no
statistically significant effects of minimum wage increases on either employment or hours in
restaurants and other low-wage industries, controlling for a range of regional and local
differences that previous research did not include.
Allegretto (2013) uses the same dataset to examine the effects of the subminimum wage for
tipped workers (which has remained at $2.13 an hour at the federal level for more than two
decades, but varies significantly across states). Focusing on restaurants, she finds no
statistically significant evidence of negative employment effects in states with higher (or no)
subminimum wages for tipped workers.
We highlight these studies because they combine state-of-the art econometric methods with
the most detailed datasets available, allowing researchers to accurately control for differences
in local economic conditions that could confound the analysis.
That said, the economics literature includes conflicting findings on the employment impacts of
the minimum wage. Even if the employment impacts of minimum wage are zero, we would
expect to find case studies clustered around that point, with some finding positive and others
finding negative impacts (Schmitt 2013). However, most of the broader studies that find
negative effects, as reviewed in Neumark and Wascher (2008), fail a fundamental necessary
condition for identifying statistically unbiased estimates of minimum wage effects. The key
issue is that their research design assumes that states that increase minimum wages are
otherwise not different from those that do not increase minimum wages. Dube, Lester and
Reich (2010) and Allegretto, Dube, Reich and Zipperer (2013) show that this assumption is
incorrect. In the states that increased their minimum wages, employment among low-wage
workers was already growing more slowly two years before the implementation of the
minimum wage increases, compared to states that did not increase minimum wages. Existing
20
differences in regional employment trends that are unrelated to minimum wage policy can
explain the differences in outcomes after the increases. As Allegretto, Dube, Reich and Zipperer
(2013) document, local comparisons make sense because nearby areas are much more similar
than areas that are farther away. And when minimum wage effects are estimated using local
comparisons—such as across adjacent counties on a state border—the negative effect on
employment disappears.10
Belman and Wolfson (2014) provide the most extensive summary of the minimum wage
research since Card and Krueger. They conclude that the employment effects of the minimum
wage in the United States are “both vanishingly small and not statistically significant in even the
most generous test” (p. 168). A separate review of minimum wage research by Schmitt (2013)
similarly finds “the minimum wage has little or no discernible effect on the employment
prospects of low-wage workers.”
Impact on which workers are hired
In his review of minimum wage research, Schmitt (2013) considers several channels through
which employers might adjust to increases in the minimum wage. One possible scenario is that
employers will simply switch to hiring more skilled workers, thereby hurting the employment
prospects of less educated workers and, in particular, black and Latino teens. Schmitt reviews
several studies that have explicitly researched this question, some of which yield conflicting
findings. Again, research design matters a lot here, and studies that thoroughly control for
regional or local differences do not find evidence of labor substitution. For example, Allegretto,
Dube and Reich (2011) examine the impact of the minimum wage on the employment of white,
black, and Hispanic teens, covering the period from 1990 to 2009. After improving on previous
research by controlling for regional differences, they find no statistically significant negative
effects on employment or hours for teens, regardless of race or gender. In their contiguous
counties dataset, Dube, Lester and Reich (2013) similarly find no evidence of such substitution
by either age or gender.
10
A recent report by the Congressional Budget Office (2014) projects that a $10.10 national minimum wage would
raise wages for 16 million Americans, lift 900,000 out of poverty, and result in a reduction in jobs of 500,000. The
report claims to synthesize recent research on teen employment, but it does so without making adjustments for
research quality. The CBO’s estimated elasticity for adult employment is unsupported by the recent empirical
research, including that of Neumark and Wascher (2008), which found no measurable employment impact for
adults.
21
B. Impacts on firms’ costs
The impact of minimum wages on the overall cost structure of a business varies significantly by
industry. The impact of the minimum wage on a firm’s operating costs will depend on the
share of the workforce at or below the new minimum wage rate, their average wage before the
increase, and the share of labor costs in total operating costs. Operating costs include not only
labor, but also materials, rent, maintenance, supplies, taxes, utilities, and energy costs. An
industry may have large numbers of low-wage workers, but if labor is a relatively small share of
the total costs of the firm the wage increase will have a correspondingly small impact on the
overall cost structure of the firm.
In a prospective study of the San Francisco minimum wage, Reich and Laitinen (2003) carried
out a representative survey of establishments. They estimated that a 25.9 percent increase in
the minimum wage from $6.75 to $8.50 would result in a 1.1 percent increase in the overall
wage bill. When viewed from the perspective of operating costs, a 26 percent increase would
result in 82.0 percent of establishments experiencing an increase in operating costs of less than
1 percent or more, and 95.2 percent experiencing an increase in operating costs of less than 5
percent. Breaking down results by industry, they estimated that 17.9 percent of restaurants
would experience an increase in operating costs of 5 percent or more, as would 8.6 percent of
retail establishments. For manufacturing, entertainment, hotel, and personal service firms, the
estimated increase in operating costs was close to zero.
Pollin (2004) similarly estimated that the average increase in firms’ costs relative to sales under
Santa Fe’s 2003 minimum wage ordinance would be 1 percent; the average cost increase for
hotels relative to sales would be 3 percent.
Benner and Jayaraman (2012) analyzed the impact of a proposed increase in the federal
minimum wage from $7.25 to $10.10 (a 39 percent increase, not accounting for inflation during
the phase-in) on the food industry. They estimated a maximum increase in operating costs for
the food service and drinking establishment industry of 2.25 percent over three years, and 1
percent in the retail food industry.
To put these results in context, consider the following hypothetical example of how a 10
percent increase in the minimum wage might affect costs in the restaurant industry. If onethird of restaurant workers were paid exactly the minimum wage or up to no more than 10
percent above the minimum wage (and if wages were evenly distributed), then these workers
would receive a pay increase that would average half of the 10 percent increase in the statutory
minimum. The increase in the wage bill would thus be one-third of 5 percent, or 1.67 percent.
22
Moreover, labor costs comprise about one-third of operating costs in the restaurant industry. A
10 percent increase in the minimum wage would therefore increase operating costs by onethird of 1.67 percent, or 0.56 percent. A larger minimum wage increase would imply a greater
increase in costs. In the retail industry, the proportion of low-wage workers is lower than in
restaurants; the proportion making exactly the minimum wage is also lower; and labor costs are
only about 10 percent of operating costs (compared to about one-third in restaurants). So the
effect on costs in the retail industry would be even smaller. The research results we
summarized above are consistent with these hypothetical examples.
C. Impacts on prices
Since a higher minimum wage applies to all employers, a firm that serves the local market, like
a restaurant, will be able to pass through a share of the higher costs without suffering a
disadvantage relative to its competitors. Belman and Wolfson (2014) survey seven studies of
price effects of the minimum wage, all of which found some impacts on prices in industries
highly affected by the minimum wage, namely restaurants. Dube, Naidu and Reich (2007)
found that restaurant prices in San Francisco rose 2.8 percent more than those in neighboring
Alameda County, following the implementation of a 26 percent increase in the city’s minimum
wage law. Using a very small sample, Hirsch, Kaufman and Zelenska (2011) found that twothirds of the cost increase for quick serve restaurants in Georgia and Alabama were offset by
increases in price. Aaronson (2001) found that a 10 percent increase in the minimum wage
results in a 0.7 percent increase in restaurant prices.
Price effects outside the restaurant industry are largely negligible. Benner and Jayaraman
(2012) provide estimates of price impacts across industries for a $10.10 federal minimum wage
increase. They estimate that if the entire cost were passed through to prices, restaurant prices
would increase 2.5 percent over three years, retail food 1 percent, warehouse and storage and
accommodations 0.7 percent, and administrative and support services 0.9 percent. In most
other industries, price increases could not be detected.
When these small price increases are considered in the context of who receives the wage
increases, research shows a redistribution effect towards lower income families. Jacobs,
Graham-Squire and Luce (2011) estimated the impact of a $12 minimum wage for large
retailers on employees and consumers. They found that if the entire cost were passed through
to consumers, Wal-Mart would increase prices 1.1 percent. The increased costs would be
shared by consumers across the income spectrum, with 28.1 percent borne by shoppers in
lower income households. By contrast, they found that the increase in workers’ earnings would
23
be large and concentrated, with 41.4 percent going to workers in families with incomes below
200 percent of the federal poverty line.
D. Impact on employee turnover
The relationship between low wages and high employee turnover is well documented (Cotton
and Tuttle 1986). In 2011, 37 percent of food service workers and workers in hotels and
accommodations voluntarily quit their jobs (Boushey and Glynn 2012). In an extensive study of
minimum wage impacts on employment flows, Dube, Lester and Reich (2013) found that a 10
percent increase in the minimum wage results in a 2.1 percent reduction in turnover for
restaurant workers and a 2.0 percent reduction in turnover for teens. Dube, Naidu and Reich
(2007) found an increase in the average tenure of workers in limited-service restaurants of
three and a half months.
Three studies analyzed the impact of living wage laws on employee turnover. A study of the
Los Angeles Living Wage Ordinance (Fairris 2005) found a 35 percent reduction in turnover in
firms that increased wages as a result of the law, with an average increase of 23 percent. Reich,
Hall and Jacobs (2005) found an overall decrease in turnover at the San Francisco International
Airport of 60 percent for firms that were highly impacted by mandated pay increases. Turnover
of airport screeners fell by 80 percent following a 55 percent wage increase, from $5.75 to $10
per hour. Howes (2005) found a 17 percent decrease in turnover following a 13 percent wage
increase for homecare workers in San Francisco. Putting the living wage studies together,
Jacobs and Graham-Squire (2010) estimate that for every 1 percent increase in wages in lowwage service positions, turnover declines by an average of 1.45 percent. The impact may be
smaller for broad minimum wage laws where all employers in a market increase their wages at
the same time and the wage difference between firms remains the same (Manning 2011).
Employers incur significant costs from employee turnover. This includes both direct costs for
recruitment, selection, and training of workers and the indirect costs associated with lost sales,
poor customer relations, and lost productivity as new workers learn on the job. The cost of
worker replacement varies based on compensation, firm size, and skill level of the job. Hinkin
and Tracey (2000) conducted a detailed study of non-managerial staff at four hotels, two in
Boston and two in Chicago. Taking into account both direct and indirect costs, they estimated
replacement costs ranging from $1,322 for room service wait staff and $2,077 for a line cook to
$7,658 for an administrative assistant in sales and catering. A study of the cost of supermarket
turnover by the Coca Cola Research Council estimated the replacement cost for an $8 an hour
non-union worker at $4,199 (Blake 2000). Boushey and Glynn (2012) find that the median cost
of replacement for jobs paying $30,000 a year or less is 16.1 percent of an employee’s annual
24
salary. A statistical analysis of California businesses by Dube, Freeman and Reich (2010)
obtained similar results. Jacobs and Graham-Squire (2010) estimate that 18 percent of the
costs of a wage increase for school cafeteria workers would be offset by lower turnover costs.
E. Impacts on firms’ operations and productivity
A higher minimum wage may reduce costs through additional channels that improve firm
performance. In a small case study of quick service restaurants in Georgia and Alabama, Hirsch,
Kaufman and Zelenska (2011) suggest how firms adjust to higher wage mandates. These
authors analyzed detailed payroll data and also surveyed managers and employees about
human resource practices. The authors found no negative effect from the minimum wage
increase on employment or hours worked. Managers reported they could offset 23 percent of
the labor cost increase through operational efficiencies. Ninety percent of the employers
reported they had or would increase performance standards, including requiring better
attendance, requiring more proficient and faster performance of job duties, having workers
take on additional tasks, and more quickly terminating workers who were not performing.
Managers reported economizing on non-labor inputs, including water, electricity, and food
wastage.
Reich, Hall and Jacobs (2005) surveyed employers and employees at the San Francisco
International Airport following the implementation of higher mandated compensation
standards. Employers reported improvements in overall work performance (35%), employee
morale (47%), absenteeism (29%), reductions in grievances (45%), reductions in disciplinary
issues (44%), improvements in equipment maintenance (29%), reductions in equipment
damage (24%), and improvements in customer service (45%). Employees reported that more
skills were required of them (50%), that they were working harder on the job (44%), that they
were experiencing greater stress on the job (43%) and that the pace of work had increased
(37%).
F. Impacts on retail businesses
The retail industry is the second most intensive user of minimum wage and near-minimum
wage workers (after Accommodation and Food Services). A few studies have examined the
effects of minimum wages on the retail sector. In her research on the retail industry, Zeynep
Ton (2012) finds that highly successful retail chains “not only invest heavily in store employees
but also have the lowest prices in their industries, solid financial performance and better
customer service than their competitors.” Using County Business Patterns data and their
border-county pair research design, Dube, Lester and Reich (2010) found no negative effects of
25
minimum wages on retail employment. In a related study, Dube et al. (2006) compared the
number of national retailers operating in San Francisco before and after the city minimum wage
policy was implemented. They found that the number of top retailers grew, as did the number
of stores. Overall retail employment did not decline in San Francisco or Santa Fe, nor did
employment in individual retail sectors, such as grocery stores, general merchandise stores, or
clothing and accessories.11
G. Impacts on health benefits and pensions
If employers are required to increase their wages, they may compensate by reducing other
benefits. For this reason, some of the local minimum wage laws count contributions towards
health care towards meeting the minimum compensation requirement. Schmitt (2013)
summarizes the empirical research, finding “small or no effects along these lines,” either on the
receipt of health insurance, on provision of family health insurance, or whether or not the
employer paid the full premium. Dube, Naidu and Reich (2007) did not detect any decrease in
the provision of health benefits in restaurants in San Francisco. 12 Belman and Wolfson’s (2014)
detailed survey of minimum wage research found that the evidence was “thin,” and that any
effect on health insurance provision was concentrated in smaller firms. They find no impact on
employer-provided pensions, which is not surprising given that this benefit is rare among lowwage workers. Since the provision of employment-based health benefits are closely correlated
with wage, effects could be larger at higher minimum wage rates.
7. Conclusion
In 1994 David Card and Alan Krueger published a groundbreaking study that changed how many
economists view the minimum wage. Card and Krueger (1994) looked at employment in fastfood restaurants across the New Jersey and Pennsylvania border after New Jersey increased its
state minimum wage. They found no measurable negative impact on employment. As we
reviewed above, a large body of research has since built upon their methodology. As a result,
we have learned a great deal about how employers respond to increases in the minimum wage.
First, paying workers more can change their work performance. It can change their productivity,
their attitude about their job, how hard they work, and their ability to make it to the job on
time. Second, low-wage labor markets have high levels of job churning. Turnover levels are
high as workers leave jobs looking for better wages or because they are unable to stay in their
11
However, data were not available for comparisons to areas not covered by the minimum wage policy.
Their surveys were carried out sufficiently prior to San Francisco’s proposal to establish an employer minimum
health spending requirement to avoid any contamination of the results.
12
26
jobs due to poverty-related problems such as difficulties with transportation, child care, or
health. As a result, rather than eliminating jobs, raising the minimum wages can reduce
turnover and increase job stability. Third, firms can absorb higher labor costs through other
means as well. They can pass on some of the increased costs to consumers through higher
prices or earn lower profits. In short, firms use a combination of strategies to adjust to higher
minimum wages without cutting jobs or hours (Schmitt 2013).
Nonetheless, it is important to emphasize again that the existing research literature is
necessarily limited to the range of minimum wage increases that have been actually been
implemented. While these studies are suggestive, they cannot tell us what might occur when
minimum wages are increased significantly beyond existing local, state, or federal mandates.
Finally, raising the minimum wage is not a cure-all, especially in the face of larger forces
generating inequality that require national attention. Still, our assessment of the research
evidence is that these policies have worked well. They raise the incomes of low-wage workers
and their families. The costs to businesses are absorbed largely by reduced turnover costs and
by small price increases among restaurants. Additional benefits, such as reduced spending on
public assistance programs and the local stimulus of additional spending by low-income
families, might also occur. But we do not yet have enough definitive research on these effects.
27
References
Aaronson, Daniel. 2001. “Price Pass-Through and the Minimum Wage.” The Review of Economics and
Statistics 83(1): 158-169.
Aaronson, Daniel and Eric French. 2013. “How Does a Federal Minimum Wage Hike Affect Aggregate
Household Spending?” The Federal Reserve Bank of Chicago, Chicago Fed Letter, August 2013, Number
313. Available at:
http://www.chicagofed.org/digital_assets/publications/chicago_fed_letter/2013/cflaugust2013_313.pdf
Allegretto, Sylvia. 2013. “Waiting for Change: Is It Time to Increase the $2.13 Subminimum Wage?”.
Working Paper No. 155-13, Institute for Research on Labor and Employment, UC Berkeley. Available at:
http://www.irle.berkeley.edu/workingpapers/155-13.pdf
Allegretto, Sylvia, Marc Doussard, Dave Graham-Squire, Ken Jacobs, Dan Thompson and Jeremy
Thompson. 2013. “Fast Food, Poverty Wages: The Public Cost of Low-Wage Jobs in the Fast-Food
Industry.” UC Berkeley Labor Center. Available at:
http://laborcenter.berkeley.edu/publiccosts/fastfoodpovertywages.shtml.
Allegretto, Sylvia, Arindrajit Dube and Michael Reich. 2011. “Do Minimum Wages Really Reduce Teen
Employment? Accounting for Heterogeneity and Selectivity in State Panel Data.” Industrial Relations
50(2): 205-240.
Allegretto, Sylvia, Arindrajit Dube, Michael Reich and Ben Zipperer. 2013. “Credible Research Designs for
Minimum Wage Studies.” Working Paper, Institute for Research on Labor and Employment, UC
Berkeley. Available at: http://www.irle.berkeley.edu/workingpapers/148-13.pdf.
Autor, David, Alan Manning and Christopher Smith. 2010. “The Contribution of the Minimum Wage to
U.S. Wage Inequality over Three Decades: A Reassessment.” Unpublished Manuscript, MIT Department
of Economics. Available at http://economics.mit.edu/files/3279.
Belman, Dale and Paul J. Wolfson. 2014. New Minimum Wage Research. Kalamazoo, MI: W.E. Upjohn
Institute for Employment Research. Forthcoming.
Benner, Chris and Saru Jayaraman. 2012. “A Dime a Day: The Impact of the Miller/Harkin Minimum
Wage Proposal on the Price of Food.” University of California Berkeley Food Labor Research Center,
Food Chain Workers Alliance and Restaurant Opportunities Center. Available at:
http://laborcenter.berkeley.edu/foodlabor/price_food12.pdf
Bernhardt, Annette, Anmol Chaddha and Siobhan McGrath. 2008. “When Work Doesn’t Pay: The Public
Cost of Low-Wage Jobs in New York State.” Technical Report, National Employment Law Project.
Available at: http://www.nelp.org/page/-/EJP/PublicCostReport08.pdf?nocdn=1.
Bernstein, Jared and John Schmitt. 1998. “Making Work Pay: The Impact of the 1996-97 Minimum Wage
Increase.” Economic Policy Institute. Available at: http://www.epi.org/publication/studies_stmwp/.
Blake, Frank. 2000. “New Ideas for Retaining Store-Level Employees,” Coca-Cola Research Council.
Atlanta, GA.
28
Boushey, Heather and Sarah Jane Glynn. 2012. “There are Significant Business Costs to Replacement
Employees.” Center for American Progress. Available at: http://www.americanprogress.org/wpcontent/uploads/2012/11/CostofTurnover.pdf.
Brown, Charles 1999. “Minimum Wages, Employment, and the Distribution of Income.” In Orley
Ashenfelter and David Card, eds. Handbook of Labor Economics, Vol. 3. New York: Elsevier
Card, David and Alan B. Krueger 1994. “Minimum Wage and Employment: A Case Study of the Fast-Food
Industry in New Jersey and Pennsylvania.” American Economic Review 84, 4: 772-93.
Center on Wisconsin Strategy. 2006. “When Work Doesn’t Pay: The Public Cost of Low-Wage Jobs in
Wisconsin.” Center on Wisconsin Strategy, University of Madison-Wisconsin. Available at:
http://laborcenter.berkeley.edu/publiccosts/when_work_doesnt_pay.pdf.
Colla, Carrie, William Dow and Arindrajit Dube. 2014. “Health Spending Requirements in San Francisco.”
In Michael Reich, Ken Jacobs and Miranda Dietz (eds.) When Mandates Work: Raising Labor Standards
at the Local Level, pp. 125-155. Berkeley CA: University of California Press.
Congressional Budget Office. 2014. “The Effect of a Minimum-Wage Increase on Employment and Family
Income.” Washington DC. Available at
http://www.cbo.gov/sites/default/files/cbofiles/attachments/44995-MinimumWage.pdf.
Cooper, David. 2013. “Raising the Federal Minimum Wage to $10.10 Would Lift Wages for Millions and
Provide a Modest Economic Boost.” Economic Polity Institute. Available at:
http://www.epi.org/publication/raising-federal-minimum-wage-to-1010/.
Cotton, John L. and Jeffery M. Tuttle. 1986. “Employee Turnover: A Meta-Analysis and Review with
Implications for Research.” Academy of Management Review 11(1): 55-70.
Council of Economic Advisers. 2014. “The Economic Case for Raising the Minimum Wage.” February 12,
2014. Available at: http://www.whitehouse.gov/blog/2014/02/12/economic-case-raising-minimumwage.
Dietz, Miranda, Donna Levitt and Ellen Love. 2014. “Enforcement of Labor Standards.” In Michael Reich,
Ken Jacobs and Miranda Dietz (eds.) When Mandates Work: Raising Labor Standards at the Local Level,
pp. 229-255. Berkeley CA: University of California Press.
Dube, Arindrajit. 2013. “Minimum Wages and the Distribution of Family Income.” University of
Massachusetts Amherst and IZA. Unpublished working paper. Available at:
https://dl.dropboxusercontent.com/u/15038936/Dube_MinimumWagesFamilyIncomes.pdf.
Dube, Arindrajit, Eric Freeman and Michael Reich. 2010. "Employee Replacement Costs." IRLE Working
Paper 201-10, UC Berkeley. Available at: http://www.irle.berkeley.edu/workingpapers/201-10.pdf.
Dube, Arindrajit, Ethan Kaplan, Michael Reich and Felix Su. 2006. “Do Businesses Flee Citywide Minimum
Wages? Evidence from San Francisco and Santa Fe.” Institute of Industrial Relations Policy Brief, UC
Berkeley. Available at:
http://www.irle.berkeley.edu/research/minimumwage/minwage_sfandsantafe.pdf.
29
Dube, Arindrajit, T. William Lester, and Michael Reich. 2010. "Minimum Wage Effects Across State
Borders: Estimates Using Contiguous Counties." Review of Economics and Statistics 92(4): 945-964.
Dube, Arindrajit, T. William Lester, and Michael Reich. 2013. "Minimum Wage Shocks, Employment
Flows and Labor Market Frictions." Working Paper, Institute for Research on Labor and Employment,
University of California Berkeley. Available at: http://escholarship.org/uc/item/76p927ks.
Dube, Arindrajit, Suresh Naidu, and Michael Reich. 2007. "The Economic Effects of a Citywide Minimum
Wage." Industrial and Labor Relations Review 60(4): 522-543.
Dube, Arindrajit, Suresh Naidu, and Michael Reich. 2014. “Labor Market Impacts of San Francisco’s
Minimum Wage.” In Michael Reich, Ken Jacobs and Miranda Diets (eds.) When Mandates Work: Raising
Labor Standards at the Local Level, pp. 47-69. Berkeley CA: University of California Press.
Fairris, David. 2005. “The Impact of Living Wages on Employers: A Control Group Analysis of the Los
Angeles Ordinance.” Industrial Relations 44(1): 84-105.
Giuliano, Laura. 2013. “Minimum Wage Effects on Employment, Substitution, and the Teenage Labor
Supply: Evidence from Personnel Data.” Journal of Labor Economics 31(1): 155-194.
Hinkin, Timothy R. and J. Bruce Tracey. 2000. “The Cost of Turnover: Putting a Price on the Learning
Curve.” Cornell Hotel and Restaurant Administration Quarterly 41(14): 18-19.
Hirsch, Barry T., Bruce Kaufman, and Tetyana Zelenska. 2011. "Minimum Wage Channels of
Adjustment." IZA Discussion Paper No. 6132. Institute for the Study of Labor. Available at:
http://www2.gsu.edu/~ecobth/IZA_HKZ_MinWageCoA_dp6132.pdf.
Howes, Candace. 2005. “Living Wages and Retention of Homecare Workers in San Francisco.” Industrial
Relations 44(1): 139-163.
Jacobs, Ken and Dave Graham-Squire. 2010. “Labor Standards for School Cafeteria Workers, Turnover
and Public Program Utilization.” Berkeley Journal of Employment and Labor Law 21(2): 447-458.
Jacobs, Ken, Dave Graham-Squire and Stephanie Luce. 2011. “Living Wage Policies and Big Box Retail.”
Research Brief, Center for Labor Research and Education, University of California Berkeley. Available at:
http://laborcenter.berkeley.edu/retail/bigbox_livingwage_policies11.pdf.
Jacobs, Ken and Michael Reich. 2014. “When do Mandates Work.” In Michael Reich, Ken Jacobs and
Miranda Diets (eds.) When Mandates Work: Raising Labor Standards at the Local Level, pp. 1-43.
Berkeley CA: University of California Press.
Johnson, David, Jonathan Parker and Nicholas Soueles. 2004. “Household Expenditure and the Income
Tax Rebates of 2001.” Working Paper 10784, National Bureau of Economic Research. Available at:
http://www.nber.org/papers/w10784.pdf?new_window=1
Lantsberg, Alex. 2003. “Assessing the Distribution of Wage Increases and Answering Public Policy
Questions Regarding a San Francisco Minimum Wage.” UC Berkeley Labor Center. Available at:
http://laborcenter.berkeley.edu/minwage/minwage.pdf.
30
Lee, David. 1999. “Wage Inequality in the United States During the 1980s: Rising Dispersion or Falling
Minimum Wage?” Quarterly Journal of Economics 114(3): 977‐1023.
Lee, David, and Emmanuel Saez. 2012. “Optimal Minimum Wage Policy in Competitive Labor Markets.”
Journal of Public Economics 96(9): 739–749.
Manning, Alan. 2011. “Imperfect Competition in the Labor Market.” In O. Ashenfelter & D. Card (eds.),
Handbook of Labor Economics. Elsevier, ed. 1, vol. 4, no. 5.
National Employment Law Project. 2012. Reviewing the Research on Citywide Minimum Wage Increases.
Research Analysis.
Neumark, David and William Wascher. 2006. "Minimum Wages and Employment: A Review of Evidence
from the New Minimum Wage Research." National Bureau of Economic Research Working Paper 12663.
Cambridge, MA: National Bureau of Economic Research. http://www.nber.org/papers/w12663.
Neumark, David and William Wascher. 2008. Minimum Wages. Cambridge: MIT Press.
Neumark, David and William Wascher. 2011. “Does a Higher Minimum Wage Enhance the Effectiveness
of the Earned Income Tax Credit?” Industrial and Labor Relations Review 64(4): 712-46.
Pollin, Robert. 2004. Expert Report submitted in New Mexicans for Free Enterprise v. City of Santa Fe,
No. D-0101-CV-2003-468 (N.M. 1st Jud. Dist Ct., Mar. 9, 2004).
Pollin, Robert and Jeannette Wicks-Lim. 2005. “Comments on Aaron Yelowitz, ‘Santa Fe’s Living Wage
Ordinance and the Labor Market’.” Political Economy Research Institute, Working Paper. Available at:
http://scholarworks.umass.edu/cgi/viewcontent.cgi?article=1085&context=peri_workingpapers
Potter, Nicholas. 2006. “Measuring the Employment Impacts of the Living Wage Ordinance Santa Fe,
New Mexico.” University of New Mexico, Bureau of Business and Economic Research. Available at:
https://bber.unm.edu/pubs/EmploymentLivingWageAnalysis.pdf
Reich, Michael. 2012. "Raising the Minimum Wage in San Jose: Benefits and Costs." Policy Brief, Center
for Wage and Employment Dynamics, IRLE, UC Berkeley. Available at:
http://www.irle.berkeley.edu/cwed/briefs/2012-01.pdf.
Reich, Michael, Peter Hall and Ken Jacobs. 2005. “Living wage Policies at the San Francisco Airport:
Impacts on Workers and Businesses.” Industrial Relations 44(1): 106-138.
Reich, Michael, Ken Jacobs and Miranda Dietz (eds.) 2014. When Mandates Work: Raising Labor
Standards at the Local Level. Berkeley CA: University of California Press.
Reich, Michael and Amy Laitinen. 2003. “Raising Low Pay in a High Income Economy: The Economics of a
San Francisco Minimum Wage.” University of California Berkeley, Institute for Research on Labor and
Employment, Report for the San Francisco Board of Supervisors. Available at:
http://irle.berkeley.edu/research/minimumwage/minwage_may03.pdf
31
Reynis, Lee, Myra Segal and Molly Bleeker. 2005. “Preliminary Analysis of the Impacts of the $8.50
Minimum Wage on Santa Fe Businesses, Workers and the Santa Fe Economy.” University of New
Mexico, Bureau of Business and Economic Research. Revised December 27, 2005.
Rothstein, Jesse. 2010. “Is the EITC as Good as an NIT? Conditional Cash Transfers and Tax Incidence.”
American Economic Journal: Economic Policy 2(1): 177–208.
Schmitt, John. 2013. “Why Does the Minimum Wage Have No Discernible Effect on Employment?”
Center for Economic and Policy Research. Available at:
http://www.cepr.net/documents/publications/min-wage-2013-02.pdf
Schmitt, John and David Rosnick. 2011. “The Wage and Employment Impact of Minimum-Wage Laws in
Three Cities.” Center for Economic and Policy Research. Available at:
http://www.cepr.net/documents/publications/min-wage-2011-03.pdf
Theodore, Nik and Marc Doussard. 2006. “The Hidden Public Cost of Low-Wage Work in Illinois.” Center
for Urban Economic Development, University of Illinois at Chicago. Available at:
http://www.urbaneconomy.org/sites/default/files/HiddenPublicCostMain.pdf.
Ton, Zeynep. 2012. “Why ‘Good Jobs’ Are Good for Retailers.” Harvard Business Review 90(1/2): 124131.
West, Rachel and Michael Reich. 2014. “The Effects of Minimum Wages on SNAP Enrollments and
Expenditures.” Center for American Progress. Available at:
http://www.americanprogress.org/issues/economy/report/2014/03/05/85158/the-effects-ofminimum-wages-on-snap-enrollments-and-expenditures/
Wicks-Lim, Jeannette. 2006. “Mandated Wage Floors and the Wage Structure: New Estimates of the
Ripple Effects of Minimum Wage Laws.” Working Paper Number 116, Political Economy Research
Institute. Available at:
http://scholarworks.umass.edu/cgi/viewcontent.cgi?article=1092&context=peri_workingpapers.
Yelowitz, Aaron. 2005a. “Santa Fe’s Living Wage Ordinance and the Labor Market.” Employment Policies
Institute. Available at: http://www.epionline.org/studies/yelowitz_09-2005.pdf
Yelowitz, Aaron. 2005b. “How Did the $8.50 Citywide Minimum Wage Affect the Santa Fe Labor
Market?” Employment Policies Institute. Available at: http://www.epionline.org/studies/yelowitz_122005.pdf
Yelowitz, Aaron. 2012. “The Labor Market Effects of Citywide Compensation Floors.” Employment
Policies Institute. Available at: http://www.epionline.org/studies/yelowitz_12-2005.pdf
Zabin, Carol, Arindrajit Dube and Ken Jacobs. 2004. “The Hidden Public Costs of Low-Wage Jobs in
California.” Institute for Labor and Employment, University of California, Berkeley. Available at:
http://escholarship.org/uc/item/9hb1k75c.
32
Figure 1. Inflation-Adjusted Hourly Wages for the 10th Decile of Bay Area Workers
SF minimum
wage
$12.00
$11.00
San Francisco
$10.00
Surrounding counties
(weighted average)
$9.00
$8.00
2003
2004
2005
2006
2007
2008
2009
2010
2011
2012
th
10 percentile hourly real wages, 2003-2012 in 2012 dollars
Surrounding counties include San Mateo, Santa Clara, and Alameda counties
Figure 2. Bay Area Restaurant Employment
Minimum wage
60,000
Paid sick
leave
Health spending
requirement
San Francisco
50,000
Surrounding counties
(weighted average)
40,000
30,000
20,000
10,000
0
2001.1 2002.1 2003.1 2004.1 2005.1 2006.1 2007.1 2008.1 2009.1 2010.1 2011.1
Shaded areas indicate recession.
Surrounding counties include San Mateo, Santa Clara, and Alameda counties
Table 1. Current Local Minimum Wage Laws
Albuquerque, NM
Date
Passed
How
Enacted
Date First
Implemented
Geographic
Scope
Current
Value
Remaining
phase-in
Indexed?
To What (Specific CPI)
11/6/2012
ballot
1/1/2013
city
$8.60
n/a
yes
CPI for Urban Wage Earners and Clerical Workers,
U.S. City Average for All Items
legislative
7/1/2013
unincorporated
areas outside city
limits
$8.50
n/a
yes
Consumer Price Index
(superseded
previous law
from 2006)
Bernalillo County, NM
4/23/2013
(superseded
previous law
from 2006)
Montgomery County, MD
11/26/2013
legislative
10/1/2014
county
$8.40
(in Oct 2014)
$11.50
(in Oct
2017)
no
n/a
Prince George's County,
MD
12/17/2013
legislative
10/1/2014
county
$8.40
(in Oct 2014)
$11.50
(in 2017)
no
n/a
San Francisco, CA
11/4/2003
ballot
1/1/2004
city
$10.74
n/a
yes
CPI for Urban Wage Earners and Clerical Workers
for the San Francisco-Oakland-San Jose, CA
Metropolitan Statistical Area
San Jose, CA
11/6/2012
ballot
3/11/2013
city
$10.15
n/a
yes
CPI for Urban Wage Earners and Clerical Workers,
U.S. City Average for All Items
Santa Fe, NM
2/27/2003
legislative
6/25/2004
city
$10.66
n/a
yes
CPI for the Western Region for Urban Wage
Earners and Clerical Workers
Santa Fe County, NM
2/25/2014
legislative
4/26/2014
unincorporated
areas outside city
limits
$10.66
(in April 2014)
n/a
yes
CPI for the Western Region for Urban Wage
Earners and Clerical Workers
Washington D.C.
1/15/2014
legislative
7/1/2014
city
$9.50
(in July 2014)
$11.50
(in July
2016)
yes
Consumer Price Index for All Urban Consumers in
the Washington Metropolitan Statistical Area
(superseded
previous law
from 2004)
Table 2. Detailed Wage Increases in Local Minimum Wage Laws
Locality (date of enactment)
Pre1st
1st
%
2nd
2nd
%
ordinance min wage min wage increase min wage min wage increase
min wage
DATE
DATE
Albuquerque (2006)
$5.15
$6.75
1/1/07
31.1
Albuquerque (2012)
$7.50
$8.50
1/1/13
13.3 *
Bernalillo County (2006)
$5.15
$6.75
1/07
Bernalillo County (2013)
$7.50
$8.00
Montgomery County (2013)
$7.25
Prince George's County (2013)
3rd
3rd
%
4th
4th
min wage min wage increase min wage min wage
DATE
DATE
%
increase
$7.15
1/1/08
5.9
$7.50
1/1/09
4.9
31.1
$7.15
1/1/08
5.9
$7.50
1/1/09
4.9
7/1/13
6.7
$8.50
1/1/14
6.3 *
$8.40
10/1/14
15.9
$9.55
10/1/15
13.7
$10.75
10/1/16
12.6
$11.50
10/1/17
7.0
$7.25
$8.40
10/1/14
15.9
$9.55
10/1/15
13.7
$10.75
10/1/16
12.6
$11.50
10/1/17
7.0
San Francisco (2003)
$6.75
$8.50
2/24/04
25.9 *
San Francisco (2003)
nonprofits and small businesses
(implementation delayed until 2005)
$6.75
$7.75
1/1/05
14.8
$8.82
1/1/06
13.8 *
San Jose (2012)
$8.00
$10.00
3/11/13
25.0 *
Santa Fe (2003)
large businesses only
$5.15
$8.50
6/25/04
65.0
$9.50
1/1/06
11.8 *
Santa Fe (2003)
small businesses
(not covered until 2008)
$5.85
$9.50
1/1/08
62.4 *
Santa Fe County (2014)
$7.50
$10.66
4/27/14
42.1 *
Washington D.C. (2004)
$6.15
$6.60
4/8/05
7.3
$7.00
1/1/06
6.1
$7.55
7/24/08
7.9 **
$8.25
7/24/09
9.3 **
Washington D.C. (2014)
$8.25
$9.50
7/1/14
15.2
$10.50
7/1/15
10.5
$11.50
7/1/2016
9.5 *
* Indexed to CPI thereafter
** Minimum wage level tied to increase in the federal minimum wage
Table 3. Total Mandated Wage Increases in Local Minimum Wage Laws
Total
percentage
increase
Phase-in
Albuquerque (2006)
45.6
yes
Albuquerque (2012)
13.3
no
Bernalillo County (2006)
45.6
yes
Bernalillo County (2013)
13.3
yes
Montgomery County (2013)
48.3
yes
Prince George's County (2013)
58.6
yes
San Francisco (2003)
Initial increase delayed implementation for nonprofits and small
businesses
25.9
no
30.7
yes
San Jose (2012)
25.0
no
Santa Fe (2003)
Only large businesses were covered until 2008
84.5
yes
Small businesses were covered in 2008
62.4
no
Santa Fe County (2014)
42.1
no
Washington D.C. (2004)
34.1
yes
Washington D.C. (2014)
39.4
yes
Average, total ordinance increase
41.4
Average, per-step increase
16.7
Locality (date of enactment)
Nonprofits and small businesses phased-in in 2005
Table 4. Coverage and Exemptions of Local Minimum Wage Laws Specified in Ordinances
Business Coverage
Albuquerque
•
•
Bernalillo County •
•
Montgomery
County
Prince George’s
County
Business Exemptions
Worker Coverage
•
any employer required to have a business
license or business registration from the
city of Albuquerque and who directly or
indirectly employs or exercises control over
the wages, hours or working conditions of
any employee
includes part-time,
seasonal, and temporary
workers
specifically includes the city of
Albuquerque
•
any person required to have a business
registration from Bernalillo County and
who directly or indirectly employs or
exercises control over the wages, hours or
working conditions of any employee
includes part-time,
seasonal, and temporary
workers
specifically includes the county as an
employer
•
businesses that employ two or more
persons in the county
•
includes Montgomery County government
•
any employer in Prince George's County
•
includes governmental units
•
“employer” includes a person who acts
directly or indirectly in the interest of
another employer with an employee
•
excludes US government, •
state government, or any
other local government
those who perform work
in the county
Worker Exemptions
•
persons working fewer than 2 hours a week in the city
•
those excluded from the definition of employee under
[section of NM statutes dealing with agricultural
workers] in the NM Minimum Wage Act (except those
employed by the City of Albuquerque)
•
interns working for academic credit or work-study
students
•
those who received certificate from state labor
commissioner pursuant to [statute dealing with
workers with disabilities]
•
persons working fewer than 2 hours a week within the
unincorporated limits of the county
•
those excluded from the definition of employee under
[section of NM statutes dealing with agricultural
workers] in the NM Minimum Wage Act (except those
employed by the county of Bernalillo)
•
interns working for academic credit or work-study
students
•
those who received certificate from state labor
commissioner pursuant to [statute dealing with
workers with disabilities]
•
those employed by parent, spouse, or sibling
•
those performing babysitting services in the
employer's home on a casual basis
•
any employee under the age of 16
•
those exempt from state or federal minimum wage
•
those under age 19 and employed no more than 20
hours per week
•
those subject to an opportunity wage under state or
federal act
•
•
those exempt from state or federal minimum wage
those under age 19 and employed no more than 20
hours per week
Business Coverage
San Francisco
San Jose
Santa Fe
•
•
Business Exemptions
work performed in the city of San Francisco •
any business with a facility in San Jose or
that is required to pay the San Jose
business tax must pay minimum wage for
work performed in the city of San Jose
•
•
work performed in the
city of San Francisco
•
parents, spouses, children of employers
•
•
undocumented workers
those not eligible for state minimum wage
•
•
those covered by
collective bargaining
agreement, but this can
be waived
those who work fewer than 2 hours a week in the city
employers who neither
have a facility within San
Jose nor are subject to
the San Jose business tax
•
work performed in the
city of San Jose
•
parents, spouses, children, domestic partners of
employers
•
undocumented workers
•
those not eligible for state minimum wage
•
those covered by
collective bargaining
agreement, but this can
be waived
•
those who work fewer than 2 hours a week in the city
•
specifically includes
•
contingent or contracted
workers, or those working •
through temporary
service agencies
•
state and federal agencies including school •
districts when the work performed is not
related to their governmental function
•
the city of Santa Fe (for its full-time
permanent workers, but this may be
superseded by union contracts)
•
businesses with <25
employees exempted
until 2008
•
contractors, including construction service
but excluding purchase of goods, for work
with the city >= $30,000 (for both direct
employees and subcontractors)
•
nonprofits whose primary
source of funds is from
Medicaid waivers
businesses receiving economic
development assistance >$25,000, for the
duration of the assistance
•
businesses required to have a business
license or business registration from the
city of Santa Fe
Worker Exemptions
nonprofit and small
businesses (<10
employees) exempt in
year one only; phased in
year 2; year 3 same as
other businesses
•
•
Worker Coverage
state and federal agencies
including school districts,
when the work
performed is related to
their government
function
•
persons related by blood or marriage to their
employer
interns working for academic credit at an accredited
school
persons working in connection with a court-ordered
community service program
workers in an apprenticeship program in a 501c(3)
organization
Business Coverage
Santa Fe County
Washington D.C.
•
businesses required by Santa Fe County
Ordinance to have a business license
•
Santa Fe County government (though this
may be superseded by union contracts)
•
businesses with contracts with Santa Fe
County government for services including
construction services
•
businesses that undertake an economic
development project and execute a project
participation agreement with Santa Fe
County, for the duration of the project
•
any employer in the District of Columbia
Business Exemptions
•
the United States, the
state or any political
subdivision of the state
other than Santa Fe
County
Worker Coverage
Worker Exemptions
•
all part-time, full-time
•
and temporary workers at
covered businesses
•
specifically includes
contingent or contracted
workers, or those working •
through temporary
service agencies
•
federal government
Covers:
•
District of Columbia
government
•
OR
•
Those who spend
more than 50% of
working time in DC
an individual engaged in the activities of an
educational, charitable, religious or nonprofit
organization where the employer-employee
relationship does not exist or where the services
rendered are on a voluntary basis
apprentices in a state- or federally-registered
apprentice program; G.I. bill trainees during training;
"significant" apprenticeships offered by 501C(3)s
•
temporary employees of an educational, charitable or
religious youth camp or retreat where room and board
is provided to the employee, or if a day camp, where
board only is provided; employer needs state
certificate
•
Parent, spouse, child or other member of the
employer's immediate family; the employer shall
include the principal stockholder of a family
corporation
•
Interns working for academic credit at an accredited
school, college or university
•
Persons working in connection with a court-ordered
community service program
•
volunteers in educational, charitable, religious, or
nonprofit organization
•
lay member elected or appointed to office of religious
organization
•
casual babysitter, in or about the residence of the
employer
Those whose
employment is based •
in D.C. and who
•
spend substantial
amount of working
•
time in DC and not
more than 50% of
working time in any
particular state
"handicapped" worker with certificate from US DOL
bona fide executive, administrative or professional, or
outside salesman
newspaper deliverers
Table 5. Treatment of Other Forms of Compensation by Local Minimum Wage Laws Specified in Ordinances
Tipped Workers
Albuquerque
•
tipped wage: $5.16; must be at least 60% of minimum
wage (higher than state tipped minimum wage)
•
employer must make up the difference if wages and tips
don’t add up to the minimum wage (ordinance is specific
about how this will be determined)
•
Commissioned Workers
•
Unclear
•
In earlier ordinance, it had been the same policy as for
tipped workers
•
In 2013 ordinance, the word “tipped” was added as
follows, leaving ambiguity as to whether commissioned
workers had alternative minimum wage:
tipped worker definition: customarily and regularly
receives tips from customers
Montgomery
County
Prince George’s
County
San Francisco
•
tipped wage: $2.13 (federal minimum)
•
employer must make up the difference if wages and tips
don't add up to the minimum wage
•
tipped worker definition: customarily and regularly
receives tips from customers
•
tipped wage: $3.63 (same as state); must be at least half
of the state minimum wage
•
employer must make up the difference if wages and tips
don't add up to the minimum wage
•
tipped worker definition: customarily and regularly
receives more than $30 a month in tips
•
policy is the same as state tipped minimum wage
•
tipped wage: $3.63 (same as state)
•
definition of tipped worker: receives $30 a month in tips
(per state policy: not specified in ordinance)
•
no tip credit
•
If employer provides childcare or healthcare
benefits in excess of annualized rate of
$2,500, the minimum wage is $1.00 per hour
less.
•
If employer provides childcare or healthcare
benefits in excess of annualized rate of
$2,500, the minimum wage is $1.00 per hour
less.
•
employers are allowed to offset a portion of
the minimum wage for housing and meal
costs
“tips or commissions received and retained by a
tipped employee may be counted as wages and
credited toward partial satisfaction of the minimum
wage” [emphasis added]
•
Bernalillo County
Other
if applicable, it is the same as tipped wage: $5.16; must
be at least 60% of minimum wage
•
commissions are considered to be part of wages
•
employer must make up difference if minimum wage not
met during pay period. "Whether the employer may
thereafter recover any amounts based on commissions
•
that the employee earns in a later pay period, or which
are paid at a later date, depends on whether the
•
employer and employee have an enforceable written
agreement"
"non-discretionary performance bonuses"
included in definition of wages
Welfare-to-Work participants' cash benefits
divided by hours worked must be at least
minimum wage; if policy does not allow for
participants' hours to be reduced to meet
the minimum wage requirement, their cash
benefits must be increased
Tipped Workers
San Jose
Santa Fe
Santa Fe County
Washington D.C.
•
no tip credit
Commissioned Workers
Other
•
commissions are considered to be part of wages
•
employer must make up difference if minimum wage not
met during pay period. "Whether the employer may
•
thereafter recover any amounts based on commissions
that the employee earns in a later pay period, or which
are paid at a later date, depends on whether the
•
employer and employee have an enforceable written
agreement"
•
tipped wage: $2.13 (federal minimum)
•
•
tipped worker definition: customarily receive more than
$100 per month in tips
commissioned worker wage: $2.13 (tipped federal
minimum)
•
commissioned worker definition: customarily receive
more than $100 per month in commissions
•
tipped wage: $6.40; must be at least 60% of minimum
wage (higher than state tipped minimum wage)
•
commissioned worker wage: $6.40; must be at least 60%
of minimum wage
•
employer must make up the difference if wages and tips
don't add up to the minimum wage
•
employer must make up the difference if wages and
commissions don't add up to the minimum wage
•
tipped worker definition: customarily and regularly
receive more than $30 a month in tips
•
commissioned worker definition: customarily and
regularly receive more than $30 a month in commissions
•
tipped wage: $2.77
•
•
employer must make up the difference if wages and tips
don't add up to the minimum wage
Minimum wage ordinance is not violated if the employee
works for a retail or service establishment and:
•
the ordinance created a detailed process to validate
earnings of tipped workers
1) the regular rate of pay is in excess of 1.5 times
the minimum hourly rate
AND
2) more than 1/2 of the employee's compensation
for a representative period (not less than 1 month)
represents commission on goods or services
•
•
employers are allowed to offset a portion of
the minimum wage for housing and meal
costs
"non-discretionary performance bonuses"
included in definition of wages
Welfare-to-Work participants' cash benefits
divided by hours worked must be at least
minimum wage.
health benefits and childcare are considered
to be elements of wages

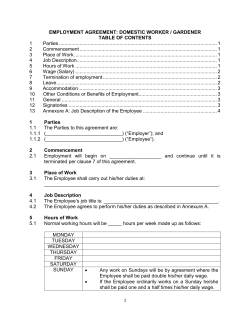


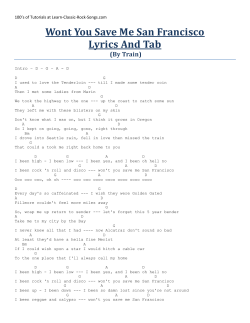
© Copyright 2026