
DEMOCRACY BUILDING AND CIVIC RESPONSIBILITY: AN
DEMOCRACY BUILDING AND CIVIC RESPONSIBILITY: AN ANALYSIS OF TERTIARY STUDENTS` PARTICIPATION IN THE 2009 NATIONAL ELECTIONS FOCUSING ON WINDHOEK A THESIS SUBMITTED IN PARTIAL FULFILMENT OF THE REQUIREMENTS FOR THE DEGREE OF MASTER OF PUBLIC ADMINISTRATION OF THE UNIVERSITY OF NAMIBIA BY EVARISTUS EVARISTUS 200030868 APRIL 2015 Main Supervisor: Dr. Lesley Blaauw Co-supervisor: Prof. Pempelani Mufune ii ABSTRACT The study focused on students understanding and reasons as to why they do not participate in elections to vote. The major problem of the study was student participation in elections which continues to drop when students are considered the future of the country, whilst the electoral commission conducts election campaigns to encourage them to register in order to vote? The major objective of the study was to to investigate why young people are increasingly disengage from politics and their understanding of civic responsibility with regard to participation in Namibian elections. The study adopted a mixed method approach, which involves both quantitative and qualitative research methods. The qualitative approach was used to understand the participant’s knowledge of youth participation in national and presidential elections and general understanding of democracy in the context of Namibia. Data was collected from the key informants that were identified and interviewed. Focus Group Discussions (FGD) were conducted in order to get in-depth understanding of the respondents about voter apathy. Quantitative responses to the questionnaires were classified and tabulated in different categories using the IBM SPSS 20 software. The coded data was analysed by means of One-Way Anova at significance level of .05 in order to determine the relationship of the variables. Significant variables to the study were identified and interpreted accordingly and where possibly linked to literature review to gain a full understanding from both primary research data and secondary research. In addition, frequencies were generated and interpreted, leading to creation iii of different figures. Qualitative data was collected through interviews and FGD and data was coded. The major findings of the study were that there is much that needs to be done by political parties if they are to be in touch with the youths. Most of the youths are not voting because they are not interested in political change. It is recommended that youth voter education is encouraged to eliminate voter apathy in the students category. It is also recommended that there is need to create and develop outreach programmes that attract the students to participate in political activities. It is also recommended that political parties need to engage the youth in political activities in order to generate interest in them to participate in elections. There is also need to harness the media to educate and encourage the youth to use their democratic rights and civic responsibilities through voting. A further research with a wider population and an increase in variables is recommended. iv TABLE OF CONTENTS ABSTRACT............................................................................................................................. ii LIST OF FIGURES .............................................................................................................. viii LIST OF TABLES .................................................................................................................. ix ACKNOWLEDGEMENT ........................................................................................................x DEDICATION ........................................................................................................................ xi DECLARATION ................................................................................................................... xii LIST OF ABBREVIATIONS/ACRONYMS ....................................................................... xiii CHAPTER 1: INTRODUCTION .............................................................................................1 1.1 Orientation of the proposed study ............................................................................ 1 1.2 Statement of the problem ......................................................................................... 3 1.3 Objectives of the study............................................................................................. 3 1.3.1 Research objective ................................................................................................... 3 1.3.2 The specific objectives are: ..................................................................................... 4 1.4 Significance of the study .......................................................................................... 4 1.5 Limitations of the study ........................................................................................... 5 1.6 Chapter outline ......................................................................................................... 5 1.7 Conclusion ............................................................................................................... 5 CHAPTER 2: LITERATURE REVIEW ..................................................................................7 2.1 Introduction .............................................................................................................. 7 2.2 Importance of youth in society................................................................................. 7 2.3 Importance of youth political participation .............................................................. 8 2.4 Democracy building and students participation in elections.................................. 10 2.5 The effect of electoral outcomes on political trust ................................................. 11 2.6 Namibian youth perspective................................................................................... 13 2.7 The importance of political trust ............................................................................ 15 2.8 Generational differences in electoral behaviour .................................................... 20 2.8.1 Generations and life cycles .................................................................................... 20 v 2.8.2 Reasons advanced for the decline in turnout at elections ...................................... 23 2.9 Conclusion ............................................................................................................. 25 CHAPTER 3: RESEARCH METHODOLOGY ....................................................................26 3.1 Introduction ............................................................................................................ 26 3.2 Research design ..................................................................................................... 26 3.3 Population of the study .......................................................................................... 26 3.4 Sampling ................................................................................................................ 27 3.5 Questionnaires format and data collection ............................................................. 29 3.5.1 Focus Group Discussions ...................................................................................... 30 3.5.2 Key Informant Interviews ...................................................................................... 30 3.5.3 Survey .................................................................................................................... 30 3.6 Data Collection Methods ....................................................................................... 31 3.6.1 Key Informant Interviews ...................................................................................... 31 3.6.2 Focus Group Discussions ...................................................................................... 32 3.6.3 Survey .................................................................................................................... 33 3.7 Data Analysis ......................................................................................................... 33 3.8 Ethical Considerations ........................................................................................... 37 3.9 Conclusion ............................................................................................................. 37 CHAPTER 4: RESULTS ........................................................................................................38 4.1 Introduction ............................................................................................................ 38 4.2 General Observation Regarding Respondents ....................................................... 38 4.2.1 Response Rate........................................................................................................ 38 4.2.2. One-Way Anova statistical analysis ..................................................................... 42 4.3 Attitude and practices of the students towards elections ....................................... 45 4.3.1 How important is voting to you? ........................................................................... 45 4.3.2 What are your reasons for voting? ......................................................................... 46 4.4 Students’ understanding of democratic rights and civic responsibilities ............... 49 4.4.1 Likely to vote for the same party ........................................................................... 50 4.4.2 My vote will not make any difference ................................................................... 50 4.4.3 I am not interested in elections .............................................................................. 51 4.4.4 Presidential ............................................................................................................ 51 4.4.5 National Assembly................................................................................................. 52 4.4.6 Local Authority...................................................................................................... 52 4.4.7 I want vote to for change ....................................................................................... 52 4.5 Students satisfaction with current democracy ........................................................ 56 vi 4.5.1 Distrust in the election system ............................................................................... 56 4.5.2 I feel that only those elected benefit ...................................................................... 56 4.5.3 Others..................................................................................................................... 57 4.6 Sources motivating participation in elections ........................................................ 57 4.6.1 How much does media influence ........................................................................... 58 4.6.2 Television .............................................................................................................. 59 4.6.3 Newspaper ............................................................................................................. 59 4.6.4 Reported achievements geared towards national development ............................. 59 4.6.5 Member of any party ............................................................................................. 60 4.6.6 I do not actively participate but I have full membership ....................................... 60 4.6.7 Aware of political party policies ............................................................................ 69 4.6.8 It allows me to vote for the person I want ............................................................. 69 4.6.9 I don’t see its importance ....................................................................................... 70 4.6.10 It is mainly important for democracy .................................................................. 70 4.6.11 Officials to be trusted........................................................................................... 71 4.6.12 Regional Councilors ............................................................................................ 72 4.6.13 Local Authority Councilors ................................................................................. 73 4.6.14 Traditional leaders ............................................................................................... 74 4.6.15 State what is true.................................................................................................. 75 4.6.16 It does not matter what type of government is in power in a democratic state .... 76 4.6.17 A democratic government is preferable to any other kind of government .......... 77 4.7 Conclusion ............................................................................................................. 81 CHAPTER 5: DISCUSSION AND RECOMMENDATIONS...............................................82 5.1 Summary of the findings ........................................................................................ 82 5.2 Research Question 1: What are the attitudes and practices of students towards elections?................................................................................................................ 83 5.3 Research Question 2: Do students understand their democratic rights and civic responsibilities?...................................................................................................... 83 5.4 Research Question 3: Are students satisfied with the way democracy currently works? .................................................................................................................... 83 5.5 Research Question 4: How do students value participating in Presidential and National Elections? ................................................................................................ 84 5.6 Recommendations .................................................................................................. 85 5.6.1 Voter Education ..................................................................................................... 85 5.6.2 Importance of voting.............................................................................................. 86 5.6.3 Media influence in voting ...................................................................................... 86 5.6.4 Lack of trust ........................................................................................................... 86 vii 5.6.5 Party membership .................................................................................................. 87 5.7 Concluding remarks ............................................................................................... 87 REFERENCES .......................................................................................................................89 APPENDIX .............................................................................................................................97 APPENDIX 1: SURVEY QUESTIONNAIRE .................................................................. 97 APPENDIX 2: FOCUS GROUP DISCUSSION SCHEDULE ....................................... 116 APPENDIX 3: KEY INFORMANTS INTERVIEW GUIDE ......................................... 118 APPENDIX 4: ONE – WAY ANOVA STATISTICAL RESULTS ............................... 123 viii LIST OF FIGURES Figure 1: Data Analysis Process (Cresswell, 2009) ................................................... 35 Figure 2: How important is voting to you? ................................................................ 45 Figure 3: Likely to vote for the same party ................................................................ 50 Figure 4: How much does media influence you when voting? .................................. 58 Figure 5: I do not actively participate but I have full membership ............................ 60 Figure 6: It allows me to vote for the person I want .................................................. 69 Figure 7: Officials to be trusted in public office ........................................................ 71 Figure 8: Regional councilors .................................................................................... 72 Figure 9: Local Authority Councilors ........................................................................ 73 Figure 10: Traditional Leaders ................................................................................... 74 Figure 11: Namibia being a Democracy .................................................................... 75 Figure 12: Type of government in power .................................................................. 76 Figure 13: Democratic government ........................................................................... 77 ix LIST OF TABLES Table 1: Educational Institutions ............................................................................... 27 Table 2: Year/Level of Study ..................................................................................... 28 Table 3: Response rate (N= 200) ............................................................................... 38 Table 4: One Way Anova Statistics Results Summary .............................................. 43 Table 5: Source: FGD ................................................................................................ 47 Table 6: Source: FGD ................................................................................................ 53 Table 7: Source: KII ................................................................................................... 54 Table 8: Source: KII ................................................................................................... 61 Table 9: Source: FGD ................................................................................................ 78 Table 10: Source: KII ................................................................................................. 80 x ACKNOWLEDGEMENT My sincere gratitude is expressed to the following people and institutions: My parents, brothers and sisters who did not give up taking care of me and guiding me from day one. My lovely wife and children for their sacrifices, support, and care. All those who directly or indirectly contributed to my studies at The University of Namibia, especially my colleagues and senior leadership. The University of Namibia, especially the Faculty of Economics and Management Science, and all the staff members within the department of political and public administration department. The UNAM Staff Development Unit for the support provided to me in the furthering of my studies. All those who directly or indirectly contributed to the realization of this study, especially my supervisors Dr. L. Blaauw and Prof. P. Mufune, as well as the faculty officers, Ms Sofia Alfred and Ms Desiree Davies, including Dr Cornelia Shaimemanya (Director: Postgraduate School). All those who knowingly or unknowingly care about the Evaristus family. Above all, I thank the Almighty God for protecting me to date and for giving me the courage not to give up despite the tough time. xi DEDICATION First and foremost, I give thanks to the Almighty for having blessed me with a great and supportive family (my wife, daughters, mom and dad, as well as my brothers and sisters) to whom I am dedicating my thesis. A special feeling of gratitude goes to my loving wife, Niita Ndeshipanda Evaristus who supported me throughout the process. Our daughters Celia-Joy and Rose-Jean were a great source of strength and motivation knowing that I am doing it for them. I also want to give gratitude to my colleagues (Prof Hangula Lazarus, Prof Gideon Frednard, Mr Uushona Nabot and Dr Marius Hedimbi) that keep encouraging me in the process and their word really meant a lot to me. Not to forget, my parents for keeping my family in their prayers. xii DECLARATION I, Evaristus Evaristus, declare hereby that this study is a true reflection of my own research, and that this work, or part thereof has not been submitted for a degree in any other institution of higher education. No part of this thesis may be reproduced, stored in any retrieval system, or transmitted in any form, or by means (e.g. electronic, mechanical, photocopying, recording or otherwise) without the prior permission of the author, or The University of Namibia in that behalf. I, Evaristus Evaristus, grant The University of Namibia the right to reproduce this thesis in whole or in part, in any manner or format, which The University may deem fit, for any person or institution requiring it for study and research; providing that The University of Namibia shall waiver this right if the whole thesis has been or is being published in a manner satisfactory to the University. ___________________ Evaristus Evaristus __________________ Date xiii LIST OF ABBREVIATIONS/ACRONYMS DDB - Division Democracy Building DTA - Democratic Turnhalle Alliance ECN - Electoral Commission of Namibia FGD - Focus Group Discussion HIV/AIDS Human Immunodeficiency Virus Infection / Acquired Immunodeficiency Syndrome IBM - International Business Machines Corporation IUM - International University of Management KAP - Knowledge Attitudes and Practices KII - Key Informants Interviews MSC - Monitronics Success Colleague NDP - National Development Plan NUDO - National Unity Democratic Organisation NYC - National Youth Council PoN - Polytechnic of Namibia RDP - Rally for Democracy SPSS - Statistical Package for the Social Sciences SWAPO - South West Africa People’s Organization UNAM - University of Namibia Main Campus UNAMKC - University of Namibia Khomasdal Campus 1 CHAPTER 1: INTRODUCTION 1.1 Orientation of the proposed study The youth are said to be the future of a country, “it is therefore important to understand the attitudes and opinions of youth on elections because it will allow us to take a peek in the political future of the country” (Keulder and Van Zyl, 2001, p.13). Among the youth, students are considered to be more progressive in society since they are more mobile and active job seekers. Because they are more exposed to modernity especially through the education system, they can easily challenge traditional values surrounding political culture. Braungart and Braungart (1986, p.24), define the youth stage as “the period of late adolescence and early adulthood”, which is important from a political perspective because it is at that time that youth enter tertiary education, transit into adulthood and start engaging in political activities. Students are an important segment of society because they can articulate policy shortcomings and can help shape youth demands. According to Keulder and Van Zyl (2001, p.13), past studies in Namibia suggest that “Namibian youth are not very active in politics”. Their level of participation is low and only a handful shows interest in public and political affairs. The study aims to analyse student knowledge, attitudes and practices towards elections in the hope of uncovering reasons for their low participation in public affairs. There is a current generation in Namibia (commonly referred to as the born-free generation) that participated in the 2009 Presidential and National elections. Their views and 2 opinions towards elections as instruments that build and consolidate democracy are sought for in this study. An election is a process of decision-making by which a population chooses an individual to hold formal office. Moreover, an election is the usual mechanism in a modern democracy which allows elected officials to occupy, amongst other, offices in the legislature, regional and local government. The elections of leaders are also critical in Namibian politics. Similarly, in Canada “the key to encouraging young Canadians to participate in politics is to get them to tune in by getting them directly involved in political activities” (Gidengil et al, 2003, p.34). “The more education young people have, the more interested they are in politics and the more likely they are to vote, to join groups working for change and to be active in their communities” (Gidengil et al, 2003, p.36). Gidengil et al, (2003, p.37) argue that “education not only equips citizens with the cognitive skills that active youth engagements require, but it also seems to install norms of civic obligation”. Zolberg (1969, p.204) affirms this by expressing that, “although generational political and intellectual politics are separate phenomena, in practice they occur simultaneously in many new nations”. They commonly share the same civic aspects of responsibility and social expectations. “The sudden acceleration of all other processes of social change after World War II intensified the disparity between the socialization processes carried on by the family, least affected by these changes, and the secondary socialization which children and young people experience through newly available educational, occupational and political agencies” (Zolberg 1969, p.205). The sudden acceleration of social change did not leave civic responsibility by students untouched and this 3 applies to the born free generation of Namibia that voted in the 2009 presidential and national elections. 1.2 Statement of the problem It is generally perceived that young people are increasingly disengaging from politics and feel alienated from political institutions and leaders by not turning out at elections. They also fail to participate in elections in sufficiently large numbers. The afore-mentioned similarly applies in Namibia notwithstanding the fact that the youth were at the forefront of the fight for independence. The youth, in general, and students in particular, are also considered as future leaders. Preliminary voters’ registration is conducted to accommodate new eligible voters, especially those that have reached the voting age category. In cases where students register some do not even bother to turn up at polling stations. Why is student participation in elections dropping when students are considered the future of the country, and the electoral commission conducts election campaigns to encourage them to register in order to vote? This study looks at student understanding and reasons as to why they do not participate in elections to vote. 1.3 Objectives of the study 1.3.1 Research objective The general objective is to investigate why young people are increasingly disengaging from politics and their understanding of civic responsibility with regard to participation in Namibian elections, focusing on students. 4 1.3.2 The specific objectives are: to investigate attitudes and practices of students towards elections; to assess students’ understanding of their democratic rights and civic responsibilities; to investigate students’ satisfaction with the way democracy currently works; and to assess how students’ value participating in presidential and national elections. 1.4 Significance of the study The existing literature mainly focuses on the youth and not necessarily on the students. This study is amongst the few studies conducted in Windhoek, focusing on students identified from tertiary institutions. The study is significant in the sense that; (i) it might assist political parties and the government to understand what students think about elections, as they plan for future election education campaigns, (ii) it might lead to steps that will lessen apathy towards elections amongst the youth; and (iii) it will contribute to existing youth literature on democracy and civic responsibility with focus on election participation in Namibia. 5 1.5 Limitations of the study The study mainly covered students from the following tertiary institutions in Windhoek; The University of Namibia Khomasdal Campus (UNAMKC), International University of Management (IUM), Monitronics Success College (MSC), Polytechnic of Namibia (PoN) and the University of Namibia’s Main Campus (UNAM). Due to limited resources, it was not feasible to extend the study to students’ at higher education institutions outside Windhoek and was limited to students between the ages of 18-34, who are eligible voters. 1.6 Chapter outline Chapter 1 - Introduction & background of the study Chapter 2 - Literature review Chapter 3 - Introduction Methodology, Research Design and Population Chapter 4 - Presentation of Data, Analysis and Discussion of Results Chapter 5 - Summary, Recommendations and Conclusions. 1.7 Conclusion This chapter described the nature of the problem under investigation, the significance of the investigation, the possible limitation of the investigation and the possible contribution that the researcher hopes to make in the study area. In short, the aim of this chapter was to put the whole research project into perspective. The next chapter 6 will focus on the review of related literature pertaining to democracy building and civic responsibility and focus on an analysis of tertiary students’ participation in the 2009 national elections in Windhoek. 7 CHAPTER 2: LITERATURE REVIEW 2.1 Introduction This chapter represents review of the literature on democracy building and civic responsibility and focus on an analysis of tertiary students’ participation in the 2009 national elections in Windhoek. In addition, this chapter also reviews the literature on youth participation in elections. 2.2 Importance of youth in society Youth in general are considered as key in society in the sense that they are energetic and viewed as future leaders in a contemporary society. They are said to be increasingly disengaging from politics and feel alienated from political institutions and leaders by not turning out at elections. The youth fail to directly or indirectly participate in politics particularly party politics that establish the government of the day. Despite the involvement of youth and students in politics during the apartheid era, contemporary Namibia is confronted with a new challenge of low level of participation in the new political dispensation by the youth. This is serious as “the strength, depth and sustainability of democratization gains are dependent on the extent of citizen participation especially among the youth as they are not only in the present but are in the future” (Ntsabane, 2000, p.1). This suggests that the sustenance of democracy in Namibia is contingent on the participation of young people in party politics. 8 According to Donna, et al (2002, p.14), political engagement by youth in particular “will encourage young people to be citizens as it will foster an interest in and to the local community”. If students are engaged in social and civic activities, it will make them part of the process rather than making them feel excluded. Writing on the Namibian youth, Keulder (2002, p.7) shares the same sentiments that “the youth are the elite and the marginalized of tomorrow”. To overcome future marginalisation requires engagement not disengagement from the youth. In this regard, Keulder (ibid, p.9) claims that “political participation can be regarded as a corner stone of democracy and its definition could differ from person to person” since, naturally, democracy is encouraged by higher level of industrial development which creates pressure for wider participation in politics. Sociological discussions of democracy have gone through several phases. It is through political participation that citizens are granted the right to elect or vote leaders of their choice and be elected into office. This can only be a reality if it is valued by its beneficiaries. 2.3 Importance of youth political participation Twenty years after Namibia’s independence, political participation remains a vital aspect of democracy and political culture. The idea of youth participation in politics has once more become a popular part of contemporary social talk in most parts of the world, including Namibia. According to Ntsabane’s (2000, p.1), “students participation in elections can help empower the youth to build the community and is a remedy to a range of social problems”. Most democratic governments, including Namibia, routinely and publicly declare their commitment to consultation and grant 9 young people opportunities to have real say and choices about policies and services that directly affect them and the future of the nation. Bessant (2005, p.1) claims that “youth participation enhances citizenship while tackling social problems”. The youth of every given community in one way or the other gradually contribute to social changes, and it is through them that one can try to understand the future of a country’s political status. Students are the inheritors of the fundamental values of society and they can contribute to its development and future initiatives if they are knowledgeable of their roles and responsibilities as youth. Bessant (ibid, p.389), asserts that “youth participation is critical for maintaining democratic values… of which elections is one thereof, the challenge is to enlist the enthusiasm of youth for commonwealth in the new century”. Youth participation in this context is important in maintaining democratic values such as freedom, peace and justice. It is believed that society should be guided by social norms and values, and these should start with the students since they are better positioned in society as the generation of the future. The youths’ activities are deliberately designed with the understanding of getting them involved in order to feel included. According to Bessant (ibid, p.390), “the British commonwealth’s youth participation mainly entails social, culture and leisure activities which are clear indicators of a healthy transition towards independence and evidence of social integration”. It helps give them a better understanding of their civic responsibility and equally role to play in the contemporary society. 10 According to Cochrance and Billigs (quoted in Ellis, 2004, p.90) “due to economic and social decline in the west midland, young people were marked by a decline in support for major political parties, a failure to be inspired by idealism, and a tendency to respond by accepting simple but extreme solution to economic problems”. Nevertheless, a similar study was conducted in some UK cities of which Perception of Human Rights and rights-related issues among Namibian Youth: Results from focus group discussion, indicate that “youth surveyed expressed little interest in political matters, and if they engaged in political activities this was typically in a passive form such as, watching party political broadcast or discussing politics with their parents” (Cochrance and Billigs in Ellis 2004, p.91). The student’s low participation in elections should remain a concern to all parties, especially in democratic societies where civic responsibility is advocated continuously. 2.4 Democracy building and students participation in elections Democracy helps shape political social structures, conditions of political culture and participation that could guide youth participation in political activities. The Namibian constitution commits itself to a multiparty system which is an important exercise in pluralism and an essential element in democracy and which strengthens political culture and participation in particular. Friedrich-Ebert-Shifting (1996, p.1), states that “an electoral process and democracy cannot be separated from the empowerment of the people, observance of human rights, and the promotion of equality, mutual security and respect for human dignity”. Therefore, for political culture to be meaningful and successful, it should be legal and fully owned by the citizens, especially the students who should be the driving force of the process since it is 11 assumed that they understand civic responsibility and the future of the country is vested in them. Ariste Zolberg (1969, p.201) views political socialization as, “one of the several requisite functions of the political system through which children are subject to a process of induction into the political culture”. The various activities that the youth carry out in society can contribute to heightened levels of civic participation. This will help them give meaning to the existence of democracy through political participation in a democratic society. In doing so, students get educated on their civic responsibilities from childhood. 2.5 The effect of electoral outcomes on political trust Competing theoretical claims exist in the literature on the effect of proportionality (i.e. the effect of the number of parties in elections, parliament and government, voting for the winning or losing party under different levels of proportionality and the clarity of responsibility) on political trust. To date, empirical studies yielded mixed results (European Social Survey, 2006-2009). According to the European Social Survey (2006-2009) study, they found out that political trust is indeed highest in countries with very proportional as well as in countries with very disproportional election outcomes and lowest in countries that fall in between. The survey also concludes that election outcomes that are fully inclusive as well as those that provide more accountability can lead to higher levels of political trust. In the last decades, there has been a renewal of interest in the effect of electoral outcomes on political trust. Widespread dissatisfaction with politics has been 12 interpreted as the result of dissatisfaction with the functioning of the electoral system. Electoral reform is often seen as a way to restore political trust with recent examples of electoral reforms that aimed to do this in Zimbabwe (2009-2013), New Zealand, Italy and Japan (Dalton, 2004, p.177–187). Also the emergence of new democracies and cases of divided societies has stimulated research interest in the effect of electoral design and its outcomes on political trust (Lijphart, 1999; Farrell and McAllister, 2006). The electoral system links citizens and elites and political trust is considered to be an indication of the quality of this linkage (Aarts and Thomassen, 2008, p.712-726). They further argue that political trust is believed to be affected by electoral outcomes such as the proportionality of the election outcome, the number of political parties participating in elections, in parliament and in office. Also whether the political party one voted for gains office is argued to influence political trust, especially when the election outcome is disproportional the ‘winner’ gains substantial representation and power in relation to the ‘loser’. In addition, clarity of responsibility is also theorized to raise political trust levels. While scholars agree upon the importance of these election outcomes on political trust, the direction of the effects is still debated (Aarts and Thomassen, 2008, p.712-726). For one, proportional as well as disproportional election outcomes, single-party governments as well as coalitions are believed to increase political trust levels (Lijphart, 1999; Norris, 2011:217–235; Wagner et al., 2009). Farrell and McAllister (2006, p.724) conclude: “Whether and how electoral systems can affect levels of satisfaction with democracy is therefore unresolved and more work is required”. 13 2.6 Namibian youth perspective Latukhina (2013, p.1) asserts that according to the official government rhetoric, the important role of the youth in Namibian society is generally acknowledged. According to the former Minister of Youth and Sport, “young people are an asset of any nation. They are full of energy and have a dream and vision for the future.” (Kapelwa-Kabajani 2000, p. 275). This view is declared in the official documents as well. For example, in both the National Youth Policy and the African Youth Charter, which the Namibian government ratified on 12 March 2008, it is said that youth are an important part of the society since they can have a positive impact on social, political, and economic spheres if provided appropriate resources for the development of their skills and capacities. However, in practice, what we see does not always conform to the ideal. This is shown by the example of the kinds of social problems youth encounter and how the government responds to them, and by the example of the possibilities of political participation provided to the youth by the government. As mentioned earlier, Namibia, like the rest of Sub-Saharan Africa, has a large youth population. Generally, young people strive to be educated, to have a good job and a stable family. However, in reality, many young people encounter diseases, specifically HIV/AIDS, high unemployment, marginalization, displacement, and other ailments and uncertainties, which make the achievement of their dreams unlikely. These infirmities also affect the Namibian youth in profound ways. Most young people, especially those in the rural areas, are disadvantaged and vulnerable. Massive school dropouts, HIV/AIDS, high unemployment and, as a result, poverty 14 are the key issues that Namibian youth encounter (Third National Development Plan [NDP3]; Wikan, n.d.; Keulder & Van Zyl, 2001). Realizing the importance of these problems, the government has taken measures to solve them. However, the overall success of the policies is questionable, except for addressing the HIV/AIDS problem, where the government has achieved some progress. By and large, the problems that young people encounter in Namibia, impact on their participation in politics generally. Van Zyl and Keulder (2001) suggest that participation of youth in politics is important because: (1) The consolidation of democracy cannot be fulfilled without the integration of young people into political life; (2) participation contributes to the socialization of young people due to its behavioural and attitudinal attributes; and (3) without youth participation, issues related specifically to youth might not be adequately addressed. The same can be said with regards to the importance of student participation in politics. In addition, students have a broad view on political and social issues and can make critical judgments about political matters or policies. In other words, they have necessary knowledge and skills to contribute to the decision-making process in their countries. In practice, however, the African youth in general, and students, in particular, very often either resort to protesting and violence or prefer to stay away from active politics. The disengagement of students from active politics stems from dissatisfaction not only with the political regime, but also with institutional politics in 15 general (Keulder, 1998). While young people have only resorted to anti-government protest in a few instances since independence in Namibia, the norm in the Namibian context seems to be apathy towards political sphere. Keulder (1998) found that Namibian University students were mostly apathetic. A similar study in 2000/01 drew the same conclusion about the youth in general (Keulder & Spilker, 2001). The non-participation of the youth in active politics begs the question: Can a lack of participation in politics by the Namibian youth be attributed to the crucial issue of political trust in leaders? 2.7 The importance of political trust Political trust is at the centre of democratic theory. According to Miller and Listhaug, (1990, p. 358) political trust “reflects evaluations of whether or not political authorities and institutions are performing in accordance with the normative expectations held by the public”. Political trust operates as a heuristic devise that guides all kinds of behaviour such as participation in politics, law abidance or the willingness to contribute to the collective good (Hetherington, 1999; Scholz and Lubell, 1998). Citizens with higher political trust levels are more likely than distrusting citizens to accept and comply with political decisions voluntarily, thereby political trust enables political authorities to collect resources and implement political decisions more effectively (Tyler, 1990; Marien and Hooghe, 2011). As a result, political trust is a key resource for a political system to authoritatively allocate values for society (Easton, 1965). 16 From the above reading, political trust seems to be nurtured by an active population. Indeed, some authors have argued that critical citizens can force political systems and political decision makers to react in a more responsive manner to demands from the population (Norris, 1999; Rosanvallon, 2008; Geibel, 2008). By critically examining government’s policy and governance, citizens keep government officials accountable on a permanent basis. Nevertheless, most authors agree that some level of political trust is needed for the stability and functioning of democratic societies. Political trust is defined as an expression of diffuse rather than specific support and it is attributed specifically to the regime and the political authorities (Easton, 1975). Inline with David Easton, political trust is considered in this study as an expression of diffuse support which is not the mere result of satisfaction of individual demands. Political institutions play an important role in shaping a democratic society; we can assume that trust in these institutions is strongly related to a more general evaluation of the political system. Conversely, political trust is also believed to be fostered by disproportional outcomes as these promote accountability and effectiveness (Aarts and Thomassen, 2008, p.712-726). These different characteristics result from the distinct goals that underlie different electoral systems: “the major difference between the majoritarian and proportional vision is their view on the essence of democratic government and consequently the function of elections” (Aarts and Thomassen, 2008, p. 6). Proportional election outcomes are generally seen as more fair than the disproportional ‘the winner takes it all’ outcome (Sartori, 1994). Seats are allocated to parties in proportion to the votes they received at election, as a result voters 17 determine to a great extent which parties obtain seats and only few votes are wasted (Karp and Banducci, 2008). A proportional election outcome is generally characterized by inclusiveness. In fact, proportional electoral rules aim to lower the threshold for parliamentary representation by encouraging more parties to enter the electoral contest, resulting in the presentation of various alternatives to the electorate, from extreme-right parties to extreme-left parties to pirate parties or animal parties etc. As party choice can effectively be used to voice (specific) political preferences, citizens’ feeling of influence is strengthened. Finally, citizens voting for the party that won the election gain more in an electoral system producing disproportional outcomes, therefore, they are thought to have higher levels of political trust than winners in a system that produces more proportional outcomes. Voters of parties that have lost the election, on the other hand, are theorized to be better off with proportional election outcomes than disproportional ones (Anderson et al., 2005). In sum, both proportional and disproportional election outcomes are theorized to foster political trust. While proportional outcomes are associated with inclusiveness and representativeness, disproportional outcomes are associated with government accountability and effectiveness. Proportional outcomes mean a proportional translation of votes into seats and are generally associated with a large number of political parties in elections, parliament and government. Disproportional outcomes, on the other hand, mean a disproportional translation of votes into seats and are in 18 general associated with fewer political parties in elections, parliament and generally single-party governments. Moreover, political trust is found to be higher in countries with coalition governments, but too much coalition partners diminished political trust levels again (Anderson et.al, 2005). It is argued that in such countries elites rather than election outcomes determine the composition of government. Cabinet instability is also found to be related to lower levels of political trust (Weil, 1989). In addition, extensive research effort has been devoted to the effects of winning and losing elections on political trust in different institutional contexts. According to Anderson and Guillory (1997, p.68), “losers are more trusting in consensual systems than in majoritarian systems and winners are more trusting in majoritarian than consensual systems”. Hence, the gap in political trust is larger in majoritarian systems than in consensual systems. Electoral outcomes have been examined in order to explain cross-national differences in levels of political trust (Sartori, 1994, p.75). It is argued that; Political trust is highest within countries that have very proportional or very disproportional election outcomes. Election outcomes that fall in between are associated with the lowest levels of political trust. Although proportionality is an age-old issue, there is still no consensus on its effects on the attitudes of citizens. 19 This study shows a promising way to investigate the effect of proportionality on political trust. It emerged in this literature review that the use of appropriate measurements in electoral design is crucial. It is argued that when focusing on electoral design instead of electoral outcomes and dividing electoral systems into three categories, the variation within these systems is completely ignored. Using indices of the proportionality of election outcomes seems a better way to proceed. The relationship between political trust and several additional election outcomes were examined in the literature review. The number of political parties in elections, parliament and government was examined. It also emerged that when a large number of political parties participate in elections, citizens can effectively use their party choice to voice their political preferences (Armingeon, 2002). Political discontent can be voiced by voting on minor protest parties. In addition, these parties can effectively pass the threshold to parliamentary representation and defend the interests of their voters better than large catch-all parties. This is supported by the evidence that citizens have higher trust levels in countries with more parties contesting elections and more inclusive legislatures. However, party fragmentation does not foster trust as it becomes increasingly difficult to aggregate interests into ideological coalitions. Surprisingly, there is no clear relationship between political trust and coalition governments or single-party governments despite the strong arguments on the effectiveness of single-governments, the instability or inclusiveness of coalition governments (Armingeon, 2002). 20 2.8 Generational differences in electoral behaviour The pattern of voting in the world has drastically changed and is skewed towards a number of factors such as the behavioural inclinations that have evolved overtime in Britain. Behavioural patterns, deep-rooted values, as well as political attitudes tend to be very stable in influencing voters. Therefore, “generational replacement is one of the main driving forces behind social and political change” (Hooghe, 2004:331). Aggregate political changes may be the result of new generations entering the electoral arena with different attitudes, different party loyalties, and different sets of values than the older generations they replace. Studies of electoral change try to distinguish between changes that are affecting all generations, and changes which are due to generational replacement. 2.8.1 Generations and life cycles Blais et al., (2004); Rubenson et al., (2004); Topf, (1995) argued that “over the last years, young voters are less likely to participate in elections than older ones”. They noted a variety of reasons for this phenomenon that include, minor interest in politics, less knowledge about politics and the loss of seeing voting as a civic duty among young voters. However, it is still unclear to which extent these changes are due to life-cycle effects, or to generational effects and which implications this might have on the future developments in turnout levels. The debate about lower turnout rates of young voters became particularly vibrant with Franklin stating that “the habit of voting is established relatively early in “peoples’ adult lives” (2004, p.12). Thus, someone’s 21 first election might have a major impact on his/her future electoral participation habit: if s/he turns out at the first election it is more likely that s/he becomes a habitual voter, whereas non-participation in the first election increases the likelihood of becoming a non-habitual voter (Plutzer, 2002; Franklin, 2004). Hence, differences in turnout across generations might simply reflect differences in how people got “set in their ways” during young adulthood, Franklin (2004, p. 216). On the other hand, it might also be that once young voters settle down into adult life, they assimilate to the electoral participation habit of older voters. Turning to vote choice, party identification and also left-right ideology have lost considerable power in structuring and explaining voting behaviour. According to Franklin et al (1992, p.385), “all of the countries that they studied showed a decline in the ability of social cleavages to structure individual voting choice”. To a certain extent, the ways in which people arrive at their electoral decisions were largely caused by deconfessionalisation and individual emancipation (Knutsen, 2001; Achterberg, 2006). Even if voters would still be voting on the basis of their structural positions, the decline of church attendance in the 1970s would lead to a steady loss of Christian democratic parties (Knutsen, 2004). Additionally, as a result of individual emancipation more and more voters no longer vote for the party of ‘their social group’ (e.g. Evans, 1999). Many prior studies have also shown that across various European systems the behaviour of parties and voters alike has been structured largely by a left–right dimension, which until the 1990s remain the dominant ideological dimension in many of these countries (e.g. Fuchs and Klingemann, 1990; Van der Eijk and Franklin, 1996; Hix, 1999). 22 However, there are reasons to expect that the left/right dimension has partially lost its capacity to structure the behaviour of parties and voters. First, parties have converged on the left-right dimension (e.g. Pennings and Keman, 2003), and second, new issues have emerged such as environmentalism, immigration, European integration, globalisation which at the level of voters are not related with the socioeconomic issues that traditionally characterized the left/right dimension especially in Britain (e.g. Kriesi et al., 2006; Van der Brug and van Spanje, 2009). As a result of the fact that public opinion is organized by two dimensions in most West European countries, the single left/right dimension is less useful as a cue for voters on which to base their vote choice. At the same time, voters vote increasingly on the basis of political issues: various scholars noted that the decline of structural voting went hand in hand with an increase in issue voting (e.g. Rose and McAllister, 1986; Franklin, 1992). The concept of party identification was introduced by Campbell et al. (1960) and the importance of political socialization was recognized by scholars of electoral processes. Holmberg, (2007) argued that party identification is seen as a political attitude, or some claim a non-political attitude (e.g.), that is formed early in life and that is supposed to remain highly stable after that. Alwin, (1991); Sears and Funk, (1999); Jennings, (2007) noted that studies in political socialisation have generally provided support for political learning’. The studies indicate that political orientations tend to be rather unstable during the adolescent years, after which they become more crystallized and tend to be relatively stable. Further, it is argued that, behavioural patterns, deep-rooted values, as well as political attitudes tend to be quite 23 stable over time from the early adulthood onwards. The notion that political orientations appear to be rather stable, has important implications for studies that focus on electoral change, party system change and processes of realignment and dealignment. Van der Brug, (2010) argued that generational experiences might be an important intervening factor. For instance, due to historical experiences social cleavages may still be quite important for the oldest generations, but less important for younger ones. He noted that the same goes for party loyalties or the importance of issue outside the left-right dimension in structuring party preferences. 2.8.2 Reasons advanced for the decline in turnout at elections Bhatti and Hansen (2012) demonstrate that the decline in turnout in European elections is to a substantial degree caused by changes in the composition of the electorates. Walczak et al. (2012) explore whether generational replacement explains changes in the degree to which long-term and short-term factors affect party preferences in established and consolidating European democracies. Perhaps the most important finding is that the differences between the generations are much smaller than the similarities among them. When focusing on the differences, they find that party preferences of older generations are more strongly structured by longterm determinants than those of younger generations. Yet, among younger generations there are clear indications of de-alignment, since short-term determinants as well as long-term determinants of party preferences have a weaker effect among younger than among older generations. 24 Wagner and Kritzinger (2012) focus on the Austrian case, where the voting age has recently been lowered to 16. They observed that voters of different generations use ideological dimensions differently: older voters being more concerned with material well-being would put more weight on the socio-economic dimension, whereas younger voters would be driven more by post-materialist concerns and would therefore be guided more by the socio-cultural dimension. They further ague that these different dimensions are assumed to determine party choice: mainstream parties –labelled old politics parties – are considered to be the representatives of socio-economic values, and would therefore be more likely to attract older voters. Nonmainstream parties – referred to as new politics parties –would be the more likely representatives of socio-cultural values, and would therefore be more attractive for young voters (Wagner and Kritzinger, 2012)’ Wagner and Kritzinger, (2012) further argued that some differences across generations emerge: young women vote for new politics parties both on socioeconomic and socio-cultural values while older women only use their socio-cultural dimensions. They observed that young women are much more likely to vote for the Greens than men in Europe. Franklin and van Spanje (2012) studied the behaviour of young voters in Italy and observed differences in patterns of party choice among generations, caused by learning effects in which young people need time to get to know their way around the party system, differences between cohorts. They find that a new party system causes confusion as to where parties stand in left–right terms, making it difficult for voters to make their choices on the basis of ideological cues. 25 The confusion is greatest among older voters – those already set in their habits of voting. Anderson and Just (2012) investigated whether the party cues on the desirability of the political system effect supporters’ legitimacy view. They found out that parties can indeed impact citizens’ view on the political system and that the strongest effect can be found among older political parties. They conclude that, parties have an important role in establishing positive or negative views amongst citizens regarding the democratic legitimacy of a political system. They found this role particularly important amongst (older) partisans; a position difficult to achieve given the dynamics of changing political patterns. 2.9 Conclusion His chapter has illustrated that there are differences between generations when it comes to both party preference and the intention to vote. Even though this observation is far from new, it tends to be often overlooked. Moreover, it emerged that younger generation’s turnout less at elections than older generations, even when controlling for life-cycle effects, and their voting patterns are less predictable than those of older generations. The evidence provided by this chapter points to two diverging trends. On the one hand, there is evidence of increase disengagement by the youth from politics. However, there are also some signs of increase political engagement by the youth. 26 CHAPTER 3: RESEARCH METHODOLOGY 3.1 Introduction This chapter briefly describes the research design employed, methods of data collection, research questions format, sampling and finally the data analyzed. 3.2 Research design The study adopted a mixed method approach and is both quantitative and qualitative. It is exploratory in nature. The qualitative approach used key informants interviews (KII) and Focus Group Discussions (FGDs) in order to assist the researcher understand the participant’s knowledge of youth participation in national and presidential elections and general understanding of democracy in the context of Namibia. The quantitative approach used the survey questionnaires to assist in obtaining the data about political participation among students. 3.3 Population of the study The population size of the study constituted 2300 respondents drawn out of students or youth between the ages of 18-34, from the identified tertiary institutions; these institutions are: University of Namibia Khomasdal Campus 230 respondents, The International University of Management 230 respondents, Monitronics Success College 230 respondents, Polytechnic of Namibia 690 respondents, and the University of Namibia’s Main Campus 920 respondents. 27 3.4 Sampling The sample size of the study is 200 respondents. Table 3.1 below, depicts the number of participants per institution, while table 3.2 below shows the level of education of the participants. Table 1: Educational Institutions Institution Total of % of students participants 1 International University of Management 20 10 2 Monitronics Success College 20 10 3 Polytechnic of Namibia 60 30 4 University of Namibia Khomasdal 20 10 University of Namibia Main Campus 80 40 TOTAL 200 100 Campus 5 The research population includes postgraduate students in order to diversify options of past voting experience and not only focusing on the 2009 as per the research topic. Majority of the respondents in the survey are students from UNAM because of the total numbers of registered students per institution. The data collected were tabulated and interpreted while others had been expressed in figures and percentage for easy analysis and interpretation. 28 Table 2: Year/Level of Study Year/Level of study Total number of respondents % 1 1st year 2 1 2 2nd year 37 18 3 3rd year 122 61 4 4th year 30 15 5 Postgraduate 9 5 200 100 TOTAL Table 3.2 above depicts the year/levels of study of the participants who were eligible to vote or have participated in an election process in Namibia. The focus group participants were selected from the respective tertiary institution provided that they were eligible voters and registered to vote. Quantitative sample- The tertiary institutions were purposively selected based on the number of students registered annually. Purposive sampling method was also used to identify the classes based on the willingness of the lecturers who could grant permission for the interviews to be conducted at that respective slot of class at the institution. The third, final year and postgraduate students were identified and selected since it was presumed that they are eligible voters and should have at list voted by the time the interviews were conducted. Simple random sampling method was used to select the students in each class who were eligible participants. Class lists were used as sampling frames by randomly selecting student from the list since 29 they were alphabetically arranged. The advantage of randomly selecting the students was for them to all have an equal chance of being included in the sample. The purpose was to obtain a broader overview of what the students’ knowledge, attitudes and practices (KAP) toward elections, and their general understanding of democracy was. Qualitative sample- Purposive sampling method was used to select participants for the qualitative data collection. The key informants were purposively selected because of their knowledge on elections and youth in general. Six individuals were all provided with a sequence of structured questions to respond to. The opinions of the key informants were of great importance for the study because of their vast knowledge and practical involvement in terms of understanding the youth’s practices. Equally, FGD groups were selected purposively with the assistance of specific lecturers and faculty representative at respective institution. A semi- structured KII schedule as part of the exploratory research was designed for this purpose. The FGD gave participants a chance to discuss and exchange views with each other on the set questions and probing questions. 3.5 Questionnaires format and data collection The purpose of the questionnaires was to collect and record primary research data and allow the participants to contribute to the objectives of the study. There were three questionnaires designed for the study; FGDs, KII’s and a survey. 30 3.5.1 Focus Group Discussions The FGD focused on issues related to the general opinions of the students in relations to participation in elections; The student understanding of elections. The role that institutions such as ECN play in persuading them to participate in elections. Why they vote and its importance, as well as why they do not vote? What is the students understanding of Democracy? What influences the way they and others vote? 3.5.2 Key Informant Interviews Key informant interview schedule focused on the following key themes: Respondents’ occupation, gender and level of education. Types of elections that students participate. The importance of elections to students. Understanding of elections in a democratic country. Factors that influences the way students vote. Voting as a legal obligation versus personal right. 3.5.3 Survey The survey questionnaires covering the following information of the respondents; 31 Demographic information of participants, Education: level of study information, Reasons why the respondents votes, Influences in voting choices, Level of awareness on elections, Level of political awareness and participation, Understanding of the term democracy and whether Namibia is a democratic country in terms of election, The data obtained from the qualitative and qualitative method used was addressed the key objectives of the research which made it reliable to address the required. 3.6 Data Collection Methods 3.6.1 Key Informant Interviews Data was collected from the key informants that were identified and interviewed. The identified key informants have the knowledge on the subject and they interact with the youth or students on a regular basis, either during elections, academic debates or youth and students’ forums. The interviews was composed of the a representative for the Division Democracy Building (DDB) at the Directorate of Elections, a representative from the National Youth Council (NYC) and three of the four youth leaders of the following political parties; SWAPO, RDP, NUDO and DTA. In addition, a lecturer of Electoral behaviour from the University of Namibia in the Department of Political and Administration studies was also interviewed. 32 The identification was done on a voluntary basis and respondents were not forced to attend the interview sessions. The purpose of the study was explained verbally and in writing to the participants at all interview sessions. Both structured and semistructured interviews were employed and both captured the needed information. During the interviews sessions, the structured interview schedule assisted the researcher to stay focused. Semi-structured interviews revealed information which was not expected, but of vital importance in terms of perceptions and opinions. For the key informants whom the researcher could not secure an appointment, the interview schedule was provided to them in advance and the responses were collected and captured for data analysis. During the interview process the researcher read out question by question to the participant, and also made provision for follow up questions to answers that were not clear. 3.6.2 Focus Group Discussions Face-to-face FGDs were conducted at each institution, with exception of Monitronics Success College. The aim was to further explore views and opinions of the participants with regard to their understanding of democracy in the Namibian context and how it could impact their level of participation in elections. The FGD interviews mainly targeted the 3rd, 4th/final year’s and postgraduate students since most of them are above the age of 18 and are eligible to participate in elections. At each institution, there was a FGD comprised of male and female members, with a total of 6 students. Each interview schedule consisted of ten (10) preliminary structured questions, with an option of probing questions. 33 The main advantages of FGD’s interview as a qualitative technique are that, it enables the researcher to observe and note the process of interaction among the participants, and to have access to the substantive content of their verbally expressed views, opinions, ideas, attitudes and experiences as it characterises the participants biographical and life structure. 3.6.3 Survey The research also collected quantitative data which provided relevant opinions of the study from the 200 respondents (students) from different tertiary institutions within Windhoek. The survey questionnaire consisted of (25) questions and was mainly used to cover 200 youth (students) in order to have an inclusive opinion of students on their reasons of participations in national and presidential elections. The quantitative approach also assisted to confirm the statement by Keulder and Van Zyl (2001, p.13), on the past studies in Namibia that, “Namibian youth are not very active in politics”. In the discussions and recommendations of the findings, it is evident that the quantitative survey response serves as an important part of the students’ knowledge, attitude and practices on elections in Namibia because they are well defined and well designed; so that they could achieve the intended purpose of the study conducted. 3.7 Data Analysis Quantitative responses to the questionnaires were classified and tabulated in different categories using the IBM SPSS 20 software. The coded data was analysed by means of One-Way Anova at significance level of .05 in order to determine the relationship 34 of the variables. Significant variables to the study were identified and interpreted accordingly and where possibly linked to literature review to gain a full understanding from both primary research data and secondary research. The findings were presented in chapter four of the research report. In addition, frequencies were generated and interpreted, leading to creation of different figures. Qualitative data was collected through KII and FGD and data was coded. Six key informants were interviewed and four FGD were conducted with each focus discussion group represented by six respondents. The same types of questions were used on each FGD. Qualitative data analysis was conducted through Cresswell (2009) model as depicted in figure 3.3 below. 35 7. Interrelating themes/descriptions 6. Themes 1. Validating the data accuracy of the 8. Interpreting the meaning of the themes 6. Codes 5. Coding of the data (manually) 4. Read through all the data 2. Read through raw data (transcripts/questionnaires 3. Organizing and preparing data for analysis Figure 1: Data Analysis Process (Cresswell, 2009) Figure 1 above depicts the various steps that are involved in the explanation of the data analysis model depicted above. The steps range from step 1 up to step 7 (Cresswell, 2009). Step 1: Involves the validation of data for accuracy of information. In this process, the researcher validated the accuracy of the data recorded from the interviews and transcribes it. Step 2: In this part process of data analysis, the researcher carefully read through all raw data of the transcripts several times to get a general sense of the information and to reflect its overall meanings and identify themes and sub-themes that emerges from the interview. 36 Step 3: The researcher organised and prepared the data for analysis by sorting and organizing the data into different categories/themes as per sub question formulated from the main research question. Step 4: The research read through all data carefully once again. The reasons were to find out what participants are really saying, what ideas emerge from the data and what is the impression of the overall depth, credibility, and use of the information. At this stage the researcher started to look for general patterns, similarities and differences in the responses from the subjects. Step 5: This stage outlines the coding system used in this research. The researcher began by making detailed analysis with a coding process of the interviewees. Step 6: At this stage, themes and sub-themes were identified. The researcher focuses on themes and sub-themes predetermined from the sub-questions of the main research question by organizing the material into segments of text before bringing meaning to information. Data were then fit to these themes and sub-themes through sentence construction. The procedure involves organizing the data according to a data analysis memo/summary, by tabulating it under the sub questions of the main questions. Themes were formulated based on the questions under each sub question. Step 7: Is the final step in the data analysis process that involves making an interpretation or meaning of the data. Data were interpreted by means of reading with understanding what emerged from the themes and the sub-themes according to the information provided by the subjects’ personal opinions, experience and appreciating 37 the study based on their experiences in participation of youth in elections through democracy. 3.8 Ethical Considerations The researcher obtained a letter from the department (University of Namibia) confirming the purpose of the study. This document was used to communicate to all respective institutions and was read out to all participants at interview intervals. The study was based on the principle of voluntary participation. Consent were gained from participates prior to their participation. The respondents were informed that they are not forced to participate or to divulge information they felt was confidential and for their own knowledge in view of the sensitivity of the topic. Respondents had the freedom to participate or withdraw from the study (or interview process) at any time they wished to do so. No withdrawal was recorded or observed during the data collection process. All participants were assured of their confidentiality, privacy and anonymity of any information shared during the interview. 3.9 Conclusion The Chapter focused on the research design that has been used to carry out the research. The population, sample size, research questions, data collection methods, data analysis and ethical considerations were also looked at in this chapter. The next chapter focused on analysis of results obtained. 38 CHAPTER 4: RESULTS 4.1 Introduction This study focuses on analysing democracy building and civic responsibility of tertiary students’ participation in the 2009 presidential and national elections in Windhoek, Namibia. The study sought to identify areas that need to be worked on and finally recommend areas which need to be perfected in the Namibian electoral system. This chapter focuses on presenting the data collected for the purpose of the study. 4.2 General Observation Regarding Respondents 4.2.1 Response Rate A response rate of 100% was achieved from sample size of 200 respondents who were chosen for the survey, 24 respondents participated in the FGD and 6 Key Informants were interviewed. The high response rate was attributed to the constant telephone calls made prior to the distribution of the questionnaires and personal follow ups undertaken by the researcher. Table 3 below depicts the response rate for the survey conducted. Table 3: Response rate (N= 200) FREQUENCY PERCENT Age distribution 18-21 years 101 50 39 22-25 years 65 33 26-29 years 22 11 30-34 years 12 6 Gender distribution Male 86 43 Female 114 57 Marital status Married 7 4 Divorced 3 1 Single 190 95 Language of Participants Afrikaans 8 4 Damara/Nama 14 7 English 7 4 Herero 16 8 Oshiwambo 124 62 Rukwangali 10 5 Other 21 10 Citizenship/Originality of Respondents Birth 170 85 Descent 8 4 Marriage 1 1 Registration 10 5 40 Naturalization 5 2 Other 6 3 Status of Returnees 1-5 years 9 4 10 years+ 9 4 All my life 182 92 Institutional Demography IUM 20 10 MSC 20 10 POLY 60 30 UNAMKC 20 10 UNAMMC 80 40 Academic Status 1st year 2 1 2nd year 37 18 3rd year 122 61 4th year 30 15 5th year 9 5 To be eligible to vote, the required age is 18 years. Table 3 indicates that 50% of the respondents are in the 18-21 years age category, 33% are in the 22-25 years age category, 11% are in the 26-29 years age category and 6% of the respondents are in the 30-34 years age group. Table 3 also indicates that 50% of the respondents are 41 very young and 43% of the respondents who completed the questionnaires were male and 57% were female. The female respondents outnumbered their male counterparts. On marital status, 4% of the respondents are married, 1% is divorced and 95% are single. Since the respondents are youth it is reasonable and justified to have 95% of them single as they are still in the youth age. The above table also suggests that 4% of the respondents are Afrikaans, 7% are Damara/Nama, 4% are English, 8% are Herero, 62% are Oshiwambo, 5% are Rukwangali and 10% comprises of other tribes. The Oshiwambo youth outnumbered the other tribes, probably because they were just nominated with a larger number in the study and they constitute the majority. On citizenship/originality of respondents, 85% of the respondents were Namibians by birth, 4% were by descent, 1% by marriage, 5% by registration, 2% by naturalization and 3% by any other means. It is expected that the majority of the youth are Namibians by birth as stated by the results above. 4% of the respondents are returnees, whilst 96% of the respondents are not returnees. On the number of years in Namibia, 4% of the respondents have been in Namibia 1-5 years, 4% have been in Namibia for 10 years+ and 92% of the respondents have been in Namibia for the rest of their lives. On the respondents institution of studies, 10% of the targeted youth studied at IUM, the other 10% studied at MSC, 30% studied at the PoN, 10% studied at UNAMKC and 40% studied at UNAM. On the level of education, the study indicates that 1% of the respondents are in the 1st year, 18% are in the 2nd year, 61% in the 3rd year, 15% in the 4th year and 5% in the 5th year. 42 4.2.2. One-Way Anova statistical analysis The listed results summary on table 4 below is derived from One-Way Anova statistical analysis depicted in appendix 4. One-way Anova is a way of presenting the calculations for the significance of a particular factor`s effect, especially for data in which the influence of several factors is being considered simultaneously. Usually, it is useful to distinguish between fixed and random effects. Anova is a statistical method that divides the variance in an observation into the variance of and the rest of the variance called the within group or error variance (Changarampatt, M.T., 2011, p.27). Each critical variable will be explained below. 43 Table 4: One Way Anova Statistics Results Summary Parameter Sum of df squares Mean F Sig Square I want things to improve 2.201 4:195 .550 2.416 .050 I feel it is an obligation to vote 1.302 4:195 .326 3.203 .014 Other .920 4:195 .230 5.225 .001 Likely to vote for the same party 27.403 4:195 6.851 5.066 .001 My vote will not make any 2.499 4:195 .625 8.289 .000 I am not interested in elections .846 4:195 .211 3.164 .015 National Assembly 8.422 4:195 2.106 4.396 .002 Presidential 17.286 4:195 4.322 18.453 .000 Local Authority 11.885 4:195 2.971 5.303 .000 I want vote to for change 5.054 4:195 1.264 5.488 .000 Because I don’t trust the election 1.322 4:195 .330 4.526 .002 I feel that only those elected benefit 2.660 4:195 .665 6.750 .000 Others 3.444 4:195 .861 4.409 .002 How much does media influence 16.897 4:195 4.224 3.496 .009 Television 2.447 4:195 .612 2.569 .039 Newspaper 3.742 4:195 .935 4.071 .003 Reported achievements geared 2.260 4:195 .565 2.745 .030 difference system towards national development 44 Member of any party 14.038 4:195 3.509 4.265 .002 I do not actively participate but I 3.103 4:195 .776 4.276 .002 Aware of political party policies 20.932 4:195 5.233 5.551 .000 It allows me to vote for the person I 4.370 4:195 1.092 4.670 .001 I don’t see its importance 5.625 4:195 1.406 19.686 .000 It’s mainly important for 4.531 4:195 1.133 4.793 .001 Officials to be trusted 43.293 4:195 10.823 2.794 .027 Regional Councillors 23.728 4:195 5.932 4.975 .001 Local authority councillors 19.999 4:195 5.000 3.066 .018 Traditional Leaders 28.552 4:195 7.138 2.858 .025 State what is true 12.480 4:195 3.120 2.984 .020 It doesn’t matter what type of 5.990 4:195 1.498 2.715 .031 7.524 4:195 1.881 2.560 .040 have full membership want democracy government is in power in a democracy A democratic government preferable to any other kind of government 45 4.3 Attitude and practices of the students towards elections Scholars on electoral behavior believe that is the difference in terms of attitudes of voters which has an effect on how they participate in elections and subsequently when they vote. 4.3.1 How important is voting to you? 60% 50% 40% 30% 53% 20% 34% 10% 7% 0% very important 4% important do not know unimportant 2% very unimportant Figure 2: How important is voting to you? With regard to the reasons why the respondents vote, 53% indicated that it was very important to them, 34% indicated that it was important, whilst 7% of the respondents indicated that they did not know, 4% stated that it was unimportant and 2% indicated that it was very unimportant. The majority of the Namibian youth, therefore, seems to realise that voting is crucial for democracy building. Moreover, the interest of the youth in elections suggest that they have put trust in elections as a crucial element of 46 democracy and seems to refute the Perception of Human Rights study which suggest that the Namibian youth have little interest in political matters. 4.3.2 What are your reasons for voting? 4.3.2.1 I want things to improve I want things to improve has a strong bearing to the study since the significance value of .050 is equal to the critical value of .05 and is relevant to the study as it is statistically significant (P<0.05) refer to table 4.10 above. 63% of the respondents agreed that they wanted things to improve, and 37% did not want things to improve. The fact that the majority of students participate in elections to ensure that youth related issues are addressed, augers well for the consolidation of democracy. 4.3.2.2 I feel it is an obligation to vote I feel it is an obligation to vote has a strong bearing to the study since the significance value of .014 is equal to the critical value of .05 and is relevant to the study as it is statistically significant (P<0.05) refer to table 4.10 above. The majority of the respondents constituting 88% agreed that it was their obligation to vote, whilst 12% did not feel it was their obligation to vote. The overwhelming positive response to the need to vote suggests that students in particular, expect that political authorities and institutions conform to the normative expectations of students. 47 4.3.2.3 Others Others has a strong bearing to the study since the significance value of .001 is equal to the critical value of .05 and is relevant to the study as it is statistically significant (P<0.05) refer to table 4.10 above. The majority of the respondents who are 95% indicated that they do not vote for personal reasons whilst 5% indicated that they voted for personal reasons. Table 5 below depicts the results obtained from the FGD on students’ attitude and participation towards elections. The purpose was mainly to establish if there are general consensuses on the argument that the youth or students are generally ignorant or, because of other issues affecting their lives, they choose to clear an attitude towards elections. Source: FGD With regard to the youth not participating in elections (voting), the table below captures their views and concerns; Table 5: Source: FGD It is believed that there are youth that do not participate in elections; in your view, what could be the reasons? Themes and Sub-Themes Participants Responses Interpretations/Reflections/Observations 1.Theme: Knowledge, attitudes and - Majority of the youth don’t know 48 practices of youth in Presidential elections their rights, - The youth are ignorant of their rights or privileges. - Geographical location of most of the youth original town or village of registration for elections makes it very difficult or impossible to take part in certain elections during certain times of the year, - Due to long queues, we can’t wait in the queues for the whole day just to vote, - Sometimes you are expected to walk a long distance in order to reach the point of voting and it is time consuming, - We are demoralized by what we see in our society, on television or hear on radio with regard to how government is handling issues of serious concerns for development, - Because of the level of competency of certain individuals or 49 candidates, - We don’t see the logic of participating in a process which consists of individuals that are not results driven. - They don’t see the need to vote, - Parties only want to use us during elections, - We are not important to them when it comes to strategies that will address issues of concern and only when its election time, that’s why we don’t vote, 4.4 Students’ understanding of democratic rights and civic responsibilities Here the research aimed at establishing the general understanding of democracy and civic responsibility of the students in order to relate it to their participation in elections. 50 4.4.1 Likely to vote for the same party 3% 7% very likely 44% likely neutral 30% unlikely very unlikely 16% Figure 3: Likely to vote for the same party Likely to vote for the same party has a strong bearing to the study since the significance value of .001 is equal to the critical value of .05 and is relevant to the study as it is statistically significant (P<0.05) refer to table 4 above. Figure 3 depicts that 44% of the respondents stated that they were very likely to vote for the same party they voted for in the previous elections, 16% were likely to vote for the same party, 30% were neutral, 3% were unlikely to vote for the same party and 7% of the respondents were very unlikely to vote for the same party. The responses of students implies that trust in political authorities means that they expect the political system to authoritatively allocate values. 4.4.2 My vote will not make any difference My vote will not make any difference has a strong bearing to the study since the significance value of .000 is equal to the critical value of .05 and is relevant to the 51 study as it is statistically significant (P<0.05) refer to table 4 above. The majority of the respondents constituting 91% indicated that their vote will not make a difference, whilst 9% of the respondents agreed that their vote will make a difference. Such an overwhelming negative response provide a poignant paradox: on the one hand negative students vote, on the other hand they do not seem to realise that through political participation they can evoke a positive response from political decisionmakers. 4.4.3 I am not interested in elections I am not interested in elections has a strong bearing to the study since the significance value of .015 is equal to the critical value of .05 and is relevant to the study as it is statistically significant (P<0.05). 93% of the respondents were interested in elections, whilst 7% of the respondents were not interested in elections. While there are negative responses from students on the difference that voting may make, the irony is that the majority of respondents are interested in elections. 4.4.4 Presidential Presidential has a strong bearing to the study since the significance value of .000 is equal to the critical value of .05 and is relevant to the study as it is statistically significant (P<0.05) refer to table 4.10 above. 66% of the respondents participated in the presidential elections and 34% of the respondents did not participate. This will help us determine if there are those that only choose to participate in the presidential elections and not national of which is evident. Participation in national elections are seen to be essential by an overwhelming majority of students. This has to do with the 52 degree of political trust that students have in the president to solve youth-specific issues. It also conforms with successive studies by the Afrobarometer (2006, 2008; 2013), which posits that there seems to be a high degree of political trust in the executive branch of government, in general, and the president in particular. 4.4.5 National Assembly National Assembly has a strong bearing to the study since the significance value of .002 is equal to the critical value of .05 and is relevant to the study as it is statistically significant (P<0.05) refer to table 4 above. Only 44% of the respondents participated in the National Assembly Elections and the other 56% did not participate. 4.4.6 Local Authority Local Authority has a strong bearing to the study since the significance value of .000 is equal to the critical value of .05 and is relevant to the study as it is statistically significant (P<0.05) refer to table 4 above. 73% of the respondents did not participate in local authority elections, whilst only 27% of the respondents participated in the elections. Based on the results, the local authority elections are not so much considered important by the youth of which is evident in the response rate. Yet, the building of durable democratic systems depend to a large extent on building the ‘inner links’ between the general population and their direct representatives. 4.4.7 I want vote to for change I want vote to for change has a strong bearing to the study since the significance value of .000 is equal to the critical value of .05 and is relevant to the study as it is 53 statistically significant (P<0.05) refer to table 4 above. 52% of the respondents indicated that they wanted to vote in future elections for a change, whilst 48% of the respondents indicated that they were not going to vote. This response implies that there is a great degree of political trust, which augers well for both democracy and democratic consolidation. Democratic rights and civic responsibilities are considered important for political participation. The table below depicts the understanding of democratic rights and civic responsibility. Table 6: Source: FGD Themes and Sub Themes 1. What is your understanding of democratic rights and civic responsibilities? Themes and Sub Themes Participants Responses Interpretations/Reflections/Observations 1. Theme: Students’ understanding of - their democratic rights and civic responsibilities The opportunity and right to exercise personal choices, - Free and fair elections process. - Equality and equity for all voters and participants. - Full participation, - When elections are held within a country - Majority rule 54 - Democracy is when the people within a state are able to practice their rights without any intimidation or force by either government, citizens and foreign forces. - The term democracy originated from the west and considered as a liberal theory. Table 7: Source: KII Participants Responses 1. What is your general - understanding of democracy (liberal democracy)? In this regard every individual is entitled to his/her right or opinion - Democracy is not only about elections but to also address the needs and issues affecting the citizens - It is a western word used to express the rights of citizens within a given state. 55 2. In your view, is Namibia a democratic country and why? - Yes, because one is satisfied. - Yes, because it has periodic elections, there is freedom of speech. However, there is still room for improvement especially when it comes to socioeconomic welfare of the citizens. - Yes, it provides its citizens with choices in terms of elections. People are free to criticize the state’s affairs and are allowed to do as such. 3. What is your understanding on - democratic elections? Is the right of every individual to elect his/her leader or government of his/her choice. - Elections should electorates the promote the afford opportunity the to socioeconomic development agenda. - A free and fair process without any intimidation of candidates or voters. 4. Briefly explain the importance of voting in a democratic country? - To determine the government and leadership, 56 - Voting is not an end in itself but it is means to an end, - The privilege or option to have a leader of your choice. 4.5 Students satisfaction with current democracy Namibia is considered to be one of world democratic states, hence the research aims to establish the view of the youth as future leaders and if the elections are also viewed as such. 4.5.1 Distrust in the election system Distrust the election system has a strong bearing to the study since the significance value of .002 is equal to the critical value of .05 and is relevant to the study as it is statistically significant (P<0.05) refer to table 4 above. Only 9% of the respondents would participate in future elections, whilst 91% of the respondents indicated that they were not going to participate because they did not trust the election system. The outcome here does not imply a lack of political trust, but rather a lack of understanding how elections can promote accountability and effectiveness. 4.5.2 I feel that only those elected benefit I feel that only those elected benefit has a strong bearing to the study since the significance value of .050 is equal to the critical value of .05 and is relevant to the study as it is statistically significant (P<0.05) refer to table 4 above. Only12% of the 57 respondents felt that only those elected benefit, whilst 88% of the respondents disagreed with that idea. This disagreement again points to the realisation that political authorities and institutions can perform according to the normative expectations held by students. 4.5.3 Others Others has a strong bearing to the study since the significance value of .002 is equal to the critical value of .05 and is relevant to the study as it is statistically significant (P<0.05) refer to table 4 above. 97% of the respondents agreed that there were other reasons attached to the respondents’ failure to vote, whilst 3% disagreed. 4.6 Sources motivating participation in elections How the respondents value participation in elections is key for the research. The opinions of the key informants are of outmost importance for the study. A free press and the access that people have to a free press play an important role in influencing not only the choices within a democracy, but democracy itself. 58 4.6.1 How much does media influence 35% 34% 35% 30% 25% 20% 17% 14% 15% 10% 5% 0% very much I obtain some valuable information from it not at all only partly Figure 4: How much does media influence you when voting? How much does media influence has a strong bearing to the study since the significance value of .009 is equal to the critical value of .05 and is relevant to the study as it is statistically significant (P<0.05) refer to figure 4 above. 17% of the respondents indicated that media has much influence to the elections, whilst 34% of the respondents indicated that they obtained some valuable information from it, 14% indicated that they did not obtain any valuable information at all and 35% indicated that they only partly obtained valuable information from the media. 59 4.6.2 Television Television has a strong bearing to the study since the significance value of .039 is equal to the critical value of .05 and is relevant to the study as it is statistically significant (P<0.05) refer to table 4 above. Only 43% of the respondents indicated that television influences how people vote, whilst 57% of the respondents disagreed. It is however true that television plays a role in influencing votes for a particular party that has access to the media. 4.6.3 Newspaper Newspaper has a strong bearing to the study since the significance value of .003 is equal to the critical value of .05 and is relevant to the study as it is statistically significant (P<0.05) refer to table above. Newspaper is part of media that influences voting and 43% indicated that their voting is influenced by the Newspapers, whilst 57% of the respondents disagreed. 4.6.4 Reported achievements geared towards national development Reported achievements geared towards national development has a strong bearing to the study since the significance value of .030 is equal to the critical value of .05 and is relevant to the study as it is statistically significant (P<0.05) refer to table 4 above. Only 42% of the respondents indicated that the media influences their choice of voting because it reported achievements geared towards national development, and 58% of the respondents disagreed with this idea. 60 4.6.5 Member of any party Member of any party has a strong bearing to the study since the significance value of .050 is equal to the critical value of .05 and is relevant to the study as it is statistically significant (P<0.05) refer to table 4 above. Only 30% of the respondents are attached to a party, whilst 70% of the respondents are not attached to any party. 4.6.6 I do not actively participate but I have full membership 60% 50% 40% 55% 30% 20% 31% 10% 14% 0% yes not sure no Figure 5: I do not actively participate but I have full membership I do not actively participate but I have full membership has a strong bearing to the study since the significance value of .002 is equal to the critical value of .05 and is relevant to the study as it is statistically significant (P<0.05) refer to table 4 above. Figure 5 depicts that 31% of the respondents have full membership of political parties but do not actively participate, 14% were not sure and 55% were not members of political parties. 61 Table 8: Source: KII Question Participants Responses 1. What is your - Key informant In this regard every - Leader of a political general individual is entitled party understanding of to his/her right or democracy opinion (liberal - democracy)? Democracy is not - only about elections Leader of a political party but to also address the needs and issues affecting the citizens - It is a western word - Lecturer - Leader of a political used to express the rights of citizens within a given state. 2. In your view, is - Namibia a democratic country and why? Yes, because one is satisfied. - Yes, because it has periodic elections, there is freedom of speech. However, there is still room for improvement especially when it party - Representative from ECN 62 comes to socioeconomic welfare of the citizens. - Yes, it provides its citizens with choices in terms of elections. - Lecturer - Lecturer - Political leader - Representative from People are free to criticize the state’s affairs and are allowed to do as such. 3. What is your - Is the right of every understanding on individual to elect democratic his/her leader or elections? government of his/her choice. - Elections should afford the electorates the opportunity to promote the socioeconomic development agenda. - A free and fair process ECN without any intimidation of candidates or voters. 4. Briefly explain - To determine the - Political leaser 63 the importance of government and voting in a leadership, democratic - country? - Political leader - Lecturer - Lecturer - Political leader - Lecturer - Representative from Voting is not an end in itself but it is means to an end, - The privilege or option to have a leader of your choice. 5. What do you - Because they are part of think are the the reasons why the group. youth participate their opinion. exercise in elections? their rights, - decision They making provide Excited about voting for the first time especially the born frees, - Political growth since they are the leaders of tomorrow. 6. What do you - Lack of understanding, think are the influence, incentives reasons why the and motivation. youth do not - They don’t see the party ECN 64 participate in that they belong to elections? taking them serious and - Political leader - Representative from their issues are not being given adequate priority. - Excluded from the political frontline and limited understanding of NYC its importance. 7. In your view, briefly explain - No reason, - Political leader - To strengthen the - Political leader Educate them and - Political leader incentivize them - Political leader the importance of existing political youth concepts and maintain participation in political stability. elections for a country such as Namibia? 8. It is believed that - the youth do not participate in - Yes, there is a elections. What significant participation do you think of the youth as voters, should be done to but more could be done 65 encourage them to bring in more youth to participate? as candidates. - Representative from To make room for more ECN youth to serve in critical positions and to rewards those deserving. 9. Should voting be - a legal obligation or a personal A personal right - because it is a secret - Representative from ECN It should remain as a right? (Explain personal right to allow why) people to exercise it - Lecturer - Representative from when they so wish to vote or be voted for. - It should be a legal obligation for those eligible to partake in NYC order to have responsible citizens that should also contribute to state affairs through participation. 10. In your view, - Clear programs with - Representative from 66 what influences the way the youth direct benefits - votes? - NYC Availability of - Political party leader information - Political party leader - Lecturer - Representative from Their perception of how their issues are being dealt with by various parties and candidates. - The political ideology in which they find themselves. 11. What do you think - Individual candidates are the reasons why may have different people vote for the personalities than the candidate of a ideologies of the party, particular party but - No response, not necessarily - It is not common and if voting for the same it does happen, it’s a party? Does it affect sign of a matured democracy? democracy, ECN - Political party representative - Lecturer and ECN representative 12. In your view, do you - think returnee youth have a different I think the perception is - the same. - I don’t know. Representative from ECN - Political party leader 67 perception on - Yes, they feel that the participation, and party (s) they vote owe why? them in one way or the - Political party leader - Lecturer - Political party leader - Political party leader - Political party leader - Lecturer other. 13. Do you think female - Yes, because both youth are equally genders receive aware of their information the same. democratic rights to - Male youth seems more vote in comparison vocal compered to their to male youth? State female counterparts the reason(s) - Yes, the ground is levelled and all have equal access to information. 14. Do you think - It does because, a ethnicity influences candidate from a small elections in tribe suffers in a Namibia? Is it good democratic election or bad for nation - building? Yes it does influence, because it remains a very influential tool for political socialization - Yes, because people 68 normally vote in line - with what they feel is Representative from Political leaders easy and convenient for them of which might have a negative influence on the democracy. 15. Do you think media - They do play a big role (TV, radio, since most of the newspaper) plays a people are glued to role on voters’ television and radio education in before and during Namibia? elections, - - Representative from NYC Yes, but more could be done especially in terms of promoting debates focusing on issues between the different candidates. Indeed a great role in terms of information sharing and also influence people to vote - Representative from ECN 69 in a particular manner, 4.6.7 Aware of political party policies Aware of party policies has a strong bearing to the study since the significance value of .000 is equal to the critical value of .05 and is relevant to the study as it is statistically significant (P<0.05) refer to table 4 above. Only 26% of the respondents indicated that they were aware of party policies, whilst 74% of the respondents were not aware of party policies. 4.6.8 It allows me to vote for the person I want 60% 51% 50% 40% 30% 18% 20% 13% 10% 8% 10% 0% very aware aware average unaware very unaware Figure 6: It allows me to vote for the person I want It allows me to vote for the person I want has a strong bearing to the study since the significance value of .001 is equal to the critical value of .05 and is relevant to the study as it is statistically significant (P<0.05) refer to table 4 above. Figure 6 depicts 70 that 8% of the respondents were very aware of what voting meant to them since it allowed them to vote for the person they wanted, 18% were aware, 51% were on average, 13% were unaware and 10% were very much unaware. 4.6.9 I don’t see its importance I don’t see its importance has a strong bearing to the study since the significance value of .000 is equal to the critical value of .05 and is relevant to the study as it is statistically significant (P<0.05) refer to table 4 above. Only 49% of the respondents indicated that they did not see the importance of voting, whilst 51% disagreed with the other respondents. 4.6.10 It is mainly important for democracy It’s mainly important for democracy a strong bearing to the study since the significance value of .001 is equal to the critical value of .05 and is relevant to the study as it is statistically significant (P<0.05) refer to table 4 above. Only 64% of the respondents indicated that voting was mainly important for democracy, whilst 36% of the respondents disagreed. 71 4.6.11 Officials to be trusted 60% 50% 40% 30% 20% 10% 0% 53% 17% 9% 7% 11% 3% Figure 7: Officials to be trusted in public office Officials to be trusted has a strong bearing to the study since the significance value of .050 is equal to the critical value of .05 and is relevant to the study as it is statistically significant (P<0.05) refer to table 4 above. Figure 7 suggests that 17% of the respondents indicated that they trusted presidents of parties to deliver on their promises, 9% trusted national assembly officials, and 7% regional authorities’ officials, 11% local authorities’ officials and 53% indicated that they trusted none of the above mentioned officials. 72 4.6.12 Regional Councilors 60% 0.6 0.5 0.4 0.3 19% 0.2 0.1 3% 2% always contact most of time 6% 10% 0 sometimes contact rarely contact never contact contact Figure 8: Regional councilors Regional Councillors has a strong bearing to the study since the significance value of .001 is equal to the critical value of .05 and is relevant to the study as it is statistically significant (P<0.05) refer to table 4 above. Figure 8 states that 3% of the respondents always contacted the Regional Councillors, 2% contact them most of the time, 6% sometimes contact them, 10% rarely contact them, 60% never contacted them and only 19% contacted them. 73 4.6.13 Local Authority Councilors 60% 50% 40% 30% 51% 20% 10% 0% 4% 6% 12% 10% 17% Figure 9: Local Authority Councilors Local Authority Councillors has a strong bearing to the study since the significance value of .018 is equal to the critical value of .05 and is relevant to the study as it is statistically significant (P<0.05) refer to table 4 above. Figure 9 suggests that 4% of the respondents always contact Local Authority Councillors, 6% contacted them, 12% sometimes contacted them, 10% rarely contacted them, 51% never contacted them and 17% contacted them. 74 4.6.14 Traditional leaders 50% 40% 30% 20% 10% 0% 48% 13% 7% 7% 10% 15% Figure 10: Traditional Leaders Traditional Leaders has a strong bearing to the study since the significance value of .025 is equal to the critical value of .05 and is relevant to the study as it is statistically significant (P<0.05) refer to table 4 above. Figure 10 depicts that 13% of the respondents always contacted the Traditional Leaders, 7% contacted them most of the time, 7% sometimes contacted them, 10% rarely contacted them, 48% never contacted them and 15% contacted them 75 4.6.15 State what is true 0.6 0.5 0.4 56% 0.3 0.2 0.1 0 21% 7% 6% namibia is namibia is not a a democracy democracy with its problems namibia is a namibia is a democracy complete with minor democracy problems 10% I don’t know Figure 11: Namibia being a Democracy State what is true has a strong bearing to the study since the significance value of .020 is equal to the critical value of .05 and is relevant to the study as it is statistically significant (P<0.05) refer to table 4 above. Figure 11 states that 6% of the respondents stated that Namibia is not a democratic state, 56% indicated that Namibia is a democratic state with its problems, 21% indicated that Namibia is a democratic state with minor problems, 7% indicated that Namibia is a complete democratic state and 10% of the respondents did not know. 76 4.6.16 It does not matter what type of government is in power in a democratic state 0.5 0.4 0.3 45% 35% 0.2 0.1 20% 0 agree don’t agree don’t know Figure 12: Type of government in power It does not matter what type of government is in power in a democratic state has a strong bearing to the study since the significance value of .031 is equal to the critical value of .05 and is relevant to the study as it is statistically significant (P<0.05) refer to table 4 above. Figure 12 states that 20% of the respondents agreed that it does not matter what type of government is in power in a democratic state, 45% disagreed and 35% of the respondents did not know. 77 4.6.17 A democratic government is preferable to any other kind of government 60% 46% 40% 22% 20% 32% 0% agree don’t agree don’t know Figure 13: Democratic government A democratic government preferable to any other kind of government has a strong bearing to the study since the significance value of .040 is equal to the critical value of .05 and is relevant to the study as it is statistically significant (P<0.05) refer to table 4 above. Figure 13 indicated that 46% of the respondents agreed that a democratic government is preferable to any other kind of government, 22% disagreed and 32% indicated that they did not know. In as much as elections are important for any democratic system, the table below shows the comments from the FGD on its relevance and why students value it as important or otherwise. 78 Table 9: Source: FGD Summary Data: Sub Questions Why do the youth vote, and how important could that be? Which elections do the youth participate the most? Themes and Sub Themes Participants Responses Interpretations/Reflections/Observations Theme: Participation in elections - We don’t see the reasons as to why we should not participate, - In order for my party of preference to win, - For development and national security, Summary Data: Sub Questions What are your experiences about the elections that you think you (youth) participate the most? Themes and Sub Themes Participants Responses Interpretations/Reflections/Observations Theme: Type of elections - The youth mostly participate in the national elections; “the regional and local elections are 79 less participated because we are not allowed to vote in regions or local authorities where we are not registered as residents”. This also makes it impossible for us to know the candidates contesting in elections. - Most of the focus on election is mainly on the national and presidential elections. 80 Table 10: Source: KII 1. What do you think are the reasons - why the youth do not participate in elections? Lack of understanding, influence, incentives and motivation. - They don’t see the party that they belong to taking them serious and their issues are not being given adequate priority. - Excluded from the political frontline and limited understanding of its importance. 2. In your view, briefly explain the - No reason, importance of youth participation - To strengthen the existing political in elections for a country such as concepts and maintain political Namibia? stability. 3. It is believed that the youth do not - Educate them and incentivize them participate in elections. What do - Yes, there is a significant you think should be done to participation of the youth as voters, encourage them to participate? but more could be done to bring in more youth as candidates. - To make room for more youth to 81 serve in critical positions and to rewards those deserving. 4. Should voting be a legal - obligation or a personal right? (Explain why) A personal right because it is a secret - It should remain as a personal right to allow people to exercise it when they so wish to vote or be voted for. - It should be a legal obligation for those eligible to partake in order to have responsible citizens that should also contribute to state affairs through participation. 4.7 Conclusion This Chapter focused on the presentation of results obtained from the survey, and these results were presented in tables and graphs format. A number of important issues emerged from the results. These issues are addressed in the concluding chapter. 82 CHAPTER 5: DISCUSSION AND RECOMMENDATIONS 5.1 Summary of the findings The genesis of this study was to ascertain the attitudes and practices of students towards elections. In addition, this study was also geared towards assessing students’ understanding of their democratic rights and civic responsibilities. Furthermore, an attempt was made to investigate students’ satisfaction with the way democracy currently works. Finally, this thesis wanted to assess how students’ value participating in presidential and national elections. A fruitful entry point is to agree with key informants who pointed out that democracy is not only about elections, but to also addresses the needs and issues affecting the citizens. This postulate is of particular importance to the youth, in general, and students in particular. Generally, this study concluded that students participate in elections for a variety of reasons. Disconcertingly, however, lack of interest in elections by students has been mainly caused by empty promises made by the politicians, such that the youth have felt isolated. The way the youth see things is different from the way political parties run things. The political parties programmes do not carter for the youth interests as a result this pushes them away. A lot of work has to be done by the stakeholders to involve the youth as they form part of the future generation. Voter participation to most of the youth is a sheer waste of time. This trend has to change as the adults and youth join hands and work together for the development of the nation. 83 5.2 Research Question 1: What are the attitudes and practices of students towards elections? The majority of the students are not keen to participate in elections. They have a wrong perception and wrong attitude towards elections. There is a lot of ground work that needs to be covered to ascertain that the youth are educated and have acquired the right frame of mind regarding elections. 5.3 Research Question 2: Do students understand their democratic rights and civic responsibilities? Students do not understand their democratic rights and civic responsibilities. The results obtained from this study reflected that students are ignorant of their democratic rights and civic responsibilities. They need to be educated on their democratic rights and civic responsibilities, in order for them to appreciate and change their attitude towards elections. 5.4 Research Question 3: Are students satisfied with the way democracy currently works? Most of the students are not even aware of the way the current democracy system is working. The fact that they do not know simply means that they are not satisfied. Pertaining to issues that concern them they are not satisfied at all. The fact that they are out of the system makes it difficult for them to voice their concerns. 84 5.5 Research Question 4: How do students value participating in Presidential and National Elections? The majority of the students do not value participating in Presidential and National Elections since they assume that it does not concern them, and does not change their welfare and well-being. Just a few of the students are actively participative, whilst the majority is not interested. Something has to be done to bring them aboard. Majority of the youth in Windhoek, Namibia do not know their rights and are ignorant of their rights or privileges. Majority of the youth said that they cannot vote because of long queues, and the distance they have to walk in order to reach a polling station. The key informants had the following to say on democracy: It is a western word used to express the rights of citizens within a given state. Whether is Namibia a democratic country and why? Most of them showed some degree of satisfaction because according to them there are periodic elections, the exercise of freedom of speech. Hence there is also a comment that there is still room for improvement especially when it comes to socioeconomic welfare of the citizens. Citizens are granted the preference of choice as to who to vote and also to be voted into office. People are free to criticize the state’s affairs and are allowed to do as such. 85 The reasons why the youth participate in elections, is mainly because they are part of the decision making group. And while the contrary as to why they do not participate is cited as lack of understanding, influence, incentives and motivation, they don’t see the party that they belong to taking them serious and their issues are not being given adequate priority. While some feel that they are excluded from the political frontline. Male students or youth are seen as more vocal compared to the female counterparts hence they all have equal access to information on services to participate. Generally there is much that needs to be done by political parties if they are to be in touch with the youth. Most of the youth are not voting and are not interested in a political change. The youth have grievances and promises which were not met as a result most of them want to distance themselves away from politics. The youth form the future generation as a result if political parties are not careful they will eventually become irrelevant. 5.6 Recommendations 5.6.1 Voter Education The Electoral Commission of Namibia has a lot of work to do by engaging and educating the youth to know their constitutional rights. Voting is one of their constitutional rights. There is no way they can influence a change or lobby for their interests except if they can only speak the ballot box. Voter education could help to create youth voting awareness and would encourage them to participate. The youth need to know that their vote can change things. Their interests and grievances can only be heard if they participate in elections. 86 5.6.2 Importance of voting The youth need to be trained on the importance of their participation in elections. Political parties also have a duty to do as they also scout for membership. If the youth do not know that voting is their democratic right, they might not to participate and as a result, their voice will never be heard, and the government and political parties would not hear their voice as well. Their participation is critical and is very much needed for the future of the country. 5.6.3 Media influence in voting The media coverage also plays a role in terms of influence especially during the election campaigns. This to a certain extend has an influence on how the youth votes. Political parties also make use of the media to influence the youth to a certain extend. 5.6.4 Lack of trust The youth tends not to trust political leadership due to empty promises that they make when campaigning. The youth would be promised jobs, loans for projects and many more promises which translate to nothing after the elections. This has a negative effect as it drives the youth away from the politicians. Political leaders should be the role models to the youth, but this is not like that. There is a lot of work that the political figures should do to gain the confidence of the youth. 87 5.6.5 Party membership Political parties should carry out membership drives by engaging the youth. Youth Policies should be crafted and implemented by the political parties. It is one other thing to have policies and programmes in place and it also becomes another issue to have these policies and programmes implemented. Youth involvement from the start is a noble idea. The results of the study reflected that the majority of the respondents do not have political parties they are affiliated to. If only the political parties can move ahead and incorporate, educate and involve the youth in their party activities, then they can attract the attention of these youth. 5.7 Concluding remarks Based on the findings the following are recommended: 1. Youth voter education is encouraged to eliminate voter apathy in the students category. 2. Create and develop outreach programmes that attract the students to participate in political activities. 3. Engage the youth in political activities to generate interest in them to participate in elections. 4. Harness the media to educate and encourage the youth to use their democratic rights and civic responsibilities through voting. 88 5. Political parties should have youth policies that target the youth as they geaar towards membership drive. 6. Political parties should involve the youth in their political activities as a way of encouraging them to participate. 7. The Government should put strategies in place to carter for the youth involvement. 89 REFERENCES Aarts, K., Thomassen, J., (2008). Satisfaction with democracy: do institutions matter? Electoral Studies 27 (1), 5–18. Achterberg, P., 2006. Class voting in the new political culture. International Sociology 21 (2), 237–261. Altemeyer, B. (1996). The authoritarian specter (p. 374). Cambridge, MA: Harvard University Press. Alwin, D.F., 1991. Family of origin and cohort differences in verbal ability. American Sociological Review 56, 625–638. Anderson, C., Blais, A., Bowler, S., Donovan, T., Listhaug, O., (2005). Losers’ Consent. Elections and Democratic Legitimacy. Oxford University Press, Oxford. Anderson, C., Guillory, C., (1997). Political institutions and satisfaction with democracy. A cross-national analysis of consensus and majoritarian systems. American Political Science Review 91 (1), 66–81. Anderson, C., Just, A., 2012. Partisan legitimacy across generations. Electoral Studies 31, 306–316. Anderson, C.J., (2000). Economic voting and political context. A comparative perspective. Electoral Studies 19 (2–3), 151–170. 90 Armingeon, K., (2002). The effects of negotiation democracy. A comparative analysis. European Journal of Political Research 41 (1), 81–105. Banducci, S.A., Donovan, T., Karp, J.A., (1999). Proportional representation and attitudes about politics. Results from New Zealand. Electoral Studies 18 (4), 533– 555. Beck, P.A., 1974. A socialization theory of partisan realignment. In: Niemi, R.E. (Ed.), The Politics of Future Citizens: New Dimensions in the Political Socialization of Children. Jossey-Bass, San Fransisco. Bhatti, Y., Hansen, K.M., 2012. The effect of generation and age on turnout to the European Parliament – How turnout will continue to decline in the future. Electoral Studies 31, 262–272. Blais, A., Gidengil, E., Nevitte, N., Nadeau, R., 2004. Where does turnout decline come from? European Journal of Political Research 43, 221–236. Bok, D., (1997). Measuring the performance of government. In: Nye, J.S., Zelikow, P.D., King, D.C. (Eds.), Why People Don’t Trust Government. Harvard University Press, Cambridge, pp. 55–76. Bovens, M., Wille, A., (2008). Deciphering the Dutch drop. Ten explanations for decreasing political trust in the Netherlands. International Review of Administrative Sciences 74 (2), 283–305. 91 Campbell, A., Converse, P.E., Miller, W.E., Stokes, D.E., 1960. The American Voter. John Wiley & Sons, New York. Carmines, E., Stimson, J.A., 1981. Issue evolution, population replacement, and normal partisan change. American Political Science Review 75 (1), 107–118. Claggett, W., 1981. Partisan acquisition v. Partisan identity: life cycle, generation, and period effects. American Journal of Political Science 25, 193–214. Criado, H., Herreros, F., (2007). Political support taking into account the institutional context. Comparative Political Studies 40 (12), 1511–1532. Dalton, R., (2004). Democratic Challenges, Democratic Choices. The Erosion of Political Support in Advanced Industrial Democracies. Oxford University Press, Oxford. Easton, D., (1965). A Systems Analysis of Political Life. Wiley, New York. Easton, D., (1975). A re-assessment of the concept of political support. British Journal of Political Science 5 (4), 435–457. Elazar, D.J., (1997). Contrasting unitary and federal systems. International Political Science Review 8 (3), 237–251. Evans, G. (Ed.), 1999. The End of Class Politics? Class Voting in Comparative Context. Oxford University Press, Oxford. 92 Flanagan, S.C., 1987. Value change in industrial societies. American Political Science Review 81 (4), 1303–1319. Franklin, M., 1992. The decline of cleavage politics. In: Franklin, M., Mackie, T., Valen, H. (Eds.), Electoral Change. Responses to Evolving Social and Attitudinal Structures in Western Countries. Cambridge University Press, Cambridge. Franklin, M., 2004. Voter Turnout and the Dynamics of Electoral Competition in Established Democracies Since 1945. Cambridge University Press, New York. Franklin, M., Ladner, M., 1995. The undoing of Winston Churchill: mobilization and conversion in the 1945 realignment of British voters. British Journal of Political Science 25, 429–452. Franklin, M., Mackie, T., Valen, H. (Eds.), 1992. Electoral Change. Responses to Evolving Social and Attitudinal Structures in Western Countries. Cambridge University Press, Cambridge. Franklin, M., van Spanje, J., 2012. How established voters react to new parties? The case of Italy, 1985–2008. Electoral Studies 31, 297–305. Fuchs, D., Klingemann, H.-D., 1990. The left-right scheme: theoretical framework. In: Jennings, M.K., van Deth, J. (Eds.), Continuities in Political Action: A Longitudinal Study of Political Orientations in Three Western Democracies. De Gruyter, Berlin. 93 Hix, S., 1999. Dimensions and alignments in European Union Politics: cognitive constraints and partisan responses. European Journal of Political Research 35, 69– 106. Holmberg, S., 2007. Partisanship Reconsidered. In: Dalton, R.J., Klingemann, H.-D. (Eds.), The Oxford Handbook of Political Behaviour. Oxford University Press, Oxford, pp. 557–570. Hooghe, M., 2004. Political socialization and the future of politics. Acta Politica 39, 331–341. Hooghe, M., Wilkenfeld, B., 2008. The Stability of political attitudes and behaviours across adolescence and early adulthood: a comparison of survey data on adolescents and young adults in eight countries. Journal of Youth Adolescence 37, 155–167. Inglehart, R., 1984. The changing structure of political cleavages in Western Society. In: Dalton, R.J., Flanagan, S.C., Beck, P.A. (Eds.), Electoral Change in Advanced Industrial Democracies: Realignment or Dealignment? Princeton University Press, Princeton, pp. 25–69. Jennings, M.K., 2007. Political socialization. In: Dalton, R.J., Klingemann, H.-D. (Eds.), The Oxford Handbook of Political Behaviour. Oxford University Press, Oxford, pp. 29–44. Kapelwa-Kabajani, R. (2000). Ministry of Youth and Sport. Namibia In A decade of peace, democracy and prosperity 1990-2000. Windhoek: Government of the Republic of Namibia. 94 Keulder, C. 1998. Popular perceptions and opinions of Namibian students: survey findings of students. A report to the National Democratic Institute for International Affairs (NDI). Windhoek, Namibia. Keulder, C., & Spilker, D. 2001. Political and social participation among Namibia’s youth. IPPR Briefing Paper No. 8. Retrieved from the web on September 5, 2008: http://www.ippr.org.na/publications.php. Keulder, C., & Van Zyl, D. 2001. An overview of the youth and politics survey 2000/2001. Findings. IPPR Briefing Paper No. 9. Retrieved from web on May 1, 2010: http://www.ippr.org.na/Briefing%20Papers/BP9.PDF. Keulder, C. 2006. Afrobarometer survey. Afrobarometer Survey Findings Summary of Results. Retrieved from the web on January 5, 2015: http://www.afrobarometer.org/files/documents/summary_results/nam_r3_sor.pdf . Keulder, C. 2008. Afrobarometer survey. Afrobarometer Survey Findings Summary of Results. Retrieved from the web on January 5, 2015 http://scholar.google.com/scholar?q=Afrobarometer+Survey+2008+namibia&hl=en &as_sdt=0&as_vis=1&oi=scholart&sa=X&ei=B4HLV Keulder, C. 2013. Afrobarometer survey. Afrobarometer Survey Findings Summary of Results. Retrieved from the web on January 5, 2015. http://www.afrobarometer.org/results/results-by-country-n-z/namibia 95 Kitschelt, H., 2004. Diversification and Reconfiguration of Party Systems in Postindustrial Democracies. Friedrich Ebert Stiftung, Bonn. Knutsen, O., 2001. Social class, sector employment, and gender as party cleavages in the Scandinavian countries: a comparative longitudinal study, 1970–95. Scandinavian Political Studies 24 (4), 311–350. Knutsen, O., 2004. Religious denomination and party choice in Western Europe: a comparative longitudinal study from eight countries, 1970–97. International Political Science Review 25 (1), 97–128. Konzelmann, L., Wagner, C., Rattinger, H., 2012. Turnout in Germany in the course of time: Life cycle and cohort effects on electoral turnout from 1953 to 2049. Electoral Studies 31, 250–261. Kriesi, H., Grande, E., Lachat, R., Dolezal, M., Bornschier, S., Frey, T., 2006. Globalization and the transformation of the national political space: six European countries compared. European Journal of Political Research 45 (6), 921–956. Kriesi, H., Grande, E., Lachat, R., Dolezal, M., Bornschier, S., Frey, T., 2008. West European Politics in the Age of Globalization. Cambridge University Press, Cambridge. Latukhina, M., 2013. Multiple maternities and social change: the case of university students in Namibia; thesis submitted to university of Saskatchewan, Saskatoon. 96 Lyons, W., Alexander, R., 2000. A Tale of two electorates: generational replacement and the decline of voting in Presidential elections. Journal of Politics 62 (4), 1014– 1034. Miller, W.E., 1992. The puzzle transformed: explaining declining turnout. Political Behavior 14 (1), 1–43. Mindich, D., 2005. Tuned Out: Why Americans under 40 Don’t Follow the News. Oxford University Press, Oxford. Van Zyl, D., & Keulder, C. 2001. Youth and democracy in Namibia: results of the youth and politics 2000/01 survey. IPPR Research Report No. 1. Wikan, G. Non-enrolled, drop-outs and pupils. The state of education for all in Namibia. Retrieved from the web on May 9, 2013: http://www.pef.uni-lj.si/atee/978961-6637-06-0/261-269.pdf. 97 APPENDIX APPENDIX 1: SURVEY QUESTIONNAIRE Student Masters in Public Administration Department of Public Administration and Political Studies University of Namibia, Windhoek, Namibia I, Evaristus Evaristus a Masters student of the University of Namibia, as part of my academic requirement for a master degree in public administration is conducting a survey on ‘Democracy Building and Civic Responsibility: An analysis of tertiary students’ participation in the 2009 National Elections Focusing on Windhoek’, in partial fulfilment of the requirement of the studies. In order for the study to be successful, I would like to seek for your assistance in this academic venture by honestly answering the questionnaire attached. The information being collected will ONLY be used for this academic work and is entirely confidential. Your cooperation and assistance in this regard will be highly appreciated. 98 SECTIONS COVERED IN THE QUESTIONNAIRE Section: A Respondent’s demographic information Section: B Educational /level of study Section: C Reasons why respondents vote Section: D Type of elections respondents participated Section: E Influences on voting choices Section: F Level of awareness on elections Section: G Level of awareness on political participation Section: H Democracy in Namibia 99 Quantitative Questionnaire SECTION: (A) RESPONDENT’S DEMOGRAPHIC INFORMATION 1. Age group 1 18-21 2 22-25 3 26-29 4 30-34 2. Gender 1 Male 2 Female 3. Marital status 1 Married 4 Living together 2 Divorced 5 Widow 3 Single 5 Herero 4. Home language 1 Afrikaans 100 2 Damara/Nama 6 Oshiwambo 3 English 7 Rukwangali 4 German 8 Other 5. You are a Namibian by 1 Birth 4 Registration 2 Descent 5 Naturalization 3 Marriage 6 Others 6. Are you a returnee? 1 Yes 2 No 7. How long have you lived in Namibia? 1 1-5 years 2 6-10 years 3 10+ years 4 All my life 101 SECTION: (B) EDUCATIONAL /LEVEL OF STUDY 8. Institution at which you are studying? 1 International University of Management 2 Monitronics Success College 3 Polytechnic of Namibia 4 University of Namibia Khomasdal Campus 5 University of Namibia Main Campus 9. Education level 1 1st year 2 2nd year 3 3rd year 4 4th year 5 Postgraduate SECTION: (C) REASONS WHY RESPONDENTS VOTE 10. How important is voting to you? 1 Very important 2 Important 102 3 Do not know 4 Unimportant 5 Very unimportant 11. What are your reasons for voting? Reasons 1 I want things to improve 2 Because I want the party of my choice to win 3 It is my democratic right 4 I feel it is an obligation to vote 5 I am unsure as to why I vote 6 I care about my country so I will vote the party I think Yes No can build the nation 7 I don’t want the wrong party to win 8 Other specify: …………………………………………………………………………………… 12. The next time you vote, how likely are you to vote for the same party that you previously voted for? 1 Very likely 2 Likely 103 3 Neutral 4 Unlikely 5 Very unlikely 13. How likely is it that you might vote for the president of a party and not the party? 1 Very likely 2 Likely 3 Neutral 4 Unlikely 5 Very unlikely SECTION: (D) TYPES OF ELECTIONS PARTICIPATED 14. In how many elections did you participate? 1 None 2 1-3 elections 3 4-6 elections 4 7+ elections 15. If none for Q-14, give reasons for not participating? RESPONDENTS 104 (Answer only if you answered none for Q-14). Reason for not participating Yes 1 My vote will not make any difference 2 I am not interested in elections 3 I don’t see the importance of participating 4 All parties are the same and it makes no difference 5 Others specify: No …………………………………………………………………………………… 16. In which elections did you participate from the below? (Answer ONLY if you answered Q-14 and choose number 2-4). Yes No Type of election 1 Presidential elections 2 National Assembly elections 3 Regional elections 4 Local Authority elections 17. Do you plan to vote in the next Presidential, National Assembly and Local Authority elections? (choose one answer for each election) Option Presidential National Assembly Local Authority 105 1 Yes, I will vote 2 Not sure 3 No, I will not vote 18. If you chose YES for (Q-17), why? Reasons Yes No Yes No 1 To vote for leader(s) of my choice 2 I want to vote for change 3 I want to vote for my party to win 4 It is my democratic right to participate in elections 5 Others specify: 19. If you chose NO for (Q-17), why? Reason for not participating 1 Because I don’t trust the election system 2 My vote will not make a difference 3 I feel that only those elected benefit 4 There is no candidate of my choice 5 Others specify: 106 SECTION: (E) INFLUENCES ON VOTING CHOICES 20. Do the people around you influence your choice of vote? 1 Yes 2 No 21. In what way do people influence your choice of vote? Options 1 I vote according to how my parents vote 2 I often vote the same way as my friends vote 3 I vote as my husband/wife vote 4 I vote because I am a loyal member of my party 5 Other specify: 22. How much do the media influence your voting? 1 Very much 2 I obtain some valuable information from it 3 Only partly 4 Not at all Yes No 107 23. Which type of media influence your decision to vote? (Answer only if you answered Q-22, and choose number 1-3) Yes No Options 1 Television 2 Radio 3 Newspaper 4 Others 24. In what way do the media influence your choice? (Answer only if you answered Q-23, and choose number 1-3) Yes No Reasons 1 The way the media covers the presentation of parties manifestos at elections 2 Reported achievements geared towards national development 3 By the frequent reports of parties activities before and during elections 4 Others specify: 25. Most people who vote like me are from my ethnic group. 1 Mostly aware 108 2 Just aware 3 Don’t agree 4 Mostly disagree 5 Don’t know SECTION: (F) LEVEL OF AWARENESS ON ELECTIONS 26. Are you a member of any political party? 1 Yes 2 Not sure 3 No 27. If yes for Q-26, how do you view your role in the organization or party you are a member off? Reasons 1 I participate actively in the work of the party 2 I do not actively participate, but I have full membership 3 Others: Yes No 109 28. How aware are you of political party(s) policies? 1 Very unaware 2 Aware 3 Average 4 Unaware 5 Very unaware 29. How did you become aware of the political party(s) policies? Reasons 1 By attending their political meetings and rallies 2 By reading their manifestos 3 Through media awareness 4 Through discussions with friend and family members 4 Others specify: Yes No 110 30. What does voting mean to you? Yes No Meaning 1 It allows me to vote for the person I want 2 I can vote out a candidate that I don’t like 3 I don’t see its importance 4 It’s mainly important for democracy 5 I don’t know its meaning SECTION: (G) LEVEL OF POLITICAL AWARENESS AND PARTICIPATION 31. Which of the following officials can be trusted to deliver on their promises? If any, state the reasons why? If none, continue answering Q-32. Types of officials 1 Presidential officials of parties 2 National Assembly officials 3 Regional Authorities Official 4 Local Authority elections 5 Youth Leaders officials 6 None Reasons 111 32. If you have answered none for Q-31, state the reasons. ………………………………………………………………………………………… ………………………………………………………………………………………… 33. Have you personally done any of these things during the past year? (choose one answer for each activity) Activity 1 Working with others in your community on solving community problem 2 Contacting/writing to governmental officials (local/extra-local) on the individual issue(s) 3 Consulting local/regional/national Yes, I No, but No, and I I do not have would do would know/do done if I had a never do not chance this remember 112 officials on a public issue 4 Writing a letter or viewpoint on political issue(s) to a journal/newspaper 5 Participating in lawful demonstrations, rallies, marches 6 Collaborating with local/regional/national officials on solving a public issue 7 Contacting/writing to governmental officials (local/extra-local) on local/regional/national issue(s) 34. Which of the following political officials have you contacted in the last year or so? (choose one answer for each political official or a group of officials) Official Always Contact Sometimes Rarely Never I contact most of contact contact contact don’t 113 the time s 1 The President 2 Members know of Parliament 3 Regional councillors 4 Local authority councillors 5 Traditional Leaders Section: (H) Democracy in Namibia 35. Choose of the following statements with which you agree: 1 Namibia is not a democracy 2 Namibia is a democracy with some major problems 3 Namibia is a democracy with some minor problems 4 Namibia is a complete democracy 5 I don’t know 36. Which of the following statements do you agree or disagree with? Statement Agree Don’t Don’t 114 Agree 1 In some circumstances a know non-democratic government can be preferable to a democratic one 2 It does not matter what kind of government is in power in a democratic state 3 A democratic government is preferable to any other kind of government 4 It is democratic for the government only appoint it is party loyal members into high government positions 37. Can you, please, name the national problems/issues that you think compromises democracy in Namibia, and motivation thereof? ………………………………………………………………………………………… 38. What political rights do Namibians have? (choose as many answers as you want) 1 The right to participate in peaceful demonstration and rallies 2 The right to vote and be elected 3 The right to participate in government affairs 4 Freedom of speech 5 The right to political association 115 6 The right to petition 7 None of the rights 116 APPENDIX 2: FOCUS GROUP DISCUSSION SCHEDULE Title: Democracy building and civic responsibility: An analysis of tertiary students’ participation in the 2009 presidential and national elections focusing on Windhoek. Topic: Focus Group Discussion I, the undersigned, hereby declare that I understand the purpose of this focus group discussion, and have been informed that the information I have provided will only be used for follow-up purposes and that under no circumstance will any of my particulars be linked with any information that I provide. I also know that I can withdraw from participating at any time. I, therefore, willingly consent to participate in the discussion on the above mentioned topic. Participant’s gender: _________________________ Participant’s age in years: _________________________ Participant’s contact details: _________________________ Signed at __________________ on the ________ day of ________________ 2011 Signature: ____________________________ 117 Introduction Greet participant and self-introduction, allow questions if any Explain the purpose of the discussion and the ethical issues Desensitize participants to the recording media (video recording) Obtain written consent Discussions What is your understanding of democracy? What is your understanding of elections? In your view, what roles does ECN play in persuading the youth to participate in elections? What could be the reasons why the youth vote, and how important could that be? Which elections do the youth participate the most? It is believed that there are youth that do not participate in elections; in your view, what could be the reasons? What influences the way the youth/students vote? Follow with probing questions as necessary. 118 APPENDIX 3: KEY INFORMANTS INTERVIEW GUIDE Title: Democracy building and civic responsibility: An analysis of tertiary students’ participation in the 2009 presidential and national elections focusing on Windhoek. Topic: Key Informants Interview (respondents) I, the undersigned, hereby declare that I understand the purpose of this focus group discussion, and have been informed that the information I have provided will only be used for follow-up purposes and that under no circumstance will any of my particulars be linked with any information that I provide. I also know that I can withdraw from participating at any time. I, therefore, willingly consent to participate in the discussion on the above mentioned topic. Participant’s organization: _________________________ Participant’s contact details: _________________________ Participant’s level of education: Signed at __________________ on the ________ day of ________________ 2011 Signature: ____________________________ 119 1. What is your general understanding of democracy (liberal democracy)? ………………………………………………………………………………………… ………………………………………………………………………………………… 2. In your view, is Namibia a democratic country and why? ………………………………………………………………………………………… ………………………………………………………………………………………… 3. What is your understanding on democratic elections? ………………………………………………………………………………………… ………………………………………………………………………………………… 4. Briefly explain the importance of voting in a democratic country? ………………………………………………………………………………………… ………………………………………………………………………………………… 5. What do you think are the reasons why the youth participate in elections? ………………………………………………………………………………………… ………………………………………………………………………………………… 120 6. What do you think are the reasons why the youth do not participate in elections? ………………………………………………………………………………………… ………………………………………………………………………………………… 7. In your view, briefly explain the importance of youth participation in elections for a country such as Namibia? ………………………………………………………………………………… ………………………………………………………………………………… 8. It is believed that the youth do not participate in elections. What do you think should be done to encourage them to participate? ………………………………………………………………………………… ………………………………………………………………………………… 9. Should voting be a legal obligation or a personal right? (Explain why) ………………………………………………………………………………… ………………………………………………………………………………… 10. In your view, what influences the way the youth votes? ………………………………………………………………………………… ………………………………………………………………………………… 121 11. What do you think are the reasons why people vote for the candidate of a particular party but not necessarily voting for the same party? Does it affect democracy? ……………………………………………………………………………… ……………………………………………………………………………… 12. In your view, do you think returnee youth have a different perception on participation, and why? ………………………………………………………………………………… ………………………………………………………………………………… 13. Do you think female youth are equally aware of their democratic rights to vote in comparison to male youth? State the reason(s). ………………………………………………………………………………… ………………………………………………………………………………… 14. Do you think ethnicity influences elections in Namibia? Is it good or bad for nation building? ………………………………………………………………………………… ………………………………………………………………………………… 122 15. Do you think media (TV, radio, newspaper) plays a role on voters’ education in Namibia? ………………………………………………………………………………… ………………………………………………………………………………… 123 APPENDIX 4: ONE – WAY ANOVA STATISTICAL RESULTS Sum of Df Squares Between Groups 9789.674 Question Paper Age Group Gender Marital status 4 656860.326 195 Total 666650.000 199 2447.419 4 .962 Within Groups 152.027 195 .780 Total 155.875 199 Between Groups .783 4 .196 Within Groups 48.237 195 .247 Total 49.020 199 Between Groups .219 4 .055 Within Groups 29.336 195 .150 Total 29.555 199 Total Sig. .727 .575 3368.514 Between Groups 3.848 Home Language Within Groups F Square Within Groups Between Groups 4.305 Namibian by Mean 4 1.076 559.890 195 2.871 564.195 199 Between Groups 4.994 4 1.249 Within Groups 286.506 195 1.469 Total 291.500 199 1.234 .298 .792 .532 .364 .834 .375 .826 .850 .495 124 Returnee Between Groups .066 4 .017 Within Groups 7.614 195 .039 Total 7.680 199 Between Groups .858 4 .215 Within Groups 82.662 195 .424 Total 83.520 199 .424 .791 .506 .731 .652 .626 .265 .900 Years in Namibia Between Groups 4.858 4 1.214 Within Groups 363.142 195 1.862 Total 368.000 199 Studying Institution Between Groups .599 4 .150 Within Groups 110.156 195 .565 Total 110.755 199 Level of Education Between Groups 2.201 4 .550 Within Groups 44.419 195 .228 Total 46.620 199 2.416 .050 I want things to improve Because I want Between Groups 1.071 4 .268 the party of my Within Groups 29.709 195 .152 choice to win Total 30.780 199 Between Groups .620 4 .155 Within Groups 53.360 195 .274 Total 53.980 199 1.757 .139 .566 .687 It is my democratic right I feel it is an Between Groups 1.302 4 .326 obligation to Within Groups 195 .102 19.818 3.203 .014 125 vote Total 21.120 199 Between Groups .164 4 .041 Within Groups 11.516 195 .059 Total 11.680 199 .694 .597 I am unsure as to why I vote Between Groups 1.120 4 .280 Within Groups 46.000 195 .236 Total 47.120 199 1.186 .318 I care about my country I don’t want a Between Groups .648 4 .162 wrong party to Within Groups 31.352 195 .161 win Total 32.000 199 Others Between Groups .920 4 .230 Within Groups 8.580 195 .044 Total 9.500 199 Likely to vote Between Groups 27.403 4 6.851 for the same Within Groups 263.717 195 1.352 party Total 291.120 199 Likely to vote Between Groups 8.876 4 2.219 2.059 for president and Within Groups 401.444 195 not party Total 410.320 199 Number of Between Groups 1.022 4 .255 elections Within Groups 38.853 195 .199 participated Total 39.875 199 My vote will not Between Groups 2.499 4 .625 1.008 .405 5.225 .001 5.066 .001 1.078 .369 1.282 .278 8.289 .000 126 make any Within Groups 14.696 195 difference Total 17.195 199 I am not Between Groups .846 4 .211 interested in Within Groups 13.029 195 .067 elections Total 13.875 199 A don’t see the Between Groups .173 4 .043 importance of Within Groups 8.422 195 .043 participating Total 8.595 199 All parties are Between Groups .045 4 .011 the same and it Within Groups 4.830 195 .025 4.875 199 makes no .075 3.164 .015 .999 .409 .455 .769 .314 .868 Total difference Others Presidential Between Groups .037 4 .009 Within Groups 5.783 195 .030 Total 5.820 199 Between Groups 1.177 4 .294 Within Groups 43.703 195 .224 Total 44.880 199 Between Groups 1.631 4 .408 Within Groups 47.649 195 .244 Total 49.280 199 1.313 .267 1.668 .159 National Assembly Between Groups 1.420 4 .355 Within Groups 195 .192 Regional 37.535 1.845 .122 127 Total Local Authority 38.955 199 Between Groups .963 4 .241 Within Groups 38.912 195 .200 Total 39.875 199 17.286 4 4.322 1.206 .309 18.45 .000 Between Groups 3 Presidential Within Groups 45.669 195 Total 62.955 199 .234 Between Groups 8.422 4 2.106 Within Groups 93.398 195 .479 Total 101.820 199 4.396 .002 National Assembly Local Authority Between Groups 11.885 4 2.971 Within Groups 109.270 195 .560 Total 121.155 199 To vote for Between Groups 3.251 4 .813 leaders of my Within Groups 217.069 195 1.113 choice Total 220.320 199 Between Groups 5.054 4 1.264 Within Groups 44.901 195 .230 Total 49.955 199 5.303 .000 .730 .572 5.488 .000 I want to vote for change Between Groups .537 4 .134 Within Groups 30.858 195 .158 Total 31.395 199 I want to vote for my party to win .848 .497 128 It is my Between Groups 1.428 4 .357 2.117 democratic right Within Groups 412.892 195 to participate in 414.320 199 .169 .954 .590 .670 Total elections Others Because I don’t Between Groups .124 4 .031 Within Groups 10.271 195 .053 Total 10.395 199 Between Groups 1.322 4 .330 .073 trust the election Within Groups 14.233 195 system 15.555 199 Total My vote will not Between Groups .050 4 .012 make a Within Groups 6.705 195 .034 difference Total 6.755 199 I feel that only Between Groups 2.660 4 .665 those elected Within Groups 19.215 195 .099 benefit Total 21.875 199 There is no Between Groups .050 4 .012 candidate of my Within Groups 6.705 195 .034 choice Total 6.755 199 Others Influence your Between Groups .057 4 .014 Within Groups 5.763 195 .030 Total 5.820 199 Between Groups .771 4 .193 4.526 .002 .361 .836 6.750 .000 .361 .836 .480 .750 1.084 .366 129 choice of vote Within Groups 34.649 195 Total 35.420 199 .178 I vote according Between Groups .420 4 .105 to how my Within Groups 21.455 195 .110 parents vote Total 21.875 199 I often vote the Between Groups .180 4 .045 .052 same way as my Within Groups 10.215 195 friends vote Total 10.395 199 I vote as my Between Groups .017 4 .004 husband/wife Within Groups 3.903 195 .020 vote Total 3.920 199 I vote because I Between Groups 1.224 4 .306 am a loyal Within Groups 43.971 195 .225 45.195 199 member of my .953 .434 .860 .489 .207 .934 1.357 .250 Total party Others Between Groups 3.444 4 .861 Within Groups 38.076 195 .195 Total 41.520 199 Between Groups 16.897 4 4.224 Within Groups 235.658 195 1.209 Total 252.555 199 4.409 .002 3.496 .009 How much does media influence Between Groups 2.447 4 .612 Within Groups 195 .238 Television 46.428 2.569 .039 130 Total Radio Newspaper Others 48.875 199 Between Groups 1.215 4 .304 Within Groups 33.105 195 .170 Total 34.320 199 Between Groups 3.742 4 .935 Within Groups 44.813 195 .230 Total 48.555 199 Between Groups .498 4 .124 Within Groups 23.582 195 .121 Total 24.080 199 The way media Between Groups 1.070 4 .267 covers the Within Groups 42.805 195 .220 43.875 199 presentation of 1.789 .133 4.071 .003 1.029 .394 1.218 .304 parties Total manifestos at elections Reported Between Groups 2.260 4 .565 achievements Within Groups 40.135 195 .206 42.395 199 geared towards national 2.745 .030 Total development By the frequent Between Groups 5.928 reports of parties Within Groups 847.947 4 1.482 195 4.348 .341 .850 131 activities before and during 853.875 199 Total elections Others Between Groups .045 4 .011 Within Groups 4.830 195 .025 Total 4.875 199 Between Groups 6.171 4 1.543 Within Groups 409.509 195 2.100 Total 415.680 199 .455 .769 .735 .569 Ethnic group influence Between Groups 14.038 4 3.509 Within Groups 160.442 195 .823 Total 174.480 199 4.265 .002 Member of any party I participate Between Groups .779 4 .195 actively in the Within Groups 19.576 195 .100 20.355 199 work of the party Total I do not actively Between Groups 3.103 4 .776 participate, but I Within Groups 35.377 195 .181 have full 38.480 199 1.941 .105 4.276 .002 Total membership Others Aware of Between Groups .274 4 .069 Within Groups 22.921 195 .118 Total 23.195 199 Between Groups 20.932 4 5.233 .583 .675 5.551 .000 132 Political parties Within Groups 183.823 195 policies Total 204.755 199 By attending Between Groups 1.516 4 .379 their political Within Groups 34.439 195 .177 35.955 199 meetings and .943 2.146 .077 Total rallies Between Groups .310 4 .078 Within Groups 38.645 195 .198 Total 38.955 199 .391 .815 By reading their manifestos Between Groups 1.699 4 .425 Within Groups 48.256 195 .247 Total 49.955 199 1.717 .148 Through media awareness Through Between Groups 1.724 4 .431 .200 discussions with Within Groups 39.031 195 friends and 40.755 199 2.153 .076 Total family members Others Between Groups .294 4 .073 Within Groups 6.461 195 .033 Total 6.755 199 It allows me to Between Groups 4.370 4 1.092 vote for the Within Groups 45.610 195 .234 person I want Total 49.980 199 I can vote out a Between Groups .385 4 .096 2.217 .069 4.670 .001 1.236 .297 133 candidate that I Within Groups 15.170 195 don’t like Total 15.555 199 5.625 4 .078 1.406 19.68 .000 Between Groups I don’t see its importance 6 Within Groups 13.930 195 Total 19.555 199 .071 It’s mainly Between Groups 4.531 4 1.133 important for Within Groups 46.089 195 .236 democracy Total 50.620 199 Between Groups .452 4 .113 Within Groups 10.303 195 .053 Total 10.755 199 4.793 .001 2.137 .078 I don’t know its meaning Between Groups 43.293 4 10.823 Within Groups 755.262 195 3.873 Total 798.555 199 2.794 .027 Officials to be trusted Between Groups .689 4 .172 Within Groups 46.266 195 .237 Total 46.955 199 .726 .575 Why trusting none Working with Between Groups 6.423 4 1.606 others in your Within Groups 195 .904 176.372 1.775 .135 134 community on 182.795 199 solving a Total community problem Contacting/writi Between Groups 5.190 4 1.297 ng to 142.805 195 .732 147.995 199 Within Groups government 1.772 .136 officials Total consulting on public issues Consulting Between Groups 6.237 4 1.559 .860 local/regional/na Within Groups 167.758 195 tional officials 173.995 199 1.812 .128 Total on public issues Writing a letter Between Groups 3.053 4 .763 or viewpoint on Within Groups 153.142 195 .785 political issues Total 156.195 199 Participating in Between Groups 4.773 4 1.193 lawful Within Groups 202.622 195 1.039 207.395 199 demonstrations, rallies and .972 .424 1.148 .335 Total marches Collaborating Between Groups 5.365 4 1.341 1.629 .169 135 with Within Groups local/regional/na 160.555 195 165.920 199 .823 tional officials Total on solving a public issue Contacting/writi Between Groups 3.774 4 .944 ng to 160.101 195 .821 163.875 199 Within Groups governmental 1.149 .335 Total officials President Between Groups 3.415 4 .854 Within Groups 124.085 195 .636 Total 127.500 199 Between Groups 30.088 4 7.522 Within Groups 1791.892 195 9.189 Total 1821.980 199 1.342 .256 .819 .515 Members of Parliament Between Groups 23.728 4 5.932 Within Groups 232.492 195 1.192 Total 256.220 199 4.975 .001 Regional Councillors Between Groups 19.999 4 5.000 Within Groups 317.996 195 1.631 Total 337.995 199 3.066 .018 Local Authority Councillors Traditional Between Groups 28.552 4 7.138 Leaders Within Groups 195 2.497 487.003 2.858 .025 136 Total 515.555 Between Groups 12.480 State what is true Within Groups Total 199 4 3.120 203.900 195 1.046 216.380 199 A non- Between Groups 1.045 4 .261 democratic Within Groups 103.575 195 .531 104.620 199 government can be preferable to 2.984 .020 .492 .742 Total a democratic one It does not Between Groups 5.990 4 1.498 .552 matter what kind Within Groups 107.565 195 of government is 113.555 199 in power in a 2.715 .031 Total democratic state A democratic Between Groups 7.524 4 1.881 government is Within Groups 143.271 195 .735 150.795 199 preferable to any other kind of 2.560 .040 Total government It is democratic Between Groups 3.057 4 .764 for the Within Groups 195 .586 114.298 1.304 .270 137 government only 117.355 199 appoint its party loyal members Total into high positions Between Groups 5.030 4 1.257 Within Groups 344.125 195 1.765 Total 349.155 199 .713 .584 .729 .573 National problems Right to Between Groups .560 4 .140 participate in Within Groups 37.435 195 .192 37.995 199 peaceful demonstration Total and rallies Between Groups 1.011 4 .253 Within Groups 33.864 195 .174 Total 34.875 199 1.455 .217 The right to vote and be elected The right to Between Groups 1.450 4 .362 participate in Within Groups 48.550 195 .249 50.000 199 governmental 1.456 .217 Total affairs Between Groups .524 4 .131 Within Groups 46.096 195 .236 Total 46.620 199 Freedom of speech .554 .696 138 The right to Between Groups 1.419 4 .355 .248 political Within Groups 48.456 195 association Total 49.875 199 The right Between Groups 1.118 4 .279 Within Groups 48.277 195 .248 Total 49.395 199 to petition 1.427 .226 1.129 .344


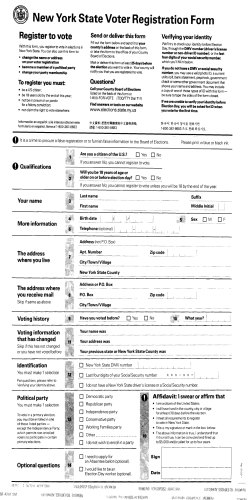

© Copyright 2026