
Hines-Kay_Thesis1 - University of New Mexico
Transcriptional analysis of Schistosoma mansoni treated
with sub-lethal doses of the anthelmintic drug praziquantel
BY
Jarrett Hines-Kay
B.A., University of New Mexico, 2004
M.B.A., University of Arizona, 2007
THESIS
Submitted in Partial Fulfillment of the
Requirements for the Degree of
Master of Science
Biology
The University of New Mexico
Albuquerque, New Mexico
07, 2011
ii
©2011, Jarrett Hines-Kay
iii
Transcriptional analysis of Schistosoma mansoni treated
with sub-lethal doses of the anthelmintic drug praziquantel
BY
Jarrett Hines-Kay
ABSTRACT OF THESIS
Submitted in Partial Fulfillment of the
Requirements for the Degree of
Master of Science
Biology
The University of New Mexico
Albuquerque, New Mexico
07, 2011
iv
Transcriptional analysis of Schistosoma mansoni treated with sub-lethal doses of the
anthelmintic drug praziquantel
by
Jarrett Hines-Kay
M.S., Biology, University of New Mexico, 2011
ABSTRACT
Schistosoma mansoni is one of the most common etiological agents responsible for the disease
schistosomiasis. More than 200 million people suffer from this disease making it the most severe
tropical disease after malaria in terms of morbidity. Praziquantel (PZQ) is the treatment of choice
for schistosomiasis and has been used almost exclusively to treat the disease since the 1970s.
However, while the drug is lethal for sexually mature schistosomes, it is ineffective against
juveniles. Thus, while morbidity can be eased, a cure is difficult to achieve. As a result there is
an urgent need to develop a new generation of anti-schistosomal drugs, a task that will be made
easier by understanding the mechanism of action of PZQ. As yet, neither the molecule to which
PZQ binds nor the means by which it kills mature schistosomes is known. The overarching aim
of this study was to understand the molecular basis of PZQ sensitivity in S. mansoni. We believe
that juvenile worms survive PZQ treatment in vivo due to the induction of, as yet, unidentified
protective molecular pathways. To address this hypothesis juvenile and adult PR1 S. mansoni
were treated in vitro with sub-lethal concentrations of PZQ. mRNA was extracted from replicate
samples, cRNA prepared and labeled with cyanine dyes for analysis using a 44K S. mansoni
microarray. The data was then analyzed using Genespring. Our findings suggest that a number of
genes associated with drug transport, iron homeostasis and apoptosis are induced in juvenile but
not adult schistosomes and that this allows the juvenile worms to protect themselves against the
lethal effects of PZQ long enough for the drug to be metabolized by the human host.
v
TABLE OF CONTENTS
LIST OF FIGURES ....................................................................................................... viii
LIST OF TABLES ........................................................................................................... ix
CHAPTER 1 BACKGROUND.........................................................................................1
CHAPTER 2 METHODS..................................................................................................8
2.1 Schistosoma mansoni 8
2.2 Mortality Study 9
2.3 RNA Collection and Extraction 10
2.4 Reference RNA 11
2.5 Microarray Experiment 11
2.5.1 Spike- In Controls 12
2.5.2 cDNA synthesis 12
2.5.3 cRNA synthesis, amplification and labeling 12
2.5.4 Hybridization 13
2.5.5 Wash and scan 13
2.6 Microarray Analysis in Genespring 13
2.7 Transcript Identification 14
2.8 Real-Time PCR 15
2.8.1 cDNA Synthesis 15
2.8.2 Real-Time PCR 15
2.8.3 Analysis of Real-Time PCR data 16
vi
2.9 Creation of Additional Graphics 17
CHAPTER 3 RESULTS AND DISCUSSION………………….……………………..18
3.1 Mortality study of S. mansoni exposed to PZQ 18
3.2 Transcriptional profile of S. mansoni treated with PZQ 21
3.3 Comparing the transcriptome profiles of PZQ treated schistosomes 24
3.4 Feature Annotation and Identification 29
3.5 Confirmation of Transcriptional Profile 29
3.6 Extreme Gene Regulation 30
3.7 Gene expression analysis 31
3.7.1 Calcium Regulation 31
3.7.2 Apoptosis 33
3.7.3 Iron Homeostasis 36
3.7.4 Drug Binding and Detoxification 41
CHAPTER 4 CONCLUSION………………..………………….……………………..51
FIGURES………………….………………………………………………………...…..57
TABLES………………….………………………………………………………….…..67
REFERENCES…………………………………………………………..……….……..86
vii
LIST OF FIGURES
Figure 1: Adult and juvenile S. mansoni exposed to PZQ ………………………...……57
Figure 2: Percentage of S. mansoni death at varying PZQ concentrations and exposure
times ………………………………………………………………………..……………58
Figure 3: Amount of differentially expressed features in S. mansoni treated with
PZQ ...................................................................................................................................59
Figure 4: Amount of significantly expressed features in S. mansoni treated with
PZQ …………………………………………………………………………………...…60
Figure 5: Amount of significantly, differentially expressed genes in S. mansoni treated
with PZQ ………………………………………………………………………...………61
Figure 6: Map of significantly expressed directional gene overlap between PZQ
treatment groups ………………………………………………………………………...62
Figure 7: Venn diagram of up- and down-regulated significantly expressed genes from
the 28 DPE 20 h PZQ exposed overlap and the 28 DPE 1 h PZQ exposed overlap …….63
Figure 8: RT-PCR expression data for 28 DPE 1 µg/mL PZQ 1 h exposed S.
mansoni ………………………………………………………………………………….64
Figure 9: RT-PCR expression data for 28 DPE 10 µg/mL PZQ 1 h exposed S.
mansoni ………………………………………………………………………………….65
Figure 10: Heat map of top 74 extremely regulated genes ...………………………...…66
Figure 11: RT-PCR expression of ABC drug transporters ………………...…………...67
viii
LIST OF TABLES
Table 1: PZQ treatment regimes employed in the microarray study on S. mansoni ……...…….68
Table 2: S. mansoni gene expression tested with Real-Time PCR …...……………………...…68
Table 3: Three-factor ANOVA comparing variables from the mortality study………….....…..69
Table 4: Statistical comparison of mortality of S. mansoni treated with varying concentration of
PZQ for 20 h or 1 h ……………………………………………………………………..….……70
Table 5: Statistical comparison of mortality of S. mansoni treated with varying concentration of
PZQ for 0.25, 0.5 or 1 h ……………………………………………...…………………….……71
Table 6: Significantly expressed features by exposure group in S. mansoni treated with
PZQ …………………………………………………………………………………………...…72
Table 7: Comparison of differentially expressed features in PZQ treated and untreated S.
mansoni ………………………………………………………………………………………….72
Table 8: Expressed features by exposure group in S. mansoni treated with PZQ ……………...73
Table 9: Distance matrix exhibiting the number of significantly expressed directional gene
overlap between treatment groups ………………………………………………………………74
Table 10: Distance matrix exhibiting the number of significantly expressed, same direction gene
overlap between S. mansoni PZQ treatment groups as a percentage of the total significantly
expressed genes in compared groups…………………………………………………………....75
Table 11: Distance matrix exhibiting the total number of significantly expressed gene overlap
between S. mansoni PZQ treatment groups as a percentage of the total significantly expressed
genes in compared groups…………………………………………………………………….....76
ix
Table 12: Distance matrix comparing the percentage of significantly expressed gene overlap in
the same direction to the total significantly expressed gene overlap in S. mansoni PZQ treatment
groups ……………………………………………………………………………………………77
Table 13: Feature annotation by BLAST database ………………………………………….….78
Table 14: Microarray and RT-PCR expression data for 28 DPE 1 µg/mL PZQ 1 h exposed S.
mansoni ……………………………………………………………………………………….....79
Table 15: Microarray and RT-PCR data for 28 DPE 10 µg/mL PZQ 1 h exposed S. mansoni ..79
Table 16: List of 74 extremely regulated genes and their patterns of expression ……………...80
Table 17: Significant gene expression related to categories of interest ...………………………81
Table 18: Percent significant gene expression related to categories of interest ..........................81
Table 19: Percent of genes significantly upregulated in categories of interest ………………....82
Table 20: Calcium related genes showing interesting significant expression patterns and overlap
between treatment groups ……………………………………………………………………….83
Table 21: Apoptosis related genes showing interesting significant expression patterns and
overlap between treatment groups ……………………………………………………………....84
Table 22: ABC drug transporter related significant expression ………………………..….……85
x
Chapter 1
Background
More than 207 million people in over 70 countries suffer from the parasitic disease
schistosomiasis (Steinmann et al., 2006; Hotez and Fenwick, 2009). These individuals
are largely infected with one of three species of schistosome (Schistosoma haematobium,
S. japonicum, or S. mansoni) and the disease is implicated in over 200,000 deaths
annually (WHO Schistosomiasis Fact Sheet) as well as the loss of approximately 24 – 56
million disability-adjusted life years (DALYs) (King, 2010). In fact, schistosomiasis is
estimated to be the most severe tropical disease after malaria in terms of morbidity
(Chitsulo et al., 2004).
Schistosomes have a digenetic trematode life cycle that relies on only two specific hosts.
In the case of S. mansoni the intermediate host is an aquatic snail of the genus
Biomphalaria while the definitive host is a mammal, often humans. Free-swimming
miracidia are hatched from eggs excreted in the definitive host’s feces when the eggs
come into contact with freshwater. These miracidia then seek their intermediate snail
host, which they penetrate and then transform into sporocysts before undergoing
successive rounds of asexual reproduction prior to leaving the snail as cercariae to infect
their mammalian host. On penetrating the definitive host the worms sexually mature over
a period of 4 – 6 weeks. Males and females pair and the female begins to release
fertilized eggs. On average, an adult schistosome lives 3-5 years and an adult pair can
hypothetically produce as many as 600 million schistosomes in their lifetime (Gryseels et
al., 2006). The most severe disease symptoms in the definitive host are caused when
1
schistosome eggs accumulate in the liver and invoke significant immune and
inflammatory responses.
Praziquantel, an acylated quinoline-pyrazine, has been used almost exclusively to treat
schistosomiasis since the 1970s. It is sold in 600 mg tablets costing around $ US 0.12 per
tablet. A single oral dose of 60 mg/kg is considered sufficient to achieve cure rates of 6090% (Caffrey, 2007). Praziquantel acts within one hour of ingestion, has low toxicity and
no long-term safety difficulties have been noted (Gryseels et al., 2006). One significant
problem with PZQ is that it is largely ineffective at killing juvenile parasites (up to 4
weeks post infection), both in vivo (Andrews et al., 1977; Sabah et al., 1986) and in vitro
(Pica-Mattoccia and Cioli, 2004; Aragon et al., 2009). Thus, the treatment regime must
be repeated to kill worms that might have been at the juvenile stage of development when
the initial treatment was administered.
In addition, though less relevant clinically, it has been shown that both S. mansoni
miracidia and cercariae experience high levels of mortality when exposed to PZQ
concentrations ranging from 1 µg/mL (~3.2 µM) to 313 µg/mL (~1.0 mM) (Andrews,
1978; Liang et al., 2001). Conversely, S. mansoni sporocysts show little signs of death at
10 µg/mL (~32 µM) PZQ, but shedding interference occurs when 20 – 30 µg/mL (~64 –
96 µM) PZQ is added to the diet of Biomphalaria glabrata (Mattos et al., 2006). Finally,
Pica-Mattoccia and Cioli (2004) showed PZQ’s ED50 in vivo was 30 times greater in 42
DPE than 28 DPE schistosomes. In addition, they demonstrated a large decrease in the
mortality of schistosomes derived from single-sex female infections and a moderate
decrease in single-sex male infections. The molecular basis of resistance to PZQ of
2
juvenile worms and those raised as single sex infections has yet to be elucidated.
However, it is known that upon in vitro exposure to PZQ concentrations as low as 0.1
µg/mL (320 nM), S. mansoni worms exhibit muscular contraction (Pica-Mattoccia and
Cioli, 2004). After being allowed to recover in drug-free medium, some worms recover
to normal appearance and movement, but some remain contracted. These contracted
worms show no signs of movement and often appear opaque. Pica-Mattoccia et al.
(2004, 2007) defined this lack of movement, opaque appearance and permanent state of
contraction as the criteria necessary to determine death. Using these criteria, it has been
shown that adult male worms from bisexual infections begin to experience significant
levels of mortality (approximately 50% dead 8 days after PZQ exposure) when exposed
to as little as 0.5 µg/mL (~1.6 µM) PZQ overnight and complete mortality when exposed
to 2 µg/mL (~6.4 µM) PZQ overnight (Pica-Mattoccia and Cioli, 2004). In comparison,
the estimated effective therapeutic plasma concentration of PZQ is approximately 0.3
µg/mL (~960 nM) (Andrews, 1981), which is sufficient to cause muscular contraction
and paralysis in schistosomes. However, it has been difficult to relate in vitro mortality
to in vivo worm death because it is not readily apparent whether or not PZQ works in vivo
by directly killing adult schistosomes or if the muscular contraction caused by PZQ
simply dislodges the worms from the mesenteric and hepatic portal blood vessels
allowing them to be swept to the liver where they are recognized by the host immune
system and destroyed (Fetterer et al., 1980). Although the binding target and mode-of-action of PZQ remain to be discovered, it has
been observed that in addition to the immediate muscular contraction and paralysis that S.
mansoni undergo on exposure to PZQ, there is also an immediate influx of calcium ions
3
accompanied by a slower influx of sodium ions and a decreased influx of potassium ions
(Pax et al., 1978), which suggests PZQ may interfere with inorganic ion transport. It has
also been observed that PZQ might alter the function of a schistosome voltage-operated
calcium channel (Cavβ) by acting on a subunit of this channel (Kohn et al., 2001 and
reviewed by Greenberg, 2005). It has been shown, however, that there is no difference in
expression between adult and juvenile schistosomes in the genes that encode the Cavβ
subunits (Valle et al., 2003; Aragon et al., 2009). This suggests that if PZQ binds to, or
acts indirectly on, the Cavβ channel it is unlinked to resistance in juveniles. Complicating
this story further, Pica-Mattoccia et al. (2008), showed that pre-incubation of adult male
worms from single-sex infections with cytochalasin D caused increased calcium ion
uptake despite the fact that cytochalasin D has previously been shown to suppress
schistosomicidal effects (Pica-Mattoccia et al., 2007), suggesting the calcium influx
worms experience when exposed to PZQ does not fully explain PZQ’s mechanism of
action. In addition to the interesting observations surrounding the calcium influx PZQ causes in
schistosomes, another notable effect is the blebbing of worm tegumental and
subtegumental structures caused by in vitro PZQ exposure (Shaw and Erasmus, 1984;
Xiao et al., 2009). This damage to the tegument is thought to expose surface antigens
(Harnett and Kusel, 1986), which may contribute to the influx of calcium ions (Redman
et al., 1996) and possibly recognition and clearance of the parasite by the host immune
system. Lending credence to this theory is the fact that tegumental damage and high rates
of mortality in adult S. japonicum worms occurred with exposure to 10 – 30 µg/mL (~32
- 96 µM) PZQ while these same PZQ concentrations produced little to no blebbing and
4
no death in juvenile worms (Xiao et al., 2009).
Another observation of PZQ’s effect on schistosomes is that PZQ binds recombinant S.
mansoni myosin light chain (rSmMLC) (Gnanasekar et al., 2009). In addition, to these
observations, Gnanasekar et al., (2009) also showed that S. mansoni myosin light chain
(SmMLC) was phosphorylated when exposed to PZQ in vivo, which is interesting
because MLCs are generally calcium dependent proteins (Pfitzer, 2001) and their
phosphorylation is thought to play a role in several biological processes including smooth
muscle contraction (Satterwhite, 1992), thus providing a connection between PZQ,
SmMLC, calcium and muscle contraction. Gnanasekar et al., (2009) also noted that PZQ
bound actin. This phenomenon was first observed by Tallima and El Ridi (2007);
however, it and several other proposed PZQ modes of action such as the alteration of
membrane fluidity (Harder et al., 1987 and Lima et al., 1994), the inhibition of
phosphoinositide turnover (Wiest et al., 1992), the reduction of glutathione concentration
(Ribeiro et al., 1998) and adenosine antagonism (Angelucci et al., 2007) were difficult to
reconcile with the biology of PZQ and its differential action on juvenile and mature
schistosomes.
More recently, researchers have started looking at epigenetic mechanisms that could be
possible targets for future drug development. Epigenetic control refers to modifications
of DNA and of DNA-associated proteins (i.e., histones) that affect chromatin structure.
These modifications introduce heritable changes in gene expression caused by
mechanisms other than changes in the underlying DNA sequence. Factors such as
histone modification (acetylation, methylation and phosphorylation) and DNA
5
methylation play critical roles in chromatin compaction and thus control of transcription
(Berger, 2007). S. mansoni, however, does not methylate its DNA, though histonemodifying proteins are present (Fantappie et al., 2001). In S. mansoni, acetylation of
histones plays an important role in epigenetic control, causing chromatin to be in its
relaxed transcriptional state; for example, the transformation of miracidia to sporocysts
can be blocked with histone deacetylase inhibitors (HDACi) (Azzi et al., 2009). Histone
deacetylases (HDAC) are a class of enzymes that remove acetyl groups from histones.
Thus HDACi inhibit this activity, causing hyperacetylation of histones, which can in turn
cause an increase in transcriptional activity. Histone deacetylase inhibitors have been
shown to cause mortality; specifically, an increase in caspases 3 and 7 activities has been
observed in adult S. mansoni treated with HDACi (Dubois et al., 2009). Since caspases
are involved in the apoptosis cascade, it is possible that PZQ acts through
hyperacetylation of histones, which then leads to transcription of caspase genes and
eventually worm death via apoptosis.
Due to the large number of people infected with schistosomiasis, massive public health
efforts have been launched in the past several years, such as The Bill and Melinda Gates
Foundation’s Schistosomiasis Control Initiative, that have put millions of dollars into
control through chemotherapy. Data from this initiative show the number of people
treated in programs in Uganda, Burkina Faso, Niger, Tanzania and Zambia have
increased from approximately 500,000 in 2003 to nearly 11 million in 2008. This
increase in usage of PZQ to treat schistosomiasis raises fears of possible increases in
parasitic resistance to the drug (Caffrey, 2007). With nearly 1/6th of the world’s global
population either infected with schistosomiasis or at risk of infection (Chitsulo et al.,
6
2000), if widespread schistosome resistance to PZQ were to occur, it would likely cause a
massive public health disaster. Thus, the need to discover the mechanism of action of
PZQ as well as the underlying reasons for its ineffectiveness against juvenile worms is
essential in order to inform the development of a new generation of anti-schistosomal
drugs.
Treating schistosomes with PZQ in vitro is obviously different than treating an infected
patient. For example, it is not known if PZQ directly kills in vivo or if the paralyzing
effect observed upon in vitro exposure to PZQ allows the worms to be recognized by the
host immune system, which then mounts a response resulting in death. Regardless, PZQ
does kill adults in vitro while juvenile worms are able to recover. In order to understand
the role of differential gene expression in the mechanism of PZQ killing in adult worms
and the ability of juveniles to survive PZQ treatment, the first aim of my thesis was to
identify sub-lethal exposures of PZQ. The second aim of my thesis was to conduct a
transcriptional analysis of those identified sub-lethal PZQ exposures in order to measure
the transcriptional differences between juvenile and adult worms. Finally, the third aim
of my thesis was to identify molecular pathways and interactions that might be involved
in schistosome protection and death when worms are exposed to PZQ.
7
Chapter 2
Methods
2.1 Schistosoma mansoni Schistosome infected mice and snails were supplied by Dr. Fred A. Lewis, NIAID
Schistosomiasis Resource Center at the Biomedical Research Institute (Rockville, MD).
The abdomens of female Swiss Webster mice were exposed to 125 PR-1 S. mansoni
cercariae. Mice were anesthetized and worms harvested by perfusion (Lewis, 1998) with
RPMI 1640 (always containing L-Glutamine; Invitrogen) at 28 and 42 days post exposure
(DPE). Mice were subsequently euthanized by cervical dislocation. All animal
experimentation complied with the policies, regulations and guidelines mandated by the
Institutional Animal Care and Use Committee (IACUC), University of New Mexico
(UNM). Adult worms (42 DPE) were separated into males and females by visual inspection.
Juvenile worms (28 DPE) used were collected and maintained as mixtures of males and
females as they are impossible to sex visually with any confidence at this time. Prior to
all experiments, worms were allowed to recover overnight in enriched RPMI (RPMI
1640 containing 20 % heat inactivated fetal bovine serum (Sigma) and antibiotics (100
units/mL penicillin and 100 µg/mL streptomycin) (GIBCO) at 37 °C. This and all
subsequent procedures that required worms to be maintained at 37 °C were performed
using a water-jacketed incubator with 5% CO2. 8
2.2 Mortality Study
Individual groups of 15 adult male, adult female or juvenile schistosomes derived from
different mice were placed in separate Petri dishes containing 5 mL enriched RPMI 1640
with 1 % (v/v) dimethyl sulphoxide (DMSO; Sigma) and maintained at 37 °C for 1 h.
After this time worms were exposed to 0, 0.1, 1.0, 10, 50 or 100 µg/mL racemic PZQ
(Sigma) solubilized in 1% (v/v) DMSO in enriched RPMI 1640 for 0.25, 0.5, 1.0 or 20 h
at 37 oC. After exposure, the worms were washed twice with RPMI 1640 and then
allowed to recover in enriched RPMI 1640 at 37 oC. Each of these experiments was
performed in triplicate.
Schistosomes were viewed at 4X magnification prior to PZQ exposure to ensure the
worms being tested were alive, several minutes after PZQ exposure to observe if the
worms contracted in response to the drug and again after 48 and 96 h recovery to
determine the lethality of the various combinations of PZQ concentration and exposure
time. At the end of the observation period, worms were defined ‘dead’ using the criteria
of Pica-Mattoccia and Cioli (2004); i.e., if they remained contracted, did not resume
movement during the observation period and acquired an opaque appearance.
Results were analyzed using a three-factor ANOVA (R version 2.12.1, cran.r-project.org)
in order to determine which variables in the mortality study were significant as well as
which variables were the most significant. The variables tested were DPE/sex, PZQ
concentration and PZQ exposure time. Age and sex were combined in order to provide
enough degrees of freedom to make the test significant for those variables. In addition,
two-tailed homoscedastic student t-tests were performed in Excel (Microsoft) between
9
the control and experimental exposures in each group as well as between the groups at
the same exposures in order to determine which treatments had significant levels of
mortality and if the significant levels of mortality varied between the groups.
2.3 RNA Collection and Extraction
Adult male, adult female and juvenile worms were collected and exposed to PZQ in the
same manner as described in section 2.2; however, the worms were collected in groups of
30 and exposed only to 0, 1.0 and 10 µg/mL PZQ for 1 or 20 h. In addition, the worms
were harvested immediately after the exposure period by placing them in separate 1.5mL
tubes with 600 µL of RLT Buffer (Qiagen) containing 1% (v/v) β-mercaptoethanol
(Sigma) (RLT/β-ME buffer) and homogenizing them using a RNase-Free Pellet Pestle
(VWR International; Aragon et al., 2009). The homogenate was then frozen at −80 °C
until RNA was extracted as described below. Each of these experiments was performed
in triplicate thus providing three biological replicates for subsequent microarray and realtime PCR (RT-PCR) studies.
Total RNA was isolated from thawed worm homogenates using an RNeasy® Mini kit
(Qiagen) including a DNase step according to the manufacturer's specifications, eluted
with 100 μL of RNase free distilled water (dH2O) and quantified using a NanoDrop® ND1000 spectrophotometer with ND-1000 3.3 software (NanoDrop Technologies). In
addition, RNA integrity was evaluated using an Agilent 2100 Bioanalyzer with a RNA
6000 Nano LabChip® Kit (Agilent Technologies).
10
A total of 14 different samples of RNA were isolated and stored at -80 oC (Table 1) for
further use in microarray and RT-PCR studies.
2.4 Reference RNA
To assist in the normalization of our microarray data (see sections 2.5 and 2.6) we
employed a universal reference RNA sample (Novoradovskaya et al. 2004). This sample
was derived mostly from 100 mixed sex adult schistosomes collected at 6 weeks after
infection as previously described in section 2.2. These worms were allowed to recover
for at least 1 h at 37 oC in enriched RPMI then homogenized, stored at -80 oC and had
their RNA extracted in the same manner as described in section 2.3. To provide a
positive hybridization signal at as many elements on the array as possible this RNA
sample was spiked with 0.5 % (v/v) RNA isolated from adult mixed sex worms exposed
to 10 µg/mL PZQ, 0.5 % (v/v) RNA isolated from juvenile worms exposed to 10 µg/mL
PZQ and 0.5 % (v/v) RNA isolated from juvenile worms unexposed to PZQ.
2.5 Microarray Experiment
The oligonucleotide microarrays used in these studies were designed and described by
Gobert et al. (2006) and obtained from Agilent Technologies. They have 12,166 S.
mansoni features per array with four arrays per slide. Each S. mansoni gene featured on
the array is represented by two independent oligonucleotides. These experiments were
done in biological triplicates with no replicates on the same slide. All microarray
experiments were performed according to Agilent’s Two-Color Low Input Quick Amp
Labeling kit protocol.
11
2.5.1 Spike- In Controls
Spike-in controls (Agilent Technologies) were prepared for signal standardization
according to manufacturer’s specifications. Two microliters of spike-in controls were
added to approximately 100 ng of total RNA for each experimental sample as well as the
reference sample. Spike B was added to each experimental sample and Spike A was
added to each reference sample.
2.5.2 cDNA synthesis
cDNA was reverse transcribed from mRNA according to the kit protocol by adding a T7
Promoter Primer to the spiked samples and denaturing them at 65oC for 10 min. A
master mix containing a 5X first strand buffer, dithiothreitol (DTT), dNTPs and Affinity
Script RNase Block Mix containing Affinity Script reverse transcriptase (Agilent
Technologies) was then added to the samples and the mixture incubated at 40 oC for 2 h.
The enzyme was then inactivated by incubation at 70 oC for 15 min.
2.5.3 cRNA synthesis, amplification and labeling
cDNA was transcribed to cRNA and amplified according to manufacturers instructions
by adding a transcription master mix containing 5X transcription buffer, DTTs, NTPs and
a blend of enzymes (Agilent Technologies) to the sample. The cyanine dye Cy-3
(Invitrogen) was then added to the reference samples and Cy-5 (Invitrogen) to the
experimental samples and incubated at 40 oC for 2 h.
After the incubation period, the cRNA was purified using Qiagen’s RNeasy Mini Kit and
the RNA quantified. Calculations for labeling efficiency were performed using
12
manufacturer recommendations and only samples which met the manufacturer’s
suggested minimum activity for hybridization were processed further (Agilent
Technologies).
2.5.4 Hybridization
A fragmentation mix was made by adding 825 ng total Cy-3 and Cy-5 labeled cRNA to
10X blocking agent and a 25X Fragmentation Buffer. This was then incubated at 60 oC
for 30 min. The reaction was then placed on ice and a stop buffer was added to halt the
reaction. Each sample was then pipetted onto a gasket slide sitting in a hybridization
chamber and an array slide was then placed over the gasket slide sandwiching the
samples into four separate chambers. The top of the hybridization chamber was then
fitted to the samples and the whole apparatus was placed in an oven and rotated at 10 rpm
and 65 oC for 17 h.
2.5.5 Wash and scan
After hybridization, the slides were washed in Agilent wash buffers and stabilized against
ozone deterioration in Agilent’s Stabilization Buffer. The slides were then scanned with
Agilent’s Microarray G2505C scanner and extracted using Agilent’s Feature Extraction
software by the University of California San Francisco’s Viral Diagnostics and Discovery
Center, China Basin Landing Facility.
2.6 Microarray Analysis in Genespring
The array data was analyzed using GeneSpring GX version 11 by first creating five
separate experimental groupings: 28 DPE mixed sex 1 h PZQ exposures, 42 DPE male 1
13
h PZQ exposures, 28 DPE mixed sex 20 h PZQ exposures, 42 DPE male 20 h PZQ
exposures and 42 DPE female 20 h PZQ exposures. A baseline transformation to the
median of the control for each grouping (Table 1) was then performed. Features that
were not positive, not significant, not above background noise, not uniform, saturated or
a population outlier were not considered for analysis. Replicates in each grouping were
then grouped based on PZQ concentration and only features with signal in all three
replicates were retained. The signal from the replicates was averaged in each of the 14
treatment groups. The signal from these groups was log2 transformed. Differential
analysis evaluated features that had fold change values greater than a magnitude of two.
Analyses of significance compared the PZQ exposed groups to the control in each
grouping with an unpaired, unequal variance t-test. Significant features had p-values <
0.05. In addition, Genespring was used to create a heatmap (Fig. 10).
2.7 Transcript Identification
The arrays used were custom arrays designed by Gobert et al. (2006) and have 12,166 S.
mansoni features per array. Each feature has a probe sequence associated with it that is
approximately 60 base pairs (60mer) long and represents a specific S. mansoni expressed
sequence tag (EST). The EST’s the oligonucleotides were designed to represent were
accessed through the S. mansoni Genome Index
(compbio.dfci.harvard.edu/tgi/tgipage.html) and blasted using NCBI’s BlastX with both
the Swissprot Protein Sequence Database and the Non-Redundant Protein Sequence
Database (www.ncbi.nlm.nih.gov) as well as KEGG’s BlastX database (www.genome.jp)
and AmiGO’s BlastX database (www.geneontology.org). In addition, GO term
associations for each oligonucleotide were generated with AmiGO. Blast settings were
14
set so that only results with an Expect value less than 1E-05 were accepted. The four
blast results for each feature along with the GO terms and Entrez Gene ID numbers were
placed into Excel spreadsheets (Microsoft) where they could be searched for specific
terms.
2.8 Real-Time PCR
Real-Time PCR (RT-PCR) was performed in two-steps by first creating complimentary
DNA (cDNA) from the RNA isolated in section 2.3 and then using that cDNA as the
template for RT- PCR.
2.8.1 cDNA Synthesis
Complimentary DNA was synthesized in a 20 µL reaction according to manufacturer’s
specifications using Transcriptor First Strand cDNA Synthesis Kit (Roche) with the kit’s
anchored-oligo(dT) primer and 100 ng of RNA template. The primer and template were
combined and denatured at 65 °C for 10 min. Transcriptor RT 5X Reaction Buffer,
RNase Inhibitor, dNTPs and Transcriptor Reverse Transcriptase were then added and the
reaction was incubated at 50 °C for 60 min. Finally, the reverse transcriptase was
inactivated at 85 °C for 5 min and the product quantified using a NanoDrop® ND-1000
spectrophotometer with ND-1000 3.3 software (NanoDrop Technologies).
2.8.2 Real-Time PCR
Subsequently, Real-Time PCR was performed to manufacturer’s specifications using
approximately 25 ng of cDNA (section 2.8.1) and the FastStart Universal Syber Green
Master (ROX) kit (Roche) with 200 ng/µL of each of the forward and reverse primers
15
(Table 2) in a 25 µL reaction. Following an initial incubation at 50 °C for 2 min and a
denaturation at 95 °C for 10 min, the reactions were amplified for 40 cycles of 95 °C for
15 s and 53 °C for 60 s on an ABI Prism 7000 Sequence Detection System. Each assay
was performed in technical duplicates of each biological triplicates for all genes tested
(Table 2).
The primer sequences shown in Table 2 were generated using both Primer3Plus
(www.bioinformatics.nl/cgi-bin/primer3plus/primer3plus.cgi) and Integrated DNA
Technologies OligoAnalyzer tool (www.idtdna.com). In addition, the OligoAnalyzer
tool was used to help predict which primers would have the least chance of forming
hairpins, self-dimerizing or hetero-dimerizing.
2.8.3 Analysis of Real-Time PCR data
Real-Time PCR data was first standardized with ABI Prism 7000 SDS software by
manual adjustment of the threshold and baseline. Cycle threshold (Ct) values were then
exported to Excel (Microsoft) where the technical duplicates were averaged and the
values of the three biological replicates analyzed using the 2−ΔΔCt method (Schmittgen
and Livak, 2008) to obtain the relative expression ratio between the target genes (Table
2) and the endogenous control, S. mansoni glyceraldehyde 3-phosphate dehydrogenase
(GAPDH).
The housekeeping gene GAPDH (TC16678) was used for primary normalization as the
endogenous control in all RT-PCR experiments. GAPDH was selected because it is a
common reference housekeeping gene and was consistently expressed and unchanged in
16
all experimental and control groups in the microarray data, albeit at a low and nonsignificant level with a mean fold change of 0.44.
2.9 Creation of Additional Graphics
The Venn diagram in Figure 7 was created using the 4-way Venn diagram tool at
www.pangloss.com/seidel/Protocols/venn4.cgi.
The map of significantly expressed gene overlap between groups (Fig. 6) was created
with the data from the distance matrix in Table 10 and the Computational Biochemistry
Research Group’s TreeGen tool (www.cbrg.ethz.ch/services/TreeGen) using the
2DPlacement function. The distance matrix that was used as the input source into the
2DPlacement map was created by taking the amount of significantly expressed features
that overlapped between each group in the same direction (i.e., either both upregulated or
both downregulated in the treatment groups being compared) and then dividing that
number by the sum of the total amount of significantly expressed features from the two
groups being compared. This allowed for the similarity between two groups (amount of
same direction gene overlap) to be displayed as a percentage of total significant gene
expression. In addition, the area of each circle in Figure 6 correlates to the number of
genes expressed in that group, so the 28 DPE 1 µg/mL PZQ 20 h group has the circle
with the greatest area (3482 significantly expressed features) and the circle representing
that group is approximately 20 time greater than the area of the circle representing the 42
DPE male 10 µg/mL PZQ 1 h group (170 significantly expressed features). 17
Chapter 3
Results and Discussion
3.1 Mortality study of S. mansoni exposed to PZQ
In order to conduct a microarray experiment that showed the transcriptional response of
S. mansoni to in vitro exposures of PZQ, we first conducted a mortality study to identify
sublethal PZQ concentrations over a variety of exposure times. We exposed adult male,
adult female and juvenile mixed-sex worms to six different concentrations of PZQ (0,
0.1, 1.0. 10, 50 and 100 µg/mL) for four different time intervals (0.25, 0.5, 1.0 and 20 h).
After the exposure period we allowed the worms to recover in drug-free media for 48 h
before making mortality observations based on the criteria of Pica-Mattoccia and Cioli
(2004), who defined a lack of movement, opaque appearance and permanent state of
contraction as the definition of death in S. mansoni. It can be seen in Table 3 that age/sex, concentration of PZQ and PZQ exposure time all
had a highly significant effect on schistosome mortality (p-values<0.05). It can also be
seen in the bottom four rows of Table 3 that the interactions between these variables are
all highly significant as well. In other words, the concentration (p=8.27E-09) and
exposure time (p=8.78E-05) have significantly different effects on adult male, adult
female and juvenile worms. Finally, it can be seen from the f-values that the
concentration of PZQ has the greatest effect on worm death (f=149.02) followed by PZQ
exposure time (f=69.21).
18
Upon addition of PZQ to a final concentration of 0.1 µg/mL and greater, muscular
contraction was observed immediately in worms in all groups (Fig. 1). Adult male worms
were most sensitive to PZQ, reaching levels of mortality greater than 80% (Fig. 2A)
when exposed to 10 µg/mL PZQ for 20 h (Table 4A) and there was significant mortality
in all adult male groups exposed to 50 µg/mL PZQ irrespective of the exposure time
(Tables 4A and 4D).
These results can be contrasted with the juvenile and adult female PZQ exposures that
never achieved more than 40% mortality (Figs 3B and 3C). Adult females showed
significant levels of mortality compared to untreated controls when exposed to 10 µg/mL
PZQ for 20 h and 50 µg/mL PZQ for 1 or 20 h; however, the levels of mortality reached
in these groups were all significantly less than the levels male worms reached in these
same groupings (Tables 4B and 4E). This is consistent with other findings of variability
in PZQ sensitivity between male and female schistosomes (Pica-Mattoccia and Cioli,
2004; Fitzpatrick et al., 2005).
Juveniles reached significant levels of mortality only when exposed to 50 µg/mL PZQ for
20 h; however the levels of mortality reached were significantly less than the levels
reached by males in this group (Tables 4C and 4F). The observation that juvenile worms
are less sensitive to PZQ than adults has been described repeatedly in the literature (Xiao
et al., 1985; Sabah et al., 1986; Pica-Mattoccia and Cioli, 2004). In addition to visual
observations of this phenomena, Aragon et al. (2009) were able to confirm juvenile worm
insensitivity with a Real-Time PCR assay that utilized expression of specific heat shock
related genes. Finally, the only significant difference between juveniles and females was
19
in the 50 µg/mL PZQ 1 h exposure group, where the juveniles experienced significantly
less mortality than the females (Table 4F).
Overall, these experiments suggest that adult male worms are more sensitive to PZQ than
the adult female or juvenile worms. One point of note was that these mortality
experiments were also conducted using 100 µg/mL PZQ exposures for 1 and 20 h,
however, these results were unreliable and are not shown. This was probably due to the
fact that PZQ did not appear to become fully dissolved in solution at this concentration.
In addition, the results from the 0.25, 0.5 and 1.0 h exposure times for adult and juvenile
worms showed no significant difference between each other (Tables 5A, 5B and 5C), so
only the 1 and 20 h exposure groups are compared in Fig. 1 andTable 4.
Thus in order to evaluate the transcriptional response of schistosomes to PZQ with the
microarray, we chose nine sublethal exposure groups and five controls to the sublethal
exposure groups (Table 1). The decision to use 1 as opposed to 0.25 or 0.5 h as the shortterm PZQ exposure time with the microarray experiments was to provide sufficient time
to ensure we saw a significant transcriptional response to the drug. Likewise, although
the worms contracted when exposed to 0.1 µg/mL PZQ, we chose 1.0 µg/mL PZQ for the
lower dosage of the drug to maximize the chance of detecting a transcriptional response.
Conversely, we chose 10.0 µg/mL PZQ as the high-end exposure because it was this dose
that we began to observe significant levels of death in adult schistosomes exposed for 20
h (Tables 3A and 3B); however, we did not evaluate the adult males at the 20 h 10 µg/mL
PZQ exposure because the majority of them died at this exposure (Fig. 2) and this would
not have provided for a robust transcriptional response to the drug.
20
3.2 Transcriptional profile of S. mansoni treated with PZQ
Since the mechanism of action of PZQ remains unknown, but it is known that juvenile
worms are less sensitive to the lethal effects of the drug in vitro than adult worms, we
performed a microarray analysis to better understand the transcriptional response of
juvenile and adult S. mansoni to PZQ. Based on the findings from the mortality study,
which showed not only a difference in PZQ sensitivity between juvenile and adult
worms, but also a difference between adult female and adult male worms, we decided to
also evaluate the transcriptional response of adult male and adult female schistosomes
separately.
Upon treatment with PZQ, all groups expressed an increased amount of significantly
expressed features (p-value<0.05 compared to group control; Table 6). The average
number of genes differentially expressed (Fold Change > +/- 2.0) amongst the five
control groups was only six, however, the average number of genes differentially
expressed amongst the nine treated groups was 244 (Table 7). The groups with the
greatest number of differentially expressed genes were the two 20 h juvenile PZQ treated
groups, which averaged 741 differentially expressed genes. This was followed by the
two 20 h adult female PZQ treated groups that averaged 182 differentially expressed
genes. In contrast, the adult male treated groups showed differential expression of only
53 genes. Thus, the transcriptome of juvenile schistosomes appears to be more responsive
to PZQ treatment than that of adult female and especially adult male worms (Table 7).
Overall, a signal was detected associated with array features representing 8582 unique
genes expressed from all 14 different exposure groups with an average of 7855 expressed
21
genes per group (Table 8). The group with the most expressed genes was the males
exposed to 1 µg/mL PZQ for 20 h (8332 genes). The least expressed genes were in the
juvenile 20 h control group (7458 genes). On average half the genes were upregulated
and half downregulated compared to the reference sample. The overall magnitude of the
change in signal associated with these genes features was approximately neutral with a
fold change of +0.01. Individual groups whose transcript profile showed a reduction in
overall signal compared to the reference sample also had negative magnitudes of fold
change with the exception of the juvenile 20 h exposure groups, which had approximately
52% of the transcript downregulated but a positive fold change in signal magnitude
overall. The inference from this snapshot of the data is that juveniles exposed to PZQ for
20 h up-regulate a portion of their transcriptome to a greater extent than any other group.
This observation is supported when filtering the raw transcriptome data for array features
reporting differential expression of at least a 2-fold change in signal. Using this criterion,
1323 genes are differentially expressed across all groups (column 8, Table 8). This
represents approximately 15% of the different genes expressed; however, there is only an
average of 159 genes differentially expressed per group, representing an average of only
2% of the expressed genes per group.
Juveniles exposed to PZQ for 20 h have the greatest number of differentially expressed
genes with 868 and 614 differentially expressed genes in the groups treated with 1 and 10
µg/mL PZQ respectively (Fig. 3). Of a similar magnitude, females exposed to 10 µg/mL
PZQ for 20 h have 322 differentially expressed genes. In comparison, all other PZQ
treated groups of adult worms of either sex have far fewer differentially regulated genes.
22
Females exposed to 1 µg/mL PZQ for 20 h have only 41 genes differentially expressed
while males exposed to 1 and 10 µg/mL PZQ for 1 h have only 42 and 50 genes
differentially expressed respectively. Similarly, males exposed to 1 µg/mL PZQ for 20 h
have only 66 genes differentially expressed. Finally, when filtering for differential
expression there is a clear bias towards gene induction with an average of 63% of the
differentially expressed genes being up-regulated.
To further determine if expression was significantly different (p<0.05) between the
experimental and control treatments, unpaired, unequal variance T-Tests were performed
on the microarray data for each feature. Overall there were 6161 different significantly
expressed features (Table 6); however, there was only an average of 1526 significantly
expressed features per group.
This large difference between the number of overall expressed features and the average
amount of features expressed in each group indicates that there is a lot of variance in the
genes that are being differentially expressed between the treatment groups. In other
words, the transcriptional response to PZQ exposure is different amongst the groups we
studied.
The group with the most significantly expressed features was the juveniles exposed to 1
µg/mL PZQ for 20 h (3482 genes; Fig 4). That with the least significantly expressed
genes were those of males exposed to PZQ for 1 h (average of 189 genes). Thus, it
appears that upon treatment with PZQ the adult male worms do not respond with a large
transcriptional response, particularly when compared to the response of juvenile worms.
23
This trend of having greater transcriptional activity in both 20 h juvenile exposures as
well as the 10 µg/mL PZQ 20 h female exposure is further highlighted when looking at
the genes that are both significantly (p<0.05) and differentially (Fold Change > +/- 2.0)
regulated (Fig 5 and Table 6) suggesting that these particular groups are not only
transcribing more genes, but they are doing so with greater intensity, whether that be
upregulation or downregulation. Probably the most significant fact to arise from these
data, however, is that the juvenile schistosome response is different than that of the adult
worms.
3.3 Comparing the transcriptome profiles of PZQ treated schistosomes
After evaluating the individual transcriptional responses of each grouping, we evaluated
the transcriptional relationships between the treatment groups. In order to determine the
degree by which the transcriptomes of the different PZQ groups overlapped, we created a
distance matrix showing the number of significantly expressed genes (p<0.05 compared
to control) that overlap in the same direction (i.e., significantly upregulated or
downregulated) between each group (Table 9). We then took the overlap of the
significantly expressed genes that overlapped in the same direction from Table 9 and
made a second matrix showing the overlap as a percentage of the total amount of
significantly expressed genes in the groups being compared (Table 10). Much like a
matrix showing the relationships between different locations based on distance, the
matrix depicted in Tables 9 and 10 shows the relationships of the different treatment
groups from the microarray study based on the amount of gene overlap between the
groups. The data from Table 10 then allowed us to map out these relationships in two
dimensions, much like locations on a map, providing a visual representation of the
24
transcriptional similarity between all nine treatment groups (Fig. 6). Figure 6 displays the
similarity between groups much like a Venn diagram might; however, we are able to
evaluate the relationships between all nine groups in this manner as opposed to only
being able to relate three or four groups at a time as is typical with Venn diagrams. In
Figure 6, the percentage of overlap between each group is represented by the distance
between the centers of each circle; hence, the closer the circles the greater the similarity
in expression is between groups. In addition, the area of each circle correlates to the
number of genes expressed in that group, so the 28 DPE 1 µg/mL PZQ 20 h group has the
circle with the greatest area (3482 significantly expressed features) and this is
approximately 20 time greater than the area of the circle representing the 42 DPE male 10
µg/mL PZQ 1 h group (170 significantly expressed features). From Figure 6 it can be
seen that the greatest outliers from the main cluster are the 42 DPE male 1 and 10 µg/mL
PZQ 1 h treatment groups. This is probably due to the fact that these groups have such a
small transcriptional response to the affects of PZQ, significantly expressing an average
of only 189 genes compared to an average of 1526 significantly expressed genes from all
groups (Table 6). Other apparent outliers are the 1 and 10 µg/mL 28 DPE 1 h PZQ
exposures. These two groups are highly related to each other, but it appears they are
expressing a suite of genes that is largely different than any other group. The most
closely related groups are the 1 and 10 µg/mL PZQ 28 DPE 20 h exposures together with
the 1 and 10 µg/mL PZQ 42 DPE female 20 h PZQ exposures suggesting that these
females are expressing a fairly similar suite of genes to the 28 DPE 20 h PZQ exposures.
Sitting as an outlier from this main cluster is the 42 DPE male 1 µg/mL PZQ 20 h
exposure. This is the group from the microarray study with the highest level of death at
approximately 10% (Fig. 2). Thus, it can be inferred from Figure 6 that when S. mansoni
25
are exposed to PZQ for relatively long lengths of time (i.e., 20 h in this study) there is
probably a fairly similar transcriptional response in terms of the actual genes being
differentially regulated though the degree of that regulation may differ. Conversely, the
suite of genes the 28 DPE 1 h PZQ groups are transcribing appears to be largely unique
and may be indicative of a response to PZQ that allows them to survive the lethal effects
of the drug long enough for the host to metabolize or excrete it. In contrast to the
juvenile 1 h exposures, the 42 DPE male 1 h exposures are outliers not because they
express a unique set of genes, but because they fail to mount a significant response to
PZQ. It is this failure to respond adequately to PZQ that may ultimately lead to the high
rates of mortality seen in adult male schistosomes (Fig. 2A).
Table 11 also displays a distance matrix relating overlap to total expression; however, the
overlap is for all features, not just the features overlapped in the same direction. In Table
12 we then divided the features overlapped in the same direction (Table 10) by the total
features overlapped (Table 11). From this we can see that ~100% of the overlap between
the 28 DPE 1 µg/mL PZQ 20 h group and the 28 DPE 10 µg/mL PZQ 20 h group is in
the same direction. Conversely, we can see that only about 12 % of the overlap between
the 28 DPE 1 µg/mL PZQ 20 h group and the 28 DPE 1 µg/mL PZQ 1 h group is in the
same direction. From Tables 10 and 12 and Fig. 6 we can also see that the overlap
between the 28 DPE 1 h PZQ exposed groups is the greatest with each other and that
overlap is expressed in the same direction. We can also see that this holds true for the 42
DPE male 1 h PZQ exposed groups, the 28 DPE 20 h PZQ exposed groups and the 42
DPE female 20 h PZQ exposed groups. The 42 DPE male 20 h PZQ exposed group does
not share a majority overlap in the same direction with any other specific group. This lack
26
of relation to other groups can also be seen at the bottom of Table 9 (which shows the
average overlap a group has to all the other groups) where the 42 DPE male 20 h PZQ
exposed group has the smallest average relation to any other group (17%). The fact the
42 DPE male 20 h PZQ exposed group shows some relation to other groups, particularly
the four other 20 h PZQ exposed groups, but not strong overlap with any of them is most
likely due to the fact that this group is the most sensitive to PZQ of the groups tested in
the microarray study (Fig. 2A). In addition, it can be seen in Figure 2A that the majority
of worms are dead in the 42 DPE male 20 h PZQ exposed groups with concentrations
greater than 1 µg/mL. Thus it is possible the reason for high mortality rates in adult male
schistosomes is due to the fact that they are unable to express genes that allow juvenile
and adult female worms to better survive the lethal effects of PZQ.
Another point of interest worth considering that arises from the data in Table 12 is the
relationships of the overlapped regions to each other. For example, by taking the overlap
between the two 42 DPE female 20 h PZQ exposed groups (93%) and the overlap
between the two 28 DPE 20 h PZQ exposed groups (100%) and overlapping those
overlaps, we find that ~89% of that overlap is in the same direction, so it can be implied
that adult female schistosomes and juvenile worms have a broadly similar transcriptional
response when treated to PZQ for 20 h. Similarly, if we examine the overlap between the
two 28 DPE 20 h PZQ exposed groups (100%) and the 42 DPE male 20 h PZQ exposed
group, we find ~79% is accounted for by shared genes being differentially expressed in
the same direction. If, however, we take the overlap between the two 28 DPE 20 h PZQ
exposed groups (100%) and the overlap between the two 28 DPE 1 hour PZQ exposed
groups (99%) and compare those overlaps, we find that only about 10 % of the genes in
27
this category are regulated in the same direction. Figure 7 is a Venn diagram depicting
this relationship between the up-regulated and down-regulated features from the 28 DPE
20 h PZQ exposed groups and the upregulated and down-regulated features from the 28
DPE 1 h PZQ exposed groups. It can be seen in Figure 7 that of the 1289 genes that are
downregulated in both 28 DPE 20 h PZQ exposed groups, only six are also
downregulated in the 28 DPE 1 h PZQ exposed overlap. It can also be seen that of the
1107 genes that are upregulated in both 28 DPE 20 h PZQ exposed groups, only 14 are
also upregulated in the 28 DPE 1 h PZQ exposed overlap. Conversely, 176 genes show
conflicting patterns of regulation between the 28 DPE 20 h PZQ exposed overlap and the
28 DPE 1 h PZQ exposed overlap and 2464 genes are not shared between these overlaps
at all. Together this data suggests that the transcriptomic changes associated with
exposure to PZQ in 28 DPE 1 h exposed schistosomes is very different than that of the 28
DPE 20 h PZQ exposed groups, suggesting that juvenile worms are able to mount a
response to PZQ upon exposure that allows them to survive for a time, but that amount of
time might not be indefinite as the mortality data in Figure 2C shows.
To reiterate, we believe that this analysis of the transcriptomic changes associated with
each treatment group suggests that 42 DPE male S. mansoni do not mount a sufficiently
robust response on exposure of PZQ and thus are the most sensitive to the lethal effects
of the drug. In contrast, 28 DPE S. mansoni are able to mount a significant transcriptional
response on initial exposure of PZQ, which may allow them to survive for some period of
time.
28
3.4 Feature Annotation and Identification
To help identify and better understand the interesting transcriptional patterns we found in
sections 3.2 and 3.3, we blasted the EST sequences the microarray probes represented
with NCBI’s Swissprot and Non-Redundant (NR) databases as well as KEGG and GO
databases. Eighty seven percent of the 8582 expressed features had annotation from at
least one of these databases (Table 13). Likewise, we found that 89% of the 6161
significantly expressed features had annotation from at least one of these databases.
Finally, we found that approximately 97% of the 1052 significantly and differentially
expressed features were annotated. This suggests a bias towards conserved genes within
the cohort of the more highly differentially regulated genes in PZQ treated worms, which
implies that PZQ’s mode probably acts through previously understood mechanisms.
3.5 Confirmation of Transcriptional Profile
Real-Time PCR (RT-PCR) was employed to validate the gene expression data obtained
from the microarray analyses and was performed on nine genes from the 28 DPE 1
µg/mL PZQ 20 h exposure group and four genes from the 28 DPE 10 µg/mL PZQ 20 h
exposure group. Of the initial group of nine genes, three were chosen because they were
significantly and differentially upregulated on the array (TC11991, TC16575 and
TC7600), three because they were significantly and differentially downregulated
(TC7830, TC14697 and TC14236) and three genes because they were not differentially
expressed (TC10825, TC9859 and TC9950) (Fig. 8). The four genes from the juvenile
10 µg/mL PZQ 20 h group (Fig 9) consisted of two genes chosen because they were
significantly and differentially upregulated (TC16575 and TC7600) and two genes that
were significantly and differentially downregulated (TC14236 and TC14697). Figures 8
29
and 9 demonstrate that the RT-PCR study showed the same pattern of expression all the
genes as was seen on the microarray. Tables 14 and 15 depict the expression results of
both the microarray and the Real-Time PCR for the tested features.
3.6 Extreme Gene Regulation
To help with identification of genes that PZQ might be acting on, we generated a list of
those genes undergoing the most extreme degrees of differential regulation compared to
untreated controls. These were genes that not only had high fold-change values within
individual treatment groups, but they also varied extensively between groups. For
example, array feature TC13647, for which there was no annotation, was not only upregulated over 20-fold in the 28 DPE 20 h PZQ exposed groups, but it was downregulated approximately 3-fold in the 28 DPE 1 h PZQ exposed groups. There were 74
gene features that met these criteria and of these 13 were hypothetically expressed
schistosome proteins and 20 had no annotation whatsoever, leaving only 55% of these
extremely regulated genes annotated. Some interesting genes from this annotated group
include calmodulin (TC18546), ferritin 1 (TC7601), ferritin 2 (TC7600), two egg proteins
(TC9623 and TC7919), several heat shock proteins (TC16575, TC17408 and TC16535)
and a drug transporter (TC14236). A list of all 74 features and the respective fold change
values for each group can be found in Table 16. In addition, Figure 10 is a heat map
depicting the expression of these 74 features. It can be seen from this figure that the 28
DPE 20 h PZQ exposures are upregulating the vast majority of these genes, the 28 DPE 1
h PZQ exposures are downregulating more of these genes than any other group and that
the 42 DPE male 1 h PZQ exposures only significantly express two of these genes
between them. This again lends credence to the idea that short-term PZQ exposed
30
juvenile worms are mounting a unique transcriptional response to the drug and that the
short-term exposed adult male worms are relatively transcriptionally inactive.
3.7 Gene expression analysis
Clearly it would be overly time-consuming and perhaps relatively unproductive to
examine each of the differentially expressed genes individually. Rather, we chose to
select groups of genes for further investigation based on what is known about
schistosome biology and the worm’s physiological response to PZQ. Thus, we used the
annotations described in section 3.4 to further investigate expression of four groups of
genes; those involved in:
(i)
calcium regulation
(ii)
apoptosis
(iii)
iron homeostasis
(iv)
drug binding and detoxification
3.7.1 Calcium Regulation
Since a large influx of calcium ions is one of the most prominent observations in
schistosome exposure to PZQ, we decided to look at how many calcium related genes
were significantly expressed in the treatment groups. There were 186 different
significantly expressed genes with a calcium related function and an average of 50
expressed in each treatment group (Table 17). The 28 DPE 20 h PZQ exposed groups
expressed the most calcium related genes with an average of 105 being expressed and the
42 DPE male 1 h PZQ exposed groups expressed the least with an average of 4 being
31
significantly expressed. However, when accounting for calcium related expression as a
percentage of total significant gene expression, the 28 DPE 10 µg/mL PZQ 1 h group
expressed the most calcium related genes compared to the other groups (~4.31%) and the
42 DPE male 1 µg/mL PZQ 1 h exposure group the least (~1.44%) (Table 18). In
addition, it can be seen that on average half of the significantly expressed calcium related
genes were up-regulated. Though it appears the 42 DPE male 1 h PZQ exposed groups
are upregulating the most calcium related genes (Table 19), they only are significantly
expressing an average of 4 calcium related genes (Table 17) between them. Thus, it is
truly the 42 DPE male 1 µg/mL PZQ 1 h group that is significantly upregulating the most
calcium related genes (56%; Table 19).
Furthermore, when evaluating the overlap in genes related to calcium expression, it can
be seen when comparing the two 28 DPE 1 h exposed groups, 20 significantly expressed
genes overlapped in the same direction (i.e., up- or down-regulated). Included in the 11
upregulated genes were two calcium binding atopy-related autoantigens (TC15469 and
TC8640), which are involved in binding calcium when mitochondrial calcium
concentrations increase, calpain (TC17049), a mitochondrial solute carrier (TC19570)
and an Na+/K+ transporting ATPase subunit alpha (TC7518). There were no genes from
this cohort that had conflicting expression patterns (i.e., were up-regulated in one group
but down regulated in the other), thus leaving 41 genes individually expressed in one or
the other group. Of the 28 DPE 20 h exposed groups, 78 significantly expressed genes
overlapped in the same direction. There were no genes from this cohort that had
conflicting expression patterns, leaving 53 genes individually expressed. In the 42 DPE
female 20 h exposed groups, 11 significantly expressed genes overlapped in the same
32
direction and three genes from this cohort had conflicting expression patterns, thus
leaving 85 genes individually expressed. None of the 42 DPE male 1 h exposed group
had genes that significantly overlapped with each other.
In addition, of the two 28 DPE 1 h PZQ exposed overlaps, 10 genes overlapped, but with
conflicting expression. Among these were TC8640 and TC17049 as well as an annexin
(TC15390). The full list and significant expression values can be found in Table 20. Of
the 28 DPE 20 h overlap, four significantly expressed genes overlapped in the same
direction with the 42 DPE female 20 h overlap and two genes overlapped with conflicting
expression patterns. These genes and their respective significant expression values can
all be found in Table 20.
3.7.2 Apoptosis
Calcium can be a trigger for apoptosis, or programmed cell death, through several
mechanisms; one of them being that an influx of calcium can lead to activation of
caspases (Li et al., 2003; Mattson, 2007 and He et al., 2000). Caspases, also known as
cysteine proteases, are necessary for the cascade of events that eventually lead to
programmed cell death (Fan et al., 2005). In addition, blebbing, an outward bulge caused
by destruction of a cell’s cytoskeleton during apoptosis (Deschesnes et al., 2001), as a
result of in vitro PZQ exposure has been shown to occur in schistosome tegumental and
subtegumental structures (Shaw and Erasmus, 1984 and Xiao et al., 2009). With these
observations in mind, we thought it would be prudent to further investigate the
transcription of genes related to programmed cell death in our treatment groups.
33
We found 137 different significantly expressed genes with an apoptosis related function
(Table 17). The 28 DPE 20 h PZQ exposed groups expressed the most apoptosis related
genes with an average of 66 and the 42 DPE male 1 h PZQ exposed groups expressed the
least with an average of 5 being significantly expressed.
When evaluating the overlap in genes related to apoptosis, it can be seen that of the 28
DPE 1 h exposed groups, 14 significantly expressed genes overlapped in the same
direction and one gene, p30 DBC (TC7500), had conflicting expression between the two
exposure groups. This leaves 26 apoptosis related genes individually expressed in the 28
DPE 1 h exposed groups. Of the 28 DPE 20 h exposed groups, 55 significantly expressed
genes overlapped in the same direction. There was one gene, an annexin (TC16153),
which had a conflicting expression between the two groups and left 19 genes individually
expressed in this cohort. In the 42 DPE female 20 h exposed groups, 11 significantly
expressed apoptosis related genes overlapped in the same direction and one gene from
this cohort had a conflicting expression pattern, thus leaving 59 genes individually
expressed. Finally, only one gene overlapped between the 42 DPE male 1 h exposed
group, a member of the sno and ski oncogene family (TC14224) leaving 9 genes
independently expressed in this cohort.
In addition, of the two 28 DPE overlaps, 7 genes overlapped, but with conflicting
expression (Table 21). Six of these genes were downregulated in the 28 DPE 1 h exposed
overlap and upregulated in the 28 DPE 20 h exposed overlap. Of these six, three were
programmed cell death proteins (TC10907, TC11294 and TC11843), one had similar
homology to death associated protein 5 (TC18668), one was an annexin (TC15390) and
34
one was a protein kinase (TC9163). This suggests that PZQ might inducing the apoptosis
cascade via some unknown path or mechanism and that the juvenile schistosomes
exposed to PZQ for 1 h are able to sustain this damage while the juveniles exposed to
PZQ for 20 h are not and this may be the reason that we start seeing significant mortality
in the 28 DPE 10 µg/mL PZQ 20 h group (Fig. 2). The 28 DPE 1 h exposed overlap also
overlapped with five genes related to apoptosis from the 42 DPE male 1 µg/mL PZQ 20 h
group. These were all regulated in the same direction and can be found in Table 21. The
overlap from the 28 DPE 20 h exposed schistosomes overlapped with seven apoptosis
related genes from the 42 DPE female 20 h exposed overlap all in the same direction.
Included in the three upregulated genes were a programmed cell death protein (TC17324)
and a homologue to death effector domain-associated factor A (TC9795). Finally, the
overlap from the 28 DPE 20 h exposed overlapped with ten apoptosis related genes to the
42 DPE male 1 µg/mL PZQ 20 h group. Of these ten, two were upregulated in the 28
DPE 20 h exposed overlap and downregulated in the 42 DPE male 1 µg/mL PZQ 20 h
group. These were an annexin (TC15390) and a serine/threonine protein kinase
(TC17560). The other eight genes that overlapped between these groups were all
regulated in the same direction. Included in the three of these eight that were upregulated
was a gene that shared homology to death-associated protein kinase 3 (TC12214). Of the
five that were downregulated was an inhibitor of apoptosis (TC19191) and a programmed
cell death protein (TC13976). These genes all suggest that susceptible groups to PZQ
such as the 42 DPE male 1 µg/mL PZQ 20 h group are undergoing some form of
damaging apoptosis, perhaps to cells of the tegument, which again lends support to the
idea that PZQ somehow induces apoptosis. These genes and their respective significant
expression values can be found in Table 21.
35
3.7.3 Iron Homeostasis
Another interesting aspect of schistosome biology revolves around ferritin. Iron
homeostasis is regulated by ferritin and the transferrin receptor (TfR) (Leibold and Guo,
1992). Typically, iron is brought into the cell via TfR mediated endocytosis of diferric
transferrin. After being delivered to the endosome the iron is released and transferred to
ferritin, a multisubunit molecule that helps sequester iron in the cytoplasm (Theil, 1987).
Ferritin keeps iron in an available form for biological use in processes such as oxygen
transfer, electron transfer, nitrogen fixation and DNA synthesis (Theil, 1990). In most
eukaryotes ferritin is regulated posttranscriptionally. The reason for this is thought to be
because of the toxic nature of free intracellular iron (Leibold and Guo, 1992), that can
form reactive oxygen species (ROS) which can in turn cause the degradation of cellular
constituents such as lipid membranes. Ferritin synthesis is controlled by cellular iron
levels (Rouault et al., 1992). Translational regulation of ferritin mRNA depends on a
highly conserved regulatory region called the iron-response element (IRE) (von Darl et
al., 1994 and Dunkov et al., 1995). This IRE is found in all known ferritin mRNAs of
higher eukaryotes (Theil, 1994) except for the yolk ferritin of Lymnaea (von Darl et al.,
1994) and the ferritin of S. mansoni (Schussler et al., 1996). In the majority of higher
animals when iron levels are low, the iron-response element binding protein (IRE-BP)
binds IREs and this represses translation of ferritin and stabilizes TfR mRNA resulting in
an increase in iron uptake and a decrease in iron stores (Leibold and Guo, 1992).
Conversely, when there are high levels of iron, IRE-BP does not bind IRE causing the
degradation of TfR mRNA and an increase in ferritin synthesis. This results in a decrease
of iron uptake and an increase in iron stores. This, however, does not appear to be the
case for S. mansoni. Schussler et al. (1995) demonstrated that S. mansoni posses two
36
isoforms of ferritin, soma (SmFER2) and yolk (SmFER1) ferritin. Soma ferritin is
expressed at constant levels in most cells of both sexes perhaps because schistosomes are
able to obtain constant supplies of iron from their host. One proposed way the worms
achieve this is by digesting host erythrocytes in the gastrodermis by cytolytic and
proteolytic enzymes that catabolize hemoglobin to free amino acids or dipeptides for
gastrodermal syncytium absorption (Lawrence, 1973; Kasschau and Dresden, 1986;
Brindley et al., 2001). More recently, however, it has been proposed that transtegumental transport of host ferritin is the likely means of iron acquisition (Smyth et al.,
2006). Conversely, yolk ferritin is female-specific and expressed in high levels in the
vitellarium. The roles for SmFER2 include early embryogenesis (Schussler et al. 1995)
and the formation of cross-linked proteins in eggshell formation (Jones et al., 2007). All
schistosomes have a high demand for iron, but female worms have been shown to ingest
as many as 330,000 host erythrocytes per hour, the equivalent of 0.88 µL of blood daily,
whereas male worms ingest 39,000 erythrocytes per hour (Lawrence, 1973). In addition
to having two types of ferritin, both types of S. mansoni ferritin lack an IRE sequence and
no IRE-BP has been identified in the worms (Schussler et al., 1996). This may be related
to the fact that schistosomes are thought to permanently ingest bound iron as erythrocytes
or serum ferritin at constant levels so gene expression doesn’t need to be adapted to iron
concentrations. Finally, Schussler et al. (1996) concluded that they cannot rule out the
possibility of non-canonical schistosome IRE or IRE-BP; however, they do not think it
likely because they believe both SmFERs are controlled transcriptionally and
independent of iron as is the case for ferritin in mammalian glioma cells (Yokomori et
al., 1991), thyroid cells (Chazenbalk et al., 1990), pancreatic insulin cells (MacDonald et
37
al., 1994) and monocytes (Fahmy and Young, 1993) where ferritin is regulated by
proteins other than iron.
Outside of these peculiar observation, little is known about the iron transport and
regulation mechanisms that schistosomes possess; however, along with previously known
iron storage molecules such as ferritin, schistosomes must possess sufficient machinery to
survive for many years in their hosts’ without fatal damage from iron-generated ROSs.
Smyth et al. (2006) identified two divalent metal transporters, SmDMT1A and
SmDMT1B, in S. mansoni. Through iron uptake assays with these DMT1s, Smyth and
colleagues were able to rescue iron-transport deficient yeast, showing they were involved
in schistosome iron transport. SmDMT1A was expressed in S. mansoni eggs, miracidia,
cercariae, schistosomula and adult worms; whereas SmDMT1B was expressed primarily
in schistosomula and adult worms, suggesting it is probably related to parasitism of the
mammalian host. The cDNA of the two transmembrane DMT1s are almost identical
except for a short N-terminal sequence that is predicted to be intracellular. Smyth et al.
(2006) hypothesize that the “variable region (of DMT1) targets either a transporter to
distinct membrane domains with distinct sets or partner regulatory proteins.” The
mechanism by which transferrin delivers its iron load remains elusive, but it has been
shown that schistosomes bind host transferrin on their surface (Clemens and Basch,
1989). Not surprisingly these schistosome DMT1s are localized primarily to the worm
tegument, which suggests “trans-tegumental transport as one means of iron acquisition”
(Smyth et al., 2006). However, the tegument is not involved in the degradation of
erythrocytes (Xiao et al., 2000) so ferric iron from the host’s transferrin must be released
through some surface-associated molecular pathway. This is a likely scenario since
38
endocytosis of host transferrin has been shown to exist in trypanosome (Fast et al., 1999)
and Plasmodium (Rodriguez and Jungery, 1986). Smyth et al. (2006) conclude that it is
possible a hypothetical schistosome transferrin receptor provides ferric ions for uptake by
SmDMT1. In addition to the need to identify how host transferrin is endocytosed,
Glanfield et al. (2007) believe that further investigation into heme utilization mechanisms
is critical to understanding schistosome physiology.
Since so little is understood about schistosome iron homeostasis and because it is
hypothesized that much of this process takes place in the worm tegument, an organ
known to be differentially affected by PZQ, we decided to look more in depth at how
genes related to iron homeostasis were being significantly expressed in our treatment
groups. There were 68 different significantly expressed genes with an iron related
function and an average of 18 expressed in each treatment group (Table 17). The 28 DPE
20 h PZQ exposed groups expressed the most iron related genes with an average of 38
being expressed and the 42 DPE male 1 h PZQ exposed groups expressed the least with
an average of 4 being significantly expressed. It can also be seen that the 28 DPE 1 h
PZQ exposed groups are expressing an average amount of genes related to iron (Table
18), but the percent of these genes that are upregulated is higher than any of the other
groups with an average of 64% of the iron related genes being upregulated between the
two treatment groups (Table 19). In addition, it is again the adult 20 h exposures that are
downregulating the greatest number of iron related genes with an average of only 36%
being upregulated and the obvious outlier from these is the 42 DPE male 1 µg/mL PZQ
20 h group with only 14% of iron related genes being upregulated. Furthermore, when
evaluating the overlap in genes related to iron homeostasis, it can be seen that of the 28
39
DPE 1 h exposed groups, 7 significantly expressed genes overlapped in the same
direction. Three of these seven are upregulated and include S. mansoni yolk ferritin
(TC7601) and S. mansoni soma ferritn (TC7600). There were no genes from this cohort
that had conflicting expression patterns, thus leaving 13 genes individually expressed. Of
the 28 DPE 20 h exposed groups, 33 significantly expressed genes overlapped in the
same direction. Again, no genes from this cohort had conflicting expression patterns,
leaving only 8 genes individually expressed. In the 42 DPE female 20 h exposed groups,
5 significantly expressed genes overlapped in the same direction and none from this
cohort had conflicting expression patterns either, thus leaving 33 genes individually
expressed. None of the 42 DPE male 1 h exposed group had iron related genes that
significantly overlapped with each other.
In addition, of the two 28 DPE overlaps (i.e., the significantly expressed gene overlap
that overlaps between the 28 DPE 1 h PZQ exposed overlap and the 28 DPE 20 h PZQ
exposed overlap), 4 genes overlapped and they were all expressed in the same direction.
The two upregulated genes were SmFerritin1 (TC7601), yolk ferritin, and SmFerritin2
(TC7600), soma ferritin. The two downregulated genes were a mitochondrial
intermediate peptidase (TC10450) and DNA primase large subunit (TC15620). Of the 28
DPE 20 h overlap, six significantly expressed genes overlapped in the same direction
with the 42 DPE male 20 h overlap and one gene overlapped with conflicting expression
patterns. The six genes in the same direction were all downregulated and included in
them was a histone acetyltransferase-related gene (TC19229) and two HIRA interacting
proteins (TC18476 and TC9147), which interact with (HIRA), a histone chaperone. This
might suggest that free iron could be entering the schistosomes in these 20 h exposures
40
and creating damaging oxygen radicals (ROS). However, there was not a clear bias
towards regulation of enzymes that protect against ROS damage. For example, there
were two superoxide dismutase precursor proteins significantly expressed on the
microarray (TC16777 and TC16781). They were both significantly upregulated in the
42DPE female 20 h PZQ exposed groups and TC16777 was significantly upregulated in
the 42 DPE male 10 µg/mL PZQ 1 h exposed group. In addition, there were three
superoxide dismutases significantly expressed on the microarray (TC10844, TC12708
and TC14056). TC10844, a copper/zinc superoxide dismutase was significantly
upregulated in the 42 DPE male 10 µg/mL PZQ 1 h exposed group. TC12708, also a
copper/zinc superoxide dismutase was significantly upregulated in the two 28 DPE 20 h
PZQ exposed groups. Finally, TC14056, a manganese superoxide dismutase was
significantly upregulated in the 42 DPE male 1 µg/mL PZQ 20 h exposed group and the
28 DPE 1 µg/mL PZQ 1 h exposed group. In addition TC8031, glutathione peroxidase-2,
was significantly upregulated in the 42 DPE male 1 µg/mL PZQ 20 h group and
downregulated in the 42 DPE female 10 µg/mL PZQ 20 h group. Finally TC10653,
phospholipid glutathione peroxidase, was significantly upregulated in both the 42 DPE
female 20 h PZQ exposed groups as well as the 28 DPE 20 h PZQ exposed groups.
There is clearly a bias towards upregulation of these enzymes, which help protect against
ROS damage, however, there is no clear pattern of regulation between the groups.
Iron metabolism in schistosomes is shrouded in mystery. Questions as to how ferritin is
regulated, since it has been shown that ferritin lacks an IRE and no IRE-BP exists, and to
why there are two ferritin isoforms remain largely unanswered. It is thought however
that a receptor for host ferritin exists on the schistosome tegument and that the receptor is
41
most likely regulated transcriptionally by some unknown cue. Thus it is possible that
disruption to the tegument, either through blebbing due to apoptosis or some other means,
occurs in adult schistosomes allowing free iron to enter cells. The juvenile worms remain
unaffected because their tegument is not as damaged and not as much iron enters. The
adult female schistosomes are naturally prepared to handle much larger iron levels than
males due to the fact that they possess a second ferritin isoforms, yolk ferritin. Thus
adult male schistosomes become the most susceptible to damage from ROS and
experience the highest levels of mortality (Fig. 2).
3.7.4 Drug Binding and Detoxification
The previous observations, particularly with iron related genes, suggest the 28 DPE 1 h
PZQ exposed worms are able to do something none of the other groups can manage.
However, the most striking example of this observation might be in the genes associated
with detoxification. Obviously these genes have not evolved to excrete PZQ from S.
mansoni in the evolutionarily brief period of time since PZQ has been used to treat
schistosomiasis, but many drug transporters are not specific for clearance of one
substance. Instead they are capable of clearing multiple toxins from an organism as is the
case with MDR1 in Plasmodium falciparum, which can confer the parasite with
resistance to mefloquine, lumefantrine, halofantrine, quinine and artemisinin (Sidhu et
al., 2006). In our study we found 31 different significantly expressed genes with a drug
related function and an average of 12 expressed in each treatment group (Table 17). Of
these, three had a drug binding function, two were involved in drug metabolism, nine
were involved in a response to drugs and most of the others had some sort of role in drug
transport. The 28 DPE 20 h PZQ exposed groups expressed the most drug related genes
42
with an average of 19 and the 42 DPE male 1 h PZQ exposed groups expressed no drug
related genes. However, when accounting for drug related expression as a percentage of
total significant gene expression, it can be seen that both 28 DPE 1 h PZQ exposed
groups are dedicating a greater percentage of their transcriptome to expression of drug
related genes than any of the other treatment groups (Table 18). In fact, the 28 DPE 10
µg/mL PZQ 1 h group is significantly expressing almost three times the amount of drug
related genes as the 42 DPE male 1 µg/mL PZQ 20 h group, which was downregulating
the five drug related genes that were being expressed in that group. In addition, the
average amount of upregulated drug related genes from all the 20 h PZQ exposed groups
is approximately 17%; whereas, the average upregulated genes from the 28 DPE 1 h PZQ
exposed groups is ~67% (Table 19).
Furthermore, when evaluating the overlap in genes related to drug expression, it can be
seen that of the 28 DPE 1 h exposed groups, 4 significantly expressed genes overlapped
in the same direction. Three of these were upregulated and include ABCG2 (TC10285),
which is known to transport drugs out of cells (Koenderink et al., 2010),
dihydropyrimidinase related protein-2 (TC13625) and cyclin B (TC17205), both of which
have been shown to be involved in responses to drugs (AmiGo). The downregulated
gene from this cohort was ABCF3 (TC15933), which encodes a protein of unknown
function (Dean et al., 2001). There were no genes from this cohort that had conflicting
expression patterns, thus leaving 10 genes individually expressed. Of the 28 DPE 20 h
exposed groups, 14 significantly expressed genes overlapped in the same direction. Two
were upregulated, a prohibitin homologue (TC10689) and a HlyD family secretion
protein homologue (TC12637), both involved in response to drugs. The 12 genes that
43
were downregulated in both 28 DPE 20 h PZQ exposed groups included an ABCB1
member (TC14236), SMDR2 (TC14689), ABCB7 (TC17965 and TC8655), ABCG2
(TC8681) and cAMP-specific 35-cyclic phosphodiesterase (TC11920), which is known
to bind drugs. There were no genes from this cohort that had conflicting expression
patterns, leaving 10 genes individually expressed. In the 42 DPE female 20 h exposed
groups, 6 significantly expressed genes overlapped in the same direction and they were
all downregulated leaving 8 genes individually expressed. Included in the six
downregulated genes were an ABCB1 member (TC14236), SMDR2 (TC14689) and an
ABCG2 (TC8681) member. None of the 42 DPE male 1 h exposed group had genes any
significantly expressed drug related genes.
From this drug related expression data, the ATP-binding cassette transporters (ABC
transporters) are probably the most interesting group of genes. ABC transporters that
actively transport drugs have been shown to confer drug insensitivity to the organism
expressing them. Recent work by Kasinathan et al. (2010a) showed SMDR2 (TC14689)
was expressed at higher levels in S. mansoni with reduced susceptibility to PZQ and that
SMDR2 was a substrate for PZQ. Kasinathan et al. (2010b) went on to show that
SmMRP1 and SMDR2 were expressed at higher levels in the PZQ insensitive juvenile
worms than adults and they concluded that, “increases in levels of schistosome multidrug
transporters may be involved in development or maintenance of reduced susceptibility to
PZQ.” However, in the study performed by Kasinathan et al. (2010b) they compared RTPCR data for unexposed juvenile worms, choosing just to look at normal expression of
the drug transporters. In our study, we examined the response to genes encoding S.
mansoni MDRs when exposed to PZQ. Like Kasinathan et al. (2010a and 2010b), our
44
data indicated that there probably was a response amongst drug transporters to the effect
of PZQ and that juvenile worms exposed to PZQ for 1 h were expressing drug
transporters at higher levels than adults, but at the 20 h exposure the juvenile worms were
downregulating the majority of drug transporters much like the adults. This phenomenon
might explain why juvenile schistosomes start to experience significant levels of
mortality when exposed to PZQ for 20 h in vitro (Fig. 2).
ABC transporters are part of a large and ancient superfamily that are involved in
transporting a wide variety of substances from metals to lipids. There are seven ABC
transporter gene subfamilies in mammals, named ABCA through ABCG. These
subfamilies can have one or several representatives (Dean et al., 2001). Some ABC
transporters are involved in pumping out drugs from cells, which decreases intracellular
drug concentrations and ultimately confers organismal resistance to the drug (BorgesWalmsley et al., 2003). These ABC transporters are known as multiple drug resistant
proteins (MDRs) and include classes of p-glycoproteins (PGPs), multidrug resistant
proteins (MRPs) and breast cancer resistant protein (BCRP). ABC subfamilies that are
known to actively transport drugs include the B, C and G subfamilies (Koenderink et al.,
2010). The typical structure of ABC transporters is two transmembrane domains (TMDs),
with six transmembrane helices (TM) in each domain, as well as two cytosolic
nucleotide-binding domains (NBDs) that bind ATP (Koenderink et al., 2010). The
rearrangement of the TM helices is the mechanism ATP transporters utilize to translocate
substrate across the membrane (Jones et al., 2009). This mechanism is induced by the
dimerization of the NBDs after ATP binds, hydrolyzes and flips them. Despite this
knowledge, there still is very little understanding of the drug binding sites or how many
45
sites a transporter might posses (Borges-Walmsley et al., 2003). For example, it has been
shown that P. falciparum MDR1 conferred parasite resistance to mefloquine,
lumefantrine, halofantrine, quinine and artemisinin (Sidhu et al., 2006), but not to
chloroquine (Koenderink et al., 2010). ABC transporters can be encoded as full
transporters (TMD-NBD-TMD-NBD) or as half transporters (TMD-NBD) that combine
to form a full functional unit when they are translated into proteins (Koenderink et al.,
2010).
ABC transporter members are typically placed in their subfamilies based on phylogenetic
analysis of the NBDs (Sauvage et al., 2009). The publication of the S. mansoni genome
(Berriman et al., 2009) allowed for the prediction of 24 genes that encode ABC
transporters in S. mansoni; 8 B subfamily members, 9 C subfamily members and 4 G
subfamily members were among the 24 transporters. Of these 21 ABC transporter genes
in the S. mansoni genome related to drug transport, seven were identified as significantly
expressed in our microarray data; ABCG1 (TC9950), two members of ABCG2 (TC8681
and TC10285), two members of ABCB1 (TC14236 and TC14689 also described as
SMDR2), an ABCC1 member (TC9859) and an ABCB7 member (represented by both
TC17965 and TC8655). In addition, we obtained expression values for two more drug
transporters that were not on the array with our RT-PCR study. Those included a member
of ABCB8 (SmDR1) and another ABCC1 member (SmMRP1). Expression data for
these transporters can be found in Table 22.
SMDR1, an ABCB8 member, has been shown to encode a half transporter (NBD-TMD)
(Bosch et al., 1994), which is typical of all subfamily B members with the exception of
46
the B1 members (Koenderink et al., 2010). In support of this finding in other organisms,
SMDR2 (TC14689), an ABCB1 member, was shown by Bosch and colleagues to encode
a full transporter consisting of two NBDs and two TMDs, or twelve total TMs. Thus, it is
likely that the ABCB7 (TC17965 and TC8655) member we found in our data encodes a
half transporter and the other ABCB1 (TC14236) member encodes a full transporter. The
protein encoded by the ABCB1 gene is known both as PGP and SMDR2 (Kasinathan et
al., 2010a), so two PGPs are encoded by TC14236 and TC14689; the protein encoded by
ABCB8 is SMDR1 (Dean et al., 2001); and the protein encoded by ABCB7 (TC17965
and TC8655) has been shown to be a mitochondrial transporter involved in biogenesis of
iron-sulfur clusters (Zutz et al., 2009). ABC transporter subfamily C transporters are
known to encode full transporters (Koenderink et al., 2010), thus, both TC9859 and
SmMRP1 probably both encode two full transporters called MRP1s. Finally, ABC
transporter subfamily G members typically encode half transporters (Koenderink et al.,
2010), making this the likely scenario for TC10285 (ABCG2), TC8681 (ABCG2) and
TC9950 (ABCG1). In mammals, ABCG2 encodes BCRP (Dean et al., 2001) and can
transport many various substrates across membranes (Vlaming et al., 2009).
Interestingly, only one ABC C subfamily member was present on the array (TC9859). In
Plasmodium falciparum the ABC C subfamily has been shown to only be present in
asexual stages of the parasite (Koenderink et al., 2010). Similarly, TC9859 was present
in juvenile schistosomes; however, it was upregulated in the 1 µg/mL PZQ 1 h exposure
and down regulated in the 1 µg/mL PZQ 20 h exposure, possibly offering some insight
into why the 1 h exposed juveniles do not experience any significant levels of mortality,
but the 20 h exposures do (Fig. 2). In addition, as with 20 h PZQ exposed juveniles,
47
TC9859 was shown to be downregulated in adult female worms. Schistosoma mansoni
adults lay numerous amounts of eggs, which are mostly responsible for the pathology of
schistosomiasis. This egg production requires a lot of energy. To meet these high energy
demands, schistosomes essentially transport a constant stream of glucose from the host’s
blood via diffusion across their tegument (Skelly and Shoemaker, 1996). These demands
are so high that adult worms consume their weight in glucose every 5 h (Bueding, 1950).
In addition, drug transport via ABC transporters is energetically expensive, requiring two
molecules of ATP to successfully transport its substrate across a membrane (Dean, 2001).
Thus, it is possible that one of the reasons female schistosomes might be less sensitive to
the lethal effects of PZQ than the adult male worms is because they posses this ABCC
drug transporter, but after extended exposure to the drug (i.e., 20 h), the energy demands
of the transporter cause its downregulation and the parasite begins to experience
significant levels of mortality. Finally, we studied another member of the ABC C family,
SmMRP1, with RT-PCR and found similar results as to TC9859 expression (Table 22).
We targeted SmMRP1 in the juvenile exposure groups and found significant up
regulation in the 1 h exposed groups and significant downregulation in the 1 µg/mL 20 h
exposure group, again lending support to the idea that ABC C subfamily members might
be involved in protecting juvenile schistosomes. Although juvenile worms do not lay
eggs, and as a consequence have less energy demands than sexually mature adults, the
downregulation after 20 h exposure suggests that like the adult female worms, juvenile
schistosomes are unable to sustain the ATP demands of the transporters indefinitely.
In addition to testing SMDR1 and SmMRP1 with RT-PCR, since they weren’t on the
array, we also chose to confirm expression of five other drug transporters from the array
48
by RT-PCR: TC10285, TC14236, TC14689, TC9859 and TC9950. In this study, there
was gene expression conflict between the RT-PCR and microarray results for three data
points. It can be seen in Figure 11 that SMDR1 is significantly upregulated (p<0.05
compared to the endogenous control SmGAPDH) in the 28 DPE 1 µg/mL PZQ 1 h
group, but not significantly expressed in the 28 DPE 10 µg/mL PZQ 1 h group or the 28
DPE 1 µg/mL PZQ 20 h group. It can also be seen that SmMRP1 is significantly
upregulated in both 28 DPE 1 h PZQ exposed groups, but downregulated in the 28 DPE 1
µg/mL PZQ 20 h group. The rest of the data matched the significant expression from the
microarray with the exception the 28 DPE 1 µg/mL PZQ 1 h group’s genes TC10285,
which was significantly upregulated on the array and upregulated in the RT-PCR data
though not significantly, and TC9950, which was significantly downregulated on the
array and not significantly expressed with RT-PCR. As well as TC 14689 in the 28 DPE
1 µg/mL PZQ 20 h, which was significantly downregulated on the array and
downregulated in the RT-PCR data though not significantly (Fig. 11).
In all, there was significant expression of nine ABC drug transporter genes in the two 28
DPE 1 h PZQ exposed groups and seven of them were upregulated (Table 22). This can
be contrasted with the two 28 DPE 20 h PZQ exposed groups which significantly
expressed 13 ABC drug transporter genes that were all being downregulated compared to
the group control. The 42 DPE male 1 h PZQ exposed groups didn’t significantly
express any ABC drug transporters and the 42 DPE male 20 h PZQ exposed group only
expressed an ABCB7 member, which was downregulated. Finally, the two 42 DPE
female 20 h PZQ exposed groups significantly expressed 10 ABC drug transporter genes,
three of which were upregulated compared to the group control.
49
This data suggests that juvenile worms are transcriptionally able to upregulate drug
transport related genes in the short-term that allow them to survive the lethal effects of
PZQ until the host has metabolized the drug. However, it appears that this response is
not perpetual as is made evident by the fact that the 28 DPE 20 h PZQ exposed groups
are downregulated their drug transport related genes and they are beginning to experience
significant levels of mortality (Fig. 2). The reason that juvenile worms might not be able
to sustain prolonged drug transport might be related to the fact that these transporters
require ATP to excrete the drugs. In addition, this might explain why adult worms die
from PZQ exposure as well. It might not only be due to the fact that they, for some
reason, are unable to express as many, or the correct, drug transporters, but the high ATP
demands of the transporters coupled with the stage in their life when they are mating,
which likely has high energy demands of its own, is too much of a burden for the
schistosomes and they begin to suffer significant levels of mortality.
50
Chapter 4
Conclusion
The schistosome tegument is a critical organ as it is the principle interface with the host,
including the blood. Hence, there are many important proteins expressed in the worm
tegument related to nutrient uptake, maintenance of solute balance (Braschi et al., 2006a),
transport, structure, enzyme activity (Braschi et al., 2006b) and immunity (Castro-Borges
et al., 2011). Though the means by which PZQ damages the tegument of schistosomes is
unknown, the observation that blebbing occurs in mature (but not juvenile) worms (Xiao
et al., 2009) suggests a possible role for apoptotic pathways (Deschesnes et al., 2001).
Since juvenile worms contract upon PZQ exposure in much the same way as adult worms
(Pica-Mattoccia and Cioli 2004) but are much less sensitive to PZQ (Xiao et al., 1985;
Sabah et al., 1986; Pica-Mattoccia and Cioli, 2004), it is perhaps unlikely that the
observed calcium ion influx that occurs on exposure to PZQ is actually related to in vitro
worm mortality. In addition, if the blebbing that occurs to the mature worm tegument is
caused by apoptosis, calcium is probably not the trigger. However, identifying what
might be triggering programmed death in cells on the surface of schistosomes, where they
come into contact with PZQ, is difficult to ascertain from complex transcriptional data
alone as many of the proteins involved in apoptosis are preformed and the process is
complicated, involving many genes that have multiple roles (Hengartner, 2000). Thus
combining the microarray analysis and a study of the molecules that PZQ binds to
directly, might provide insight into how PZQ initiates a cascade leading to apoptosis.
Furthermore, since significant levels of mortality were found in juvenile worms exposed
to PZQ for 20 h (Fig. 2), it is possible that whatever protects juvenile schistosomes from
51
the lethal effects of PZQ is not perpetual and they begin to lose the mechanism that
allows them to weather PZQs lethality at some point and this leads to death. Thus, this
makes genes that show different expression patterns between the 28 DPE 1 h exposed
groups and the 28 DPE 20 h exposed groups particularly interesting. From our analysis
of apoptosis related genes we found three programmed cell death proteins (TC10907,
TC11294 and TC11843), two death associated protein kinases (TC18668 and TC12214)
and death effector domain-associated factor A (TC9795) which were all downregulated
compared to the group control in the 28 DPE 1 h exposed groups, but upregulated in the
28 DPE 20 h exposed groups and some of the other adult 20 h exposed groups (Table 21).
These six genes are all interesting targets for RNAi knockdown in juvenile worms that
will be exposed to PZQ for 20 h to see if the decreased expression in these genes leads to
a reduction in sensitivity to PZQ. Since PZQ has been shown to cause tegumental disruption, particularly in adult male
worms (Shaw and Erasmus, 1984; Xiao et al., 2009), this likely interferes with many
critical schistosome biological processes in adult worms. One of these processes is likely
iron homeostasis, since the worms bind host ferritin on their surface (Clemens and Basch,
1989) and likely endocytose it through a hypothetical receptor on the worm tegument
(Smyth et al., 2006). However, since adult female worms also possess a second ferritin
isoform, yolk ferritin, they are capable of binding much more intracellular iron than adult
male worms. In fact, adult female schistosomes have such a high demand for iron, they
can ingest almost 10 times the number of erythrocytes per hour as adult male worms
(Lawrence, 1973). Thus, if tegumental damage caused by exposure to PZQ increases
intracellular iron levels, it is possible adult male worms will experience fatal damage
52
from oxygen radicals; however, the adult females will experience these effects much less
since they are able to bind greater amounts of iron due to the fact they possess yolk
ferritin. In addition, the effects will be much less for the juveniles since they do not
experience the same degree of tegumental damage as the adults. Our array data show that
28 DPE 1 h PZQ exposed worms are significantly downregulating both yolk ferritin
(TC7601 and TC7940) and soma ferritin (TC7600 and TC17896), however, when they
are exposed to PZQ for 20 h, significant expression of both ferritin isoforms dramatically
increases (Table 16) even though they are sexually immature and not producing eggs.
The 42 DPE female 20 h exposed schistosomes are also upregulating both ferritin
isoforms; however, there is no significant regulation of ferritin in any of the adult male
treatment groups. This again suggests that the adult male tegument is disrupted, which
allows exposure to toxic compounds such as free iron while at the same time destroying
the unknown regulatory cue to produce more ferritin to bind the free iron. This effect is
not experienced by the juvenile worms which undergo very little tegumental damage and
thus they have no need to produce more ferritin. After long-term exposure to PZQ,
however, the small amount of damage to the juvenile tegument begins to take its toll and
the worms begin to express more ferritin to bind the free iron. The females are better able
to cope as they naturally produce more ferritin, but at the 20 h PZQ exposure we begin to
see significant levels of mortality in both the adult female and juvenile worms (Fig. 2).
To explore this theory further, work toward identifying whether or not there is increased
tegumental damage to juvenile worms exposed to PZQ for long periods of time (i.e., 20
h) should be undertaken. In addition, it is important to identify the proposed transferrin
receptor and the mechanism of iron store regulation as this might provide novel insight
into possible new therapeutic targets to combat schistosomiasis. Finally, RNAi
53
knockdown of the two ferritin isoforms in adult female schistosomes in order to see if
they become more sensitive to the fatal effects of PZQ might provide insight into whether
or not mortality in adult males is linked to iron influx.
The possibility that PZQ damages the worm tegument through some mechanism like
apoptosis, which then allows entry of damaging compounds like iron to enter the
schistosome seems feasible and even likely given the results of our data; however, it
doesn’t explain why the tegument of adult worms is disrupted more than the tegument of
juveniles. One possibility for why juvenile worms are less sensitive than adults is related
to expression of drug transporters. There are approximately 24 S. mansoni ABC
transporters (Berriman et al., 2009) and 21 of them are in the B, C and G subfamilies,
whose members are known to actively excrete drugs (Koenderink et al., 2010). Of these
21 drug transporters, nine were significantly expressed in the treatment groups we
studied. In all, there was significant expression of nine ABC drug transporter genes in the
two 28 DPE 1 h PZQ exposed groups and seven of them were upregulated (Table 22).
This can be contrasted with the two 28 DPE 20 h PZQ exposed groups which
significantly expressed 13 ABC drug transporter genes that were all downregulated
compared to the group control. The 42 DPE male 1 h PZQ exposed groups didn’t
significantly express any ABC drug transporters and the 42 DPE male 20 h PZQ exposed
group only expressed one downregulated drug transporter. Finally, the two 42 DPE
female 20 h PZQ exposed groups significantly expressed 10 ABC drug transporter genes,
three of which were upregulated. The two ABC C subfamily members (TC9859 and
SmMRP1) were upregulated in the 28 DPE 1 h PZQ exposed groups and down regulated
in the 28 DPE 1 µg/mL PZQ 20 h group. This is of particular interest because ABC
54
subfamily C members are only expressed in asexual stages of P. falciparum (Koenderink
et al., 2010). Thus it is possible that some S. mansoni ABCC transporters are involved in
excretion of PZQ but not expressed in adult male schistosomes. This possibility makes
these genes ideal targets for RNAi knockdown in juvenile worms exposed to PZQ for 1 h
to see if they become susceptible to the drug. In addition, further studies into age-specific
expression of drug transporters might provide key insights into other ABC transporters
that are expressed only in sexually immature worms and thus might be playing a role in
PZQ excretion. Other possible ABC transporter targets for RNAi knockdown in 28 DPE
1 h PZQ exposed schistosomes might be those that are upregulated; i.e., ABCB1
(TC14236), ABCB8 (SMDR1) and ABCG2 (TC10285). TC10285 is of particular
interest because it is not only upregulated in the 28 DPE 1 h exposures, but the 42 DPE
female schistosomes exposed to 10 µg/mL PZQ for 20 h are also upregulating this
transporter as well.
This data suggests that juvenile worms are transcriptionally able to upregulate drug
transport related genes in the short-term that allow them to survive the lethal effects of
PZQ until the host has metabolized the drug. However, this response does not appear to
be long term as is made evident by the fact that the 28 DPE 20 h PZQ exposed groups are
downregulating their drug transport related genes the same time as they are beginning to
experience significant levels of mortality (Fig. 2). The reason that juvenile worms might
not be able to sustain prolonged drug transport could be related to the fact that these
transporters require ATP to excrete the drugs. In addition, this might explain why adult
worms die from PZQ exposure as well. It might not only be due to the fact that they, for
some reason, are unable to express as many, or the correct, drug transporters, but the high
55
ATP demands of the transporters coupled with the stage in their life when they are
mating, which has high energy demands of its own (Khayath et al., 2006), is too much of
a burden for the schistosomes and they begin to suffer significant levels of mortality.
With almost total reliance on one drug, PZQ, to treat schistosomiasis and over 200
million people infected as well as another 779 people inhabiting areas where they are at
risk of contracting the disease (King, 2009), it is pertinent that we develop new
therapeutic strategies for treating schistosomiasis. Hopefully the work we have done in
this study will contribute to new ideas and theories as to what PZQ’s mechanism of
action is and what genes we might be able to target with novel drugs.
56
Figures
Figure 1. Muscular contraction of adult and juvenile schistosomes several minutes after exposure to 10 µg/mL PZQ.
57
A
B
C
Figure 2. The percentage of schistosome found dead at varying PZQ concentrations at either a 1 h exposure time
(dark grey) or 20 h exposure time (light grey) in A) adult males, B) adult females or C) juvenile worms. Asterisks
indicate a significant percent of worm death compared to the group control (0 µg/mL PZQ). One asterisks
represents P<0.05 and two asterisks represents P<0.01.
58
59
Figure 3. The number of upregulated and downregulated differentially expressed features in each treatment group.
60
Figure 4. The number of upregulated and downregulated significantly expressed features in each treatment group.
61
Figure 5. The number of up and downregulated significantly and differentially expressed features in each treatment group.
62
Figure 6. Map depicting the overlap between significantly expressed genes regulated in the same direction (i.e., either both upregulated or both downregulated)
by the distance between the centers of the circles. The distance between the groups was calculated with an equation to express the amount of directional overlap
as a percentage of total expression in the groups (2 x (Number of significantly expressed feature overlap in same regulatory direction between groups A & B)) /
(Sum of significantly expressed features in groups A & B). The area of each circle is correlated to the amount of significantly expressed genes in each group.
63
Figure 7. Venn diagram comparing the upregulated and downregulated significantly expressed genes from the 28 DPE 20 h overlap and the 28 DPE 1 h overlap
in Table 6.
64
Figure 8. RT-PCR expression data for 28 DPE 1 µg/mL PZQ 1 h exposed S. mansoni. The colors of the bars in this figure correlate with the microarray
expression where red represents upregulated features, green represents downregulated features and yellow represents features that weren’t significantly expressed
on the microarray. The bar heights represent the 2−ΔΔCt values the Real-Time PCR data. This method compares expression of a single feature in an experimental
group to the expression of that same feature in a control group and normalizes it to an endogenous control, which in this case was SmGAPDH. Bars above a
2−ΔΔCt value of 1 are upregulated and bars below a 2−ΔΔCt of 1 are downregulated. In addition, bars with a single asterisk above them passed a significance test
with a p-value<0.05 and bars with a double asterisk above them were significant with a p-value<0.01.
65
Figure 9. RT-PCR expression data for 28 DPE 10 µg/mL PZQ 1 h exposed S. mansoni. The colors of the bars in this figure correlate with the microarray
expression where red represents upregulated features, green represents downregulated features and yellow represents features that weren’t significantly expressed
on the microarray. The bar heights represent the 2−ΔΔCt values the Real-Time PCR data. This method compares expression of a single feature in an experimental
group to the expression of that same feature in a control group and normalizes it to an endogenous control, which in this case was SmGAPDH. Bars above a
2−ΔΔCt value of 1 are upregulated and bars below a 2−ΔΔCt of 1 are downregulated. In addition, bars with a single asterisk above them passed a significance test
with a p-value<0.05 and bars with a double asterisk above them were significant with a p-value<0.01.
66
Figure 10. Heat map of the 74 most extremely regulated genes from the microarray study with green representing upregulation, red representing downregulation,
yellow representing mild regulation and black representing no significant expression.
67
Figure 11. RT-PCR expression of ABC drug transporters. The colors of the bars in these figures correlate to the microarray expression where red represents
upregulated features, green represents downregulated features, yellow represents features that weren’t significantly expressed on the microarray and blue
represents genes that were not included on the microarray at all. The bar heights represent the 2−ΔΔCt values the Real-Time PCR data. Bars above a 2−ΔΔCt value
of 1 are upregulated and bars below a 2−ΔΔCt of 1 are downregulated. In addition, bars with a single asterisk above them passed a significance test with a pvalue<0.05 and bars with a double asterisk above them were significant with a p-value<0.01.
Tables
Table 1: PZQ treatment regimes employed in the microarray study on S. mansoni
Note, 28 DPE worms were mixed sex.
Table 2: S. mansoni gene expression tested with Real-Time PCR
All primers are in the 5’ to 3’ direction.
68
Table 3: Three-factor ANOVA comparing variables from the mortality study
69
70
P-values are from t-tests comparing the 20 h mortality results by PZQ concentration to the control for A) adult male worms, B) adult female worms and C)
juvenile worms in column 2. Column 3 employs the same significance test to compare adult male worm mortality to B) adult female and C) juvenile worm
mortality at the same PZQ concentrations for 20 h. Column 4 uses the same significance test to compare adult female worm mortality to C) juvenile worm
mortality at the same PZQ concentrations for 20 h.
Table 4: Statistical comparison of mortality of S. mansoni treated with varying concentration of PZQ for 20 or 1 h
Table 5: Statistical comparison of mortality of S. mansoni treated with varying concentration of
PZQ for 0.25, 0.5 or 1 h
P-values are from t-tests comparing the mortality between varying short-term exposures to PZQ (0.25, 0.5 and 1.0 h)
at different PZQ concentration in A) adult males, B) adult females and C) juveniles. A p-value less than 0.05 is
considered significant.
71
Table 6: Significantly expressed features by exposure group in S. mansoni treated with PZQ
Significantly expressed genes (p < 0.05) by exposure group compared to the group’s control using an unpaired,
unequal variance T-Test (column 5) and the percentage that are significantly expressed of the total genes expressed
in that group (column 6) as well as the amount of those significantly expressed genes that are differentially
expressed (Fold Change > +/- 2) (column 7) and the percentage those are of the significantly expressed genes
(column 8).
Table 7: Comparison of differentially expressed features in PZQ treated and untreated S.
mansoni
72
Table 8: Expressed features by exposure group in S. mansoni treated with PZQ
Expressed genes by exposure group (column 5), the percentage that are upregulated (column 6) and the average
expression value of all the expressed genes in each group (column 7); as well as the amount of those expressed
genes that are differentially expressed (Fold Change > +/- 2) (column 8), the percentage those are of the expressed
genes (column 9) and the percent of those differentially expressed genes that are upregulated.
73
74
The number aligning each column and row is the number of significantly expressed genes that are either upregulated or downregulated between the respective
groups. The bottom row displays the average amount of overlap each group has with the other groups as a percentage of the significantly expressed genes in that
group.
Table 9: Distance matrix exhibiting the number of significantly expressed directional gene overlap between treatment groups
75
The number aligning each column and row is the number of significantly expressed genes that are either upregulated or down regulated between the respective
groups expressed as a percentage of the total amount of significantly expressed genes in those two groups by the equation: (2 x (Number of significantly
expressed feature overlap in same regulatory direction between groups A & B)) / (Sum of significantly expressed features in groups A & B).
Table 10: Distance matrix exhibiting the number of significantly expressed, same direction gene overlap between S. mansoni PZQ
treatment groups as a percentage of the total significantly expressed genes in compared groups
76
The number aligning each column and row is the total number of significantly expressed genes that overlap between the respective groups expressed as a
percentage of the total amount of significantly expressed genes in those two groups by the equation: (2 x (Number of significantly expressed feature overlap
between groups A & B)) / (Sum of significantly expressed features in groups A & B).
Table 11: Distance matrix exhibiting the total number of significantly expressed gene overlap between S. mansoni PZQ treatment
groups as a percentage of the total significantly expressed genes in compared groups
77
A comparison between the percentage of significantly expressed gene overlap in the same direction to the total significantly expressed gene overlap was obtained
by dividing each cell in Table 10 by each cell in Table 11.
Table 12: Distance matrix comparing the percentage of significantly expressed gene overlap in the same direction to the total
significantly expressed gene overlap in S. mansoni PZQ treatment groups
Table 13: Feature annotation by BLAST database
The number of expressed genes that were annotated in one of the five databases blasted (column 2) and the percent
of the total expressed genes those represent (column 3); as well as the amount of significantly expressed genes that
were annotated in one of the five databases blasted (column 4) and the percent of the total significantly expressed
genes those represent (column 5). Finally, the number of significantly and differentially expressed genes that were
annotated in one of the five databases blasted (column 6) and the percent of the total significantly and differentially
expressed genes those represent (column 7).
78
Table 14: Microarray and RT-PCR expression data for 28 DPE 1 µg/mL PZQ 1 h exposed S.
mansoni
RT-PCR was performed to test expression results from the microarray data in 28 DPE S. mansoni exposed to 1
µg/mL PZQ for 1 h. These genes were chosen because they were either significantly and differentially upregulated
on the microarray (TC11991, TC16575 and TC7600), significantly and differentially downregulated on the
microarray (TC7830, TC14697 and TC14236) or because they were not differentially expressed on the microarray
(TC10825, TC9859 and TC9950). The 2−ΔΔCt method employed in the RT-PCR study compares expression of a
single feature in an experimental group to the expression of that same feature in a control group and normalizes it to
an endogenous control, which in this case was SmGAPDH. Values above 2−ΔΔCt of 1 are upregulated and values
below 2−ΔΔCt of 1 are downregulated.
Table 15: Microarray and RT-PCR data for 28 DPE 10 µg/mL PZQ 1 h exposed S. mansoni
RT-PCR was performed to test expression results from the microarray data in 28 DPE S. mansoni exposed to 10
µg/mL PZQ for 1 h. These genes were chosen because they were either significantly and differentially upregulated
on the microarray (TC16575 and TC7600) or significantly and differentially downregulated on the microarray
(TC14697 and TC14236). The 2−ΔΔCt method employed in the RT-PCR study compares expression of a single
feature in an experimental group to the expression of that same feature in a control group and normalizes it to
SmGAPDH. Values above 2−ΔΔCt of 1 are upregulated and values below 2−ΔΔCt of 1 are downregulated.
79
Table 16: List of 74 extremely regulated genes and their patterns of expression
80
List of the 74 most extremely regulated genes from the microarray study and the significant expression value for
each gene in the respective treatment groups.
Table 17: Significant gene expression related to categories of interest
List of four areas of interest in regards to S. mansoni’s response to PZQ and the amount of significantly expressed
genes in each of the five interest areas.
Table 18: Percent significant gene expression related to categories of interest
List of four areas of interest in regards to S. mansoni’s response to PZQ and the percent of significantly expressed
genes in each of the five interest areas of the total expressed genes in each treatment group.
81
Table 19: Percent of genes significantly upregulated in categories of interest
The percentage of the genes in each area of interest from Table 17 that are upregulated in each of the four areas of
interest.
82
83
Table 20: Calcium related genes showing interesting significant expression patterns and overlap between treatment groups
84
Table 21: Apoptosis related genes showing interesting significant expression patterns and overlap between treatment groups
85
A list of the ABC transporters related to drug transport and the significant expression values from the microarray. Also included are the results of the two drug
transporters tested with RT-PCR that were not on the microarray, SMDR1 and SmMRP1. Values for RT-PCR expression are not reported, just the direction of
significantly expressed genes from the tested exposure groups.
Table 22: ABC drug transporter related significant expression
References
1. Andrews P (1978) Effect of praziquantel on free-living stages of Schistosoma mansoni.
Zeitschrift Fur Parasitenkunde-Parasitology Research 56: 99-106.
2. Andrews P (1981) A summary of the efficacy of praziquantel against schistosomes in
animal-experiments and notes on its mode of action. Arzneimittel-Forschung/Drug Research
31-1: 538-541.
3. Andrews P, Gonnert R, Pohlke R, Seubert J (1977) Praziquantel, new schistosomicide.
Tropenmedizin Und Parasitologie 28: 275-275.
4. Angelucci F, Basso A, Bellelli A, Brunori M, Mattoccia LP, et al. (2007) The antischistosomal drug praziquantel is an adenosine antagonist. Parasitology 134: 1215-1221.
5. Aragon AD, Imani RA, Blackburn VR, Cupit PM, Melman SD, et al. (2009) Towards an
understanding of the mechanism of action of praziquantel. Molecular and Biochemical
Parasitology 164: 57-65.
6. Azzi A, Cosseau C, Grunau C (2009) Schistosoma mansoni: Developmental arrest of
miracidia treated with histone deacetylase inhibitors. Experimental Parasitology 121: 288291.
7. Berger SL (2007) The complex language of chromatin regulation during transcription. Nature
447: 407-412.
8. Berriman M, Haas BJ, LoVerde PT, Wilson RA, Dillon GP, et al. (2009) The genome of the
blood fluke Schistosoma mansoni. Nature 460: 352-U365.
9. Bueding E (1950) Carbohydrate metabolism of Schistosoma mansoni. Journal of General
Physiology 33: 475-495.
10. Borges-Walmsley MI, McKeegan KS, Walmsley AR (2003) Structure and function of efflux
86
pumps that confer resistance to drugs. Biochemical Journal 376: 313-338.
11. Bosch IB, Wang ZX, Tao LF, Shoemaker CB (1994) Two Schistosoma mansoni cDNAs
encoding ATP-binding cassette (ABC) family proteins. Molecular and Biochemical
Parasitology 65: 351-356.
12. Braschi S, Curwen RS, Ashton PD, Verjovski-Almeida S, Wilson A (2006a) The tegument
surface membranes of the human blood parasite Schistosoma mansoni: A proteomic analysis
after differential extraction. Proteomics 6: 1471-1482.
13. Braschi S, Wilson RA (2006b) Proteins exposed at the adult schistosome surface revealed by
biotinylation. Molecular & Cellular Proteomics 5: 347-356.
14. Brindley PJ, Kalinna BH, Wong JYM, Bogitsh BJ, King LT, et al. (2001) Proteolysis of
human hemoglobin by schistosome cathepsin D. Molecular and Biochemical Parasitology
112: 103-112.
15. Caffrey CR (2007) Chemotherapy of schistosomiasis: present and future. Current Opinion in
Chemical Biology 11: 433-439.
16. Castro-Borges W, Dowle A, Curwen RS, Thomas-Oates J, Wilson RA (2011) Enzymatic
Shaving of the Tegument Surface of Live Schistosomes for Proteomic Analysis: A Rational
Approach to Select Vaccine Candidates. Plos Neglected Tropical Diseases 5.
17. Chazenbalk GD, Wadsworth HL, Rapoport B (1990) Transcriptional regulation of ferritin-h
messenger-RNA levels in FRTl5 rat-thyroid cells by thyrotropin. Journal of Biological
Chemistry 265: 666-670.
18. Chitsulo L, Engels D, Montresor A, Savioli L (2000) The global status of schistosomiasis
and its control. Acta Tropica 77: 41-51.
19. Chitsulo L, Loverde R, Engels D, Barakat R, Colley D, et al. (2004) Schistosomiasis. Nature
87
Reviews Microbiology 2: 12-13.
20. Clemens LE, Basch PF (1989) Schistosoma mansoni - effect of transferrin and growthfactors on development of schistosomula in vitro. Journal of Parasitology 75: 417-421.
21. Dean M, Hamon Y, Chimini G (2001) The human ATP-binding cassette (ABC) transporter
superfamily. Journal of Lipid Research 42: 1007-1017.
22. Deschesnes RG, Huot J, Valerie K, Landry J (2001) Involvement of p38 in apoptosisassociated membrane blebbing and nuclear condensation. Molecular Biology of the Cell 12:
1569-1582.
23. Dubois F, Caby S, Oger F, Cosseau C, Capron M, et al. (2009) Histone deacetylase inhibitors
induce apoptosis, histone hyperacetylation and up-regulation of gene transcription in
Schistosoma mansoni. Molecular and Biochemical Parasitology 168: 7-15.
24. Dunkov BC, Zhang DZ, Choumarov K, Winzerling JJ, Law JH (1995) Isolation and
characterization of mosquito ferritin and cloning of a cDNA that encodes one subunit.
Archives of Insect Biochemistry and Physiology 29: 293-307.
25. Fahmy M, Young SP (1993) Modulation of iron-metabolism in monocyte cell-line U937 by
inflammatory cytokines - changes in transferrin uptake, iron handling and ferritin messengerRNA. Biochemical Journal 296: 175-181.
26. Fan TJ, Han LH, Cong RS, Liang J (2005) Caspase family proteases and apoptosis. Acta
Biochimica Et Biophysica Sinica 37: 719-727.
27. Fantappie MR, Gimba ERP, Rumjanek FD (2001) Lack of DNA methylation in Schistosoma
mansoni. Experimental Parasitology 98: 162-166.
28. Fast B, Kremp K, Boshart M, Steverding D (1999) Iron-dependent regulation of transferrin
receptor expression in Trypanosoma brucei. Biochemical Journal 342: 691-696.
88
29. Fetterer RH, Pax RA, Bennett JL (1980) Praziquantel, potassium and 2,4-dinitrophenol analysis of their action on the musculature of Schistosoma mansoni. European Journal of
Pharmacology 64: 31-38.
30. Fitzpatrick JM, Johnston DA, Williams GW, Williams DJ, Freeman TC, et al. (2005) An
oligonucleotide microarray for transcriptome analysis of Schistosoma mansoni and its
application/use to investigate gender-associated gene expression. Molecular and Biochemical
Parasitology 141: 1-13.
31. Glanfield A, McManus DP, Anderson GJ, Jones MK (2007) Pumping iron: a potential target
for novel therapeutics against schistosomes. Trends in Parasitology 23: 583-588.
32. Gnanasekar M, Salunkhe AM, Mallia AK, He YX, Kalyanasundaram R (2009) Praziquantel
Affects the Regulatory Myosin Light Chain of Schistosoma mansoni. Antimicrobial Agents
and Chemotherapy 53: 1054-1060.
33. Gobert GN, McInnes R, Moertel L, Nelson C, Jones MK, et al. (2006) Transcriptomics tool
for the human Schistosoma blood flukes using microarray gene expression profiling.
Experimental Parasitology 114: 160-172.
34. Greenberg RM (2005) Are Ca2+ channels targets of praziquantel action? International
Journal for Parasitology 35: 1-9.
35. Gryseels B, Polman K, Clerinx J, Kestens L (2006) Human schistosomiasis. Lancet 368:
1106-1118.
36. Harder A, Abbink J, Andrews P, Thomas H (1987) Praziquantel impairs the ability of
exogenous serotonin to stimulate carbohydrate-metabolism in intact Schistosoma mansoni.
Zeitschrift Fur Parasitenkunde-Parasitology Research 73: 442-445.
37. Harnett W, Kusel JR (1986) Increased exposure of parasite antigens at the surface of adult
89
male Schistosoma mansoni exposed to praziquantel in vitro. Parasitology 93: 401-405.
38. He LH, Poblenz AT, Medrano CJ, Fox DA (2000) Lead and calcium produce rod
photoreceptor cell apoptosis by opening the mitochondrial permeability transition pore.
Journal of Biological Chemistry 275: 12175-12184.
39. Hengartner MO (2000) The biochemistry of apoptosis. Nature 407: 770-776.
40. Hotez PJ, Fenwick A (2009) Schistosomiasis in Africa: An Emerging Tragedy in Our New
Global Health Decade. Plos Neglected Tropical Diseases 3: 3.
41. Jones MK, McManus DP, Sivadorai P, Glanfield A, Moertel L, et al. (2007) Tracking the
fate of iron in early development of human blood flukes. International Journal of
Biochemistry & Cell Biology 39: 1646-1658.
42. Jones PM, O'Mara ML, George AM (2009) ABC transporters: a riddle wrapped in a mystery
inside an enigma. Trends in Biochemical Sciences 34: 520-531.
43. Kasinathan RS, Goronga T, Messerli SM, Webb TR, Greenberg RM (2010a) Modulation of a
Schistosoma mansoni multidrug transporter by the antischistosomal drug praziquantel. Faseb
Journal 24: 128-135.
44. Kasinathan RS, Morgan WM, Greenberg RM (2010b) Schistosoma mansoni express higher
levels of multidrug resistance-associated protein 1 (SmMRP1) in juvenile worms and in
response to praziquantel. Molecular and Biochemical Parasitology 173: 25-31.
45. Kasschau MR, Dresden MH (1986) Schistosoma mansoni - characterization of hemolyticactivity from adult worms. Experimental Parasitology 61: 201-209.
46. Khayath N, Mithieux G, Zitoun C, Coustau C, Vicogne J, et al. (2006) Glyceroneogenesis:
An unexpected metabolic pathway for glutamine in Schistosoma mansoni sporocysts.
Molecular and Biochemical Parasitology 147: 145-153.
90
47. King CH (2010) Parasites and poverty: The case of schistosomiasis. Acta Tropica 113: 95104.
48. Koenderink JB, Kavishe RA, Rijpma SR, Russel FGM (2010) The ABCs of multidrug
resistance in malaria. Trends in Parasitology 26: 440-446.
49. Kohn AB, Anderson PAV, Roberts-Misterly JM, Greenberg RM (2001) Schistosome
calcium channel beta subunits - Unusual modulatory effects and potential role in the action of
the antischistosomal drug praziquantel. Journal of Biological Chemistry 276: 36873-36876.
50. Lawrence JD (1973) Ingestion of red blood-cells by Schistosoma mansoni. Journal of
Parasitology 59: 60-63.
51. Leibold EA, Guo B (1992) Iron-dependent regulation of ferritin and transferrin receptor
expression by the iron-responsive element binding-protein. Annual Review of Nutrition 12:
345-368.
52. Lewis, F.A. (1998). Schistosomiasis. Current protocols in immunology, 19.1.1–19.1.28.
53. Li LJ, Fan M, Icton CD, Chen NS, Leavitt BR, et al. (2003) Role of NR2B-type NMDA
receptors in selective neurodegeneration in Huntington disease. Neurobiology of Aging 24:
1113-1121.
54. Liang YS, Coles GC, Doenhoff MJ, Southgate VR (2001) In vitro responses of praziquantelresistant and -susceptible Schistosoma mansoni to praziquantel. International Journal for
Parasitology 31: 1227-1235.
55. Lima SF, Vieira LQ, Harder A, Kusel JR (1994) Effects of culture and praziquantel on
membrane fluidity parameters of adult Schistosoma mansoni. Parasitology 109: 57-64.
56. Macdonald MJ, Cook JD, Epstein ML, Flowers CH (1994) Large amount of (apo)ferritin in
the pancreatic insulin cell and its stimulation by glucose. Faseb Journal 8: 777-781.
91
57. Mattos ACA, Kusel JR, Pimenta PFP, Coelho PMZ (2006) Activity of praziquantel on in
vitro transformed Schistosoma mansoni sporocysts. Memorias Do Instituto Oswaldo Cruz
101: 283-287.
58. Mattson MP (2007) Calcium and neurodegeneration. Aging Cell 6: 337-350.
59. Novoradovskaya N, Whitfield ML, Basehore LS, Novoradovsky A, Pesich R, et al. (2004)
Universal Reference RNA as a standard for microarray experiments. Bmc Genomics 5.
60. Pax R, Bennett JL, Fetterer R (1978) Benzodiazepine derivative and praziquantel - effects on
musculature of Schistosoma mansoni and Schistosoma japonicum. Naunyn-Schmiedebergs
Archives of Pharmacology 304: 309-315.
61. Pfitzer G (2001) Signal transduction in smooth muscle - Invited review: Regulation of
myosin phosphorylation in smooth muscle. Journal of Applied Physiology 91: 497-503.
62. Pica-Mattoccia L, Cioli D (2004) Sex- and stage-related sensitivity of Schistosoma mansoni
to in vivo and in vitro praziquantel treatment. International Journal for Parasitology 34: 527533.
63. Pica-Mattoccia L, Orsini T, Basso A, Festucci A, Liberti P, et al. (2008) Schistosoma
mansoni: Lack of correlation between praziquantel-induced intra-worm calcium influx and
parasite death. Experimental Parasitology 119: 332-335.
64. Pica-Mattoccia L, Valle C, Basso A, Trolani AR, Vigorosi F, et al. (2007) Cytochalasin D
abolishes the schistosomicidal activity of praziquantel. Experimental Parasitology 115: 344351.
65. Redman CA, Robertson A, Fallon PG, Modha J, Kusel JR, et al. (1996) Praziquantel: An
urgent and exciting challenge. Parasitology Today 12: 14-20.
66. Ribeiro F, Coelho PMZ, Vieira LQ, Watson DG, Kusel JR (1998) The effect of praziquantel
92
treatment on glutathione concentration in Schistosoma mansoni. Parasitology 116: 229-236.
67. Rodriguez MH, Jungery M (1986) A protein on Plasmodium falciparum-infected
erythrocytes functions as a transferrin receptor. Nature 324: 388-391.
68. Rouault T, Haile D, Philpott C, Downey W, Harford JB, et al. (1992) The mechanism by
which the iron-responsive element binding-protein senses iron levels and regulates
expression of ferritin and the transferrin receptor. Clinical Research 40: A302-A302.
69. Sabah AA, Fletcher C, Webbe G, Doenhoff MJ (1986) Schistosoma mansoni - chemotherapy
of infections of different ages. Experimental Parasitology 61: 294-303.
70. Satterwhite LL, Lohka MJ, Wilson KL, Scherson TY, Cisek LJ, et al. (1992)
Phosphorylation of myosin-II regulatory light chain by cyclin-P34(CDC2) - a mechanism for
the timing of cytokinesis. Journal of Cell Biology 118: 595-605.
71. Sauvage V, Aubert D, Escotte-Binet S, Villena I (2009) The role of ATP-binding cassette
(ABC) proteins in protozoan parasites. Molecular and Biochemical Parasitology 167: 81-94.
72. Schmittgen TD, Livak KJ (2008) Analyzing real-time PCR data by the comparative C-T
method. Nature Protocols 3: 1101-1108.
73. Schussler P, Potters E, Winnen R, Bottke W, Kunz W (1995) An isoform of ferritin as a
component of protein yolk platelets in Schistosoma mansoni. Molecular Reproduction and
Development 41: 325-330.
74. Schussler P, Potters E, Winnen R, Michel A, Bottke W, et al. (1996) Ferritin mRNAs in
Schistosoma mansoni do not have iron-responsive elements for post-transcriptional
regulation. European Journal of Biochemistry 241: 64-69.
75. Shaw MK, Erasmus DA (1984) Schistosoma mansoni - electron-probe x-ray-microanalysis
of the elemental composition of the tegument and subtegumental tissues of adult worms.
93
Experimental Parasitology 58: 163-181.
76. Sidhu ABS, Uhlemann AC, Valderramos SG, Valderramos JC, Krishna S, et al. (2006)
Decreasing pfmdr1 copy number in Plasmodium falciparum malaria heightens susceptibility
to mefloquine, lumefantrine, halofantrine, quinine, and artemisinin. Journal of Infectious
Diseases 194: 528-535.
77. Skelly PJ, Shoemaker CB (1996) Rapid appearance and asymmetric distribution of glucose
transporter SGTP4 at the apical surface of intramammalian-stage Schistosoma mansoni.
Proceedings of the National Academy of Sciences of the United States of America 93: 36423646.
78. Smyth DJ, Glanfield A, McManus DP, Hacker E, Blair D, et al. (2006) Two isoforms of a
divalent metal transporter (DMT1) in Schistosoma mansoni suggest a surface-associated
pathway for iron absorption in schistosomes. Journal of Biological Chemistry 281: 22422248.
79. Steinmann P, Keiser J, Bos R, Tanner M, Utzinger J (2006) Schistosomiasis and water
resources development: systematic review, meta-analysis, and estimates of people at risk.
Lancet Infectious Diseases 6: 411-425.
80. Tallima H, El Ridi R (2007) Praziquantel binds Schistosoma mansoni adult worm actin.
International Journal of Antimicrobial Agents 29: 570-575.
81. Theil EC (1987) Ferritin - structure, gene-regulation, and cellular function in animals, plants,
and microorganisms. Annual Review of Biochemistry 56: 289-315.
82. Theil EC (1990) Regulation of ferritin and transferrin receptor messenger-RNAs. Journal of
Biological Chemistry 265: 4771-4774.
83. Theil EC (1994) Transition-metal coordination-complexes as probes of messenger-RNA
94
structure - the IRE (iron regulatory element) of ferritin messenger-RNA as a case-study. New
Journal of Chemistry 18: 435-441.
84. Valle C, Troiani AR, Festucci A, Pica-Mattoccia L, Liberti P, et al. (2003) Sequence and
level of endogenous expression of calcium channel beta subunits in Schistosoma mansoni
displaying different susceptibilities to praziquantel. Molecular and Biochemical Parasitology
130: 111-115.
85. Vlaming MLH, Lagas JS, Schinkel AH (2009) Physiological and pharmacological roles of
ABCG2 (BCRP): Recent findings in Abcg2 knockout mice. Advanced Drug Delivery
Reviews 61: 14-25.
86. Vondarl M, Harrison PM, Bottke W (1994) cDNA cloning and deduced amino-acidsequence of 2 ferritins - soma ferritin and yolk ferritin, from the snail Lymnaea stagnalis.
European Journal of Biochemistry 222: 353-366.
87. WHO Schistosomiasis Fact Sheet (2010)
www.who.int/mediacentre/factsheets/fs115/en/index.html
88. Wiest PM, Li YN, Olds GR, Bowen WD (1992) Inhibition of phosphoinositide turnover by
praziquantel in Schistosoma mansoni. Journal of Parasitology 78: 753-755.
89. Xiao SH, Catto BA, Webster LT (1985) Effects of praziquantel on different developmental
stages of Schistosoma mansoni in vitro and in vivo. Journal of Infectious Diseases 151: 11301137.
90. Xiao SH, Mei JY, Jiao PY (2009) The in vitro effect of mefloquine and praziquantel against
juvenile and adult Schistosoma japonicum. Parasitology Research 106: 237-246.
91. Xiao SH, Shen BG, Chollet J, Utzinger J, Tanner M (2000) Tegumental changes in adult
Schistosoma mansoni harbored in mice treated with artemether. Journal of Parasitology 86:
95
1125-1132.
92. Yokomori N, Iwasa Y, Aida K, Inoue M, Tawata M, et al. (1991) Transcriptional regulation
of ferritin messenger-ribonucleic-acid levels by insulin in cultured rat glioma-cells.
Endocrinology 128: 1474-1480.
93. Zutz A, Gompf S, Schagger H, Tampe R (2009) Mitochondrial ABC proteins in health and
disease. Biochimica Et Biophysica Acta-Bioenergetics 1787: 681-690.
96


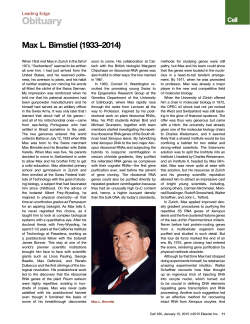


© Copyright 2026