
Playing video games does not make for better visual attention skills
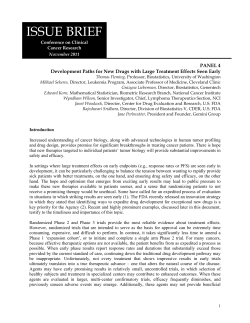
Video games and attention
Journal of Articles in Support of the Null Hypothesis
Vol. 6, No. 1
Copyright 2009 by Reysen Group. 1539-8714
www.jasnh.com
Playing video games does not make for
better visual attention skills
Karen Murphy
Amy Spencer
Applied Cognitive Neuroscience Research Unit,
Griffith Institute of Health & Medical Research, and School of Psychology,
Griffith University, Gold Coast Campus, Gold Coast 4222, Australia
The current study aimed to replicate and extend the findings of Green and
Bavelier (2003) which showed video game players (VGPs) to have superior
temporal attention, spatial distribution of attention and enhanced attentional
capacity compared to non-video game players (NVGPs). Sixty-five males aged
17 to 25 years completed an Attentional Blink task (temporal attention), a
Useful Field of View task (spatial distribution of attention), an Inattentional
Blindness task (attentional capacity) and a Repetition Blindness task (attentional
processing ability). It was expected that VGPs due to their superior attentional
skills would perform better on all tasks than the NVGPs. Results for all tasks
replicated the standard effects. VGPs were found to perform better than NVGPs
in the Attentional Blink task only at the shortest target interval. There were no
other group differences for any task suggesting a limited role for video game
playing in the modification of visual attention.
1
2
Journal of Articles in Support of the Null Hypothesis. JASNH, 2009, Vol. 6, No. 1
Video games have become an increasingly popular pastime in today’s society
(Green & Bavelier, 2003; Greenfield, 1994) and have progressed from a simple test of basic
skill and ability, to a fully interactive experience in an environment that is visually and
attentionally demanding (Blumberg, 1998; Green & Bavelier, 2006a). They require the
player to simultaneously and rapidly process numerous items whilst attending to relevant
objects and ignoring irrelevant information (Castel, Pratt & Drummond, 2005; Green &
Bavelier, 2006a). There can be dire consequences for failing to process a target or allowing
irrelevant information to interfere with this processing during game play. Conversely, there
are significant rewards for accurately processing information (Green & Bavelier, 2006a). For
example, failing to see an enemy appear can result in instant death of an onscreen character,
whilst noticing the enemy amongst other distracting stimuli can lead to advancement in the
game. Greenfield (1994) suggests that this goal-directed nature of video games, along with
the instantaneous feedback they provide, can account for not only their popularity but also
their power in stimulating a variety of cognitive skills.
Video game players (VGPs) relative to non-video game players (NVGPs), have been
shown to have shorter response times (RTs) (Castel et al., 2005), improved visual-spatial
skills (Greenfield, Brannon & Lohr, 1994; Okagaki & Frensch, 1994; Subrahmanyam &
Greenfield, 1994), including better spatial resolution of visual processing (Green & Bavelier,
2007), superior performance on divided attention tasks (Greenfield, DeWinstanley, Kilpatrick
& Kaye, 1994), and increased attentional capacity and abilities (Castel et al., 2005; Green &
Bavelier, 2003, 2006a, 2006b).
One of the earliest studies to demonstrate a link between video game playing and
enhanced visual attention was conducted by Greenfield, DeWinstanley et al. (1994). VGPs
and NVGPs were required to locate a flash (target) that could appear left or right of fixation
or in both positions simultaneously on each trial. NVGPs’ RTs were shorter for targets
presented in the high probability location (80% of trials) and longer for targets presented in
the low probability location (10% of trials) compared to the dual-target control condition
(10% of trials). VGPs also showed a RT benefit for targets in the high probability location.
However there was no difference in RTs for the dual-target and low probability target
conditions, indicating superior visual attention skills in VGPs. In experiment 2, Greenfield,
DeWinstanley et al. (1994) demonstrated this same visual attention advantage for a group of
NVGPs trained on a video game compared to the control group, suggesting a link between
video game playing and improved divided attention skills.
Recently Green and Bavelier (2003) showed that VGPs had greater visual attentional
capacity, better spatial distribution of attention and superior temporal attentional abilities
compared to NVGPs. They also implemented an experimental training design in which
NVGPs were trained for ten hours on either an action game (i.e., one that involves
simultaneously occurring events at different locations on the screen that the player must
attend to), or a non-action game (i.e., one that requires focus on only one object at a time,
but still challenges visuo-motor skills). Those who were trained on the action video game
improved on all tasks compared to those trained on the non-action game (Green & Bavelier,
2003). This illustrates that action video games modify and enhance the capacity and spatial
distribution of visual attention, and temporal processing ability.
VGPs have also been shown to have a superior resolution of visual attention
compared to NVGPs in a visual crowding task (Green & Bavelier, 2007). Participants were
required to indicate the orientation of the letter T and the degree of separation between
Video games and attention
the target and distractors was manipulated. VGPs were able to identify target orientation
accurately at a closer target-distractor distance than the NVGPs. Further when NVGPs
were trained on an action video game they improved more on the visual crowding task
than the NVGPs trained on a non-action video game. In the Green and Bavelier (2003,
2007) studies the inclusion of the non-action game training control condition, demonstrates
that attentional improvements are not simply due to superior visuo-motor coordination or
test-retest improvements (Green & Bavelier, 2003). Hence it is clear that there is a causal
relationship between video game playing and enhanced visual attention skills.
This study will examine differences between VGPs and NVGPs in temporal
attentional abilities (Attentional Blink task) and spatial attention abilities (Useful Field of
View task) with the aim to replicate Green and Bavelier’s (2003) findings on these tasks.
In addition this research will extend previous work in this area, by using an Inattentional
Blindness task under manipulated perceptual load conditions and a Repetition Blindness
task to examine differences between VGPs and NVGPs in attentional processing abilities.
Attentional Blink
The Attentional Blink (AB) (Raymond, Shapiro & Arnell, 1992) is a widely
reproduced finding in the attention literature, and refers to the impaired processing of a
second target (T2) if it is presented within a few hundred milliseconds after the first target
(T1) in a rapid serial visual presentation (RSVP) stream of items (Arnell & Jolicoeur, 1999;
Broadbent & Broadbent, 1987; Chun & Potter, 1995; Raymond et al., 1992; Shapiro, Arnell
& Raymond, 1997). The AB effect is most pronounced for stimulus onset asynchronys
(SOAs) of 200 to 500 ms, with little AB effect typically found for SOAs of 500 ms or
more (Chun & Potter, 1995; Martens, Munneke, Smid & Johnson, 2006; Olivers, 2004).
T2 detection at the 100 ms SOA relative to the 200 ms SOA usually remains high, which is
known as Lag-1 sparing (Visser, Zuvic, Bischof & Di Lollo, 1999). Numerous studies have
shown that the magnitude of the AB can vary amongst different populations. For example,
a larger AB relative to matched control groups has been shown for elderly participants
(Maciokas & Crognale, 2003), participants with ADHD (Li, Lin, Chang & Hung, 2004), or
schizophrenia (Cheung, Chen, Chen, Woo & Yee, 2002) and for NVGPs relative to VGPs
(Green & Bavelier, 2003).
The AB task used by Green and Bavelier (2003) required participants to task switch
from identification (write down the T1 letter) to detection (was T2 “X” present after T1?).
This task switching effect is most evident when both targets are temporally adjacent and
decreases as the T1-T2 interval increases. It is proposed that performance at the 100 ms
SOA (Lag 1) reflects processes associated with an amodal bottleneck, as opposed to the
visual bottleneck that is operational at the 200 ms SOA (Chun & Potter, 1995; Green &
Bavelier, 2003). As VGPs outperformed NVGPs at all SOAs within the AB task, Green
and Bavelier (2003) concluded that VGPs had better task switching and temporal attention
skills due to more efficient operations of their amodal and visual bottlenecks compared to
NVGPs.
Many models have been proposed to account for the AB, including the ResponseCompetition Interference Model (Raymond et al., 1992), and the Short-term Consolidation
Model (Arnell & Jolicoeur, 1999). However this study will focus on Chun and Potter’s (1995)
Two-Stage model, as it is one of the most widely accepted within the literature. According to
3
4
Journal of Articles in Support of the Null Hypothesis. JASNH, 2009, Vol. 6, No. 1
this model in the first stage (Stage 1) all stimuli undergo preliminary processing with simple
features and meaning being registered, but not sufficiently for identification. In the second
stage (Stage 2), which has limited capacity, these basic representations are consolidated
into more permanent representations that are sufficient for reporting. Due to this limited
capacity, no items are processed beyond Stage 1 until preceding items have completed Stage
2 processing. Therefore, an AB occurs when T2 cannot undergo Stage 2 processing because
that limited capacity stage is occupied by the processing of T1 and by the time attentional
resources are free to process T2 this representation has been lost (Chun & Potter, 1995). At
SOAs greater than 500 ms, the AB effect is substantially reduced because the second stage
processing of T1 is generally completed, allowing identification of T2s presented after this
time. When T2 is presented directly after T1 (e.g., 100 ms SOA) performance is unaffected
as both targets are processed together into Stage 2, producing a Lag-1 sparing effect (Visser
et al., 1999).
As video games require efficient search of the onscreen environment and the
processing of several visual items in quick succession, this may enhance the player’s ability to
consolidate items more efficiently. This would enable VGPs to complete Stage 2 processing
of T1 more efficiently than NVGPs, freeing resources for Stage 2 processing before the T2
representation has been lost, resulting in less of an AB. Thus it is predicted that VGPs will
outperform NVGPs on the AB task.
Useful Field of View
The Useful Field of View (UFOV) is described as the total area of the visual field
within which individuals can obtain useful information without moving their head or eyes
(Ball, Beard, Roenker, Miller & Griggs, 1988). Targets are presented rapidly at varying
degrees from the centre of the visual field (eccentricities) to provide a measure of this spatial
distribution of attention. The size of the UFOV has been shown to be reduced for older
compared to younger individuals (Ball et al., 1988; Myers, Ball, Kalina, Roth & Goode,
2000), and males have been shown to have better performance than females on tasks such
as the UFOV (e.g., Terlecki & Newcombe, 2005; Voyer, Voyer & Bryden, 1995).
Some studies (Feng, Spence & Pratt, 2007; Green & Bavelier, 2003, 2006a) have
examined the spatial distribution of attention for VGPs and NVGPs, using a UFOV where
participants were required to locate targets amongst distractors at different eccentricities.
The different eccentricities represent locations within the normal range of video game play
(i.e. the training range; 10°), at the boundary of this range (20°), and outside of this training
range (30°; Green & Bavelier, 2003, 2006a) and the ability to localise a peripheral target was
expected to decrease with increasing eccentricity (Ball et al., 1988). Green and Bavelier (2003,
2006a) and Feng et al. (2007) demonstrated that VGPs detected more targets than NVGPs
at all eccentricities in the UFOV task, indicating that VGPs’ enhanced spatial distribution
of attention was not limited to trained locations within the visual field. Additionally, Green
and Bavelier (2003, 2006a) and Feng et al. (2007) showed that when NVGPs were trained
on an action video game this resulted in better UFOV task performance than the group of
NVGPs trained on a non-action video game, further demonstrating the link between video
game playing and improved visual attention skills.
Green and Bavelier (2006a) investigated if the enhanced visuospatial attention
observed in VGPs was limited to the visual periphery. They introduced a centre task condition
into the UFOV paradigm where participants completed a centre-shape discrimination task
Video games and attention
(identifying which of two shapes appeared within the central fixation square) on each trial
before completing the peripheral localisation task. VGPs exhibited better performance than
NVGPs at all eccentricities, replicating other studies (Feng et al., 2007; Green & Bavelier,
2003). VGPs also displayed superior performance on the centre task itself, supporting the
idea that VGPs have enhanced visuospatial attention throughout the visual field (Green &
Bavelier, 2006a).
Additionally, the performance of the VGPs on the peripheral localisation task was
not affected by inclusion of the centre task, suggesting that the combined load of the two
tasks was still below their capacity for dual-task performance. In contrast, the impaired
performance of the NVGPs on the target localisation task with the additional load of the
centre task suggested a reduced capacity limit, or less attentional resources available to
accurately complete both tasks (Green & Bavelier, 2006a). Based on this evidence of superior
spatial attentional capacity it is expected that VGPs will show superior performance relative
to NVGPs on the UFOV task.
Inattentional Blindness
Inattentional Blindness (IB) refers to the failure to detect the appearance of an
unexpected, task-irrelevant object in the visual field, even if a person is looking directly
at it (Koivisto, Hyönä & Revonsuo, 2004; Mack, 2003; Most et al., 2001). This effect has
been observed in both laboratory conditions and real world scenarios (Koivisto et al., 2004;
Mack, 2003; Simons & Chabris, 1999). For example, Simons and Chabris (1999) found
that just over half of the participants in their study noticed either the woman holding the
umbrella, or a person wearing a gorilla suit, walk directly across the centre of the screen,
whilst they were engaged in a primary task of counting basketball passes between players,
who were shown on screen at the same time. Simons and Chabris (1999) found that the level
of IB depended on the difficulty of the primary task (total number of passes made) and also
on the similarity of the unexpected event to the attended items. They also demonstrated
that the unexpected object could still remain undetected even if it passed directly through
the spatial extent of attentional focus.
Similar results have also been found for computer-based IB tasks (Koivisto et al.,
2004; Most et al., 2001). Most et al. (2001) asked participants to count letters of a certain
colour whilst ignoring others of a different colour, as they moved around a computer
display. Five seconds into the critical trial, an unexpected cross moved horizontally across
the centre of the screen passing behind the fixation point. It was found that an unexpected
stimulus was more likely to be noticed if it was similar to the attended items and dissimilar
from the ignored items. However across all conditions only 50% of observers noticed the
unexpected object on the critical trials, even though it passed directly behind the point of
fixation.
Memmert (2006) measured eye movements whilst subjects completed Simons
and Chabris’ (1999) basketball passes counting task. The results showed that IB occurred
with sustained and highly salient events using both real-life and computer stimuli, and
that simply ‘seeing’ the unexpected, task-irrelevant object was not enough to facilitate
its report. Memmert (2006) extended this work examining expert-novice differences
between basketball players and those with no experience at the sport. As expected more
basketball experts noticed the unexpected stimulus than the novices even though both
groups performed equally on the primary counting task. In the current study, expert-novice
5
Journal of Articles in Support of the Null Hypothesis. JASNH, 2009, Vol. 6, No. 1
6
differences between VGPs and NVGPs will be examined using a computerised IB task
under manipulated levels of perceptual load. This IB task was specifically selected to avoid
using a task that would be like an action video game.
Perceptual load can be defined as the demands placed on visual processing capacity
(Lavie, 1995), and can range from a low level of perceptual load (e.g., having to process
one relevant stimulus), to high levels of perceptual load (e.g., having to process six or more
stimuli; Forster & Lavie, 2007). According to the Perceptual Load Theory (Lavie, 1995),
when a task involves a high level of perceptual load, attentional capacity is exhausted leaving
no additional resources left to process irrelevant stimuli. Conversely, if a task involves low
perceptual load, there is leftover attentional capacity to attend to the irrelevant stimuli
(Lavie, 1995).
Cartwright-Finch and Lavie (2007) manipulated the level of perceptual load in a
computer-based IB task by increasing the number of letters in a visual display (the primary
task), during which an unexpected object flashed rapidly on the screen. Nearly 90% of
participants noticed the unexpected object under conditions of low perceptual load,
and only 50% under high load conditions verifying that perceptual load plays a role in
determining the explicit awareness, and therefore report, of these unexpected stimuli in IB
tasks (Cartwright-Finch & Lavie, 2007).
The IB task will be based on the design of Most et al.’s (2001) study and perceptual
load will be manipulated by increasing the number of both the attended and ignored letters
in the primary monitoring task. In light of the findings of Cartwright-Finch and Lavie
(2007), it is proposed that there will be no difference between the groups in detecting the
unexpected stimulus for the low load condition, as the level difficulty should be within the
capacity limits for both groups. However, for the high load condition, VGPs are expected
to detect more instances of the unexpected stimulus than NVGPs because they will have
attentional resources in addition to those taken up in task-relevant processing. This expanded
capacity for perceptual load could be due to the stimulus-rich, multi-cued nature of many
games in which players have to be aware of the sudden appearance of unexpected objects
(e.g., enemies).
Repetition Blindness
Repetition Blindness (RB) is the difficulty in detecting and reporting both occurrences
of a repeated item in a RSVP stream (Buttle, Ball, Zhang & Raymond, 2005; Campbell,
Fugelsang & Hernberg, 2002; Coltheart, Mondy & Coltheart, 2005; Kanwisher, 1987;
Morris & Harris, 2004). RB has been shown for words, letters, colours, pictures and brand
logos (Buttle et al., 2005; Campbell et al., 2002; Kanwisher, Driver & Machado, 1995)
and it has been explained by numerous models. This study will adopt Kanwisher’s (1987)
Token-Individuation Hypothesis, as it has received wide empirical support (e.g., Morris &
Harris, 2004; Park & Kanwisher, 1994).
The Type-Token approach (Kanwisher, 1987) postulates that in a RSVP stream, type
codes (a representation from long term memory) are activated for all items but if an item
is repeated, the second instance of the type code will not be token-individuated (tokenised)
(the creation of a specific episodic memory token). This occurs because once a type has
recently undergone token individuation it is temporarily unavailable for tokenisation for a
period of time. Therefore the repeated instance of the item is not tokenised and is not able
to be recalled from short-term memory for report. Thus, RB can be seen as a failure of
7
Video games and attention
token individuation.
No studies to date have examined RB in VGPs, however VGPs could be expected to
show less of an RB effect compared to NVGPs due to their increased attentional capacity.
For example as video games involve rapidly attending to identical stimuli, this may allow
VGPs to become more efficient at tokenising second instances of repeated items. Both
word and picture stimuli will be used in a RB task. If playing video games affects the
tokenisation stage of the Token-Individuation model (Kanwisher, 1987), then VGPs should
show a reduced RB effect for word and picture stimuli compared to NVGPs. If their
superior performance is due to practice at rapidly attending to objects like those seen in
video games, then VGPs should only show a reduced RB effect relative to the NVGPs for
picture stimuli.
Method
Participants
The initial sample consisted of sixty-five male first year psychology students aged 17
to 25 years (M = 20.55, SD = 2.40), who participated in return for course credit. The age
and gender of the sample were restricted to closely match that used by Green and Bavelier
(2003). All participants reported normal or corrected-to-normal vision. Participants were
classified into either the VGP or NVGP group as per the criteria used by Green and
Bavelier (2003). VGPs played video games for a minimum of four one-hour sessions per
week in the six months prior to the study, while NVGPs never or rarely played games in
the previous six months. All VGPs reported playing various action video games (e.g., Halo)
or a combination of action and strategy games (e.g., World of Warcraft). Four participants
were excluded because they did not fit the inclusion criteria for either group. Thus the final
sample comprised of 61 males (VGP: N = 32; NVGP: N = 29) aged between 17 and 25
years (M = 20.56, SD = 2.41).
VGPs spent significantly more hours per week playing video games (M = 13.80
hours, SD = 10.37) than NVGPs (M = 0.21 hours, SD = 0.22) [t(59) = -7.05, p < 0.0005, d
= 1.86]. There was no difference between the groups in age [t(59) = 1.27, p = 0.21, d = .33]
(VGPs: M = 20.19 years, SD = 2.35; NVGPs: M = 20.97 years, SD = 2.44), years of education
[t(59) = 0.11, p = 0.915, d = .03] (VGPs: M = 13.09, SD = 1.65; NVGPs: M = 13.14, SD =
1.55), mean hours of non-video game computer usage per week [t(59) = -1.78, p = 0.08, d
= .46] (VGPs: M = 9.75, SD = 7.84; NVGPs: M = 6.67, SD = 5.25), or average hours of
sport or exercise undertaken per week1, [t(59) = 1.38, p = 0.172, d = .36] (VGPs: M = 4.95,
SD = 3.52; NVGPs: M = 6.64, SD = 4.34). Thus the groups were matched on all critical
variables, and only differed on the number of hours per week spent playing video games.
Procedure and Apparatus
All participants undertook one testing session lasting up to two hours during which
the four computer administered tasks were completed. At the start of the session, participants
1
Sporting skill has been shown to be linked with enhanced attentional abilities in a number of studies (e.g., Beilock, Wierenga & Carr, 2002; Turatto, Benso & Umiltà, 1999). Thus participants were asked to
report their sporting history in order to control for any possible confounding variables in the samples that
could influence attentional ability.
Journal of Articles in Support of the Null Hypothesis. JASNH, 2009, Vol. 6, No. 1
8
provided informed consent to take part in the study and completed a brief questionnaire
outlining demographic information, video game playing experience, other computer use
and sporting history. The self-report questions relating to video game playing experience
asked participants “How many times per week would you have played video/computer
games or arcade games over the last six months?”, “On average how long did each of
these video/computer game or arcade game sessions last?”, and “Please list the games
that you typically play - name and type”. At the beginning of each task participants were
given verbal instructions with accompanying demonstration figures, and were also asked
to read instructions presented on the computer screen. Task order was counterbalanced
across participants to minimise order effects throughout the study. The UFOV, AB and RB
tasks were run on a Pentium IV 2.66GHz PC with a Dell Ultra flat CRT monitor using
the DMDX program (Forster & Forster, 2003). The IB task was run on the same computer
using Java version 7.0.
Tasks
Attentional Blink. Each trial commenced with a central fixation ‘+’ presented for 180 ms,
followed by a rapid stream of letters presented for 15 ms each with a blank interstimulus
interval (ISI) of 85 ms. Participants were instructed to record on a response sheet the identity
of the white target letter (T1) in the RSVP stream, then indicate if an ‘X’ (T2) was present
or absent in the stream after the white target letter. All letters in the stream were shown
in black font except for T1. At the end of each trial, participants were prompted to recall
their answers then press spacebar to start the next trial. The ‘X’ (T2) was present of 50%
of the trials and occurred equally at all SOAs of 100 to 500 ms. (Ten trials at each T1-T2
SOA). Responses were scored as correct if T1 was correctly identified and T2 was correctly
detected as present. The ‘X’ absent trials and the total number of T1 correct were also
scored for each participant. Participants completed 20 practice trials followed by one block
of 100 trials presented in random order for each participant.
Useful Field of View. The trial structure consisted of a central fixation square (4° x 4°)
presented for 100 ms, followed by an array of 8 spokes made up of small white squares (4°
x 4°) forming a circular wheel. On each trial, the target stimulus (a filled triangle within a
3° x 3° circle outline) appeared on one of the 8 spokes at one of three possible eccentricities
(10°, 20° or 30° from the centre of the visual field), creating 24 possible locations at which
the target could appear. The target appeared for 6 ms at 10°, or for 12 ms at 20° or 30°.
The difference in target presentation times was to allow for the increased difficulty of
detecting the target at 20° or 30° as opposed to at 10° (Green & Bavelier, 2003). A mask
screen (random coloured patterns) then appeared for 200 ms, followed by a response screen
displaying 8 intersecting lines in the form of the wheel. For each trial, participant accuracy
and RT from the onset of the stimulus-target array, were recorded by the DMDX program
(Forster & Forster, 2003).
Participants were seated 30 cm from the screen and were instructed to locate and
identify where the circle with the triangle inside it (i.e. the target) appeared in the display.
The target could appear on any one of 8 spokes, which were labelled 1 to 8 around the
perimeter of the computer screen. Participants were required to respond by pressing the
corresponding number on the key board number pad. There were 20 practice followed by
240 randomly presented experimental trials, 10 at each of the 24 target locations.
Video games and attention
Inattentional Blindness. The IB task was based on that used by Most et al. (2001). Participants
were required to silently count the number of times either black or white letters (‘L’ and
‘T’) touched the sides of a grey 12.7 x 15.5 cm display window whilst fixating on a small
blue square in the centre. The 1° x 1° block letters moved randomly and independently of
one another at variable rates ranging from 2 to 5 cm/sec and “bounced” off the sides of
the display window. The letters could also occlude each other as they moved along their
paths.
There were two versions of the task, one with 4 letters in the display (low load
condition), and the other with 8 letters in the display (high load condition). There were
equal numbers of black and white letters in both conditions. The VGPs and NVGPs were
randomly and equally assigned to one of the two load conditions, then within those two
load conditions both groups were halved again so that half were instructed to attend to
white letters and half attended to black letters. Thus there were four conditions in the IB
task; attend black letters low-load, attend black letters high-load, attend white letters lowload and attend white letters high-load.
Participants completed five trials lasting 15 seconds each. On first two trials,
participants silently counted the number of times the letters (of the colour they were told
to attend to) hit the sides of the display window, and were then asked by the experimenter
how many times the relevant letters touched the sides of the screen. In the third critical
trial, an unexpected object (a cross of the opposite colour to the attended letters) appeared
on the screen for 5 seconds. The cross (1° x 1°) entered from the right side of the display
and moved horizontally on a linear path behind the fixation point and exited on the left
side of the display window. Participants were again asked how many times the attended
letters touched the sides of the display. They were also asked “Did you detect anything new
that was not present on the previous trials; if you did what did you detect?” If participants
answered “yes” to detecting something new and could either identify the object, identify
where it occurred, its path of motion or pick it from among four other shapes, they were
regarded as having detected the unexpected stimulus. The fourth trial followed the same
procedure as the third, although as participants had been alerted to the possible presence
of an unexpected stimulus, this was deemed a divided attention trial. On the final fifth trial,
participants were instructed not to count the attended letters but to simply keep fixated on
the fixation point and watch the display. They were then asked the same questions about
the unexpected object. As they were not required to count, full attention should have been
devoted to the previously unexpected object. Therefore this full-attention trial served as a
control to ensure participants had understood and followed instructions.
Repetition Blindness. The stimuli for this task were 120 line drawings of objects taken from a
picture database (Szekely et al., 2004) and names of the same objects which were divided
into four groups of 30, that were matched for number of letters and syllables, familiarity,
concreteness and imagability ratings, Kucera-Francis written frequency, and complexity
(Szekely et al., 2004). The four sets of items were cycled through the different positions
of the stimuli to create four different versions of the task, so that each set were the critical
items in one version and the different positions of filler items in the other three versions.
Each trial commenced with a central fixation ‘+’ for 500 ms, followed by nine 100
ms displays presented successively with no ISI. The first three displays were pattern masks,
followed by the first word/object drawing (critical item C1), a filler item, the second critical
item (C2), and then three pattern masks. In the repeat trials, C1 and C2 were of the same
9
10
Journal of Articles in Support of the Null Hypothesis. JASNH, 2009, Vol. 6, No. 1
word/object, and in the no-repeat condition they were different words/objects. For the norepeat trials, the critical item appeared equally in the first or the third position to ensure
that there was no effect of stimulus position.
Participants completed blocked trials for both word and picture stimuli, and the
version of the task and the order in which they completed the task (i.e., words first or
pictures first) were counterbalanced across participants. There were 8 practice trials and 60
experimental trials for both word and picture tasks, with 30 repeat and 30 no-repeat trials
displayed in a random order within each block. Participants were required to write down
the three words or picture names in the order that they appeared at the end of each trial.
Responses were marked as correct if, for the repeat trials both C1 and C2 were correct, and
in the no-repeat trials if the critical item was correct (Buttle et al., 2005).
Results
Attentional Blink Task
Independent-groups t-tests were used to examine group differences on the total
number of correct T2 responses for the X absent trials, and the total number of T1 correct
for all 100 trials. No difference between the groups on these measures would ensure that
any group differences in T2 detection rates (X present trials) were not due to a poor ability
to correctly identify T1, or by simply marking T2 as always present resulting in a high
score on T2 present trials by default. The data from one participant from the NVGP group
was excluded from the analyses due to near chance level performance for total correct T2
absent trials, suggesting that this participant was indicating “X present” on most trials.
There was no difference between VGPs (M = 84.81%, SD = 9.56) and NVGPs
(M = 82.64%, SD = 8.43) for the percentage correct T2 detection on the X absent trials
[t(58) = -0.926, p = 0.358, d = .25]. There was also no difference between the groups
for the percentage of T1 correctly identified [t(58) = -0.311, p = 0.742, d = .09] (VGPs:
M = 95.97%, SD = 3.28, NVGPs: M = 95.71%, SD =2.58). Thus any group differences
found for the T2 (X) present trials (AB) cannot be attributed to T1 or T2 (X) absent trial
performance differences between the groups.
A 2 (group: VGP and NVGP) x 5 (SOA: 100, 200, 300, 400 and 500 ms) mixed
factorial ANOVA was conducted for the percentage correct T2 detections (X present
trials). Where appropriate the Huynh-Feldt correction was applied to correct for violation
of sphericity. The main effect of group was not significant [F(1, 58) = 0.706, p = 0.404,
ηp2 = 0.012]. There was an effect of SOA [F(3.36, 194.99) = 20.15, p < 0.0005, ηp2 = 0.26]
and there was an interaction between group and SOA [F(3.36, 194.99) = 3.40, p = 0.015,
ηp2 = 0.06]. Group comparisons at each SOA showed that VGPs had higher T2 detection
rates than NVGPs only at the 100 ms SOA [t(58) = -2.19, p = 0.032] [SOA 200 ms: t(58) =
-1.32, p = 0.192; 300 ms: t(58) = -0.565, p = 0.574; 400 ms: t(58) = 0.62, p = 0.533; 500 ms:
t(58) = 0.68, p = 0.497]. Refer to Figure 1.
An independent groups t-test was conducted to examine group differences in the
Lag-1 sparing effect (e.g., a decrease of more than 5% in T2 detection accuracy from the 100
to 200 ms SOA, Visser et al., 1999). Although the VGP group (M = 13.13%, SD = 25.58)
showed a larger Lag-1 sparing effect than the NVGP group (M = 8.21%, SD = 19.06) this
difference was not significant [t(58) = -0.833, p = 0.408, d = .23].
11 attention 35
Video games and
Video games and attention
VGPs
T2 detection (%)
NVGPs
SOA (ms)
Figure 1. Mean T2 detection rates for VGPs and NVGPs for all SOAs of the
Figure 1: Mean T2 detection rates for VGPs and NVGPs for all SOAs of the AB task.
AB task.
barsone
represent
oneerror.
standard error.
Note:
ErrorNote:
bars Error
represent
standard
Useful Field of View Task
The data from two VGPs were removed from the analyses due to significant errors
(> 90%) and aberrant RTs, indicating a failure to follow task instructions. A 2 (group: VGP
and NVGP) x 3 (eccentricity: 10°, 20° and 30°) mixed factorial ANOVA was conducted
for the DV of target detection accuracy (%). Sphericity was violated, thus Huynh-Feldt
correction was applied to all analyses where appropriate.
A significant main effect of eccentricity was found [F(1.29, 73.78) = 162.52,
p < 0.0005, ηp2 = 0.74]. Contrasts showed that target detection rates were significantly
higher at 10° (M = 81.45%, SD = 16.37) than at 20° (M = 75.54%, SD = 16.65) [t(57) = 5.88,
p < 0.0005], and higher at 20° than at 30° (M = 50.79%, SD = 18.63) [t(57) = 13.40,
p < 0.0005].
The main effect of group was not significant [F(1, 57) = 0.262, p = 0.611, ηp2 = 0.005],
nor was the interaction between group and degrees of eccentricity [F(1.29, 73.78) = 0.064,
p = 0.862, ηp2 = 0.001]. Refer to Table 1. It is possible that while groups did not differ on
the percentage of target detections, there may have been a difference in their RTs. For
example, although asked to respond as accurately as possible, it may be that VGPs are able
to do this earlier than the NVGPs, which would be evident in the RT data.
A 2 (group) x 3 (eccentricity) mixed factorial ANOVA was conducted for the DV of
RT. A MANOVA could not be conducted for the RT and accuracy data as there was no
linear relationship between these DVs. Also, it is common practice to investigate these DVs
separately in the field of cognitive psychology (Dyckman & McDowell, 2005).
Table 1
Mean percent correct target detection, standard deviations (SD) and mean response time (ms),
Journal of Articles in Support of the Null Hypothesis. JASNH, 2009, Vol. 6, No. 1
12
standard deviations (SD) for the group by eccentricity interaction for the UFOV task.
Accuracy Data
Response Times
Group
Eccentricity
Mean
SD
Mean
SD
VGPs
10°
82.35
17.63
1278
229
20°
76.36
16.64
1205
214
n = 30
30°
52.18
19.27
1221
206
NVGPs
10°
80.62
15.22
1417
351
20°
74.72
16.91
1359
317
30°
49.39
18.17
1371
334
n = 29
Table 1. Mean percent correct target detection, standard deviations (SD) and
mean response time (ms), standard deviations (SD) for the group by eccentricity
interaction for the UFOV task.
Overall VGPs (M = 1235 ms, SD = 274) had shorter RTs than the NVGPs (M =
1382 ms, SD = 274) [F(1, 57) = 4.28, p = 0.043, ηp2 = 0.07]. The interaction between
eccentricity and group was not significant [F(2, 114) = 0.163, p = 0.850, ηp2 = 0.003]. Refer
to Table 1. There was an effect of eccentricity [F(2, 114) = 12.36, p < 0.0005, ηp2 = 0.18],
with longer RTs for targets at 10° (M = 1348 ms, SD = 301) than for the 20° (M = 1282 ms,
SD = 278) [t(57) = 5.38, p < 0.0005], or 30° (M = 1296 ms, SD = 284) [t(57) = 3.38,
p = 0.001]. There was no difference in RTs at 20° and 30° [t(57) = 0.99, p = 0.328]. As the
longer RTs at the 10° target eccentricity were associated with the least errors this might
suggest a speed-accuracy trade off. To investigate this z-scores were calculated for each
condition for both RT and accuracy data. A combined z-score (z-RT + z-accuracy) for each
degree of target eccentricity was then used as the DV in a 2 (group) x 3 (eccentricity) mixed
factorial ANOVA. There was no effect of group [F(1, 57) < .001, p = 0.98, ηp2 < .001], or
eccentricity [F(2, 114) < .001, p = 1.00, ηp2 < .001], and the interaction between group and
degrees was not significant [F(2, 114) = .103, p = .902, ηp2 = 0.002], indicating that the
differences in the RT and accuracy data were due to a speed-accuracy trade off.
Inattentional Blindness Task
Errors in the letter counting task were calculated for each participant by taking the
absolute value of the difference between each count and the actual number of letter bounces
on that trial, then dividing that difference by the number of actual bounces on that trial
(Most et al., 2001). This produced a mean percentage error relative to the number of actual
bounces, and provided a control measure to determine if participants were completing the
primary letter counting task correctly. The fifth full-attention trial also served as a control to
ensure instructions were being followed correctly. All participants detected the unexpected
stimulus on the full-attention trial, so no participant data needed to be excluded from this
task.
A 2 (group: VGP and NVGP) x 2 (load-condition: 2 and 4 letters) between-subjects
ANOVA was run on the mean percentage errors averaged across the first four trials of the
13
Video games and attention
IB task (participants were not required to count on the fifth trial).2 The mean percentage of
errors was larger in the high-load condition (M = 12.39%, SD = 6.71) than in the low-load
condition (M = 3.90%, SD = 4.12) [F(1, 57) = 35.04, p < 0.0005, ηp2 = 0.381], indicating
that the primary counting task was harder for the high-load than for the low-load condition.
There was no difference in mean errors between the VGPs (M = 7.61%, SD = 8.15) and
NVGPs (M = 8.58%, SD = 5.47) [F(1, 57) = .580, p = 0.449, ηp2 = 0.010], and group and
load-condition did not interact [F(1, 57) = 1.37, p = 0.247, ηp2 = 0.023], indicating that
any group difference in detection of the unexpected cross was not due to differences in
performance on the letter counting task.
Errors in the primary counting task for those who detected the unexpected cross
and those who did not, for both the critical (trial 3) and divided attention (trial 4) trials, were
compared to ensure that any differences in the ability to detect the unexpected cross were
not due to differences in performance on the primary letter counting task. On the critical
trial, mean errors did not differ between participants who detected the unexpected cross
(M = 7.25%, SD = 10.49), and those who did not (M = 9.62%, SD = 10.77) [t(59) = .762,
p = 0.449, d = .20]. The same result was found for the divided attention trial [t(59) = .100,
p = 0.921, d = .03], with no significant difference in mean errors for those who detected
the unexpected cross (M = 8.52%, SD = 10.97), and those who did not (M = 8.93%, SD =
9.49). Thus, differences in the ability to perform the primary task could not account for any
differences in the rate of noticing the unexpected cross.
Chi-square analyses were used to examine the number of participants who detected
the unexpected cross (or failed to notice it) under the low and high load-conditions.
Participants detected more instances of the unexpected cross in the low compared to the
high load-condition on the critical trial [c2 (1, N = 61) = 8.036, p = 0.005], and the divided
attention trial [c2 (1, N = 61) = 5.41, p = 0.020]. Refer to Table 2. Therefore, when the
Video games and attention 37
primary letter counting task involved a high perceptual load, participants detected fewer
instances of the unexpected cross.
Table
2 conducted separately for the critical trial and divided
Chi-square analyses
were
Number of participants who correctly detected or did not detect the unexpected stimuli in the
critical and divided-attention trials for the two load conditions for the IB task.
Load Condition
Critical Trial
Divided Attention Trial
Detected
Not Detected
Detected
Not Detected
Low-load
13
18
30
1
High-load
3
27
23
7
Table 2. Number of participants who correctly detected or did not detect the unexpected stimuli in
the critical and divided-attention trials for the two load conditions for the IB task.
2
A 2 (group: VGP and NVGP) x 2 (load-condition: 2 and 4 letters) between-subjects ANOVA was
run for the mean percentage errors for each of the first four trials separately. There were no significant main
effects of group or load-condition. The interactions between group and load condition were all non-significant.
Journal of Articles in Support of the Null Hypothesis. JASNH, 2009, Vol. 6, No. 1
14
attention trial on the number of VGPs and NVGPs
who detected
the unexpected
cross in
Video games
and attention
38
the low-load and high-load conditions. There was no relationship between group and load
condition on the critical trial [c2 (1, N = 61) = 0.007, p = 0.931], or in the divided-attention
Table 3
trial [c2 (1, N = 61) = 0.053, p = 0.817], indicating that for each load condition the same
number of VGPs and NVGPs detected the unexpected cross. Refer to Table 3.
Number of participants who correctly detected the unexpected stimuli in the critical and dividedattention trials, by group and load condition for the IB task.
Group
Load Condition
Critical Trial
Divided Attention Trial
VGPs
Low-load
9
16
n = 32
High-load
2
13
NVGPs
Low-load
4
14
n = 29
High-load
1
10
Table 3. Number of participants who correctly detected the unexpected stimuli in the critical and
divided-attention trials, by group and load condition for the IB task.
Repetition Blindness Task
The data of one participant from each group, were excluded from the analyses for failure to
follow task instructions. A 2 (group: VGP and NVGP) x 2 (stimulus type: words and pictures)
x 2 (condition: repeat and no-repeat) mixed factorial ANOVA was run for the percentage
of correctly identified stimuli. Correct responses were based on correctly reporting both
critical stimuli on the repeat trials and correctly reporting the single critical stimulus on the
no-repeat trials (see Buttle et al., 2005).
There was a main effect of stimulus type, with participants correctly identifying
more word stimuli (M = 84.77%, SD = 16.89) than picture stimuli (M = 74.91%, SD = 15.20)
[F(1, 57) = 36.94, p < 0.0005, ηp2 = 0.38]. Participants correctly identified more stimuli in
the no-repeat (M = 86.04%, SD = 10.60) than repeat condition (M = 73.63%, SD = 22.20)
[F(1, 57) = 28.68, p < 0.0005, ηp2 = 0.34] and the interaction between condition and
stimulus type revealed that the RB effect was larger for words than pictures [F(1, 57) = 5.58,
p = 0.022, ηp2 = 0.089]. Refer to Table 4.
There was no main effect of group [F(1, 57) = 0.266, p = 0.608, ηp2 = 0.005], and
no interaction between group and repeat condition [F(1, 57) < .001, p = 0.968, ηp2 < .001],
or group by stimulus type interaction [F(1, 57) = .289, p = 0.593, ηp2 = 0.005], or group by
stimulus type by condition interaction [F(1, 57) = 0.036, p = 0.851, ηp2 = 0.001]. Descriptive
statistics for the non-significant three-way interaction are presented in Table 5.
Table 4
Video games and attention
Mean correct stimuli identification (%), and standard deviations (SD) for the repeat condition by
15
stimulus type interaction for the RB task.
Word Condition
Picture Condition
Condition
Mean
SD
Mean
No Repeat
92.68
9.44
79.94
Repeat
77.33
25.19
71.06
SD
20.43
Video games and attention 40
12.14
Table 5
Table 4.Mean
Mean
correctstimuli
stimuliidentification
identification (%),
and standard
standard deviations
correct
(%), and
deviations(SD)
(SD)for
forthe
therepeat
repeat condition by
condition by stimulus type interaction for the RB task.
group by stimulus type interaction for the RB task.
Word Condition
Group
Picture Condition
Repeat Condition
Mean
SD
Mean
SD
VGPs
No Repeat
93.33
8.94
81.18
13.60
n = 31
Repeat
77.63
26.40
72.47
19.89
NVGPs
No Repeat
92.02
9.91
78.69
10.16
n = 28
Repeat
77.02
23.76
69.64
20.90
Table 5. Mean correct stimuli identification (%), and standard deviations (SD) for the repeat
condition by group by stimulus type interaction for the RB task.
Discussion
In 2003, Green and Bavelier demonstrated that VGPs outperformed NVGPs on
measures of temporal attention (AB task), and the spatial distribution of attention (UFOV
task). This study aimed to replicate and extend these findings by examining VGP and NVGP
performance with regards to attentional capacity (IB task), and attentional processing ability
(RB task).
Attentional Blink Task
Both groups showed the standard AB effect where performance for T2 detection
is impaired when it follows T1 by 200 to 500 ms (Arnell & Jolicoeur, 1999; Chun & Potter,
1995; Martens et al., 2006; Olivers, 2004; Raymond et al., 1992; Shapiro et al., 1997).
There was also evidence of a Lag-1 sparing effect for both groups (Visser et al., 1999).
While the finding that VGPs outperformed NVGPs at the 100 ms SOA is consistent with
Green and Bavelier (2003) this difference was not evident at all SOAs as it was in their study.
Performance at the 100 ms SOA in this AB task is said to reflect task-switching ability and
an amodal bottleneck. Where as performance at the 200 ms SOA (i.e., the point at which
the AB is maximal) reflects the ability to process information over time and is recognised as
representing a visual bottleneck (Arnell & Jolicoeur, 1999; Chun & Potter, 1995; Green &
Bavelier, 2003). Thus in this study playing video games reduced the impact of the amodal
16
Journal of Articles in Support of the Null Hypothesis. JASNH, 2009, Vol. 6, No. 1
attentional bottleneck but not the visual attentional bottleneck. Further the finding of
superior task-switching ability in VGPs is consistent with Andrews and Murphy (2006) who
showed that VGPs outperformed NVGPs on an alternate runs task switching paradigm.
Given that the AB task used in this study was based on that reported by Green and
Bavelier (2003) and the sample size was much larger than their eight participants per group
it is unclear why the group differences were not evident at all SOAs. One possible reason
could lie in the comparability of abilities of the VGPs and NVGPs across the studies. When
comparing the scores on the AB task across studies it becomes apparent that whilst the
scores of the VGPs were at a similar level, performance of the NVGPs in this study was
particularly good in comparison to the same group in their study. This may suggest that the
NVGPs in Green and Bavelier’s (2003) study found the AB task particularly difficult.
Useful Field of View Task
The fewer errors made by the VGPs compared to the NVGPs overall in the UFOV
task, appeared to be the result of a speed-accuracy trade-off even though participants were
asked to respond as accurately as they could on each trial. Therefore, VGPs did not show
a better spatial distribution of attention than NVGPs. These results are inconsistent with
Green and Bavelier (2003, 2006a) and Feng et al. (2007), who found that VGPs detected
more targets than NVGPs at all eccentricities. Comparing the data across experiments did
not reveal sub-standard performance by the VGPs in this study relative to previous research
and a larger sample of participants completed this task compared to that used by Green and
Bavelier (2003). Moreover, the NVGPs in this study performed better on the UFOV task
than those in Green and Bavelier’s (2003) study, providing further evidence that the NVGPs
in their study found task performance difficult. Further, although Feng et al. (2007) reported
superior overall UFOV task performance for VGPs relative to NVGPs, it is possible that the
inclusion of male and female participants in their study and only male participants in the
current study may account for the different outcomes. In Feng et al.’s (2007) study female
NVGPs tended to perform more poorly on the UFOV task than male NVGPs potentially
magnifying the overall group difference in UFOV task performance. Hence the inclusion
of only male participants in the current study may have minimised the potential difference
between VGPs and NVGPs on the UFOV task.
Inattentional Blindness Task
Both the IB task load manipulation and the actual IB task itself replicated previous
findings in this area (Cartwright-Finch & Lavie, 2007; Lavie, Hirst, de Fockert, & Viding,
2004; Most et al., 2001). However there was no support for the assumption that VGPs
would detect more instances of the unexpected object in the critical and divided attention
trials of the IB task under high load conditions, due to their increased attentional capacity in
comparison to NVGPs. While this might mean VGPs do not possess enhanced attentional
capacity, given the results of the AB and UFOV tasks it is possible that the failure to find
a group difference on this task was due to the ‘differences’ in attentional capacity for the
NVGP in this study compared to those in Green and Bavelier’s study (2003).
Video games and attention
Repetition Blindness Task
Results for the RB task were consistent with previous research in that participants
correctly identified more word than picture stimuli (Buttle et al., 2005). There was also a
typical RB effect with participants correctly identifying more stimuli in the no-repeat than
repeat condition (Campbell et al., 2002; Coltheart et al., 2005; Morris & Harris, 2004).
The size of the RB effect was larger for words than for pictures, which is inconsistent
with previous findings (Buttle, et al. 2005) and requires further investigation. Contrary
to expectation there was no difference between the VGPs and NVGPs in this task. Thus
according to the Token-Individuation Hypothesis (Kanwisher, 1987), VGPs were not more
efficient at tokenizing second instances of repeated items (type codes), and thus reducing
the size of their RB effect. However, as mentioned previously this lack of group difference
might be attributed to the attentional capacity of the NVGP group in this study.
Further Considerations and Conclusion
The sample size used in this study was larger than that reported by Green and
Bavelier (2003) and across the two studies participants were comparable in age, gender and
mean hours of video game playing. Moreover, the AB and UFOV tasks were based on those
reported by Green and Bavelier (2003). Thus it is unlikely that sample or task differences
can account for the non-significant video-game player group differences in the current
study. One issue requiring consideration is that Green and Bavelier (2003) reported that
their participants only played action video games, whereas in the current study participants
either only played action video games or a combination of action and strategy video games.
It has been reported that different types of video games develop different attentional skills,
and even within the category of action video games specific games can affect these skills
differently (Greenfield, 1994). However, data from a number of our own studies have shown
that most gamers play a variety of game types making it very difficult to find VGPs who
only play action video games or a single action game for a specified time period.
Further, studies demonstrating better task performance for VGPs relative to
NVGPs on visual search and inhibition of return (Castel et al., 2005), and divided attention
conditions (Greenfield, DeWinstanley et al., 1994, Experiment 1) have tended to use RT
as the primary dependent variable. Hence there is evidence to suggest that VGPs show
superior attentional processing skills compared to NVGPs when the task assesses RT. As
all tasks within this study used accuracy as the primary dependent variable, except for the
UFOV task which had RT as a secondary measure, it is possible that group differences may
have emerged if the tasks used had allowed measurement of RT in addition to accuracy.
Thus, despite adequate sample size and the use of tasks closely matching that of
Green and Bavelier (2003), the current study was unable to replicate their findings making
it unlikely that group differences would be found on other visual attention tasks. While
this could be due to differences in performance levels for the NVGPs or differences in the
types of video games played by the VGP groups across the two studies, further research
examining these ideas is needed before we are able to fully understand the impact of video
game playing on visual attention.
17
Journal of Articles in Support of the Null Hypothesis. JASNH, 2009, Vol. 6, No. 1
18
References
Andrews, G. & Murphy, K. (2006). Does video-game playing improve executive function? In M. A. Vanchevsky
(Ed.) Frontiers in Cognitive Sciences (pp. 145-161). New York. Nova Science Publishers Inc.
Arnell, K. M. & Jolicoeur, P. (1999). The attentional blink across stimulus modalities: Evidence for central
processing limitations. Journal of Experimental Psychology: Human Perception and Performance, 25, 630-648.
Ball, K., Beard, B., Roenker, D., Miller, R. & Griggs, D. (1988). Age and visual search: Expanding the useful
field of view. Journal of the Optical Society of America, 5, 2210-2219.
Beilock, S. L., Wierenga, S. A. & Carr, T. H. (2002). Expertise, attention and memory in sensorimotor skill
execution: Impact of novel task constraints on dual-task performance and episodic memory. Quarterly
Journal of Experimental Psychology, 55A, 1211-1240.
Blumberg, F. C. (1998). Developmental differences at play: Children’s selective attention and performance in
video games. Journal of Applied Developmental Psychology, 19, 615-624.
Broadbent, D. E & Broadbent, M. H. P. (1987). From detection to identification: Response to multiple targets
in rapid serial visual presentation. Perception and Psychophysics, 42, 105-113.
Buttle, H., Ball, C. K., Zhang, J. & Raymond, J. E. (2005). Semantic association of brand images at the
implicit level: Evidence from repetition blindness. Applied Cognitive Psychology, 19, 1199-1210.
Campbell, J. I. D., Fugelsang, J. A. & Hernberg, V. D. (2002). Effects of lexicality and distinctiveness on
repetition blindness. Journal of Experimental Psychology: Human Perception and Performance, 28, 948-962.
Cartwright-Finch, U. & Lavie, N. (2007). The role of perceptual load in inattentional blindness. Cognition,
102, 321-340.
Castel, A. D., Pratt, J. & Drummond, E. (2005). The effects of action video game experience on the time
course of inhibition of return and the efficiency of visual search. Acta Psychologica, 119, 217-230.
Cheung, V., Chen, E. Y. H., Chen, R. Y. L., Woo, M. F. & Yee, B. K. (2002). A comparison between
schizophrenia patients and healthy controls on the expression of attentional blink in a rapid serial visual
presentation (RSVP) paradigm. Schizophrenia Bulletin, 28, 443-458.
Chun, M. M. & Potter, M. C. (1995). A two-stage model for multiple target detection in rapid serial visual
presentation. Journal of Experimental Psychology: Human Perception and Performance, 21, 109-127.
Coltheart, V., Mondy, S. & Coltheart, M. (2005). Repetition blindness for novel objects. Visual Cognition, 12,
519-540.
Dyckman, K. A. & McDowell, J. E. (2005). Behavioural plasticity of antisaccade performance following
daily practice. Experimental Brain Research, 162, 63-69.
Feng, J., Spence, I. & Pratt, J. (2007). Playing an action video game reduces gender differences in spatial
cognition. Psychological Science, 18, 850-855.
Forster, K. I. & Forster, J. C. (2003). DMDX: A windows display program with millisecond accuracy. Behavior
Research Methods, Instruments, and Computers, 35, 116-124.
Forster, S. & Lavie, N. (2007). High perceptual load makes everybody equal. Psychological Science, 18, 377381.
Green, C. S. & Bavelier, D. (2003). Action video game modifies visual selective attention. Nature, 423, 534537.
Green, C. S. & Bavelier, D. (2006a). Effect of action video games on the spatial distribution of visuospatial
attention. Journal of Experimental Psychology: Human Perception and Performance, 32, 1465-1478.
Green, C. S. & Bavelier, D. (2006b). Enumeration versus multiple object tracking: The case of action video
game players. Cognition, 101, 217-245.
Green, C. S. & Bavelier, D. (2007). Action-video-game experience alters the spatial resolution of vision.
Psychological Science, 18, 88-94.
Greenfield, P. M. (1994). Video games as cultural artifacts. Journal of Applied Developmental Psychology, 15,
3-12.
Greenfield, P. M., Brannon, C. & Lohr, D. (1994). Two-dimensional representation of movement through
three-dimensional space: The role of video game expertise. Journal of Applied Developmental Psychology, 15,
87-103.
Greenfield, P. M., DeWinstanley, P., Kilpatrick, H. & Kaye, D. (1994). Action video games and informal
education: Effects on strategies for dividing visual attention. Journal of Applied Developmental Psychology, 15,
105-123.
Kanwisher, N. G. (1987). Repetition blindness: Type recognition without token individuation. Cognition, 27,
117-143.
Video games and attention
Kanwisher, N., Driver, J. & Machado, L. (1995). Spatial repetition blindness is modulated by selective
attention to colour or shape. Cognitive Psychology, 29, 303-337.
Koivisto, M., Hyona, J. & Revonsuo, A. (2004). The effects of eye movements, spatial attention, and stimulus
features on inattentional blindness. Vision Research, 44, 3211-3221.
Lavie, N. (1995). Perceptual load as a necessary condition for selective attention. Journal of Experimental
Psychology: Human Perception and Performance, 21, 451-468.
Lavie, N., Hirst, A., de Fockert, J. W. & Viding, E. (2004). Load theory of selective attention and cognitive
control. Journal of Experimental Psychology: General, 113, 339-354.
Li, C. R., Lin, W., Chang, H. & Hung, Y. (2004). A psychophysical measure of attention deficit in children
with attention-deficit/hyperactivity disorder. Journal of Abnormal Psychology, 113, 228-236.
Maciokas, J. B. & Crognale, M. A. (2003). Cognitive and attentional changes with age: Evidence from
attentional blink deficits. Experimental Aging Research, 29, 137-153.
Mack, A. (2003). Inattentional blindness: Looking without seeing. Current Directions in Psychological Science, 12,
180-184.
Martens, S., Munneke, J., Smid, H. & Johnson, A. (2006). Quick minds don’t blink: Electrophysiological
correlates of individual differences in attentional selection. Journal of Cognitive Neuroscience, 18, 14231438.
Memmert, D. (2006). The effects of eye movements, age, and expertise on inattentional blindness. Consciousness
and Cognition, 15, 620-627.
Morris, A. L. & Harris, C. L. (2004). Repetition blindness: Out of sight or out of mind? Journal of Experimental
Psychology: Human Perception and Performance, 30, 913-922.
Most, S. B., Simons, D. J., Scholl, B. J., Jimenez, R., Clifford, E. & Chabris, C. F. (2001). How not to be seen:
The contribution of similarity and selective ignoring to sustained inattentional blindness. Psychological
Science, 12, 9-17.
Myers, R. S., Ball, K. K., Kalina, T. D., Roth, D. L. & Goode, K. T. (2000). Relation of useful field of view
and other screening tests to on-road driving performance. Perceptual and Motor Skills, 91, 279-290.
Okagaki, L. & Frensch, P. A. (1994). Effects of video game playing on measures of spatial performance:
Gender effects in late adolescence. Journal of Applied Developmental Psychology, 15, 33-58.
Olivers, C. N. L. (2004). Blink and shrink: The effect of the attentional blink on spatial processing. Journal of
Experimental Psychology: Human Perception and Performance, 30, 613-631.
Park, J. & Kanwisher, N. (1994). Determinants of repetition blindness. Journal of Experimental Psychology:
Human Perception and Performance, 20, 500-519.
Raymond, J. E., Shapiro, K. L. & Arnell, K. M. (1992). Temporary suppression of visual processing in an
RSVP task: An attentional blink? Journal of Experimental Psychology: Human Perception and Performance, 18,
849-860.
Shapiro, K. L., Arnell, K. M. & Raymond, J. E. (1997). The attentional blink. Trends in Cognitive Sciences, 1,
291-296.
Simons, D.J. & Chabris, C.F. (1999). Gorillas in our midst: Sustained inattentional blindness for dynamic
events. Perception, 28, 1059-1074.
Subrahmanyam, K. & Greenfield, P. M. (1994). Effect of video game practice on spatial skills in girls and
boys. Journal of Applied Developmental Psychology, 15, 13-32.
Szekely, A., Jacobsen, T., D’ Amico, S., Devescovi, A., Andonova, E., Herron, D., et al. (2004). The international
picture-naming project. Retrieved 3rd July, 2006, from http://crl.ucsd.edu/~aszekely/ipnp
Terlecki, M. S. & Newcombe, N. S. (2005). How important is the digital divide? The relation of computer
and videogame usage to gender differences in mental rotation ability. Sex Roles, 53, 433-441.
Turatto, M., Benso, F., & Umiltà, C. (1999). Focusing of attention in professional women skiers. International
Journal of Sport Psychology, 30, 339-349.
Visser, T. A. W., Zuvic, S. M., Bischof, W. F. & Di Lollo, V. (1999). The attentional blink with targets in
different spatial locations. Psychonomic Bulletin and Review, 6, 432-436.
Voyer, D., Voyer, S. & Bryden, M. P. (1995). Magnitude of sex differences in spatial abilities: A meta-analysis
and consideration of critical variables. Psychological Bulletin, 117, 250-270.
19
20
Journal of Articles in Support of the Null Hypothesis. JASNH, 2009, Vol. 6, No. 1
Author Notes
We thank Xuesong Lee for programming the Inattentional Blindness task.
We thank the two anonymous reviewers for their useful feedback on an earlier draft of this
manuscript.
Address correspondence to:
Karen Murphy
School of Psychology
Griffith University, Gold Coast campus,
Queensland 4222 Australia
+617-5552 8952
[email protected]
2/11/2008 Received
12/21/2008 Revised
1/2/2009 Accepted


© Copyright 2026