
Document 167330
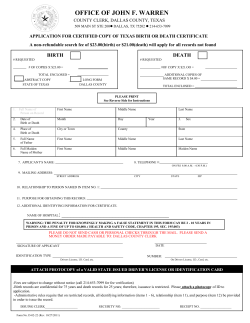
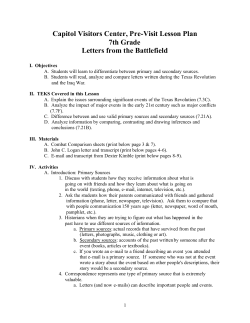
Wilson Bull.,
95(l),
1983, pp. 97-105
GROWTH, DEVELOPMENT,
AND FOOD HABITS
NESTLING MIMIDS IN SOUTH TEXAS
DAVID
H.
OF
FISCHER
The growth rates of nestling passerines recently
have received
consid-
erable study (Ricklefs 1968, 1979; Best 1977; Woolfenden 1978); however,
few studies have examined mimids (Mimidae) (but see Rand 1941; Killpack
1970; Ricklefs
1965, 1966). Food habits of nestling mimids are also poorly
known (see Bent 1948). In this paper I report on growth, development,
and food habits of nestling Curve-billed Thrashers (Toxostoma curuirostre),
Long-billed Thrashers (T. Zongirostre), and Northern Mockingbirds
(Mimus polyglottos) in south Texas. Each of these mimids is an abundant
resident of the brushlands
typical of this region.
METHODS
I studied the breeding
during the summers
ecology of Curve-billed
and Long-billed
of 1977 and 1978 near Dinero,
thrashers
and mockingbirds
Live Oak Co., Texas.
Two rectangular
study areas were selected and the vegetation
of each sampled with 25 randomly
transects
nomenclature
(30.5 m) (Canfield
1941). Botanical
Plot A (30.3 ha) supported
ping vegetative
guru),
layers)
blackbrush
hooker&
granjeno (C&is
pallida),
chaparral,
chaparral
mostly of the following
(Acacia rigidula),
acacia
was formed by trees (19.6%),
additional
a dense, often impenetrable
comprised
and mesquite
forbs (25.3%),
(Pros&s
glandolosa).
and grasses (16.%).
and two sides bordered
(185.5%
a cleared
cover, overlap-
shrubs: colima (Zanthoz&m
(Berberis trifoliata),
agarito
located line-
follows Jones (1975).
brasil
The remaining
pasture.
snakeweed
73.6%
of the vegetative
the Long-billed
mockingbird
Thrasher
cover. Forbs,
especially
cover. The remaining
nests were
located
21.3%
in plot A.
Nests were visited
between
The stage of feather
Curve-billed
and mockingbirds
Thrashers
development
on day 13, Long-billed
and prematurely
Thrashers
(1967) presented
lowing his procedures,
was formed
Curve-billed
method
Thrasher
of plot A (Fischer
and
1980).
On each visit I recorded
and bill lengths
(culmen-nostril)
the day
Thrashers
beyond these ages would not remain
Curve-billed
on day 12, and mockingbirds
a graphical
by grass. All of
through day 9, and Long-billed
disturbed
fledged.
(Gerardia
was also noted. Day 0 designates
were measured
through day 8. Young
the nest when replaced,
Ricklefs
Most
12:00 and 16:00 at 2-day intervals.
the weight and wing chord as well as the tarsometatarsus
of hatching.
gerardia
nests were found in plot B or along the periphery
of each nestling.
only 7.6%
heterophyla),
(Xanthocephalum sarothrae), and golden aster (Heterotheca latifolia),
and trees 2.4% of the total 104.9%
privided
cover
Two sides of plot A bounded
Plot B (69.0 ha) was cleared several years prior to my study. Shrubs contributed
broom
fu-
(Condalia
Thrashers
normally
on day 10 (Fischer
of fitting equations
I found that the growth of the three mimids
to growth
in
fledged
1980).
curves.
was best expressed
Folby
the logistic equation:
W,,, = A/(1
where W,,, is the weight at age
is the age at the inflection
t,
+ e -KU - t,,)
A is the asymptote,
K is the growth rate constant,
and toI
point (A/2) of the growth curve. The slopes of the growth curves
97
98
THE WILSON
BULLETIN
* Vol. 95, No. 1, March 1983
of the wing (carpometacarpus to wing tip), hill, tarsometatarsus, and weight of each species
were compared for significant differences using analysis of covariance (Snedcor and Cochran
1976). Growth rate data from 1977 and 1978 were tested, found not to differ significantly,
and combined in the following discussion. The level of significance accepted in this study
was P < 0.05.
Food samples were collected from nestlings between days 3 and 8 or 9 in 1978 using pipecleaner ligatures (Orians 1966). Samples were collected throughout the day and stored in
75% isopropyl alcohol. Later, these were identified to family, and measured volumetrically
in a ~-CC calibrated test-tube. The diets of the mimids were compared using Schoener’s
(1968) index of overlap: D = 1 - ‘/z .Z I (x,,i - yi,,)! where xi,t and yi,, are the frequencies of
the it category for species X and Y.
Food availability was assessed by collecting 50 samples monthly in 1978. Each sample
consisted of sweeping 1 m2 of herbaceous growth 25 times with a net, and collecting all
potential prey from 1 m* of ground surface; items were stored and analyzed as described
above for nestling diets. Chi-square analysis (Snedecor and Cochran 1976) was used to compare nestling Curve-billed Thrasher diets with food availability to determine dietary preferences, and to compare the proportions of the major taxa for monthly differences.
RESULTS
General
At hatching,
AND DISCUSSION
Development
each of the mimids
was typically
covered with grayish-black down (Curve-billed
or a lighter, smokey-gray down (mockingbird).
clearly visible through the translucent
species of thrashers was pinkish-red
altricial
and sparsely
and Long-billed thrashers)
The internal organs were
skin. The skin pigmentation of both
dorsally and whitish-red ventrally,
whereas the skin pigmentation of nestling mockingbirds was orange with
no tongue spotting, and the tomia and ricti were yellow.
As nestlings aged, dorsal skin pigmentation
on the thrashers,
darkened
and to a deep orangish-brown
to reddish-brown
on mockingbirds.
Nest-
lings’ eyes began to open on day 3 (mockingbird) or day 4 (thrashers) and
were fully open 1 day later. By day 2, papillae had emerged from all
pterylae on each species, and between days 3 and 4, sheaths began to
emerge from these. The first sheaths erupted on day 5 (mockingbirds) or
day 6 (thrashers)
on the lower spinal and ventral
sheaths on all tracts except the capital
virtually all sheaths had erupted.
tracts.
had shattered,
By day 8, most
and at fledging,
Growth
Wing chord.-The
longest primary included in wing chord measurements (primary 7) erupted from the sheath on day 7 for mockingbirds or
--t
FIG. 1. Growth parameters of nestling (A) Curve-billed Thrasher, (B) Long-billed Thrasher, and (C) Northern Mockingbird.
Fischer * NESTLING
loo?
go-
:
ao-
!?
5
70 -
2
60-
Q
b
50 -
I-
40-
E
:
30 -
g
20-
q
A
TARSOMETATARSVS
0
WING
0
WEIGHT
BILL
FROM
MIMIDS
A
NARES
CHORD
lo-
100
z
-
go-
0
z
80-
1
5
70-
2
60-
Q
6
50 -
!T
40 -
ti
30-
z
zolo-
100
-
:
90 -
a
c
80-
1
3
70-
2
60-
Q
b
50-
5
40-
8
30-
i
2010 -
I
0
1
99
IN TEXAS
2345678
AGE(DAYS)
I
!
I
I
100
THE WILSON
BULLETIN
* Vol. 95, No. 1, March 1983
day 8 for thrashers. Adult mockingbirds
chords than either of the two thrashers;
nestling
had considerably longer wing
however, the growth rates of
wing chords of each species were similar
significantly
different.
(Fig.
la-c),
By day 8, the wing chord had attained
36.7 ? 4.5 SE mm,
N = 22), 41.4%
@ = 39.8 + 3.9 mm,
and not
36.0%
@ =
N = 3), and
34.7% @ = 38.8 * 3.5 mm, N = 10) of adult wing lengths of Curve-billed
Thrashers (2 = 102.1 t 4.1 mm, N = 31), Long-billed
Thrashers (X =
96.1 + 2.9 mm,
N = 95), and mockingbirds
(2 = 111.5 ? 6.8 mm,
N =
15), respectively. None of the young could fly when they left the nest.
Bill and tarsometatarsus.-By
day 8 the bill length of nestling mockingbirds had grown to 59.6% @ = 6.5 * 0.3 mm, N = 10) of adult length
(j = 10.9 t 1.3 mm, N = 15), compared to 30.0% (2 = 8.2 t 0.8 mm,
N = 22) for nestling
N = 31) and 38.2%
Thrashers
Curve-billed
Thrashers (adult f = 27.3 * 1.1 mm,
(X = 8.3 ? 0.4 mm, N = 3) for nestling Long-billed
(adult f = 21.7 t
0.9 mm, N = 95). This difference
utable to the much longer bill lengths of adult thrashers
with adult
mockingbirds,
and to a significantly
(F = 27.2;
P < 0.01) greater growth rate of the bill of nestling
compared with the thrashers.
The tarsometatarsus
of each mimid
developed
was attrib-
when compared
df = 2, 688;
mockingbirds
more rapidly
when
than any
other appendage measured (Fig. la-c). By day 8, they had attained 80.8%
(i! = 27.8 + 2.6 mm, N = 22), 82.4% @ = 29.4 2 4.4 mm, N = 3), and
89.3% @ = 29.9 + 1.3 mm, N = 10) of adult lengths of Curve-billed
Thrashers
(2 = 34.4 *
1.1
mm,
N = 31),
35.7 ? 1.2 mm, N = 95), and mockingbirds
Long-billed
Thrashers
(2 =
(X = 33.5 + 1.3 mm, N = 15),
respectively. The growth rates of the tarsometatarsus of the two thrashers
did not differ significantly, but both developed slower (F = 64.9; df = 2,
688; P < 0.01) than the tarsometatarsus of mockingbirds.
Weight.-At
hatching, while still wet, Curve-billed Thrashers weighed
5.8% 6 = 4.9 ? 0.4 g, N = 24) of adult weights (Table l), Long-billed
Thrashers 6.2% (Z = 4.2 g, N = 2), and mockingbirds 7.5% @ = 3.6 2
0.3, N = 17). Weight gain in all three species was rapid and by day 8, the
young weighed 49.1%,
55.2%,
and 73.0%
of adult Curve-billed
Thrasher,
Long-billed Thrasher, and mockingbird weights, respectively (Fig. la-c,
Table 1). The growth rate of the thrashers did not differ significantly;
however,
mockingbirds
increased
in weight at a greater rate (F = 91.3;
df = 2, 688; P < 0.01) than either thrasher.
Using Ricklefs’ (1967) procedures, I calculated the following values for
the growth rate equation of each species: A = 55.6 g, t(i) = 5.9 days, and
K = 0.444 for the Curve-billed
K = 0.443 for the Long-billed
Thrasher,
Thrasher,
and K = 0.452 for the mockingbird.
A = 49.9 g, t(i) = 5.9 days, and
and A = 39.1 g, t(i) = 4.8 days,
The predicted asymptotes (A) of Curve-
Fischer. NESTLING
MIMIDS
TABLE
AVERAGE WEIGHTS
(G) OF NESTLING
THRASHERS (LBT),
N
1
CURVE-BILLED
AND NORTHERN
CBT
Age
(d-4
101
IN TEXAS
THRASHERS (CBT),
MOCKINGBIRDS
LBT
N
i&SD
LONGBILLED
(MOCK)
MOCK
i +SD
1
2
3
4
5
6
7
8
9
43
33
44
38
40
35
22
23
22
13
5.59 k 0.69
7.96 2 1.06
11.70 2 1.71
16.92 k 3.42
21.81-c 3.82
27.99 -‘ 5.15
32.05 k 5.45
38.93 k 3.36
41.84 t 6.38
47.6225.12
5
5
10
8
2
3
3
5
3
-
5.60
7.68
10.72
15.42
20.90
28.16
32.53
35.44
37.33
-
1.53
1.34
2.01
2.11
1.27
5.84
1.46
2.37
1.20
-
54
52
45
64
40
49
46
12
10
-
4.59
7.21
11.00
15.53
20.57
24.74
29.47
33.23
34.99
-
Adult
31
85.23 k 6.07
95
67.65 k 5.46
15
47.81 ? 3.83
0
billed Thrashers
and mockingbirds
+
k
k
k
”
+
k
”
c
i + SD
N
agree closely with the limited
+ 0.79
zi 0.96
+ 1.77
-r- 2.66
+- 2.91
2 2.75
2 3.04
k 3.37
% 4.04
-
number
of nestling weights that I have from the final day prior to fledging: Curvebilled Thrasher, .E = 53.4 + 2.6 g, N = 6; mockingbird, P = 40.4 + 2.7
g, N = 3). I have no measurements of Long-billed Thrashers from days
11 or 12. Growth constants for the Curve-billed Thrasher in Arizona were:
A = 55.0 g, t(i) = 6.3 days,
and K = 0.384
(Ricklefs
1968). I analyzed
Killpack’s
(1970) weight gain data of the Sage Thrasher (Oreoscoptes montanus) and again found the logistic equation best described the pattern of
growth, with constants of A = 34.1 g, t(i) = 4.3 days, and K = 0.543.
The time required to grow from 10% to 90% (t,,,,)
of the asymptote
(Ricklefs 1967) of the Curve-billed
Thrasher was 9.88 days, that of the
Long-billed Thrasher, 9.90 days, that of the mockingbird, 9.70 days, and
that of the Sage Thrasher (using Killpack’s
1970 data), 8.05 days. In Arizona, Ricklefs
(1968) reported
a greater
tlg9,, value,
11.5 days, for the
Curve-billed Thrasher, apparently indicating a longer developmental period. Ricklefs (1965) reported starvation within broods in Arizona, indicating perhaps
a scarcity
of food during the breeding
season. Although
brood sizes averaged larger in Texas than in Arizona (3.8 vs 3.0), none of
the nestlings died from starvation during this study (Fischer 1980).
The ratio (R) of the asymptote to adult weight describes the nestling
development at the time of fledging (Ricklefs 1967) and is correlated with
the feeding tactics of the adults: species foraging terrestrially have R values less than 0.9 (Ricklefs 1968). I determined R values of 0.65 for Curvebilled Thrashers,
0.73 for Long-billed
Thrashers,
0.82 for mockingbirds,
102
THE WILSON
BULLETIN
- Vol. 95, No. 1, March
TABLE
DIETS OF NESTLING CURVE-BILLED
1983
2
THRASHERS (CBT),
LONG-BILLED THRASHERS (LBT),
AND NORTHERN MOCKINGBIRDS (MOCK)
CBT
LBT
MOCK
T2.XlXl
% N”
% Vb
W N
% v
WN
% v
Orthoptera
60.4
34.9
25.5
61.0
36.6
24.4
50.8
44.8
7.1
72.8
60.4
12.4
64.3
25.6
38.7
67.4
13.9
53.5
Coleoptera
16.4
15.5
4.4
3.7
0.0
0.0
Lepidoptera
12.4
6.4
0.2
5.5
12.4
6.6
0.2
5.6
12.8
10.3
2.5
0.0
8.8
5.9
2.9
0.0
11.5
9.3
0.0
2.2
14.7
10.8
0.0
3.9
Other Insecta
0.0
0.0
10.0
4.2
13.2
9.8
Arachnida
7.0
7.3
8.8
5.7
9.8
7.9
Gastropoda
0.9
1.0
8.8
2.4
1.2
0.2
Berries
2.9
2.8
4.4
2.4
0.0
0.0
Nymph
Adult
Larvae
Pupae
Adult
’ Percent of the total items contributed by the respective taxa.
b Percentof the total volume contributed by the respective taxa.
and 0.90 for Sage Thrashers
(using Killpack’s
ported a similar
R value,
0.69,
Thus, curve-bills
weights.
in both Texas and Arizona
Nestling
Composition
and overlap.-1
apparently
(1968) rein Arizona.
fledge at similar
collected 433 items (N = 90 nestlings,
of food items
32
45 items (N = 9 nestlings, 3
and 85 items (N = 56 nestEach of the mimids fed their
(for a complete
almost all of which were terrestrial
especially
metrically
Ricklefs
Thrashers
Food Habits
nests) from nestling Curve-billed Thrashers,
nests) from nestling Long-billed Thrashers,
lings, 24 nests) from nestling mockingbirds.
young a diversity
data).
for Curve-billed
arthropods.
list see Fischer
Of these,
1979),
orthopterans,
acridids, were the most prevalent items numerically and volu(Table 2). Lepidopteran larvae and Arachnida were important
components of the diets of each species, and Coleoptera
formed a consid-
erable percentage of nestling Curve-billed Thrasher diet. Berries of agarito
and granjeno were fed to young of both thrashers but only after day 7.
The nestling diets of each species overlapped
broadly with index values
of 0.62 for Curve-billed-Long-billed
thrashers,
0.72 for Long-billed
Thrasher-mockingbird,
and 0.63 for Curve-billed Thrasher-mockingbird.
Although
the overlap
values
were considerable,
it seems unlikely
that
Fischer
CBT NESTLING
FIG. 2.
ability.
- NESTLING
DIET
MIMIDS
0
Other
0
Gastropoda
103
IN TEXAS
FOOD
a
Lepidoptera
m
Arachnida
m
Coleoptera
m
Orthoptera
AVAILABILITY
Variation by month of (A) Curve-billed Thrasher nestling diet and (B) food avail-
competition
for food would occur during
the summer
months
since ar-
thropods and gastropods were abundant. In addition, the foraging sites
and tactics of the adults differed considerably (Bent 1948, Fischer 1980).
Prior to feeding their young, adults of each species usually removed the
heavily chitonized
portions of the larger prey. These included
the legs of
arachnids, and legs, head, and wings of orthopterans and coleopterans.
Some very large long-horned grasshoppers (Tettigoniidae) were fragmented and fed to two or more young of a brood. Small prey and all lepidopterans were fed to the young without any apparent processing.
Seasonal distribution of nestling foods.-1
compared
the monthly diets
of nestling Curve-billed Thrashers only, since the sample sizes were small
for the other two mimids. The relative importance (proportion) of the major
nestling foods changed slightly between
terans significantly
May and July (Fig. 2a). Orthop-
(x2 = 12.6, df = 2, P < 0.01) increased
in proportion
between May and July (Fig. Ba), and predominated
during each month.
The proportion of coleopterans significantly (x” = 8.9, df = 2, P < 0.01)
declined between May and June. None of the other changes in taxa among
months was significantly different.
When the diet of nestling
Curve-billed
Thrashers
was compared
with
104
THE
food availability
WILSON
- Vol. 9.5, No. 1, March 1983
BULLETIN
(Fig. 2b), several trends were evident.
fed in about the same proportion
as their availability
Orthopterans
were
except in July when
they were fed in greater amounts (x” = 11.7, df = 1, P < 0.01) than expected. Gastropods, although second only to orthopterans in total availability, were avoided and their contribution to diet was minimal. Lepidopterans and arachnids apparently were taken in about the same quantities
as their respective availabilities each month.
CONCLUSIONS
The growth and developmental characteristics of each mimid examined
in this and other studies were similar, although there was a trend for the
smaller species to develop more rapidly.
thrashers
of the genus Toxostoma,
Mimids
as a group, and especially
appear to fledge at lower young/adult
weights than most other passerines studied so far (Ricklefs
56 passerine
species examined
by Ricklefs,
1968). Of the
only the Horned
Lark
mophila alpestris) fledged at a lower R value than the Curve-billed
(Ere-
Thrash-
er. Predation pressures were great during both years of this study (Fischer
1980), perhaps favoring a short nestling period with much additional growth
delayed until after fledging.
SUMMARY
The growth, development,
c~rvirostre),
Long-billed
lyglottos)were
smaller
were similar
mockingbird
Nestling
Curve-billed
(7’. longirostre), and Northern
studied during the summers
each species were typically
thrashers
and food habits of nestling
Thrashers
altricial.
of 1977 and 1978 in south Texas.
The overall growth rates of Curve-billed
(K = 0.444
(K = 0.452)
Thrashers
Mockingbirds
and 0.443,
respectively)
or Sage Thrasher
(K = 0.543,
(Mimus poThe young of
and Long-billed
and somewhat
slower than the
using Killpack’s
mimids fledged at weights lower than those of adults. At fledging,
(Toxostoma
1970 data).
none of the young
mimids could fly and the wing chords were much shorter than those of the adults. Bill lengths
of each species were also less than adult measurements.
species grew rapidly
The nestling
diets of each species overlapped
and volumetrically
arachnids.
and by day 8, it had attained
by orthopterans.
The tarsometatarsus
broadly
and were dominated
Other major prey were coleopterans,
The diet of nestling Curve-billed
of each mimid
at least 8O?k of the adult length.
Thrashers
changed relatively
numerically
lepidopterans,
and
little between
May
and July.
ACKNOWLEDGMENTS
I am grateful to Eric G. Bolen and Keith A. Arnold for providing
during the course of this study. This paper is a portion
degree from Texas A&M
and Bessie Welder
University.
Wildlife
The study was supported
Foundation,
Sinton,
Texas.
comments
and suggestions
of a thesis submitted
by a fellowship
This is Welder
for the M.S.
from the Rob
contribution
number
272.
LITERATURE
BENT, A. C.
1948.
their allies. U.S.
Life
Natl.
histories
of North
Mus. Bull.
CITED
American
195:351402.
nuthatches,
wrens,
thrashers,
and
Fischer
- NESTLING
MIMIDS
105
IN TEXAS
BEST, L. B. 1977. Nesting biology of the Field Sparrow. Auk 94:308-319.
CANFIELD, R. H. 1941. Application of the line intercept method in sampling range vegetation. J. Forest. 39:388-394.
FISCHER, D. H. 1979. Comparative ecology of the thrashers, Z’oxostoma, of south Texas.
M.S. thesis, Texas A&M Univ., College Station, Texas.
-.
1980. Breeding biology of Curve-billed Thrashers and Long-billed Thrashers in
southern Texas. Condor 82:392-397.
JONES, F. B. 1975. Flora of the Texas Coastal Bend. Rob and Bessie Welder Wildlife
Foundation, Sinton, Texas. Contrib. 6, Ser. B.
KILLPACK, M. L. 1970. Notes on Sage Thrasher nestlings in Colorado. Condor 72:48&488.
ORIANS, G. H. 1966. Food of nestling Yellow-headed Blackbirds, Cariboo Parklands, British Columbia. Condor 68:321-337.
RAND, A. L. 1941. Growth and development of Curve-billed Thrashers. Bull. Am. Mus.
Nat. Hist. 78:213-242.
RICKLEFS, R. E. 1965. Brood reduction in the Curve-billed Thrasher. Condor 67:505-510.
-.
1966. The behavior of young Cactus Wrens and Curve-billed Thrashers. Wilson
Bull. 78:47-56.
-.
1967. A graphical method of fitting equations to growth curves. Ecology 48:978983.
-.
1968. Patterns of growth in birds. Ibis 110:419451.
-.
1979. Patterns of growth in birds. V. A comparative study of development in the
Starling, Common Tern, and Japanese Quail. Auk 96:10-30.
SCHOENER, T. W. 1968. The An&s lizards of Bimini: resource partitioning in a complex
fauna. Ecology 49:704-726.
SNEDECOR, G. W. AND W. G. COCHRAN. 1976. Statistical methods. Iowa State Univ. Press,
Ames, Iowa.
WOOLFENDEN, G. E. 1978. Growth and survival of young Florida Scrub Jays. Wilson Bull.
90: 1-18.
TEXAS
A&M
UNIVERSITY,
DRESS: DEPT.
LUBBOCK,
COLLEGE
STATION,
RANGE AND WILDLIFE
TEXAS
79409.) ACCEPTED
TEXAS
MANAGEMENT,
1 MAY
1981.
77840. (PRESENT
TEXAS TECH
AD-
UNIV.,


© Copyright 2026