
2 3 4
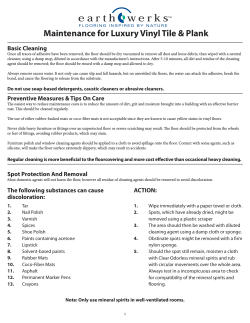
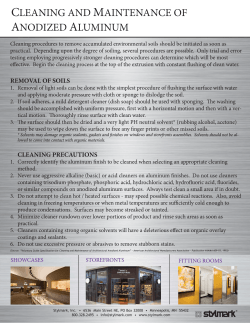
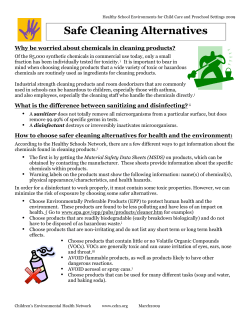
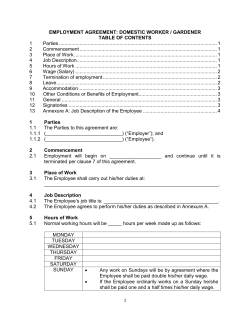
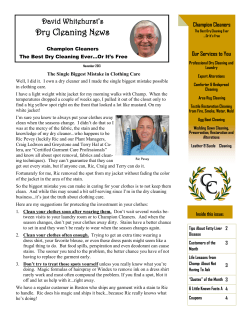
CLICK TO VIEW
INDUSTRY MARKET RESEARCH FOR BUSINESS LEADERS, STRATEGISTS, DECISION MAKERS
Table of Contents 2
List of Tables & Charts 3
Study Overview 4
Sample Text, Table
& Chart 5
Sample Profile, Table &
Forecast 6
Order Form 7
About Freedonia, Custom
Research, Related Studies,
Corporate Use License 8
Commercial & Residential
Cleaning Services
US Industry Study with Forecasts for 2013 & 2018
Study #2581 | January 2010 | $4700 | 268 pages
The Freedonia Group
767 Beta Drive
www.freedoniagroup.com
Cleveland, OH • 44143-2326 • USA
Toll Free US Tel: 800.927.5900 or +1 440.684.9600
Fax: +1 440.646.0484
E-mail: [email protected]
Study #2581
January 2010
$4700
268 Pages
Commercial & Residential
Cleaning Services
US Industry Study with Forecasts for 2013 & 2018
Table of Contents
Executive Summary
Market EnvironmenT
General....................................................... 4
Macroeconomic Environment........................... 4
Demographic Trends...................................... 9
Employment Outlook....................................12
Consumer Spending Trends............................14
Building Construction Trends.........................16
Residential..............................................19
Housing Trends........................................21
Nonresidential..........................................25
Construction Stock....................................28
Office & Commercial Building Vacancy Rates.....31
Business Formation Trends.............................32
Business Establishment Trends.......................34
Nonresidential Floor Space Trends...................36
Service Sector Trends....................................38
Regulatory Trends & Issues............................41
Privacy Laws............................................41
Indoor Air Quality.....................................42
Chemical Regulations................................44
Ergonomic Safety Regulations.....................46
Training & Licensing Regulations................47
FTC Franchise Rule....................................47
Other Regulatory Issues.............................48
International Environment.............................49
SERVICES
General......................................................52
Revenues by Service & Market.....................53
Establishment & Employment Trends............56
Interior Building Cleaning Services.................58
Industry Characteristics.............................61
Nonresidential Interior Building
Cleaning Services....................................63
Business Type.......................................64
Building Type.......................................65
Residential Interior Cleaning Services..........67
Business Type..........................................70
Franchises & Corporations.......................71
Individual Proprietorships.......................73
Establishment & Employment Trends............75
Market Share............................................78
Floor, Fabric & Surface Cleaning.....................79
Carpet & Upholstery Cleaning.....................82
Industry Characteristics..........................85
Revenues by Type..................................86
Revenues by Market...............................87
Establishment & Employment Trends........89
Other Floor, Fabric & Surface Cleaning..........91
Industry Characteristics..........................93
Establishment & Employment Trends........94
Market Share............................................96
Exterior Building Cleaning & Maintenance........99
Street & Parking Lot Cleaning
& Maintenance..................................... 101
Window Cleaning.................................... 102
All Other Exterior Building Services........... 103
Establishment & Employment Trends.......... 105
Swimming Pool Cleaning & Maintenance........ 106
Industry Characteristics........................... 107
Establishment & Employment Trends.......... 108
Restoration & Remediation Services.............. 109
Industry Characteristics........................... 111
Establishment & Employment Trends.......... 113
Other Commercial & Residential
Cleaning Services..................................... 115
Commercial Vehicle Cleaning.................... 117
Pet Waste Removal.................................. 118
All Other Cleaning Services....................... 118
Establishment & Employment Trends.......... 119
MARKETS
General.................................................... 121
Institutional............................................. 124
Office....................................................... 127
Commercial............................................... 130
Industrial................................................. 132
Residential................................................ 135
Interior Building Cleaning........................ 137
Floors, Fabrics & Services......................... 137
Exterior Buildings................................... 138
Swimming Pools..................................... 138
Restoration & Remediation....................... 139
Other Cleaning Services........................... 140
Other Markets............................................ 140
REGIONS
General.................................................... 144
Regional Demographic & Economic Trends...... 144
Population Patterns................................ 145
Economic Outlook................................... 147
Nonresidential Floor Space....................... 148
Housing Outlook..................................... 150
Regional Cleaning Services Revenues............. 153
Regional Market Profile............................... 154
Northeast................................................. 156
Revenues by Type................................... 158
Revenues by Subregion & Market............... 160
New England...................................... 162
Middle Atlantic................................... 163
Markets............................................. 164
Midwest.................................................... 164
Revenues by Type................................... 166
Revenues by Subregion & Market............... 168
East North Central............................... 169
West North Central.............................. 170
Markets............................................. 171
Click here to purchase online
Page South....................................................... 172
Revenues by Type................................... 174
Revenues by Subregion & Market............... 175
South Atlantic.................................... 177
East South Central............................... 178
West South Central.............................. 179
Markets............................................. 180
West........................................................ 180
Revenues by Type................................... 182
Revenues by Subregion & Market............... 184
Mountain........................................... 185
Pacific............................................... 186
Markets............................................. 187
INDUSTRY STRUCTURE
General.................................................... 189
Industry Composition................................. 190
Market Share............................................. 194
Franchising............................................... 200
Competitive Strategies................................ 204
Outsourcing.............................................. 208
Marketing................................................. 209
Mergers & Acquisitions................................ 211
Cooperative Agreements.............................. 214
Company Profiles
ABM Industries.......................................... 215
Anago Franchising...................................... 217
ARAMARK Corporation................................. 218
Bonus of America....................................... 220
Clean First Time......................................... 221
CleanNet USA............................................ 222
Compass Group.......................................... 224
Coverall Health-based Cleaning System.......... 225
Davis (Paul) Restoration.............................. 227
Diversco Holdings...................................... 228
Duraclean International.............................. 229
Dwyer Group............................................. 231
EMS Group................................................ 232
Fish Window Cleaning................................. 233
Grout Doctor Global Franchise...................... 234
Harvard Maintenance.................................. 235
Healthcare Services Group........................... 236
Heaven’s Best Carpet Cleaning..................... 237
Home Depot.............................................. 239
ISS Holding............................................... 241
JAN-PRO Franchising International............... 243
Jani-King International............................... 244
Maid to Perfection Global............................ 245
Maids International.................................... 247
Milliken & Company.................................... 249
Molly Maid................................................ 250
MPW Industrial Services.............................. 251
Pet Butler Franchise Services....................... 252
(continued on following page)
Order now, click here!
Study #2581
January 2010
$4700
268 Pages
Commercial & Residential
Cleaning Services
US Industry Study with Forecasts for 2013 & 2018
Table of Contents
Company Profiles
(continued from previous page)
Pride Industries......................................... 253
ServiceMaster Company............................... 254
Servpro Industries...................................... 256
Sodexo..................................................... 257
Stanley Steemer International...................... 258
Steamatic Incorporated............................... 259
Temco Service Industries............................. 261
Transfield Services...................................... 262
Triangle Services........................................ 263
United Group............................................. 265
Additional Companies
Mentioned in the Study............................. 267
List of Tables/Charts
Executive Summary
1 Summary Table....................................... 3
Market EnvironmenT
1 Macroeconomic Indicators....................... 9
2 Population & Households........................12
3 Civilian Labor Force &
Unemployment Rate...........................14
4 Personal Consumption Expenditures.........16
5 Building Construction Expenditures..........19
6 Residential Building Construction
Expenditures.....................................21
7 Housing Stock by Type...........................24
Cht Year of Construction of
Housing Stock, 2008..........................25
8 Nonresidential Building Construction
Expenditures.....................................27
9 Building Stock......................................30
Cht Office & Commercial Building
Vacancy Rates, 1998-2008...................32
Cht US Business Formations &
Dissolutions, 1989-2007.....................34
10 Business Establishments.........................36
11 Nonresidential Floor Space......................38
12 Services Income....................................41
SERVICES
1 Commercial & Residential Cleaning Services
Revenues by Type & Market.................55
Cht Commercial & Residential Cleaning
Services Revenues by Type, 2008..........56
2 Commercial & Residential Cleaning Services
Establishments & Employment.............58
3 Interior Building Cleaning Services
Revenues by Business Type & Market.....61
4 Nonresidential Building Interior
Cleaning Services Revenues
by Business & Building Type................64
5 Residential Interior Building Cleaning
Services Revenues by Business Type......70
6 Revenues for Interior Building Cleaning
Services Franchises & Corporations.......73
7 Revenues for Interior Building Cleaning
Services Individual Proprietorships.......75
8 Interior Building Cleaning Services
Establishments & Employment.............77
Cht Interior Building Cleaning Services
Market Share, 2008............................79
9 Floor, Fabric & Surface Cleaning Services
Revenues by Type & Market.................82
10 Carpet & Upholstery Cleaning Services
Revenues by Type & Market.................85
11 Carpet & Upholstery Cleaning Services
Establishments & Employment.............91
12 Other Floor, Fabric & Surface Cleaning
Services Revenues by Market................93
13 Other Floor, Fabric & Surface Cleaning
Services Establishments & Employment96
Cht Floor, Fabric & Surface Cleaning
Market Share, 2008............................97
14 Exterior Building Cleaning Services
Revenues by Type & Market............... 101
15 Exterior Building Cleaning Services
Establishments & Employment........... 105
16 Swimming Pool Cleaning & Maintenance ..... Services Revenues by Market.............. 107
17 Swimming Pool Cleaning &
Maintenance Services
Establishments & Employment........... 109
18 Restoration & Remediation Services
Revenues by Market.......................... 111
19 Restoration & Remediation Services
Establishments & Employment........... 115
20 Other Commercial & Residential Cleaning
Services Revenues by Type & Market... 116
21 Other Commercial & Residential
Cleaning Services Establishments
& Employment................................. 120
MARKETS
1 Commercial & Residential Cleaning
Services Revenues by Market.............. 123
Cht Commercial & Residential Cleaning
Services Revenues by Market, 2008..... 124
Click here to purchase online
Page 2 Institutional Building Cleaning
Services Revenues by Type................. 127
3 Office Building Cleaning Services
Revenues by Type............................ 129
4 Commercial Building Cleaning Services
Revenues by Type............................ 132
5 Industrial Building Cleaning Services
Revenues by Type............................ 134
6 Residential Cleaning Services
Revenues by Type............................ 136
7 Other Markets Cleaning Services
Revenues by Type & Market............... 143
REGIONS
1 Resident Population by Region.............. 146
2 Gross Domestic Product by Region......... 148
3 Nonresidential Floor Space by Region..... 150
4 Existing Home Sales &
Housing Stock by Region.................. 152
5 Commercial & Residential Cleaning
Services Revenues by Region............. 153
Cht Commercial & Residential Cleaning
Services Revenues by Region, 2008..... 154
6 Regional Commercial & Residential
Cleaning Services Market Profile, 2008156
7 Northeast Cleaning Services Revenues.... 158
8 Northeast Cleaning Services
Revenues by Type............................ 160
9 Northeast Cleaning Services Revenues
by Subregion & Market...................... 162
10 Midwest Cleaning Services Revenues....... 166
11 Midwest Cleaning Services
Revenues by Type............................ 168
12 Midwest Cleaning Services Revenues
by Subregion & Market...................... 169
13 South Cleaning Services Revenues.......... 173
14 South Cleaning Services
Revenues by Type............................ 175
15 South Cleaning Services Revenues
by Subregion & Market...................... 176
16 West Cleaning Services Revenues........... 182
17 West Cleaning Services
Revenues by Type............................ 184
18 West Cleaning Services Revenues
by Subregion & Market...................... 185
INDUSTRY STRUCTURE
1 Cleaning Services Revenues
by Company, 2008............................ 192
Cht Commercial & Residential Cleaning
Services Market Share, 2008.............. 195
2 Selected Cleaning Services Franchises..... 122
3 Selected Acquisitions & Divestitures....... 213
Order now, click here!
Study #2581
January 2010
$4700
268 Pages
Commercial & Residential
Cleaning Services
US Industry Study with Forecasts for 2013 & 2018
Gains will be driven by ongoing increases in both the number of households and the number of
business establishments, coupled with growing availability and affordability of cleaning services.
US demand to advance
4.5% yearly through 2013
Revenues for contract commercial and
residential cleaning services are forecast
to advance 4.5 percent annually to $66.8
billion in 2013. Gains will be driven by
ongoing increases in both the number of
households and the number of business
establishments, coupled with growing
availability and affordability of cleaning
services. The recession that began in
late 2007 and persisted through 2008
had no discernable short-term effect on
cleaning services revenues; in fact,
many companies reduced operating
expenses by outsourcing cleaning
services as the economy worsened.
Longer-term growth in cleaning services
revenues, however, will require economic recovery to expand the potential pool
of customers.
Interior building cleaning
to remain top service type
Interior building cleaning services are the
largest contributor to cleaning services
revenues, accounting for 74 percent of
the total in 2008. Growth in revenues will
derive from expansions in the number of
business establishments and the total
inventory of the US housing stock, both
of which will create more potential
customers for cleaning service providers.
Also, specialized services such as
special event clean-up and seasonal
cleaning will continue to offer niche
opportunities to cleaning companies.
Institutional
Buildings
26%
($66.8 billion)
Residential
24%
Office Buildings
23%
Commercial
Buildings 11%
All Other
16%
Demographic trends to
benefit residential market
increase 5.2 percent annually to $15.8
billion in 2013.
In the residential market, demographic
trends such as the large numbers of
dual-income households and the aging
of the “baby boomer” generation will
create opportunities for cleaning services. Such families often do not have
the time or the inclination to perform
cleaning tasks, while older citizens
sometimes lack the physical ability to do
many cleaning tasks but have the
financial resources to hire professionals.
These trends will benefit interior cleaning
services (maid services), swimming pool
cleaning and maintenance services, and
pet care services. Residential cleaning
services revenues are projected to
Nonresidential markets are the main
consumers of cleaning services, accounting for more than three-quarters of
the total in 2008. Revenues will benefit
from the trend of outsourcing cleaning
functions to cut costs. While some
nonresidential markets have already
seen much of this outsourcing take
place, there remain opportunities for
growth. Through 2013, growth in cleaning services revenues in nonresidential
markets will range from 3.7 percent
annually in the relatively mature office
market to 4.7 percent per year in the
institutional market.
Click here to purchase online
Page US Commercial & Residential
Cleaning Service Demand, 2013
Copyright 2010 The Freedonia Group, Inc.
Order now, click here!
Study #2581
January 2010
$4700
268 Pages
Commercial & Residential
Cleaning Services
US Industry Study with Forecasts for 2013 & 2018
Sample Text,
Table & Chart
TABLE IV-3
OFFICE BUILDING CLEANING SERVICES REVENUES BY TYPE
(million dollars)
Item
1998 2003 2008 2013 2018
Office Building Space (bil sq ft) 11.7 12.2 12.6 12.6 12.9
$ services/000 sq ft 612 836 1024 1230 1502
services
Office Building Cleaning Services 715510200129001550019400
Interior Building Cleaning 6150 8780110501320016450
Commercial Vehicle Cleaning
Floors, Fabrics & Surfaces 455 640 830 1035 1310
Commercial vehicle cleaning encompasses the interior cleaning
of Building Cleaning 295 420 555 685 865
Exterior
aircraft, boats and trains that carry passengers. Historically, cleaning
Swimming Pools 35
40
50
60
70
for these modes of transport has been taken care of by in-house staff.
Restoration & Remediation
50
65
80
95 115
Although the basic tools and equipment are similar to interior building
Other Cleaning Services 170 255 335 425 590
cleaning, transportation equipment cleaning firms are considered
to be
specialized. Revenues for transportation equipment cleaning were
%$400
office buildings 24.7 25.1 24.1 23.2 22.8
million in 2008 and the segment is anticipated to see advances below
Cleaning Services Revenues2900040700536006675085200
the cleaning services average through 2013. The segment is projected
to post growth of 4.6 percent per annum through 2013 to $500 million.
Growth will be bolstered by continued outsourcing of cleaning functions
as a cost-saving measure.
sample
table
sample
Aircraft cleaning accounts for the vast majority of interior transtext
portation cleaning revenues. In recent years, airlines have been under
intense pressure to cut costs to keep airfares down. As part of their strategy, many firms have started outsourcing cleaning services. Revenues for
aircraft cleaning are anticipated to rise through 2013, as major airlines,
as well as small and mid-sized airlines, continue to turn to contract
cleaning. A variety of firms offer aircraft cabin cleaning services, ranging from small individual proprietorships to large, diversified service
corporations. The firms that participate in the airline segment also offer
many other airline-related services that are not covered here, including baggage handling, catering, passenger services and cargo handling
services. Contract cleaning crews are housed directly at the terminal (like
in-house staff would be), ready to clean aircraft cabins between flights.
CHART VI-1
Among the key aircraft cleaning services firms are Air Serv, Airport Terminal Services, American Sales & Management, ARAMARK, Integrated
Airline Services Alliance, Swissport and Worldwide Flight Services. COMMERCIAL & RESIDENTIAL CLEANING SERVICES
MARKET SHARE, 2008
($53.6 billion)
A limited number of contract cleaning firms are dedicated to the
cleaning of boats and trains. Special cleaning of such transportation
117
Copyright 2009 The Freedonia Group, Inc.
O t h e rs
60.3%
Click here to purchase online
Page sample
chart
M a rk e t
L e a d e rs
39.7%
8.8%
J ani- K ing
6.9%
C O V E R A LL
5.2%
JAN -PR O
4.4%
C leanN et
3.6%
S er vic eM as ter
3.2%
2.3%
1.9%
1.9%
1.5%
A B M Inds
C hem - D r y
AR AM AR K
B onus
S odexo
Order now, click here!
Study #2581
January 2010
$4700
268 Pages
Commercial & Residential
Cleaning Services
US Industry Study with Forecasts for 2013 & 2018
Sample Profile,
Table & Forecast
TABLE V-9
NORTHEAST CLEANING SERVICES REVENUES
BY SUBREGION & MARKET
(million dollars)
Item
1998 2003 2008 2013 2018
Northeast Cleaning Services Revenues7120
By Subregion:
New England 1629
Middle Atlantic 5491
By Market:
Office Buildings 1756
Institutional Buildings 1803
Commercial Buildings 811
Industrial Buildings 391
Residential 1557
Other Markets 802
COMPANY PROFILES
9220112001340016400
2409 3430 4090 4980
6811 7770 931011420
sample
2700 3120 3730
2855 3450 4320
table
1220 1450 1730
2310
2355
1017
482
2015
1041
575 680 820
2565 3170 4000
1285 1530 1800
Maids International Incorporated
4820 Dodge Street
Omaha, NE 68132
402-558-5555
http://www.maids.com
Annual Sales: $110 million (verified by company, 11/09)
Employment: 200 (estimated)
sample
Key Services: general interior
cleaning and other standard residential
profile
cleaning; and carpet cleaning, exterior window cleaning and hard surface floor cleaning services
Maids International, which does business as The Maids Home
Services, is a provider of residential cleaning services. The privately
held company operates throughout the US and Canada.
The Company is involved in the US cleaning service industry via
the provision of standard and specialized residential cleaning services.
Standard residential cleaning services include general cleaning of
bathroom and kitchen sinks, cleaning of kitchen surfaces, cleaning and
disinfecting of toilets and other bathroom fixtures, vacuuming of carpets and upholstery, trash removal, dusting, and changing bed linens.
Among The Maids Home Services’ specialized cleaning services are
carpet cleaning; exterior window cleaning; and tile, wood and concrete
floor cleaning.
The Maids Home Services employs the 22-Step HEALTHY
TOUCH system, which comprises a 22-step detailed cleaning program
carried out by a four-person team. Each team member is screened
prior to employment, bonded and licensed, and trained in the use of the
Company’s environmentally friendly. products and equipment. For
247
Copyright 2009 The Freedonia Group, Inc.
Click here to purchase online
Page “Revenues for commercial and residential
cleaning services in the New England
subregion are anticipated to increase 3.6
percent per year to $4.1 billion in 2013.
New England’s per capita spending on
cleaning services is the highest in the
US, indicating a mature and saturated
market. In addition, the New England
subregion will see revenue growth limited by some of the slowest economic
and population growth in the US through
2013. However, ...”
--Section V, pg. 163
Order now, click here!
Order Information
INDUSTRY MARKET RESEARCH FOR BUSINESS
LEADERS, STRATEGISTS, DECISION MAKERS
Five Convenient Ways to Order
ONLINE: www.freedoniagroup.com
MAIL: Print out and complete the order
form and send to The Freedonia Group
(see address at the bottom of this form)
PHONE: Call toll free, 800.927.5900
(US) or +1 440.684.9600
FAX: +1 440.646.0484 (US)
EMAIL: [email protected]
Free Handling & Shipping
Credit Card Orders
Orders Outside of the US
Save 15%
There is NO charge for handling or UPS shipping
in the US. Expect delivery in 3 to 5 business days.
Outside the US, Freedonia provides free airmail
service. Express delivery is available at cost.
Checks must be made payable in US funds,
drawn against a US bank and mailed directly to
The Freedonia Group. For wire transfers please
contact our customer service department at info@
freedoniagroup.com. Credit cards accepted.
For convenience, Freedonia accepts American Express, MasterCard or Visa. Credit card purchases
must include account number, expiration date and
authorized signature.
If you order three (3) different titles at the same
time, you can receive a 15% discount. If your
order is accompanied by a check or wire transfer,
you may take a 5% cash discount (discounts do
not apply to Corporate Use Licenses).
Corporate Use License
Now every decision maker in your organization can act on the key intelligence found in all
Freedonia studies. For an additional $2600, companies receive unlimited use of an electronic
version (PDF) of the study. Place it on your intranet, e-mail it to coworkers around the world,
or print it as many times as you like,
Order Form
F-WEB.2581
Commercial & Residential Cleaning Services........ $4700
Corporate Use License (add to study price) * +$2600
Additional Print Copies @ $600 each *
Name
Title
Company
Division
Total (including selected option) $
Enclosed is my check (5% discount) drawn on a US bank and payable to
The Freedonia Group, Inc., in US funds (Ohio residents add 7.75% sales tax)
Street
Bill my company
City/State/Zip
American Express
MasterCard
Click here to learn more about
the Corporate Use License
Visa
MM
(No PO Box please)
YY
Country
Credit Card #
Expiration
Phone
Fax
Email
Signature
* Please check appropriate option and sign below to order an electronic
version of the study.
Individual Use License Agreement
The above captioned study may be stored on the company’s intranet or
shared directory, available to company employees. Copies of the study may
be made, but the undersigned represents that distribution of the study will
be limited to employees of the company.
The undersigned hereby represents that the above captioned study will be
used by only ___ individual(s) who are employees of the company and that
the study will not be loaded on a network for multiple users. In the event
that usage of the study changes, the Company will promptly notify Freedonia of such change and will pay to Freedonia the appropriate fee based on
Freedonia’s standard fee schedule then in effect. Note: Entire company corporate use license, add $2600; one additional user, add $600; two additional
users, add $1200; three additional users, add $1800.
Signature
Signature
Corporate Use License Agreement
The Freedonia Group, Inc. 767 Beta Drive • Cleveland, OH • 44143-2326 • USA • Web site: www.freedoniagroup.com
Tel US: 800.927.5900 or +1 440.684.9600 • Fax: +1 440.646.0484 • e-mail: [email protected]
Page 7
INDUSTRY MARKET RESEARCH FOR BUSINESS LEADERS, STRATEGISTS, DECISION MAKERS
Other Studies
Consumer Water Purification
& Air Cleaning Systems
This study analyzes the US consumer water purification and air cleaning system industry. It presents historical demand data (1999, 2004, 2009) and forecasts
for 2014 and 2019 by technology (e.g., conventional
filtration, reverse osmosis, distillation, ultraviolet,
ozone, electrostatic, ionization), water purifier type
(point-of-entry, point-of-use), air cleaner type (wholehouse, portable) and US region. The study also
considers market environment factors, evaluates
company market share and profiles industry players.
#2701................ February 2011.................. $5100
World I & I Cleaning Chemicals
Global demand for industrial and institutional (I&I)
cleaning chemicals will rise 4.4% yearly through
2013. Gains will be fastest in developing countries. The shift toward higher-end formulations with
reduced environmental impact will continue, although
commodity cleaners will retain their presence. This
study analyzes the $30 billion world I&I cleaning
chemical industry, with forecasts for 2013 and 2018
by product, market, world region and for 18 countries.
It also evaluates company market share and profiles
industry participants.
#2608...................April 2010.................... $5800
World Major Household Appliances
Global major appliance demand will rise 2.8% yearly
through 2013, driven primarily by market penetration
in developing countries. In developed regions, appliance sales will depend mainly on steady replacement
demand, new home building and the development
of new features that prompt upgrading. This study
analyzes the 434 million unit world major appliance
industry, with forecasts for 2013 and 2018 by product,
world region and for 25 countries. It also evaluates
company market share and profiles industry players.
#2588................December 2009................. $6100
Home Organization Products
US demand for home organization products will rise
4.3% annually through 2013. Bins, baskets and totes
will remain the largest group while modular units grow
the fastest. Garage units will overtake family room
products as the second largest segment, with closet
organizers also doing well. This study analyzes the
$7.2 billion US home organization product industry, with forecasts for 2013 and 2018 by material,
product, room and market. It also evaluates company
market share and profiles industry players.
About The Freedonia Group
The Freedonia Group, Inc., is a leading international industry market research company that provides its clients with information and analysis needed to make informed
strategic decisions for their businesses. Studies help clients identify business opportunities, develop strategies, make investment decisions and evaluate opportunities
and threats. Freedonia research is designed to deliver unibiased views and reliable
outlooks to assist clients in making the right decisions. Freedonia capitalizes on
the resources of its proprietary in-house research team of experienced economists,
professional analysts, industry researchers and editorial groups. Freedonia covers a
diverse group of industries throughout the United States, the emerging China market, and other world markets. Industries analyzed by Freedonia include:
• Chemicals • Plastics • Life Sciences • Packaging • Building Materials • Security
& Electronics • Industrial Components & Equipment • Automotive & Transportation
Equipment • Household Goods • Energy/Power Equipment
Click here to learn more about Freedonia
Freedonia Custom Research
Freedonia Custom Research delivers the same high quality, thorough and unbiased
assessment of an industry or market as an industry study. Since the research initiative is based upon a company’s specific needs, companies harness Freedonia’s
research capabilities and resources to answer unique questions. When you leverage
the results of a Freedonia Custom Research engagement, you are able to obtain
important answers to specific questions and issues associated with: mergers and
acquisitions, new product launches/development, geographic expansion, entry into
new markets, strategic business planning, and investment and funding decisions.
Freedonia Custom Research is ideal for companies seeking to make a strategic difference in the status quo and focus on future business growth. Working side by side
with clients, Freedonia’s team is able to define a research project that is custom-tailored to answer specific questions and provide the basis from which a company can
make informed business decisions.
Click here to learn more about Custom Research
#2527................... July 2009..................... $4600
Disinfectant &
Antimicrobial Chemicals
US demand for disinfectant and antimicrobial chemicals is projected to grow 3.6% annually through 2013.
The consumer market will grow the fastest, driven by
fears of foodborne and other pathogens, while paint
and coatings remains the largest market. Organosulfurs will be the fastest-growing product category.
This study analyzes the $1 billion US disinfectant
and antimicrobial chemical industry, with forecasts
for 2013 and 2018 by market, function and product.
It also evaluates market share and profiles industry
players.
#2474.................. March 2009.................... $4600
Page 8
Click here for complete title list
Click here to visit freedoniagroup.com
The Freedonia Group, Inc. 767 Beta Drive • Cleveland, OH • 44143-2326 • USA • Web site: www.freedoniagroup.com
Tel US: 800.927.5900 or +1 440.684.9600 • Fax: +1 440.646.0484 • e-mail: [email protected]

© Copyright 2026