
Amtrak FY2014 Budget & Business Plan
The National Railroad Passenger Corporation FY2014 Budget and Business Plan ◊ FY2015 Budget Request Justification ◊ FY2014 – 2018 Five Year Financial Plan April 2014 Table of Contents Section 1: Strategic Overview ........................................................................................................... 5 Background ..................................................................................................................................... 5 PRIIA Sections 209 and 212 .......................................................................................................... 6 Amtrak’s Strategic Plan .................................................................................................................. 7 Human Capital Strategy ............................................................................................................... 12 The Gateway Program ................................................................................................................. 18 Fleet Strategy ................................................................................................................................ 20 Strategic Vision for High-Speed Rail ........................................................................................... 28 Section 2: Economic Impact of Amtrak Activities ...................................................................................... 31 Findings .............................................................................................................................................................. 31 Part 1: Spending by Amtrak Passengers............................................................................................... 32 Part 2: Amtrak Employment ..................................................................................................................... 34 Part 3: Amtrak Goods and Services Purchased .................................................................................. 35 Section 3: Five Year Financial Summary ....................................................................................... 37 Change in Methodology ............................................................................................................... 37 Amtrak Financial Stability ........................................................................................................... 41 Methods of Estimation and Significant Assumptions ................................................................ 42 Debt and Principal and Interest Payments Five Year Plan ....................................................... 46 Cash Flow Five Year Plan ............................................................................................................. 47 Section 4: Northeast Corridor ........................................................................................................ 48 Overview ....................................................................................................................................... 48 Business Plan Discussion – Northeast Corridor ........................................................................ 50 NEC Five Year Financial Summary .............................................................................................. 53 Measuring the Success of the NEC Investment .......................................................................... 56 Section 5: State Supported Corridors Business Line .................................................................... 57 Overview ....................................................................................................................................... 57 1 Business Plan Discussion – State Supported Corridors ............................................................ 57 State Supported Corridors Five Year Financial Summary ........................................................ 60 Measuring the Success of the State Supported Corridors Investment .................................... 63 Section 6: Long-Distance Services Business Line ......................................................................... 64 Overview of Long-Distance Services .......................................................................................... 64 Business Plan Discussion – Long-Distance ................................................................................ 65 Long-Distance Five Year Financial Summary ............................................................................ 68 Food and Beverage Improvement............................................................................................... 71 Measuring the Success of the Long-Distance Investment ......................................................... 73 Section 7: Corporate Development Business Line ........................................................................ 74 Overview of Corporate Development Business Line ................................................................. 74 Corporate Development Five Year Financial Summary ............................................................ 74 Business Plan Discussion - Corporate Development ................................................................. 76 Appendices........................................................................................................................................ 77 Appendix I: Performance Measure Definitions ......................................................................... 77 Appendix II: FY2014 – FY2018 Summary Metrics .................................................................... 78 Appendix III: Compliance with PRIIA 204 ................................................................................. 86 Appendix IV: Operating Expenses by Account and Department ............................................. 90 Appendix V: FY2014 Capital Project List ................................................................................. 110 Appendix VI: FY2015 Capital Project List ............................................................................... 122 Appendix VII: Capital Program Descriptions .......................................................................... 135 2 Exhibits Exhibit 1-1– Corporate Themes and Goals ....................................................................................... 8 Exhibit 1-2– Strategic Change Agenda.............................................................................................. 9 Exhibit 1-3– Corporate Strategy Map ............................................................................................. 10 Exhibit 1-4– Route Map of Train Services by Business Line......................................................... 12 Exhibit 1-5– Amtrak Human Capital Blue Print ............................................................................. 13 Exhibit 1-6– Amtrak Human Capital Strategy Map ....................................................................... 14 Exhibit 1-7– Gateway Program Map ............................................................................................... 19 Exhibit 1-8– Average Age and Mileage of Rolling Stock ................................................................ 21 Exhibit 1-9– Expected Fleet Availability ........................................................................................ 23 Exhibit 1-10 – Rolling Stock Unit Acquisition Plan ....................................................................... 26 Exhibit 1-11 – Five Year Capital Expenditure and Debt Service Plan for Rolling Stock ............. 28 Exhibit 2-1 – Summary of Amtrak Economic Benefit, Jobs Supported, & Tax Revenue Created ............................................................................................................................................................ 32 Exhibit 2-2 – U.S. Travel Spending Key Metrics - 2012 ................................................................. 33 Exhibit 2-3 – Taxes Generated by U.S. Travel Spending – 2012 ................................................... 33 Exhibit 2-4 – Average U.S. Travel Spending per Person-Trip – 2012 .......................................... 33 Exhibit 2-5 – Amtrak Passenger Spending, Jobs Supported, and Tax Revenue Generated - 2012 ............................................................................................................................................................ 34 Exhibit 2-6 – Amtrak Employment and Tax Revenue Generated - 2012..................................... 35 Exhibit 2-7 – Amtrak Purchases, Jobs Supported and Tax Revenue Generated - 2012 ............. 36 Exhibit 3-1 – Net Operating Loss History and FY2014 - FY2018 Projections............................. 38 Exhibit 3-2 – Five Year Operating Losses ....................................................................................... 39 Exhibit 3-3 – Five Year Total Capital Plan by Funding Source ..................................................... 40 Exhibit 3-4 – Five Year Total Capital Plan by Business Line......................................................... 40 Exhibit 3-5 – Five Year Federal Appropriations General Capital Plan by Business Line ........... 40 Exhibit 3-6 – Amtrak Five Year Funding Summary ....................................................................... 41 Exhibit 3-7 – Debt and Debt Service ............................................................................................... 46 Exhibit 3-8 – Cash Flow ................................................................................................................... 47 Exhibit 4-1 – NEC Business Line Strategy Map .............................................................................. 51 Exhibit 4-2 – Five Year Projected Operating Results, NEC ........................................................... 54 3 Exhibit 4-3 – Five Year Projected Capital Investment by Program, NEC ..................................... 55 Exhibit 4-4 – Statistics and Key Performance Indicators – Northeast Corridor ......................... 56 Exhibit 5-1 –State Supported Corridors Strategy Map.................................................................. 58 Exhibit 5-2 – Five Year Projected Operating Results, State Supported Corridors ...................... 61 Exhibit 5-3 – Five Year Projected Capital Investment by Program, State Supported Corridors 62 Exhibit 5-4 – Statistics and Key Performance Indicators – State Supported Services ............... 63 Exhibit 6-1 – Long-Distance Strategy Map ..................................................................................... 65 Exhibit 6-2 – Five Year Projected Operating Results, Long-Distance .......................................... 69 Exhibit 6-3 – Five Year Projected Capital Investment by Program, Long-Distance ................... 70 Exhibit 6-4 – Food and Beverage Initiatives .................................................................................. 70 Exhibit 6-5 – Statistics and Key Performance Indicators – Long-Distance Services .................. 73 Exhibit 7-1 – Five Year Projected Operating Results, Corporate Development .......................... 75 Exhibit 7-2 – Five Year Projected Capital Investment by Program, Corporate Development ... 76 4 Section 1: Strategic Overview Background The National Railroad Passenger Corporation – Amtrak – is incorporated under the District of Columbia Business Corporation Act (D.C. Code section 29-301 et seq.) in accordance with the provisions of the Rail Passenger Service Act of 1970 (P.L. 91-518). Under the provisions of the Passenger Rail Investment and Improvement Act of 2008 (P.L. 110-432; 49 U.S.C. Section 24301), Amtrak’s Board of Directors was reorganized and expanded to nine members. The company is operated and managed as a for-profit corporation providing intercity rail passenger transportation as its principal business. Congress created Amtrak in 1970 to take over, and independently operate, the nation’s intercity rail passenger services. Prior to this, America’s private railroad companies ran passenger rail as required by federal law. Those companies reported that they had operated their passenger rail services without profit for a decade or more. With this in mind, when Amtrak began service on May 1, 1971, more than half of the rail passenger routes then operated by private railroad companies were eliminated. After divesting of passenger rail services, these private railroads became freight-only railroads, establishing Amtrak as the sole national provider of passenger rail service. These were decidedly unfavorable circumstances – not just for Amtrak, but for the larger rail industry. Amtrak was not expected to survive, and many policymakers openly questioned the viability of the national rail system. Forty years later, however, the situation is dramatically different. Today, the Class I freight railroads are profitable entities, which play a tremendous role in the national economy. Amtrak’s creation was the first in a long series of Federal decisions that were needed to sustain the national rail network. Many doubted Amtrak’s ability to survive, but the company has managed to both survive and grow in a manner that has exceeded every expectation - with the bare minimum of capital investment and operating support. The past decade has been a tremendous one for Amtrak. From the brink of bankruptcy in 2002, the company has transformed itself. Debt, which had ballooned to nearly $4 billion, has now been cut to less than half of that level. Key metrics for operating efficiency have improved tremendously; in real terms, Amtrak cut its Federal operating support need in half between 2004 and 2014, and cost recovery has now risen to 89%. Innovative new technologies such as eTicketing and Wi-Fi have been introduced, and new equipment is starting to arrive. The public response to Amtrak’s improvements has been simply tremendous. Ridership has been rising across the system for more than a decade, and the company set annual ridership records in ten of the last eleven years. Last year short distance trains set an annual ridership record, and longdistance trains had their best year in twenty years. Amtrak now carries more people between Boston and New York than all of the airlines put together – and more than three times as many people between New York and Washington. FY2013 is only the latest of several record years, with Amtrak carrying a record 31.6 million riders nationwide. While these records highlight the strength of the demand for Amtrak services, the FY2013 outcome could easily have been very different – the fleet is aging and hard-run, while the condition of the Northeast Corridor continues to deteriorate as investment lags. Amtrak was able to maintain its aging rail system in 2013 and to sustain and even improve service in the face of unprecedented natural disasters and a challenging environment, but the losses we incurred highlight the increasing fragility of this effort. Service disruptions caused by weather and other issues cost the company more than 440,000 riders, and $42 million in ticket revenue. In spite of that, Amtrak set an annual ridership record of 31.2 million passengers operating as many as 307 daily intercity trains and approximately 21,000 route miles serving 513 communities in 46 states, the District of Columbia and 3 Canadian 5 provinces. Approximately 810,000 people also commuted every weekday on Amtrak infrastructure or on Amtrak-operated commuter trains around the country under contracts with 19 state partnerships and 5 regional commuter authorities. FY2013 produced another record with $2.1 billion of ticket revenue. In spite of these successes, the likelihood of major infrastructure failure has grown, a risk that was confirmed in a study by the independent Northeast Corridor Infrastructure Advisory Commission. Capital support levels have fallen and current investment levels leave Amtrak vulnerable to a larger, costlier, and far more damaging failure than anything yet experienced. The nation cannot afford to let a railroad infrastructure that hosts half of Amtrak’s trains and 80% of the nation’s rail commuters fall apart; the economic consequences would be devastating. These trends must be reversed to ensure passenger rail can continue to contribute to our national economy. While the Northeast Corridor (NEC) once required a Federal operating grant, improved customer service, marketing and sales have generated greater revenue, higher ticket sales and better return on those sales. Revenues now exceed operating costs by approximately $300 million, and cost controls have been improved by implementing the strategic vision for a private sector model. The time has come to begin renewing the NEC by investing the NEC’s profits into its infrastructure and equipment. Amtrak’s state-supported and long-distance trains play critical roles in connecting America’s small cities and rural towns, providing economic development opportunities, and carrying interstate trade and commerce. Amtrak’s national system supplies effective and efficient connections for people and businesses in these communities, enabling them to use the national transportation infrastructure of airports, highways and the buses that they pay for and use. Amtrak has successfully sustained these services for four decades, thanks to growing ticket revenue, strong freight railroad support, and the Federal grants designed to ensure national connectivity throughout the United States. Congress stated in Section 228 of the Passenger Rail Investment and Improvement Act of 2008 (PRIIA) that the operation of a national system was “a vital and necessary part of our national transportation system and economy,” and that is a sentiment with which Amtrak strongly agrees. To ensure that these vitally important services continue, Amtrak intends to request Federal operating support financing at a higher operating level than in previous years. This will help maintain these services, and will also enable continued support of capital investment designed to sustain them, through investment in stations and the replacement of the aging rolling stock. Reserving the NEC operational surplus for NEC investment is not a complete solution, but the funds could immediately permit Amtrak to increase essential State of Good Repair work, pursue funding partnerships and pay for debt service on loans, which would help address some of Amtrak’s larger capital challenges. With these proceeds the company can pursue a broader array of funding options including debt, matched grants of assistance, public-private partnerships, and State/Commuter Rail partnerships. All of these options will help, but to avoid continued decapitalization of the Northeast Corridor, Amtrak will also need a significant and reliable multi-year capital commitment from the Federal government. Only this type of commitment will permit planning and undertaking of major multi-year projects such as bridge and tunnel replacements. PRIIA Sections 209 and 212 Section 209 of PRIIA called on Amtrak to work in collaboration with its State partners to develop and implement a uniform cost-sharing formula for routes of less than 750 miles outside the BostonWashington, DC Northeast Corridor (NEC). Amtrak and the affected States formed a State Working 6 Group (SWG) consisting of five States and agencies which developed the common methodology that was approved by the Surface Transportation Board (STB), adopted by all States, and implemented in October 2013. Section 212 of PRIIA included language that required the establishment of a Northeast Corridor Infrastructure and Operations Advisory Commission (the Commission) which, among other things, was charged with developing a standardized formula for determining and allocating costs between intercity and commuter use of shared NEC infrastructure. Section 212 requires that the Commission’s formula ensure that there is no cross subsidization of commuter, intercity or freight rail transportation and that each service is assigned the costs incurred only for the benefit of that service and a proportionate share, based upon factors that reasonable reflect relative use, of cost incurred for the common benefit of more than one service. The US DOT, Amtrak, Northeastern states and commuter agencies are currently working through the Commission to develop a cost-sharing formula extending to both operating and capital costs incurred in the NEC. The implementation of this new allocation method should result in additional commuter investments in Amtrak’s NEC infrastructure that will supplement Amtrak’s own capital funding and usher in a new cooperative planning and coordination regime across the full NEC network. Amtrak’s Strategic Plan Since the publication of the original plan in 2011, much has happened. Ridership and revenue have continued to grow, debt and operating support needs have been reduced, and Amtrak has carried out a reorganization designed to increase the focus of the company on customers and support core financial and operational goals. While this plan provided Amtrak with a useful set of goals and guidelines, it was always meant to be a living document. Recognizing that strategic plans need to be reviewed and refreshed on a regular basis, throughout 2013 Amtrak devoted time and effort to reviewing the plan, studying the lessons learned in implementing it, and revising the document to take those lessons into account. The result was a revised version, issued in December, 2013, that is designed to guide the company through 2018. A simpler and more focused mission and vision statement highlight Amtrak’s basic purpose – “Delivering intercity transportation with superior safety, customer service and financial excellence.” To accomplish this mission, Amtrak has identified three overarching strategic themes, each of which is measured through two to four performance metrics: 1. Safety and Security: set the industry standard for safety to ensure that every customer and employee goes home injury-free every day. Improvement in the Safety and Security theme will be measured by the Peer-to-Peer Observation Rate and injuries per hundred million passenger miles. A passenger mile is defined as the movement of one passenger for a distance of one mile. 2. Customer Focus: to acquire and retain the most satisfied customers of any travel company in the world. Improvement in the Customer Focus theme will be measured through Ridership and other customer satisfaction measurement methods. 3. Financial Excellence: to be profitable on an operating basis (as defined by our operating ratio) and be good stewards of capital in order to secure our long-term viability as a company. Improvement in the Financial Excellence theme will be measured by Operating Ratio and Adjusted Net Income/ (Loss). 7 Exhibit 1-1– Corporate Themes and Goals While the strategy provides Amtrak with a set of goals that are measureable, attainable, and relevant, the best strategy is only as good as its execution – and experience has shown that it is in execution, rather than vision, that corporate strategies are typically deficient. To avoid this problem, Amtrak devoted considerable time and effort to creating three tools that will be used to manage and guide strategy implementation – the Change Agenda, the Business Line Portfolio, and the Corporate Strategy Map. The Change Agenda outlines what kind of a company we believe Amtrak has traditionally been, and describes the company we wish it to become. It identifies key traits, and articulates the process of transformation and transition by which the company will become the successful modern business we want it to be. Because the Change Agenda envisions considerable cultural change, values and an organizational philosophy are key components of the Agenda. The Corporate Goals are also interwoven into the Agenda – because, while the transformation we envision is intrinsically worthwhile, we also believe it must advance the cause of making Amtrak a safer, more customerfocused, and a better-performing organization. 8 Exhibit 1-2– Strategic Change Agenda While the Change Agenda outlines the current and the proposed states, the Corporate Strategy Map describes the ways in which Amtrak will seek to instill our values in our employees, leverage their talent to create a competitive advantage, and guide the organization to take the necessary strategic actions that will drive customer satisfaction, improve safety, and build the ridership and revenues we will need to improve our financial position. 9 Exhibit 1-3– Corporate Strategy Map 10 Finally, the Business Line Portfolio will realign corporate infrastructure to help Amtrak pursue the most effective path toward goal attainment. Over the course of the past year, Amtrak has undertaken this realignment to improve our customer service performance, financial efficiency, and operational focus. As part of this reorganization, Amtrak has created three rail-related “business lines” which will manage its basic intercity passenger rail operations. These are: Northeast Corridor (NEC) Operations State-Supported Corridors Long-Distance Services The General Managers of these three primary business lines are responsible for the operations, capital investment and financial performance of their respective passenger rail services. The next phase, which began in early FY2014, is the creation of an organization to manage Amtrak’s corporate assets. This fourth business line will be known as “Corporate Development,” and is still in the process of formation. While the organization’s scope is not yet fully defined, it is being designed to create common stewardship, management and development of all of Amtrak’s infrastructure assets across the nation, while also building new capacity to pursue ancillary business opportunities associated with leveraging Amtrak’s unique business assets. In short, Corporate Development will maximize the value and cash generation of our assets. By early October, 2014, Amtrak will have a better defined Corporate Development Business Line that will be designed to extract the maximum revenue from other transportation assets of the company. In addition to these business lines, Amtrak will continue to execute the traditional railroad functions (Engineering, Safety and Mechanical), key passenger service functions (Customer Service, System Operations, and Food and Beverage), and the necessary corporate support functions such as Marketing, Finance, Legal, and Human Capital Management that provide essential functional capability necessary to support the services provided by each of the business lines. Business Line Responsibilities Each of Amtrak’s three operating business lines is a fully integrated operation, combining traditional transportation and mechanical functions to improve accountability and service focus. Previously, Amtrak had been structured in business groups organized by function, geography and tasks. In contrast, the new vision is to manage the business using cross-functional teams. Therefore, all the specialized areas in Operations work together as one team in a matrix organization to deliver Amtrak’s Strategic Plan, committed to Safety and Security, Customer Focus and Financial Excellence. Amtrak believes a matrix organization will offer the following advantages: Organizational silos are dissolved to increase cooperation, and improve information flow. By sharing talent and expertise, communication across all organizations is improved, and decisions can be made by employees closer to the situation. Changes in markets and priorities are responded to with greater flexibility and speed. Employees are exposed to new career opportunities because they have more interaction with various parts of the business. The intent is to drive stronger communication, collaboration and a unified purpose across business disciplines to positively impact our customers’ satisfaction and loyalty to Amtrak. This represents a considerable cultural shift; in the past, managers were responsible principally for ensuring that they 11 managed to their budget and executed only their portion of a complex job. Today, however, they will be held accountable for ensuring that each business line meets its strategy-driven goals for safety, financial performance, and customer satisfaction. Business line General Managers are responsible for day-to-day train operations through collaboration of a matrix structured organization. Performance will be measured with a metric-driven focus on safety, on-time performance, customer satisfaction and service delivery improvements as their key responsibilities. Implicit in this slate of responsibilities is Amtrak’s expectation that the General Manager will find and exploit opportunities for improvement. They will develop short- and long-range strategies to improve customer service, build ridership and revenues, improve on-time performance, and develop a safer, more customer-focused and more effective organization. They will also be expected to develop strategies to mitigate risk and be responsible for the overall profits or losses of their businesses. Exhibit 1-4– Route Map of Train Services by Business Line Human Capital Strategy Implementing Amtrak’s Strategic Plan begins with effective management of its most important resource, Amtrak’s workforce. Achieving the goals and objectives envisioned in the Strategic Plan – from adopting a Business Line structure to improving financial performance – requires an industrybest workforce pulling together toward the right common goals. To lead this change, in mid-2011 the Human Capital (HC) team was restructured and aligned with the Strategic Plan. The HC vision and mission, shown in Exhibit 1-5, was also established. 12 Exhibit 1-5– Amtrak Human Capital Blue Print In 2012 the HC leadership team – in coordination with Amtrak’s CEO and Executive Committee developed Amtrak’s first HC Strategic Plan (Plan), a three year continuous improvement roadmap of HC deliverables. The Plan is refreshed annually. The Plan identified the following critical workforce-related risks: A retiring workforce Shortage of qualified workers available for hire Below-market compensation structure Lack of effective performance management process Outdated/insufficient Human Capital technology platform Increased benefits cost Lack of enterprise wide workforce strategy Recognizing that solutions to these risks must be formulated in accordance with Amtrak’s Strategic Plan, HC developed its own Strategy Map (Exhibit 1-6) that ties into the overall Amtrak Strategy Map shown in Exhibit 1-3. This HC map governs Amtrak’s approach of driving performance through its people. 13 Exhibit 1-6– Amtrak Human Capital Strategy Map Over the past two years Amtrak HC has made significant progress towards grasping these opportunities and mitigating the identified risks. Formulating and implementing solutions to address these risks has been approached through the Awareness, Desire, Knowledge, Ability, and Reinforcement (ADKAR) change management process. ADKAR remains an integral part of Amtrak’s HC philosophy and each HC improvement initiative. Following describes some initiatives undertaken to address the workforce-related risks. Integrated Talent Management and Total Rewards Amtrak’s approach to talent management centers around the Integrated Talent Management (ITM) and Total Rewards program strategies. The bedrock of executing these strategies consists of three critical components – people, process and technology. By focusing on improving these components, Amtrak is systematically addressing the workforce-related risks identified above. Amtrak’s new non-agreement talent, as identified by the consultant AON Hewitt, originates from the following sources: General Industry (69%), Government and Military (17%), and Freight Railroads (14%). Because Amtrak is competing with private industry for the majority of its workforce, it is imperative that the company is competitive in this marketplace and able to attract and retain the talent needed to provide world-class passenger rail service. Over the past two years Amtrak has designed, developed and successfully launched or implemented several key components of the ITM strategy including building a robust schema of core and technical competencies, risk management protocol, and improving capabilities in workforce planning and analytics systems. The first area of focus within the ITM program was Talent Acquisition (TA) – the processes and methods for hiring and onboarding new talent into Amtrak. To improve TA, Amtrak has restructured and realigned its TA professionals with the needs and goals of Amtrak’s Business Lines and support groups. Hiring processes and practices have been redesigned and Amtrak is in the process 14 of acquiring new pre-hiring testing instruments which will help ensure only best-fit talent is identified and hired. Additionally, a new applicant tracking system is being introduced in 2014, along with the introduction of a behavioral based interview protocol. Amtrak’s second major ITM initiative was the launch in 2013 of a new performance management process. The goal of this process is to create a culture which differentiates performance. Amtrak established new standards of accountability, goals and metrics by which individual performance is assessed. A new performance management tool - “MyCareerTrak” – was introduced. MyCareerTrak equips managers and employees with the in-depth employee performance information required to establish clear goals and accurate, objective talent assessments. Managers and leaders were trained on having effective conversations with employees about roles, goal-setting and performance accountabilities. A rigorous new goal-setting process was established, followed individual performance evaluation and reviews after six and twelve months. The final year-end performance review process included the introduction of “calibration” sessions in which HC management worked individually with each Amtrak department, and across the entire organization as a whole, to ensure that consistent performance measures were applied that resulted in consistent performance rating outcomes across all of Amtrak. Over the last two years, Amtrak has made significant improvements in achieving consistent and fair distribution of performance ratings that improve organizational performance outcomes. This improvement has been accomplished without the use of a forced ratings distribution system. Through the Total Rewards strategy, Amtrak has realigned its pay and benefits offerings to more directly link employee rewards to achieving its Strategic Plan. Amtrak’s Total Rewards represents the broad spectrum of plans and programs designed to reward, recognize, motivate and develop Amtrak’s employees throughout their careers. Total Rewards offers competitive, market-based pay and incentives that drive behavior, differentiates employee pay based on performance, and improves individual alignment to Amtrak’s business goals. Total Rewards introduced a Short-Term Incentive (STI) program that, in 2013, paid STI bonuses for the first time in Amtrak’s history. Total Rewards also incorporated cost control, quality, preventive care and wellness interventions to better manage its non-agreement medical plans. Through the Total Rewards strategy Amtrak has been able to implement the following improvements to compensation and benefit programs. These steps mirror actions and programs implemented by a majority of Fortune 500 companies. Close the Retirement Income Plan (pension) for new employees and agreement transfers hired on or after April 1, 2013. It is expected that cash savings will begin to be realized beginning in FY2017 and total $15.7 million over five years. Close the Retiree Medical plan for new employees and agreement transfers hired on or after April 1, 2013. It is expected that cash savings will begin to be realized beginning in FY2016 and total $0.5 million over five years. Increase retiree contributions to the Retiree Medical plan beginning January 1, 2014 resulting in cash savings of $0.7 million in 2014 and $14.6 million over the next 5 years Launch incentive-based Every Day Wellness to better manage chronic conditions and improve health outcomes Implement a generic-first policy that requires patients to try a generic medication before a brand name drug Offer Consumer Directed Health Plan as option for non-agreement employees with a Health Savings Account (HSA) which will result in cash savings of $3.5 million in 2014 and $28.1 million over the next 5 years 15 Introduce a performance-based Short-Term Incentive (STI) program for all non-agreement employees with rating of “Met Goals” Invested more than $10 million in new online, classroom and on-the-job learning opportunities linked to Amtrak’s strategic plan and its core competencies Lean Enterprise Solutions The Lean Enterprise Solutions (LES) Department has been created to assist Amtrak in developing a consistent process of waste elimination and continuous improvement. LES strives to work with teams, managers, department/business line leaders and the Executive Committee to remove the barriers that are preventing Amtrak from making the improvements needed for future success. Customers, State Partners and Congress are demanding that Amtrak make comprehensive improvements that increase the value of services it provides to the country. The overall process achieving these improvements will be called the “One Amtrak Way” – a systematic approach to accomplishing thousands of daily improvements across the entire company. The goal is for all of Amtrak to participate in LES activities and actively look for opportunities to streamline processes and eliminate waste. To accomplish this, LES was first launched in Human Capital (HC) to drive improvements and demonstrate the value of a structured performance improvement program. The LES governance body is chaired by the Chief Human Capital Officer and includes the Chief Financial Officer and the Vice President of Operations. Initial projects include streamlining the hiring process and improving sub-processes that impact delivery of HC services to employees. LES is also leading HC through the process of becoming ISO9001 certified. ISO9001 is an international standard used for certification of an organization’s quality management system. This process requires a deep assessment of core HC transactional processes to ensure procedures that enable a consistent quality of service are in place and are being followed. It also requires establishment of a corrective action process and periodic quality management reviews that detect non-conformances for correction. A primary benefit of the certification is the discipline and focus on quality that is instilled in the organization. This translates to improved processes that ensure quality and service delivery, optimal use of resources and overall improvement in client satisfaction. Human Capital Operations The Human Capital Operations Group consists of two teams; the Employee Service Center (ESC) and Human Capital Technology. The Employee Service Center strives to provide an outstanding customer experience for both employees and management. The goal of the ESC is to assist employees with their HC needs and eliminate unnecessary administrative redundancies to free employees and managers to focus on customers and executing the Amtrak strategic plan. The ESC constantly pursues streamlining of HC processes that simplifies employee and management transactions and improves the quality of service delivered. Several initiatives are currently in process. A call monitoring program is being implemented with the Customer Support Team to increase the consistency and accuracy of information provided and to identify process enhancement opportunities that allow for one-call resolution. The ESC is also proactively meeting with client group business leaders to identify ways to improve the employee and client group experience. One outcome of these interactions has been the conversion of several paper forms to electronic forms (eForms) improving the ease of form submission, tracking, and processing. The ESC organizational structure has revamped to ensure focus is on day-to-day operations as well as strategic long term planning. Team leads have been established that provide an escalation point, as needed, for incoming inquiries and requests. Another significant improvement is the establishment of a Leave Management team which provides comprehensive, consistent, and timely administrative 16 processing of all employee leave and return-to-work scenarios including leave for the Family Medical Leave Act (FMLA), Short Term Disability (STD), and Long Term Disability (LTD). The ESC will also be restructuring the Recruitment Support team to align with both the business and Talent Acquisition’s new organizational structure. The Human Capital Technology (HCT) team provides both the operational and technological systems required to meet business demands for workforce management systems. This group has leveraged technology to reduce costs, improve effectiveness, maximize efficiencies and ensure data integrity. HCT manages the development and operation of the Amtrak workforce management system. Ongoing efforts are underway to drive the adoption of automation and self-service functionality throughout the system. HCT has partnered with multiple Amtrak departments to deliver conversion from weekly to bi-weekly payroll, retroactive and general wage increase for agreement employees, short term incentives and merit increases for non-agreement employees, automation of forms, and system self-service. HCT has contributed to a successful implementation and is providing continuous support of the SAP SuccessFactors modules, Amtrak’s new HC management system. Looking forward, the HCT team will support Amtrak efforts in areas of talent management, onboarding, succession planning, Total Rewards, employee career development, better learning opportunities and benefits by focusing on user friendly experience with seamless integration of cutting edge technology. HCT will also continue to drive integrated solutions for compliance issues by recommending, implementing and supporting more efficient systems for employee health services, leave administration, FMLA and labor management systems. Labor Relations: Statement on Amtrak’s Ability to Recruit, Retain, and Manage the Agreement Workforce Amtrak’s ability to recruit, retain and manage its agreement workforce remains strong. Amtrak has a mature workforce and a significant proportion of that workforce is eligible to retire or is nearing retirement eligibility. While it is conceivable that Amtrak could experience mass retirements over the next five years, our experience has been that Amtrak’s workforce does not generally retire at first eligibility. The majority of Amtrak’s workforce is covered by labor agreements which in terms of benefits and wages are generally consistent with the other railroads and industries. This consistency mitigates the risk of Amtrak’s workforce leaving for competitors. Amtrak’s wage structure is competitive and enables the company to select new employees from a deep pool of qualified candidates. Amtrak offers excellent job-skills training and benefits that continue to make Amtrak an attractive employer. Amtrak enjoys favorable relations with labor unions and has had no significant labor concern in recent years. Terms of almost all labor agreements run through January 1, 20151, and are thereafter open for renegotiation under the terms of the Railway Labor Act which provides for an orderly and stable negotiations process to ensure continuity of operations in the rail industry. Employee Relations: In order to understand what drives employee effectiveness and to understand employees' views on whether Amtrak has the right work environment to attract and retain best-fit talent and ensure that employees feel connected and committed to their jobs and helping Amtrak meet its business goals, in support of Amtrak's Strategic Plan, Amtrak conducted its first employee engagement survey in October 2013. The survey consisted of 25 engagement-related questions added to the 2013 Organizational Culture Diagnostic Instrument (OCDI). The questions touched on eleven factors that drive engagement (manager approachability, capability, communication/no abrupt changes in work policies or procedures, ethics/values, fair treatment/honest issue closure, performance management system, recognition, self-esteem and dignity/trust and respect, total compensation, and work/life 1 The contract with the Fraternal Order of Police runs through October 2015 17 balance). In FY2014 Amtrak will use the survey results to identify areas that need to be changed, improved or enhanced and then develop and begin implementing action plans for addressing problem areas. The engagement survey will be administered again in 2015. Amtrak's employee engagement journey actually began in December 2012 when Human Capital began using the Engagement Factors assessment tool with select business units. The Engagement Factors tool, which Human Capital continued to use in 2013 and 2014, is designed to identify potential workplace barriers to employee engagement. Following the sessions the business units use workplace committees to devise solutions for addressing the identified barriers. The Gateway Program The Gateway Program is a comprehensive program of infrastructure improvements that will improve existing assets, strengthen system resiliency, increase track, tunnel, bridge and station capacity serving New York City, and allow the eventual doubling of passenger trains into Manhattan. The new tunnels and supporting infrastructure will be designed to withstand storm-related conditions and prevent salt water intrusion in the Hudson River tunnels. The creation of new Hudson River tunnels under the Gateway Program will also permit the closing of the existing, century-old tunnels for extended periods so that much-needed repair and improvement work can be done while maintaining access to Manhattan and accommodating the dense volume of daily traffic. While the Gateway Program is a long-term project spanning more than a decade, early actions to secure its right-of-way have already begun and must continue in order to meet the critical time schedule imposed by the ongoing Hudson Yards development project west of Penn Station. It is envisioned as a critical incremental investment to maintain the Northeast Corridor as the nation's premier rail corridor for the next century, with adequate new capacity to accommodate ridership growth for decades into the future. Additionally, the Gateway Program is being designed to permit future expansions of tracks and tunnels to Manhattan's East Side, Queens, and points north, as well as future tunnels under the Hudson River, should they become necessary in future decades. Planning is also underway to coordinate Gateway Program elements with the recommendations of the just-concluded Penn Station Visioning Study, a cooperative study with partner railroads to consider future improvements to the existing Penn Station facility. The program elements have been carefully designed as modular components, each offering independent utility, in recognition of an uncertain federal funding environment. Gateway's modular design allows the entire terminal complex to expand in a cohesive, integrated manner, transforming Penn Station into a facility truly worthy of the city it serves. Key Components of the Gateway Program New Trans-Hudson River Tunnels -Two new trans-Hudson River rail tunnels from the Bergen Palisades in New Jersey to Manhattan will directly serve the Penn Station/Moynihan complex. These new tunnels will provide operational benefits for the existing Penn Station by providing both operational resiliency and future increased capacity for commuter and intercity rail operations including New Jersey Transit and Amtrak. Construction has already begun on an initial segment that will install an 800-foot concrete casing through the Hudson Yards site, west of Penn Station, to preserve the only viable right-of-way for future tunnels into Penn Station. Expanded Moynihan/Penn Station -An expansion of existing New York Penn Station tracks and platforms and the creation of new "Penn South" concourses with direct connections to the existing Penn Station and future Moynihan Station facilities. These improvements will support the long-term growth of commuter and intercity passenger rail service at both Penn Station and the transformation 18 of the historic Farley Post Office Building into the new "Moynihan Station" serving Amtrak’s intercity operations and providing the station capacity to support the growth of Amtrak's Acela and future NextGen high-speed rail services. These investments further reinforce Penn Station's role as a vital multi-modal transportation hub for Manhattan and the entire region. New Portal Bridges -Two new high-level bridges, known as Portal North and South Bridges, will eventually replace the vulnerable 100-year-old moveable Portal Bridge over the Hackensack River between Kearny and Secaucus, New Jersey, doubling corridor capacity. Final design and federal environmental review for the North Bridge, the first to be constructed, has been completed. The North Portal Bridge is estimated to cost $900 million over a five year construction program and will proceed with the cooperation of New Jersey Transit and Amtrak, as soon as funding can be secured. Newark-to-Secaucus Improvements -The existing NEC will be greatly improved between Newark and Secaucus, New Jersey. The mainline will be expanded from two to four tracks between Newark and the Bergen Palisades tunnel portals, better connections will be built to link the NEC with the New Jersey Transit Morris and Essex Lines, and various bridges will be upgraded. Reconstruction of Existing Hudson River Tunnels -The existing Hudson River tunnels, opened in 1910, will be modernized once the new Hudson River tunnels are complete and rail traffic can be shifted to allow for the reconstruction of the old tunnels. The century-old tunnels will be upgraded to meet 21"-century standards for track infrastructure (direct track fixation), operations, fire and life safety, and resiliency to inundation and other potential emergencies. Exhibit 1-7– Gateway Program Map Gateway Program Cost Estimates The current five year plan call for $1.8 billion in spending, $0.2 billion to be funded through a grant via the Federal Transit Administration (FTA) and the remaining through the annual General Capital and Debt grants. The $1.8 billion includes the majority of work to complete the North Portal Bridge, finish the remaining portion of the tunnel box from Penn Station to the Hudson River and complete all studies for the Gateway program. The bulk of the expected project work and spending will take place after FY2018 which includes the two Hudson River Tunnels, new tracks, station expansions, and the South Portal Bridge. Current estimate for all work is expected to exceed $15 billion. 19 Each major project in the Gateway program is fairly unique and independent. Advancing funds to accelerate each project is the objective but is not included in this document, however this is the time to discuss and look for other possible funding mechanisms. The prime example is the Hudson Tunnel Box (phase 1) project which was funded via FTA grant to advance the Gateway program and preserve the right of way access from Penn Station NYC to the Hudson River. Fleet Strategy The following discussion responds to the direction in the Consolidated Appropriations Act, 2014 (Pub. L. 113-76, January 17, 2014), that the Corporation’s Budget, Business Plan and Five-Year Financial Plan, be accompanied by a comprehensive fleet plan. Amtrak has prepared comprehensive fleet plans for all Amtrak rolling stock. The most recent such plan, Amtrak Fleet Strategy: Building a Sustainable Fleet for the Future of America’s Intercity and High Speed Railroad Version 3.1, was published on March 29, 2012 (March 2012 Fleet Strategy) and is available at www.amtrak.com. There have been no significant changes to inventory of Amtrak’s rolling stock or plans and time frames for rolling stock maintenance, refurbishment or replacement since the publication of that document, other than that identified below. Therefore Amtrak is resubmitting the March 2012 Fleet Strategy this year by reference, with the explanation and qualifications provided below, as the FY2014 comprehensive fleet plan. Amtrak’s management believes that this is the best approach to be responsive to this direction given the uncertainties that flow from the expiration of the authorizations contained in the Passenger Rail Investment and Improvement Act of 2008 (Division B of Pub. L. 110-432, October 16, 2008) and Moving Ahead for Progress in the 21st Century or MAP-21 (Pub L. 112-141, July 6, 2012). Capital Planning at Amtrak Amtrak’s capital requirements are dominated by two specific categories of investments needed to provide safe, reliable and market-responsive intercity passenger rail service. The first is the acquisition, rehabilitation and maintenance of its fleet of passenger cars, locomotives, baggage cars and the other miscellaneous types of equipment, and the second is the construction, rehabilitation and maintenance of the infrastructure that Amtrak owns or controls. These types of capital investments are not dissimilar from those required by other forms of transportation such as commuter rail service that frequently shares the same infrastructure as Amtrak. The challenge that intercity passenger rail service provided by Amtrak faces is that unlike transit and commuter rail or other forms of transportation, there is no reliable, multi-year source of funds for capital investment. Thus, Amtrak must undertake capital planning without knowledge of how much capital will be provided from one year to the next. Indeed, Amtrak did not know the amount of capital available for FY2014 until January 17, 2014 with one-third of the fiscal year having already elapsed. Under the current approach, if Amtrak were to make a multi-year commitment to acquire needed equipment and subsequent appropriations for capital were less than anticipated, other critical investments would have to be deferred or alternatively Amtrak would have to pay penalties for breach of contract. Neither is desirable scenarios and would serve to drive up costs. The lack of predictability in the timing and levels of capital investment tends to force Amtrak away from systematic, long-term strategic planning and investment in favor of short-term fixes. Almost without exception, when viewed in their totality including impact on both revenue and expenses, over the long-run this latter model costs us more. This approach requires maintaining equipment long after the original manufacturer and many of the manufacturers of component parts have ceased to exist. This drives up costs and reduces reliability, both of which have adverse impacts on the financial bottom line. To some extent the challenges that Amtrak has faced in addressing the winter weather of 2013-2014, can be traced to the under capitalization of Amtrak’s fleet. 20 At this time, the only situations where Amtrak can undertake acquisitions of significant amounts of new equipment are in those limited situations such as the new ACS-64 locomotives and the proposed Tier III Next Generation high-speed trainsets for the Northeast Corridor (NEC) where the company can reasonably expect that net incremental revenues will service most, if not all, the costs of financing that equipment. A large portion of Amtrak’s equipment needs, however, are for services where America finds value in the national connectivity Amtrak provides, not necessarily in the net revenues flowing from the fare box. For these services, Amtrak’s investment in fleet must come from public sources in a manner similar to public transit including commuter rail. At this time however, those public sources of investment are insufficient in both amount and predictability to enable undertaking acquisition of significant quantities of new equipment. Amtrak believes that this is an issue that must be addressed as part of a comprehensive reauthorization of the Federal Government’s role in surface transportation. Status of Amtrak’s Current Fleet In FY2013 there were no significant additions to the Amtrak fleet from those outlined in the March 2012 Fleet Strategy. The fleet aged by another year of heavy use and came closer to the time when its condition will limit Amtrak’s ability to provide service at current levels of maintenance of equipment investment. Delays caused by equipment failures increased by 1.6 percent in FY2013. Exhibit 1-8 lists the current fleet age and average mileage of equipment used by Amtrak (including equipment owned by states.) In FY2013 Amtrak received two trainsets from Oregon for use in the Cascades service. Exhibit 1-8– Average Age and Mileage of Rolling Stock Passenger Cars Equipment Type Amfleet I Active Units 12/1/2013 Year Started in Service Average Age in 2014 Average Mileage 463 1975 - 1977 38 Years 4,409,000 (a) P32 18 P32DM P40 17 15 P42 19 F59PHI 21 AEM-7 47 HHP-8 15 California Diesels 17 Notes Cab Cars / NPCU Horizon 40 94 1967 - 1981 1989 - 1990 41 Years 25 Years 3,184,000 3,070,000 (b) Surfliner 49 2000 - 2002 14 Years 1,861,000 (c) California Cars 78 1993 - 2002 18 Years 2,155,000 North Carolina Cars 11 1953 - 1965 61 Years 876,000 Amfleet II 145 1981 - 1983 32 Years 6,018,000 Heritage 97 1946 - 1962 60 Years 5,394,000 Viewliner 51 1988 - 1990 19 Years 3,450,000 Superliner (I & II) 429 1979 - 1996 28 Years 5,293,000 Auto Carrier 80 2005 9 Years 1,555,000 Other 3 Unknown Unknown N/A Total 1,540 (a) (d) (e) (f & g) (h) Equipment Type Active 12/1/2 North Carolina Diesels 6 Switchers 45 Total 39 (i) California and North Carolina die Average Amfleet I mileage lower than previous report due to the return to service of 55 cars formerly in storage for 5+ years (b) (c) Cab Car average mileage = 1,800,000 miles since inception of Amtrak data systems in 1970's - mileage prior to data systems not available. NPCU average mileage = 3,900,000. Includes cars owned by Amtrak (39) and California (10) Equipment Type Acela Northwest Service Active 12/1/2 20 7 (d) Mileage since last major overhaul, approximately 1995 (e) Mileage since inception of Amtrak data systems in 1970's; estimates not available for prior period (j) 20 Trainsets = 40 power cars; 120 (f) Average Superliner I mileage = 6,392,000 and Superliner II average mileage = 3,833,000 (k) Washington State owns 3 trainset (g) Superliner I fleet was introduced during 1979 - 1981 while Superliner II cars came into service 1993 - 1996. (h) Two maintence of way work cars and one conference car 21 enger Cars Locomotives ar Started Service Average Age in 2014 Average Mileage 75 - 1977 38 Years 4,409,000 (a) P32 18 1991 23 Years 2,091,000 67 - 1981 89 - 1990 41 Years 25 Years 3,184,000 3,070,000 (b) P32DM P40 17 15 1995 - 1998 1993 18 Years 21 Years 1,850,000 2,421,000 00 - 2002 14 Years 1,861,000 (c) P42 195 1996 - 2001 15 Years 2,586,000 93 - 2002 18 Years 2,155,000 F59PHI 21 1998 16 Years 1,764,000 53 - 1965 61 Years 876,000 AEM-7 47 1980 - 1988 32 Years 4,179,000 81 - 1983 32 Years 6,018,000 HHP-8 15 1999 - 2001 14 Years 1,307,000 46 - 1962 60 Years 5,394,000 California Diesels 17 1991 - 2001 18 Years 1,857,000 (i) 88 - 1990 19 Years 3,450,000 North Carolina Diesels 6 1988 - 1998 23 Years 370,000 (i) Switchers 45 1950 - 2013 36 Years N/A Total 396 79 - 1996 28 Years 5,293,000 2005 9 Years 1,555,000 nknown Unknown N/A Notes (d) (e) (f & g) (h) Equipment Type (i) ely 1995 Average Mileage Notes California and North Carolina diesel locomotives are not Amtrak-owned Train Sets eport due to the return to service of 55 cars formerly ce inception of Amtrak data systems in 1970's - mileage age mileage = 3,900,000. nia (10) Active Units Year Started Average 12/1/2013 in Service Age in 2014 Equipment Type Acela Northwest Service Active Sets Year Started Average 12/1/2013 in Service Age in 2014 20 1999 - 2000 14 Years 7 1999 11 Years Average Mileage 1,959,821 2,281,469 Notes s in 1970's; estimates not available for prior period (j) 20 Trainsets = 40 power cars; 120 trailer cars plus one (1) non-revenue track geometry car uperliner II average mileage = 3,833,000 (k) Washington State owns 3 trainsets, Oregon DOT owns 2 trainsets, Amtrak own 2 trainsets 1981 while Superliner II cars came into service 1993 - 1996. rence car 22 (j) (k) Exhibit 1-9 lists expected availability of the current fleet in FY2014 as compared to the two most recent fiscal years: Exhibit 1-9– Expected Fleet Availability End FY2012 Active Car Fleet Amfleet I Horizon Surfliner California Cars North Carolina Cars Amfleet II Heritage Baggage Cars Heritage Diner Heritage Dome/Parlor Cars 463 94 49 78 11 145 64 20 6 Heritage Co. Serv., Exhibit 1 Viewliner - Viewliner II 2 SuperLiner I & II Auto Carrier Cab Cars / NPCU 429 80 40 Other 3 Total Car Fleet End FY2013 Net Shop Available Active 46 18 9 10 2 26 11 5 2 - 417 76 40 68 9 119 53 15 4 463 94 49 78 11 145 64 20 6 48 16 9 10 22 12 5 2 415 78 40 68 11 123 52 15 4 463 94 49 78 11 145 39 20 6 10 7 41 7 51 76 9 8 353 71 32 - 48 16 9 10 22 7 4 2 415 78 40 68 11 123 32 16 4 10 7 41 25 429 80 40 3 73 9 8 22 356 71 32 - 41 7 51 - 10 352 71 35 429 80 40 - 77 9 5 10 1,540 1 231 9 1,309 3 1,540 1 228 2 1,312 3 1,540 221 3 1,319 62 289 17 45 45 244 62 289 17 45 45 244 62 289 17 47 45 242 62 45 334 45 396 6 68 39 328 47 398 4 68 43 330 24 8 97 32 121 40 24 8 97 32 121 40 24 8 97 32 60 6 195 1,838 85.0% 84 8 253 2,189 3 1 36 332 81 7 217 1,857 84.8% 84 8 253 2,191 3 1 36 325 81 7 217 1,866 85.2% 51 - Projected End FY2014 Net Planned Net Shop Available Active Shop Available - - Locomotives Electric Locomotives 4 Diesel Locomotives Switchers 5 Locomotives Totals 45 396 Trainsets Acela (20 Trainsets) - Cars - Locomotives 121 40 Cascades Service (7 Trainsets) 6 - Cars - Locomotives Total Trainsets Grand Total Planned Availability % 60 6 227 2,163 - 32 325 1 Reclassed seven (7) cars from Other to Heritage Co. Serv., Exhibit above. 2 Long Distance Single Level cars now known as Viewliner II, to replace Heritage Baggage and Diner Cars and augment Single Level Sleeper fleet (130 car order comprised of 55 bag cars, 25 diners, 25 bag/dorm cars and 25 sleepers). 3 Other cars include two (2) MoW parts cars and one (1) conference car. 4 Electric locomotive deliveries begin in FY14 and continue thru FY16. 5 Switchers were not previously included in Planned Shop counts. Adding has no effect on passenger service. 6 Two (2) new Oregon (ODOT) owned trainsets placed in service FY 2013. 23 Status of Current Activities to Augment Amtrak’s Fleet ACS-64 Locomotives Amtrak entered into a contract with the Mobility Division of Siemens Corporation in September 2010 for delivery of 70 electric locomotives, designated as ACS-64, for use on the Northeast Corridor. These locomotives will replace the AEM-7 and HHP-8 locomotives currently used on Northeast Regional, Keystone and various state-supported and long-distance trains that operate over the electrified sections of the NEC. The first locomotive entered revenue service on February 7, 2014 and it is anticipated that the final unit will be delivered by January 2016. The total cost, including program management, spare parts and facility improvements will be $562.9 million and is being funded by a loan agreement under the Railroad Rehabilitation and Improvement Financing (RRIF) Program. Amtrak’s debt service payments related to this loan will come from net operating revenues from Amtrak’s Northeast Corridor operations. Viewliner II long-distance single level cars Amtrak entered into a contract with CAF USA for delivery of 130 long-distance single level cars, designated as Viewliner II, for use on long-distance trains, primarily over routes where clearances prevent the operation of bi-level Superliner equipment. The order consists of 55 baggage cars, 25 crew dorm cars, 25 diners and 25 sleeping cars. It is anticipated that the first units will be delivered to Amtrak for testing in the second quarter of FY 2014. The first car is anticipated to enter revenue service in the fourth quarter of 2014 with the final unit entering revenue service by March 2016. The total project cost will be $342.8 million. Payment for acquisition of these cars and related spare parts is being funded by annual Federal capital appropriation. Low Emissions Switch Locomotives Amtrak is receiving the benefit of a Diesel Emissions Reduction Act grant awarded through the US Environmental Protection Agency’s National Clean Diesel Funding Assistance Program to replace the existing engines in two switch locomotives with GenSet engines for use at the Washington (Ivy City) yard. Amtrak is working with the Metropolitan Washington Council of Governments (which is the actual grant recipient) and the Brotherhood of Locomotive Engineers and Trainmen (BLET) on this effort with Amtrak providing approximately 25 percent matching funds. This follows upon Amtrak’s receipt of four low emission switch locomotives, two funded under California’s Carl Moyer Program (sponsored by the Bay Area Air Quality Management District (AQMD) and the South Coast AQMD) and two funded by a Congestion Mitigation and Air Quality (CMAQ) grant from the Illinois Environmental Protection Agency and the Illinois Department of Transportation. Amtrak does not anticipate acquiring additional switch locomotives prior to 2018 unless grant funds dedicated for this purpose from sources such as above, become available. Tier III Next Generation Trainsets Amtrak and the California High-Speed Rail Authority (the Authority) released a request for proposals for Tier III Next Generation Trainsets on January 24, 2014. The equipment being sought by Amtrak under this acquisition would initially supplement and eventually replace the equipment presently used to provide the Acela service on the NEC. The purpose for the joint solicitation with the Authority is to determine whether there is a common platform available that can cost-effectively meet both Amtrak’s existing needs and the needs of the Authority’s initial operating segment which are similar to Amtrak’s future requirements articulated in the Vision for High-Speed Rail on the NEC. Each train would need to meet or better existing trip times on the NEC assuming no significant improvement to existing infrastructure, and have between 400 and 450 seats (compared to 304 seats 24 in the existing equipment.) Amtrak seeks up to 28 trainsets which would permit half hourly Acela service if the final business analysis justifies this level of investment. This is the first procurement in which Amtrak has undertaken with a partner, the first major procurement in which Amtrak has used performance based specifications, the first procurement in which Amtrak has used the Buy America standards in PRIIA (versus those in the Rail Passenger Service Act), and would be the first major equipment order that would be based upon the Federal Railroad Administration (FRA)’s Railroad Safety Advisory Committee Engineering Task Force II recommendations to create Tier III passenger equipment standards. Proposals are due from potential builders of this equipment on May 16, 2014, with selection targeted by the end of calendar year 2014. In parallel with the RFP and review of proposals, Amtrak will be working with FRA on the necessary safety approvals for use of this type of equipment on the NEC and to identify the best source of financing. Amtrak anticipates financing this equipment using the net operating revenue from NEC operations, in particular the net additional operating revenue that this equipment would generate. The report accompanying the Consolidated Appropriations Act, 2014, encourages Amtrak to apply to the FRA for financing of this equipment under the RRIF program. Presently Amtrak anticipates that the first trainsets would enter revenue service in 2018. Other adjustments to the March 2012 Fleet Strategy Exhibit 1-10 updates the rolling stock acquisition plan contained in the March 2012 Fleet Strategy. Amtrak anticipates a more significant update of this table might be necessary after the business lines’ 5 year plans are translated into fleet requirements, the pace of state acquisition of Section 305 equipment becomes more clear and after reauthorization for the surface transportation programs which include Amtrak. 25 Fiscal Year 2014 2015 2016 2017 2018 2019 2020 2021 2022 2023 2024 2025 2026 2027 2028 2029 Cycle 1 2036 2037 2038 2039 2040 2041 2042 2043 2044 Cycle 2 Total Exhibit 1-10 – Rolling Stock Unit Acquisition Plan Locomotives Cars Single Auto Electric Diesel Switcher Level Bi-Level Carriers 24 2 25 35 84 11 21 70 50 50 50 50 50 30 280 24 35 11 70 140 0 280 8 8 5 5 5 5 100 100 100 100 100 100 95 New High Speed Trainsets 8 12 8 100 100 100 100 100 8 80 38 825 508 80 28 8 12 8 8 8 5 5 5 5 36 74 25 25 850 0 508 0 80 28 56 Planning the Future of Amtrak’s Fleet Amtrak’s approach to fleet strategy and execution is being designed to emphasize the commercial nature of Amtrak’s business. The foundation for fleet strategy is articulation of the commercial strategy for the operating business lines that will be based on a strategic evaluation of the markets they serve. The business line general manager will recommend how the service be positioned and designed to maximize net income, while meeting customer expectations. From this will flow proposed operating schedules and the equipment requirements needed to meet these schedules (e.g. number of trains, seats and amenities for each train, performance attributes of trains). The next step is an assessment of Amtrak’s current assets, including assets that might need to be repurposed to meet equipment requirements, as well as options and opportunities for supplementing Amtrak’s fleet through acquisition of existing or new equipment. This assessment will develop into the business case for the proposed service including costs of various scenarios involving equipment, 26 opportunities for internal synergies, opportunities for external partnerships, opportunities for external financing, and estimates of return on investment, external benefits, and risks. The business case will then flow into Amtrak’s resource allocation decision making process where the recommendations for use of Amtrak’s resources and future investment will be prioritized against other investment needs. Until the reliable source of funding is in place, Amtrak will not know from year to year the level of capital resources that will be available to meet those needs. The end result will still be aspirational in many respects, but it will link investment needs to strategic outcomes. The fleet plan will consider fleet needs in three different time frames and thus provide for a better distinction between short-term actions and long term plans. The first time frame will be one year and align with the Corporation’s legislative and grant request. It will address the status of equipment acquisitions previously committed to and those specific fleet-related actions for which Amtrak will seek financing in the next year or public capital investment in the next Appropriations Act. The second time frame will reflect the five year mid-term plans of the business lines and align with the corporation’s five year financial plan. These requests will identify the fleet needs required to implement the five year plans but not necessarily reflect decisions on the prioritization of the use of capital. It is during this time frame that business cases will be developed that address specific equipment needs and address such options as the use of existing equipment, repurpose/rebuild of existing equipment, and/or acquisition of new equipment. Thus the five year mid-term plan will be less specific as to the cost and timing. The third time frame will address long-term issues that do not fall within the five year time frame, in particular the aging and additional wear and tear being placed upon our fleet. This will help provide policy makers an opportunity to see the long-term but not immediate financial needs of intercity passenger rail service and help inform decisions such as opportunities to develop domestic manufacturing of rail equipment that is sustainable over the longterm. Amtrak completed establishment of its three operating business lines, NEC Operations, State Supported Services and Long-Distance services in FY2013. During FY2014, the general managers of these business plans will be developing one-year and five-year plans for the routes and services for which they are responsible. In the interim however, there remains significant tactical investment requirements to keep Amtrak’s aging fleet in operation until the strategy aligns with the financial ability to implement that strategy which hopefully will flow from comprehensive legislation that addresses America’s pressing national transportation investment needs. Amtrak anticipates that the FY2015 will be reflective of this new approach to fleet planning. Fleet Activities in the FY2014 to FY2018 Fleet Plan This five year plan reflects the current challenges faced by Amtrak in funding the acquisition of new fleet. The only new equipment acquisitions assumed over the five-year time frame are the completion of delivery of the ACS-64 locomotives, funded by a loan made under FRA’s Railroad Rehabilitation and Improvement Financing (RRIF) Program; completion of delivery of the Viewliner II long-distance single-level cars funded as part of Amtrak’s capital grant, and Tier III Next Generation Trainsets for the Acela Express service. For the latter equipment Amtrak hopes to select a vendor in the first or second quarter of FY2015 and complete acquisition over a period of six years. Amtrak intends to finance this equipment with the corporation’s preference being, as indicated in the report accompanying the FY2014 Appropriation, that this be financed under the RRIF program as well. However, given the current state of this acquisition, it will not be until the second quarter of FY2015 that Amtrak can predict with reasonable accuracy the annual expenditure for the acquisition of this equipment or the annual debt service during this five year period. Other equipment-related capital funding requirements over the five year period will primarily involve overhauls of existing equipment with a minor amount of compliance-related acquisitions. Thus the capital fleet related expenditures for the five year period are presented in Exhibit 1-11. It should be noted that as Amtrak develops a more comprehensive strategic rail fleet plan that is also reflective of a 27 reliable, multi-year source of funding, the total expenditures on fleet and the expenditures by year will likely change. Exhibit 1-11 – Five Year Capital Expenditure and Debt Service Plan for Rolling Stock $ millions ACS-64 Electric Locos Acquisition (RRIF) Viewliner II Acquisition (CAF) Tier III Trainsets Acquisition Overhauls Total RRIF Financing Prior Equipment Debt Total FY2014 $89.7 103.3 5.8 216.5 $415.3 FY2015 $98.1 129.6 100.0 224.6 $552.3 FY2014 $11.2 112.9 $124.1 FY2015 $27.2 68.1 $95.3 Capital Expenditures FY2016 FY2017 FY2018 $59.3 $0.6 14.5 128.7 128.7 112.7 228.7 163.6 162.0 $431.2 $292.9 $274.7 Debt Service FY2016 FY2017 $32.4 $34.3 76.3 79.3 $108.7 $113.6 FY2018 $36.3 65.0 $101.3 5 Year $247.7 247.4 475.9 995.4 $1,966.4 5 Year $141.4 401.6 $543.0 Strategic Vision for High-Speed Rail The United States defines high-speed as 110 MPH or higher. Amtrak’s Acela is currently the country’s only world-ranking HSR service, but achieves 150 MPH only along stretches of the Northeast Corridor in Massachusetts and Rhode Island. Speeds are slower on the rest of the route due to the limitations of the track and power infrastructure, which reduces the average Washington, DC to New York speed to between 80 and 85 MPH. Achieving the national vision for high-speed rail will require Federal commitments of time and resources analogous to the commitments made to high-speed rail in other parts of the world. Amtrak is positioned to retain its leadership position in the high-speed rail age, and the next five years will mark the beginning of a decades-long investment in infrastructure that we believe will eventually culminate in true high-speed rail along the entire Washington, DC to Boston corridor. Amtrak’s plans call for a phased approach to the improvement of existing infrastructure, construction of new high-speed infrastructure, and acquisition of a “next-generation” (NextGen) highspeed fleet that will deliver, by 2040, a fully integrated HSR system with speeds up to 220 miles per hour, making possible to travel from Washington, DC to New York in 94 minutes by 2030, and from New York to Boston in 94 minutes by 2040. The 457-mile Northeast Corridor, stretching from Washington, DC to Boston and serving Amtrak, commuter and freight trains, traverses eight states and the District of Columbia. Carrying over 2,200 daily trains, the Northeast Corridor is among the nation’s most congested rail corridors and one of the highest volume rail corridors in the world. Service reliability, on-time performance, and opportunities for expansion have been negatively impacted by a lack of capacity along many stretches, especially where Amtrak’s operations overlap with intensive commuter and freight traffic. In May 2010, Amtrak released the Northeast Corridor Infrastructure Master Plan (NEC Master Plan). The plan resulted in a precedent-setting regional collaboration among the twelve Northeast states and District of Columbia, Amtrak, the Federal Railroad Administration, eight commuter and three freight railroads. The development of the NEC Master Plan led to a realization that NEC travel capacity requirements by 2030 and beyond could not be met by improvements to the existing corridor alone. 28 As a result, in September 2010, Amtrak released A Vision for High-Speed Rail in the Northeast Corridor, which presented the bold concept of a new 423-mile dedicated two-track high-speed rail alignment from Washington, DC to Boston to increase corridor capacity, improve service reliability and reduce travel times for all rail users. In July 2012 Amtrak integrated the two 2010 plans into a single service and investment program called the NEC Capital Investment Program. This update, summarized in The Amtrak Vision for the Northeast Corridor: 2012 Update Report describes the current stage of conceptual development and planning for the future of the NEC rail network. It details actions taken by Amtrak and other stakeholders since the release of the two major NEC planning reports in 2010 and also highlights the key findings of Amtrak’s recently completed NEC business and financial plan. The NEC Capital Investment Program consists of two parts: NEC Upgrade Program (NEC-UP): projects completed between 2015 and 2030 that will achieve a state of good repair on the Corridor, upgrade capacity-constrained segments, and allow for a top speed of 160 mph for HSR on selected segments. NEC Next Generation High-Speed Rail: projects completed between 2025 and 2040 that utilize both new and existing alignments, built upon the foundation of the NEC-Upgrade Program, that allow for a top speed of 220 mph. The NEC Capital Investment Program calls for a $151 billion investment (in constant 2011 dollars) in a cohesive service and investment program over the coming decades to improve and expand the NEC, and affirms the Amtrak commitment to implementing critically needed near-term NEC Master Plan projects while advancing the long-term development of a 220 mph NextGen HSR network through incremental “Stair-Step” improvements to its current high-speed rail service. Amtrak received feedback from states, commuter rail agencies and other NEC users and stakeholders, and in response and collaboration has made several revisions to its NEC plans since 2010, including: announcement of the Gateway Program to increase track, bridge, station and tunnel capacity from Newark, N.J., to New York Penn Station; a revised alignment of the proposed NextGen HSR route to travel through Providence, R.I., rather than via Woonsocket; and changes to various proposed stations. The Amtrak Vision for the Northeast Corridor: 2012 Update Report (Update Report) provides input to a new NEC environmental analysis and planning process led by the Federal Railroad Administration (FRA). This process, known as NEC Future – FRA Passenger Rail Corridor Investment Plan (PRCIP), will develop a new long-term service plan and related environmental analysis to guide an NEC investment plan for the next 30 years. The PRCIP is a critical step in defining and realizing future improvements to the NEC and will provide necessary information to support future FRA investment decisions. It is comprised of two components: a Service Development Plan that articulates the overall scope and approach for future intercity passenger rail service along the NEC and a National Environmental Policy Act (NEPA) Tier 1 Programmatic Environmental Impact assessment that addresses the broad environmental impacts for the entire Corridor along the route of proposed service. This is expected to be completed in 2015. The 2012 Update Report also discusses key findings from the recently undertaken NEC Business and Financial Plan (B&F Plan) to guide Amtrak on how to potentially fund and finance its integrated vision for the NEC. Specifically, the B&F Plan finds greater than anticipated ridership demand for, and associated revenue from, the planned Amtrak services levels supported by the NEC Capital Investment Program, forecasting a 25 percent increase in ridership and revenue over 2010 projections. However, the B&F Plan also finds that the schedule and large annual capital expenditures in the peak period of planned construction should be modified to strengthen opportunities for public and private sector funding, to take into account resource constraints and to ensure effective management and delivery of the Program. To advance the Program, the B&F Plan concludes that Amtrak should pursue a phased approach and strategically advance specific elements that have the most significant impacts on 29 improved reliability, increased capacity and reduced trip-time as quickly as funding allows, while deferring remaining elements to subsequent phases. This approach will help Amtrak achieve early successes that strengthen revenue and financial performance and create additional capital funding to support other program elements. For example, the proposed Amtrak Gateway Program to improve travel to and through New York City via new tunnels under the Hudson River and the expansion of the Moynihan Station and Penn Station terminal complex is essential to the entire NEC network. Its completion will deliver many key benefits for intercity and commuter rail service and set the stage for future NextGen HSR expansion. The B&F Plan also recommends that a combination of funding, policy decisions and cooperation from federal, state, and local governments, NEC users, regional partners, the private sector and Amtrak are necessary to advance a program of this size and of such regional and national significance. Further, public sector leadership and funding is essential during the early years. While the B&F Plan finds that current Federal, state, and local transportation investment programs are insufficient to support the Program presently, strategies are available to generate funding, including enhanced access fees paid by NEC users to support state of good repair and other improvement projects to the existing corridor that provide the greatest benefits to their services. The improvements envisioned entail long-term projects that require long-term funding commitments, which must be started immediately. The FY2014 – FY2018 period will see the commencement of elements of all six stair-steps, in order to complete the entire program by 2040. Elements of the NECUpgrade Program will involve traditional Amtrak investments in infrastructure and fleet state of good repair, while investments in programs such as Gateway and new fleet acquisitions kick off the Next Generation HSR portion of the vision. 30 Section 2: Economic Impact of Amtrak Activities Introduction When considering the appropriation of public funds to support a service such as Amtrak, it is important to establish what the taxpayer will receive in return for the investment. Some benefits are easy to identify. Capital funds purchase physical assets that are added to track infrastructure, rolling stock, stations and facilities, and support systems. Operational support provides intercity connectivity, improves the livability of the communities served, promotes a clean environment, and provides a critical link in the national transportation system. But there are also vast economic benefits that result from Amtrak’s activities - jobs created and supported, tax revenue generated - that is returned directly to the taxpayers making the investment in Amtrak. This analysis establishes that economic benefit. Amtrak has analyzed its business activities to measure their impact on the American economy. The analysis establishes the direct economic output of three segments of Amtrak activity: spending by our passengers during their travels, including jobs supported and tax revenue generated; direct Amtrak jobs and the income taxes paid by its employees; and goods and services purchased by Amtrak, including jobs supported and tax revenue supported. Our analysis does not attempt to quantify the “multiplier effect” of the induced spending and tax generated by the employment created by Amtrak activity. If this effect were considered, the economic impact would be much greater than presented in this analysis. Findings Our analysis was based on fiscal year 2012. In summary, our analysis shows Amtrak and its passengers spend $10.2 billion annually, which supports 115,500 jobs and returns nearly $1.6 billion in tax revenue to Federal, State, and Local governments. When compared to our FY2014 plan for Federal support, this represents a net contribution of $8.82 billion to the U.S. economy. Exhibit 2-1 summarizes our findings, and the following sections contain the assumptions and calculations behind the analysis. 31 Exhibit 2-1 – Summary of Amtrak Economic Benefit, Jobs Supported, & Tax Revenue Created Economic Benefit Tax Revenue Created Jobs $ Millions Amtrak Direct Expenditures Amtrak Payroll Goods and Services Purchases Total Amtrak Direct (thousands) $1,320 1,778 3,098 20.2 10.0 30.2 7,111 85.3 Total Amtrak Impact on Economy 10,209 115.5 Actual Federal Investment (FY14) 1,390 Passenger Travel Spending * Net Economic Benefit $8,820 Federal State Local Total $ Millions $917 431 241 $1,588 115.5 *Excludes purchases of Amtrak tickets Part 1: Spending by Amtrak Passengers The analysis of spending by Amtrak’s travelers relies heavily on research data published by the U.S. Travel Association in its annual report The Impact of Travel on State Economies (2013 Research Report, using 2012 data). The U.S. Travel Association has been publishing this study for over 30 years, and its economic impact data is produced by its proven proprietary economic model Travel Economic Impact Model (TEIM). TEIM was developed specifically to quantify spending generated by travel away from home and the jobs, payrolls, and tax revenue supported by this spending. The U.S. Travel Association estimates that in 2012 travelers made 2.1 billion “person-trips” in the United States2 and those trips generated $855 billion in traveler spending, which generated 7.7 million jobs, paying over $200 billion in payrolls, and creating about $129 billion in tax revenue.3 A persontrip is defined as one person traveling at least 50 miles from home one-way, or spending at least one night away from home. The 2012 average total spend per person-trip, regardless of mode of transportation, was $408 ($256 excluding the cost of transportation). Using the data published by the U.S. Travel Association, Amtrak incorporated the following information into its calculation of the economic impact of Amtrak travelers. 2 U.S. Travel Forecasts, U.S. Travel Association http://www.ustravel.org/sites/default/files/page/2010/12/Public_Forecast_Summary.pdf 3 The Impact of Travel on State Economies 2013 Research Report, U.S. Travel Association 32 Exhibit 2-2 – U.S. Travel Spending Key Metrics - 20124 2012 U.S. Travel Spending ($ billions) $162.8 155.0 317.8 158.4 201.4 89.7 88.2 0.0 Payroll Supported by Travel Spending ($ billions) $45.4 7.9 53.3 39.8 52.2 35.6 12.0 7.9 Payroll % of Travel Spending 27.9% 5.1% 16.8% 25.1% 25.9% 39.7% 13.6% Subtotal Non-Transportation 537.6 147.6 27.4% 6,450.7 22,877 Total Travel Spending $855.4 $200.9 23.5% 7,672.3 $26,185 Public Transportation Auto Transportation Subtotal Transportation Lodging Foodservices Recreation/Amusement Retail Travel Planning Jobs Supported Average by Travel Spending Annual (thousands) Wage/Job 962.1 $47,209 259.5 30,482 1,221.6 43,656 1,447.7 27,506 3,049.8 17,122 1,304.7 27,294 485.6 24,732 162.9 48,557 Exhibit 2-3 – Taxes Generated by U.S. Travel Spending – 20125 Federal State Local Total $ Billions % Total Travel Spending $70.4 36.3 22.1 $128.8 8.2% 4.2% 2.6% 15.1% Exhibit 2-4 – Average U.S. Travel Spending per Person-Trip – 20126 2012 Person-Trips within U.S. (billions) 2.097 Spending Per PersonTrip (dollars) $152 Transportation Spending Non-Transportation Spending $256 Total Travel Spending $408 The statistics in these tables were applied to Amtrak’s ridership to compute the total economic impact of Amtrak’s passengers during their travels. In FY2012 Amtrak carried 31.2 million passengers, a number which includes commuters traveling on multi-ride tickets. These commuters did not meet the 4 The Impact of Travel on State Economies 2013 Research Report, U.S. Travel Association The Impact of Travel on State Economies 2013 Research Report, U.S. Travel Association 6 The Impact of Travel on State Economies 2013 Research Report, U.S. Travel Association 5 33 definition of person-trips as defined by the U.S. Travel Association and were excluded from this analysis. The adjusted ridership number without multi-ride passengers was 27.7 million. The calculations in this section are based on the $256 per passenger spending which excludes the cost of transportation. Amtrak passenger spending on transportation represents the purchase of Amtrak tickets, which is used to pay Amtrak employees and purchase goods and services, and is therefore excluded from this part of the analysis. The economic benefit of Amtrak spending activity is quantified in the next section of this analysis. In summary, Amtrak’s passengers in FY2012 spent an estimated $7.1 billion during their travels which supported about 85,300 jobs and created $1.1 billion in tax revenue. The calculations of these amounts are shown in Exhibit 2-5. Exhibit 2-5 – Amtrak Passenger Spending, Jobs Supported, and Tax Revenue Generated - 20127 NEC Services State Services Long-Distance Services Total Amtrak Non-Transportation Spending by Amtrak Passengers in FY2012 (a) Ridership excluding multi-ride (millions) 10.9 12.1 4.7 27.7 (b) Spending per person-trip (dollars) $256 $256 $256 $256 (c) = a x b Non-Transportation Spending by Amtrak Passengers while traveling ($ millions) $2,785.6 $3,111.4 $1,214.2 $7,111.2 Jobs Supported by Amtrak Passenger Spending in FY2012 (d) % Non-Transportation Passenger Spending supporting Payrolls 27.4% 27.4% 27.4% 27.4% (e) = c x d Payroll Supported ($ millions) $764.7 $854.1 $333.3 $1,952.0 (f) Average Pay per Job Non-Transportation Spending ($ thousands) $22.9 $22.9 $22.9 $22.9 (g) = e/f Jobs supported by Amtrak Passenger Non-Transportation spending (thousands) 33.4 37.3 14.6 85.3 8.2% 4.2% 2.6% 8.2% 4.2% 2.6% 8.2% 4.2% 2.6% 8.2% 4.2% 2.6% $229.3 $118.2 $72.0 $419.4 $256.1 $132.0 $80.4 $468.5 $99.9 $51.5 $31.4 $182.8 $585.3 $301.8 $183.7 $1,070.8 Tax Revenue Generated by Amtrak Passenger Non-Transportation Spending in FY2012 (h) (i) (j) Federal taxes generated as % of passenger spending State taxes generated as % of passenger spending Local taxes generated as % of passenger spending Federal taxes generated ($ millions) State taxes generated ($ millions) (m) = c x j Local taxes generated ($ millions) (n) = k+l+m Total taxes generated ($ millions) (k) = c x h (l) = c x i Part 2: Amtrak Employment Amtrak spends a portion of its revenue and Federal support on its workforce. Amtrak employs approximately 20,000 people in highly-skilled professional jobs that return significant tax revenue to each level of government. Exhibit 2-6 represents Amtrak’s employment, payroll, and income taxes for 2012. FY2012 is used to be consistent with the latest analysis from the U.S. Travel Association. Note the tax revenue generated represents only income taxes withheld from employees. In summary, Amtrak employs over 20,000 people and that workforce has payroll withholdings for income taxes totaling about $250 million annually. 7 Rows (b), (d), (f),(h), (i), (j) from The Impact of Travel on State Economies 2013 Research Report, U.S. Travel Association. Row (a) from Amtrak ridership records. 34 Exhibit 2-6 – Amtrak Employment and Tax Revenue Generated - 20128 $ millions Amtrak Payroll Amtrak Jobs (thousands) Income Tax Witholdings Federal State Local Total Tax Witholdings NEC Services $547.5 State Services $332.3 Long-Distance Corporate Total Services Development Amtrak $435.9 $4.0 $1,319.7 9.0 4.7 6.4 0.1 20.2 76.8 22.1 4.6 $103.6 46.6 13.4 2.8 $62.9 61.2 17.6 3.7 $82.4 0.6 0.2 0.0 $0.8 185.1 53.3 11.1 $249.6 Part 3: Amtrak Goods and Services Purchased The balance of Amtrak’s revenue and Federal support is spent on the purchases of goods and services which also support jobs and create tax revenue. In 2012 Amtrak spent almost $1.8 billion on qualifying purchases of goods and services for its operations and capital projects. This total excludes the costs of Amtrak’s workforce, payroll taxes and retirement benefits, casualty and claims, depreciation and amortization. These expenditures supported an estimated 10,000 jobs and created $268 million of tax revenue. Quantifying the jobs supported and tax revenue created by these expenditures required using slightly different metrics compared to the passenger spending calculations. The percentage of total spending dedicated to payrolls was assumed to be the same as for passenger spending. However, the average salary per job was assumed to be higher than in the passenger analysis because the suppliers of the goods and services purchased by Amtrak generally employ more full-time and more highly paid employees than the retail, food-service, and lodging businesses that cater to travelers. Accordingly, the average wage used to quantify jobs supported is $48.9 thousand annually, which represents the average 2012 hourly wage of $23.53 per the U.S. Bureau of Labor Statistics9, multiplied by 2080 hours. The percentage of the overall spending that becomes tax revenue was assumed to be consistent with the rates of the passenger spending. 8 Amtrak payroll and ridership records 2012 Total Private All Employees Average Hourly Earnings, Not Seasonally Adjusted, U.S. Bureau of Labor Statistics, ftp://ftp.bls.gov/pub/suppl/empsit.compaeheu.txt 9 35 Exhibit 2-7 – Amtrak Purchases, Jobs Supported and Tax Revenue Generated - 201210 Goods & Services Purchased by Amtrak ($ millions) NEC Services State Services Long-Distance Services Corporate Development Total Amtrak $658 $476 $636 $8 $1,778 Jobs Supported by Amtrak Purchases of Goods & Services in FY2012 % Non-Transportation Passenger Spending supporting Payrolls 27.4% 27.4% 27.4% 27.4% 27.4% Payroll Supported ($ millions) $180.7 $130.6 $174.7 $2.1 $488.2 Average annual U.S. Wage - 2012 (thousands) $48.9 $48.9 $48.9 $48.9 $48.9 3.7 2.7 3.6 0.0 10.0 Jobs Supported (thousands) Tax Revenue Generated by Amtrak Purchases of Goods & Services in FY2012 Federal taxes generated as % of passenger spending State taxes generated as % of passenger spending Local taxes generated as % of passenger spending 8.2% 4.2% 2.6% 8.2% 4.2% 2.6% 8.2% 4.2% 2.6% 8.2% 4.2% 2.6% 8.2% 4.2% 2.6% Federal taxes generated ($ millions) State taxes generated ($ millions) Local taxes generated ($ millions) Total taxes generated ($ millions) 54 28 17 $99 39 20 12 $72 52 27 16 $96 1 0 0 $1 146 75 46 $268 10 Rows (b), (f), (g), (h) from The Impact of Travel on State Economies 2013 Research Report, U.S. Travel Association. Row (a) from Amtrak financial records. Row (d) from 2012 Total Private All Employees Average Hourly Earnings, Not Seasonally Adjusted, U.S. Bureau of Labor Statistics, ftp://ftp.bls.gov/pub/suppl/empsit.compaeheu.txt 36 Section 3: Five Year Financial Summary Change in Methodology As noted in Section 1 of this document, over the FY2014 – FY2018 period Amtrak is making significant changes in how it reports and funds its business operations. As a result of the company’s reorganization into business lines, Amtrak has updated the presentation of our financial information to provide greater clarity and transparency regarding the needs and performance of the Amtrak system. In order to identify the overall cash contribution or requirement of each operating business line, all of Amtrak’s operating costs have been assigned to a business line using the Amtrak Performance Tracking (APT) system. APT is an FRA-approved software allocation product that assigns and allocates all of Amtrak’s costs to trains and routes, and is used to establish the State payments directed by PRIIA 209. Revenue and costs that are directly attributable to a specific route or business line - for example ticket revenue, on-board labor, materials, and supplies, and train fuel – are fully assigned to the route or business line that incurred the costs. Revenues and costs that are shared by multiple routes – for example station revenues, operational overheads, and the cost of central support functions such as Information Technology, Legal and Accounting services, are allocated to routes and business lines that benefit from the shared operations. Generally speaking, operational (Mechanical, Maintenance of Way, and Transportation) overheads are allocated to a route or other business lines in direct proportion to the respective operational functions. Central support functions which do not have activity based statistics (e.g., Ridership) use statistics which encompass both train and non-train activities. This allows for allocations based on a subset of all other costs to be proportionally distributed to all Amtrak routes and business lines. A fundamental goal of Amtrak’s organization into business lines is to reduce operating losses and Amtrak is committed to achieving those reductions. Accordingly, Amtrak has targeted operational improvements that reduce operating losses in the FY2014 - FY2018 period. 37 Exhibit 3-1 – Net Operating Loss History and FY2014 - FY2018 Projections While Amtrak’s FY2014 funding has been established by appropriation, beginning with FY2015 Amtrak’s operating results will not be presented in the legacy format. When shown by Business Line, Amtrak’s operating losses consist of net profit for the Northeast Corridor and Commercial Development Business Lines, and net losses in the State-Supported and Long-Distance Business Lines. As mentioned in Section 1 of this document, PRIIA 212 requires that adopted cost-sharing formulas ensure that there is no cross subsidization of commuter, intercity or freight rail transportation and that each service is assigned the costs incurred only for the benefit of that service and a proportionate share, based upon factors that reasonable reflect relative use, of cost incurred for the common benefit of more than one service. Furthermore, cost-sharing methods defined by PRIIA 212 govern the entirety of the Northeast Corridor, not only the portion owned by Amtrak. As a result, Amtrak will incur financial obligations to the other owners of NEC infrastructure. Because of this requirement, Amtrak will need to end cross-subsidization of operating losses. The net profits of the Northeast Corridor and Commercial Development Business Lines will be used to fund Amtrak’s obligations under PRIIA 212, repay loans specific to the NEC, and fund capital investment in those businesses, thereby supplementing Amtrak’s available capital. Amtrak’s FY2015 – FY2018 projected operating losses, without cross-subsidization, are shown in Exhibit 3-2. FY2014 is shown with cross-subsidization continuing, in accordance with the FY2014 operating appropriation. 38 Exhibit 3-2 – Five Year Operating Losses FY2014 Utilizes Legacy Methodology with Cross-Subsidization FY2014 $ millions Direct Route Revenue Direct Route Expenses [a] Adjusted Net Operating Income/(Loss) Direct Routes Infrastructure Responsibility Profit/(Loss) [b] NEC $1,191.5 761.3 430.2 (99.8) State Supported $777.1 878.0 (100.9) Corporate Long-Distance Development $577.1 $95.4 1,199.3 18.5 (622.1) 77.0 Total Amtrak $2,641.1 2,856.9 (215.8) (99.8) Reimbursable Responsibility Profit/(Loss) [b] (36.3) 12.1 0.0 (24.1) Commuter Responsibility Profit/(Loss) [b] RRIF Payment Adjusted Net Operating Income/(Loss) Total Responsibility Capital Contribution Net Federal Operating Subsidy 3.3 (11.2) 286.3 0.1 7.4 (88.6) (614.7) 77.0 10.9 (11.2) (340.0) $286.3 ($88.6) ($614.7) $77.0 ($340.0) FY2015 - FY2018 Eliminates Cross-Subsidization FY2015 Direct Route Revenue Direct Route Expenses [a] Adjusted Net Operating Income/(Loss) Direct Routes Infrastructure Responsibility Profit/(Loss) [b] NEC $1,227.2 783.6 443.6 (92.8) State Supported $799.1 897.7 (98.6) FY2016 Corporate Long-Distance Development $595.4 $97.6 1,221.7 18.7 (626.3) 78.9 Total Amtrak $2,719.3 2,921.7 (202.4) (92.8) NEC $1,272.7 815.4 457.3 (93.3) State Supported $823.6 913.7 (90.1) LongDistance $624.3 1,268.5 (644.1) Corporate Development $105.0 25.0 80.0 Total Amtrak $2,825.6 3,022.5 (196.9) (93.3) Reimbursable Responsibility Profit/(Loss) [b] (38.5) 15.0 0.0 (23.4) (38.5) 13.6 0.0 (24.8) Commuter Responsibility Profit/(Loss) [b] RRIF Payment Adjusted Net Operating Income/(Loss) Total Responsibility Capital Contribution Net Federal Operating Subsidy 4.5 (27.2) 289.6 (289.6) $0.0 0.4 7.9 8.8 (618.3) (75.7) (635.3) ($83.2) ($618.3) 5.7 (32.4) 298.8 (298.8) $0.0 0.8 (83.2) 12.8 (27.2) (333.0) (368.5) ($701.5) ($75.7) ($635.3) 80.0 (80.0) $0.0 15.3 (32.4) (332.2) (378.8) ($711.0) State Supported $870.8 949.1 (78.3) FY2018 LongDistance $662.7 1,324.9 (662.3) Corporate Development $116.4 36.4 80.0 78.9 (78.9) $0.0 FY2017 Direct Route Revenue Direct Route Expenses [a] Adjusted Net Operating Income/(Loss) Direct Routes Infrastructure Responsibility Profit/(Loss) [b] NEC $1,312.1 846.0 466.2 (94.1) State Supported $846.1 930.8 (84.7) Corporate Long-Distance Development $642.4 $110.2 1,295.2 30.2 (652.8) 80.0 Total Amtrak $2,910.9 3,102.2 (191.3) (94.1) NEC $1,356.2 880.6 475.6 (95.1) Total Amtrak $3,006.0 3,190.9 (184.9) (95.1) Reimbursable Responsibility Profit/(Loss) [b] (38.5) 12.2 0.0 (26.2) (38.5) 10.2 0.0 (28.3) Commuter Responsibility Profit/(Loss) [b] RRIF Payment Adjusted Net Operating Income/(Loss) Total Responsibility Capital Contribution Net Federal Operating Subsidy 7.0 (34.3) 306.3 (306.3) $0.0 1.2 9.6 10.5 (643.1) (66.4) (651.8) ($71.3) ($643.1) 8.3 (36.3) 314.0 (314.0) $0.0 1.6 (71.3) 17.9 (34.3) (328.1) (386.3) ($714.4) ($66.4) ($651.8) 20.4 (36.3) (324.1) (394.0) ($718.2) 80.0 (80.0) $0.0 80.0 (80.0) $0.0 [a] Expenses are adjusted for non-cash expenses and other costs that do not impact the calculation of Federal operating support [b] Infrastructure, Reimbursable, and Commuter activities that are the the responsibility of the Business Lines are presented as net Profit or (Loss) amounts. These net amounts consist of revenues less expenses. Likewise, Amtrak’s capital requirements are impacted by this change in methodology and by PRIIA Sections 209 and 212. In prior years, Amtrak requested Federal general capital for all of its capital needs, other than certain joint-benefit investments that were partially funded by States and municipalities. In FY2014 Amtrak began receiving capital funding from States for rolling stock maintenance under PRIIA Section 209, and in FY2015 expects to begin receiving capital funding from States for infrastructure maintenance under PRIIA 212. Amtrak will also incur obligations to the other owners of NEC infrastructure under PRIIA 212. Because PRIIA 212 cost sharing methodology has not been finalized and adopted, this plan makes no assumptions regarding external PRIIA 212 funding. Finally, Amtrak will partially fund its capital program from earnings in the NEC and Corporate Development Business Lines. As the Exhibit 3-3 demonstrates, Amtrak plans to invest $1.5 billion of its operating profits from the NEC and Corporate Development Business Lines over the next five years into capital programs, an amount that directly reduces the need for Federal capital support. 39 Exhibit 3-3 – Five Year Total Capital Plan by Funding Source $ millions Federal Appropriations General Capital Amtrak Operating Profits - NEC and Corporate Development Subtotal Capital Department of Homeland Security Hudson Yards Concrete Encasement Grant NY-NJ High Speed Rail Grant PRIIA 209 Rolling Stock Maintenance Railroad Rehabilitation & Improvement Financing Sandy Capital Relief Appropriation State, Local, and Other Funds Subtotal Capital - Other Total Capital FY2014 FY2015 FY2016 FY2017 FY2018 $863 $760 369 1,129 14 63 144 70 198 0 320 809 $1,938 $1,584 379 1,963 9 0 115 65 179 0 344 713 $2,676 $1,691 386 2,077 10 0 31 59 121 0 333 553 $2,630 $1,650 394 2,044 10 0 0 48 100 0 143 301 $2,345 863 35 120 69 40 90 6 190 549 $1,411 5 Year Total $6,548 1,528 8,075 77 183 360 282 688 6 1,329 2,925 $11,000 Exhibit 3-4 – Five Year Total Capital Plan by Business Line $ millions FY2014 FY2015 FY2016 FY2017 FY2018 NEC Business Line State Supported Corridors Business Line Long-Distance Business Line Corporate Development Business Line Total Capital $996 115 258 43 $1,411 $1,386 155 315 82 $1,938 $2,149 146 300 82 $2,676 $2,155 107 286 82 $2,630 $1,891 87 285 82 $2,345 5 Year Total $8,577 611 1,443 370 $11,000 Exhibit 3-5 – Five Year Federal Appropriations General Capital Plan by Business Line $ millions NEC Business Line State Supported Corridors Business Line Long-Distance Business Line Corporate Development Business Line Total Federal General Capital FY2014 FY2015 FY2016 FY2017 FY2018 $573 22 235 32 $863 $445 20 295 0 $760 $1,274 25 285 0 $1,584 $1,386 30 275 0 $1,691 $1,336 35 279 0 $1,650 40 5 Year Total $5,015 132 1,369 32 $6,548 Exhibit 3-6 summarizes Amtrak’s funding plan for the five year period: Exhibit 3-6 – Amtrak Five Year Funding Summary $ millions FY2015 FY2016 FY2017 FY2018 $340 863 177 10 1,390 $701 760 150 9 1,620 $711 1,584 157 19 2,471 $714 1,691 195 20 2,620 $718 1,650 112 20 2,500 5 Year Total $3,185 6,548 791 78 10,601 549 809 713 553 301 2,925 $1,938 $2,430 $3,184 $3,173 $2,801 $13,526 FY2014 Operating Capital Debt Service FRA Holdback Total Federal Appropriation Other Capital Funds Total Amtrak Funding Amtrak Financial Stability The following statement is made in compliance with PRIIA Section 204 (b) (7): Amtrak’s financial stability and its ability to continue to provide passenger rail services depend upon and are influenced by numerous variables. The possibility exists that matters beyond Amtrak’s control may alter its current estimate capital and operating funding needs. Fluctuations in the political process and the economy, weather events and the fluctuations of fuel prices are serious concerns. Similarly, an economic downturn, particularly in the Northeast Corridor region could lead to unfavorable results in ridership and revenues. Budgetary issues faced by some State partners could likewise pressure our operating budget needs. Risks that can impact Amtrak’s operating and capital funding needs include: If Amtrak does not receive sufficient Federal government funding, Amtrak’s ability to operate in its current form may be adversely affected. Amtrak’s business is capital intensive, and without sufficient capital investment, Amtrak will be unable to maintain and improve current infrastructure and rolling stock. Instability or unavailability of Amtrak’s information technology systems could have a detrimental effect on Amtrak’s business. Legal proceedings may adversely affect Amtrak’s business operations. Amtrak’s business is subject to numerous operational risks – such as changes in general economic, weather or other conditions, equipment failure, disruption of its supply chain, war, acts of terrorism and other catastrophic events – which could result in significant disruptions to Amtrak’s operations, increased expenses or decreased revenue. Amtrak’s costs and revenues could be substantially adversely or positively affected by competition from airlines, buses and other modes of transportation. Amtrak’s business is vulnerable to rising fuel costs and disruptions in fuel supplies. Amtrak's business is subject to Federal, and in some cases, state and local, laws and regulations. 41 Amtrak’s business is subject to environmental laws and regulations that may result in significant costs. Most of Amtrak’s employees are covered by collective bargaining agreements, and failure to reach agreements may result in strikes, work stoppages or substantially higher ongoing labor costs. Catastrophic events could result in liabilities exceeding Amtrak’s insurance coverage. Amtrak has a mature work force, with substantial employee retirements expected in upcoming years, and therefore has large potential pension and other post-employment benefit obligations. Significant changes in the amount of those obligations could result from small changes in assumptions about healthcare cost trends and other variables. Amtrak has significantly reduced its dependence on Federal operating support over the past several years, as depicted in Exhibit 3-1. On a total company basis Amtrak will continue to require Federal operating support during the FY2014 - FY2018 period, although the company expects this aggregate need to continue to diminish. Assuming these external risks to our business do not materialize, when the business is viewed by segment, the company could provide passenger rail services in the Northeast Corridor without continuing Federal operating support but will continue to require Federal operating support for State Supported Corridors and Long-Distance (see Exhibit 3-2). Delivery of passenger rail services requires significant and increasing capital investment in Amtrak’s infrastructure and rolling stock. The level of deferred infrastructure maintenance that has accumulated as a result of insufficient funding is well documented, as is the age of Amtrak’s rolling stock. These assets must be improved and replaced in order to continue delivery of current services. Amtrak’s plan to reinvest the surplus cash from NEC passenger rail services in NEC infrastructure and rolling stock combined with PRIIA Section 212 funding requirements mitigates, but does not eliminate, the need for Federal capital support in the NEC. Likewise, PRIIA Section 209 funding requirements mitigate but do not eliminate the need for Federal capital support of State Supported Corridors. LongDistance capital requirements are solely reliant upon Federal capital investment. Without this investment, Amtrak’s ability to deliver passenger rail services will be adversely impacted and could eventually end. Methods of Estimation and Significant Assumptions The following statement is made in compliance with PRIIA Section 204 (b) (10): Each year Amtrak departments and finance staff formulate one-year budget appropriation requests and five-year financial plan documents. These efforts are greatly impacted by the timing of Federal appropriation actions. Typically our planning cycles involve the following major milestones: 1. A detailed one-year budget is developed and published in February of each year as part of Amtrak’s appropriations request justification. 2. Upon enactment of a Federal appropriation, the one-year budget is adjusted as necessary to match the appropriated amount. 3. A Five Year Financial Plan, beginning with the fiscal year of the appropriation, is developed concurrently to the one-year budget and finalized upon passage of the annual appropriations bill. Amtrak is required by its grant agreement to submit this document within sixty days of passage of the appropriations bill or October 1, whichever is later. Although the Amtrak Office of the Inspector General (OIG) is a part of the National Railroad Passenger Corporation, Federal funding is appropriated directly to the OIG and is not a part of this budget. 42 Operating Five Year Plan The FY2014 operating budget was developed by Amtrak’s operating departments as a “zero-base” budget, governed by targeted reduction to Amtrak’s overall operating loss. The plans for FY2015 – FY2018 were based on the FY2014 budget, with the following adjustments: 1. Passenger Revenue was estimated for each year in a manner consistent with FY2014. 2. State Supported Revenue was estimated in a manner consistent with the expected terms of PRIIA Section 209. 3. All other revenue was estimated based on delivering services consistent with FY2014, plus increases in fees paid by other rail operators to operate on the Northeast Corridor, as directed by PRIIA Section 212. 4. FY2014 Straight-time Wages for agreement-covered employees were inflated annually by continuing to apply the gross wage increase (GWI) pattern of the current contracts that expire June 30, 2015. For planning purposes only, this provision has been made for new GWIs during the FY2014 - FY2018 period. Actual GWI amounts, if any, will be determined by new contracts which are under negotiation. After GWI inflation was added, reductions were taken for targeted efficiency improvements. Overtime wages were not inflated to encourage efficiency improvements that would reduce overtime usage to offset wage increases. 5. FY2014 Salaries for non-agreement employees include a provision for merit-based annual salary increases. 6. Employee benefits were inflated by 6% annually, representing a decrease from prior year cost increase trends as a result of changes to benefit plan offerings. 7. Train Operations costs were increased to reflect new payments to other owners of Northeast Corridor assets as directed by PRIIA Section 212. These cost increases are offset by incremental access revenue, also directed by PRIIA 212. 8. All other costs were held to minor or no cost increases over FY2014 The following is a description of major revenue and operating expense categories: Revenue Passenger Revenue: including ticket sales, was developed with the assistance of a consulting firm. The consultant employs a complex model that takes into account numerous factors such as population growth, shifts, and preferences, employment, household income, travel industry competition including the price of gasoline, economic conditions, service schedules, and proposed pricing actions. State Supported Revenue: was budgeted in accordance with existing state contracts and projected route performance in those states. Amtrak has 19 States partnerships to provide services for 29 routes. Each of these route agreements was renegotiated effective October 1, 2013 in compliance with PRIIA Section 209 which requires States to pay their full proportional share of the operating costs of routes they support. These new agreement terms have resulted in a significant increase in Amtrak’s budget for State Supported Revenue. In addition to this Operating support, the terms of PRIIA 209 added $40 million to Amtrak’s capital funding to maintain the rolling stock used to deliver State services. Ancillary Business Revenue: consisting of Commuter, Reimbursable, and Commercial Development revenue was budgeted according to the operating agreements and operating expenses needed to deliver those services. 43 Commuter Revenue: Amtrak partners with the States or regional transportation authorities in Maryland, Florida, Connecticut, California and Washington to provide commuter services. Reimbursable Revenue: Amtrak performs reimbursable project work for a number of state agencies on an as-needed basis. Commercial Development: Amtrak leverages and maximizes revenue from its real estate holdings through retail, parking, advertising, real property leases/easements/sales and right-of-way fees. Other Revenue: Amtrak charges other railroads access fees in relation to their use of the NEC. Other revenue sources include resale of electric propulsion to state commuter agencies, commissions from co-branded credit cards, and revenue from other travel partners. This revenue increases beginning in FY2015 due to provisions of PRIIA Section 212. Operating Expenses Salaries: Salaries are budgeted for current and planned positions, with a modest merit-based salary increase provision each year. Wages: Wage rates are governed by the labor agreements that remain in effect until June 30, 2015. Agreements with all unions follow the same wage increase patterns, and accordingly all unions including those still not yet ratified were budgeted using the terms of the agreements. The final contractual GWI for most agreements is January 1, 2015 11. For planning purposes only, a provision has been made for new GWIs during FY2014 – FY2018 period. Employee Benefits: Employee benefit costs were calculated using total planned payroll expense across all business activity including capital and reimbursable projects. An outside consulting firm provided actuarial projections for the pension and retirement expense planning. Insurance costs were projected by Amtrak’s Benefit Accounting group, with assistance from the outside firm, using the projected participation in each plan and the projected costs of those plans. Railroad taxes were planned in accordance with the prevailing tax rates applied to wage and salary budgets. Due to changes to benefit plans designed to limit cost increases – most notably the migration to “Consumer Directed” health care options for non-agreement personnel, the five year estimate of benefit costs are rising at a lower annual rate than in recent experience. Fuel, Power and Utilities Train Propulsion: Electricity to power electric locomotives operating in the NEC was budgeted in accordance with projected contractual power costs and projected consumption based on the service schedule. Amtrak negotiates multi-year contracts for bulk electric power to be used for train propulsion. All propulsion power distribution is provided by the Philadelphia Electric Company (PECO) but three companies – Exelon, Constellation New Energy, and GDF Suez – are utilized as power generation resources. The most recent contracts became effective January 1, 2011 and provide favorable pricing that has kept this major expense at little to no inflation for several years. Consumption of diesel fuel to power the off-corridor diesel locomotives was planned in accordance with the service schedule and historical per-mile consumption statistics. The price per gallon of diesel fuel was computed using a historic correlation between the price of oil (per barrel), retail gasoline, and diesel fuel. Diesel fuel prices vary by geographic region due to the sourcing, delivery and transportation options available in each area. The five year per-gallon price outlook was based on U.S. Department of Energy estimates. 11 The final contractual GWI for the Fraternal Order of Police is October 1, 2015 44 Utilities: Utility budgets were developed with the assistance of an energy management consultant based upon historical utility cost analyses at a detail level. Other Expenses Materials: Materials consumed in the maintenance of track infrastructure and train equipment were budgeted by the Engineering and Mechanical departments according to the work production plans in each department. Occupancy: Rent, Common Area Maintenance, and other occupancy costs were budgeted by the Real Estate department to reflect lease agreement terms and are part of the “Facility, Communications and Office” Account. Casualty Claims: Estimates for casualty claims including employee Federal Employers’ Liability Act (FELA) and passenger liability were developed with actuarial assistance from outside actuarial consultants. Capital Five Year Plan Planning and documenting all capital investment projects, Amtrak submits specific required information that complies with Federal Railroad Administration (FRA) mandatory reporting requirements. In addition, Amtrak conducts a review of the projects according to Generally Accepted Accounting Principles (GAAP) to properly account for operating versus capital costs. The following is a summary and description of the information that is required for Capital budget submissions: Project Scope - A description of what the project is and its intended purpose/objective. Project Justification - An explanation of why the project is necessary and how performance will be measured. Funding Sources - The assumed source of funds that will pay for the project. National Environmental Policy Act (NEPA) Codes - Codes that describe the status of environmental impact of a project. Project Timeline – full project timeline from start to project closeout. Project Selection – projects were selected for funding based on a tiered approach. Projects were assigned into 3 primary tiers: Compliance, Maintenance and Enhanced Performance. Projects were reviewed, ranked, and selected for funding within each tier. Return on Investment Analysis - The submissions included an analysis estimating the return on capital investment. All projects that claim business improvement benefits were required to have this analysis completed; state of good repair programs including rolling stock rehabilitation are excluded. Project Outcome and Performance Measures - The submission included a worksheet to input outcomes and performance measures. This is a brief description of major outcome or outcomes anticipated upon completion of the project, and the metrics to measure the outcome(s). 45 Debt and Principal and Interest Payments Five Year Plan Exhibit 3-7 – Debt and Debt Service $ millions Debt Beginning Debt RRIF Loan Bridge Loan/Bonds Early Buyouts Subtotal Debt Before Principal Payments Principal Payments Baseline Savings from Exercising Early Purchase Options RRIF Loan Bridge Loan/Bonds Total Principal Payments Ending Debt FY2014 $1,396.5 FY2015 $1,402.1 FY2016 $1,369.7 FY2017 $1,324.5 FY2018 $1,167.2 90.2 200.0 (152.0) 1,534.7 82.9 0.0 0.0 1,485.0 85.5 0.0 0.0 1,455.1 18.9 0.0 0.0 1,343.5 0.0 0.0 0.0 1,167.2 146.8 (22.7) 4.3 4.2 132.6 87.3 0.0 10.9 17.2 115.3 99.4 0.0 13.5 17.8 130.6 142.5 0.0 14.7 19.1 176.2 68.7 0.0 16.0 19.7 104.4 $1,402.1 $1,369.7 $1,324.5 $1,167.2 $1,062.8 FY2016 $33.7 0.0 19.0 6.0 $58.7 FY2017 $28.7 0.0 19.6 4.7 $53.0 FY2018 $19.7 0.0 20.3 4.1 $44.1 FY2016 $189.3 (32.4) $156.9 FY2017 $229.3 (34.3) $195.0 FY2018 $148.5 (36.3) $112.2 Interest Expense Baseline Savings from Exercising Early Purchase Options RRIF Loan Bridge Loan/Bonds Total Interest Expense FY2014 $52.0 (5.8) 6.9 2.1 $55.2 FY2015 $38.8 0.0 16.3 6.6 $61.7 Debt Service Principal Payments and Interest Expense RRIF Loan Funded by Passenger Revenue Net Debt Service Expense FY2014 $187.8 (11.2) $176.6 FY2015 $177.0 (27.2) $149.8 After peaking at $3.9 billion in FY2002, Amtrak’s outstanding debt declined to $1.4 billion as of September 30, 2013, leading to significantly reduced debt service funding requirements. This reduction in debt has been accomplished primarily through exercising early buyout options (EBOs) on leased rolling stock, aided in recent years by special financing from the U.S. Treasury, authorized by PRIIA Section 205, that funded approximately $420 million of equipment lease buyouts. This financing expired in FY2013. Amtrak has further EBOs available in FY2014, totaling $197 million, that it expects to exercise using private financing. By exercising these options at a cost of $197 million, Amtrak will avoid $304 million in future lease payments, creating an estimated net benefit to Amtrak of $71 million after financing costs. A $130 million bridge loan has been obtained to fund EBOs as they become available while longer-term financing arrangements are pursued. This bridge loan is payable in January 2016. Amtrak continues to draw amounts under a $562.9 million financing agreement between Amtrak and the Federal Railroad Administration, funded by the Railroad Rehabilitation and Improvement 46 Financing (RRIF) program. Amounts drawn are used to fund the continued purchase of Siemens ACS64 electric locomotives for use in the Northeast Corridor, along with related infrastructure and spare parts. This five year plan does not include amounts or assumptions for any additional or new debt programs. Cash Flow Five Year Plan Exhibit 3-8 – Cash Flow $ millions FY2014 $286.8 FY2015 $298.8 FY2016 $298.8 FY2017 $298.8 FY2018 $298.8 1,142.2 (813.4) 328.8 11.2 1,411.5 176.6 1,928.1 973.2 (667.5) 305.7 27.2 1,937.9 149.8 2,420.6 962.7 (662.8) 299.8 32.4 2,676.3 156.9 3,165.4 949.8 (656.1) 293.7 34.3 2,630.0 195.0 3,153.0 938.7 (650.7) 288.0 36.3 2,344.7 112.2 2,781.2 Federal Grants: Operating Capital Debt Service Principal & Interest Less Amount Retained by FRA Subtotal Federal DOT Grants Third Party and Special Grants 340.0 872.9 176.6 (10.3) 1,379.2 548.9 701.5 769.2 149.8 (9.1) 1,611.4 809.3 711.0 1,603.1 156.9 (18.9) 2,452.1 713.3 714.4 1,710.9 195.0 (20.2) 2,600.1 553.0 718.2 1,669.7 112.2 (19.7) 2,480.4 300.7 Balance Sheet, Revenue, and Operating Improvements Total Sources 12.0 1,940.1 2,420.7 (0.0) 3,165.4 3,153.1 2,781.1 Ending Cash $298.8 $298.8 $298.8 $298.8 $298.8 Beginning Cash Balance Uses: Operating Expenses (Net operating loss including Depreciation & NonCash OPEB's (1) Non-Cash Adjustments (Depreciation & Non-Cash OPEB's) Net Operating Loss RRIF Loan Payment Capital Expenditures Debt Service Principal & Interest Total Uses Sources: (1) OPEBs - Other Post Retirement Employee Benefits Amtrak's five year simple sources and uses of cash statement assumes operating and capital expenditures within each respective year match its federal operating and capital grant funding levels. Amtrak's evolving management by business line structure will naturally lead to more clarity on cash balance improvement opportunities. The $298.8 million year-end FY2014 cash balance includes insurance receipts of $30 million related to Amtrak's Superstorm Sandy insurance claim. Future cash receipts from insurance carriers due to Superstorm Sandy damages are not projected due to ongoing settlement process with insurance carriers. Intra-year cash balances between will significantly increase and decrease above and below the ending cash balances in Exhibit 3-8. 47 Section 4: Northeast Corridor Overview The General Manager for the Northeast Corridor (NEC) Operations business line is accountable for the financial and operating performance of services that connect Boston, New York, and Washington, the busiest passenger rail line in the United States and the only one currently capable of services up to 150 mph. The core of these services are Amtrak’s high speed Acela service and the very successful Northeast Regional service, but several other operational responsibilities are also included, most notably the day-to-day management of commuter services that use the route. The mainline of the Northeast Corridor is a 457 mile route that stretches from Washington, DC to Boston. The track infrastructure is owned by multiple entities, with Amtrak being the principal owner with 363 miles owned (“Amtrak NEC”). The other owners are the Metropolitan Transit Authority and the State of Connecticut with 56 miles and the Commonwealth of Massachusetts with 38 miles. Three connecting corridors: the Springfield Line in Massachusetts and Connecticut, the Hudson Line in New York and the Harrisburg Line in Pennsylvania have all or portions of their route under Amtrak NEC ownership and operations. Operating and capital costs of these corridors are apportioned under the terms of PRIIA Sections 209 and 212. Amtrak’s NEC passenger rail services operate roughly 150 Amtrak trains daily serving the NEC mainline and connecting corridors, carrying 11.4 million passengers annually and delivering over $1.1 billion of passenger revenue. Amtrak’s NEC trains transport 76% of all travelers using rail or air between Washington, DC and New York City12. In addition to operating the Acela and Northeast Regional train services, Amtrak serves as the infrastructure manager for the majority of the NEC, providing dispatching services, electric propulsion power, and maintaining and improving the infrastructure and facilities that are used by the commuter and freight rail services, including the connecting corridors. The NEC is an incredibly intricate railroad system as one of the most complex and congested railroad territories in the world. With more than 260 million trips per year, the NEC carries approximately 750,000 riders every day on more than 2,200 trains operated by Amtrak, eight commuter rail operators and regional freight railroads. In fact, nearly half of all commuter trips and a third of all intercity passenger rail trips nationwide rely on some portion of the NEC network of tracks, stations and facilities. Of the 2,200 daily trains that use some portion of the Northeast Corridor, over 90% are non-Amtrak services - commuter trains operated by or for the various public authorities of the region as well as some 60 daily freight trains operated by CSX, Norfolk Southern, Providence & Worcester and Conrail. The NEC has certain market advantages allowing for a city center to city center trip that: Closely parallels Interstate 95 for most of its length Includes 4 of 10 largest metropolitan areas Houses 37% of Fortune 500 headquarters in Northeast states Serves over 700 universities and colleges Connects to the global center of finance, media, health care, culture and fashion Since Amtrak’s assumption of operating and dispatching of the NEC in 1976, train miles and passenger travel has effectively doubled to record levels with no indication the underlying demand is nearing maximum mode share. These high levels of train movements are, in many locations, exceeding the 12 Air/Rail Shares report as compiled by Amtrak’s Market Research and Analysis group for Fiscal 2012 48 capacity of the existing system, creating reliability problems for all operators and capping continued market expansion of services. Continued growth in both intercity and commuter travel will be effectively halted unless new investments are made to accommodate the impending greater market demand. Much of the Northeast Corridor is in need of rehabilitation and is approaching the limits of its capacity. Initially, constructed by the Pennsylvania Railroad over 100 years ago, many of the major structural components of the infrastructure are delivering extraordinary levels of service with little capital improvement. Amtrak currently faces more than $9 billion in State of Good Repair backlog that requires attention to ensure continued reliable services on the Northeast Corridor. These rail assets are in need of redesign and replacement in order for the nation to enjoy reliable high-speed rail service into the next century. While confronting the challenge of maintaining and rehabilitating the aging infrastructure, there is also a fundamental economic need for long-term reinvestment in capacity expansion along the NEC. The Northeast mega-region is a powerhouse of economic output for the United States. With projected population growth of 13 percent by 2040, passenger rail investment will become more critical as dramatically modernized infrastructure will be required to stimulate economic development and preserve overall quality of life in the Northeast. The economic competitiveness of the Northeast and the United States as a whole is at stake and there is a definitive need for sustainable transportation alternatives in the region. Other modes of transportation are unable to meet this growing demand as highway and airports are already overburdened. To address capacity constraints and the challenges of aging infrastructure beyond a state of good repair, extensive planning efforts are underway to ensure Amtrak can meet the long-term mobility needs of the region. Many of these recommendations have been detailed in previous Amtrak commissioned planning studies released over the last few years.13 In addition, Amtrak, in coordination with other NEC owners, operators and stakeholders is currently working on a comprehensive Northeast Corridor infrastructure improvement plan called, the Five Year Comprehensive NEC Capital Plan. This planning effort marks a significant change in how infrastructure improvements had previously been developed on the NEC, providing for regional collaboration in the development of a planning framework that meets the goals and objectives of all users. The Plan will serve as the basis for FRA’s review and approval of Amtrak’s NEC capital budget through the annual grant process that provides Amtrak with Federal capital funds appropriated to the Secretary of Transportation for the use of Amtrak. The purpose of the plan is to create a network-wide, comprehensive infrastructure capital program to meet goals and objectives for all users of the Corridor from Boston to Washington including the portions of the main line owned by Massachusetts, Connecticut and New York, as well as the Springfield, Albany, and Harrisburg connecting corridors. Amtrak’s Infrastructure State of Good repair (SOGR) needs, together with similar needs of other owners and projected growth, are addressed through a collaborative planning effort that incorporates corridor-wide service plans and the necessary capital investments to support those plans. Informed by a longer-term planning horizon, the Plan defines the actionable improvements that can be accomplished at given levels of funding within a five-year timeframe. The Plan will be structured to identify measurable service outcomes at variable funding levels, and to comply with a new cost allocation methodology, directed by PRIIA Section 212 and currently being developed by the NEC Commission, that requires Amtrak and commuter operators to utilize a common cost allocation methodology that consistently and equitably distributes the operating and capital costs of NEC infrastructure to its users. The Plan is slated for completion and approval by September 2014 and is aimed to support any of the long term alternatives currently being studied in the NEC Future Process, which is scheduled to be completed by mid-2015. 13 The Northeast Corridor Infrastructure Master Plan (2010), A Vision for High-Speed Rail in the Northeast Corridor (2010) and The Amtrak Vision for the Northeast Corridor (2012). 49 Business Plan Discussion – Northeast Corridor With the inception of the new Business Line organization the main focus has been to define, develop and implement the vision, mission and objectives of the new NEC Business Line. With this goal, the leadership of the NEC has been working tirelessly to provide service, build a future for the NEC that grows in profitability, ridership and market share of trips. This future is being built in an environment of increasing threat of decapitalization of the railroad. Chronic underinvestment and the advancing age of the NEC’s infrastructure have created a capital crisis on the NEC as the railroad infrastructure moves more passengers than ever before. Current investment levels are actively decapitalizing the railroad, as ongoing investment fails to keep pace with the rate of degradation of the infrastructure. It is against this backdrop that Amtrak plans a significant, long-term investment increase in the NEC infrastructure and rolling stock assets. The NEC requires no Federal operating support, but it does require significant Federal capital investment. This investment will be augmented by surplus revenue generated by our NEC services. The majority of the investment will be spent on infrastructure renewal, which includes stations, rail and safety mandates. Despite this threat, Amtrak believes that a bright future for the NEC lies ahead. To guide that future the NEC Business Line will strive to deliver the following mission: Provide high speed intercity travel that reflects our commitment to safe, reliable and environmentally sustainable operations. Support Long-Distance and State Supported Business Line services as well as work closely with the Corporate Development Business Line to attain a “state of good repair” while making high speed rail infrastructure investments. Delivery of this mission will be accomplished by following the Strategy Map established for the NEC Business Line. The numbering references in this Strategy Map are aligned with the Corporate Strategy Map depicted in Exhibit 1-3. 50 Exhibit 4-1 – NEC Business Line Strategy Map Improve Business Line operating ratio – maximize the growth of revenue while managing costs (F1). Maximize revenue - explore new opportunities to generate new revenue in the operation of our various routes and services (F2). Eliminate unnecessary operating costs - explore the various levels of operation for areas where efficiencies and process adjustments can result in lower costs (F3). Premium Customers: Provide personalized services to meet travel needs better than competing modes. This means providing a premium service on the Acela trains that will meet the customer’s needs of onboard mobility with relaxing, safe travel. The service will be a fast, on-time, smooth/comfortable ride (C1). Regional Customers: Provide a safe, on time, and clean service that meets travel needs better than competing modes. This means provide regional train service that will meet the customer’s needs of onboard mobility with relaxing, safe travel. The service will be convenient with a smooth/comfortable ride (C2). Business Line and Commuter Partners: Provide service according to the partner’s objectives. The NEC Business Line operates several State Supported routes including the Keystone Service, the Downeaster Service and several routes along the Empire Line. The NEC Business Line will maintain superior relationships with its State Supported partners and operate these trains in a manner that allows all partners to achieve their goals (C3). 51 Provide a consistent, high-quality customer experience that fulfills the brand promise. This means providing a consistent travel experience that meets or exceeds the expectations of the customers for whatever route they travel (S1). Grow a loyal, long term customer base by targeting and acquiring new riders. Utilize the projections of the Marketing partners to identify, increase and maintain our market share of customers in those areas of lower values (S2). Continuously improve our culture of safety and security. Provide a safe environment for employees, passengers and the general public who come in contact with NEC train services (S3). Drive productivity and quality through process improvement. Review established best practices and implement those enhancements that will lead to improved efficiency and equipment quality (S4). Clearly define measurable financial targets and provide transparent performance reporting. Create measures and targets that are actionable, meaningful, and aligned to the strategic plan. The information provided will be accurate, timely, communicated and readily available to understand results, perform analysis, and drive performance (S5). Acquire, develop and retain talent that will deliver on the NEC Mission. Ensure there are motivated and highly skilled employees in the right roles, who understand the core business and who contribute to achieving the company’s strategic objectives. To accomplish this, the complete package of Human Capital tools must be in place and utilized to deliver the strategy (T1). Enable talent with technology for productivity, agility and customer intimacy. This means people with the right skills and competencies must be in place to deliver on the strategic objectives, must be equipped with appropriate and consistently productive equipment to enable a productive work environment, and must have access to tools that allow flexibility and agility in responding to business and customer needs (T2). In the course of the next year, Amtrak is striving to identify specific initiatives to deliver the stated objectives. In addition, Amtrak is focusing on what can be done to measure the initiatives success and therefore, the performance toward the stated mission. The intent is to have clear, measurable and performance driven organization. This will not be without challenges, cultural changes and some setbacks. However, Amtrak is committed to succeeding and delivering high speed intercity travel that reflects our commitment to safe, reliable and environmentally sustainable operations. To deliver this mission and objectives the NEC business line has been organized in such a manner as to include the following: • Deputy General Managers – oversee districts in the NEC, including Washington, New York, and Boston and will be directly responsible for the financial, operational, customer satisfaction, ridership and revenue, safety and overall business goals in their region as well as commuter services were applicable in their specific territory. The DGMs are also accountable for profit and loss of their routes by overseeing all field operations and directing business planning and decision-making. • Route Operations – operate Northeastern train service routes and stations to provide excellent customer service and safe, reliable, efficient operation. • Major Terminals – operate terminal facilities that provide maintenance, train origination and termination, and major passenger operations for NEC and other business lines. • Dispatching/Control – safely dispatch trains to meet or exceed operating plan performance metrics. 52 This does not come without specific risks to implementation. Leadership takes seriously the need to understand areas of risk and developing plans to mitigate the following: • • • • Inconsistent Customer Service Competition (Airline and Bus Undercutting Prices) Declining Infrastructure / Lack of Capital Investment Increased Competition for Infrastructure Capacity Reorienting the culture and building the needed processes for the NEC and the rest of Amtrak to succeed by maximizing the resources available will be a significant challenge in the upcoming five years. NEC Five Year Financial Summary The Northeast Corridor Business Line generates a net profit and does not require Federal operating support. Over the FY2014 – FY2018 five year period, the NEC will produce $1.5 billion of surplus cash. Beginning with the change in methodology in FY2015 this surplus, which totals $1.2 billion for the four years beginning with FY2015, will be invested into NEC capital projects rather than subsidizing the operations of other business lines. The NEC requires significant capital investment. In addition to the earnings of the NEC and Federal investment, the NEC fleet benefits from capital contributions defined under PRIIA Section 209. Due to ongoing discussions surrounding PRIIA 212, no assumptions were made in regards to funding provided to Amtrak relating to infrastructure maintenance and repair under PRIIA 212. Descriptions of the capital programs can be found in Appendix VII. 53 Exhibit 4-2 – Five Year Projected Operating Results, NEC $ millions FY2014 FY2015 FY2016 FY2017 FY2018 $1,143.8 37.5 0.1 10.1 1,191.5 $1,178.9 38.1 0.1 10.1 1,227.2 $1,223.7 38.8 0.1 10.1 1,272.7 $1,262.7 39.2 0.1 10.2 1,312.1 $1,306.1 39.8 0.1 10.2 1,356.2 Direct Labor Train & Engine Crew Labor On Board Service Labor and Support Total Direct Labor 81.4 24.8 106.2 82.5 25.7 108.3 83.7 26.7 110.4 84.8 27.7 112.5 86.1 28.8 114.9 Other Direct Costs Host Railroad Maintenance of Way Host Railroad Performance Incentives Fuel and Power Commissary Provisions and Management Car & Locomotive Maintenance and Turnaround Commissions Reservations and Call Centers Connecting Motor Coach Stations - Route Total Other Direct Costs 2.7 0.8 55.3 23.6 125.1 25.7 19.9 0.6 1.8 255.5 2.7 0.8 55.4 23.7 128.6 25.7 20.5 0.6 1.8 259.9 2.7 0.7 59.2 23.9 132.2 25.7 21.1 0.6 1.8 268.2 2.7 0.7 62.5 24.1 135.9 25.7 21.7 0.6 1.8 276.1 2.7 0.7 66.4 24.3 140.0 25.7 22.4 0.6 1.9 285.0 Total Direct Costs 361.7 368.2 378.5 388.6 399.9 Contribution/(Loss) after Direct Costs 829.8 859.0 894.2 923.6 956.3 Shared Costs Stations - Shared MoE Supervision Training and Overhead MoW Support Yard Operations Marketing and Distribution Police/Environmental and Safety T&E Overhead and Operations Management Utilities Casualty, FELA, and other Claims Data Processing Services Communication Property Insurance Other General and Administrative Total Shared Costs 35.5 49.9 93.6 20.1 42.4 23.5 38.6 6.2 14.1 25.0 7.4 11.0 50.3 417.6 36.7 50.8 94.6 21.0 42.1 24.4 38.9 6.2 15.6 25.0 7.4 12.4 59.2 434.3 37.8 52.3 96.2 21.8 42.6 25.3 40.8 6.2 16.2 26.1 7.4 12.9 69.4 455.0 39.0 53.7 98.0 22.7 43.0 26.2 42.3 6.3 16.7 26.9 7.4 13.3 78.6 474.1 40.2 55.4 100.0 23.7 43.5 27.2 44.0 6.3 17.3 28.0 7.4 13.8 89.5 496.4 SubTotal Direct and Shared Costs 779.3 802.5 833.5 862.7 896.3 Net Operating Income/(Loss) - GAAP 412.2 424.7 439.2 449.4 459.9 Adjustments to GAAP [a] 18.0 18.9 18.1 16.7 15.7 Adjusted Net Operating Income/(Loss) [b] - NEC Routes 430.2 443.6 457.3 466.2 475.6 Payment of RRIF Loan for Electric Locomotives Profit/(Loss) of NEC Infrastructure Operations Profit/(Loss) of Managed Commuter Operations Profit/(Loss) of Managed Reimbursable Operations (11.2) (99.8) 3.3 (36.3) (27.2) (92.8) 4.5 (38.5) (32.4) (93.3) 5.7 (38.5) (34.3) (94.1) 7.0 (38.5) (36.3) (95.1) 8.3 (38.5) Adjusted Net Operating Income/(Loss) [b] $286.3 $289.6 $298.8 $306.3 $314.0 Revenue Ticket Revenue, net Food and Beverage Revenue Other Transportation Freight Access Fees & Other Total Operating Revenue Direct Costs [a] Adjustments to GAAP are made to exclude costs and revenue that do not impact Amtrak's need for Federal operating support. Items excluded are costs for Amtrak's Office of the Inspector General (funded independently), non-capitalizable costs and certain contributions associated with capital projects (funded by capital appropriation), net interest expense (funded by debt service appropriation), depreciation (non-cash expense), and accruals for estimated future post-retirement employee benefits (non-cash expense). [b] Adjusted Net Operating Income/(Loss) represents cash contributions or need for Federal operating support 54 Exhibit 4-3 – Five Year Projected Capital Investment by Program, NEC $ millions FY2014 FY2015 FY2016 FY2017 FY2018 5 Year Total SOGR Base Major Projects Safety / Mandates Support Equipment and Vehicles Improvements Amtrak Support Infrastructure Renewal $187.5 26.1 43.6 7.6 2.2 0.0 266.9 $320.5 25.5 10.9 2.6 3.3 0.3 363.0 $467.1 225.3 8.3 4.0 1.8 0.0 706.4 $493.9 425.0 5.6 4.5 0.1 0.0 929.0 $523.6 474.9 6.5 0.0 0.1 0.0 1,005.2 $1,992.6 1,176.8 74.9 18.6 7.4 0.3 3,270.6 SOGR Base Major Projects Safety / Mandates Improvements Amtrak Support NEC Master Planning Support Equipment and Vehicles Stations and Facilities 43.3 23.4 1.2 10.1 0.2 2.1 0.6 80.7 114.3 7.9 0.2 17.6 0.0 10.5 0.0 150.5 202.2 257.7 0.2 35.9 0.2 31.7 0.0 528.0 216.1 251.3 0.0 29.6 0.0 27.2 0.0 524.2 208.0 51.0 0.0 26.4 0.0 9.1 0.0 294.6 784.0 591.3 1.6 119.6 0.4 80.7 0.6 1,578.1 Amfleet Programs Acela Programs Superliners Locomotives Horizon/Surfliner Programs Viewliner Programs General Safety & Reliability Mandatory Projects Wrecks Fleet Overhauls 38.8 62.9 0.0 1.2 1.6 0.0 8.4 1.0 0.0 113.9 41.8 52.7 0.9 0.4 0.1 0.0 11.8 4.1 4.1 115.9 32.0 46.8 0.8 0.5 0.1 0.0 9.1 4.1 4.1 97.5 26.7 0.0 0.0 0.5 0.1 0.0 4.9 4.1 4.1 40.5 33.1 0.0 0.0 0.5 0.2 0.0 4.9 4.1 4.1 47.0 172.4 162.3 1.7 3.1 2.1 0.0 39.2 17.5 16.5 414.8 Software Operations Foundation Hardware Back Office Support Technology Systems 55.3 11.8 11.3 0.1 78.6 39.2 27.2 3.1 0.6 70.0 91.8 24.2 16.7 0.3 133.0 60.8 25.3 10.5 0.3 96.8 41.5 11.1 12.1 0.3 65.1 288.5 99.5 53.7 1.7 443.5 Special Programs Gateway Program 13.0 13.0 19.0 19.0 79.0 79.0 72.0 72.0 205.0 205.0 388.0 388.0 Safety / Mandates Environmental Remediation 6.0 6.0 9.8 9.8 0.0 0.0 0.0 0.0 0.0 0.0 15.8 15.8 Special Programs Rolling Stock Acquisition 4.8 4.8 0.0 0.0 8.7 8.7 8.9 8.9 12.7 12.7 35.0 35.0 ADA Stations Safety / Mandates ADA Compliance 0.0 9.4 9.4 0.0 6.5 6.5 15.0 5.5 20.5 15.0 5.5 20.5 15.0 5.5 20.5 45.0 32.5 77.5 General Capital / Amtrak Operating Profits - NEC [a] 573.4 734.9 1,573.0 1,692.0 1,650.0 6,223.3 Department of Homeland Security Hudson Yards Concrete Encasement Grant NY-NJ High Speed Rail Grant Railroad Rehabilitation & Improvement Financing Sandy Capital Relief Appropriation State, Local, and Other Funds Total Capital - Northeast Corridor 21.9 115.7 64.1 89.7 5.2 125.6 $995.6 8.5 60.7 134.7 198.1 0.0 249.3 $1,386.2 5.9 0.0 107.6 179.3 0.0 283.4 $2,149.2 6.0 0.0 29.3 120.6 0.0 307.4 $2,155.3 6.0 0.0 0.0 100.0 0.0 134.9 $1,890.9 48.2 176.4 335.7 687.8 5.2 1,100.6 $8,577.2 573.4 0.0 $573.4 445.3 289.6 $734.9 1,274.2 298.8 $1,573.0 1,385.7 306.3 $1,692.0 1,336.0 314.0 $1,650.0 5,014.6 1,208.7 $6,223.3 NOTE: [a] Fund Sources for these Programs are: General Capital Amtrak Operating Profits - NEC General Capital / Amtrak Operating Profits - NEC 55 Measuring the Success of the NEC Investment Amtrak’s updated Strategic Plan, which covers Fiscal Years 2014 – 2018, establishes Corporate Goals which are measured by key performance indicators. The following goals have been established for the NEC Business Line. Definitions of the measurements are found in Appendix I. Exhibit 4-4 – Statistics and Key Performance Indicators – Northeast Corridor Measurement Safe-to-Safer Contact Rate 60-day Personnel-Related Category Praise-to-Complaint Ratio FY2014 FY2015 FY2016 FY2017 FY2018 78% 78% 78% 78% 78% 16.3% 16.8% 17.3% 17.8% 18.3% The method of ga theri ng cus tomer feedba ck i s mi gra ting from pa per to di gi tal , whi ch wi l l cha nge the popul a tion of res pondents . Ta rgets ca nnot be es tabl i s hed until Amtra k ha s experi ence wi th the new methodol ogy. Customer Satisfaction Index (CSI) 80% Endpoint On-Time Performance 83% 84% 85% 86% 87% Cost Recovery Ratio 140% 144% 147% 151% 155% Food & Beverage Direct Cost Recovery 101% 102% 102% 103% 103% 56 Section 5: State Supported Corridors Business Line Overview The state-supported corridors have become a major source of ridership growth, with ridership almost doubling between 1998 and 2013. Today, nearly half of the passengers who ride an Amtrak train ride a state-supported train. The frequency of service on these routes can vary from as few as two to as many as 32 trains a day, and each has developed, in close partnership with the sponsoring State, to fill a specific transportation need on 29 routes, each less than 750 miles in length. Over the course of the past year, Amtrak has worked closely with its State partners to implement the cost-sharing mandates established by Section 209 of PRIIA. Section 209 requires the states to assume a larger and consistent share of the costs associated with each service, and their willingness to do so has allowed Amtrak to preserve every single state-supported service – a testament to the value these trains provide to the communities they serve. To manage these services, the General Manager will be responsible for the financial and operating performance of these services and for sustaining Amtrak as the provider of choice for short-distance intercity rail transportation in markets where a state government is interested in partnering with Amtrak. This will entail positioning Amtrak for growth in the years ahead – both by focusing on providing more cost-effective and market-competitive service, and by building relationships with current and potential state partners. The General Manager will be responsible for such partnership initiatives as the implementation of Section 209 and the introduction of next generation passenger equipment in partnership with the states, as provided for in Section 305 of PRIIA. While the 209 process has secured state support for the majority of operating expenses, Amtrak will still require Federal operating support for these trains in the foreseeable future. The State Supported Corridors Business Line consists of the following Amtrak routes: Pacific Surfliner Capitol Corridor San Joaquin Vermonter New Haven-Springfield Washington-Lynchburg Washington-Newport News Washington-Norfolk Washington-Richmond Carolinian Chicago-St. Louis (Lincoln Service) Hiawatha Wolverine Chicago-Carbondale (Illini/Saluki) Chicago-Quincy (IL Zephyr/Carl Sandburg) Blue Water Hoosier State Pere Marquette Downeaster Kansas City-St. Louis (MO River Runner) Piedmont Keystone Pennsylvanian Ethan Allen Albany-Niagara FallsToronto Empire (NYP-ALB) Adirondack Heartland Flyer Cascades Maple Leaf Business Plan Discussion – State Supported Corridors With the implementation of PRIIA 209 and organization of the new Business Lines the main focus has been to define, develop and implement the vision, mission and objectives of the new State Supported Corridors. With this goal, the leadership of the State Supported Corridors has been working tirelessly to provide service, build a future consistent PRIIA 209, the State partners and riding public. With this in mind, the State Supported Corridors Business Line strives to deliver the following mission: 57 To position Amtrak as the provider of choice for short-distance intercity rail transportation. Committed to offering safe, convenient and reliable intercity passenger rail related services that exceed customer expectations and contribute to economic, environmental and social well-being of the communities. Delivery of this mission will be accomplished by following the Strategy Map established for the State Supported Corridors Business Line. The numbering references in this Strategy Map are aligned with the Corporate Strategy Map depicted in Exhibit 1-3. Exhibit 5-1 –State Supported Corridors Strategy Map Reduce Business Line Operating Ratio (F1) Maximize Revenue (F2) Improve Custodianship of State Supported Operating Costs (F3) Amtrak receives funding from 18 States under 19 Operating Agreements in support of 29 short distance (less than 750 miles) routes. Our managers will be conversant with State operating agreements and will work together to explore opportunities with our State partners for improved financial performance or increased revenue. Customers – Provide a safe, reliable, hassle free and convenient travel option that consistently meets passenger travel needs (C1) Equipment and facilities will be clean and in a state of good repair. Employees will be friendly, courteous and helpful and the operating team will have a sense of urgency to move our passengers where they want to go safely and on time. 58 State/Commuter Partners – Provide quality, dependable, cost-efficient rail passenger service that meets the connectivity needs for each State (C2) Amtrak will meet or exceed services established in State and Commuter Operating Agreements to gain a competitive edge over other potential service providers. Long-Distance Business Line – Provide service and support to long-distance routes in order to successfully meet objectives (C3) The State Supported Corridors Business Line will partner with the Long-Distance Business Line to provide services and support of Long-Distance strategic objectives. Deliver a clean, pleasant, and reliable travel experience with onboard amenities that meet customer expectations (S1) Employees will meet or exceed customer services standards and we will work with State and Amtrak partners to provide Wi-Fi, interactive station signage (PIDS) and new onboard information systems where applicable and within the financial means of our State partners. Ensure compliance with State operating agreement requirements including standard reporting and performance measurements, and transparent and accurate cost allocation to routes (S2) Clearly define and then implement performance measurements that are important to the State partners. Educate and guide employees on accurate coding and capture of costs and its importance to accurate and consistent financial relationships with the State partners. Continuously improve a culture of safety and security (S3) Provide opportunities for training and support employee participation in the Safe-2-Safer Observation program. Provide employees with a clear understanding of Corporate safety strategy and management. Drive accountability and good stewardship for Operating Agreements for each Route (S4) Improve the understanding and accountability of managers delivering the day-to-day services defined by the State Supported Corridors Operating Agreements to ensure the operational and financial terms of the agreements are met. Provide transparent and understandable definitions of the methodologies used to assign costs to State Supported Corridor routes (S5) Provide State partners with a clear understanding and definition of the activities that drive the financial performance of State Supported Corridors. Seek opportunities to involve State partners in decisions that affect the performance of the routes they support. Develop, acquire and retain talent that will deliver on our mission (T1) Work to align the talent and the organizational structure to ensure success. Measures include cross-training employees to accommodate succession plans and future needs and mentoring and coaching managers to improve accountability. Enable talent with technology for productivity, agility and customer intimacy (T2) Leadership takes seriously the needs to understand areas of risk to the success of this mission and develop plans to mitigate the following potential risks: • • • PRIIA Sections 209 and 305 Competition Brand Erosion 59 • • Inconsistencies Loss of Credibility Reorienting the culture and building the needed processes for the State Supported Corridors and the rest of Amtrak to succeed by maximizing the resources available will be a significant challenge in the upcoming five years. In the course of the next year, Amtrak is striving to identify specific initiatives to deliver the stated objectives. In addition, Amtrak is focusing on what can be done to measure the initiatives success and therefore, the performance toward the stated mission. The intent is to have a clear, measurable and performance driven organization. This will not be without challenges, cultural changes and some set-backs. However, Amtrak is committed to succeeding as the provider of choice for short-distance intercity rail transportation. State Supported Corridors Five Year Financial Summary The State Supported Corridors Business Line requires Federal support for both operations and capital. In addition to Federal investment, the State-Supported fleet benefits from capital contributions defined under PRIIA Section 209. Descriptions of the capital programs can be found in Appendix VII. 60 Exhibit 5-2 – Five Year Projected Operating Results, State Supported Corridors $ millions FY2014 FY2015 FY2016 FY2017 FY2018 $498.0 23.0 246.6 3.3 0.5 5.6 777.1 $515.8 23.3 250.4 3.4 0.5 5.7 799.1 $535.8 23.7 254.2 3.6 0.5 5.7 823.6 $554.0 24.0 258.1 3.7 0.5 5.7 846.1 $574.2 24.4 262.1 3.9 0.5 5.8 870.8 Direct Labor Train & Engine Crew Labor On Board Service Labor and Support Total Direct Labor 120.1 27.3 147.4 124.2 28.0 152.2 128.2 28.8 157.0 132.3 29.6 161.9 136.9 30.4 167.3 Other Direct Costs Host Railroad Maintenance of Way Host Railroad Performance Incentives Fuel and Power Commissary Provisions and Management Car & Locomotive Maintenance and Turnaround Commissions Reservations and Call Centers Connecting Motor Coach Stations - Route Total Other Direct Costs 35.5 28.8 76.5 14.6 103.4 10.2 31.4 32.4 14.3 347.1 35.0 25.6 75.7 14.8 104.8 10.2 32.6 32.4 14.7 345.8 35.0 23.0 75.7 15.0 106.5 10.2 33.8 32.4 15.1 346.8 35.1 20.5 75.8 15.2 108.1 10.2 35.1 32.4 15.5 347.9 35.1 17.7 75.8 15.4 110.0 10.2 36.4 32.4 16.0 349.0 Total Direct Costs 494.4 498.0 503.7 509.8 516.3 Contribution/(Loss) after Direct Costs 282.6 301.1 319.8 336.3 354.5 Shared Costs Stations - Shared MoE Supervision Training and Overhead MoW Support Yard Operations Marketing and Distribution Police/Environmental and Safety T&E Overhead and Operations Management Casualty, FELA, and other Claims Data Processing Services Communication Property Insurance Other General and Administrative Total Shared Costs 60.3 71.4 38.3 17.9 21.8 20.0 45.5 15.8 28.0 8.2 12.0 64.7 404.1 62.1 72.1 38.7 18.4 21.8 20.6 46.6 17.7 28.0 8.2 14.0 72.9 421.3 63.9 73.7 39.2 19.0 22.1 21.2 48.2 17.7 28.0 8.2 14.0 75.2 430.6 65.8 75.2 39.8 19.6 22.4 21.8 49.9 17.7 28.0 8.2 14.0 77.7 440.1 67.8 77.1 40.4 20.2 22.8 22.4 51.7 17.7 28.0 8.2 14.0 80.2 450.7 SubTotal Direct and Shared Costs 898.5 919.2 934.3 949.9 967.0 Net Operating Income/(Loss) - GAAP (121.4) (120.2) (110.7) (103.8) (96.2) 20.5 21.6 20.6 19.0 17.9 (100.9) (98.6) (90.1) (84.7) (78.3) 0.1 12.1 0.4 15.0 0.8 13.6 1.2 12.2 1.6 10.2 ($88.6) ($83.2) ($75.7) ($71.3) ($66.4) Revenue Ticket Revenue, net Food and Beverage Revenue State Revenue Reimbursable Revenue Other Transportation Freight Access Fees & Other Total Operating Revenue Direct Costs Adjustments to GAAP [a] Adjusted Net Operating Income/(Loss) [b] - State Supported Routes Profit/(Loss) of Managed Commuter Operations Profit/(Loss) of Managed Reimbursable Operations Adjusted Net Operating Income/(Loss) [b] [a] Adjustments to GAAP are made to exclude costs and revenue that do not impact Amtrak's need for Federal operating support. Items excluded are costs for Amtrak's Office of the Inspector General (funded independently), non-capitalizable costs and certain contributions associated with capital projects (funded by capital appropriation), net interest expense (funded by debt service appropriation), depreciation (non-cash expense), and accruals for estimated future postretirement employee benefits (non-cash expense). [b] Adjusted Net Operating Income/(Loss) represents cash contributions or need for Federal operating support 61 Exhibit 5-3 – Five Year Projected Capital Investment by Program, State Supported Corridors FY2014 FY2015 FY2016 FY2017 FY2018 5 Year Total SOGR Base Major Projects Safety / Mandates Support Equipment and Vehicles Improvements Amtrak Support Infrastructure Renewal $9.0 1.6 1.2 0.1 0.3 0.0 12.2 $10.6 0.6 0.2 0.0 0.6 0.0 12.1 $12.1 0.7 0.2 0.0 0.2 0.0 13.2 $13.3 4.0 0.1 0.0 0.1 0.0 17.5 $18.6 5.3 0.2 0.0 0.1 0.0 24.1 $63.5 12.2 2.0 0.1 1.3 0.0 79.1 SOGR Base Major Projects Safety / Mandates Improvements Amtrak Support NEC Master Planning Support Equipment and Vehicles Stations and Facilities 2.5 0.5 0.1 1.3 0.0 0.0 0.0 4.4 2.5 0.0 0.0 3.5 0.0 0.3 0.0 6.2 4.7 0.0 0.0 1.2 0.0 1.0 0.0 7.0 4.8 0.0 0.0 2.7 0.0 0.9 0.0 8.3 4.7 0.0 0.0 2.5 0.0 0.2 0.0 7.4 19.2 0.5 0.1 11.2 0.0 2.4 0.0 33.4 Amfleet Programs General Safety & Reliability Mandatory Projects Wrecks Fleet Overhauls 0.2 0.2 0.1 0.0 0.5 0.0 0.4 0.3 0.3 1.1 0.0 0.4 0.3 0.3 1.1 0.0 0.4 0.3 0.3 1.1 0.0 0.4 0.3 0.3 1.1 0.2 1.9 1.4 1.4 4.9 Software Hardware Back Office Support Technology Systems 2.5 0.8 0.0 3.3 0.3 0.1 0.0 0.4 2.0 1.1 0.0 3.2 2.0 0.6 0.0 2.6 1.1 0.8 0.0 1.9 7.8 3.4 0.1 11.4 Special Programs Gateway Program 0.8 0.8 0.0 0.0 0.0 0.0 0.0 0.0 0.0 0.0 0.8 0.8 Safety / Mandates Environmental Remediation 0.1 0.1 0.3 0.3 0.0 0.0 0.0 0.0 0.0 0.0 0.3 0.3 Special Programs Rolling Stock Acquisition 0.4 0.4 0.0 0.0 0.0 0.0 0.0 0.0 0.0 0.0 0.4 0.4 Safety / Mandates ADA Compliance 0.3 0.3 0.0 0.0 0.5 0.5 0.5 0.5 0.5 0.5 1.6 1.6 General Capital - State Supported 22.0 20.0 25.0 30.0 35.0 132.0 1.5 1.8 1.8 40.2 0.1 47.9 $115.4 0.9 1.0 3.7 70.1 0.0 59.7 $155.5 0.7 0.0 3.0 64.8 0.0 52.1 $145.7 0.7 0.0 0.8 58.9 0.0 16.5 $106.9 0.7 0.0 0.0 48.4 0.0 3.2 $87.3 4.6 2.8 9.3 282.5 0.1 179.4 $610.8 $ millions Department of Homeland Security Hudson Yards Concrete Encasement Grant NY-NJ High Speed Rail Grant PRIIA 209 Rolling Stock Maintenance Sandy Capital Relief Appropriation State, Local, and Other Funds Total Capital - State Supported 62 Measuring the Success of the State Supported Corridors Investment Amtrak’s updated Strategic Plan, which covers Fiscal Years 2014 – 2018, establishes Corporate Goals which are measured by key performance indicators. The following goals have been established for the State Supported Corridors Business Line. Definitions of the measurements are found in Appendix I. Exhibit 5-4 – Statistics and Key Performance Indicators – State Supported Services Measurement Safe-to-Safer Contact Rate 60-day Personnel-Related Category Praise-to-Complaint Ratio FY2014 FY2015 FY2016 FY2017 FY2018 78% 78% 78% 78% 78% 24.2% 25.4% 26.7% 28.0% 29.4% The method of ga theri ng cus tomer feedba ck i s mi gra ting from pa per to di gi tal , whi ch wi l l cha nge the popul a tion of res pondents . Ta rgets ca nnot be es tabl i s hed until Amtra k ha s experi ence wi th the new methodol ogy. Customer Satisfaction Index (CSI) 87% Endpoint On-Time Performance 83% 84% 85% 86% 87% Cost Recovery Ratio 86% 87% 88% 89% 90% Food & Beverage Direct Cost Recovery 100% 100% 100% 100% 100% 63 Section 6: Long-Distance Services Business Line Overview of Long-Distance Services Amtrak’s fifteen long-distance routes are the backbone of our system. Providing the only Amtrak service to half of the states and stations we serve, these trains are scheduled on a daily or tri-weekly basis, but are nevertheless heavily patronized and vital to the communities and the people they serve. Long-distance trains are, on average, as full on the peak leg of their trips as are the Acela services on the NEC. Their principal mission is connectivity, and it is an increasingly important one to communities that have been losing their bus and air connections at a steady pace over the last decade. These trains connect rural communities with major metropolitan areas, and afford passengers a wide range of destinations – a service that has become increasingly important as air and bus options have contracted in many states. Since 1998, long-distance ridership has grown by roughly 20%, without the introduction of any new services, frequencies, or equipment. Congress expressed its support for maintaining this national passenger rail network when it stated in PRIIA Section 228(b): SENSE OF THE CONGRESS.— It is the sense of the Congress that— (1) long-distance passenger rail is a vital and necessary part of our national transportation system and economy; and (2) Amtrak should maintain a national passenger rail system, including long-distance routes, that connects the continental United States from coast to coast and from border to border The General Manager, Long-Distance is accountable for the financial and operating performance of these services. The General Manager’s core responsibilities include ensuring the effective connectivity of the nation’s major regions through Amtrak’s network of long-distance trains, providing a foundation of intercity passenger rail service and preserving intercity mobility for underserved communities or populations. The General Manager is expected to preserve and improve this network in a manner that demonstrates the highest value for taxpayer investment. The General Manager will also play a key role in the development and execution of Amtrak’s plan, announced late in 2013, to eliminate Amtrak’s food and beverage service deficits. While the long-distance service costs have been offset in recent years by revenues from the Northeast Corridor services, Amtrak is proposing that beginning in FY2015 the Federal Government provide for the totality of their operating need. Like the Northeast Corridor, these routes require significant capital investment, including a large portion for ADA compliance at our stations. The purchase of new rolling stock and overhauls to existing fleet, much of which dates to the early 1980s, likewise requires a large Federal investment. Superliner cars, which are used in long-distance service, may be the hardest-run passenger equipment in North America, with the average car traveling an annual distance equal to seven trips around the world. The Long-Distance Services business line consists of the following Amtrak routes: Crescent Texas Eagle Southwest Chief Sunset Limited California Zephyr Coast Starlight City of New Orleans Lake Shore Limited Silver Star Cardinal Silver Meteor Capitol Limited Palmetto Auto Train Empire Builder 64 Business Plan Discussion – Long-Distance With the inception of the new Business Line organization the main focus has been to define, develop and implement the vision, mission and objectives of the new Long Business Line. With this goal, the leadership of the Long-Distance is working tirelessly to provide service, and reconfigure the LongDistance Service model. This requires a deeper dive into the operations, the business model and a thorough understanding of the market serviced by Long-Distance trains. To accomplish this goal the Long-Distance Business Line strives to deliver the following mission: Connect the nation’s major regions through Amtrak’s network of long-distance trains, providing a foundation of intercity passenger rail service and preserving intercity mobility for underserved communities or populations. Preserve and improve this network in a manner that demonstrates the highest value for taxpayer investment with a commitment to excellence in safety, customer service and experience, host railroad partner relationships and cost and revenue management. Delivery of this mission will be accomplished by following the Strategy Map established for the LongDistance Business Line. The numbering references in this Strategy Map are aligned with the Corporate Strategy Map depicted in Exhibit 1-3. Exhibit 6-1 – Long-Distance Strategy Map Reduce the Long-Distance operating ratio (F1) Maximize revenue (F2) Optimize operating costs (F3) 65 Provide highly personalized, concierge type travel experience (C1) A memorable individualized travel experience is consistently delivered by proactive employees, high-quality equipment and enabling technology. Employees, equipment and technology focus on the customer’s comfort, entertainment, service and safety of their journey. Amtrak will focus on distinguishing the sleeper service customer’s experience from that of a coach customer. Provide a clean, comfortable, affordable trip (C2) Amtrak will provide a trip in an environment that is clean, both at the beginning and the end of the trip, including restrooms; comfortable, as a result of outstanding equipment and employees; and affordable, delivering value by offering larger seats than buses and lower fares than airlines. Provide shorter coach trips competitive with other travel modes (C3) Long-Distance will develop services for city pairs less than 750 miles aboard LongDistance trains to serve markets not currently served by a State-Supported Corridor. By providing premium service to these customers, such as beverage service, newspapers, early boarding and Wi-Fi, Amtrak will become a more appealing alternative to competitive modes of transportation and will increase revenue with minimal investment. Provide State Supported Corridor route services that meet State partner objectives (C4) The Long-Distance Business Line is responsible for the day-to-day operations of several State-Supported routes, including the Blue Water, Hiawatha, Heartland Flyer, Hoosier State, Illini-Saluki, Illinois Zephyr-Carl Sandburg, Lincoln Service, Pere Marquette, River Runner, and Wolverines. Long-Distance will maintain positive and productive relationships with partners in the State Supported Business Line to operate these trains with the goal of achieving their strategic objectives, and work to provide competitive trip times, on time performance, and good communications within Amtrak and with State DOTs. Define and consistently deliver high-quality customer experience (S1) Long-Distance will establish customer service standards and principles for all of the different services and lines that we provide. Every employee will be trained in hospitality and embody a spirit of excellence. Processes and policies will be put in place to ensure personnel can uphold the defined standards. Quality assurance and performance management programs and processes are in place to ensure that targeted customer experience outcomes are achieved. Optimize the network by providing products & services focused on the target customer (S2) In order to drive down cost and better serve Amtrak’s varying customer groups, including Long-Distance coach passengers, sleeper passengers, and corridor passengers, LongDistance will strive to optimize routes and equipment usage. We will identify opportunities to serve new groups of customers and existing customers better, through a review and refurbishment of existing Long-Distance services, potentially including new routes, more frequent routes, or additional on-board services. Continuously improve a culture of safety and security (S3) Drive productivity & quality through process improvement (S4) Long-Distance will regularly review the results of established practices and processes to measure their effectiveness, and will investigate alternative ideas and measures to see how 66 they compare to current processes. This will not only include standards for facilities and equipment maintenance and cleanliness, but will incorporate terminal operating plans and procedures in order to drive overall turnaround time and efficiency. Clearly define measurable financial targets and provide transparent performance reporting (S5) Establish measures and realistic targets that are actionable, meaningful, and are aligned to targeted financial and customer goals. The information provided will be accurate, timely, communicated and readily available to understand results, perform analysis, and drive performance. Align the organization to achieve Long-Distance business outcomes (S6) Aggressively redesign service delivery model (S8) Evaluate innovative and bold alternatives to components the service delivery model based on a goal of significantly reducing operating loss over the upcoming years. This may include new products, dramatic reduction in resource waste, new partnerships. Changes will be supported with strong employee engagement (Zephyr/Wall of Fame), awareness and auditing of costs to ensure progress toward our goal. Specific strategies are being developed and financial targets will be included in future financial plans. Acquire, develop, & retain best-fit talent (T1) Place empowered, motivated and highly skilled employees in the right roles, who understand the core business and who contribute to achieving the company’s strategic objectives. To accomplish this, a full range of world-class HC tools must be in place, such as organizational design, clear roles and job descriptions, timely, effective selection and hiring processes, career and succession planning, and performance management and compensation programs linked to our strategy. Create stewardship through empowerment (T2) All employees are willing to be held accountable for the well-being of the product, assets and revenue of our company by creating and embracing a culture of service to the customer, each other and external partner by openly sharing information and enabling each employee the authority to meet the needs of their customers. Long-Distance employees will share information, listen to each other, encourage risk taking and accountability, provide proactive and consistent on-the-job communication and live up to Amtrak’s leadership standards. Enable talent with technology for productivity, agility and customer focus (T3) To deliver this mission and objectives the Long-Distance business line has been organized in such a manner as to include the following: Deputy General Managers – oversee regional portfolios of routes and stations. This includes direct responsibility for the financial, operational, customer satisfaction, ridership and revenue, safety and overall business goals in his area of responsibility. This includes accountability for profit and loss of the several routes and stations by overseeing all field operations and directing business planning and decision-making. 67 Route Operations – operate passenger rail routes, managing train service crews, customer service staff, stations, and support services. This includes the new position of Route Director which is directly responsible for one or more long-distance train routes including financial, customer satisfaction, ridership and revenue, safety and overall business line goals. The route directors are fully responsible for profit and loss of their route(s) by directing business planning and decision-making. Major terminals – operate major passenger terminals including Chicago, Los Angeles, Miami, and New Orleans. Operate crew bases, provide for service and inspection, running repairs, train makeup, and customer service operations for Long-Distance and other business lines. Leadership takes seriously the need to understand areas of risk to this mission and to develop plans that mitigate the following risks: • • • • • PRIIA Inconsistent Customer Service Brand Erosion Federal / National Support (lack funding and congressional support) Host Railroad Access/Issues Reorienting the culture and building the needed processes for Long-Distance and the rest of Amtrak to succeed by maximizing the resources available will be a significant challenge in the upcoming five years. In the course of the next year, Amtrak is striving to identify specific initiatives to deliver the stated objectives. In addition, Amtrak is focusing on what can be done to measure the initiatives success and therefore, the performance toward the stated mission. This will not be without challenges, cultural changes and some setbacks. However, Amtrak is committed to succeeding in providing a foundation of intercity passenger rail service and preserving intercity mobility for underserved communities or populations. Long-Distance Five Year Financial Summary The Long-Distance Business Line requires Federal support for both operations and capital. Descriptions of the capital programs can be found in Appendix VII. 68 Exhibit 6-2 – Five Year Projected Operating Results, Long-Distance $ millions FY2014 FY2015 FY2016 FY2017 FY2018 $507.0 61.6 0.1 2.0 6.4 577.1 $524.4 62.4 0.1 2.0 6.4 595.4 $550.9 64.8 0.1 2.0 6.5 624.3 $568.1 65.6 0.1 2.0 6.5 642.4 $587.3 66.6 0.1 2.0 6.6 662.7 Direct Labor Train & Engine Crew Labor On Board Service Labor and Support Total Direct Labor 136.3 119.9 256.2 142.3 121.8 264.1 148.2 126.3 274.5 154.3 130.9 285.2 161.0 135.9 296.9 Other Direct Costs Host Railroad Maintenance of Way Host Railroad Performance Incentives Fuel and Power Commissary Provisions and Management Car & Locomotive Maintenance and Turnaround Commissions Reservations and Call Centers Connecting Motor Coach Stations - Route Total Other Direct Costs 42.4 14.0 142.6 58.4 129.2 15.1 35.9 5.7 20.3 463.7 42.1 10.0 140.7 58.6 130.6 15.1 37.3 5.7 20.9 461.1 42.2 9.3 141.8 59.0 132.4 15.3 38.7 5.7 21.6 465.9 42.2 8.7 141.8 59.4 134.3 15.3 40.1 5.7 22.2 469.7 42.3 8.0 141.8 59.8 136.3 15.3 41.6 5.7 22.9 473.7 Total Direct Costs 719.9 725.2 740.4 754.9 770.6 Contribution/(Loss) after Direct Costs (142.8) (129.9) (116.1) (112.5) (108.0) Shared Costs Stations - Shared MoE Supervision Training and Overhead MoW Support Yard Operations Marketing and Distribution Police/Environmental and Safety T&E Overhead and Operations Management Utilities Casualty, FELA, and other Claims Data Processing Services Communication Property Insurance Other General and Administrative Total Shared Costs 55.0 114.4 37.5 23.5 26.3 25.9 48.2 0.6 23.4 41.1 12.1 18.5 81.2 507.7 56.6 116.3 37.7 24.6 26.2 26.6 49.8 0.6 26.4 41.1 12.1 21.4 86.8 526.3 58.2 119.6 38.0 25.3 26.5 27.4 51.7 0.6 26.4 41.1 12.1 21.6 108.0 556.5 59.8 122.7 38.4 26.0 26.8 28.1 53.7 0.6 26.4 41.1 12.1 21.6 109.0 566.4 61.6 126.6 38.8 26.8 27.1 29.0 55.9 0.6 26.4 41.1 12.1 21.6 111.1 578.7 SubTotal Direct and Shared Costs 1,227.6 1,251.5 1,296.9 1,321.3 1,349.3 Net Operating Income/(Loss) - GAAP (650.5) (656.2) (672.6) (678.9) (686.7) 28.3 29.9 28.4 26.1 24.4 (622.1) (626.3) (644.1) (652.8) (662.3) 7.4 0.0 7.9 0.0 8.8 0.0 9.6 0.0 10.5 0.0 ($614.7) ($618.3) ($635.3) ($643.1) ($651.8) Revenue Ticket Revenue, net Food and Beverage Revenue Reimbursable Revenue Other Transportation Freight Access Fees & Other Total Operating Revenue Direct Costs Adjustments to GAAP [a] Adjusted Net Operating Income/(Loss) [b] - Long-Distance Routes Profit/(Loss) of Managed Commuter Operations Profit/(Loss) of Managed Reimbursable Operations Adjusted Net Operating Income/(Loss) [b] [a] Adjustments to GAAP are made to exclude costs and revenue that do not impact Amtrak's need for Federal operating support. Items excluded are costs for Amtrak's Office of the Inspector General (funded independently), non-capitalizable costs and certain contributions associated with capital projects (funded by capital appropriation), net interest expense (funded by debt service appropriation), depreciation (non-cash expense), and accruals for estimated future post-retirement employee benefits (non-cash expense). [b] Adjusted Net Operating Income/(Loss) represents cash contributions or need for Federal operating support 69 Exhibit 6-3 – Five Year Projected Capital Investment by Program, Long-Distance FY2014 FY2015 FY2016 FY2017 FY2018 5 Year Total SOGR Base Major Projects Safety / Mandates Support Equipment and Vehicles Improvements Amtrak Support Infrastructure Renewal $9.6 2.5 1.7 0.1 0.3 0.0 14.2 $10.9 1.0 0.2 0.0 0.6 0.0 12.8 $30.0 1.1 0.2 10.0 2.2 0.0 43.5 $25.2 6.3 0.2 1.1 2.0 0.0 34.8 $25.3 8.4 0.3 0.0 1.5 0.0 35.4 $100.9 19.3 2.6 11.2 6.6 0.0 140.7 SOGR Base Major Projects Safety / Mandates Improvements Amtrak Support NEC Master Planning Support Equipment and Vehicles Stations and Facilities 2.3 0.3 0.1 1.2 0.0 0.0 0.1 4.1 3.0 0.0 0.0 3.0 0.0 0.5 0.0 6.5 12.1 0.0 0.0 37.0 1.4 2.0 0.0 52.5 11.5 8.3 0.0 40.2 2.4 1.7 0.0 64.2 11.7 8.3 0.0 35.0 18.8 0.4 0.0 74.2 40.6 17.0 0.1 116.5 22.7 4.6 0.1 201.5 Amfleet Programs Superliners Locomotives Horizon/Surfliner Programs Viewliner Programs General Safety & Reliability Mandatory Projects Heritage Programs Wrecks Fleet Overhauls 11.4 54.7 18.9 1.2 7.5 0.4 0.1 0.6 0.0 94.9 0.7 57.5 20.3 0.1 7.8 0.6 0.5 0.0 0.5 88.1 31.0 49.9 22.5 0.2 8.7 0.6 0.5 0.0 0.5 114.2 17.5 53.7 23.0 0.4 8.9 0.6 0.5 0.0 0.5 105.3 18.2 62.6 18.5 0.1 8.5 0.6 0.5 0.0 0.5 109.7 79.0 278.3 103.3 2.1 41.5 3.0 2.3 0.6 2.2 512.2 Software Operations Foundation Hardware Back Office Support Technology Systems 3.9 0.0 1.2 0.0 5.1 0.5 0.0 0.1 0.1 0.6 2.6 0.0 11.2 0.0 13.8 2.8 0.0 11.0 0.0 13.8 1.7 0.0 1.0 0.0 2.7 11.4 0.0 24.4 0.2 36.0 Special Programs Gateway Program 1.2 1.2 0.0 0.0 0.0 0.0 0.0 0.0 0.0 0.0 1.2 1.2 Safety / Mandates Environmental Remediation 2.5 2.5 1.3 1.3 0.0 0.0 0.0 0.0 0.0 0.0 3.8 3.8 Special Programs Amtrak Support Rolling Stock Acquisition 74.0 0.1 74.1 135.5 0.0 135.5 4.0 0.0 4.0 0.0 0.0 0.0 0.0 0.0 0.0 213.5 0.1 213.6 ADA Stations Safety / Mandates ADA Compliance 38.3 0.4 38.7 50.0 0.0 50.0 56.3 0.7 57.0 56.3 0.7 57.0 56.3 0.7 57.0 257.1 2.6 259.6 General Capital - Long Distance 234.9 294.9 285.0 275.0 279.0 1,368.7 Department of Homeland Security Hudson Yards Concrete Encasement Grant NY-NJ High Speed Rail Grant Sandy Capital Relief Appropriation State, Local, and Other Funds Total Capital - Long Distance 2.9 2.5 2.8 0.2 14.4 $257.6 1.5 1.3 5.9 0.0 11.1 $314.6 1.0 0.0 4.8 0.0 8.7 $299.5 1.1 0.0 1.3 0.0 8.7 $286.1 1.1 0.0 0.0 0.0 4.6 $284.7 7.6 3.7 14.8 0.2 47.5 $1,442.5 $ millions 70 Food and Beverage Improvement Amtrak has committed to eliminating the loss associated with providing Food and Beverage services on-board trains within the next five years. In doing so, Amtrak is aggressively reviewing the service model to identify opportunities to reshape the business model that addresses the customer’s needs and the financial realities of providing such service. As result a thorough and intense review is underway of, but not limited to, the following: Labor optimization – aligning staffing with ridership and customer demand and exploring more efficient alternative service models that will significantly reduce labor expenses On-board Logistics – reduce spoilage and loss, re-evaluate amenities offered and ensure that the full value is included in pricing, optimize on-board stock levels, and redefine and standardize service levels. Product Development and Supply Chain – optimize product portfolio through the cross utilization of products, improved placement of consumer relevant products that drive sales, customer participation and revenue, and maximization of National Volume Discounts. In addition we are exploring vending and micro market options on certain services either as a replacement to the current model on low volume services or to augment the current model on high volume services. Training – engage labor in revenue enhancement and cost control initiatives and enforce loss prevention measures. Ticket Revenue – align the perceived value of F&B services with revenue collected. Technology Enhancements and Policy Improvements – complete implementation of point of sale system, pilot cashless sales on select services, develop and implement sales based accounting system to eliminate labor intensive inventory tasks, and evaluate ways to leverage new technology in decision support. The Food and Beverage improvement strategy is under development. Incremental improvements will reduce expenses in FY2014 and additional actions will be taken in subsequent years to significantly reduce the loss. More significant transformational changes may require the issuance of Requests for Information, Request for Proposals, collaboration with labor, and changes to rolling stock over a longer period of time. Accordingly, the current financial projections only include those actions that have taken place in FY2014 and are planned for in FY2105. 71 Exhibit 6-4 – Food and Beverage Initiatives $ millions FY2014 Annualized $2.4 $4.1 IP 3.2 $0.4 0.6 $0.4 1.7 0.24 IP 0.12 IP 0.24 IP 0.74 IP $0.25 0.1 $0.25 1.0 0 IP 0.6 IP IP 0 IP IP 0 IP IP IP 0 0.586 IP 0 IP 2.7 IP IP IP IP 0 0 0.3 9.5 $4.2 $25.4 Labor Optimization Align the food and beverage service model w ith variations in ridership, customer demand, and financial performance for each route. Collaborate w ith Long Distance Route Directors to develop new service delivery model for City of New Orleans, Capitol Limited, and Texas Eagle. On-Board Service and Logistics Develop and implement new policies to reduce system w ide spoilage. Evaluate cost/benefit of amenities on all long distance services and recommend common portfolio for all services. Optimize on-board stocking levels (PAR management). Allow employees to sell expiring goods at reduced prices at the end of the trip. Increase aw areness of support items expense and accountability. Define standardized service levels for dining car service and ensure delivery of same. Product Development and Supply Chain Optimize supply chain, increase national volume discounts (NVDs), and consolidate distributors. Optimize product portfolio to reduce stock keeping units (SKUs), increase cross utilization of products, gain efficiencies and speed of food production. Negotiate ARAMARK contract extension to reduce w arehouse management costs. Develop concept and design plans to pilot vending service on select route(s). Training Rewards and Accountability Develop performance measures and metrics for assessing OBS sales performance in (CSPMI). Implement and enforce loss prevention (LP) measures and improve accountability. Engage the support of labor (ASWC) and Business Line Leadership to develop incentive programs to rew ard high sales performers. Ticket Revenue Allocation Ensure that the financial impact of complimentary items is considered w hen developing the price accommodations and that the corresponding revenue transfer is completed. Implement policy to charge personal pass riders for dining car service w hen travelling on Auto Train. Pilot de-linking of sleeper and meal service. Pilot pre-paid dining car service for coach class. Technology Enhancements and Process Improvements Develop food and beverage cost and revenue data by train, car, and departure day to reduce the reliance on allocated financial data to make tactical decisions. Develop and implement a sales based accounting system that w ill reduce labor intensive manual inventory processes and focus OBS employees on sales and service. Pilot cashless sales on select trains. Implement POS on all café/lounge services. Total IP = In Process 72 Measuring the Success of the Long-Distance Investment Amtrak’s updated Strategic Plan, which covers Fiscal Years 2014 – 2018, establishes Corporate Goals which are measured by key performance indicators. The following goals have been established for the Long-Distance Business Line. Definitions of the measurements are found in Appendix I. Exhibit 6-5 – Statistics and Key Performance Indicators – Long-Distance Services Measurement Safe-to-Safer Contact Rate 60-day Personnel-Related Category Praise-to-Complaint Ratio FY2014 FY2015 FY2016 FY2017 FY2018 78% 78% 78% 78% 78% 50.3% 52.8% 55.5% 58.2% 61.1% The method of ga theri ng cus tomer feedba ck i s mi gra ting from pa per to di gi tal , whi ch wi l l cha nge the popul a tion of res pondents . Ta rgets ca nnot be es tabl i s hed until Amtra k ha s experi ence wi th the new methodol ogy. Customer Satisfaction Index (CSI) 82% Endpoint On-Time Performance 62% 65% 68% 71% 75% Cost Recovery Ratio 50% 50% 50% 50% 50% Food & Beverage Direct Cost Recovery 48% TBD 49% TBD 49% 50% TBD TBD 50% 73 Section 7: Corporate Development Business Line Overview of Corporate Development Business Line The final business line is the creation of a Corporate Development Business Line (CDBL). A formal charter for CDBL is currently being developed. The mission of CDBL is to leverage Amtrak assets to gain strategic and financial value for the corporation, and our strategy is to invest in growth of this business, including the development of High-Speed Rail assets in the NEC and potentially in other corridors. Just like the operating business lines, CDBL will be managed as a business with its own income statement, and focused on maximizing the net returns to Amtrak. These returns would be used to meet unfunded investment needs of the Corporation. Real estate will provide the first part of CDBL's business plan and financial statements, which will expand as the other aspects of this business line develop. In many ways, CDBL is the embodiment of that provision of the law creating Amtrak which directs us to be managed as a for-profit corporation. Real Estate has been part of Amtrak's lines of business since we acquired the Northeast Corridor in 1976. While it has generated significant revenue over the years, its approach has been more tactical than strategic. Looking forward, we need now to look comprehensively at real estate assets and develop strategies that preserve what we need for operations and obtain value from the rest. CDBL will apply objective industry standards to identify opportunities to market our services and other assets. These assets may be products and systems we have developed that others can use, such as eTicketing. Building on its skills, CDBL will help develop strategies to attract capital for investments we need to make to realize the potential of our three operating business lines. The future requires us to develop approaches to partnerships and innovative finance to address such significant investment needs as the Gateway Project. Flowing from its knowledge and familiarity with the best industry practices, CDBL will also have the program planning responsibility to ensure we are effectively using our capital resources. Corporate Development Five Year Financial Summary The CDBL is still in the process of formation. While the organization’s scope is not yet fully defined, it is being designed to create common stewardship, management and development of all of Amtrak’s infrastructure assets across the nation, while also building new capacity to pursue ancillary business opportunities associated with leveraging Amtrak’s unique business assets. In short, CDBL will maximize the value and cash generate of our assets. By early October, 2014, Amtrak will have a better defined business line that will be designed to extract the maximum revenue from other transportation assets of the company. For the purposes of this plan, CDBL financial statements generally represent the revenue and activities of Amtrak’s Real Estate Department. This view of CDBL generates a net profit and does not require Federal operating support. Over the FY2014 – FY2018 five year period, the CDBL will produce $350 million of surplus cash. Beginning with the methodology change in FY2015 this surplus, which totals $319 for the four years beginning with FY2015, will be invested into capital projects rather than subsidizing the operations of other business lines. Descriptions of the capital programs can be found in Appendix VII. 74 Exhibit 7-1 – Five Year Projected Operating Results, Corporate Development $ millions FY2014 FY2015 FY2016 FY2017 FY2018 $0.3 13.2 75.5 0.4 5.9 95.4 $0.6 13.7 76.9 0.4 5.9 97.6 $0.9 14.2 83.3 0.4 6.0 105.0 $1.2 14.7 87.7 0.4 6.0 110.2 $1.5 15.3 92.9 0.5 6.1 116.4 Direct Labor On Board Service Labor and Support Total Direct Labor 0.4 1.2 0.4 1.2 0.4 1.2 0.4 1.2 0.4 1.2 Other Direct Costs Car & Locomotive Maintenance and Turnaround Total Other Direct Costs 1.0 1.5 1.0 1.5 1.0 2.8 1.0 3.9 1.0 5.1 Total Direct Costs 2.7 2.7 4.0 5.1 6.4 Contribution/(Loss) after Direct Costs 92.7 94.9 100.9 105.1 110.0 Shared Costs Stations - Shared MoE Supervision Training and Overhead MoW Support Police/Environmental and Safety Depreciation Casualty, FELA, and other Claims Data Processing Services Communication Property Insurance Other General and Administrative Total Shared Costs 1.1 12.1 8.3 4.0 712.1 0.4 0.4 0.2 0.4 11.1 755.1 1.1 11.8 8.4 4.0 711.2 0.4 0.4 0.2 0.4 11.5 754.5 1.2 11.7 9.0 4.1 710.3 0.6 0.8 0.2 0.6 15.0 758.6 1.3 11.5 9.6 4.2 709.5 0.8 1.1 0.2 0.7 17.9 761.9 1.4 11.4 10.3 4.2 708.5 1.1 1.5 0.2 0.9 21.2 765.8 SubTotal Direct and Shared Costs 757.9 757.3 762.6 767.0 772.2 Interest Expense, Net Federal & State Capital Payments (income) (8.4) (46.8) (8.4) (195.8) (8.4) (195.8) (8.4) (195.8) (8.4) (195.8) Net Operating Income/(Loss) - GAAP (607.3) (455.5) (453.5) (452.6) (451.7) Adjustments to GAAP [a] 684.3 534.4 533.5 532.6 531.7 Adjusted Net Operating Income/(Loss) [b] $77.0 $78.9 $80.0 $80.0 $80.0 Revenue Ticket Revenue, net Reimbursable Revenue Commercial Development Other Transportation Freight Access Fees & Other Total Operating Revenue Direct Costs [a] Adjustments to GAAP are made to exclude costs and revenue that do not impact Amtrak's need for Federal operating support. Items excluded are costs for Amtrak's Office of the Inspector General (funded independently), non-capitalizable costs and certain contributions associated with capital projects (funded by capital appropriation), net interest expense (funded by debt service appropriation), depreciation (non-cash expense), and accruals for estimated future post-retirement employee benefits (non-cash expense). [b] Adjusted Net Operating Income/(Loss) represents cash contributions or need for Federal operating support 75 Exhibit 7-2 – Five Year Projected Capital Investment by Program, Corporate Development FY2014 FY2015 FY2016 FY2017 FY2018 5 Year Total $10.6 1.1 0.1 1.1 13.0 $11.7 7.8 0.6 4.4 24.5 $13.3 8.5 0.0 2.1 23.8 $7.6 0.0 0.0 2.1 9.7 $7.3 0.0 0.0 0.1 7.4 $50.4 17.4 0.7 9.7 78.3 SOGR Base Major Projects Improvements Amtrak Support Stations and Facilities 1.4 0.0 6.7 0.0 8.1 1.9 0.0 32.7 0.0 34.6 13.0 0.0 19.6 2.8 35.4 11.3 16.7 19.0 4.9 51.8 10.3 16.7 17.3 15.3 59.6 37.9 33.4 95.3 23.0 189.5 General Safety & Reliability Fleet Overhauls 0.0 0.0 0.4 0.4 0.0 0.0 0.0 0.0 0.0 0.0 0.4 0.4 Software Operations Foundation Hardware Technology Systems 4.7 3.0 0.6 8.3 7.1 6.8 1.4 15.3 8.2 6.0 2.8 17.1 6.0 6.3 2.4 14.8 5.3 2.8 1.1 9.2 31.4 24.9 8.3 64.6 Safety / Mandates Environmental Remediation 1.5 1.5 2.4 2.4 0.0 0.0 0.0 0.0 0.0 0.0 3.9 3.9 ADA Stations Safety / Mandates ADA Compliance 0.0 1.6 1.6 0.0 1.6 1.6 3.8 0.0 3.8 3.8 0.0 3.8 3.8 0.0 3.8 11.3 3.2 14.5 General Capital /Amtrak Operating Profits - Corporate Development [a] 32.4 78.9 80.0 80.0 80.0 351.3 Department of Homeland Security State, Local, and Other Funds Total Capital - Corporate Development 8.8 1.7 $42.8 2.7 0.0 $81.5 1.8 0.0 $81.8 1.8 0.0 $81.8 1.8 0.0 $81.8 16.9 1.7 $369.8 32.4 0.0 $32.4 0.0 78.9 $78.9 0.0 80.0 $80.0 0.0 80.0 $80.0 0.0 80.0 $80.0 32.4 318.9 $351.3 $ millions SOGR Base Major Projects Support Equipment and Vehicles Improvements Infrastructure Renewal NOTE: [a] Fund Sources for these Programs are: General Capital Amtrak Operating Profits - Corporate Development General Capital /Amtrak Operating Profits - Corporate Development Business Plan Discussion - Corporate Development Strategic planning for the creation of CDBL began in early FY2014 with the objective of creating an organization to manage Amtrak’s corporate assets. This business line is still in the process of formation. While the organization’s scope is not yet fully defined, it is being designed to create common stewardship, management and development of all of Amtrak’s infrastructure assets across the nation, while also building new capacity to pursue ancillary business opportunities associated with leveraging Amtrak’s unique business assets. In short, Corporate Development will maximize the value and cash generate of our assets. By early October, 2014, Amtrak will have a better defined corporate asset business line that will be designed to extract the maximum revenue from other transportation assets of the company. 76 Appendices Appendix I: Performance Measure Definitions Adjusted Net Income/ (Loss): This number represents Amtrak's bottom line need for Federal operating support. It is calculated as total operating revenue (excluding certain State capital contributions) minus total operating expenses (excluding interest, depreciation, certain postemployment benefit estimates, the cost of Amtrak’s Inspector General, and costs paid with capital funds). Operating Ratio: A measure of financial performance equal to cash operating expenses divided by revenue generated from operations. The revenue and expenses used in this calculation are described in the Adjusted Net Income/ (Loss) definition above. Operating Ratio is the inverse of Cost Recovery. Cost Recovery Ratio: A measure of financial performance equal to revenue generated from operations divided by cash operating expenses. The revenue and expenses used in this calculation are described in the Adjusted Net Income/ (Loss) definition above. Cost Recovery is the inverse of Operating Ratio. Food & Beverage Direct Cost Recovery Ratio: A measure of financial performance equal to revenue generated from food & beverage sales divided by the direct costs of delivering food service. Direct costs include on-board labor, cost of food & beverage inventory, and costs of food commissary and warehouse services. Praise to Complaint Ratio: A ratio used to measure on-board customer service that is calculated by dividing the number of customer praise communications by the number of complaint communications. For instance, if a train received one praise letter and two complaint letters, the ratio would be 50% (1 praise divided by 2 complaints). The measure used to establish Business Line goals is limited to praise or complaints related to personnel (as opposed to equipment, weather, etc.) received within 60 days of a trip. Safe-2-Safer Contact Rate: As part of Amtrak's Safe-2-Safer program, trained employees conduct systematic peer-to-peer safety observations. They monitor each other working for a brief period of time and assess certain activities and behaviors to determine whether or not the employee(s) are at risk of injury. The observing employee then provides feedback to his or her peer(s) on how they could reduce their risk of injury. These observations are proven to reduce injuries over time. The contact rate is defined as the number of peers observed per month within a specific group (such as a Mechanical facility), divided by the population of that group. If 50 peers are observed at a facility with 100 employees, that would equal a contact rate of 50%. Multiple peers can be observed at once during an observation. Ridership: The total number of trips taken on Amtrak trains in a given period of time. Ten customers taking one trip each would count as ridership of 10. Conversely, one customer taking 10 separate trips in the given time period would also count as ridership of 10. Consumer Satisfaction Index (CSI): The percentage of riders polled who indicate they are “Very Satisfied” with their Amtrak experience. To rate as Very Satisfied a rider must give a rating of 8 or more on a scale of 0 to 10. Endpoint On-Time Performance (OTP): Percentage of trains which arrive at their endpoint on-time. On-time arrival is defined as the scheduled arrival time plus a small additional allowance ranging from 77 10 minutes for an Acela Express to a maximum of 30 minutes for a long-distance train whose trip was 550 miles or greater. Appendix II: FY2014 – FY2018 Summary Metrics National Train Service FY2014 Key Performance Indicators RASM - Core Revenue per Seat Mile (a) CASM - Core Expenses per Seat Mile (b) Core (NTS) Cost Recovery Ratio (c) Ridership (000's) Passenger Miles per total core employee (000's) (d) On-Time Performance (Endpoint) Customer Satisfaction Index Host Railroad Performance (e) FY2015 FY2016 FY2017 FY2018 Budget $0.196 $0.219 89.7% 31,508 32 81 83 900 Plan $0.202 $0.224 90.3% 32,041 32 n/a n/a 900 Plan $0.210 $0.231 90.8% 32,604 32 n/a n/a 900 Plan $0.216 $0.237 91.2% 33,014 33 n/a n/a 900 Plan $0.223 $0.243 91.6% 33,512 33 n/a n/a 900 12,967,553 6,878,800 37,953 53.0% 2.2 59 12,967,553 6,965,500 37,953 53.7% 2.2 59 12,967,553 7,061,600 37,953 54.5% 2.2 59 12,967,553 7,159,100 37,953 55.2% 2.2 59 12,967,553 7,258,200 37,953 56.0% 2.2 59 84.1% 89.1% $2,196,659 $0.3193 $69.72 $67.07 $73.62 1.12 $3.65 84.2% 89.2% $2,267,882 $0.3256 $70.78 $69.07 $75.31 1.11 $3.61 84.7% 89.4% $2,360,503 $0.3343 $72.40 $71.68 $77.79 1.10 $3.63 85.0% 89.6% $2,435,733 $0.3402 $73.78 $73.78 $79.75 1.10 $3.63 85.2% 89.8% $2,519,653 $0.3471 $75.19 $76.13 $81.92 1.09 $3.63 Other Indicators Seat Miles (000's) Passenger Miles (000's) Train Miles (000's) Average Load Factor Core diesel gallons per train mile (f) Seat Miles per total core employee (000's) (g) Equipment - % of Units in Service: Locomotive Fleet Passenger Fleet Unadjusted Ticket Revenue ($000's) Average Ticket Yield Average Ticket Price Core Revenue per Train Mile (h) Core Expenses per Train Mile (i) Adjusted Operating Ratio (j) Average cost per gallon of diesel Notes: (a ) Thi s i s ca l cul a ted a s NTS Tota l Revenue di vi ded by Ava i l a bl e Sea t Mi l es to be cons i s tent wi th the KPI's . (b) Thi s i s ca l cul a ted a s NTS Tota l Opera ti ng Expens e l es s OIG, PRJ, Depreci a ti on a nd non-ca s h OPEB's di vi ded by Ava i l a bl e Sea t Mi l es . (c) Thi s i s ca l cul a ted a s RASM di vi ded by CASM. (d) Avera ge monthl y Pa s s enger Mi l es di vi ded by yea r-end hea dcount. (e) Avera ge monthl y mi nutes of del a y per ten thous a nd Tra i n Mi l es . (f) Thi s i s ca l cul a ted a s Tota l Di es el Ga l l ons excl udi ng thos e us ed for commuter s ervi ces . (g) Avera ge monthl y Sea t Mi l es di vi ded by yea r-end hea dcount. (h) Thi s i s ca l cul a ted a s Tota l Core Revenue di vi ded by Tota l Tra i n Mi l es . (i ) Thi s i s ca l cul a ted a s Tota l Core Expens e l es s Depreci a ti on a nd non-ca s h OPEB's di vi ded by Tota l Tra i n Mi l es . (j) Thi s YTD mea s ure i s ca l cul a ted a s Tota l Opera ti ng Expens es (excl udi ng Depreci a ti on, OIG, OPEB's a nd PRJ) by Tota l Opera ti ng Revenue (excl udi ng s ta te ca pi ta l pa yments ). 78 Northeast Corridor FY2014 Key Performance Indicators RASM - Core Revenue per Seat Mile (a) CASM - Core Expenses per Seat Mile (b) Core (NTS) Cost Recovery Ratio (c) Ridership (000's) Passenger Miles per total core employee (000's) (d) On-Time Performance (Endpoint) Customer Satisfaction Index Host Railroad Performance (e) FY2015 FY2016 FY2017 FY2018 Budget $0.335 $0.214 156.5% 11,641 33 83 80 n/a Plan $0.345 $0.220 156.6% 11,678 33 84 n/a n/a Plan $0.357 $0.229 156.1% 11,872 33 85 n/a n/a Plan $0.369 $0.238 155.1% 12,008 33 86 n/a n/a Plan $0.381 $0.247 154.0% 12,177 33 87 n/a n/a 3,560,269 1,903,500 9,042 53.5% n/a 61 $1,159,657 $0.6092 $99.62 $131.76 $82.64 0.64 n/a 3,560,269 1,923,600 9,042 54.0% n/a 60 $1,195,068 $0.6213 $102.34 $135.71 $85.09 0.64 n/a 3,560,269 1,950,600 9,042 54.8% n/a 60 $1,240,209 $0.6358 $104.47 $140.74 $88.60 0.64 n/a 3,560,269 1,978,100 9,042 55.6% n/a 59 $1,279,369 $0.6468 $106.54 $145.10 $91.97 0.64 n/a 3,560,269 2,005,800 9,042 56.3% n/a 58 $1,323,079 $0.6596 $108.65 $149.97 $95.78 0.65 n/a FY2014 FY2015 Other Indicators Seat Miles (000's) Passenger Miles (000's) Train Miles (000's) Average Load Factor Core diesel gallons per train mile (f) Seat Miles per total core employee (000's) (g) Unadjusted Ticket Revenue ($000's) Average Ticket Yield Average Ticket Price Core Revenue per Train Mile (h) Core Expenses per Train Mile (i) Adjusted Operating Ratio (j) Average cost per gallon of diesel State Supported Corridors Key Performance Indicators RASM - Core Revenue per Seat Mile (a) CASM - Core Expenses per Seat Mile (b) Core (NTS) Cost Recovery Ratio (c) Ridership (000's) Passenger Miles per total core employee (000's) (d) On-Time Performance (Endpoint) Customer Satisfaction Index Host Railroad Performance (e) FY2016 FY2017 FY2018 Budget $0.163 $0.184 88.5% 15,112 30 83 80 900 Plan $0.167 $0.188 89.0% 15,469 31 84 n/a 900 Plan $0.172 $0.191 90.1% 15,765 32 85 n/a 900 Plan $0.177 $0.195 90.9% 15,991 32 86 n/a 900 Plan $0.182 $0.199 91.8% 16,259 33 87 n/a 900 4,779,064 2,034,000 14,461 42.6% 2.2 71 $497,428 $0.2446 $32.92 $53.73 $59.79 1.13 $3.65 4,779,064 2,064,900 14,461 43.2% 2.2 71 $515,403 $0.2496 $33.32 $55.25 $61.15 1.12 $3.61 4,779,064 2,097,400 14,461 43.9% 2.2 72 $535,723 $0.2554 $33.98 $56.94 $62.25 1.11 $3.63 4,779,064 2,130,600 14,461 44.6% 2.2 72 $554,123 $0.2601 $34.65 $58.50 $63.43 1.10 $3.63 4,779,064 2,164,300 14,461 45.3% 2.2 73 $574,583 $0.2655 $35.34 $60.21 $64.69 1.09 $3.63 Other Indicators Seat Miles (000's) Passenger Miles (000's) Train Miles (000's) Average Load Factor Core diesel gallons per train mile (f) Seat Miles per total core employee (000's) (g) Unadjusted Ticket Revenue ($000's) Average Ticket Yield Average Ticket Price Core Revenue per Train Mile (h) Core Expenses per Train Mile (i) Adjusted Operating Ratio (j) Average cost per gallon of diesel 79 Long-Distance FY2014 Key Performance Indicators RASM - Core Revenue per Seat Mile (a) CASM - Core Expenses per Seat Mile (b) Core (NTS) Cost Recovery Ratio (c) Ridership (000's) Passenger Miles per total core employee (000's) (d) On-Time Performance (Endpoint) Customer Satisfaction Index Host Railroad Performance (e) FY2015 FY2016 FY2017 FY2018 Budget $0.125 $0.259 48.1% 4,755 32 62 80 900 Plan $0.129 $0.264 48.7% 4,894 32 65 n/a 900 Plan $0.135 $0.274 49.2% 4,967 33 68 n/a 900 Plan $0.139 $0.280 49.6% 5,015 33 71 n/a 900 Plan $0.143 $0.286 50.0% 5,076 34 75 n/a 900 4,628,219 2,941,300 14,451 63.6% 2.2 50 $539,575 $0.1834 $113.48 $39.93 $81.81 2.08 $3.65 4,628,219 2,977,000 14,451 64.3% 2.2 50 $557,411 $0.1872 $113.90 $41.20 $83.35 2.05 $3.61 4,628,219 3,013,600 14,451 65.1% 2.2 50 $584,570 $0.1940 $117.69 $43.20 $86.59 2.03 $3.63 4,628,219 3,050,400 14,451 65.9% 2.2 50 $602,240 $0.1974 $120.09 $44.45 $88.43 2.02 $3.63 4,628,219 3,088,100 14,451 66.7% 2.2 50 $621,990 $0.2014 $122.54 $45.85 $90.48 2.00 $3.63 Other Indicators Seat Miles (000's) Passenger Miles (000's) Train Miles (000's) Average Load Factor Core diesel gallons per train mile (f) Seat Miles per total core employee (000's) (g) Unadjusted Ticket Revenue ($000's) Average Ticket Yield Average Ticket Price Core Revenue per Train Mile (h) Core Expenses per Train Mile (i) Adjusted Operating Ratio (j) Average cost per gallon of diesel 80 FY2014 Budget Statistics by Route $ millions except Contribution/(Loss) per Rider Allocation of Acela Regional NEC Special Trains NEC Spine Ethan Allen Express Vermonter Maple Leaf The Downeaster New Haven - Springfield Keystone Service Empire Service Chicago-St.Louis Hiawathas Wolverines Illini Illinois Zephyr Heartland Flyer Pacific Surfliner Cascades Capitols San Joaquins Adirondack Blue Water Washington-Lynchburg Washington-Newport News Washington - Norfolk Washington - Richmond Hoosier State Kansas City-St.Louis Pennsylvanian Pere Marquette Carolinian Piedmont Non NEC Special Trains State Supported Routes Silver Star Cardinal Silver Meteor Empire Builder Capitol Limited California Zephyr Southwest Chief City of New Orleans Texas Eagle Sunset Limited Coast Starlight Lake Shore Limited Palmetto Crescent Auto Train Long Distance Routes Ridership 3,471,176 8,156,195 13,939 11,641,310 55,066 89,818 427,814 539,053 391,953 1,314,292 1,119,507 651,421 790,645 504,533 335,934 225,402 81,917 2,715,027 839,933 1,459,626 1,224,826 137,183 198,587 192,012 366,184 156,696 206,582 35,729 201,392 226,961 103,401 315,947 182,021 22,307 15,111,769 419,599 116,524 372,777 517,989 232,389 382,179 352,560 254,733 340,851 103,402 475,182 391,589 211,912 312,179 270,999 4,754,864 Revenue $575.5 614.5 1.5 1,191.5 4.8 11.0 27.5 15.4 23.2 45.4 55.6 34.7 23.1 32.5 17.6 15.8 6.9 100.0 63.3 57.4 81.2 12.8 12.7 12.5 26.4 11.4 12.9 3.1 14.4 14.8 5.8 23.6 6.4 4.5 777.1 39.2 8.8 43.1 71.4 23.5 57.0 49.1 22.9 30.3 14.0 48.0 35.3 19.5 35.7 79.3 577.1 Expense $292.9 466.5 1.9 761.3 5.5 12.3 32.6 17.0 26.8 52.7 68.1 37.0 23.9 41.1 19.9 17.8 8.7 119.3 72.1 67.3 89.2 13.4 13.2 8.8 21.7 8.0 20.2 4.0 16.4 19.0 8.3 23.9 8.0 1.9 878.0 92.5 26.7 83.3 125.0 51.5 127.0 118.5 46.9 62.2 56.0 112.3 74.6 32.5 81.1 109.2 1,199.3 Capital Projects (2) $255.0 283.2 4.4 542.6 0.1 0.9 1.1 0.6 0.3 2.5 1.9 1.0 0.4 1.0 0.5 0.4 0.2 1.5 0.9 0.6 0.9 0.3 0.2 0.2 0.6 0.2 0.2 0.1 0.3 1.9 0.3 1.3 0.1 0.1 20.7 20.8 5.3 21.1 31.1 12.1 31.2 28.2 12.3 15.8 12.4 19.6 15.7 12.2 15.1 14.3 267.0 National Train Service 31,507,943 $2,545.7 $2,838.5 $830.2 Non-Allocated Capital (4) Avg. PM per Avg. SM per Contribution/ Core employee Core employee (Loss) per Rider (000's) (3) (000's) (3) $81.42 29 45 18.15 35 70 (29.46) 15 113 36.96 33 61 (12.61) 17 56 (14.18) 13 58 (11.90) 23 91 (3.01) 55 98 (9.26) 26 33 (5.52) 44 73 (11.11) 29 71 (3.55) 31 81 (0.93) 58 96 (16.98) 22 86 (6.61) 30 100 (8.56) 22 73 (22.12) 16 48 (7.08) 40 82 (10.52) 20 43 (6.79) 38 73 (6.54) 24 63 (4.47) 18 47 (2.65) 26 81 19.52 38 92 12.75 30 72 21.83 34 169 (35.13) 18 43 (24.42) 16 41 (9.63) 22 59 (18.38) 21 55 (24.06) 22 45 (1.00) 23 64 (8.85) 40 67 117.56 21 67 (6.68) 30 71 (127.18) 36 46 (153.82) 35 38 (107.59) 36 55 (103.53) 33 68 (120.57) 36 41 (183.26) 24 52 (196.94) 24 52 (94.06) 44 48 (93.51) 44 54 (405.67) 15 38 (135.32) 34 42 (100.34) 42 56 (61.37) 52 74 (145.37) 31 47 (110.22) 20 37 ($130.84) 32 50 ($9.29) 32 59 $32.4 Total Capital $862.6 (1) Budget route res ul ts a re projected ba s ed on APT hi s tori ca l ra ti os . Expens es excl ude net Depreci a ti on, OPEB's , PRJ a nd Interes t. (2) Thi s repres ents the a l l oca ti on to routes of Ca pi ta l Projects funded by Federa l Appropri a ti on a nd Opera ti ng Profi ts . (3) Empl oyee da ta i s not a ggrega ted by route i n Amtra k's Fi na nci a l Sys tems . The da ta pres ented here i s ba s ed on a n a l l oca ti on of Core empl oyees ba s ed on tota l cos ts of ea ch route. PM equa l s Pa s s enger Mi l es a nd SM equa l s Sea t Mi l es . (4) Non-Al l oca ted Ca pi ta l ca tegory repres ents Corpora te Devel opment Bus i nes s Li ne. 81 FY2015 Plan Statistics by Route $ millions except Contribution/(Loss) per Rider Acela Regional NEC Special Trains NEC Spine Ethan Allen Express Vermonter Maple Leaf The Downeaster New Haven - Springfield Keystone Service Empire Service Chicago-St.Louis Hiawathas Wolverines Illini Illinois Zephyr Heartland Flyer Pacific Surfliner Cascades Capitols San Joaquins Adirondack Blue Water Washington-Lynchburg New York-Newport News Washington - Norfolk Washington - Richmond Hoosier State Kansas City-St.Louis Pennsylvanian Pere Marquette Carolinian Piedmont Non NEC Special Trains State Supported Routes Silver Star Cardinal Silver Meteor Empire Builder Capitol Limited California Zephyr Southwest Chief City of New Orleans Texas Eagle Sunset Limited Coast Starlight Lake Shore Limited Palmetto Crescent Auto Train Long Distance Routes Ridership 3,473,000 8,191,002 13,998 11,678,000 56,368 91,941 437,927 551,796 401,218 1,345,361 1,145,971 666,820 809,335 516,460 343,875 230,730 83,853 2,779,208 859,788 1,494,130 1,253,780 140,426 203,281 196,551 374,841 160,400 211,465 36,574 206,153 232,326 105,845 323,416 186,324 22,834 15,469,000 431,877 119,934 383,685 533,146 239,189 393,362 362,877 262,187 350,825 106,428 489,087 403,048 218,113 321,314 278,929 4,894,000 Revenue $592.6 633.0 1.5 1,227.2 5.1 11.3 28.5 15.8 23.8 46.8 57.4 35.6 23.8 33.4 18.1 16.2 7.1 102.9 64.8 58.9 83.3 13.1 13.0 13.0 27.6 11.8 12.9 3.2 14.8 15.2 5.9 24.4 6.6 4.7 799.1 40.4 9.1 44.5 73.7 24.2 58.8 50.6 23.6 31.3 14.4 49.5 36.4 20.1 36.8 81.8 595.4 Expense $303.8 477.8 1.9 783.6 5.6 12.5 32.9 17.5 27.4 54.4 68.0 38.3 24.7 42.4 20.5 18.0 9.0 123.1 73.3 69.6 90.7 13.5 13.7 9.0 22.1 8.1 20.3 4.0 16.8 19.4 8.2 24.6 8.1 2.0 897.7 94.3 27.2 85.0 129.1 51.9 128.6 119.0 48.0 63.7 57.1 114.1 75.7 33.1 82.9 112.0 1,221.7 National Train Service 32,041,000 $2,621.6 $2,902.9 Avg. PM per Avg. SM per Allocation of Capital Contribution/ Core employee Core employee Projects (2) (Loss) per Rider (000's) (3) (000's) (3) $324.0 $83.14 29 45 469.2 18.95 35 70 7.4 (28.34) 15 114 800.7 37.99 33 60 0.1 (8.03) 18 57 0.7 (13.00) 13 58 1.0 (10.17) 24 92 0.3 (3.10) 56 98 0.8 (9.04) 26 33 2.1 (5.59) 44 72 1.6 (9.21) 30 73 0.7 (4.05) 31 80 0.3 (1.05) 58 95 0.7 (17.46) 22 85 0.3 (6.83) 30 99 0.3 (7.94) 23 73 0.1 (22.83) 17 48 1.0 (7.26) 40 81 0.6 (9.95) 21 43 0.6 (7.14) 38 72 0.7 (5.93) 25 63 0.1 (3.17) 18 47 0.2 (3.14) 26 81 0.1 20.26 39 92 0.4 14.83 30 73 0.1 22.89 35 170 0.1 (34.75) 19 43 0.1 (21.83) 16 42 0.3 (9.94) 22 59 1.4 (18.02) 21 55 0.1 (21.63) 23 46 1.0 (0.79) 23 64 0.1 (8.22) 41 68 0.1 119.60 21 66 15.8 (6.37) 31 71 19.2 (124.86) 37 46 4.2 (151.25) 36 38 19.3 (105.39) 37 56 26.6 (103.83) 33 67 9.8 (115.93) 37 42 26.2 (177.42) 25 52 23.7 (188.41) 25 53 11.3 (92.79) 44 48 13.4 (92.33) 45 54 10.7 (400.65) 15 39 15.7 (132.03) 35 43 15.3 (97.44) 43 56 13.1 (59.73) 53 75 12.8 (143.63) 31 47 11.9 (108.15) 20 37 233.3 ($127.97) 32 50 $1,049.7 Non-Allocated Capital (4) Total Capital ($8.78) 32 59 $78.9 $1,128.6 (1) Budget route res ul ts a re projected ba s ed on APT hi s tori ca l ra ti os . Expens es excl ude net Depreci a ti on, OPEB's , PRJ a nd Interes t. (2) Thi s repres ents the a l l oca ti on to routes of Ca pi ta l Projects funded by Federa l Appropri a ti on a nd Opera ti ng Profi ts . (3) Empl oyee da ta i s not a ggrega ted by route i n Amtra k's Fi na nci a l Sys tems . The da ta pres ented here i s ba s ed on a n a l l oca ti on of Core empl oyees ba s ed on tota l cos ts of ea ch route. PM equa l s Pa s s enger Mi l es a nd SM equa l s Sea t Mi l es . (4) Non-Al l oca ted Ca pi ta l ca tegory repres ents Corpora te Devel opment Bus i nes s Li ne. 82 FY2016 Plan Statistics by Route $ millions except Contribution/(Loss) per Rider Acela Regional NEC Special Trains NEC Spine Ethan Allen Express Vermonter Maple Leaf The Downeaster New Haven - Springfield Keystone Service Empire Service Chicago-St.Louis Hiawathas Wolverines Illini Illinois Zephyr Heartland Flyer Pacific Surfliner Cascades Capitols San Joaquins Adirondack Blue Water Washington-Lynchburg New York-Newport News Washington - Norfolk Washington - Richmond Hoosier State Kansas City-St.Louis Pennsylvanian Pere Marquette Carolinian Piedmont Non NEC Special Trains State Supported Routes Silver Star Cardinal Silver Meteor Empire Builder Capitol Limited California Zephyr Southwest Chief City of New Orleans Texas Eagle Sunset Limited Coast Starlight Lake Shore Limited Palmetto Crescent Auto Train Long Distance Routes Ridership 3,531,000 8,326,769 14,231 11,872,000 57,446 93,701 446,307 562,354 408,896 1,371,104 1,167,900 679,580 824,822 526,342 350,455 235,145 85,458 2,832,388 876,240 1,522,721 1,277,771 143,113 207,171 200,312 382,013 163,469 215,512 37,273 210,097 236,772 107,871 329,604 189,889 23,271 15,765,000 438,319 121,723 389,408 541,099 242,757 399,230 368,289 266,098 356,058 108,015 496,382 409,060 221,366 326,107 283,089 4,967,000 Revenue $614.1 657.1 1.6 1,272.7 5.4 11.6 29.5 16.2 24.5 48.4 59.5 36.6 24.6 34.4 18.7 16.6 7.2 106.1 66.5 60.5 85.6 13.5 13.4 13.5 29.0 12.2 12.9 3.3 15.2 15.7 6.1 25.3 6.8 4.9 823.6 43.0 9.6 46.4 78.6 25.4 60.8 53.7 24.9 32.4 14.9 51.2 38.5 20.8 39.5 84.6 624.3 Expense $317.2 496.2 2.0 815.4 5.7 12.7 33.5 17.8 28.1 55.8 69.5 39.1 25.2 43.3 20.9 18.3 9.1 124.9 74.4 70.8 91.7 13.8 14.0 9.1 22.4 8.2 20.4 4.1 17.1 19.7 8.4 25.2 8.3 2.0 913.7 99.4 28.6 89.6 135.1 51.8 132.4 122.7 50.2 65.8 59.1 117.5 78.8 34.6 87.8 115.2 1,268.5 National Train Service 32,604,000 $2,720.6 $2,997.5 Non-Allocated Capital Total Capital Avg. PM per Avg. SM per Allocation of Capital Contribution/ Core employee Core employee Projects (2) (Loss) per Rider (000's) (3) (000's) (3) $621.8 $84.06 29 44 978.0 19.32 35 70 15.7 (26.78) 15 115 1,615.5 38.52 33 60 0.1 (4.67) 18 58 1.3 (11.52) 13 59 1.0 (8.97) 24 93 0.3 (2.81) 58 99 1.4 (8.75) 27 33 4.1 (5.38) 45 72 1.7 (8.62) 31 73 0.8 (3.69) 32 80 0.4 (0.75) 60 96 0.8 (16.90) 22 86 0.4 (6.33) 31 100 0.3 (7.27) 23 74 0.1 (22.16) 17 48 1.0 (6.64) 41 82 0.6 (9.00) 21 44 0.5 (6.74) 39 73 0.7 (4.79) 25 64 0.1 (2.55) 19 48 0.2 (2.80) 27 81 0.1 21.72 40 94 0.3 17.30 31 74 0.1 24.05 36 173 0.1 (34.83) 19 44 0.1 (21.60) 17 42 0.3 (9.49) 22 60 2.8 (16.88) 22 56 0.2 (21.18) 23 46 1.8 0.14 24 64 0.1 (8.15) 41 68 0.1 124.75 21 67 21.6 (5.72) 31 72 29.9 (128.55) 37 45 3.4 (155.85) 36 38 31.2 (110.83) 36 55 23.1 (104.32) 33 66 9.5 (108.79) 39 44 23.4 (179.25) 25 52 21.0 (187.56) 25 53 9.9 (94.93) 45 48 11.5 (93.75) 45 54 8.5 (408.90) 15 39 12.7 (133.66) 35 43 17.5 (98.52) 43 56 24.7 (62.37) 54 75 8.2 (148.22) 31 46 11.4 (107.94) 21 38 245.9 ($129.68) 33 50 $1,883.0 (4) ($8.49) 32 59 $80.0 $1,963.0 (1) Budget route res ul ts a re projected ba s ed on APT hi s tori ca l ra ti os . Expens es excl ude net Depreci a ti on, OPEB's , PRJ a nd Interes t. (2) Thi s repres ents the a l l oca ti on to routes of Ca pi ta l Projects funded by Federa l Appropri a ti on a nd Opera ti ng Profi ts . (3) Empl oyee da ta i s not a ggrega ted by route i n Amtra k's Fi na nci a l Sys tems . The da ta pres ented here i s ba s ed on a n a l l oca ti on of Core empl oyees ba s ed on tota l cos ts of ea ch route. PM equa l s Pa s s enger Mi l es a nd SM equa l s Sea t Mi l es . (4) Non-Al l oca ted Ca pi ta l ca tegory repres ents Corpora te Devel opment Bus i nes s Li ne. 83 FY2017 Plan Statistics by Route $ millions except Contribution/(Loss) per Rider Acela Regional NEC Special Trains NEC Spine Ethan Allen Express Vermonter Maple Leaf The Downeaster New Haven - Springfield Keystone Service Empire Service Chicago-St.Louis Hiawathas Wolverines Illini Illinois Zephyr Heartland Flyer Pacific Surfliner Cascades Capitols San Joaquins Adirondack Blue Water Washington-Lynchburg New York-Newport News Washington - Norfolk Washington - Richmond Hoosier State Kansas City-St.Louis Pennsylvanian Pere Marquette Carolinian Piedmont Non NEC Special Trains State Supported Routes Silver Star Cardinal Silver Meteor Empire Builder Capitol Limited California Zephyr Southwest Chief City of New Orleans Texas Eagle Sunset Limited Coast Starlight Lake Shore Limited Palmetto Crescent Auto Train Long Distance Routes Ridership 3,572,000 8,421,607 14,393 12,008,000 58,270 95,044 452,705 570,416 414,758 1,390,760 1,184,642 689,322 836,646 533,888 355,479 238,516 86,683 2,872,992 888,802 1,544,550 1,296,089 145,165 210,141 203,184 387,490 165,813 218,601 37,808 213,109 240,166 109,417 334,329 192,611 23,605 15,991,000 442,555 122,899 393,171 546,328 245,103 403,088 371,848 268,669 359,499 109,059 501,179 413,013 223,506 329,258 285,825 5,015,000 Revenue $633.2 677.3 1.6 1,312.1 5.7 11.9 30.5 16.6 25.1 49.9 61.3 37.5 25.3 35.3 19.2 17.0 7.4 109.0 68.1 62.1 87.8 13.8 13.7 13.9 30.3 12.5 13.0 3.3 15.5 16.2 6.3 26.1 7.0 5.1 846.1 44.2 9.9 47.8 80.9 26.1 62.6 55.2 25.7 33.3 15.4 52.7 39.6 21.4 40.6 87.1 642.4 Expense $330.3 513.7 2.0 846.0 5.8 12.9 34.2 18.1 28.8 57.4 71.2 39.9 25.8 44.2 21.3 18.6 9.3 126.9 75.5 72.1 92.9 14.1 14.3 9.3 22.8 8.4 20.6 4.1 17.5 20.1 8.6 25.8 8.6 2.0 930.8 101.6 29.0 91.6 139.2 52.5 135.2 125.0 51.1 66.9 60.2 120.1 80.4 35.1 89.8 117.5 1,295.2 National Train Service 33,014,000 $2,800.7 $3,072.0 Avg. PM per Avg. SM per Allocation of Capital Contribution/ Core employee Core employee Projects (2) (Loss) per Rider (000's) (3) (000's) (3) $628.5 $84.79 29 43 1,085.8 19.43 36 69 17.4 (25.86) 15 116 1,731.8 38.82 33 59 0.1 (1.69) 19 58 1.8 (10.51) 14 60 1.0 (8.15) 25 94 0.3 (2.63) 59 100 1.6 (8.71) 27 34 5.6 (5.36) 45 72 1.7 (8.31) 31 74 0.8 (3.53) 32 81 0.4 (0.58) 61 96 0.9 (16.68) 23 86 0.4 (6.06) 31 100 0.3 (6.85) 24 75 0.1 (21.83) 18 49 1.1 (6.22) 42 83 0.7 (8.38) 22 44 0.6 (6.53) 40 73 0.7 (3.91) 26 65 0.1 (2.30) 19 48 0.2 (2.69) 28 82 0.1 22.95 41 95 0.3 19.36 32 75 0.1 25.06 37 175 0.1 (35.12) 20 45 0.1 (21.44) 17 43 0.3 (9.31) 23 60 3.9 (16.11) 22 56 0.2 (21.04) 24 47 2.4 0.71 24 64 0.1 (8.27) 42 68 0.1 129.27 22 68 26.1 (5.30) 32 72 31.1 (129.61) 37 45 3.0 (154.97) 37 38 32.5 (111.51) 37 55 21.7 (106.69) 34 66 9.3 (107.83) 40 44 22.2 (180.33) 26 52 19.7 (187.70) 25 53 9.3 (94.54) 45 48 10.7 (93.36) 46 54 8.2 (410.87) 16 39 12.1 (134.55) 36 43 14.8 (98.72) 44 56 26.2 (61.35) 55 75 7.0 (149.51) 31 46 11.4 (106.35) 21 38 239.1 ($130.16) 33 50 $1,997.0 Non-Allocated Capital (4) Total Capital ($8.22) 33 59 $80.0 $2,077.0 (1) Budget route res ul ts a re projected ba s ed on APT hi s tori ca l ra ti os . Expens es excl ude net Depreci a ti on, OPEB's , PRJ a nd (2) Interes t. Thi s repres ents the a l l oca ti on to routes of Ca pi ta l Projects funded by Federa l Appropri a ti on a nd Opera ti ng Profi ts . (3) Empl oyee da ta i s not a ggrega ted by route i n Amtra k's Fi na nci a l Sys tems . The da ta pres ented here i s ba s ed on a n a l l oca ti on of Core empl oyees ba s ed on tota l cos ts of ea ch route. PM equa l s Pa s s enger Mi l es a nd SM equa l s Sea t Mi l es . (4) Non-Al l oca ted Ca pi ta l ca tegory repres ents Corpora te Devel opment Bus i nes s Li ne. 84 FY2018 Plan Statistics by Route $ millions except Contribution/(Loss) per Rider Acela Regional NEC Special Trains NEC Spine Ethan Allen Express Vermonter Maple Leaf The Downeaster New Haven - Springfield Keystone Service Empire Service Chicago-St.Louis Hiawathas Wolverines Illini Illinois Zephyr Heartland Flyer Pacific Surfliner Cascades Capitols San Joaquins Adirondack Blue Water Washington-Lynchburg New York-Newport News Washington - Norfolk Washington - Richmond Hoosier State Kansas City-St.Louis Pennsylvanian Pere Marquette Carolinian Piedmont Non NEC Special Trains State Supported Routes Silver Star Cardinal Silver Meteor Empire Builder Capitol Limited California Zephyr Southwest Chief City of New Orleans Texas Eagle Sunset Limited Coast Starlight Lake Shore Limited Palmetto Crescent Auto Train Long Distance Routes Ridership 3,623,000 8,539,406 14,594 12,177,000 59,246 96,637 460,292 579,976 421,709 1,414,068 1,204,496 700,875 850,668 542,835 361,437 242,514 88,136 2,921,142 903,698 1,570,436 1,317,810 147,597 213,663 206,589 393,984 168,592 222,265 38,441 216,681 244,191 111,251 339,933 195,839 24,000 16,259,000 447,938 124,394 397,954 552,973 248,084 407,991 376,371 271,937 363,872 110,386 507,275 418,036 226,224 333,263 289,302 5,076,000 Revenue $654.5 700.0 1.7 1,356.2 6.0 12.2 31.6 17.0 25.8 51.5 63.4 38.4 26.1 36.3 19.7 17.3 7.5 112.2 69.8 63.7 90.1 14.1 14.1 14.4 31.7 12.9 13.0 3.4 15.9 16.7 6.4 27.0 7.2 5.3 870.8 45.6 10.2 49.3 83.5 26.9 64.5 56.9 26.5 34.4 15.8 54.3 40.9 22.1 41.8 89.9 662.7 Expense $345.1 533.4 2.1 880.6 6.0 13.1 34.9 18.4 29.5 59.0 72.9 40.8 26.4 45.2 21.8 18.9 9.4 129.0 76.7 73.5 94.0 14.4 14.6 9.4 23.2 8.5 20.8 4.2 17.8 20.4 8.7 26.5 8.8 2.1 949.1 104.0 29.4 93.9 143.8 53.4 138.4 127.5 52.1 68.2 61.4 122.9 82.2 35.8 92.0 120.0 1,324.9 National Train Service 33,512,000 $2,889.6 $3,154.5 Non-Allocated Capital Total Capital (1) Avg. PM per Avg. SM per Allocation of Capital Contribution/ Core employee Core employee Projects (2) (Loss) per Rider (000's) (3) (000's) (3) $612.2 $85.40 29 43 1,062.4 19.51 36 68 17.0 (25.00) 16 117 1,691.7 39.06 33 58 0.1 1.35 19 58 1.7 (9.39) 14 61 1.0 (7.21) 25 95 0.3 (2.44) 61 101 6.9 (8.64) 28 34 4.7 (5.31) 46 72 1.7 (7.94) 32 74 0.8 (3.35) 33 81 0.4 (0.38) 62 97 0.9 (16.40) 23 87 0.4 (5.75) 32 101 0.3 (6.37) 25 76 0.1 (21.43) 18 49 1.1 (5.74) 44 84 0.7 (7.63) 23 45 0.6 (6.26) 41 74 0.7 (2.94) 27 66 0.1 (1.97) 20 48 0.2 (2.56) 28 82 0.1 24.28 42 96 0.4 21.60 33 76 0.1 26.12 38 177 0.1 (35.36) 21 46 0.1 (21.66) 17 43 0.3 (9.08) 23 61 3.5 (15.23) 23 57 0.2 (20.85) 24 47 2.3 1.42 25 64 0.1 (8.35) 43 68 0.1 134.06 22 68 30.4 (4.81) 33 73 30.1 (130.54) 38 45 2.9 (154.06) 37 38 31.6 (112.06) 37 55 22.6 (109.00) 34 65 9.9 (106.73) 41 44 23.4 (181.15) 26 53 20.7 (187.52) 26 54 9.2 (94.05) 46 48 11.2 (92.80) 47 54 8.4 (412.57) 16 39 13.4 (135.24) 36 43 14.1 (98.80) 45 56 25.5 (60.29) 55 75 6.1 (150.65) 32 46 12.8 (104.27) 21 38 242.0 ($130.47) 34 50 $1,964.0 (4) ($7.90) 33 59 $80.0 $2,044.0 Budget route res ul ts a re projected ba s ed on APT hi s tori ca l ra ti os . Expens es excl ude net Depreci a ti on, OPEB's , PRJ a nd (2) Interes t. Thi s repres ents the a l l oca ti on to routes of Ca pi ta l Projects funded by Federa l Appropri a ti on a nd Opera ti ng Profi ts . (3) Empl oyee da ta i s not a ggrega ted by route i n Amtra k's Fi na nci a l Sys tems . The da ta pres ented here i s ba s ed on a n a l l oca ti on of Core empl oyees ba s ed on tota l cos ts of ea ch route. PM equa l s Pa s s enger Mi l es a nd SM equa l s Sea t Mi l es . (4) Non-Al l oca ted Ca pi ta l ca tegory repres ents Corpora te Devel opment Bus i nes s Li ne. 85 Appendix III: Compliance with PRIIA 204 The terms of the FY2014 Grant Agreement between Amtrak and the Federal Railroad Administration specify that Amtrak’s Five Year Plan continues to comply with the requirements of PRIIA Section 204. The PRIIA 204 requirements are listed below, along with a reference to the section of this document that complies with each. (a) DEVELOPMENT OF 5-YEAR FINANCIAL PLAN - The Amtrak Board of Directors shall submit an annual budget and business plan for Amtrak, and a 5-year financial plan for the fiscal year to which that budget and business plan relate and the subsequent 4 years, prepared in accordance with this section, to the Secretary and the Inspector General of the Department of Transportation no later than: (1) the first day of each fiscal year beginning after the date of enactment of this Act; or (2) the date that is 60 days after the date of enactment of an appropriations Act for the fiscal year, if later. (b) CONTENTS OF 5-YEAR FINANCIAL PLAN - The 5-year financial plan for Amtrak shall include, at a minimum: (1) all projected revenues and expenditures for Amtrak, including governmental funding sources; See Exhibits 3-6, 3-7, 4-2, 5-2, 6-2, 7-1 (2) projected ridership levels for all Amtrak passenger operations; in millions Northeast Corridor State Supported Corridors Long Distance Total Amtrak FY2014 Budget 11.6 15.2 4.8 31.6 FY2015 Plan 11.6 15.6 5.0 32.1 FY2016 Plan 11.8 15.9 5.0 32.7 FY2017 Plan 11.9 16.1 5.1 33.1 FY2018 Plan 12.1 16.4 5.2 33.6 (3) revenue and expenditure forecasts for non-passenger operations; 86 FY2014 Budget $ millions Commuter Reimbursable Commercial Development Other Transportation Freight Access Fees and Other Total Operating Revenue Reimbursable 0.0 208.1 0.0 0.7 0.0 208.8 FY2015 Plan Commuter Commercial Contract Development 125.5 0.0 (1.4) 1.7 0.0 75.2 0.0 0.0 0.0 1.2 124.0 78.2 Total NonPassenger 125.5 208.3 75.2 0.7 1.2 411.0 Commuter Commercial Reimbursable Contract Development 0.0 130.7 0.0 212.7 (1.4) 1.8 0.0 0.0 76.6 0.7 0.0 0.0 0.0 0.0 1.2 213.4 129.2 79.6 Total NonPassenger 130.7 213.0 76.6 0.7 1.2 422.2 Operating Expenses by Type Salaries Wages & Overtime Employee Benefits Employee Related Train Operations Fuel, Power, & Utilities Materials Facility, Communication, & Office Advertising and Sales Professional Fees Data Processing Services and Supplies Environmental and Safety Maintenance of Way Services Passenger Inconvenience Financial Transfer Credits Total Operating Expenses Net Operating Loss - Cash 3.3 56.7 22.9 0.6 0.1 0.6 16.6 8.3 0.0 1.9 0.5 0.3 52.4 0.0 0.6 45.0 209.8 4.9 39.4 27.2 0.3 0.6 13.7 6.0 1.8 0.0 0.3 0.5 0.2 0.1 0.2 0.1 12.3 107.7 2.4 0.7 2.7 0.1 (0.0) 0.3 0.0 2.0 0.1 1.9 0.3 0.0 0.0 0.0 0.5 0.2 11.2 10.6 96.9 52.7 1.0 0.7 14.7 22.6 12.0 0.1 4.1 1.3 0.6 52.4 0.2 1.2 57.5 328.7 3.9 57.7 24.0 0.6 0.1 0.6 16.6 8.3 0.0 1.9 0.5 0.3 52.4 0.0 0.6 45.8 213.3 5.1 40.4 28.3 0.3 0.6 13.7 6.0 1.8 0.0 0.3 0.5 0.2 0.1 0.2 0.1 12.4 110.0 2.5 0.7 2.8 0.1 (0.0) 0.3 0.0 2.0 0.1 1.9 0.3 0.0 0.0 0.0 0.5 0.2 11.4 11.5 98.8 55.1 1.0 0.7 14.7 22.6 12.0 0.1 4.1 1.3 0.5 52.4 0.2 1.2 58.3 334.7 (1.1) 16.4 67.0 82.3 0.1 19.3 68.2 87.5 FY2016 Plan $ millions Commuter Reimbursable Commercial Development Other Transportation Freight Access Fees and Other Total Operating Revenue FY2017 Plan Commuter Commercial Reimbursable Contract Development 0.0 136.1 0.0 217.4 (1.4) 1.8 0.0 0.0 83.0 0.7 0.0 0.0 0.0 0.0 1.2 218.1 134.6 86.1 Total NonPassenger 136.1 217.8 83.0 0.8 1.2 438.9 Reimbursable 0.0 222.3 0.0 0.7 0.0 223.0 Commuter Commercial Total NonContract Development Passenger 141.6 0.0 141.6 (1.4) 1.9 222.7 0.0 87.4 87.4 0.0 0.0 0.8 0.0 1.2 1.2 140.2 90.6 453.8 Operating Expenses by Type Salaries Wages & Overtime Employee Benefits Employee Related Train Operations Fuel, Power, & Utilities Materials Facility, Communication, & Office Advertising and Sales Professional Fees Data Processing Services and Supplies Environmental and Safety Maintenance of Way Services Passenger Inconvenience Financial Transfer Credits Total Operating Expenses Net Operating Loss - Cash 4.0 58.7 25.1 0.6 0.1 0.6 16.6 8.3 0.0 1.9 0.5 0.3 52.4 0.0 0.6 46.6 216.3 5.3 41.4 29.3 0.3 0.6 13.7 6.0 1.8 0.0 0.3 0.5 0.2 0.1 0.2 0.1 12.5 112.2 2.6 0.8 2.9 0.1 (0.0) 0.3 0.0 2.0 0.1 1.9 0.3 0.0 0.0 0.0 0.5 0.2 11.7 11.9 100.8 57.3 1.0 0.7 14.7 22.6 12.0 0.1 4.1 1.3 0.5 52.4 0.2 1.2 59.2 340.2 4.0 59.7 26.2 0.6 0.1 0.6 16.6 8.3 0.0 1.9 0.5 0.3 52.4 0.0 0.6 47.4 219.3 5.5 42.4 30.4 0.3 0.6 13.7 6.0 1.8 0.0 0.3 0.5 0.2 0.1 0.2 0.1 12.5 114.6 2.7 0.8 3.0 0.1 (0.0) 0.3 0.0 2.0 0.1 1.9 0.3 0.0 0.0 0.0 0.5 0.2 11.9 12.2 102.9 59.7 1.0 0.7 14.7 22.6 12.0 0.1 4.1 1.3 0.5 52.4 0.2 1.2 60.0 345.8 1.9 22.4 74.5 98.7 3.8 25.6 78.7 108.0 87 FY2018 Plan $ millions Commuter Reimbursable Commercial Development Other Transportation Freight Access Fees and Other Total Operating Revenue Commuter Commercial Total NonReimbursable Contract Development Passenger 0.0 147.4 0.0 147.4 227.3 (1.4) 1.9 227.8 0.0 0.0 92.6 92.6 0.8 0.0 0.0 0.8 0.0 0.0 1.2 1.2 228.1 146.0 95.9 469.9 Operating Expenses by Type Salaries Wages & Overtime Employee Benefits Employee Related Train Operations Fuel, Power, & Utilities Materials Facility, Communication, & Office Advertising and Sales Professional Fees Data Processing Services and Supplies Environmental and Safety Maintenance of Way Services Passenger Inconvenience Financial Transfer Credits Total Operating Expenses Net Operating Loss - Cash 4.1 60.8 27.6 0.6 0.1 0.6 16.6 8.3 0.0 1.9 0.5 0.3 52.4 0.0 0.6 48.2 222.6 5.8 43.5 31.6 0.3 0.6 13.7 6.0 1.8 0.0 0.3 0.5 0.2 0.1 0.2 0.1 12.6 117.2 2.8 0.8 3.2 0.1 (0.0) 0.3 0.0 2.0 0.1 1.9 0.3 0.0 0.0 0.0 0.5 0.2 12.2 12.6 105.0 62.4 1.0 0.7 14.7 22.6 12.0 0.1 4.1 1.3 0.5 52.4 0.2 1.2 60.9 351.9 5.5 28.8 83.7 118.0 (4) capital funding requirements and expenditures necessary to maintain passenger service in order to accommodate predicted ridership levels and predicted sources of capital funding; See Exhibits 3-3, 3-4, 4-3, 5-3, 6-3, 7-2 (5) operational funding needs, if any, to maintain current and projected levels of passenger service, including State-supported routes and predicted funding sources; See Exhibits 3-2, 4-2, 5-2, 6-2, 7-1 (6) projected capital and operating requirements, ridership, and revenue for any new passenger service operations or service expansions; Plan contains no new or expanded passenger services (7) an assessment of the continuing financial stability of Amtrak, as indicated by factors such as anticipated Federal funding of capital and operating costs, Amtrak's ability to efficiently recruit, retain, and manage its workforce, and Amtrak's ability to effectively provide passenger rail service; See “Amtrak Financial Stability” in Section 3 and “Human Capital Strategy” in Section 1 (8) estimates of long-term and short-term debt and associated principal and interest payments (both current and anticipated); See “Debt and Principal & Interest” in Section 3 (9) annual cash flow forecasts; See “Cash Flow” in Section 3 (10) a statement describing methods of estimation and significant assumptions; See “Methods of Estimation and Significant Assumptions” in Section 3 (11) specific measures that demonstrate measurable improvement year over year in the financial results of Amtrak's operations; See “Human Capital Strategy” in Section 1 88 (12) prior fiscal year and projected operating ratio, cash operating loss, and cash operating loss per passenger on a route, business line, and corporate basis; See Appendix II (13) prior fiscal year and projected specific costs and savings estimates resulting from reform initiatives; See “Human Capital Strategy” in Section 1 (14) prior fiscal year and projected labor productivity statistics on a route, business line, and corporate basis; See Appendix II (15)prior fiscal year and projected equipment reliability statistics See Exhibit 1-9 (16)capital and operating expenditures for anticipated security needs FY2014 Budget $ millions Salaries Wages & Overtime Employee Benefits Employee Related Facility, Communication, & Office Professional Fees Data Processing Services and Supplies Environmental and Safety Maintenance of Way Services All Other Expenses Total Operating Expenses Amtrak Police $4.4 40.3 22.6 1.7 3.5 0.1 0.0 0.0 1.8 0.1 74.7 Capital Programs Total Security Expenses $74.7 FY2015 Plan Total Security Expenses $8.0 40.5 25.4 2.0 6.2 1.8 0.1 0.1 1.9 0.1 86.0 Emergency Mgmt & Total Security Amtrak Police Corp Expenses $4.6 $3.7 $8.3 41.4 0.2 41.6 23.8 2.9 26.7 1.6 0.4 2.0 3.5 2.7 6.2 0.1 1.7 1.8 0.0 0.0 0.1 0.0 0.1 0.1 1.8 0.0 1.9 0.1 0.0 0.1 77.1 11.6 88.7 35.1 35.1 13.5 13.5 $46.4 $121.1 $25.2 $102.3 Salaries Wages & Overtime Employee Benefits Employee Related Facility, Communication, & Office Professional Fees Data Processing Services and Supplies Environmental and Safety Maintenance of Way Services All Other Expenses Total Operating Expenses $77.1 FY2017 Plan $ millions Emergency Mgmt & Amtrak Police Corp $5.1 $4.0 43.7 0.2 26.2 3.2 1.6 0.4 3.5 2.7 0.1 1.7 0.0 0.0 0.0 0.1 1.8 0.0 0.1 0.0 82.1 12.2 Capital Programs Total Security Expenses FY2016 Plan Emergency Mgmt & Corp Security $3.5 0.2 2.7 0.4 2.7 1.7 0.0 0.1 0.0 0.0 11.3 $82.1 $79.6 FY2018 Plan Total Security Expenses $9.1 43.8 29.3 2.0 6.2 1.8 0.1 0.1 1.9 0.1 94.4 9.6 9.6 $21.8 $103.9 89 Emergency Mgmt & Amtrak Police Corp $4.8 $3.8 42.5 0.2 25.0 3.0 1.6 0.4 3.5 2.7 0.1 1.7 0.0 0.0 0.0 0.1 1.8 0.0 0.1 0.0 79.6 11.9 Emergency Mgmt & Amtrak Police Corp $5.3 $4.2 44.9 0.2 27.5 3.3 1.6 0.4 3.5 2.7 0.1 1.7 0.0 0.0 0.0 0.1 1.8 0.0 0.1 0.0 84.9 12.6 $84.9 Total Security Expenses $9.5 45.0 30.9 2.0 6.2 1.8 0.1 0.1 1.9 0.1 97.5 9.6 9.6 $22.2 $107.1 Total Security Expenses $8.7 42.7 28.0 2.0 6.2 1.8 0.1 0.1 1.9 0.1 91.5 9.4 9.4 $21.4 $101.0 Appendix IV: Operating Expenses by Account and Department Total Operating Expenses $ millions GM NEC Operations GM State Supported Services GM Long Distance General Manager Eastern Region Mechanical Engineering Transportation Officer Customer Service Operations Research & Planning Safety Business Operations System Operations COO Staff Historical/Inactive Cost Centers OH VP Operations Total Operations Finance Procurement Real Estate NEC Advisory Comm (reimbursed) Treasury Mandatory NEC Electric Propulsion Power Corp Common Total CFO CEO Marketing IT Amtrak Police Human Capital Management Emergency Mgmt & Corp Security Corp Research & Strategy NEC IID General Counsel Government Affairs & Corp Comm Subsidiaries & Elimination Planning Contingency Core Operating Expenses Reimbursable Expenses Commuter Expenses Commercial Development Expenses Total Operating Expenses FY2013 Actual $669.6 240.2 718.2 0.7 60.0 213.1 150.5 104.1 17.3 15.0 3.9 20.7 4.1 (12.1) 0.0 2,205.4 44.8 56.7 1.5 3.3 91.4 99.4 (98.6) 198.5 1.8 173.8 196.8 66.3 41.7 9.4 2.3 7.4 56.3 8.5 4.5 0.0 $2,973.0 216.6 105.7 18.2 $3,313.4 FY2014 Budget $690.0 237.3 712.7 0.0 94.1 227.3 157.4 105.9 14.5 16.4 10.3 21.5 10.9 0.0 (2.3) 2,295.9 49.0 58.4 1.9 4.3 96.5 100.4 (90.4) 220.2 2.0 180.5 212.5 74.6 53.8 11.3 1.8 9.6 63.6 9.3 4.9 12.9 $3,153.0 248.5 58.9 5.4 $3,465.8 FY2015 Plan $705.8 241.4 726.7 0.0 91.4 229.6 176.2 106.6 14.6 16.7 10.4 22.2 16.1 0.0 (2.3) 2,355.5 51.1 60.5 2.0 4.3 101.3 100.7 (68.9) 251.0 2.1 182.8 214.6 77.1 54.1 11.6 1.9 10.0 64.9 9.6 3.1 10.1 $3,248.5 252.0 61.2 5.6 $3,567.3 FY2016 Plan $724.8 246.3 750.7 0.1 92.9 236.9 173.7 107.7 14.7 17.0 10.6 22.9 16.4 0.0 (2.3) 2,412.4 52.9 62.6 2.1 4.4 101.5 101.6 (67.6) 257.4 2.2 186.6 216.9 79.5 55.8 11.9 2.0 10.4 66.2 9.9 3.1 42.1 $3,356.5 254.9 63.5 5.8 $3,680.8 FY2017 Plan $743.6 251.3 769.2 0.1 93.5 244.6 171.3 108.7 14.8 17.4 10.8 23.7 16.8 0.0 (2.3) 2,463.6 54.8 64.7 2.1 4.5 101.5 102.7 (64.1) 266.4 2.3 190.5 219.3 82.1 57.6 12.2 2.0 10.7 67.5 10.3 3.1 56.0 $3,443.6 258.0 65.9 6.1 $3,773.5 FY2018 Plan $764.3 256.8 789.5 0.1 95.6 253.1 168.6 109.8 15.0 17.7 11.1 24.5 17.1 0.0 (2.3) 2,520.8 56.9 67.1 2.2 4.6 101.5 103.9 (62.8) 273.4 2.4 194.8 221.9 84.9 59.5 12.5 2.1 11.2 69.0 10.7 3.1 74.3 $3,540.5 261.2 68.5 6.3 $3,876.6 The sum of the individual amounts may differ slightly from Totals due to rounding Excl udes cos ts tha t do not i mpa ct Amtra k's need for Federa l opera ti ng s upport. Items excl uded a re cos ts for Amtra k's Offi ce of the Ins pector Genera l (funded i ndependentl y), non-ca pi ta l i za bl e cos ts a nd certa i n contri buti ons a s s oci a ted wi th ca pi ta l projects (funded by ca pi ta l a ppropri a ti on), net i nteres t expens e (funded by debt s ervi ce a ppropri a ti on), depreci a ti on (non-ca s h expens e), a nd a ccrua l s for es ti ma ted future pos t-reti rement empl oyee benefi ts (non-ca s h expens e). 90 Salaries $ millions GM NEC Operations GM State Supported Services GM Long Distance General Manager Eastern Region Mechanical Engineering Transportation Officer Customer Service Operations Research & Planning Safety Business Operations System Operations COO Staff Historical/Inactive Cost Centers Total Operations Finance Procurement Real Estate NEC Advisory Comm (reimbursed) Corp Common Total CFO CEO Marketing IT Amtrak Police Human Capital Management Emergency Mgmt & Corp Security Corp Research & Strategy NEC IID General Counsel Government Affairs & Corp Comm Core Operating Expenses Reimbursable Expenses Commuter Expenses Commercial Development Expenses Total Operating Expenses FY2013 Actual $28.1 9.1 22.7 0.3 17.0 25.9 7.5 5.1 2.7 2.0 0.9 9.7 1.7 0.2 133.1 16.5 11.7 0.8 0.6 0.0 29.6 0.9 16.4 23.6 3.8 17.1 3.4 0.7 3.3 13.9 3.7 $249.5 3.6 4.6 2.3 $260.0 FY2014 Budget $29.8 9.7 24.6 0.0 18.5 27.5 6.2 5.0 1.6 2.5 3.1 12.1 4.4 0.0 145.1 19.5 12.2 0.8 0.9 1.9 35.4 1.0 17.6 27.5 4.4 20.9 3.5 0.8 4.4 15.4 4.1 $280.2 7.9 2.2 0.8 $291.2 FY2015 Plan $31.1 10.2 25.6 0.0 19.4 26.5 6.5 5.2 1.6 2.6 3.2 12.5 4.6 0.0 148.9 20.4 12.8 0.8 1.0 26.0 61.0 1.1 18.4 28.7 4.6 21.8 3.7 0.8 4.6 16.1 4.3 $314.0 8.5 2.4 0.9 $325.8 FY2016 Plan $32.4 10.6 26.7 0.0 20.2 28.3 6.9 5.5 1.7 2.7 3.4 12.8 4.7 0.0 155.8 21.3 13.3 0.9 1.0 26.1 62.6 1.1 19.2 29.9 4.8 22.8 3.8 0.9 4.8 16.8 4.5 $327.0 8.6 2.6 1.0 $339.2 FY2017 Plan $33.8 11.1 27.7 0.0 21.1 30.1 7.3 5.7 1.7 2.8 3.5 13.2 4.9 0.0 162.9 22.2 13.9 0.9 1.1 26.2 64.3 1.2 20.1 31.2 5.1 23.8 4.0 0.9 5.0 17.5 4.7 $340.7 8.6 2.8 1.1 $353.2 FY2018 Plan $35.3 11.5 28.9 0.1 22.0 32.1 7.7 5.9 1.8 2.9 3.6 13.6 5.1 0.0 170.4 23.2 14.5 1.0 1.1 26.3 66.1 1.2 20.9 32.5 5.3 24.9 4.2 0.9 5.2 18.3 4.9 $354.8 8.7 3.1 1.2 $367.8 Salaries include only non-agreement employee payroll. Agreement employee payroll is recorded to Wages & Overtime. The sum of the individual amounts may differ slightly from Totals due to rounding Excl udes cos ts tha t do not i mpa ct Amtra k's need for Federa l opera ti ng s upport. Items excl uded a re cos ts for Amtra k's Offi ce of the Ins pector Genera l (funded i ndependentl y), non-ca pi ta l i za bl e cos ts a nd certa i n contri buti ons a s s oci a ted wi th ca pi ta l projects (funded by ca pi ta l a ppropri a ti on), net i nteres t expens e (funded by debt s ervi ce a ppropri a ti on), depreci a ti on (non-ca s h expens e), a nd a ccrua l s for es ti ma ted future pos t-reti rement empl oyee benefi ts (non-ca s h expens e). 91 Wages & Overtime $ millions GM NEC Operations GM State Supported Services GM Long Distance Mechanical Engineering Transportation Officer Customer Service Operations Research & Planning Safety System Operations Total Operations Finance Procurement Corp Common Total CFO Marketing IT Amtrak Police Human Capital Management Emergency Mgmt & Corp Security Subsidiaries & Elimination Planning Contingency Core Operating Expenses Reimbursable Expenses Commuter Expenses Commercial Development Expenses Total Operating Expenses FY2013 Actual $316.0 80.4 306.9 45.4 130.8 1.0 0.1 0.6 2.3 0.8 884.4 3.7 17.8 (12.2) 9.4 41.4 0.3 34.8 0.1 0.1 12.2 0.0 $982.7 52.3 37.2 0.5 $1,072.6 FY2014 Budget $325.9 81.4 314.1 47.4 133.2 0.8 0.2 0.4 2.5 0.6 906.6 3.6 18.7 (12.9) 9.4 43.0 0.3 40.3 0.1 0.2 12.9 0.0 $1,012.8 83.7 13.1 0.2 $1,109.8 FY2015 Plan $331.7 83.5 319.9 48.8 136.7 0.9 0.2 0.4 2.6 0.6 925.3 3.7 19.2 (12.9) 10.1 44.2 0.3 41.4 0.1 0.2 12.9 (5.2) $1,029.2 84.6 14.1 0.2 $1,128.2 FY2016 Plan $340.4 85.7 330.6 50.2 140.2 0.9 0.2 0.4 2.7 0.6 952.1 3.8 19.8 (12.9) 10.8 45.4 0.3 42.5 0.1 0.2 12.9 (0.7) $1,063.5 85.6 15.1 0.3 $1,164.4 FY2017 Plan $349.1 88.0 339.5 51.7 143.9 0.9 0.2 0.5 2.8 0.7 977.2 3.9 20.4 (12.9) 11.5 46.6 0.3 43.6 0.1 0.2 12.9 3.3 $1,095.7 86.7 16.1 0.3 $1,198.8 FY2018 Plan $358.1 90.3 348.7 53.2 147.6 0.9 0.2 0.5 2.9 0.7 1,003.0 4.0 21.0 (12.9) 12.2 47.9 0.3 44.8 0.1 0.2 12.9 8.2 $1,129.7 87.7 17.1 0.3 $1,234.8 Wages & Overtime include straight time and overtime payroll for agreement employees. Non-agreement employee payroll costs are recorded to Salaries. The sum of the individual amounts may differ slightly from Totals due to rounding Excl udes cos ts tha t do not i mpa ct Amtra k's need for Federa l opera ti ng s upport. Items excl uded a re cos ts for Amtra k's Offi ce of the Ins pector Genera l (funded i ndependentl y), non-ca pi ta l i za bl e cos ts a nd certa i n contri buti ons a s s oci a ted wi th ca pi ta l projects (funded by ca pi ta l a ppropri a ti on), net i nteres t expens e (funded by debt s ervi ce a ppropri a ti on), depreci a ti on (non-ca s h expens e), a nd a ccrua l s for es ti ma ted future pos t-reti rement empl oyee benefi ts (non-ca s h expens e). 92 Employee Benefits Expenses $ millions GM NEC Operations GM State Supported Services GM Long Distance General Manager Eastern Region Mechanical Engineering Transportation Officer Customer Service Operations Research & Planning Safety Business Operations System Operations COO Staff Historical/Inactive Cost Centers Total Operations Finance Procurement Real Estate NEC Advisory Comm (reimbursed) Treasury Mandatory Corp Common Total CFO CEO Marketing IT Amtrak Police Human Capital Management Emergency Mgmt & Corp Security Corp Research & Strategy NEC IID General Counsel Government Affairs & Corp Comm Planning Contingency Core Operating Expenses Reimbursable Expenses Commuter Expenses Commercial Development Expenses Total Operating Expenses FY2013 Actual $171.2 46.0 167.6 0.3 37.0 83.6 6.5 4.1 2.4 2.8 0.7 8.0 1.4 (12.2) 519.4 15.1 18.7 0.6 0.5 0.3 (129.2) (94.1) 0.7 34.0 18.8 21.2 13.7 2.8 0.6 2.7 11.0 2.9 0.0 $533.7 24.1 37.2 3.9 $599.0 FY2014 Budget $172.1 45.1 165.0 0.0 38.2 97.1 5.1 3.8 1.0 3.1 2.3 7.4 3.6 0.0 543.9 16.3 18.8 0.6 0.7 0.0 (129.1) (92.7) 0.8 34.6 20.0 22.6 14.0 2.7 0.6 3.3 11.4 3.1 12.9 $577.2 7.3 27.0 2.5 $614.0 FY2015 Plan $181.1 47.5 173.7 0.0 40.2 101.5 5.5 4.1 1.1 3.2 2.4 7.8 3.8 0.0 571.8 17.2 19.7 0.6 0.8 0.0 (140.2) (101.8) 0.8 36.4 21.1 23.8 14.8 2.9 0.6 3.5 12.0 3.3 12.9 $602.2 8.5 28.1 2.6 $641.3 FY2016 Plan $189.5 49.7 181.9 0.0 42.1 105.6 5.8 4.3 1.1 3.4 2.5 8.1 3.9 0.0 598.1 18.1 20.7 0.7 0.8 0.0 (138.6) (98.4) 0.9 38.2 22.1 25.0 15.5 3.0 0.6 3.7 12.6 3.4 12.9 $637.5 9.6 29.1 2.7 $678.9 FY2017 Plan $198.3 52.0 190.4 0.0 44.0 109.9 6.2 4.5 1.2 3.5 2.6 8.4 4.1 0.0 625.2 18.9 21.6 0.7 0.8 0.0 (134.8) (92.7) 0.9 40.0 23.2 26.1 16.2 3.2 0.7 3.8 13.2 3.6 12.9 $676.4 10.7 30.2 2.8 $720.1 FY2018 Plan $208.6 54.7 200.4 0.1 46.3 114.8 6.6 4.7 1.2 3.7 2.7 8.8 4.3 0.0 657.0 20.0 22.8 0.7 0.9 0.0 (133.1) (88.7) 0.9 42.1 24.5 27.5 17.1 3.3 0.7 4.1 13.9 3.8 12.9 $719.0 12.0 31.4 3.0 $765.4 Employee Benefits include the company funded costs for employee payroll taxes (including RRTA Tier II), health insurance, pension, and savings plans. The sum of the individual amounts may differ slightly from Totals due to rounding Excl udes cos ts tha t do not i mpa ct Amtra k's need for Federa l opera ti ng s upport. Items excl uded a re cos ts for Amtra k's Offi ce of the Ins pector Genera l (funded i ndependentl y), non-ca pi ta l i za bl e cos ts a nd certa i n contri buti ons a s s oci a ted wi th ca pi ta l projects (funded by ca pi ta l a ppropri a ti on), net i nteres t expens e (funded by debt s ervi ce a ppropri a ti on), depreci a ti on (non-ca s h expens e), a nd a ccrua l s for es ti ma ted future pos t-reti rement empl oyee benefi ts (non-ca s h expens e). 93 Employee Related $ millions GM NEC Operations GM State Supported Services GM Long Distance Mechanical Engineering Transportation Officer Customer Service Operations Research & Planning Safety Business Operations System Operations COO Staff Historical/Inactive Cost Centers Total Operations Finance Procurement Real Estate NEC Advisory Comm (reimbursed) Corp Common Total CFO Marketing IT Amtrak Police Human Capital Management Emergency Mgmt & Corp Security Corp Research & Strategy NEC IID General Counsel Government Affairs & Corp Comm Subsidiaries & Elimination Planning Contingency Core Operating Expenses Reimbursable Expenses Commuter Expenses Commercial Development Expenses Total Operating Expenses FY2013 Actual $2.2 0.8 2.9 1.6 6.4 2.6 1.2 0.1 0.6 0.1 0.1 0.3 0.1 18.9 0.3 0.7 0.1 0.0 (0.0) 1.0 0.7 0.5 1.3 4.5 0.2 0.0 0.0 0.6 0.2 0.1 0.0 $27.9 0.9 0.3 0.1 $29.2 FY2014 Budget $2.0 1.0 3.2 1.4 5.2 2.5 0.3 0.1 0.8 0.7 0.1 0.8 0.0 18.1 0.3 0.4 0.1 0.1 0.1 1.0 0.8 0.6 1.6 5.9 0.4 0.1 0.1 0.6 0.2 (0.0) 0.0 $29.4 0.8 0.1 0.0 $30.4 FY2015 Plan $2.0 1.0 3.2 1.4 3.5 2.4 0.3 0.1 0.8 0.6 0.1 0.7 0.0 16.1 0.4 0.4 0.1 0.1 0.1 1.0 0.8 0.4 1.6 5.8 0.4 0.1 0.1 0.6 0.2 (0.0) 0.0 $27.1 0.8 0.1 0.0 $28.1 FY2016 Plan $2.0 1.0 3.2 1.4 3.5 2.4 0.3 0.1 0.8 0.6 0.1 0.7 0.0 16.1 0.4 0.4 0.1 0.1 0.1 1.0 0.8 0.4 1.6 5.8 0.4 0.1 0.1 0.6 0.2 (0.0) 0.3 $27.4 0.8 0.1 0.0 $28.4 FY2017 Plan $2.0 1.0 3.2 1.4 3.5 2.4 0.3 0.1 0.8 0.6 0.1 0.7 0.0 16.1 0.4 0.4 0.1 0.1 0.1 1.0 0.8 0.4 1.6 5.8 0.4 0.1 0.1 0.6 0.2 (0.0) 0.6 $27.7 0.8 0.1 0.0 $28.7 FY2018 Plan $2.0 1.0 3.2 1.4 3.5 2.4 0.3 0.1 0.8 0.6 0.1 0.7 0.0 16.1 0.4 0.4 0.1 0.1 0.1 1.0 0.8 0.4 1.6 5.8 0.4 0.1 0.1 0.6 0.2 (0.0) 0.9 $28.1 0.8 0.1 0.0 $29.0 Employee Related expenses include travel costs, employee recruiting and relocation, employee uniforms, and preemployment medical screening The sum of the individual amounts may differ slightly from Totals due to rounding Excl udes cos ts tha t do not i mpa ct Amtra k's need for Federa l opera ti ng s upport. Items excl uded a re cos ts for Amtra k's Offi ce of the Ins pector Genera l (funded i ndependentl y), non-ca pi ta l i za bl e cos ts a nd certa i n contri buti ons a s s oci a ted wi th ca pi ta l projects (funded by ca pi ta l a ppropri a ti on), net i nteres t expens e (funded by debt s ervi ce a ppropri a ti on), depreci a ti on (non-ca s h expens e), a nd a ccrua l s for es ti ma ted future pos t-reti rement empl oyee benefi ts (non-ca s h expens e). 94 Train Operations $ millions GM NEC Operations GM State Supported Services GM Long Distance Engineering Transportation Officer Customer Service Operations Research & Planning Business Operations System Operations Total Operations Government Affairs & Corp Comm Planning Contingency Core Operating Expenses Reimbursable Expenses Commuter Expenses Total Operating Expenses FY2013 Actual $5.7 32.2 18.4 0.2 112.8 89.0 11.1 1.0 0.5 270.9 0.0 0.0 $271.0 0.3 0.7 $272.0 FY2014 Budget $5.8 31.4 18.4 0.1 121.8 91.8 11.2 0.2 0.1 280.7 0.1 0.0 $280.9 0.5 0.2 $281.6 FY2015 Plan $5.7 31.4 18.9 0.1 139.9 92.1 11.2 0.2 0.1 299.6 0.1 0.0 $299.8 0.5 0.2 $300.4 FY2016 Plan $5.8 31.4 19.6 0.1 136.7 92.7 11.2 0.2 0.1 297.8 0.1 12.3 $310.2 0.5 0.2 $310.9 FY2017 Plan $5.8 31.4 19.6 0.1 133.5 93.3 11.2 0.2 0.1 295.2 0.1 9.2 $304.5 0.5 0.2 $305.2 FY2018 Plan $5.8 31.4 19.6 0.1 129.9 93.8 11.2 0.2 0.1 292.1 0.1 6.9 $299.1 0.5 0.2 $299.8 Train Operations expenses include access to host railroads and related host railroad costs, cost of Food & Beverage inventory and supplies including cost of outsourced commissary operations, costs of train crew layover including transportation, connecting motor coach services, contracted vehicle loading/unloading service for auto train, and rental of locomotives and cars. The sum of the individual amounts may differ slightly from Totals due to rounding Excl udes cos ts tha t do not i mpa ct Amtra k's need for Federa l opera ting s upport. Items excl uded a re cos ts for Amtra k's Offi ce of the Ins pector Genera l (funded i ndependently), non-ca pi tal i za bl e cos ts a nd certai n contri butions a s s oci a ted wi th ca pi tal projects (funded by ca pi tal a ppropri a tion), net i nteres t expens e (funded by debt s ervi ce a ppropri a tion), depreci a tion (non-ca s h expens e), a nd a ccrua l s for es tima ted future pos t-retirement empl oyee benefi ts (non-ca s h expens e). 95 Fuel, Power, & Utilities $ millions GM NEC Operations GM State Supported Services GM Long Distance Mechanical Engineering Transportation Officer Customer Service System Operations Total Operations Procurement Treasury Mandatory NEC Electric Propulsion Power Corp Common Total CFO Marketing Human Capital Management Subsidiaries & Elimination Planning Contingency Core Operating Expenses Reimbursable Expenses Commuter Expenses Commercial Development Expenses Total Operating Expenses FY2013 Actual $66.2 42.0 112.2 4.6 8.0 18.2 0.1 0.5 251.6 0.3 6.5 99.4 0.7 106.9 0.5 0.0 0.0 0.0 $359.1 0.9 9.9 0.2 $370.1 FY2014 Budget $68.1 40.4 112.6 4.4 7.7 18.4 0.1 0.2 251.9 0.4 4.1 100.4 0.6 105.6 0.5 0.1 (0.1) 0.0 $357.9 11.2 3.1 0.1 $372.3 FY2015 Plan $68.1 39.6 110.7 4.4 7.7 18.4 0.1 0.2 249.2 0.4 4.1 100.7 0.6 105.8 0.5 0.1 (0.1) 0.0 $355.6 11.2 3.1 0.1 $369.9 FY2016 Plan $68.5 39.6 111.8 4.4 7.8 18.4 0.1 0.2 250.8 0.4 4.1 101.6 0.6 106.7 0.5 0.1 (0.1) 4.3 $362.3 11.2 3.1 0.1 $376.7 FY2017 Plan $68.6 39.6 111.9 4.5 7.9 18.4 0.1 0.2 251.1 0.4 4.1 102.7 0.6 107.9 0.5 0.1 (0.1) 8.0 $367.5 11.2 3.1 0.1 $381.9 FY2018 Plan $68.8 39.6 112.0 4.5 7.9 18.4 0.1 0.2 251.5 0.4 4.1 103.9 0.6 109.0 0.5 0.1 (0.1) 12.4 $373.5 11.2 3.1 0.1 $387.9 Fuel, Power, and Utilities include the cost of electric propulsion power for the electric locomotives, cost of diesel fuel for the diesel locomotives, and utilities for buildings, stations, and facilities The sum of the individual amounts may differ slightly from Totals due to rounding Excl udes cos ts tha t do not i mpa ct Amtra k's need for Federa l opera ti ng s upport. Items excl uded a re cos ts for Amtra k's Offi ce of the Ins pector Genera l (funded i ndependentl y), non-ca pi ta l i za bl e cos ts a nd certa i n contri buti ons a s s oci a ted wi th ca pi ta l projects (funded by ca pi ta l a ppropri a ti on), net i nteres t expens e (funded by debt s ervi ce a ppropri a ti on), depreci a ti on (non-ca s h expens e), a nd a ccrua l s for es ti ma ted future pos t-reti rement empl oyee benefi ts (non-ca s h expens e). 96 Materials $ millions GM NEC Operations GM State Supported Services GM Long Distance Mechanical Engineering Transportation Officer System Operations Total Operations Procurement Corp Common Total CFO Amtrak Police Subsidiaries & Elimination Planning Contingency Core Operating Expenses Reimbursable Expenses Commuter Expenses Total Operating Expenses FY2013 Actual $64.2 16.8 55.3 (22.5) 14.2 0.5 0.1 128.8 0.5 4.3 4.8 0.1 0.5 0.0 $134.2 28.7 5.9 $168.8 FY2014 Budget $67.5 14.6 43.9 7.6 18.3 0.8 0.1 152.9 0.2 13.1 13.3 0.0 0.0 0.0 $166.3 21.1 1.5 $188.9 FY2015 Plan $67.5 14.6 43.9 2.1 17.8 0.8 0.1 146.8 0.2 13.1 13.3 0.0 0.0 0.0 $160.2 21.1 1.5 $182.8 FY2016 Plan $67.7 14.6 45.0 0.6 17.8 0.8 0.1 146.7 0.2 13.1 13.3 0.0 0.0 2.1 $162.2 21.1 1.5 $184.7 FY2017 Plan $67.7 14.6 45.0 (1.7) 17.8 0.8 0.1 144.3 0.2 13.1 13.3 0.0 0.0 3.9 $161.5 21.1 1.5 $184.1 FY2018 Plan $67.7 14.6 45.0 (3.1) 17.8 0.8 0.1 143.0 0.2 13.1 13.3 0.0 0.0 6.0 $162.3 21.1 1.5 $184.9 Materials include the parts, components, and supplies used in the maintenance of track infrastructure and rolling stock The sum of the individual amounts may differ slightly from Totals due to rounding Excl udes cos ts tha t do not i mpa ct Amtra k's need for Federa l opera ting s upport. Items excl uded a re cos ts for Amtra k's Offi ce of the Ins pector Genera l (funded i ndependently), non-ca pi tal i za bl e cos ts a nd certai n contri butions a s s oci a ted wi th ca pi tal projects (funded by ca pi tal a ppropri a tion), net i nteres t expens e (funded by debt s ervi ce a ppropri a tion), depreci a tion (non-ca s h expens e), a nd a ccrua l s for es tima ted future pos t-retirement empl oyee benefi ts (non-ca s h expens e). 97 Facility, Communication, & Office $ millions GM NEC Operations GM State Supported Services GM Long Distance Mechanical Engineering Transportation Officer Customer Service Operations Research & Planning Safety Business Operations System Operations COO Staff Total Operations Finance Procurement NEC Advisory Comm (reimbursed) Corp Common Total CFO CEO Marketing IT Amtrak Police Human Capital Management Emergency Mgmt & Corp Security Corp Research & Strategy NEC IID General Counsel Government Affairs & Corp Comm Subsidiaries & Elimination Planning Contingency Core Operating Expenses Reimbursable Expenses Commuter Expenses Commercial Development Expenses Total Operating Expenses FY2013 Actual $27.3 9.3 25.8 6.0 18.1 0.8 2.6 0.1 0.4 0.7 1.0 0.8 92.9 1.8 4.6 0.1 11.3 17.8 0.1 8.0 35.2 3.3 2.1 2.5 0.0 0.1 1.7 0.5 (7.3) 0.0 $157.1 9.6 1.5 8.0 $176.3 FY2014 Budget $28.4 10.9 25.2 7.9 17.4 0.9 2.9 0.0 0.4 3.4 0.9 1.3 99.5 2.4 4.8 0.3 8.6 16.0 0.1 8.4 36.5 3.5 3.8 2.6 0.1 0.2 1.9 0.5 (8.5) 0.0 $164.6 10.6 0.7 0.8 $176.7 FY2015 Plan $28.4 10.9 25.1 7.9 17.3 0.9 2.9 0.0 0.3 3.4 0.9 1.3 99.2 2.5 4.9 0.3 8.6 16.2 0.1 8.4 36.5 3.5 2.5 2.6 0.1 0.2 1.9 0.5 (8.5) 0.0 $163.1 10.6 0.7 0.8 $175.1 FY2016 Plan $28.4 10.9 25.1 7.9 17.3 0.9 2.9 0.0 0.3 3.4 0.9 1.3 99.2 2.5 4.9 0.3 8.6 16.2 0.1 8.4 36.5 3.5 2.5 2.6 0.1 0.2 1.9 0.5 (8.5) 2.0 $165.1 10.6 0.7 0.8 $177.1 FY2017 Plan $28.4 10.9 25.2 7.9 17.3 0.9 2.9 0.0 0.3 3.4 0.9 1.3 99.2 2.5 4.9 0.3 8.6 16.2 0.1 8.4 36.5 3.5 2.5 2.6 0.1 0.2 1.9 0.5 (8.5) 3.7 $166.8 10.6 0.7 0.8 $178.9 FY2018 Plan $28.4 10.9 25.2 7.9 17.3 0.9 2.9 0.0 0.3 3.4 0.9 1.3 99.2 2.5 4.9 0.3 8.6 16.2 0.1 8.4 36.5 3.5 2.5 2.6 0.1 0.2 1.9 0.5 (8.5) 5.8 $168.9 10.6 0.7 0.8 $181.0 Facility, Communication, and Office expenses include rental of stations, offices, and facilities; office supplies and equipment including personal computers; building security services; building maintenance and repair services and materials; data and voice network and communication costs including cellular phones. The sum of the individual amounts may differ slightly from Totals due to rounding Excl udes cos ts tha t do not i mpa ct Amtra k's need for Federa l opera ti ng s upport. Items excl uded a re cos ts for Amtra k's Offi ce of the Ins pector Genera l (funded i ndependentl y), non-ca pi ta l i za bl e cos ts a nd certa i n contri buti ons a s s oci a ted wi th ca pi ta l projects (funded by ca pi ta l a ppropri a ti on), net i nteres t expens e (funded by debt s ervi ce a ppropri a ti on), depreci a ti on (non-ca s h expens e), a nd a ccrua l s for es ti ma ted future pos t-reti rement empl oyee benefi ts (non-ca s h expens e). 98 Advertising & Sales $ millions GM NEC Operations GM Long Distance Total Operations Treasury Mandatory Total CFO Marketing Human Capital Management Government Affairs & Corp Comm Planning Contingency Core Operating Expenses Reimbursable Expenses Total Operating Expenses FY2013 Actual $0.0 0.0 0.0 43.6 43.6 51.2 0.0 0.1 0.0 $95.0 0.0 $95.0 FY2014 Budget $0.0 (0.0) 0.0 46.0 46.0 51.4 0.1 0.1 0.0 $97.6 0.1 $97.7 FY2015 Plan $0.0 (0.0) 0.0 46.0 46.0 50.0 0.1 0.0 0.0 $96.1 0.1 $96.3 FY2016 Plan $0.0 0.1 0.2 46.0 46.0 50.0 0.1 0.0 1.1 $97.5 0.1 $97.6 FY2017 Plan $0.0 0.1 0.2 46.0 46.0 50.0 0.1 0.0 2.1 $98.4 0.1 $98.6 FY2018 Plan $0.0 0.1 0.2 46.0 46.0 50.0 0.1 0.0 3.2 $99.6 0.1 $99.7 Advertising and Sales includes all advertising media and production costs; credit card commissions; cost of Amtrak Guest Rewards program; timetables and railway guides; third party sales channels such as ticket agents and airline systems The sum of the individual amounts may differ slightly from Totals due to rounding Excl udes cos ts tha t do not i mpa ct Amtra k's need for Federa l opera ting s upport. Items excl uded a re cos ts for Amtra k's Offi ce of the Ins pector Genera l (funded i ndependently), non-ca pi tal i za bl e cos ts a nd certai n contri butions a s s oci a ted wi th ca pi tal projects (funded by ca pi tal a ppropri a tion), net i nteres t expens e (funded by debt s ervi ce a ppropri a tion), depreci a tion (non-ca s h expens e), a nd a ccrua l s for es tima ted future pos t-retirement empl oyee benefi ts (non-ca s h expens e). 99 Casualty & Other Claims $ millions GM Long Distance Total Operations Corp Common Total CFO General Counsel Subsidiaries & Elimination Planning Contingency Core Operating Expenses Total Operating Expenses FY2013 Actual 0.0 0.0 59.6 59.6 4.4 2.5 0.0 $66.6 $66.6 FY2014 Budget 0.1 0.1 57.3 57.3 4.7 0.4 0.0 $62.6 $62.6 FY2015 Plan 0.1 0.1 64.0 64.0 4.7 1.1 0.0 $70.0 $70.0 FY2016 Plan 0.1 0.1 64.0 64.0 4.7 1.1 0.8 $70.8 $70.8 FY2017 Plan 0.1 0.1 64.0 64.0 4.7 1.1 1.5 $71.4 $71.4 FY2018 Plan 0.1 0.1 64.0 64.0 4.7 1.1 2.3 $72.3 $72.3 Casualty & Other Claims include costs associated with claims under the Federal Employers Liability Act (FELA); passenger claims; legal disbursements; cost of investigations, surveillance, and expert witnesses The sum of the individual amounts may differ slightly from Totals due to rounding Excl udes cos ts tha t do not i mpa ct Amtra k's need for Federa l opera ting s upport. Items excl uded a re cos ts for Amtra k's Offi ce of the Ins pector Genera l (funded i ndependently), non-ca pi tal i za bl e cos ts a nd certai n contri butions a s s oci a ted wi th ca pi tal projects (funded by ca pi tal a ppropri a tion), net i nteres t expens e (funded by debt s ervi ce a ppropri a tion), depreci a tion (non-ca s h expens e), a nd a ccrua l s for es tima ted future pos t-retirement empl oyee benefi ts (non-ca s h expens e). 100 Professional Fees Expenses $ millions GM NEC Operations GM State Supported Services GM Long Distance Mechanical Engineering Transportation Officer Customer Service Operations Research & Planning Safety Business Operations Total Operations Finance Procurement Real Estate NEC Advisory Comm (reimbursed) Treasury Mandatory Corp Common Total CFO CEO Marketing IT Amtrak Police Human Capital Management Emergency Mgmt & Corp Security Corp Research & Strategy NEC IID General Counsel Government Affairs & Corp Comm Subsidiaries & Elimination Planning Contingency Core Operating Expenses Reimbursable Expenses Commuter Expenses Commercial Development Expenses Total Operating Expenses FY2013 Actual $0.1 0.7 1.1 5.5 3.7 0.1 0.1 0.0 6.7 0.0 18.0 4.9 1.7 0.0 2.0 1.9 2.1 12.6 0.0 13.9 16.1 0.4 3.8 0.4 1.0 1.2 23.2 1.1 0.4 0.0 $92.0 3.0 1.8 2.1 $98.9 FY2014 Budget $0.0 0.6 1.6 5.2 4.6 0.2 0.3 0.1 6.9 0.3 19.9 5.0 1.9 0.4 2.2 1.3 1.5 12.3 0.1 15.3 15.3 0.1 7.6 1.7 0.3 1.5 27.2 1.0 0.2 0.0 $102.5 3.8 0.0 0.1 $106.5 FY2015 Plan $0.0 0.6 1.6 5.2 4.6 0.2 0.3 0.1 6.9 0.3 19.9 5.0 1.9 0.4 2.2 1.3 1.5 12.3 0.1 15.3 15.3 0.1 7.6 1.7 0.3 1.5 27.2 1.0 0.2 0.0 $102.5 3.8 0.0 0.1 $106.5 FY2016 Plan $0.0 0.6 1.6 5.2 4.6 0.2 0.3 0.1 6.9 0.3 19.9 5.0 1.9 0.4 2.2 1.3 1.5 12.3 0.1 15.3 15.3 0.1 7.6 1.7 0.3 1.5 27.2 1.0 0.2 1.2 $103.8 3.8 0.0 0.1 $107.7 FY2017 Plan $0.0 0.6 1.6 5.2 4.6 0.2 0.3 0.1 6.9 0.3 19.9 5.0 1.9 0.4 2.2 1.3 1.5 12.3 0.1 15.3 15.3 0.1 7.6 1.7 0.3 1.5 27.2 1.0 0.2 2.3 $104.8 3.8 0.0 0.1 $108.8 FY2018 Plan $0.0 0.6 1.6 5.2 4.6 0.2 0.3 0.1 6.9 0.3 19.9 5.0 1.9 0.4 2.2 1.3 1.5 12.3 0.1 15.3 15.3 0.1 7.6 1.7 0.3 1.5 27.2 1.0 0.2 3.5 $106.1 3.8 0.0 0.1 $110.1 Professional Services includes the cost of consultants, advertising agencies, and outside legal counsel The sum of the individual amounts may differ slightly from Totals due to rounding Excl udes cos ts tha t do not i mpa ct Amtra k's need for Federa l opera ti ng s upport. Items excl uded a re cos ts for Amtra k's Offi ce of the Ins pector Genera l (funded i ndependentl y), non-ca pi ta l i za bl e cos ts a nd certa i n contri buti ons a s s oci a ted wi th ca pi ta l projects (funded by ca pi ta l a ppropri a ti on), net i nteres t expens e (funded by debt s ervi ce a ppropri a ti on), depreci a ti on (non-ca s h expens e), a nd a ccrua l s for es ti ma ted future pos t-reti rement empl oyee benefi ts (non-ca s h expens e). 101 Data Processing Services $ millions GM NEC Operations GM State Supported Services GM Long Distance Mechanical Engineering Transportation Officer Customer Service Safety Business Operations Total Operations Finance Procurement Corp Common Total CFO Marketing IT Amtrak Police Human Capital Management General Counsel Government Affairs & Corp Comm Planning Contingency Core Operating Expenses Reimbursable Expenses Commuter Expenses Commercial Development Expenses Total Operating Expenses FY2013 Actual $0.2 0.2 0.3 0.7 1.8 0.3 0.4 0.1 0.5 4.5 1.5 0.4 0.0 1.9 3.6 102.0 0.1 0.3 0.1 0.0 0.0 $112.6 2.3 0.5 0.2 $115.6 FY2014 Budget $0.1 0.2 0.2 0.9 1.9 0.4 0.4 0.1 0.3 4.4 0.7 0.6 0.5 1.7 4.3 112.3 0.0 1.1 0.1 0.1 0.0 $124.1 1.0 0.0 0.3 $125.4 FY2015 Plan $0.1 0.2 0.2 0.9 1.9 0.4 0.4 0.1 0.3 4.4 0.7 0.6 0.5 1.7 4.3 112.3 0.0 1.1 0.1 0.1 0.0 $124.1 1.0 0.0 0.3 $125.4 FY2016 Plan $0.1 0.2 0.2 0.9 1.9 0.4 0.4 0.1 0.3 4.4 0.7 0.6 0.5 1.7 4.3 112.3 0.0 1.1 0.1 0.1 1.4 $125.5 1.0 0.0 0.3 $126.8 FY2017 Plan $0.1 0.2 0.2 0.9 1.9 0.4 0.4 0.1 0.3 4.4 0.7 0.6 0.5 1.7 4.3 112.3 0.0 1.1 0.1 0.1 2.7 $126.7 1.0 0.0 0.3 $128.1 FY2018 Plan $0.1 0.2 0.2 0.9 1.9 0.4 0.4 0.1 0.3 4.4 0.7 0.6 0.5 1.7 4.3 112.3 0.0 1.1 0.1 0.1 4.2 $128.2 1.0 0.0 0.3 $129.6 Data Processing Services include the cost of outsourced data center operations, outsourced IT staff, and software licenses The sum of the individual amounts may differ slightly from Totals due to rounding Excl udes cos ts tha t do not i mpa ct Amtra k's need for Federa l opera ti ng s upport. Items excl uded a re cos ts for Amtra k's Offi ce of the Ins pector Genera l (funded i ndependentl y), non-ca pi ta l i za bl e cos ts a nd certa i n contri buti ons a s s oci a ted wi th ca pi ta l projects (funded by ca pi ta l a ppropri a ti on), net i nteres t expens e (funded by debt s ervi ce a ppropri a ti on), depreci a ti on (non-ca s h expens e), a nd a ccrua l s for es ti ma ted future pos t-reti rement empl oyee benefi ts (non-ca s h expens e). 102 Environmental & Safety $ millions GM NEC Operations GM State Supported Services GM Long Distance Mechanical Engineering Transportation Officer Safety Total Operations Procurement Corp Common Total CFO Emergency Mgmt & Corp Security General Counsel Planning Contingency Core Operating Expenses Reimbursable Expenses Commuter Expenses Commercial Development Expenses Total Operating Expenses FY2013 Actual $1.2 0.5 1.3 1.0 2.2 0.2 0.1 6.5 0.1 0.4 0.4 0.0 1.5 0.0 $8.5 0.1 0.2 0.1 $8.8 FY2014 Budget $1.2 0.7 1.2 1.1 2.2 0.3 0.2 6.9 0.1 (0.3) (0.2) 0.1 2.4 0.0 $9.2 0.5 0.1 0.0 $9.8 FY2015 Plan $1.2 0.6 1.2 1.1 2.1 0.3 0.2 6.7 0.1 2.0 2.1 0.1 2.4 0.0 $11.3 0.5 0.1 0.0 $11.9 FY2016 Plan $1.2 0.6 1.2 1.1 2.1 0.3 0.2 6.7 0.1 2.0 2.1 0.1 2.4 0.1 $11.5 0.5 0.1 0.0 $12.0 FY2017 Plan $1.2 0.6 1.2 1.1 2.1 0.3 0.2 6.7 0.1 2.0 2.1 0.1 2.4 0.3 $11.6 0.5 0.1 0.0 $12.1 FY2018 Plan $1.2 0.6 1.2 1.1 2.1 0.3 0.2 6.7 0.1 2.0 2.1 0.1 2.4 0.4 $11.7 0.5 0.1 0.0 $12.3 Environmental and Safety includes the cost of routine and emergency environmental clean-up, hazardous materials disposal, recycling costs, and safety equipment The sum of the individual amounts may differ slightly from Totals due to rounding Excl udes cos ts tha t do not i mpa ct Amtra k's need for Federa l opera ting s upport. Items excl uded a re cos ts for Amtra k's Offi ce of the Ins pector Genera l (funded i ndependently), non-ca pi tal i za bl e cos ts a nd certai n contri butions a s s oci a ted wi th ca pi tal projects (funded by ca pi tal a ppropri a tion), net i nteres t expens e (funded by debt s ervi ce a ppropri a tion), depreci a tion (non-ca s h expens e), a nd a ccrua l s for es tima ted future pos t-retirement empl oyee benefi ts (non-ca s h expens e). 103 Maintenance of Way Services $ millions GM NEC Operations GM State Supported Services GM Long Distance Mechanical Engineering Transportation Officer Customer Service Total Operations Procurement Corp Common Total CFO Amtrak Police Human Capital Management Subsidiaries & Elimination Planning Contingency Core Operating Expenses Reimbursable Expenses Commuter Expenses Total Operating Expenses FY2013 Actual $0.6 0.1 0.8 0.2 16.8 0.1 0.5 19.1 0.3 0.2 0.5 1.3 0.0 (0.8) 0.0 $20.2 31.2 0.1 $51.5 FY2014 Budget $0.7 0.2 1.0 0.2 26.3 0.1 0.5 28.9 0.4 0.0 0.4 1.8 0.1 (1.0) 0.0 $30.3 52.4 0.0 $82.7 FY2015 Plan $0.7 0.2 1.0 0.2 26.3 0.1 0.5 28.9 0.4 0.0 0.4 1.8 0.1 (1.0) 0.0 $30.3 52.4 0.0 $82.7 FY2016 Plan $0.7 0.2 1.9 0.2 26.3 0.1 0.5 29.8 0.4 0.0 0.4 1.8 0.1 (1.0) 1.0 $32.2 52.4 0.0 $84.6 FY2017 Plan $0.7 0.2 1.9 0.2 26.3 0.1 0.5 29.8 0.4 0.0 0.4 1.8 0.1 (1.0) 1.8 $33.0 52.4 0.0 $85.4 FY2018 Plan $0.7 0.2 1.9 0.2 26.3 0.1 0.5 29.8 0.4 0.0 0.4 1.8 0.1 (1.0) 2.8 $34.0 52.4 0.0 $86.4 Maintenance of Way includes the cost of track inspection services, vegetation control, leasing of equipment, and work vehicles The sum of the individual amounts may differ slightly from Totals due to rounding Excl udes cos ts tha t do not i mpa ct Amtra k's need for Federa l opera ting s upport. Items excl uded a re cos ts for Amtra k's Offi ce of the Ins pector Genera l (funded i ndependently), non-ca pi tal i za bl e cos ts a nd certai n contri butions a s s oci a ted wi th ca pi tal projects (funded by ca pi tal a ppropri a tion), net i nteres t expens e (funded by debt s ervi ce a ppropri a tion), depreci a tion (non-ca s h expens e), a nd a ccrua l s for es tima ted future pos t-retirement empl oyee benefi ts (non-ca s h expens e). 104 Passenger Inconvenience $ millions GM NEC Operations GM State Supported Services GM Long Distance Customer Service Operations Research & Planning Total Operations Corp Common Total CFO Marketing Planning Contingency Core Operating Expenses Reimbursable Expenses Commuter Expenses Total Operating Expenses FY2013 Actual $1.0 2.2 4.2 0.7 0.1 8.1 0.1 0.1 4.1 0.0 $12.2 0.0 0.0 $12.3 FY2014 Budget $0.8 1.8 4.8 0.7 0.0 8.0 (0.0) (0.0) 4.5 0.0 $12.5 0.1 0.2 $12.7 FY2015 Plan $0.8 1.8 4.8 0.7 0.0 8.0 (0.0) (0.0) 4.5 0.0 $12.5 0.1 0.2 $12.7 FY2016 Plan $0.8 1.8 4.8 0.7 0.0 8.0 (0.0) (0.0) 4.5 0.1 $12.6 0.1 0.2 $12.9 FY2017 Plan $0.8 1.8 4.8 0.7 0.0 8.0 (0.0) (0.0) 4.5 0.3 $12.8 0.1 0.2 $13.0 FY2018 Plan $0.8 1.8 4.8 0.7 0.0 8.0 (0.0) (0.0) 4.5 0.4 $12.9 0.1 0.2 $13.2 Passenger Inconvenience costs are allowances and payments to customers who have been inconvenienced by canceled or delayed service The sum of the individual amounts may differ slightly from Totals due to rounding Excl udes cos ts tha t do not i mpa ct Amtra k's need for Federa l opera ting s upport. Items excl uded a re cos ts for Amtra k's Offi ce of the Ins pector Genera l (funded i ndependently), non-ca pi tal i za bl e cos ts a nd certai n contri butions a s s oci a ted wi th ca pi tal projects (funded by ca pi tal a ppropri a tion), net i nteres t expens e (funded by debt s ervi ce a ppropri a tion), depreci a tion (non-ca s h expens e), a nd a ccrua l s for es tima ted future pos t-retirement empl oyee benefi ts (non-ca s h expens e). 105 Financial $ millions GM State Supported Services GM Long Distance Engineering Customer Service Total Operations Finance Treasury Mandatory Corp Common Total CFO Subsidiaries & Elimination Planning Contingency Core Operating Expenses Reimbursable Expenses Commuter Expenses Commercial Development Expenses Total Operating Expenses FY2013 Actual 0.1 0.2 0.1 0.1 0.5 1.0 39.1 7.4 47.4 (1.8) 0.0 $46.1 0.7 0.1 0.5 $47.4 FY2014 Budget 0.0 0.2 0.2 (0.0) 0.4 1.1 45.2 5.3 51.6 (1.1) 0.0 $50.9 1.0 0.0 0.2 $52.1 FY2015 Plan 0.0 0.2 0.2 (0.0) 0.4 1.1 49.9 5.3 56.4 (1.4) 0.0 $55.4 1.0 0.0 0.2 $56.7 FY2016 Plan 0.0 0.2 0.2 (0.0) 0.4 1.1 50.2 5.3 56.6 (1.4) 0.7 $56.3 1.0 0.0 0.2 $57.6 FY2017 Plan 0.0 0.2 0.2 (0.0) 0.4 1.1 50.2 5.3 56.6 (1.4) 1.2 $56.9 1.0 0.0 0.2 $58.1 FY2018 Plan 0.0 0.2 0.2 (0.0) 0.4 1.1 50.2 5.3 56.6 (1.4) 1.9 $57.6 1.0 0.0 0.2 $58.8 Financial includes the cost of insurance, bank fees, bad debts, and the repayment of principal and interest of RRIF loans The sum of the individual amounts may differ slightly from Totals due to rounding Excl udes cos ts tha t do not i mpa ct Amtra k's need for Federa l opera ting s upport. Items excl uded a re cos ts for Amtra k's Offi ce of the Ins pector Genera l (funded i ndependently), non-ca pi tal i za bl e cos ts a nd certai n contri butions a s s oci a ted wi th ca pi tal projects (funded by ca pi tal a ppropri a tion), net i nteres t expens e (funded by debt s ervi ce a ppropri a tion), depreci a tion (non-ca s h expens e), a nd a ccrua l s for es tima ted future pos t-retirement empl oyee benefi ts (non-ca s h expens e). 106 Expense Transfer $ millions GM NEC Operations Mechanical Engineering Total Operations Procurement Corp Common Total CFO Subsidiaries & Elimination Core Operating Expenses Reimbursable Expenses Total Operating Expenses FY2013 Actual $0.1 1.7 9.0 10.8 (0.2) 1.0 0.8 (0.7) $11.2 0.6 $11.8 FY2014 Budget $0.0 0.0 0.2 0.2 (0.1) (0.0) (0.1) 0.3 $0.3 0.0 $0.3 FY2015 Plan $0.0 0.0 0.2 0.2 (0.1) (0.0) (0.1) 0.3 $0.3 0.0 $0.3 FY2016 Plan $0.0 0.0 0.2 0.2 (0.1) (0.0) (0.1) 0.3 $0.3 0.0 $0.3 FY2017 Plan $0.0 0.0 0.2 0.2 (0.1) (0.0) (0.1) 0.3 $0.3 0.0 $0.3 FY2018 Plan $0.0 0.0 0.2 0.2 (0.1) (0.0) (0.1) 0.3 $0.3 0.0 $0.3 Expense Transfers are transactions between Amtrak and its subsidiaries The sum of the individual amounts may differ slightly from Totals due to rounding Excl udes cos ts tha t do not i mpa ct Amtra k's need for Federa l opera ting s upport. Items excl uded a re cos ts for Amtra k's Offi ce of the Ins pector Genera l (funded i ndependently), non-ca pi tal i za bl e cos ts a nd certai n contri butions a s s oci a ted wi th ca pi tal projects (funded by ca pi tal a ppropri a tion), net i nteres t expens e (funded by debt s ervi ce a ppropri a tion), depreci a tion (non-ca s h expens e), a nd a ccrua l s for es tima ted future pos t-retirement empl oyee benefi ts (non-ca s h expens e). 107 Other Expenses $ millions GM NEC Operations GM State Supported Services GM Long Distance Mechanical Engineering COO Staff Total Operations Procurement Total CFO Amtrak Police Human Capital Management Subsidiaries & Elimination Planning Contingency Core Operating Expenses Commuter Expenses Total Operating Expenses FY2013 Actual $0.0 0.0 0.0 0.0 0.0 0.0 0.0 0.0 0.0 0.0 0.0 0.0 0.0 $0.0 0.0 $0.0 FY2014 Budget $0.2 0.1 0.3 0.1 0.5 0.8 2.1 0.1 0.1 0.1 0.1 1.8 0.0 $4.3 0.0 $4.4 FY2015 Plan $0.2 0.1 0.3 0.1 0.5 5.8 7.1 0.1 0.1 0.1 0.1 (0.4) 2.4 $9.6 0.0 $9.6 FY2016 Plan $0.2 0.1 0.3 0.1 0.5 5.8 7.2 0.1 0.1 0.1 0.1 (0.4) 2.4 $9.6 0.0 $9.6 FY2017 Plan $0.2 0.1 0.3 0.1 0.5 5.8 7.2 0.1 0.1 0.1 0.1 (0.4) 2.4 $9.6 0.0 $9.6 FY2018 Plan $0.2 0.1 0.3 0.1 0.5 5.8 7.2 0.1 0.1 0.1 0.1 (0.4) 2.4 $9.6 0.0 $9.6 Other Expenses are costs that are not classified in any specific category The sum of the individual amounts may differ slightly from Totals due to rounding Excl udes cos ts tha t do not i mpa ct Amtra k's need for Federa l opera ting s upport. Items excl uded a re cos ts for Amtra k's Offi ce of the Ins pector Genera l (funded i ndependently), non-ca pi tal i za bl e cos ts a nd certai n contri butions a s s oci a ted wi th ca pi tal projects (funded by ca pi tal a ppropri a tion), net i nteres t expens e (funded by debt s ervi ce a ppropri a tion), depreci a tion (non-ca s h expens e), a nd a ccrua l s for es tima ted future pos t-retirement empl oyee benefi ts (non-ca s h expens e). 108 Operating Expenses Paid by Capital Projects $ millions GM NEC Operations GM State Supported Services GM Long Distance Mechanical Engineering Historical/Inactive Cost Centers OH VP Operations Total Operations Corp Common Total CFO Subsidiaries & Elimination Core Operating Expenses Reimbursable Expenses Commuter Expenses Commercial Development Expenses Total Operating Expenses FY2013 Actual ($14.5) (0.0) (1.8) (38.3) (107.9) (0.2) 0.0 (162.6) (40.3) (40.3) (0.5) ($203.5) 58.2 5.6 0.3 ($139.4) FY2014 Budget ($12.6) (0.8) (3.8) (39.0) (115.3) 0.0 (2.3) (173.9) (32.8) (32.8) (0.0) ($206.7) 46.7 10.7 0.2 ($149.2) FY2015 Plan ($12.8) (0.8) (3.8) (40.3) (117.4) 0.0 (2.3) (177.4) (33.4) (33.4) (0.0) ($210.8) 47.4 10.7 0.2 ($152.4) FY2016 Plan ($13.0) (0.8) (3.9) (41.5) (119.5) 0.0 (2.3) (181.0) (33.8) (33.8) (0.0) ($214.8) 48.2 10.8 0.2 ($155.6) FY2017 Plan ($13.2) (0.8) (3.9) (42.8) (121.7) 0.0 (2.3) (184.6) (34.2) (34.2) (0.0) ($218.8) 49.0 10.8 0.2 ($158.8) FY2018 Plan ($13.3) (0.8) (3.9) (44.1) (124.0) 0.0 (2.3) (188.4) (34.7) (34.7) (0.0) ($223.2) 49.9 10.9 0.2 ($162.2) Operating Expenses paid by Capital Projects, commonly known as "Transfer Credits" represent capital projects absorbing the costs of management, facilities, equipment, employee benefits, and general conditions The sum of the individual amounts may differ slightly from Totals due to rounding Excl udes cos ts tha t do not i mpa ct Amtra k's need for Federa l opera ting s upport. Items excl uded a re cos ts for Amtra k's Offi ce of the Ins pector Genera l (funded i ndependently), non-ca pi tal i za bl e cos ts a nd certai n contri butions a s s oci a ted wi th ca pi tal projects (funded by ca pi tal a ppropri a tion), net i nteres t expens e (funded by debt s ervi ce a ppropri a tion), depreci a tion (non-ca s h expens e), a nd a ccrua l s for es tima ted future pos t-retirement empl oyee benefi ts (non-ca s h expens e). 109 Appendix V: FY2014 Capital Project List $ millions GCAP ADA Compliance ADA Stations ADA Compliance Projects ADA Stations Total Safety / Mandates Amtrak System ADA Platform Gap Solution Passenger Information Display System (PIDS) Passengers With Disabilities Site Upgr Safety / Mandates Total ADA Compliance Total Environmental Remediation Safety / Mandates Asbestos/Lead Paint/Mold Abate Beech Grove Facility - Wwtp/Sewers Cedar Hill Remedation Chicago Steam Plant Asbestos Abatement Hialeah FL Pahs Remediation Los Angeles Wastewater Upgr New Brunswick Commuter Yard Remediation New Orleans Fueling Facility Upgrs Oakland Stormwater Treatment System Penn Station Track Remed Prevention Of Groundwater Contam. Sanford Fl Wastewater System Upgrade Sunnyside Yard Oil/Pcb Remed Trenton NJ - Commuter Yard Remediation Wilmington Remediation Wilmington Shop Replace Petroleum Tanks Wilmington West Yard Safety / Mandates Total Environmental Remediation Total Fleet Overhauls Acela Programs Amfleet Programs General Safety & Reliability Heritage Programs Horizon/Surfliner Programs Locomotives Mandatory Projects Superliners Talgo Programs Viewliner Programs Fleet Overhauls Total Gateway Program Special Programs Gateway Preliminary Design And Planning Hudson Interlocking-Turnout Installation NY Gateway Tunnel - Phase 1 Design Portal Bridge Direct Fixation Track Design Special Programs Total Gateway Program Total Grand Total $38.3 38.3 $38.3 38.3 3.7 6.0 2.0 11.7 50.0 3.7 6.0 2.0 11.7 50.0 0.8 1.5 0.9 2.0 0.1 1.0 0.1 0.2 0.1 0.2 0.4 1.3 0.8 0.1 0.8 0.1 0.2 10.1 10.1 0.8 1.5 0.9 2.0 0.1 1.0 0.1 0.2 0.1 0.2 0.4 1.3 0.8 0.1 0.8 0.1 0.2 10.1 10.1 62.9 47.3 9.0 0.6 2.8 20.2 1.3 54.7 7.6 206.3 3.5 3.5 3.5 110 Other 1.6 0.5 0.0 43.3 62.9 70.0 9.0 0.6 11.7 29.9 1.3 56.3 0.5 7.6 249.6 1.5 1.5 4.0 1.5 8.5 8.5 5.0 1.5 4.0 1.5 12.0 12.0 22.6 0.0 8.8 9.8 $ millions Infrastructure Renewal Amtrak Support Chicago Station- Overhead Structure Removal Equipment Pool Committee Int Chicago Harrison St-Switch Machine Amtrak Support Total Improvements Chicago Station- Overhead Structure Removal Galien River Br Foundation Upgr - Mi215.89 Il466.20 Bridge Rehabilitation Metrair Relf Canal-Replace Bridge Michigan Line - Rail Lubricator Installationll Overhead Bridge Catenary Mods Rensselaer NY-MOFW Direct Fix Track Upgr Septa Stations Intertrack Fence Upgrades Tkrn North Haven - Reconstruct West Class Yd Csx C WIL MOFE Facility Tie/Timber Improvements Total Major Projects Brunswick-Trenton NJHSRIP Track Upgrades BWI Imprv/Bridge-Winans Track 4 CHI 14Th St Yd Retaining Wall Colonie NY Land Purchase To Limit Curves CT106.89 Conn Rv Repl Design CT116.74 Niantic Bridge Repl Dsn Freq Metuchen Converter NJHSRIP-Upgrade Freq Safe Harbor - Frequency Converter Upgrade Hamilton Sub NJHSRIP Design And Construct Harrisburg Line Private Xing Elim Kingston RI Capacity And Platform Imprv Landover/Hanson Interlocking Renewal New Brunswick-Trenton NJHSRIP Bridge Upgrs New Brunswick-Trenton NJHSRIP Catenary New Brunswick-Trenton NJHSRIP Prg Mgmnt New Brunswick-Trenton NJHSRIP Signals New Substation NJHSRIP Design And Construct NY015.73 Pelham Bay-Brdg Replacement Dsn Penn Station NY Brookfield Overbuild Penn Station NY NJHSRIP Interlocking Renewal Penn Station NY NJHSRIP Interlocking Renewal Pm SPG Line Britain-Harford Busway Project Springfield Ln Double Track Stip Brandy To Ragan - Section Improve Susquehanna Bridge Replacement - Md060.07 Tun B&P Tunnel-Replacment Prelim Dsn Major Projects Total Safety / Mandates 1St Ave NY Ert Lines 1&2- Emerg Trans Sw Acse Amtrak Owned-Positive Train Control Bal Subdiv Inst Security Fence GCAP Other Grand Total 0.1 1.7 1.0 2.8 0.1 1.7 1.0 2.8 0.0 0.1 0.8 0.3 0.1 0.1 0.1 0.1 2.2 0.3 3.9 0.0 0.1 0.8 0.3 0.1 0.1 0.1 0.1 2.2 0.3 3.9 12.0 0.1 1.0 0.2 0.2 0.2 10.0 20.0 5.0 0.6 3.0 5.9 7.0 2.0 16.0 8.2 14.0 1.0 1.4 3.0 0.4 0.1 2.4 35.9 5.0 31.5 0.1 22.4 2.0 111 5.0 14.0 141.9 12.0 0.1 1.0 0.2 0.2 0.2 10.0 20.0 5.0 0.6 5.9 10.0 2.0 16.0 8.2 14.0 1.0 1.4 3.0 0.4 0.1 2.4 35.9 5.0 5.0 14.0 173.5 0.1 22.4 2.0 $ millions Cetc NY Scada Phase II Empire Line Overbuild Lighting Eng Employee Arc Flash Protection Safe New England Division Fencing New York North Riv Tun-Vent Shft Constrc NY Ert-1St Ave Vent Shft Desgn NY Tun Emergency Pwr Dsn NY Tunnels - Emergency Signage Instl Penn Station NY Fire Life Safty System Upgr Penn Station NY Standpipe Cntrl System Upgr PTC I-Etms # Acses Interoperability (Fed Sys Life Safety - Project Management Tunnel Standpipe Installationll 3/4 Safety / Mandates Total SOGR Base 30Th St Station Block Ties 52Nd St - Septa Service Amtrak Contr 52Nd St Br Span And Column Upgr - PA004.06 Adams Subdiv Culvert Upgr Albany Line - Culverts Upgrades Albany Line - Timber Program Albany Line Curve & Trail Track Rail Repl Albany Ln Insulated Jnt Renew Amtrak Sy Surfacing Prg Develop Amtrak System Mud Spot Elimination Amtrak System Roadbed Stability Upgr Arsenal 2A-Disconnect Switch Replacement Arsenal Sub 2A Transformer Installation B&P Tun Block Tie/Rail Renewal Bal Subdiv Catenary Pole Upgrs Bal Subdiv Chrysler Rtu'S Repl Baltimore Subdiv - Cat Hardware Renewal Baltimore Subdiv Koupler Upgr Baltimore Subdiv Subst Imprv Baltimore Subdivision-Signal Power Upgr Baltimore Tunnel Improvements Baltimore-Trans Line And Hardware Upgr Bell Interlocking - Catenary Hardware Renewal Boston Subdiv-Circuit Breaker Installationll Bowie Sub 23-Air Break Switch Replace Brandywine Creek North Walkway - PA032.10 Brg/Tunnel/Wall Future Design Bridge Control Upgrs - NJ008.50 Bridge Interlocking Renewal Bryn Mawr Interlocking -Catenary Hardware Renewal Bryn Mawr Interlocking Turnout Replacement Bush River-Susquehanna Bridge Lighting Upgr Cat Empire Line - Catenary Hardware Renewal Cat Et Training Facility - Upgrades Cat Hellgate Line - Koupler Brake Replacement GCAP 4.5 0.3 0.7 0.2 0.2 0.0 0.2 0.1 0.5 0.1 0.5 0.2 32.0 0.8 0.1 0.5 0.2 0.1 0.2 0.4 0.1 0.3 2.0 2.0 0.1 0.8 Other 0.1 9.9 0.2 1.0 11.2 0.2 5.2 2.5 1.5 0.3 0.3 0.8 0.1 0.2 0.3 0.3 0.3 0.2 0.3 0.0 0.3 1.0 1.3 0.5 0.1 0.1 0.1 0.1 0.3 0.1 112 1.3 Grand Total 4.5 0.3 0.7 0.2 0.2 0.2 0.2 0.1 0.5 0.1 9.9 0.7 1.2 43.2 0.8 0.1 0.5 0.3 0.1 5.4 2.9 0.1 0.3 2.0 2.0 0.1 0.8 1.5 0.3 0.3 0.8 0.1 0.2 0.3 0.3 0.3 0.2 0.3 0.0 0.3 1.0 2.5 0.5 0.1 0.1 0.1 0.1 0.3 0.1 $ millions Cat Mp14.1 To Mp14.4 Lamokin - Catenary Central Div Track Rehabilitation Cocassett St Backwall Upgrades - Ma206.42 Conestoga Substa Transformer Replacement CT080.59 Bridge Replacment CT082.00 Abutment/Pier Upgr CT130.63 Abutment/Pier Upgr CT132.16 Bridge Control Drive Upgr Cynwyd/Paxton Interlocking Renewal Davisville Interlocking Microlok 2 Upgr De018.51 Philadelphia Pike - Bridge Upgr Disconnect Switch Replacement - Zoo 9 Dock Interlocking C&S Renewal Dock Interlocking T/O Renewal East Riv Tun Replace Wayside Comm Boxes East Riv Tun-Rehab Pump Station Dewater Sys East River Tun Rehab Scada Control Panels East River Tunnel Emergency Door Repl East River Tunnels Ballast Replacement East River Tunnels C&S Cable Replacement Edgely Sub 33 Improvements Electric Traction - Substation Relay Upgrades Electric Traction Design Review Elmora-Union Catenary Upgr Empire Line Overbuild Safety Improvement Eqir Viewliner - Theater Car Conversion ERT Line 3/4 Rail/Ties Fair Interlocking Dc Sw/Battery Installationll Fast New York Div - Replace Concrete Tie Fastener Final $40M Frankford 30 - Disconnect Sw Replacement Glenolden 10 - Disconnect Sw Replacement Grove-Bowie Catenary Structure Repl H Street - Steel Upgrade Hackensack Sub 42 Air Break Sw Harrisburg Line 12Kv Substation Brks Harrisburg Line Culverts Upgrs Harrisburg Line Sig Pwr Upgrs Harrisburg Line Xing Elimination Hartford Tunnel - Drainage System Upgr Hellgate Bridge Walkway & Fall Protection Hellgate/Empire Interlocking Steel Hellgate/Empire Rail Renewal Hellgate/Empire Tie/Timber Hot Box Detector Repl - NED208.7 Inman Ave - Bridge Column Upgr - NJ020.16 Ivy City Sub 25 Transformer Installation Jericho Pk Wall-Bld Expansion-Paving Kressor St - Bridge Column Upgr - Md092.50 Lamokin 11-Disconnect Switch Replacement GCAP 0.2 4.5 Other 0.2 0.5 0.2 0.4 0.3 0.7 1.0 0.2 0.2 0.3 1.5 1.4 0.1 0.1 0.3 0.1 0.3 2.0 0.0 0.3 40.0 0.1 0.1 0.1 0.3 0.0 0.3 0.3 0.2 0.2 0.5 0.2 0.2 0.3 0.2 0.1 0.4 0.1 0.3 0.1 113 1.5 1.4 0.2 0.7 0.0 0.2 0.2 0.5 0.1 10.0 0.0 0.0 0.2 0.3 0.1 Grand Total 0.2 4.5 0.2 0.5 0.2 0.4 0.3 0.7 1.0 0.2 0.2 0.3 3.0 2.8 0.2 0.7 0.0 0.2 0.2 0.5 0.1 0.1 0.3 0.1 0.3 2.0 10.0 0.0 0.3 40.0 0.1 0.1 0.1 0.3 0.0 0.3 0.3 0.2 0.4 0.5 0.2 0.2 0.3 0.2 0.3 0.3 0.4 0.1 0.3 0.1 $ millions Lamokin Transformer-Breakers Replacement Landlith-West Yd Handrail Repl Landover Sub 24 - Air Break Replacement Lane Interlocking - Interlocking Renewal LIC NY-Generator Transfer Switch Upgr Lincoln-County Catenary Upgr Lititz Pike Br-Cat Improvements - PA067.85 Marietta St Bdg Catenary Improv - PA080.03 Massachusetts Bridge Catenary Upg Mathus Drain Bridge Upgrades - Mi190.21 Metuchen Sub 38 Transformer Installation Michigan Dist Culverts Upgr Michigan District Surfacing Michigan Ln Repl Xing Pannels Mid-Atlantic Battery/Charger Mid-Atlantic Div Concrete Tie Replacement Mid-Atlantic Div Division Bridge Timber Replacement Mid-Atlantic Div Drainage Upgr Mid-Atlantic Div Insul Joints Mid-Atlantic Div North Signal Bridge Upgr Mid-Atlantic Div S Substation Cntl Hse Upgr Mid-Atlantic Div South Interlocking Lighting Upgr Mid-Atlantic Div Turnout Replacement Mid-Atlantic Interlocking Steel Renewal Mid-Atlantic Joint Elimination Mid-Atlantic Roadbd Reconstruction Mid-Atlantic Tie/Timber Repl Midway Interlocking Impact Detectors Monmouth Sub 36 Improvements Morris-Holmes Catenary Upgr Morrisville Sub 34 Improvement Movable Bridge Component Dsn Ne Div Double Messenger Clamps NEC Mitre Rail Expansion Joints NEC Wayside Detector Comm Sys New England - Bridge Pier And Abutment Upgrades New England Blst Deck Bridge Walkway Inst New England Concrete Tie Replacement New England Div Bridge Fall Protection New England Div Bridge Timbers New England Div Crv Patch Rail New England Div Culvert Upgr New England Div Drainage Impv New England Div Hdblock Ties New England Div Spot U/C New England Div Sub Lighting New England Div Sub Upgrades New England Div Wall Upgrs New England Division Wd Ties New England Division Xing Upgr GCAP 1.0 0.3 0.2 2.0 0.1 0.1 0.4 0.1 0.2 0.1 0.5 0.4 0.2 2.5 0.6 2.9 1.0 0.3 0.2 0.1 1.3 3.0 2.0 1.2 7.0 1.2 0.1 0.1 0.1 0.2 Other 2.0 0.1 1.8 0.3 0.2 0.1 0.1 0.1 1.0 0.3 0.3 0.2 10.5 0.2 0.3 1.5 0.3 0.5 0.8 1.1 0.1 0.1 0.2 2.1 0.5 114 Grand Total 1.0 0.3 0.2 4.0 0.1 0.1 1.8 0.3 0.4 0.1 0.4 0.1 0.5 0.4 0.2 2.5 0.6 2.9 1.0 0.3 0.2 0.1 1.3 3.0 2.0 1.2 7.0 1.2 0.2 0.1 0.1 0.2 0.1 1.0 0.3 0.3 0.2 10.5 0.2 0.3 1.5 0.3 0.5 0.8 1.1 0.1 0.1 0.2 2.1 0.5 $ millions New England Div-Retire Wayside Switches New England Dv T/O Replacement New England Insulated Joints New England Interlocking RTU Upgr New England Joint Elimination New Orleans- La Wd Tie Repl New York Div NJT Territory East Timbers New York Div Surfacing Prgm New York Div Vacuum Train New York Div West Tie/Timber New York Tunnel Flood Gates Upgrades New York-Newark Crv Patch Rail NJ057.75 Blst Retainer-Handrail Upgrades North Penn Interlocking -Catenary Hardware Renewal North Riv Tun Replace Wayside Comm Boxes North Riv Tun-Rehab Pump Station Dewater Sys North River Tun Benchwall-Diamond Plate North River Tun Rehab Scada Control Panels North River Tunnels Ballast Replacement North River Tunnels Replace C&S Cable NY Area Rail Replacement NY Div Catenary Pole Upgr NY Div Concrete Tie Repl-Tls NY Div East NJT Territory Interlocking Steel NY Div NJT Territory-Joint Elim NY Div Non-NJT Territory-Insulated Joint NY Div Non-NJT Territory-Joint Elim NY Div -Spot Renew Pads Clips And Insulators NY Div West Insulated Joints NY Div West Interlocking Stl NY Div West Joint Elimination NY Div-Concrete Ties Replacemn NY Div-Intrlocking Lighting Fixture Upgr NY East Riv Tun Rehab Tun Light Fixtures NY East River Tunnels 3Rd Rail Rehab NY East Rvr Tun Rail/Tie Ln1/2 NY Ert - 1St Ave Ventilation Door Design NY Ert-Anti Corrosion Rail Protection NY Lic And 11Th Ave-Rehab Mech Equip Rm NY North Riv Tun Rehab Tun Light Fixture NY North Riv Tun-Anti Corrosion Rail Protection NY Tun-Rehab 1St Ave And Lic Vent Plants NY010.20 Bridge Upgrades NY015.73 Peinion Bearing Upgr NY135.82 Ballast Deck Conv NY143.02 Lab - Bridge And Emerg Gen Upgr NYP Subdiv-Replace Ties And Timbers Overbrook-Woodbine Interlocking -Catenary Hardware Paoli-Frazer Catenary Upgr Perryville Subdiv - Cat Hardware Renewal 115 GCAP 0.3 0.8 0.4 0.3 1.5 0.1 0.3 13.0 0.1 0.5 0.0 0.1 1.0 0.2 0.1 0.3 0.3 23.9 1.1 0.1 0.1 0.2 0.4 0.1 0.3 0.4 1.0 0.1 0.3 0.1 Other 0.3 2.0 0.1 0.5 0.0 0.1 0.2 0.7 0.1 0.1 0.2 0.5 0.3 3.6 1.1 0.1 0.1 0.1 0.3 0.4 0.1 0.1 1.7 0.5 0.8 0.1 0.2 0.6 0.1 0.3 0.5 0.4 0.2 0.1 0.2 0.6 0.2 Grand Total 0.3 0.8 0.4 0.3 1.5 0.1 0.7 15.0 0.2 1.0 0.1 0.3 1.0 0.2 0.2 0.7 0.1 0.1 0.2 0.5 0.3 0.5 27.5 2.3 0.2 0.2 0.2 0.4 0.3 0.6 0.7 1.0 0.1 0.1 0.1 2.0 0.1 0.5 0.8 0.1 0.2 0.6 0.1 0.3 0.5 0.4 0.3 0.1 0.2 0.6 $ millions Perryville Subdiv Subst Imprv Perryville Subdiv Wall Upgrade Perryville Subdivision-Signal Power Upgr Perryville Subdiv-Section Break Upgrades Phil New Cetc Control Center Phil Subdiv Catenary Pole Replacement C Phil Subdiv Interlocking RTU Replacement Phil Subdiv Interlocking RTU Upgrades PHL-WIL Catenary Structure Replace Piers-Arches-Abutments - PA066.71 Plum Street-Replace Super Pole Harrisburg Line - Catenary Pole Replacement Pole Zoo To Paoli-Catenary Struct Repla Portal Bridge Mitre Rail- NJ006.10 Princeton Sub 35 Transformr Installation Principio Creek-Arch Upgr Providence RI- Plate Installationll Tks 1 & 2 PRY Subdiv Catenary Pole Upgrs PSNY - Sub Breaker Remote Operation Sys PSNY Sub 43 31St Improvements PSNY Sub 43 7Th Ave Improvemen PSNY Walkover 18 Conduit/Cable Repl 3Rd Rail Ert/Harold Repl Rail Lifter - NJ006.10 Repl Tmbr Blst Dk Tk1 - PA035.27 Richmond Freq Circuit Breakers Upgrades Roadbed Stability Upgrades S Bay I/O Turnout Replacement S Bay Interlocking Upgrade To Microlok2 Safe Harbor Freq Convert Upgr Sharon Substa Replace Circuit Breakers Shore Interlocking - Catenary Hardware Renewal Shsy - Sectionalizing Switch Replacement Sigp Baltim Sub 20-Signal Power Upgrade Sigp Fulton Inter-Repl 352 Sig Pwr Circ Sigp Landov Sub 24-Rpl 352 Sig Pwr Circ South Penn Interlocking Catenary Upgr South Penn Interlocking Renewal Southampton St Yd Turnouts Southampton St Yd-Substation Switch Upgr Southwest Corridor - Lighting Upgrades Springfield Ln Interlocking Stl Renewal State Interlocking Renewal Stringers/Deck Repl - PA067.33 Structures - Bridge Tie Design Sub 32 To Sub 34- Signal Pwr System Upgr Sub 34 To Sub 42- Signal Pwr System Upgr Sub Baltimore Subdivision - Trolley Breaker Upgrad Sub Baltimore Subdiv-Service And Potential Transfo Sub Kearny Sub 41 - Relocation Design And Construc GCAP 0.2 0.2 0.4 0.1 5.5 0.1 0.2 0.3 0.3 1.5 Other 0.1 0.2 0.6 0.5 0.2 1.5 0.5 0.4 0.3 0.1 0.1 0.0 0.1 0.3 0.1 2.0 0.5 0.2 0.3 0.1 0.1 0.0 0.1 0.1 0.1 1.0 0.2 0.2 0.1 0.2 0.1 0.2 0.2 0.2 0.2 1.5 0.6 0.2 0.3 1.3 0.3 7.5 0.1 0.2 0.2 0.1 0.2 0.1 0.5 116 0.1 Grand Total 0.2 0.2 0.4 0.1 5.5 0.1 0.2 0.3 0.3 1.5 0.1 0.2 0.6 1.0 0.4 1.5 0.5 0.4 0.5 0.1 0.1 0.1 0.1 0.1 0.3 0.1 2.0 1.0 0.2 0.2 0.1 0.2 0.1 0.2 0.2 0.2 0.2 1.5 0.6 0.2 0.5 1.3 7.5 0.1 0.2 0.2 0.3 0.2 0.1 0.5 $ millions Sub NEC Substations - Control House Replacement De Sub Perryville Subdivision - Trolley Breaker Upgra Sub Perryville Subdiv-Service And Potential Transf Sub Rahway Sub 39 - Air Break Switch Replacement Sub Royalton Sub 71 - Transformer Installation Sunnyside Yard - Substation Upgrades Sunnyside Yard Freq Computer Sys Sunnyside Yard Inst Timber Sunnyside Yard Sub 44 Improvements Swatara Creek Br Walkway Upgr - PA094.67 Swift Interlocking Sw Htr Installation Ties Boston Subdivision-Tie/Timber Prog Ties Concrete Tie - Redesign Of Concrete Ties Ties Michigan Line - Wood Tie Program Tower One Turnout Replacement Track - Future Design Track 3 Blst Deck Conv - Ma220.42 Track A 1 Replace Concrete Deck - Md094.10 Track A Replace Concrete Deck - Md094.07 Transfer-Forest-Plains Sw Mach Trn Ave To Carroll-Static Wire Installationll Trn Kearny, NJ- Passaic River Transmission Tower R Trn Midatlantic Div-Transm Brker Installationl Trn Sub 42 To Sub 44-Repl 12Kv Cbl/Cond Tun LIC NY-Rehab Ups And Station Batteries Tun NY Ert-Lines 1&3 Sump Pump Air Lines Turnout Development/Design Union Interlocking Retaining Wall Upgrs Union Substation Relocation Union Tun Baltimore Md-Sig Pwr System Upgr Van Nest Sub Vacuum Brkr Repl Wall/Spandrel Beam - Ma224.25 WAS -Bos Rail Lubicator Replace Washington 1St St - Tunnel Lighting Upgr Washington -New York Curve Patch Rail Washington -New York System Undercutting Washington Term & Ivy City - Upgr Tracks Waverly Sub 40 Improvements Waverly Sub 40 Signal Machine West Division - Station Track Upgrades White Clay Creek-Ballast Whitford Rd - Bridge Structure Upgra WIL-WAS Interlocking RTU Replacement Re Wood Interlocking Catenary Upgr York St Bridge Upgrades - PA085.46 Zoo - 44Th St Interlocking Reconfiguraton SOGR Base Total Special Programs Hudson Yd Construct Tunnel Box Special Programs Total GCAP 0.3 0.1 0.1 0.1 0.8 0.2 0.1 0.7 0.1 0.1 0.0 1.2 0.8 4.5 Other 59.5 Grand Total 0.3 0.1 0.1 0.2 0.8 0.2 0.2 0.7 0.1 0.1 0.1 1.2 0.8 4.5 1.0 0.8 0.1 2.0 1.0 0.1 0.1 0.4 0.1 0.5 0.1 0.4 0.3 0.1 0.1 0.8 0.1 1.0 0.5 0.4 2.3 22.0 1.5 0.1 0.4 0.9 1.5 0.3 0.3 0.1 0.2 1.0 296.3 120.0 120.0 120.0 120.0 0.1 0.1 0.1 0.0 1.0 0.8 0.1 2.0 1.0 0.1 0.1 0.2 0.1 0.3 0.1 0.3 0.1 0.0 0.8 0.1 0.2 0.3 0.1 0.3 0.1 0.0 1.0 0.5 0.4 2.3 22.0 1.5 0.0 0.2 0.9 1.5 0.3 0.3 0.1 0.2 1.0 236.8 117 0.0 0.2 $ millions Support Equipment and Vehicles 10002 Geometry Car - Equipment Upgrade Acela Train - Refurbish Accelerometer Advanced Technlogy Track Insp Sys Engineering Track Eqi Purchase Theater Car Conversion Track Gauge Restraint Measuring System Support Equipment and Vehicles Total Infrastructure Renewal Total Rolling Stock Acquisition Amtrak Support Purch 4 Low Emission Swtr Loco Amtrak Support Total Special Programs Electric Locos - Acs64 Long Distance Single Level Replacement Next Generation Trainset Procurement-Pm Special Programs Total Rolling Stock Acquisition Total Stations and Facilities Amtrak Support DHS2010 Operational Packages Jackson MI Foundation Upgrades Paperless Time Tickets Amtrak Support Total Improvements 30Th St Garage Revenue Equipment Repl Adams Subdiv NJT Platform Upgr Amtrak System 480 Volt Standby Power Amtrak System Design ADA Station Impv Amtrak West Div-Station Emerg Pwr Upgr APD - Relocate Police National Comm Center Central Divi Station Upgr/Ada CHI Union Station Parking Garage - Replace Revenue Equipment Chicago Station-Fire Sprinkler And Asbestos Chicago Yard - Master Plan Development Chicago Yds Facilities Upgrade Commissary Partial Refrigerated Carts CUS Escalator Plates Replacements DHS2010 Communication Control Center DHS2010 Infrastructure Protect DHS2010 Planning And Assessments DHS2010 Training And Public Awareness DHS2011 Infrastructure Securty Hardening DHS2011 Security Awareness Prog DHS2011 Station Action Plan-Continuity Of Ops DHS2012 Infrastructure Securty Hardening DHS2012 Security Awareness Planning Prgm Edmonds Wa - Station Roof Improvements Elyria Station 118 GCAP 0.4 0.3 0.3 6.0 0.5 0.4 7.9 312.1 Other Grand Total 335.4 0.4 0.3 0.3 6.0 0.5 0.4 7.9 647.5 0.1 0.1 103.3 5.8 109.1 109.2 0.1 0.1 89.7 4.4 94.2 94.2 0.8 0.8 0.2 0.2 1.6 0.8 0.1 0.4 0.5 0.2 0.3 1.0 0.8 0.4 0.1 1.0 0.1 0.2 0.6 5.8 0.2 0.5 4.8 1.7 2.9 3.0 1.9 0.1 0.2 89.7 107.8 5.8 203.3 203.4 0.8 0.8 0.2 1.8 0.8 0.1 0.4 0.5 0.2 0.3 1.0 0.8 0.4 0.1 1.0 0.1 0.2 0.6 5.8 0.2 0.5 4.8 1.7 2.9 3.0 1.9 0.1 0.2 $ millions Goleta CA-Facility Inspection Track Upgr Install Hgh Eff Light-Mech Fac Ivy City S&I Bld Lighting Impv King St Yard Seattle-Wastewater System Upgr MOFE Sunnyside Yard - Consolidated Maintaince Faci New Orleans La Maintenance Facility Upgr NY Div Septa Station Pltform Upgrs Oakland CA Maintenance Facility Upgrades Oakland CA MOFE - Train Wash Upgrades Oakland CA MOFE-Industrial Drains Upgr Oakland CA MOFW Facility Upgrades Paioli Station ADA Upgrades Penn Station New York PIDS Upgrade Pittsburg PA Station Electrical Upgrades Replace Wilm Maint Facility Heating Sy S&I/Running Repair Facility - South Seattle Maint Facil Wa-Upgr Pit Tks 8&9 Septa Stations Step Ups Intertk Pltfrms Southwest Subdivision Station Improvmnts Station Emgncy Improv: Rte 128 Washington Union Station Master Plan Western Div Station Upgr Wilmington DE - New Maintenance Complex Wilmington: Back-Up Generator Improvements Total Major Projects 30Th St - Understreet Garage Reconstruction Boston South Station Exp And Facility Dsn Branford-Guilford CT Station Improvement Ivy City-Train Traffic Upgr Master Pln Moynihan Station - Station Construction Major Projects Total NEC Master Planning MARC Jt Benefit Projects New England Div-Clinton Interlocking Dsn New York Penn Station Exterior Improvements New York Penn Station Interior Improvements New York Penn Station Wayfinding-Design P&H Transmission - Concept Design & NEPA NEC Master Planning Total Safety / Mandates 30Th Street Station Emergency Generator Bear: Replace Electrical Sub-Stations Exton PA New High Level Platform Station PSNY-Emerg Operation Plan Development Rochester NY Station Improvements Sta Middletown PA Station - New Station Safety / Mandates Total SOGR Base 10003 Geometry Car - Data System Upgrade GCAP 0.2 0.9 0.2 0.1 Other 4.0 1.0 0.1 0.2 0.1 0.1 0.2 1.4 2.3 0.2 2.0 0.2 0.8 0.5 0.5 1.5 3.2 0.5 0.5 0.2 20.2 28.1 19.9 0.3 2.9 1.5 2.6 24.2 6.0 8.9 7.0 0.6 0.3 0.6 0.2 0.5 2.1 7.0 0.2 1.1 0.0 0.1 1.4 6.0 119 0.1 0.2 0.3 Grand Total 0.2 0.9 0.2 0.1 4.0 1.0 0.1 0.2 0.1 0.1 0.2 1.4 2.3 0.2 2.0 0.2 0.8 0.5 0.5 1.5 3.2 0.5 0.5 0.2 48.3 19.9 0.3 2.9 1.5 8.5 33.1 7.0 0.6 0.3 0.6 0.2 0.5 9.1 0.2 1.1 0.0 0.1 0.1 0.2 1.7 6.0 $ millions 30Th St Light/Interior Improve 30Th St Station - Electrical Substation Upgr 30Th St Station Electrical Upgr 30Th St Station Fire Alarm Sys 30Th St Station HVAC Replacement 30Th St Station Platform Upgr 30Th Station Chiller Replacement 30Th Station Elevator Replacement 30Th Station HVAC Control Upgr 30Th Street Station - Facade Restoration 30Th Street Station Signage Amtrak E-Ticketing Initiative Bear Facility Improvements Beech Grove Shops Facility Improvements Dock Interlocking Tower Elec Equip Upgr Electric Traction Catenary Measuring System Harrisburg Ln Station Upgrs La MOFE-Fire Alarm Sprinkler System Upgr Mat Handling Equp Facil-Sgr Material Management Facilities SOGR MOFW Bases Inventory Security Mount Joy PA Station Improvements New England Division MOFW Base Upgrades New York Division MOFW Building Upgrades NY PSCC - Building Roof Replacement Odenton MOFW Base - Facility Upgrades Penn Coach Yd Electrical Substation Upgr Penn Station NY-Fan Rm 1 Struct Replacement Perryville MOFW Base Upgrades Providence RI Station-Platform Lighting Upgr PSNY - Station Lighting Fixture Upgrades PSNY Escalator Replacement PSNY Facilities Upgrades PSNY Platform Upgr 1-7 Quad Ave MOFW Base - Facility Upgrades M Route 128 Station MA-Platform Lighting Upgr S&I/Running Repair Facility - West Sta 901790 Wil Station Renov- Fa State Of Good Repair Stations Structures FacilityFuture Design Track Equip Heavy Overhauls WAS & Ivy City Electrical Upgr WAS Term H20 Pressure Imprv WAS Term Interior Space Upgr Wash Platform Renewal-MARC Wash Union-Sta Platform Canopy Roof Upgr Wilm Service Facility-Structural Upgr SOGR Base Total Support Equipment and Vehicles Acela Food Cart Delivery System GCAP 0.4 0.2 0.3 0.1 0.3 0.1 0.3 2.0 1.5 9.0 Other 1.9 2.0 1.0 0.3 0.3 1.4 2.0 0.1 1.4 1.1 0.5 0.3 0.1 0.5 0.1 1.0 0.1 0.1 1.3 0.1 0.3 1.8 0.3 0.3 0.1 0.3 0.1 1.0 0.6 2.0 3.0 0.3 0.2 0.1 2.0 0.8 0.3 1.8 0.3 1.4 0.2 0.3 43.5 0.2 120 8.8 Grand Total 0.4 0.2 0.3 0.1 0.3 0.1 0.3 2.0 1.5 9.0 1.9 2.0 1.0 0.3 0.5 1.4 2.0 0.1 1.4 1.1 0.5 0.1 0.5 0.1 3.0 0.1 0.1 1.3 0.1 0.8 0.5 3.5 0.3 0.5 0.1 0.3 0.1 1.0 0.6 2.0 3.0 0.3 0.2 0.1 1.4 0.2 0.3 52.3 0.2 $ millions Cart Delivery System - Single Level Diners DHS2011 APD Operational Equipment Upgrs DHS2011 Comm-Situational Awarenes Hdware DHS2011 Comm-Situational Awareness Sys DHS2012 Comm-Situational Awareness-CCTV DHS2012 Comm-Situational Awareness-Plan Support Equipment and Vehicles Total Stations and Facilities Total Technology Systems Back Office Support Phila Call Cntr Facility Improvements Riverside Call Cntr Facility Improvements Back Office Support Total Hardware Mobile Infrastructure Enhancement Progrm Point Of Sale Quik-Trak Replacement Technology SOGR And Cost Optimization Hardware Total Operations Foundation Operations Foundation Operations Foundation Total Software Agr Redemption Restructuring Amtrak Credit Card Payments Platform Amtrak Foundation - Train Operations Technology Asset, Train And Project Performance Reporting System (ATPPR) Building Automated Systems (BAS) Cyber Information Security Eng Information Portal Sys Eng Primavera Contr Mgr-Server Upgr Eng Proj Estimating Application Devlpmnt Fuel Management System -Ivy City FY04 Eng AMM Development FY05 Eng AMM Development HCM Foundations IT Strategic Technology Program IT Technology Upgrade Program Mobile Infrastructure And Enhancements Program Network Redesign And Expansion Real Property Inventory Management Information System (Rpimis) Res-Ng Web Services Infrastructure Symantec Endpoint Travel Booking Tool [Critical] Vendor Support Ending Websphere Licenses Work Management System IT Upgrade - Solaris To Linux Sap OS Upgrade Loco Health Monitrng & Analysis Sy Financial Supply Chain Management (SAP) Software Total Technology Systems Total Grand Total 121 GCAP 0.4 0.6 92.2 Other 2.9 5.3 0.2 2.0 2.5 12.9 67.4 Grand Total 0.4 2.9 5.3 0.2 2.0 2.5 13.5 159.7 0.0 0.1 0.1 0.0 0.1 0.1 0.8 2.3 4.4 3.8 11.4 0.8 2.3 4.4 3.8 11.4 14.8 14.8 14.8 14.8 3.5 7.6 1.2 2.0 1.3 0.4 0.1 0.1 0.5 0.2 0.7 6.5 6.8 1.6 2.5 0.3 1.9 0.6 10.2 0.2 0.3 0.7 0.6 2.2 0.5 0.7 53.0 79.3 $862.6 3.5 7.6 1.2 2.0 1.3 0.4 0.1 0.1 0.5 0.2 0.7 6.5 6.8 1.6 2.5 0.3 1.9 0.6 10.2 0.2 0.3 0.7 0.6 2.2 0.5 0.7 53.0 79.3 $1,411.5 $548.9 Appendix VI: FY2015 Capital Project List GCAP & Operating Profits $ millions ADA Compliance ADA Stations ADA Compliance Projects ADA Stations Total Safety / Mandates Passenger Information Display System (PIDS) Safety / Mandates Total ADA Compliance Total Environmental Remediation Safety / Mandates Asbestos/Lead Paint/Mold Abate Beech Grove Facility - Wwtp/Sewers Cedar Hill Remedation Future Pollultion Prevention Future Remediation Hialeah FL Pahs Remediation Los Angeles Wastewater Upgr New Brunswick Commuter Yard Remediation New Orleans Daf Upgrades New Orleans Fueling Facility Upgrs Oakland Stormwater Treatment System Penn Station Track Remed Prevention Of Groundwater Contam. Sanford Fl - Storm Water System Upgrade Sanford Fl Wastewater System Upgrade Sunnyside Yard Asbestos Wrap Abatement Sunnyside Yard Oil/Pcb Remed Trenton NJ - Commuter Yard Remediation Wilmington Maintenance Facility Stormwater Drainage Wilmington Remediation Wilmington West Yard Safety / Mandates Total Environmental Remediation Total Fleet Overhauls Acela Programs Acela Overhaul Acela Programs Total Amfleet Programs Amfleet Coach Overhaul Level 2 Amfleet I Cafe/Club O/H Lvl 1 Amfleet I Coach O/H Level 1 Amfleet II Coach Overhaul Level 2 Amfleet II Diner O/H Lvl 2 Cab Car Overhaul - Level 1 Amfleet Programs Total General Safety & Reliability Automated Pantograph Inspection System Brake Pad Scan System Engineering Modification Project Positive Train Control (PTC) Grand Total $50.0 50.0 $50.0 50.0 8.2 8.2 58.2 8.2 8.2 58.2 0.8 1.5 0.3 1.3 1.0 0.1 0.2 1.3 0.1 0.7 0.3 0.2 0.2 0.2 0.1 1.0 0.8 0.9 0.5 2.5 0.2 13.8 13.8 0.8 1.5 0.3 1.3 1.0 0.1 0.2 1.3 0.1 0.7 0.3 0.2 0.2 0.2 0.1 1.0 0.8 0.9 0.5 2.5 0.2 13.8 13.8 52.7 52.7 52.7 52.7 26.5 4.8 7.2 0.0 2.5 1.6 42.6 1.0 1.0 5.0 4.2 122 Other 15.6 6.7 3.1 2.5 3.2 31.1 42.1 11.5 10.3 2.5 2.5 4.8 73.6 4.6 1.0 1.0 5.0 8.8 GCAP & Operating Profits 1.0 1.0 13.2 $ millions Trackside Acoustic Detection System s (T Wheel Scan General Safety & Reliability Total Horizon/Surfliner Programs Horizon Cafe Overhaul Horizon Coach Overhaul - Level 2 O/H Surfliner Business Class Cars Surfliner Cab Car Overhaul Surfliner Cafe Overhaul Surfliner Coach Overhaul Horizon/Surfliner Programs Total Locomotives Diesel Locomotive LCPM F59 Locomotive Overhaul Non-Powered Control Units(NPCU)-Overhaul P-32-ED Locomotive Overhaul Locomotives Total Mandatory Projects Car Mandatory Programs Locomotive Mandatory Programs Mandatory Projects Total Superliners Superliner 1 Diner Overhauls Superliner Diner Lounge Overha Superliner I Coach Overhauls Superliner I Lounge Overhauls Superliner I Sleeper Overhaul Superliner II Coach Overhaul Superliner II Diner Overhaul Superliner II Lounge Overhaul Superliner II Sleeper Overhaul Superliner II Trns Sleepr/Dorm O/H Superliners Total Talgo Programs Talgo Equipment Modifications Talgo Programs Total Viewliner Programs Viewliner Sleeper - Overhaul Viewliner Programs Total Wrecks Car Wreck Program Locomotive Wreck Program Wrecks Total Fleet Overhauls Total Gateway Program Special Programs Gateway Preliminary Design And Planning NY Gateway Tunnel - Phase 1 Design Special Programs Total Gateway Program Total 4.6 Grand Total 1.0 1.0 17.8 0.0 0.1 0.0 0.0 0.1 0.0 0.2 0.8 8.1 0.4 0.6 0.7 1.6 12.2 0.8 8.2 0.4 0.6 0.8 1.7 12.4 15.1 0.1 0.0 5.5 20.7 9.7 7.0 1.5 0.0 18.1 24.8 7.0 1.5 5.5 38.9 2.0 3.0 5.0 2.0 3.0 5.0 3.1 4.2 19.0 6.5 3.0 9.5 1.7 2.0 3.8 5.5 58.4 0.0 3.6 3.1 4.2 22.3 6.5 3.0 9.9 1.7 2.0 3.8 5.5 62.0 0.5 0.5 0.5 0.5 0.0 0.0 7.8 7.8 2.0 3.0 5.0 205.6 70.1 2.0 3.0 5.0 275.7 15.0 4.0 19.0 19.0 0.0 0.0 0.0 0.0 15.0 4.0 19.0 19.0 7.8 7.8 123 Other 3.2 0.0 0.0 0.4 0.0 0.0 $ millions Infrastructure Renewal Amtrak Support Sunnyside Yard Water Lines Tracks 13-26 Amtrak Support Total Improvements Central Div - Undergrade Bridge Upgrades Il466.20 Bridge Rehabilitation Int Lumber St Interlocking - C&S Interlocking Upgr Int Lumber St Interlocking-C&S Interlocking Upgrad Michigan District-Hot Box Detector Michigan Line - Rail Lubricator Installationll Michigan Line Mp152-Mp158 Signal System Upg Overhead Bridge Catenary Mods PTC Porter-Kalamazoo - Itcs Servers Backup Pwr Sup Rensselaer NY-MOFW Direct Fix Track Upgr Septa Stations Intertrack Fence Upgrades WIL MOFE Facility Tie/Timber Improvements Total Major Projects Brunswick-Trenton NJHSRIP Track Upgrades Bush River Br Replacement Dsn - Md072.14 CHI 14Th St Yd Retaining Wall Conn Rv Repl Design - CT106.89 Freq Metuchen Converter NJHSRIP-Upgrade Gunpowder River Br Replace Dsn - Md078.86 Hamilton Sub NJHSRIP Design And Construct Harrisburg Line Private Xing Elim Kingston RI Capacity And Platform Imprv Landover/Hanson Interlocking Renewal New Brunswick-Trenton NJHSRIP Bridge Upgrs New Brunswick-Trenton NJHSRIP Catenary New Brunswick-Trenton NJHSRIP Prg Mgmnt New Brunswick-Trenton NJHSRIP Signals NY015.73 Pelham Bay-Brdg Replacement Dsn Springfield Ln Double Track Stip Brandy To Ragan - Section Improve Susquehanna Bridge Replacement - Md060.07 Tun B&P Tunnel-Replacment Prelim Dsn Major Projects Total Safety / Mandates Acse Amtrak Owned-Positive Train Control Bal Subdiv Inst Security Fence Empire Line Overbuild Lighting Eng Employee Arc Flash Protection Safe Mid-Atlantic Div - Row Fencing Replacement New England Division Fencing NY Div - Row Fencing Replacement PTC I-Etms # Acses Interoperability (Fed Safety / Mandates Total GCAP & Operating Profits Other Grand Total 0.4 0.4 0.4 0.4 0.8 0.8 1.0 0.4 0.8 0.2 0.5 0.1 3.0 1.5 0.9 0.1 0.4 0.3 8.9 1.0 0.4 0.8 0.2 0.5 0.1 3.0 1.5 0.9 0.1 0.4 0.3 8.9 12.6 30.0 12.0 7.0 20.0 228.2 12.6 5.0 7.5 5.0 26.8 5.0 1.9 1.5 8.0 9.8 1.8 55.6 18.2 27.4 5.0 30.0 15.0 7.0 20.0 263.2 76.1 76.1 5.0 2.0 0.3 0.4 2.0 0.7 1.0 76.1 87.5 5.0 7.5 5.0 26.8 5.0 1.9 1.5 3.0 8.0 6.9 1.8 55.6 18.2 27.4 5.0 3.0 35.0 5.0 2.0 0.3 0.4 2.0 0.7 1.0 11.4 124 GCAP & Operating Profits $ millions SOGR Base 30Th St Station Block Ties 52Nd St Br Span And Column Upgr - PA004.06 Abutment/Pier Upgr - CT082.00 Abutment/Pier Upgr - CT130.63 Adams Subdiv Culvert Upgr Albany Line - Culverts Upgrades Albany Line - Timber Program Albany Line Curve & Trail Track Rail Repl Albany Ln Insulated Jnt Renew Amtrak Sy Surfacing Prg Develop Amtrak System Mud Spot Elimination Amtrak System Roadbed Stability Upgr Arsenal 2A-Disconnect Switch Replacement Arsenal Sub 2A Transformer Installation B&P Tun Block Tie/Rail Renewal Bal Subdiv Catenary Pole Upgrs Bal Subdiv-Instl Track And Code Relays Bal Subdiv-Phase Selective Unit Upgr Baltimore Subdiv - Cat Hardware Renewal Baltimore Subdiv Installationll Static Wire Baltimore Subdiv Koupler Upgr Baltimore Subdiv Subst Imprv Baltimore Subdiv Substa Battery System Upgr Baltimore Subdivision-Signal Power Upgr Baltimore Tunnel Improvements Baltimore-Trans Line And Hardware Upgr Boston Subdiv-Circuit Breaker Installationll Bowie Sub 23-Air Break Switch Replace Brandywine Creek North Walkway - PA032.10 Brg/Tunnel/Wall Future Design Bryn Mawr Interlocking Turnout Replacement C&S Lancaster Shop Eqi Upgr Cabc Hellgate Line - C&S Cable Renewal Cat Empire Line - Catenary Hardware Renewal Cat Et Training Facility - Upgrades Cat Hellgate Line - Koupler Brake Replacement Central Div Track Rehabilitation Charles Interlocking - Turnout Renewal Clinton CT(Clinton) New Interlocking Construction Cocassett St Backwall Upgrades - Ma206.42 Conestoga Substa Transformer Replacement Cynwyd/Paxton Interlocking Renewal Davisville Interlocking Microlok 2 Upgr Disconnect Switch Replacement - Zoo 9 Dock Interlocking C&S Renewal Dock Interlocking T/O Renewal Dock To Elmora Catenary Hardware Renewal Edgely Sub 33 Improvements Electric Traction - Substation Relay Upgrades 0.9 0.5 0.4 0.3 0.2 1.0 0.2 0.0 0.1 0.2 2.0 2.0 0.1 0.2 Other 0.2 5.2 0.2 2.0 0.5 0.3 0.3 1.1 0.1 0.1 0.2 0.4 0.2 0.3 0.3 0.3 0.0 0.2 1.5 2.0 0.2 0.3 0.2 0.3 0.0 5.0 5.0 2.0 0.2 1.8 2.0 0.5 0.3 1.5 1.4 0.2 0.2 0.2 125 1.5 1.4 0.2 Grand Total 0.9 0.5 0.4 0.3 0.4 1.0 5.4 0.3 0.1 0.2 2.0 2.0 0.1 0.2 2.0 0.5 0.3 0.3 1.1 0.1 0.1 0.2 0.4 0.2 0.3 0.3 0.3 0.0 0.2 1.5 2.0 0.2 0.3 0.2 0.3 0.0 5.0 5.0 2.0 0.2 1.8 2.0 0.5 0.3 3.0 2.8 0.4 0.2 0.2 $ millions Electric Traction Design Review Elmora-Union Catenary Upgr Empire Corridor Bridge Timber Replacement Empire Corridor Movable Bridge Upgrades Empire Corridor Undergrade Bridge Upgrades ERT Line 3/4 Rail/Ties Fair Interlocking Dc Sw/Battery Installationll Fair Interlocking Relocate C&S Eqi Above Flood Ln Fast Mid-Atlantic Division - Renew Pads Clips And Fast New York Div - Replace Concrete Tie Fastener Frankford 30 - Disconnect Sw Replacement Gate To Pelham Bay - Install LED Signals Glenolden 10 - Disconnect Sw Replacement Grove-Bowie Catenary Structure Repl Guliford Interlocking Microlok 2 Upgr H Street - Steel Upgrade Harrisburg Line - A Point And Sub Return R Harrisburg Line - Manhole Cover Upgrades Harrisburg Line - Undergrade Bridge Upgrades Harrisburg Line 12Kv Substation Brks Harrisburg Line Culverts Upgrs Harrisburg Line Static Wire Installation Harrisburg Line Transmission Line Upgrs Hebronville MA (Bronville) Constrt New Interlocking Hellgate Bridge Walkway & Fall Protection Hellgate/Empire Interlocking Steel Hellgate/Empire Rail Renewal Hellgate/Empire Tie/Timber Hot Box Detector Repl - NED208.7 Hudson To Dock Catenary Hardware Renewal Inman Ave - Bridge Column Upgr - NJ020.16 Int Forrest Interlocking - C&S Interlocking Upgrad Int Gate Interlocking - C&S Interlocking Upgrades Int High Street Interlocking-Upgrade To Int Mid-Atlantic Division - Event Recorders Upgrad Int New England Div - Microprocessor Interlocking Bonding/G Int North Penn Interlocking - C&S Interlocking Upg Int North Penn Interlocking-C&S Interlocking Upgra Int Plains Interlocking - C&S Interlocking Upgrade Int River/Point Interlockings-C&S Interlocking Upg Int Signals - Future Design Int South Penn Interlocking - C&S Interlocking Upg Int South Penn Interlocking-C&S Interlocking Upgra Jericho Pk Wall-Bld Expansion-Paving Jo/Zoo Interlocking - Catenary Hardware Renewal Kressor St - Bridge Column Upgr - Md092.50 Lamokin 11-Disconnect Switch Replacement Lamokin Transformer-Breakers Replacement Landover Sub 24 - Air Break Replacement Lincoln-County Catenary Upgr 126 GCAP & Operating Profits 0.5 0.2 0.5 3.0 5.0 0.0 0.5 0.3 0.3 0.4 0.2 0.4 0.5 0.3 0.3 0.9 0.1 3.0 0.5 0.5 0.3 0.3 1.0 0.2 0.2 0.3 0.5 0.2 0.1 0.7 0.6 0.3 0.1 0.2 1.0 0.2 0.6 1.0 0.3 0.5 0.9 0.5 0.1 0.3 0.4 1.0 0.3 0.2 Other 0.2 7.5 0.0 0.5 0.3 0.2 0.1 0.2 Grand Total 0.5 0.4 0.5 3.0 5.0 7.5 0.0 1.0 0.3 0.3 0.4 0.2 0.4 0.5 0.3 0.3 0.9 0.1 3.0 0.5 0.5 0.3 0.3 1.0 0.2 0.2 0.3 0.5 0.3 0.4 0.3 0.7 0.6 0.3 0.1 0.2 1.0 0.2 0.6 1.0 0.3 0.5 0.9 0.5 0.1 0.3 0.4 1.0 0.3 0.4 $ millions Magnolia Interlocking Turnout Renewal Massachusetts Bridge Catenary Upg Mathus Drain Bridge Upgrades - Mi190.21 Metuchen Sub 38 Air Break Switch Repl Michigan Dist Culverts Upgr Michigan District Mp192 To Mp215 Xings Michigan District Surfacing Michigan Ln Repl Xing Pannels Mid Atlantic Division - Culvert Upgrades Mid-Atlantic Div - Retaining Wall Upgrades Mid-Atlantic Div - Tunnel Construction & Upgrades Mid-Atlantic Div Concrete Tie Replacement Mid-Atlantic Div Division Bridge Timber Replacement Mid-Atlantic Div Drainage Upgr Mid-Atlantic Div Insul Joints Mid-Atlantic Div North Hot Box Detector Replacement Mid-Atlantic Div North Signal Bridge Upgr Mid-Atlantic Div S Substation Cntl Hse Upgr Mid-Atlantic Div South Interlocking Lighting Upgr Mid-Atlantic Div Turnout Replacement Mid-Atlantic Division - Spot Undercutting Mid-Atlantic Division North - Convert Track Circuts Mid-Atlantic Division North - Installationll LED Sign Mid-Atlantic Division South - Convert Track Circuts Mid-Atlantic Division South - Installationll LED Sign Mid-Atlantic Division-Secure Manhole Cover Installation Mid-Atlantic Interlocking Steel Renewal Mid-Atlantic Joint Elimination Mid-Atlantic North Undergrade Bridge Upgrs Mid-Atlantic South Undergrade Bridge Upgrs Mid-Atlantic Tie/Timber Repl Millstone Sub 37 Transformer Installationll Monmouth Sub 36 Improvements Monmouth Sub 36 Transformer Installation Morris-Holmes Catenary Upgr Morrisville Sub 34 Improvement Movable Bridge Component Dsn Mystic CT (Lords) New Interlocking Construction NEC Mitre Rail Expansion Joints Net C&S System - Network Upgrades New England - Bridge Pier And Abutment Upgrades New England - Signal Bridge Safety Upgrades New England - Tunnel Construction & Upgrades New England - Undergrade Bridge Upgrades New England Blst Deck Bridge Walkway Inst New England Concrete Tie Replacement New England Div Bridge Fall Protection New England Div Bridge Timbers New England Div Crv Patch Rail New England Div Culvert Upgr 127 GCAP & Operating Profits 1.5 0.1 0.7 0.1 1.0 0.8 0.5 0.4 0.5 0.8 3.3 2.5 1.0 2.0 1.0 0.3 0.5 0.2 0.3 4.2 2.9 1.5 0.3 1.5 0.4 0.3 3.0 2.0 10.0 10.0 7.0 0.5 0.1 0.5 0.3 0.1 2.8 2.0 1.3 0.1 0.3 0.3 1.7 5.0 0.2 0.5 0.2 1.0 1.5 0.8 Other 0.1 0.5 0.1 0.5 0.1 Grand Total 1.5 0.1 0.7 0.2 1.0 0.8 0.5 0.4 0.5 0.8 3.3 2.5 1.0 2.0 1.0 0.3 0.5 0.2 0.3 4.2 2.9 1.5 0.3 1.5 0.4 0.3 3.0 2.0 10.0 10.0 7.0 1.0 0.2 1.0 0.3 0.2 2.8 2.0 1.3 0.1 0.3 0.3 1.7 5.0 0.2 0.5 0.2 1.0 1.5 0.8 GCAP & Operating Profits 0.5 0.8 0.5 1.5 0.1 0.1 0.8 2.1 1.0 0.5 2.0 0.4 0.1 0.3 1.5 1.0 0.1 1.4 1.5 0.7 0.3 13.0 20.0 0.2 0.5 0.5 0.3 0.3 0.8 0.1 0.5 0.3 0.8 0.5 2.0 1.0 0.8 0.1 0.1 0.1 0.2 6.7 0.1 0.2 0.1 0.3 0.4 1.5 0.3 1.3 $ millions New England Div Drainage Impv New England Div Hdblock Ties New England Div Movable Bridge Upgrades New England Div Spot U/C New England Div Sub Lighting New England Div Sub Upgrades New England Div Wall Upgrs New England Division Wd Ties New England Division Xing Upgr New England Div-Retire Wayside Switches New England Dv T/O Replacement New England Insulated Joints New England Interlocking Battery Bank Repl New England Interlocking RTU Upgr New England Joint Elimination New England Springfield Line-Bridge Timb Replace New Orleans- La Wd Tie Repl New Orleans-Replace Station Track Rail And Ties New York Div - Bridge Timber Replacement New York Div Movable Bridge Upgrades New York Div NJT Territory East Timbers New York Div Surfacing Prgm New York Div Undergrade Bridge Upgrades New York Div Vacuum Train New York Div West Tie/Timber New York Division - Drainage Improvement New York Division - Secure Manhole Cover Installation New York Division - Signal Bridge Fall Protect New York Tunnel Flood Gates Upgrades New York-Newark Crv Patch Rail Northeast Corridor Radio Voter Upgrades NY Area Rail Replacement NY Div - Retaining Wall Upgrades NY Div - Signal Bridge Safety Upgrades NY Div - Tunnel Construction & Upgrades NY Div East Interlocking Steel NY Div East NJT Territory Interlocking Steel NY Div Hot Bx Detector Replace NY Div NJT Territory-Joint Elim NY Div Non-NJT Territory-Insulated Joint NY Div Non-NJT Territory-Joint Elim NY Div Production Movable Bridge Upgrades NY Div Sig Bridge Fall Protection NY Div -Spot Renew Pads Clips And Insulators NY Div West Insulated Joints NY Div West Interlocking Stl NY Div West Joint Elimination NY Div-Concrete Ties Replacemn NY Div-Intrlocking Lighting Fixture Upgr NY East Rvr Tun Rail/Tie Ln1/2 128 Other 0.3 2.0 0.2 0.5 0.8 0.1 1.0 0.8 0.1 0.1 0.1 0.1 0.3 0.4 6.2 Grand Total 0.5 0.8 0.5 1.5 0.1 0.1 0.8 2.1 1.0 0.5 2.0 0.4 0.1 0.3 1.5 1.0 0.1 1.4 1.5 0.7 0.7 15.0 20.0 0.3 1.0 0.5 0.3 0.3 1.5 0.3 0.5 0.3 0.8 0.5 2.0 2.0 1.5 0.1 0.2 0.2 0.2 6.7 0.3 0.2 0.3 0.6 0.7 1.5 0.3 7.5 GCAP & Operating Profits 2.0 0.2 0.8 2.5 3.0 0.2 0.5 0.1 0.2 0.3 0.2 0.1 0.2 0.2 0.1 1.0 0.5 0.3 0.2 0.3 0.3 0.5 1.5 2.0 0.5 0.1 0.4 0.6 1.5 0.3 0.5 0.3 0.1 0.3 0.1 0.1 0.8 1.2 $ millions NY North Riv Tun Tie/Timber Replacement NYP Subdiv-Replace Ties And Timbers Palmer'S St Xing Sig - CT140.55 Park To Paoli-Signal System Upgrade Penn Station New York Turnout Renewal Penn Station NY - Installationll LED Signals Perryville Subdiv - Cat Hardware Renewal Perryville Subdiv Installationll Static Wire Perryville Subdiv Interlocking Sec Sw Perryville Subdiv Subst Imprv Perryville Subdiv Substa Battery System Perryville Subdiv Transmission Ln Upgrs Perryville Subdiv Wall Upgrade Perryville Subdivision-Signal Power Upgr Perryville Subdiv-Section Break Upgrades Phil New Cetc Control Center Phil Subdiv Catenary Pole Replacement C Phil Subdiv Interlocking RTU Replacement Philadelphia Pike - Bridge Upgr - DE018.51 Philadelphia Subdiv Installationll Static Wire Philadelphia Subdiv Transmission Ln Upgr PHL-WIL Catenary Structure Replace Piers-Arches-Abutments - PA066.71 Point Interlocking Turnout Renewal Pole Harrisburg Line - Catenary Pole Replacement Pole Wilmington Subdivsion - Catenary Pole Upgrade Pole Zoo To Paoli-Catenary Struct Repla Portal Bridge Mitre Rail- NJ006.10 Principio Creek-Arch Upgr Providence RI- Plate Installationll Tks 1 & 2 PRY Subdiv Catenary Pole Upgrs PSCC New York System Upgrades PSNY - Sub Breaker Remote Operation Sys PSNY Radio System Upgr Design And Instl PSNY Sub 43 31St Improvements PSNY Sub 43 7Th Ave Improvemen Q Inrl- Design And Replace C&S Equipment Read Interlocking Upgrade To Microlok 2 Repl 3Rd Rail Ert/Harold Richmond Freq Circuit Breakers Upgrades S Bay Interlocking Upgrade To Microlok2 Safe Harbor Freq Convert Upgr Sharon Substa Replace Circuit Breakers Shsy - Sectionalizing Switch Replacement Sigp Baltim Sub 20-Signal Power Upgrade Sigp Fulton Inter-Repl 352 Sig Pwr Circ Sigp Landov Sub 24-Rpl 352 Sig Pwr Circ South Penn Interlocking Renewal Southampton St Yd-Substation Switch Upgr SPG Line - Undergrade Bridge Upgrades 0.8 3.0 0.1 0.1 0.2 0.1 0.1 2.0 0.3 4.0 129 Other 0.2 0.6 0.1 0.7 0.1 0.1 0.1 0.8 0.5 Grand Total 2.0 0.3 0.8 2.5 3.0 0.2 0.5 0.1 0.2 0.3 0.2 0.1 0.2 0.2 0.1 1.0 0.5 0.3 0.2 0.3 0.3 0.5 1.5 2.0 0.5 0.1 0.4 1.3 1.5 0.3 0.5 0.3 0.3 1.0 0.2 0.2 0.8 1.2 0.1 1.5 0.5 3.0 0.1 0.1 0.2 0.1 0.1 2.0 0.3 4.0 GCAP & Operating Profits 0.3 1.3 $ millions Springfield Line - Culvert Upgrades Springfield Ln Interlocking Stl Renewal State Interlocking Renewal Stip Mid-Atlantic Division-Ride Quality Improvemen Structures - Bridge Tie Design Sub 32 To Sub 34- Signal Pwr System Upgr Sub 34 To Sub 42- Signal Pwr System Upgr Sub Baltimore Subdivision - Trolley Breaker Upgrad Sub Baltimore Subdiv-Service And Potential Transfo Sub Kearny Sub 41 - Relocation Design And Construc Sub NEC Substations - Control House Replacement De Sub Perryville Subdivision - Trolley Breaker Upgra Sub Perryville Subdiv-Service And Potential Transf Sub Rahway Sub 39 - Air Break Switch Replacement Sub Royalton Sub 71 - Transformer Installation Sunnyside Yard - Substation Upgrades Sunnyside Yard Freq Computer Sys Sunnyside Yard Inst Timber Sunnyside Yard Sub 44 Improvements Swatara Creek Br Walkway Upgr - PA094.67 Swht Plains Interlocking - Switch Heater Improveme Swht South Bay Interlocking - Switch Heater Improv Swift Interlocking Sw Htr Installation Tel New England Division - Replace Comm Equipment Tel New York Division - Replace Comm Equipment Ho Thames River Br-Replace Timbers - CT124.09 Ties Boston Subdivision-Tie/Timber Prog Ties Michigan Line - Wood Tie Program Tower One Turnout Replacement Track - Future Design Track 3 Blst Deck Conv - Ma220.42 Transfer-Forest-Plains Sw Mach Trn Kearny, NJ- Passaic River Transmission Tower R Trn Midatlantic Div-Transm Brker Installationl Trn Sub 42 To Sub 44-Repl 12Kv Cbl/Cond Turnout Development/Design Union Interlocking C&S Upgr Union Interlocking Retaining Wall Upgrs Union Substation Relocation Union Tun Baltimore Md-Sig Pwr System Upgr Van Nest Sub Vacuum Brkr Repl WAS -Bos Rail Lubicator Replace WAS -NYP Redundant Comm Cable Washington 1St St - Tunnel Lighting Upgr Washington -New York Curve Patch Rail Washington -New York System Undercutting Washington Term & Ivy City - Upgr Tracks Waverly Sub 40 Improvements Waverly Sub 40 Signal Machine Waverly Sub 40 Substation Upgrades Other 7.5 7.0 0.2 0.2 0.1 0.4 0.2 0.8 1.3 0.2 0.1 0.1 1.0 0.3 0.2 0.7 0.1 0.5 0.5 0.5 0.0 0.1 0.1 2.0 1.6 1.0 0.1 0.1 0.2 0.1 0.0 2.5 0.8 1.1 0.7 0.3 0.5 1.6 0.3 0.0 0.7 0.1 0.5 2.5 0.5 17.3 54.0 2.0 0.0 0.1 0.1 130 0.5 0.1 1.1 0.3 0.3 0.0 0.0 0.1 0.1 Grand Total 0.3 1.3 7.5 7.0 0.2 0.2 0.3 0.4 0.2 0.8 1.3 0.2 0.1 0.2 1.0 0.3 0.4 0.7 0.2 0.5 0.5 0.5 0.1 0.1 0.1 2.0 1.6 1.0 2.5 0.8 0.5 0.1 2.2 0.7 0.5 0.5 1.6 0.5 0.1 0.7 0.1 0.5 2.5 0.5 17.3 54.0 2.0 0.1 0.2 0.2 GCAP & Operating Profits 1.0 0.3 0.1 0.1 0.3 0.3 353.6 $ millions West Division - Station Track Upgrades Whitford Rd - Bridge Structure Upgra Wilmington Subdiv Installationll Static Wire Wilmington Subdiv Transmission Ln Upgrs WIL-WAS Interlocking RTU Replacement Re Xing New Haven To Boston - Quad Gates Crossing Upg SOGR Base Total Special Programs Hudson Yd Construct Tunnel Box Special Programs Total Support Equipment and Vehicles Acela Train - Refurbish Accelerometer Advanced Technlogy Track Insp Sys Track Gauge Restraint Measuring System Undercutter & Consist Upgrade Support Equipment and Vehicles Total Infrastructure Renewal Total Rolling Stock Acquisition Special Programs Electric Locos - ACS64 Long Distance Single Level Replacement Next Generation Trainset Procurement Special Programs Total Rolling Stock Acquisition Total Stations and Facilities Amtrak Support DHS2010 Infrastructure Protect DHS2010 Operational Packages DHS2011 APD Operational Equipment Upgrs DHS2011 Security Awareness Prog DHS2011 Station Action Plan-Continuity Of Ops Amtrak Support Total Improvements Adams Subdiv NJT Platform Upgr Amtrak System 480 Volt Standby Power Amtrak System Design ADA Station Impv Bear Facility Improvements Beech Grove Shops Facility Improvements Central Divi Station Upgr/Ada Central Division - Facility Upgrades Central Division - MOFW Base Upgrades Chicago Station ADA Tactile Edge Replace Chicago Station Track 48 Platform Extension Chicago Yard - Master Plan Development Chicago Yds Facilities Upgrade Chicago-Upgr Mail Pltfm-Passenger Pltfm Chi-Jackson Blvd Employe Secure Entrance DHS2010 Infrastructure Protect DHS2011 Security Awareness Prog DHS2011 Station Action Plan-Continuity Of Ops 0.3 0.7 0.2 2.0 3.2 412.3 135.5 135.5 135.5 Other 50.0 Grand Total 1.0 0.3 0.1 0.1 0.3 0.3 403.6 133.0 133.0 133.0 133.0 487.7 0.3 0.7 0.2 2.0 3.2 900.1 98.1 0.0 100.0 198.1 198.1 98.1 135.5 100.0 333.7 333.7 0.1 5.4 0.1 1.1 0.3 6.9 0.1 5.4 0.1 1.1 0.3 6.9 0.1 0.1 0.4 0.8 1.0 1.0 5.0 2.0 1.0 2.0 0.8 3.0 1.5 1.5 1.0 0.5 1.0 0.3 0.4 0.8 1.0 1.0 5.0 2.0 1.0 2.0 0.8 3.0 1.5 1.5 1.0 0.5 1.0 0.3 131 GCAP & Operating Profits $ millions DHS2012 Infrastructure Securty Hardening Emp Ident Protect-Ral Pass Aut Empire Corridor - Facility Upgrades Empire Corr-Transportation Facility Upgr Harrisburg Line - Facility Upgrades Harrisburg Line-Transportation Facility Upgrade Install Hgh Eff Light-Mech Fac Ivy City S&I Bld Lighting Impv Mid Atlantic Division- Facility Upgrades Mid-Atlantic Div - Transportation Facility Upgrades MOFE Sunnyside Yard - Consolidated Maintaince Faci New England - Transportation Facility Upgrades New England Division - Facility Upgrades New Orleans La Maintenance Facility Upgr New York Division - Facility Upgrades NY Div Septa Station Pltform Upgrs NY Div -Transportation Facility Upgrades Oakland CA Maintenance Facility Upgrades Oakland CA MOFE-Industrial Drains Upgr Oakland CA MOFW Facility Upgrades Penn Station New York PIDS Upgrade Reliability Cntr Improvements Replace Wilm Maint Facility Heating Sy S&I/Running Repair Facility - Central S&I/Running Repair Facility - South S&I/Running Repair Facility - West Southwest Subdivision Station Improvmnts SPG Line-Transportation Facility Upgrade Springfield Line - Facility Upgrades West Division - Facility Upgrades West Division - MOFW Base Upgrades Western Div Station Upgr Wilmington DE - New Maintenance Complex Wilmington Facility Improvements Improvements Total Major Projects 30Th St - Understreet Garage Reconstruction High Speed Facility Ivy City-Train Traffic Upgr Master Pln Moynihan Station - Station Construction Major Projects Total NEC Master Planning Safety / Mandates Exton PA New High Level Platform Station PSNY-Emerg Operation Plan Development Safety / Mandates Total SOGR Base 30Th St Light/Interior Improve 30Th St Station - Electrical Substation Upgr 30Th St Station Electrical Upgr Other 4.7 20.5 Grand Total 4.7 0.5 1.0 0.1 0.5 0.1 1.0 0.3 3.0 0.1 13.0 0.1 3.0 5.0 3.0 0.1 0.3 0.4 0.3 0.2 1.2 2.0 1.0 2.0 1.5 1.5 1.5 0.1 0.5 2.0 0.5 1.5 2.0 1.0 77.2 7.6 7.6 7.0 1.9 1.0 5.0 7.6 15.5 18.3 0.5 1.0 0.1 0.5 0.1 1.0 0.3 3.0 0.1 13.0 0.1 3.0 5.0 3.0 0.1 0.3 0.4 0.3 0.2 1.2 2.0 1.0 2.0 1.5 1.5 1.5 0.1 0.5 2.0 0.5 1.5 2.0 1.0 56.8 1.9 1.0 5.0 0.0 7.9 11.3 1.0 0.2 0.2 0.6 0.2 0.3 132 1.0 1.0 0.2 1.2 0.6 0.2 0.3 GCAP & Operating Profits 5.0 0.3 0.4 4.0 2.0 15.0 0.5 0.5 0.5 2.5 1.0 4.0 1.5 0.5 2.0 10.0 1.0 $ millions 30Th St Station Fire Alarm Sys 30Th St Station HVAC Replacement 30Th St Station Platform Upgr 30Th Station Elevator Replacement 30Th Station HVAC Control Upgr 30Th Street Station - Facade Restoration Dock Interlocking Tower Elec Equip Upgr Empire Corr - Station Construction Upgr Empire Corridor - MOFW Base Upgrades Hanson To Gunpow - Track 1 & A Upgrades Harrisburg Line - Station Construction Upgrades Harrisburg Ln Station Upgrs Mat Handling Equp Facil-Sgr Material Management Facilities SOGR Mid Atlantic Division-MOFW Base Upgrades Mid-Atlantic Div - Station Construction Upgrades MOFW Bases Inventory Security Mount Joy PA Station Improvements New England - Station Construction Upgrades New England Division MOFW Base Upgrades New York Division - MOFW Base Upgrades New York Division MOFW Building Upgrades NY Div - Station Construction Upgrades NY PSCC - Building Roof Replacement Odenton MOFW Base - Facility Upgrades Penn Coach Yd Electrical Substation Upgr Penn Station NY-Fan Rm 1 Struct Replacement Perryville MOFW Base Upgrades PSNY - Station Lighting Fixture Upgrades PSNY Escalator Replacement PSNY Facilities Upgrades PSNY Platform Upgr 1-7 Quad Ave MOFW Base - Facility Upgrades M S&I/Running Repair Facility - NY S&I/Running Repair Facility - WAS SPG Line - Station Construction Upgrades Sta 901790 Wil Station Renov- Fa Sta Bal-Concourse & Facilities Upgrades State Of Good Repair Stations Structures FacilityFuture Design Track Equip Heavy Overhauls WAS & Ivy City Electrical Upgr WAS -Gunpow High Capacity Signal System WAS Station Concourse & FacilityUpgrs Design Phase WAS Station Concourse & FacilityUpgrs Phase 1 WAS Station-Pltfrm-Access Imprv Design Phase 1 WAS Term H20 Pressure Imprv WAS Term Interior Space Upgr Wilm - Construction MOFE Buildings 1 & 2 Wilm Service Facility-Structural Upgr SOGR Base Total Other 0.5 7.0 5.0 2.0 3.0 2.0 10.0 0.2 0.2 0.2 0.5 0.2 0.5 1.5 0.5 0.3 0.2 2.0 2.0 0.5 2.0 0.6 3.0 2.0 2.5 0.3 1.0 7.0 11.5 3.6 0.5 0.2 5.0 0.3 121.8 133 0.3 0.5 1.5 0.3 10.1 Grand Total 5.0 0.3 0.4 4.0 2.0 15.0 1.0 0.5 0.5 2.5 1.0 4.0 1.5 0.5 2.0 10.0 1.0 7.0 5.0 2.0 3.0 2.0 10.0 0.5 0.2 0.2 0.5 0.2 1.0 3.0 0.5 0.5 0.2 2.0 2.0 0.5 2.0 0.6 3.0 2.0 2.5 0.3 1.0 7.0 11.5 3.6 0.5 0.2 5.0 0.3 131.9 $ millions Support Equipment and Vehicles DHS2011 APD Operational Equipment Upgrs Support Equipment and Vehicles Total Stations and Facilities Total Technology Systems Back Office Support Phila Call Cntr Facility Improvements Riverside Call Cntr Facility Improvements Back Office Support Total Hardware Acela Wi-Fi Upgrades Amtrak Mobile Applications Enhancements GE Locomotive Trip Optimizer Mobile Infrastructure Enhancement Progrm Hardware Total Operations Foundation Operations Foundation Operations Foundation Total Software Amtrak E-Ticketing Initiative Amtrak Foundation - Train Operations Technology Customer Train Status Data Imprv Program Emom Mobile Operations Management Eng Information Portal Sys Food And Beverage Business Support Sys FY04 Eng AMM Development FY05 Eng AMM Development Intermodal Thruway Bus Eticketing IT Technology Upgrade Program Loco Health Monitrng & Analysis Sy Network Redesign And Expansion Reservation-Ticketing Foundation Program Res-Ng Web Services Infrastructure Ticket Reservation System Ecoupon Implmnt Work Management System Software Total Technology Systems Total Grand Total 134 GCAP & Operating Profits Other Grand Total 197.9 0.2 0.2 53.3 0.2 0.2 251.2 0.2 0.5 0.7 0.2 0.5 0.7 1.0 1.1 1.0 1.5 4.6 1.0 1.1 1.0 1.5 4.6 34.0 34.0 34.0 34.0 1.4 7.8 1.5 0.6 0.1 0.8 0.9 7.3 0.8 5.6 1.0 4.8 1.1 10.2 1.6 1.5 47.0 86.3 $1,128.6 1.4 7.8 1.5 0.6 0.1 0.8 0.9 7.3 0.8 5.6 1.0 4.8 1.1 10.2 1.6 1.5 47.0 86.3 $1,937.9 $809.3 Appendix VII: Capital Program Descriptions Infrastructure Renewal Projects Base State of Good Repair Bridges, Culverts and Tunnels Movable Bridges – funding to progress Amtrak's movable bridges towards a state of good repair. Some of the bridges will be brought to a state of good repair through selective component replacement while others require complete replacement of movable structure, mechanical and electrical systems. Fixed Bridges Under-grade – this program is to address under-grade bridges currently not in a state of good repair including conversion of open deck under-grade bridges to ballast deck for improved train performance. Some of the under-grade bridges can be brought to a state of good repair through selective component replacement and others will require complete replacement. Tunnels – to progress tunnels towards a state of good repair. This will be accomplished primarily through component replacement or through complete replacement of the tunnel under extreme circumstances. Signal and Communications Systems Automatic Block Signal (ABS) – to progress ABS assets towards a state of good repair. ABS component failures have been identified as a major contributor to train delay. Upgrading of outdated components will result in increased reliability, improved on-time performance and railroad safety. Advanced Civil Speed Enforcement System (ACSES) – ACSES is the Positive Train Control (PTC) system used on the NEC. This program includes upgrades to Central Instrument House (CIH), radio transmission equipment, and wayside interface units. For interoperability with freight carriers operating on the NEC, Amtrak will install an Interoperable Electronics Train Management System (I-ETMS) overlay that will allow freight trains and some commuter trains to operate on the NEC without ACSES equipment. See the Positive Train Control section of this document for additional detail. The ACSES system was mandated by the FRA for high speed operation. Interlocking – Communications & Signals – this program is to address interlocking signal system components not currently in a state of good repair. Upgrade signal systems at interlockings to eliminate equipment failures and reduce maintenance costs. This program involves conversion of air switch machines to electric machines, automation of manual towers and replacement of obsolete interlocking signal system components. Crossings – upgrade highway crossing detection devices for more reliable operation of warning systems and enhance grade crossing system safety while reducing maintenance costs. Examples of work included under this program include the renewal of ties, rail, and crossing material at road crossings as well as concrete tie installation at grade crossings. Centralized Traffic Control (CETC) – replace centralized traffic control equipment in CETC locations with modern server-based systems. The three existing locations do not have back-up capability. Server-based systems will allow for simplified back up in case of a disaster. Communications Systems - the renewal and replacement of radio assets to bring Amtrak in compliance with Federal Communications Commission requirements. Work performed under this program includes the renewal of battery back-up systems at radio locations and the replacement of analog radio equipment with digital narrowband equipment. 135 Electric Traction Catenary – the replacement and renewal of catenary wire, insulators and hardware currently not in a state of good repair. Elements of this program include not only replacement of components that are beyond their useful life, but also the replacement of wire that is beyond the allowable wear percentages. Catenary Pole – many of the catenary poles are over 90 years old and are beyond their designed service life. Replacement of the poles will provide physical support to the power transmission and catenary systems. Transmission – the replacement of traction power transmission cable and associated hardware currently not in a state of good repair. Much of the existing cable has been in service for over 70 years and has far exceeded its useful life. Examples of work performed under this program include the design, purchase and installation of new solid dielectric cable, replacement of transmission lines, demolition of the existing ductbank and construction of a new ductbank, terminations, splices and testing of the new cable. Substations and Frequency Converters - improvements made to the electric traction and substations along the Northeast Corridor. Some examples of work performed under this program are: replacement of rotary traction power frequency converters, replacement or renewal of existing power machine, and renewal of substation components such as power transformers, circuit breakers and control cables. The reliable operation of these assets is critical to on-time performance. Track Track Ballast – perform work to progress the ballast assets towards a state of good repair. Examples of work performed under the program are replacement through spot undercutting and shoulder cleaning where total replacements are not needed. Track Drainage – renew and replace track drainage assets currently not in a state of good repair. If not corrected, poor drainage will result in slow orders and higher maintenance costs associated with the accelerated degradation of track geometry. Examples of work performed under this program include the utilization of the slot-train, the Badger ditcher, and conventional earth moving equipment to re-profile existing drainage ditches and establish new ones. Track Rail Replacement – replacement of rail that is currently not in a state of good repair. There is roughly 1,600 miles of main line track that is 40 to 50 years old. Amtrak replaces an average of 35 miles of rail per year. Useful service life of rail has been exceeded once horizontal or vertical wear limits, internal defect rates, or surface conditions are approaching safety limits. This program will help to reduce maintenance costs and slow orders. Crosstie / Timber – replace crosstie and track timber along the NEC which will reduce train delays, track geometry degradation, FRA track defects, and switch failures. Examples of work performed under this program include the installation of timber underneath turnouts in yards and block tie replacement at specific locations. Track Laying System (TLS) – utilization of TLS for the complete replacement of wood tie track with concrete cross ties including replacement of concrete ties that have been found to be defective. This replacement program will reduce maintenance costs and potential slow orders, and provide for an increase in on-time performance. Track Turnouts – replacement of standard wood turnouts and associated components not currently in a state of good repair. Associated components include frogs, switch points, and wood and concrete switch timbers and other track turnout material. Track Geometry – surfacing, realignment and re-profiling of track surface as required to meet FRA Track Safety Standards, maintain ride quality standards and extend the life of track components. 136 Interlocking Renewal - total renewal of the existing track structure within interlocking limits with new advanced technology; updates include repair or replacement of turnouts, concrete switch ties, moveable point frogs, and switches. These interlocking renewal projects will move the railroad towards a state of good repair by eliminating failures and reducing maintenance costs. Major Projects Major Bridge Special Projects Address major bridges currently not in a state of good repair for improved train performance, eliminating slow orders that Amtrak must impose when bridge components fail and disrupt the train traffic. Continuous maintenance costs due to temporary repairs will also be avoided. While some of the major bridges can be brought to a state of good repair through selective component replacement, most will require complete replacement. Special Programs New Jersey High-Speed Rail Improvement Program Upgrade and improve the catenary, power, track and signal systems on the NEC primarily between New Brunswick, NJ and Trenton, NJ in order to facilitate increased speeds and improved reliability for all users and eventual higher levels of service. The program will also support the goals of increased service capacity, helping Amtrak to meet near-term rising demand for high-speed service on the NEC by operating additional trains in the 2018 to 2023 timeframe and beyond. Safety and Mandates Safety and Security This program will provide emergency access/egress in the New York City area tunnels and provide proper ventilation for removing smoke from the affected areas. The system will provide responding local Fire Department with access to the fire suppression system within the tunnels and provide Amtrak passengers with a better opportunity to survive a catastrophic event in the New York Tunnels and Penn Station. Life Safety – 1st Avenue Construction The project is located at First Avenue in Manhattan, New York City, between 32nd and 34th Streets. The project consists of reconfiguring the two shafts, North and South structures, connecting to the East River Tunnels at First Avenue in New York City. Also, the existing narrow spiral stairways will be replaced with wider stairs with landings and the existing inadequate ventilation system replaced with high capacity bi-directional fans controlled by computer at a remote location. The installation will require relocation and/or replacement of all utilities, which have been added over the years. A new structure will be constructed at the top of the shafts to house the new fans, the new utility systems, and to provide access to the new stairwells. Life Safety – NRT Ventilation Construction This project is located in the City of Weehawken, NJ and will consist of the reconfiguration of the four shafts connecting to the North River Tunnels. The existing narrow spiral stairways will be replaced with wider stairs with landings and the existing inadequate ventilation system will be replaced with high capacity bi-directional fans that will be controlled by a remote computer. The installation will require relocation and/or replacement of all utilities and a new substation, which have been added over the years. A new structure will be constructed at the top of the shafts to house the new fans, the new utility systems, and to provide access to the new stairwells. 137 Life Safety – Standpipe Installation The project consists of the installation of approximately 16 miles of a remote computercontrolled fire standpipe system along the North and East River tunnel systems. In addition, this project includes the installation of an air monitoring system to the existing standpipe system which incorporates the addition of Air-Vacuum Isolation valves with fail safe actuators in the tunnels and the installation of Standpipe Deluge Valves and Air compressors and associated piping, electrical power and controls to provide a fully operable fire standpipe system. This also includes bonding and grounding installation for the standpipe system. Life Safety – Miscellaneous Design & Construction Project Under the "miscellaneous" category two construction projects are planned to improve communications: one will provide radio coverage in all tunnels for local Fire Department personnel, while the other (emergency tunnel phones) will provide redundant communication capability. Other construction projects involve Emergency Power systems in station and tunnels, Fire alarm system installation and SCADA system for standpipe and ventilation fans. Positive Train Control Positive Train Control (PTC) is an information and communication system that improves traditional collision prevention measures and adds an entirely new layer of automated protection by enforcing permanent and temporary speed restrictions. On January 15, 2010 the FRA issued its PTC Rule which, pursuant to the Rail Safety Improvement Act of 2008, requires Class I railroads (on lines where toxic materials are hauled) and each railroad hosting intercity or commuter rail passenger service to have a PTC system installed and operating by December 31, 2015 on their main lines. A main line is defined as having 5 million or more gross tons of railroad traffic per year, or used for regularly scheduled intercity or commuter rail passenger service. The PTC Rule provides for exceptions to PTC requirements, which are subject to FRA approval, on rail lines hosting passenger trains on which freight traffic volumes, and the number of passenger trains operated, do not exceed limits specified in the rule. Continued use of a number of existing PTC systems will be allowed. These systems include: Advanced Civil Speed Enforcement System (ACSES) and Incremental Train Control System (ITCS) Burlington Northern Santa Fe (BNSF) Railway system’s Electronic Train Management System (ETMS) Interoperable Electronic Train Management System (I-ETMS) Amtrak presently uses two of these PTC systems. ACSES was installed on portions of the Northeast Corridor (NEC) in the beginning of 2000 with the startup of Acela services, and ITCS is used on the Amtrak owned Michigan Line between Porter, IN and Kalamazoo, MI and on the Chicago-St. Louis line. Amtrak’s PTC efforts include installation of ACSES on the remainder of the NEC and its tributary routes and installation of ITCS on the state-owned portion of the Michigan Line. In addition, Amtrak will work with Federal, state, and local authorities and commuter and freight railroads to ensure Amtrak trains are compliant with PTC systems adopted for use by host railroads. Compliance with I-ETMS will be a significant element of the PTC efforts. Amtrak will equip its diesel locomotives with I-ETMS which will operate in IETMS territory on host railroads. I-ETMS will be implemented in Chicago Union Terminal and New Orleans Union Passenger Terminal. Amtrak invested $64 million of American Recovery and Reinvestment Act (ARRA) funds to install PTC on Amtrak-owned infrastructure. Further, in February, 2011, Amtrak received a grant in the amount of $12.9 million (limited to 80% of the estimated cost) to Install an I-ETMS test bed in the state of Maryland. 138 Additional funding to fully comply with PTC requirements is necessary. It is important to note that compliance with PTC requirements on the host railroads outside of the NEC could drive significant costs to Amtrak. Amtrak’s contribution to PTC installation and maintenance on host railroad property will be based on the Federal statute governing “incremental costs”, which are costs incurred by hosts solely as a result of Amtrak’s presence. Changes in freight and passenger traffic on Class I host railroad lines could cause changes to PTC requirements. If those incremental costs can be attributed solely to Amtrak’s operations on the property, the company could be responsible for significant costs outside of its own infrastructure. Support Equipment and Vehicles Track Equipment The program will replace existing track equipment at the end of its useful service life. This program includes the acquisition of track roadway equipment used for track surfacing, wood tie replacement, switch exchange, and other rubber-tired railroad maintenance equipment. This will allow us to take advantage of technological advances within the industry, to replace existing equipment at the end of their useful service life and to increase the operating efficiency, utility, and production capacity of the equipment. Stations and Facilities State of Good Repair Base Maintenance of Equipment Facilities Upgrades to equipment maintenance facilities including replacement and major overhaul, of plant structures, machinery, equipment and improvements to the premises. Station Upgrades Upgrades to stations to include HVAC, roofing, lighting, elevators and escalators replacement, replacement of support equipment and other interior improvements. Maintenance of Way Base Various system upgrades to maintenance of way facilities such as HVAC replacement, roof replacement, electrical upgrades, and lighting improvements. Transportation Department Facilities Renewal of interlocking control towers such as the “K” tower and Dock interlocking tower. Washington Union Terminal SOGR Passenger Concourse and Facilities Phase I - focuses on state of good repair and initiate 100% design and construction documents for the first round of the Passenger Concourse reconstruction including tasks such as the provision for adequate egress capacity including corridors, stairs, and doors to meet the large passenger loads that have developed over the past years. Major Improvements Concourse and Facilities Phase I - will advance major improvements for reconstruction of the concourse and terminal facilities including tasks such as renovation and expansion of Club Acela, Police, ticketing and baggage handling spaces, as well as station management offices and other station support spaces. Major Improvements Concourse and Facilities Phase II - prepare final design and construction documents for Phase II including track realignments and platform improvements, improved pedestrian access between Amtrak, Metro, commuter rail, bus, taxi and parking facilities, and upgraded passenger amenities. 139 SOGR Terminal Facilities Phase I – design phase of the Washington crew base state of good repair project as well as design of the rail infrastructure for west side tracks, rail facilities, and the satellite commissary. Major Improvements East Side Program Phase II – reconstruction of tracks and platforms 21 through 30, as well as construction of new boarding Concourses B and C, and the Central Concourse. Four new high level platforms providing level boarding with 48 inch platforms will be provided serving seven new tracks, as well as a single new 15 inch platform providing level boarding for Superliner and VRE equipment serving two new tracks. Also switches, signals, and controls will be completely reconstructed as part of the project. Major Projects 30th Street Station Underground Garage Reconstruction Construction of a permanent replacement of structural columns, beams and surface decking of the under-street parking facility below 30th Street Station in Philadelphia, PA. The scope also includes addressing the water infiltration problems throughout the facility as well as inspecting, replacing and painting the structural steel below the North Parking Deck. Ivy City Master Plan Amtrak plans to double high speed train frequency between New York and Washington in 2020. This will require additional high speed service & inspection tracks as well as additional crew quarters and material storage. The recently completed Union Station Master Plan did not include a detailed analysis of Ivy City. King Street Facility Construction Phase 3 and 4 of the construction of a Service and Inspection Facility and Locomotive Shop at King Street in Seattle, WA. Moynihan Station Construction The first phase of the project is the expansion of the west end concourse, which will be followed by the installation of fan plants over E and C yards and the expansion of the 33rd Street connector. Sunnyside Yard New Mechanical Facility Plan and begin construction on a new consolidated Mechanical, Engineering, and Transportation maintenance facility and warehouse at Sunnyside Yard outside of New York Penn Station. The program is pending completion of the Sunnyside Yard master plan. Branford – Guilford Connecticut Station Improvements Funded by the State of Connecticut the scope includes the construction of a new north-side high-level platform and pedestrian bridge that will connect to the existing south-side platform at the Branford Railroad Station and the construction of an extension of the existing north-side high-level platform at the Guilford Railroad Station. High Speed Facility Replacement and major overhaul, of plant structures, machinery, equipment and improvements to the premises of the three high speed rail facilities to support operations and improve the ability to maintain the Acela fleet in a state-of-good-repair. Safety and Mandates Safety or mandated related improvements to Amtrak’s facilities such as: Implementation of ADA requirements at stations served by Amtrak nationwide 140 Replacement of emergency generator at 30th Street Station Installation of Security facilities and equipment along the right-of-way, at stations and critical locations Improvements to the Rochester NY Station funded by the New York Department of Transportation Design of the new Middletown Station facilities funded by the Pennsylvania Department of Transportation Improvements to Exton Station on Amtrak's Harrisburg Line funded by SEPTA Development of emergency operation plans and integrated evacuation plans at Penn Station New York Improvements Energy Efficiency Continuation of the successful program to install high efficiency fluorescent lighting at Amtrak facilities including mechanical locations, maintenance of way bases and stations. Quick Track Hardware Upgrades Existing Quick Track kiosks, which date from 2007, will be out of PCI compliance in April 2016. Refresh of current kiosks will permit Amtrak top replace obsolete hardware. The new QuikTrak kiosks will use state-of-the-art technology to provide continued high levels of customer service with a full range of transactions such as eTicket document issuance, remote agent capabilities, reservations purchase, and support of customers’ needs to exchange, refund and upgrade reservations and permit checked baggage in the self-serve environment. These kiosks will continue to meet requirements for accessibility to passengers with disabilities in compliance with section 508 of the Americans with Disabilities Act (“ADA”) and California state law requirements. Infrastructure Protection This program will allow Amtrak make security improvements to new or existing rail infrastructure, and to purchase and install equipment necessary to enhance security at stations and rail facilities identified in the DHS funded risk and needs assessments as key intercity rail transportation assets. These infrastructure protection measures, such as access control card readers and intrusion detection devices, CCTV, bollards, fixed and/or retractable barriers, planters, gate checkpoints, lighting and fencing, will prevent or mitigate the effectiveness of terrorist attacks, especially from VBIEDs. These measures will protect Amtrak passengers, employees and critical infrastructure assets integral to the safety and stability of the national passenger rail system. Planning and Assessments DHS funds will be used to hire a vendor to conduct an update to the risk and needs assessments. It also includes continuing deployment of Station Action Team Toolkits to Amtrak’s top priority facilities. Exercises Development of the Amtrak’s Homeland Security Exercise and Training (HSET) program, the program will create an environment where standardized training, exercise, evaluation and improvements are institutionalized within the plans, procedures and protocols at Amtrak. Successfully implementing a multi-year exercise and training program will allow Amtrak to coordinate training and exercises based on a regional approach with our federal, state, and local partners and utilize the Homeland Security Exercise and Evaluation Program (HSEEP) to coordinate our efforts. 141 Station Improvements Improvements to stations include restroom renovations, escalator replacements, replacement of support equipment and other interior improvements. Maintenance of Equipment Facilities Upgrades to equipment maintenance facilities including replacement and major overhaul, of plant structures, machinery, equipment and improvements to the premises. Maintenance of Way Base Various upgrades to maintenance of way facilities such as HVAC replacement, roof replacement, electrical upgrades, and lighting improvements. Transportation Department Facilities Upgrades, replacements and construction at transportation department facilities throughout the country. Amtrak Support Safety & Security DHS funds to support the operational and equipment needs of the Amtrak Police Department. Infrastructure Protection This program will allow Amtrak make security improvements to new or existing rail infrastructure, and to purchase and install equipment necessary to enhance security at stations and rail facilities identified in the DHS funded risk and needs assessments as key intercity rail transportation assets. These infrastructure protection measures, such as access control card readers and intrusion detection devices, CCTV, bollards, fixed and/or retractable barriers, planters, gate checkpoints, lighting and fencing, will prevent or mitigate the effectiveness of terrorist attacks, especially from VBIEDs. These measures will protect Amtrak passengers, employees and critical infrastructure assets integral to the safety and stability of the national passenger rail system. Exercises Development of the Amtrak’s Homeland Security Exercise and Training (HSET) program, the program will create an environment where standardized training, exercise, evaluation and improvements are institutionalized within the plans, procedures and protocols at Amtrak. Successfully implementing a multi-year exercise and training program will allow Amtrak to coordinate training and exercises based on a regional approach with our federal, state, and local partners and utilize the Homeland Security Exercise and Evaluation Program (HSEEP) to coordinate our efforts. Station Improvements Improvements to stations include restroom renovations, escalator replacements, replacement of support equipment and other interior improvements. NEC Master Planning Marc Joint Benefit Maryland Transit Administration will fund $7.0M annually for capital projects that benefit both Amtrak intercity passenger service and MARC commuter service. Actual projects are determined on an annual basis. Baltimore Station Area Infrastructure Improvements Funds the SOGR study which will perform a full evaluation of the station’s current condition and will provide recommended improvements. In addition, Amtrak will fund the Master Plan 142 to create a long-term vision for integrating Amtrak’s future transportation and infrastructure requirements with commercial development. Transmission Line Concept Design This project will conduct an overall environmental assessment and develop a concept design for the replacement of the current 138 kV Passaic & Harsimus Transmission Line in the vicinity of Newark, NJ, between Substation #40 (Waverly) and Substation #41 (Kearny). Clinton Interlocking Design Design of a new universal interlocking at Clinton, CT to provide operating connectivity between the two NEC main line tracks. New York Penn Station Design for wayfinding signage and preliminary design for interim corridor widening within the station. In addition funds the design and fabrication of exterior street level signage. New Carrolton Station This project will provide additional track and platform capacity at New Carrollton, including realignment of existing freight track, new gauntlet track, and new northbound side platform. Support Equipment and Vehicles Communications & Situational Awareness This is a DHS funded program and will increase the capacity for Amtrak to detect, prevent and respond to security threats by providing resources such as interoperable communications equipment, analytic CCTV systems for surveillance and alarm monitoring, and various technical solutions. These investments will increase situational awareness and capacity to monitor areas in and around various Amtrak facilities. Equipment and Security Operations This is DHS funded program. The scope includes Canine Officers refresher advanced training, canine vehicles, surge operations, etc. Fleet Overhauls Amfleet Overhauls Funding for the various levels of overhauls that range from mandatory maintenance to complete equipment overhauls, reconfigurations and conversions of equipment, and modifications required by statutes and the Federal Railroad Administration (FRA). Configurations include passenger coach, café/club, lounge, and cab cars. These passenger car programs will enable Amtrak to maintain equipment in a state of good repair, to return the assets to current Amtrak standards, improve reliability and availability of equipment, enhance overall customer experience, comply with applicable Federal regulations and mitigate equipment failures which result in customer discomfort and inconvenience. 143 Acela Overhauls Continuation of the multi-year Acela Overhaul Program addressing the system overhaul needs of the Acela train sets. Overhaul requirements are identified by major system condition assessments, fatigue life calculations, and reliability data trends. This program will enable Amtrak to maintain equipment in a state of good repair, to return the assets to current Amtrak standards, improve reliability and availability of equipment, enhance overall customer experience, comply with applicable Federal regulations and mitigate equipment failures which result in customer discomfort and inconvenience. Superliners Funding for the various levels of overhauls that range from mandatory maintenance to complete equipment overhauls, reconfigurations and conversions of equipment, and modifications required by statutes and the Federal Railroad Administration (FRA). Configurations include passenger coach, diner, sleeper, lounge, and transition sleeper cars. These passenger car programs will enable Amtrak to maintain equipment in a state of good repair, to return the assets to current Amtrak standards, improve reliability and availability of equipment, enhance overall customer experience, comply with applicable Federal regulations and mitigate equipment failures which result in customer discomfort and inconvenience. Locomotive Overhauls and Life Cycle Maintenance Program Amtrak diesel locomotive programs will involve the various levels and modifications required by Federal agencies including the Transportation Safety Administration (TSA), Environmental Protection Agency (EPA) and Federal Railroad Administration (FRA). This program enables Amtrak to bring the locomotive fleet to a state of good repair, increase locomotive reliability and availability, extend the useful life of the locomotive, comply with applicable Federal rules and regulations, and mitigate future expenses associated with an aging fleet. Overhaul for electric locomotives (AEM-7 DC, AEM-7 AC, and HHP-8) are suspended with the deployment of the new ACS-64 electric locomotive that began in FY14. Horizon Funding for the various levels of overhauls that range from mandatory maintenance to complete equipment overhauls, reconfigurations and conversions of equipment, and modifications required by statutes and the Federal Railroad Administration (FRA). Configurations include passenger coach and food service cars. These passenger car programs will enable Amtrak to maintain equipment in a state of good repair, to return the assets to current Amtrak standards, improve reliability and availability of equipment, enhance overall customer experience, comply with applicable Federal regulations and mitigate equipment failures which result in customer discomfort and inconvenience. Surfliner Programs Funding for the various levels of overhauls that range from mandatory maintenance to complete equipment overhauls, reconfigurations and conversions of equipment, and modifications required by statutes and the Federal Railroad Administration (FRA). Configurations include business class coach and cab cars. These passenger car programs will enable Amtrak to maintain equipment in a state of good repair, to return the assets to current Amtrak standards, improve reliability and availability of equipment, enhance overall customer experience, comply with applicable Federal regulations and mitigate equipment failures which result in customer discomfort and inconvenience. Viewliner I Programs Funding for the various levels of overhauls that range from mandatory maintenance to complete equipment overhauls, reconfigurations and conversions of equipment, and modifications required 144 by statutes and the Federal Railroad Administration (FRA). Configuration is for sleepers. These passenger car programs will enable Amtrak to maintain equipment in a state of good repair, to return the assets to current Amtrak standards, improve reliability and availability of equipment, enhance overall customer experience, comply with applicable Federal regulations and mitigate equipment failures which result in customer discomfort and inconvenience. General Safety and Reliability Projects include design, specification, engineering and blueprinting of future improvements to existing rolling stock, design of new rolling stock, and deployment of Positive Train Control technology upgrades on the locomotive fleets. Mandatory Revisions Required modifications to existing fleet resulting from changes in regulations required by Federal agencies including the Transportation Safety Administration (TSA), Environmental Protection Agency (EPA) and Federal Railroad Administration (FRA). These revisions vary annually. Heritage Programs Air brake Clean, Oil, Test & Stencil (COT&S) as needed for baggage cars during phase out while new baggage cars are procured and deployed into service. Talgo Programs Funding for the various levels of overhauls that range from mandatory maintenance to complete equipment overhauls, reconfigurations and conversions of equipment, and modifications required by statutes and the Federal Railroad Administration (FRA). Configurations include passenger coach, and food service cars. These passenger car programs will enable Amtrak to maintain equipment in a state of good repair, to return the assets to current Amtrak standards, improve reliability and availability of equipment, enhance overall customer experience, comply with applicable Federal regulations and mitigate equipment failures which result in customer discomfort and inconvenience. Wrecks Repair of passenger cars and locomotives place out of service due to accidents or incidents. Technology Systems Software Customer Experience Programs The Customer Experience Programs interact with Amtrak’s reservation systems to deliver customer-facing functionality through our distribution channels. In FY2014 - FY2018, the Customer Experience Program will modernize the interface to the reservations system which will improve customer service capabilities for call center and station ticket agents; enable access to “Fare Family” functionality in all distribution channels, thereby allowing customers to select from products and fare choices that best suit their needs; allow all distribution channels to access customer profile information from the reservations system which will provide customers more personalized travel options. eTicketing The initial phase of eTicketing was launched on July 30, 2012. This solution delivers “print anywhere” capability to approximately 90% of Amtrak customers. Customers now have the ability to purchase and print tickets at home, or to be paperless by using a smartphone application, greatly simplifying the customer ticketing process. Furthermore, conductors and 145 accounting personnel no longer have to use paper tickets to capture revenue, and conductors have access to real-time passenger information and greatly improved passenger manifest lists. The technology also enables on-board conductors to electronically report equipment issues to facilitate proper maintenance. The eTicketing solution has proven to be very successful with conductors and customers alike. The FY2015 eTicketing program will focus on extending the complete eTicketing solution to Amtrak’s intermodal partners (e.g. bus, airline, etc.) as well as adding enhancements for conductors, customers and state partners through the addition of enhanced reporting and accounting controls. The eTicketing Expansion project will eliminate the use of paper value tickets and greatly reduce the number of paper certificates and vouchers. This will enable Amtrak to realize increased cost efficiencies and an improved customer experience by allowing all to enjoy the benefits of eTicketing. National Passenger Information Systems (OPIS) The Onboard Passenger Information System (OPIS) will provide passengers riding Amtrak trains with reliable visual and audible information such as the train destination, current station, next station, pre-recorded messages, and visual graphics. OPIS will include at its core a control unit that directs audio messages to new and/or existing Amtrak Public Address (PA) systems, and visual information to new and/or existing LED signs and video displays, will deliver on-board media and entertainment purchase options such as movies, music and games, creating new passenger revenue opportunities. Revenue Management System (RMS) A multi-year project that will automatically and accurately forecast demand by city pair and by price point for each of Amtrak’s train departures, optimizing ticket revenue. RMS will provide price point inventory authorizations to Arrow, Amtrak’s reservation system, and passenger demand forecasting to Capacity Management Systems. The result for Amtrak will be incremental ticket revenues from a more efficiently revenue-managed system. Marketing eCRM Platform Upgrade Due to IBM's product discontinuation Amtrak will not be able to perform email and online eCommerce marketing. This project will complete the software and data integration of the Digital Marketing Center (DMC) Email platform and the Web Site Personalization (WSP) platform to support targeted and customized messaging to visitors on Amtrak.com. Human Emulation Technology It allows users to ask an automated system to answer questions and provide issue resolution. It engages users through natural language dialog and has intelligence to understand a question and determine the correct answer with a high degree of accuracy. Provides enhanced customer experience via natural language processing, advanced computing, intuitive knowledge bases, and state of the art user interface technology. Assists and guides customers towards resolution of their specific issues in an efficient and engaging manner. Credit Card System Upgrade Payments Platform Program is to extract payment card functionality from the heritage systems, place them in an up-to-date third party electronic Payments Platform, and use the resulting functionality to access “best practices” today and in the future. This will permit Amtrak to improve the customer interface (including access to PIN debit and possibly a payments wallet like PayPal), to reduce the costs of processing (including interchange screening), to reduce fraud (including 3D Secure, American Express Enhanced Authorization, and other transaction filters), and to give ready access to catastrophic fraud prevention (including “tokenization” should Amtrak decide to use such a service). 146 Amtrak Foundation Improves train operation efficiency by introducing and integrating mobile devices into work flows; consolidating Enterprise Asset Management to a single system for managing facility assets and warranties on assets and asset components. Enterprise Resource Planning (ERP) Foundation Increases the operating efficiency of the enterprise SAP system by integrating the Logistics Warehouse Management system and adding SAP licenses. It improves management reporting with emphasis on Food & Beverage information aimed at reducing costs and increasing revenue. Mechanical Technology Ongoing investment into the Work Management, Mobile Data Management, and Locomotive Health Monitoring & Analysis applications to improve the ability to schedule and monitor mandatory rolling stock maintenance, reduce manual processes and improve reliability and performance of rolling stock. Next Generation Reservations System Modernize, streamline and significantly reduce business and technical risks from Amtrak’s sales, reservation and ticketing system. The current foundation for Amtrak’s sales, ticketing, and operational processes - including customer service and train operations - is over 30 years old and is based on outdated technology. The potential failure of this outdated infrastructure presents a critical business risk that must be addressed. IT Strategic Technology Program The program is designed to organize and prioritize key strategic initiatives to be developed in the Information Technology area that are assessed as critical to providing world class IT services, assessing and responding correctly and quickly to emerging and evolving technologies, meeting threats to information confidentiality, availability and integrity, and meeting corporate strategic goals and priorities. Human Capital Management (HCM) Foundations Improves communication to employees and automates several HCM processes. Impacted systems and processes include Employee Information Management system enhancements, Employee Communications Portal, e-Recruiting Resume Parsing Module, Family Medical Leave Act Administration System, Human Capital e-Forms and New Hire Onboard Automation System. Mobile Applications Enhancements Improve performance, availability, and maintainability of Amtrak's deployment and utilization of all categories of mobile device used in eTicketing and in conductor mobile device initiatives, including supporting network infrastructure, applications and upgrading platform technology to latest supported version. Amtrak.com This project intends to deliver an enhanced customer experience and increase sales opportunities by providing accurate and reliable travel information in an interactive and 147 simple interface. Develop a strategic plan for creating and delivering destination and enroute content for major markets. Cyber Information Security Continuation of a multi-year program that enhances and refreshes Amtrak’s information security technology. This program ensures compliance with regulatory and legal requirements, improves the ability to ensure the confidentiality, integrity, and availability of Amtrak’s critical infrastructure systems, safeguards customer transaction information, and enables quick response to vulnerabilities in the information technology infrastructure. Engineering Technology The scope of this program includes the development of the Maximo Work Management System (MWMS) for the Engineering Department, development of an infrastructure asset library, development of the Engineering Personnel System (EPS), and development of an Enterprise Project Management System (EPM). It also builds on earlier investments in Timberline estimating, Primavera scheduling and document management with the integration of the EAM systems with the EPM and EPS system. These systems will continue to be developed and integrated to provide for a seamless flow of information that will assist field and management personnel in the project management of the Engineering Capital Program. Customer Service Passengers have become more and more reliant upon Amtrak’s train status information. Consistency across channels is vital for Amtrak to improve its customer service. This program aims to complete several sub-projects with the ultimate goal of improving train status from a customer perspective. In addition the program will fund the technical efforts necessary to support the new Amtrak Guest Rewards travel redemption model, and to activate the model in self-service reservations and ticketing for members. These new capabilities will expand the current availability of self-service travel redemptions beyond simple one-way trips. The member experience will be vastly improved, allowing members to utilize preferred electronic channels to price and confirm their redemption travel. Furthermore, Amtrak will reduce costs of servicing travel redemptions by eliminating dependency on contact center agents for routine tasks. Operation Business Application Improvement Implement technology to modernize operations and help to drive efficiencies. This includes improvements to interactions with the customer and back office support. It will increase Amtrak’s effectiveness and ability to track compliance with FRA regulations and customer transactions. Operations Foundation Operations Foundation Program This is a multi-year program that first looks to build a consolidated framework and roadmap for the Operations department investments. This program will enable enterprise wide process change with fully integrated tools and accurate and accountable data repositories that are fully integrated and able to consolidate important operational data. The program will be implemented in a series of phases that are prioritized by the Operations Steering Committee and stakeholders. Projects will include: the integrated Labor Management System (iLMS) which will replace and enhance the existing Labor Management System, a service management 148 system that integrates the timetable, equipment, crew and passengers across the planning time continuum, and the delivery of consolidated detailed reporting and analytical capabilities. Hardware Mobile Infrastructure Enhancements Improve performance, availability, and maintainability of Amtrak's deployment and utilization of all categories of mobile device used in eTicketing and in conductor mobile device initiatives, including supporting network infrastructure, applications and upgrading platform technology to latest supported version. IT Infrastructure This is a multi-year effort to realize cost-savings in the data center, by optimizing its infrastructure footprint in areas where it might be over-investing in or under-utilized data center assets and resource categories. The objective of the program is to create a business continuity development model that can avoid outages and provide near zero down for maintenance. Wi-Fi Program Expansion This project builds on that success of Wi-Fi in the NEC by extending the installation of Wi-Fi networks to the remaining trains system-wide, beginning with the long-distance fleets. In addition to providing Internet access, the network will serve as a platform for other passenger services (e.g. movies, news, and games) and business services (e.g., on board system communications with Amtrak’s corporate network). Mobile Application Enhancements Improve the user experience on tablet computers. Move towards a mobile logic where users operate more with Apps rather than Browsers. The current Rider application is designed to help customers plan their trips, book reservations and initiate travel. It does not provide the next step of enhancing the actual journey once onboard the train. On Board Enhancements (OPIS) The Onboard Passenger Information System (OPIS) will provide passengers riding Amtrak trains with reliable visual and audible information such as the train destination, current station, next station, pre-recorded messages, and visual graphics. OPIS will include at its core a control unit that directs audio messages to new and/or existing Amtrak Public Address (PA) systems, and visual information to new and/or existing LED signs and video displays, will deliver on-board media and entertainment purchase options such as movies, music and games, creating new passenger revenue opportunities. Locomotive Monitoring and Fuel Management To utilize trip optimizer software that controls optimum speed to achieve minimum fuel use. The trip optimizer monitors locomotive performance and integrates GPS tracking along the route, evaluates the route for savings opportunities and plots the optimal speed for fuel savings. Renovate or replace fuel management system hardware at the storage tank locations in order to be able monitor fueling activities remotely via computer network. Back Office Support Call Centers The program is to maintain a state of good repair at the Philadelphia and Riverside call centers. The facility projects include improving both interior and the exterior of the centers. The objective is to maintain safe and functional working environment for Amtrak's contact centers. 149 Gateway Program See “The Gateway Program” in Section 1 for an overview of the program. Major program milestones are listed below. Progress to Date and Anticipated Next Steps Hudson Yards Concrete Casing Phase 1: Construction began in August 2013 and will extend through October 2015. Gateway System Level Design Study (18 mos.): This study, now underway, defines functionality and utility of the infrastructure built under the Gateway Program, including use by different operators. It is developing and evaluating minimum operating segments with independent utility. As part of this study, Amtrak is seeking to collaborate with NJ Transit, LIRR and Metro-North to assess and determine future service plans and Program functionality. Gateway Program Development Study (26 mos.): Starting in May 2014, this study will focus on development of overall Program delivery and management, including implementation strategies partnerships, funding and financing, schedule, and risks. Final Design and Construction of Hudson Yards Concrete Casing Extension: Procurement of final design underway and NEPA review anticipated to be complete in FY2015. Concept Design of Penn South Station Expansion: Advancing concept design for Penn Station South and integrating it with the Penn Vision Study and Moynihan Phase II. Includes pedestrian analysis. Penn Station NY Train Capacity Modeling: Train capacity modeling and service development plans, including evaluation of potential Metro-North service over Hell Gate Line and additional Empire Service. Begin Preliminary Engineering and NEPA work on new Hudson River Tunnels: Begin early engineering work and environmental reviews for new tunnels serving Penn Station under the Hudson River. Preliminary Engineering of “Sawtooth” Bridges U.G. Bridge 7.80 (NJ Transit) and Bridge 7.96 (PATH): Replacement of these seriously distressed bridges must take into account expansion from two to four tracks for the Gateway Program. Concept Design - Elizabeth Station and 5th Main Track Project (Dock to Elmora): Studies have shown additional capacity west of Newark will be required for the Gateway Program. Joint studies with NJ Transit will evaluate 5th track requirements and a new NJT station at Elizabeth. Harrison 4th Track Final Design and Initiation: Property has been acquired for a 4th track in Harrison. This project is necessary for creating a full four track Gateway Program alignment from Newark to Penn Station, NY. Environmental Remediation These clean-up efforts are required by state directive or by agreement. Wilmington Facility Remediation – Amtrak has signed a Voluntary Cleanup Agreement with the Delaware Department of Natural Resources and Environmental Control to remediate PCB 150 and petroleum soil contamination at the Wilmington maintenance facility and initiate erosion control measures. Wilmington Maintenance Facility Stormwater System Upgrade – This project is mandatory based on requirements of the City of Wilmington for wastewater discharge. Currently storm water from the Locomotive Yard is conveyed either directly to Outfall 002 or to the Industrial Wastewater pretreatment system. The Yard collection system needs to be reconfigured so that drainage of the yard, yard pits, and containment areas (fueling pad, offloading pad) flow through an oil/water separator and then discharges to Outfall 002. Wilmington West Yard Remediation – The Delaware Department of Natural Resources performed an investigation of the Wilmington West Yard as part of a regional study in November 2001. Low levels of contaminants were found throughout the site from Mill Creek (southern end) to Beech Street (northern border). Wilmington Shop Replace Petroleum Tanks – Two petroleum storage tanks at the Wilmington shops have failed inspection and testing and must be replaced during FY2015. These tanks are very old and of riveted construction, therefore the tanks cannot be repaired. The exact age of these tanks is unknown. These tanks and related system must be removed and replaced to prevent a catastrophic release of petroleum on to the site. Beech Grove Facility Wastewater Treatment System Upgrades - Replaces the existing wastewater treatment system that is 60 years old and which has the potential to contaminate ground water. Sunnyside Yard Oil/PCB Remediation - By order of the New York State Department of Environmental Conservation, Amtrak and New Jersey Transit are involved in a multi-year effort to remove PCB-contaminated soil and clean-up of ground water at New York’s Sunnyside Yard. Asbestos, Lead Paint and Mold Abatements - Multi-year initiative to remove or remediate asbestos, mold and lead paint as encountered during construction projects. Sunnyside Yard Asbestos Wrap Abatement - The utility trenches at Sunnyside Yard (between tracks 13/14, 15/16, 17/18, 19/20, 21/22, 23/24, and 25/26), which is where New Jersey Transit trains are platformed, have old steam lines with asbestos wrap on them. The steam lines are no longer in service. Prior to the new water service pipes being installed in these trenches, the old pipes and trenches need to be abated of asbestos. Los Angeles Facility Wastewater Treatment System Upgrades - Covers the potential elimination or reduction in use of 80 year old wastewater treatment ponds at Los Angeles Yards that have considerable potential for non-compliant discharges. This project anticipates design of subsurface storm water diversion features and construction of storm water diversion devices such as containment curbs, canopies or other enclosures. Chicago Steam Plant Asbestos Abatement - Removal of asbestos contaminated material from the steam plant in the Chicago maintenance yard. This plant has not operated since May of 2011. The building is a major repository for asbestos containing materials and poses a 151 significant liability for Amtrak. Removing the asbestos will insure that the general public and Amtrak employees are not exposed to asbestos and will eliminate the potential for air and water pollution. County Yard Environmental Remediation - Commuter yard in New Brunswick, NJ is owned by Amtrak but has never been operated by Amtrak; rather New Jersey Transit operates the facility under an operating agreement for commuter operations. The State of New Jersey has been notified of PCB contamination at the site and directed remediation. As owner Amtrak is responsible for ensuring remediation. East Barracks Yard Remediation - Commuter yard in Trenton, NJ is owned by Amtrak but has never been operated by Amtrak; rather New Jersey Transit operates the facility under an operating agreement for commuter operations. The State of New Jersey has been notified of PCB contamination at the site and directed remediation. As owner Amtrak is responsible for ensuring remediation. New Orleans DAF Upgrades - The existing wastewater treatment system (Dissolved Air Flotation) is nearly 30 years old and replacement parts can no longer be obtained. Therefore, the wastewater treatment system must be replaced. New Orleans Fueling Facility Upgrades - This project involves upgrading two areas at the facility with the potential for significant contamination. The areas are the fueling area and the used oil tank, including associated 500 feet of underground line. The fueling area currently has fiberglass pans for containment. These pans are worn and cracked and are often shifted out of place by employees and equipment, leading to leaks and spills onto the ballast. We will also design and construct a concrete secondary containment system with roofing for the fueling area. Prevention of Groundwater Contamination - Amtrak has a number of above and underground storage tanks used mostly for petroleum storage across the country of various sizes and ages. Several have deteriorated or are approaching the end of their useful lives and will need significant upgrade or replacement. This project is for removal and replacement of three deteriorating underground storage tanks. Sanford FL Storm Water System Upgrade - Several sections of the storm water system at Sanford, FL have collapsed and are currently allowing the inflow of groundwater. This creates a higher potential for contamination. This project covers the investigation, design and replacement of deteriorated storm water system at Sanford, FL Facility. Sanford FL Wastewater System Upgrade - The existing oil/water separator is unable to handle and properly treat wastewater being generated in the diesel shop, which has resulted in violations with the City of Sanford. Additionally, wastewater volume is anticipated to double under the SunRail contract. This project would include design and construction of an appropriate and properly sized wastewater treatment system for the facility. Penn Station Track Remediation - Mandatory multi-year project to properly disposing of soil contaminated with Polychlorinated Biphenyls (PCBs) soil during track work. Extensive PCB contamination exists at Penn Station and remediation has occurred annually since 2003. 152 Cedar Hill Remediation – Maintenance of Way facility in Connecticut has PCB soil contamination soil that must be remediated by direction of the Connecticut Department of Environmental Protection. Oakland Storm water Treatment System - This project covers design and installation of a storm water treatment system capable of preventing a significant diesel or oil release into a storm water discharge system. Tankers fill bulk engine oil aboveground storage tanks adjacent to several storm water inlets. As the Oakland Maintenance Facility is very close to the sensitive ecological, commercial, and recreational uses of the San Francisco Bay, we are recommending additional protections in the form of an in-line oil water separator to prevent spills from reaching the San Francisco Bay. Hialeah FL PAHS Remediation - During construction activities in Hialeah Yard, FL, soil contamination (polyaromatic hydrocarbons) was discovered by the contractor. Amtrak must continue remedial investigations as required by Miami-Dade Department of Regulatory and Economic Resources, delegated authority of the Florida Department of Environmental Protection. This fiscal year the Environmental group will complete the Soils Removal Report, and depending on the results, may be required to perform additional remedial activities. Future Remediation – The project serves as a place holder for remediation projects that are not yet identified at the individual site level. Amtrak may become aware of a liability due to visible signs of contamination, environmental audits performed, from property transfer due diligence, or Amtrak may receive notification from the Environmental Protection Agency (EPA) or state regulatory agency stating that Amtrak may be liable for environmental remediation costs (an “Administrative Order”). Future Pollution Prevention – This project serves as a place holder for pollution prevention projects (pollution control systems, tank upgrades, etc.) that are not yet identified at the individual site level. These can be replacements/upgrades of systems that have reached their useful life. Rolling Stock Acquisitions New Electric Locomotives The seventy new electric locomotives have been ordered from Siemens and Amtrak expects to begin taking delivery during the summer of 2013 with revenue service beginning in the first quarter of FY2014. All units are expected to be received by the end of 2016. The new locomotives will allow Amtrak to retire the existing electric locomotive fleet and standardize the fleet to include only the new Siemens units and the HSR power cars. This purchase is being funded by a Railroad Rehabilitation and Improvement Financing (RRIF) loan and will be repaid by Amtrak out of fare box receipts. The FY2014-FY2018 plan estimates $359 million of payments to Siemens, and loan repayments of $119 million. Long-Distance Single Level Equipment Completing the acquisition of 130 single level long-distance passenger cars pursuant to a contract entered into with CAF USA in August 2010. Amtrak anticipates the delivery of the first cars for testing during calendar year 2014 with the final unit entering revenue service by the end of calendar 2015. The total project cost will be $342.8 million. The payment for acquisition of these cars and related spare parts is being requested as part of the Federal capital appropriation request. 153 Switcher Locomotives Acquisition of up to eight low emission switcher locomotives. Amtrak has previously taken delivery of four such switch locomotives – two funded by a grant by the U.S. Environmental Protection Agency and two funded by grants from the Illinois Environmental Protection Agency and Illinois Department of Transportation. Early Buyouts of Leased Equipment In addition to the acquisitions of new equipment outlined above, Amtrak has options for early buyout and end-of-lease buyout of leases on existing rolling stock. From FY2011 through FY2013, special U.S. Treasury funding was made available under PRIIA section 205 that funded approximately $420 million of buyouts of leased Amtrak rolling stock. The program will end in FY2013. By exercising those buyout options, future debt service obligations were reduced by $582 million, saving the taxpayer about $162 million. In FY2014 - FY2018 Amtrak does not have access to this separate funding, but has $521.6 million of buyout options available, of which $330.3 million is for non-NEC equipment. Exercising all options would reduce future payment obligations, saving the taxpayers about another $150 million in debt service costs during the five year period. Funding to exercise these options will be requested in the five year period. Next-Generation High-Speed Rail Programs Delivering the next generation of high-speed rail service to the Northeast Corridor over the coming decades will involve construction of dedicated tracks and stations for the length of the corridor. Over the next five years, the focus will be on the commencement of two important cornerstones of the highspeed rail strategy: the Gateway Program, and acquisition of high-speed trainsets. The long-term commitment and investment necessary to complete these initiatives is outside of the scope of the annual appropriations process and the associated five year financial plan; rather, funding these initiatives will require separate and distinct financing from either governmental or private sources, or a combination of the two. For this reason no financial estimates are included with this document. Each year Amtrak publishes its updated fleet strategy. The current version was published March 29, 2012 and is available at www.amtrak.com. The March 2012 fleet plan proposed the purchase of 40 new Acela coaches to supplement capacity for the existing Acela trainsets, pending procurement of the next generation of high-speed trainsets. This plan has been discarded. Instead, Amtrak intends to expedite the procurement of new next generation high-speed trainsets. To advance this procurement, Amtrak recently issued a Request for Information (RFI), together with the California High Speed Rail Authority to gather information regarding available high-speed trainsets which could be used both on the Northeast Corridor and the future California High-Speed Rail system. Based on information gathered through this RFI, including information regarding financing and procurement approaches, Amtrak intends to issue a subsequent Request for Proposal (RFP) in September, 2013, for expedited delivery of new equipment for initiation of service in the 2016-2017 timeframe. Our FY2014 - FY2018 request to begin this procurement and associated improvements to support the new trainsets approaches $800 million. ADA Compliance Amtrak is updating train station platforms, elevators, and restrooms, and making other accessibility related improvements to make additional stations compliant with the requirements of the Americans with Disabilities Act (ADA). Amtrak serves over 500+ stations and has at least partial ADA responsibility for some component (i.e., station structure, platform or parking lot) of approximately 380 stations. Amtrak presented an estimate of its needs to the Congress on February 1, 2009, in its report “Intercity Rail Stations Served by Amtrak: A Report on Accessibility and Compliance with the Americans with Disabilities Act of 1990”. This report, which was delivered pursuant to section 219 of 154 the PRIIA, detailed the scope of Amtrak’s needs and proposed the level of Federal assistance necessary to attain full compliance. Subsequent updates to this report were issued in August 2011, May 2012, August 2012, December 2012, and October 2013. On September 19, 2011, the U.S. Department of Transportation (DOT) issued a final rule amending its ADA regulations regarding, among other things, level boarding, alternatives to level boarding, and procedures for obtaining approval of FRA and/or FTA in situations where level boarding is not provided. Amtrak operates a 21,100 mile system, and 20,000 of those miles of track belong to other companies, principally freight railroads. The platforms in these locations are owned primarily by the freight railroads but typically Amtrak has the responsibility to ensure that they are ADA accessible. The DOT has issued subsequent guidance on public ownership of the right of way and “existing freight operations” that expands on the level-boarding obligations and requires a detailed station by station and platform by platform evaluation to determine where level boarding is required. Also, at stations where multiple tracks are available to carry freight, a platform by platform and track by track analysis and subsequent negotiation with the host railroad must be conducted to determine the proper approach. Finally, FRA review and approval is required for platform designs where level-boarding is not provided. Amtrak’s Accessible Stations Development Program (ASDP) includes a complete master schedule for the stations for which Amtrak has some degree of responsibility for accessibility. In FY2012 and FY2013, the ASDP focused primarily on stations that have freight traffic directly adjacent to the platforms and, as a result, were not required to have level boarding. In FY2015 and over the next several years, Amtrak will focus on components of stations that increase passenger mobility and system accessibility. This work will address inaccessible components (other than platforms, assuming the platforms are currently usable by passengers with disabilities) such as: the path of travel to a station and/or platform or the path of travel between accessible elements, and other major station components including station entrances, restrooms, ticket counters, and station signage. This work will progress while we work to address the platform gap that is created when setback level boarding platforms are provided at stations that have shared freight traffic. Setback level boarding platforms must be set back from the centerline of the track at a greater distance to allow for the additional clearance requirements that freight railroads require, thereby creating a larger gap between our passenger trains and the setback level boarding platforms. The resulting gap requires a level boarding solution that can be deployed each time a passenger train boards or detrains at the setback level boarding platforms. 155
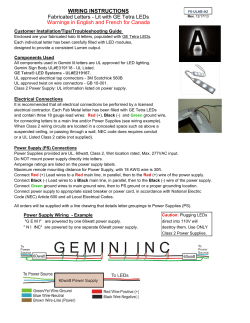

© Copyright 2026