
PUBLIC TRANSPORT PLAN August 2005 eThekwini Transport Authority
PUBLIC TRANSPORT PLAN
August 2005
eThekwini Transport Authority
ETHEKWINI TRANSPORT
AUTHORITY
PUBLIC TRANSPORT
PLAN
August 2005
Delca Systems
Development • Engineering • Logistics • Consulting Africa
CONTENTS
1
INTRODUCTION........................................................................................................................ 1.1
2
PUBLIC TRANSPORT VISION AND GOALS ........................................................................... 2.1
2.1
NATIONAL AND PROVINCIAL DOT TRANSPORT VISIONS ............................................................ 2.1
2.2
ETHEKWINI IDP VISION & CITY DEVELOPMENT STRATEGY ........................................................ 2.3
2.2.1
IDP Vision .................................................................................................................... 2.3
2.2.2
South African Cities Network City Development Strategy ............................................ 2.4
2.3
THE ETA’S TRANSPORT MISSION STATEMENT ......................................................................... 2.7
2.4
THE ETA’S PUBLIC TRANSPORT GOALS .................................................................................. 2.8
3
BROAD PUBLIC TRANSPORT POLICY .................................................................................. 3.1
3.1
3.2
3.3
3.4
3.5
4
PROPOSED POLICY FOR EFFECTIVE PUBLIC TRANSPORT .......................................................... 3.3
PROPOSED POLICY FOR EFFICIENT PUBLIC TRANSPORT ........................................................... 3.6
PROPOSED POLICY FOR SUSTAINABLE PUBLIC TRANSPORT .................................................... 3.11
PROPOSED POLICY FOR SAFETY & SECURITY IN PUBLIC TRANSPORT ...................................... 3.15
BLACK EMPOWERMENT IN PUBLIC TRANSPORT ...................................................................... 3.16
CURRENT PUBLIC TRANSPORT RECORD (CPTR) ............................................................... 4.1
4.1
EXTENT OF SURVEY .............................................................................................................. 4.1
4.2
CONTENT OF SURVEY ............................................................................................................ 4.4
4.3
PUBLIC TRANSPORT SYSTEM - KEY SURVEY RESULTS ............................................................. 4.5
4.3.1
Rail System Component .............................................................................................. 4.5
4.3.2
Bus System Component .............................................................................................. 4.5
4.3.3
Minibus Taxi System Component................................................................................. 4.6
4.3.4
Busiest Public Transport Activity Node......................................................................... 4.6
5
METERED TAXI ........................................................................................................................ 5.1
5.1
5.2
5.3
5.4
5.5
6
INTRODUCTION ...................................................................................................................... 5.1
SIZE OF ETHEKWINI METERED TAXI INDUSTRY ......................................................................... 5.1
METERED TAXI ROUTES AND OPERATIONS .............................................................................. 5.2
RANKS IN ETHEKWINI ............................................................................................................. 5.3
POLICIES AND STRATEGIES .................................................................................................... 5.3
LONG TERM TRENDS .............................................................................................................. 6.1
6.1
INTRODUCTION ...................................................................................................................... 6.1
6.2
GROWTH AND TRAVEL PROJECTIONS ...................................................................................... 6.1
6.2.1
Population and Employment ........................................................................................ 6.1
6.2.2
Travel Projections and Modal Split ............................................................................... 6.2
6.3
IMPACT OF THE TREND LAND USE ON THE TRAVEL PATTERN..................................................... 6.3
6.4
IDP RESPONSE TO DEVELOPMENT TREND .............................................................................. 6.6
7
TRANSPORT DEMAND MANAGEMENT ................................................................................. 7.1
7.1
BACKGROUND ....................................................................................................................... 7.1
7.2
GROWTH TRENDS AND TARGET MODAL SPLIT ......................................................................... 7.1
7.2.1
Growth Trend ............................................................................................................... 7.1
7.2.2
Implications of ‘Do Nothing’.......................................................................................... 7.1
7.2.3
Target Modal Split ........................................................................................................ 7.2
7.3
MODAL SPLIT MONITORING .................................................................................................... 7.4
7.4
TDM MEASURES ................................................................................................................... 7.5
7.4.1
Private Transport Measures ......................................................................................... 7.6
7.4.2
Public Transport Measures .......................................................................................... 7.6
7.4.3
Land Use Development and Management Measures .................................................. 7.7
7.4.4
Policy and Institutional Measures ................................................................................. 7.7
7.5
ETHEKWINI’S TRANSPORT MANAGEMENT STRATEGY .............................................................. 7.12
7.6
CONGESTION MONITORING .................................................................................................. 7.14
eThekwini’s Public Transport Plan
i
Contents
8
THE ETA’S PUBLIC TRANSPORT STRATEGY....................................................................... 8.1
8.1
BACKGROUND ....................................................................................................................... 8.1
8.2
THE EXISTING PUBLIC TRANSPORT SYSTEM ............................................................................ 8.1
8.2.1
System Description ...................................................................................................... 8.1
8.2.2
Rail System, Service Characteristics and Issues ......................................................... 8.5
8.2.3
Bus System, Service Characteristics and Issues ......................................................... 8.5
8.2.4
Taxi System and Service Characteristics and Issues ................................................... 8.6
8.2.5
Combined System Issues............................................................................................. 8.7
8.3
PUBLIC TRANSPORT SYSTEM PROPOSALS ............................................................................... 8.7
8.3.1
Introduction .................................................................................................................. 8.7
8.3.2
Alternative Public Transport Systems Tested............................................................... 8.8
8.3.3
The Proposed System.................................................................................................. 8.9
8.4
MODAL STRATEGIES ............................................................................................................ 8.11
8.4.1
Introduction ................................................................................................................ 8.11
8.4.2
Rail Modal Strategy.................................................................................................... 8.11
8.4.3
Bus Modal Strategy.................................................................................................... 8.14
8.4.4
Minibus Taxi Modal Strategy ...................................................................................... 8.14
8.5
PUBLIC TRANSPORT SYSTEM AND SUPPORTING LAND USE STRATEGIES.................................. 8.15
8.5.1
Introduction ................................................................................................................ 8.15
8.5.2
Public Transport Nodes and Corridors ....................................................................... 8.15
8.5.3
Spatial Strategies in Support of the Priority Public Transport Network ....................... 8.17
9
OPERATING LICENCE STRATEGY (OLS) .............................................................................. 9.1
9.1
PURPOSE OF THE OLS .......................................................................................................... 9.1
9.2
GENERAL PRINCIPLES............................................................................................................ 9.1
9.2.1
Licence Allocation Principle.......................................................................................... 9.1
9.2.2
Licence Validity Period................................................................................................. 9.2
9.2.3
Transfer of Licence ...................................................................................................... 9.3
9.2.4
Number of Taxi Routes per Licence ............................................................................. 9.3
9.2.5
Preparation of Recommendations ................................................................................ 9.4
9.3
CONDITIONS FOR GRANTING OF LICENCES .............................................................................. 9.4
9.3.1
Person Qualifying for Operating Licence...................................................................... 9.4
9.3.2
Membership per Route................................................................................................. 9.5
9.3.3
Vehicle Standards and Equipment ............................................................................... 9.5
9.3.4
Access to Ranking ....................................................................................................... 9.6
9.3.5
Access to Holding for Minibus Taxi Operators.............................................................. 9.6
9.3.6
Service Levels for Minibus Taxi.................................................................................... 9.6
9.3.7
Timetable and Fare Data ............................................................................................. 9.7
9.4
LICENCE APPLICATION AND APPROVAL PROCESS..................................................................... 9.7
9.4.1
The Process................................................................................................................. 9.7
9.4.2
The ETA's Administrative Structure.............................................................................. 9.8
9.5
PUBLIC TRANSPORT ENFORCEMENT STRATEGY ....................................................................... 9.8
9.6
OPERATING LICENCE STRATEGY ANALYSIS - PARAMETERS AND CRITERIA ................................. 9.9
9.7
CATEGORIES OF EVALUATION ............................................................................................... 9.11
9.8
ANALYSIS ........................................................................................................................... 9.12
9.8.1
Corridor Analysis........................................................................................................ 9.12
9.9
INDIVIDUAL ROUTES EVALUATION ......................................................................................... 9.18
9.10
TAXI ASSOCIATION EVALUATION ........................................................................................ 9.21
9.11
SUBSIDISED BUS CONTRACTS........................................................................................... 9.23
9.12
RAIL SERVICES ................................................................................................................ 9.24
10
10.1
10.2
10.3
10.4
10.5
10.6
10.7
10.8
IMPLEMENTATION STRATEGY ......................................................................................... 10.1
INTRODUCTION ................................................................................................................ 10.1
UNFOLDING OF THE PUBLIC TRANSPORT STRATEGY ........................................................... 10.1
RAIL STRATEGY ............................................................................................................... 10.2
BUS STRATEGY ............................................................................................................... 10.3
MINIBUS TAXI STRATEGY .................................................................................................. 10.4
NON-MOTORISED TRANSPORT (NMT) STRATEGY ............................................................... 10.5
SPECIAL NEEDS PUBLIC TRANSPORT STRATEGY ................................................................ 10.6
INTERMODALISM STRATEGY .............................................................................................. 10.7
eThekwini’s Public Transport Plan
ii
Contents
10.9
TDM STRATEGY .............................................................................................................. 10.8
10.10 BUS SUBSIDY STRATEGY .................................................................................................. 10.8
10.11 LAND USE RESTRUCTURING STRATEGY ............................................................................. 10.8
10.12 CUSTOMER FOCUS STRATEGY .......................................................................................... 10.9
10.13 TOURISM STRATEGY ...................................................................................................... 10.10
10.14 THE PEOPLE MOVER PROJECT ....................................................................................... 10.10
10.14.1
Objective of People Mover System....................................................................... 10.10
10.14.2
Phased Implementation ........................................................................................ 10.10
10.14.3
Implementation Programme ................................................................................. 10.11
11
RURAL TRANSPORT STRATEGY...................................................................................... 11.1
INTRODUCTION ................................................................................................................ 11.1
IDENTIFICATION OF KEY ISSUES ........................................................................................ 11.1
DEVELOPMENT OF A RURAL TRANSPORT STRATEGY ........................................................... 11.2
11.1
11.2
11.3
12
MONITORING AND KEY PERFORMANCE INDICATORS.................................................. 12.1
12.1
KEY PERFORMANCE INDICATORS (KPI'S)........................................................................... 12.1
TABLES
Table 4.1:
Table 4.2:
Table 6.1:
Table 6.2:
Table 6.3
Table 6.4
Table 7.1
Table 7.2
Table 7.3
Table 7.4
Table 7.5:
Table 7.6:
Table 7.7
Table 9.1:
Table 9.2:
Table 9.3:
Table 9.4
Table 9.5
Table 9.6
Table 9.7
Table 12.1
Bus/Taxi Terminal Points ............................................................................................. 4.1
Bus and Taxi Route Summary ..................................................................................... 4.2
Population and Employment (1000’s) (Years 2001 and 2020) ..................................... 6.1
Trend Trip Growth and Modal Split (AM Peak Hour - Years 2005 and 2010) ............... 6.2
Change in Average Public Transport Trip Length AM Peak Hour (1996 to 2020)......... 6.5
Public Transport Trips along the North-South Coastal Corridor: .......................................
AM Peak Hour (1996 to 2020)...................................................................................... 6.6
Trend versus Target Modal Split AM Peak Hour Years 2005 and 2020 ....................... 7.3
AM Peak Period Modal Split - Year 2004 - 5 Kilometre Cordon (Inbound & Outbound)7.5
AM Peak Period Person Trips/Modal Split Comparison 1999 vs 2004 .............................
5 Kilometre Cordon Inbound ........................................................................................ 7.5
Private Transport Measures ......................................................................................... 7.8
Public Transport Measures .......................................................................................... 7.9
Land Use Development Management Measures ....................................................... 7.10
Policy and Institutional Measures ............................................................................... 7.11
Bus and Taxi Utilisation of Surveyed Routes (Peak Hour) ......................................... 9.12
AM Peak Hour Bus and Taxi Passengers (Volumes > 1000, to nearest hundred) ..... 9.13
Area to Area Corridor Service Analysis ...................................................................... 9.14
Standard Route Comments and Recommendations .................................................. 9.18
Contracted Bus Operations (AM Peak Hour).............................................................. 9.23
Bus Routes by Operator with Particular Recommendations....................................... 9.24
Peak Hour Rail System Utilisation.............................................................................. 9.25
Monitoring of the ETA’s Public Transport Plan Key Performance Indicators (KPI’s)... 12.1
FIGURES
Figure 4.1: eThekwini CPTR - Survey Areas ..................................................................................... 4.3
Figure 6.1: Car Ownership Levels per 1000 Population .................................................................... 6.2
Figure 6.2: Employment Projections.................................................................................................. 6.4
Figure 7.1: Person Trips by Public Transport (1000’s)....................................................................... 7.3
Figure 7.2: Private Cars on Road System (1000’s)............................................................................ 7.4
Figure 8.1: Existing Public Transport Nodes and Services ................................................................ 8.2
Figure 8.2: Proposed Public Transport System Strategy ................................................................... 8.4
Figure 8.3: Feeder Distributor Service Areas in
Support of North-South Rail Corridor............. 8.13
Figure 8.4: N-S Corridor & Significant Public Transport Route ........................................................ 8.16
Figure 9.1: ETA Licence Application Adjudication Structure .............................................................. 9.8
Figure 9.2: Area to Area Corridor Services Analysis........................................................................ 9.15
Figure 9.3: Area to Area Corridor Service Analysis ......................................................................... 9.16
eThekwini’s Public Transport Plan
iii
Contents
Figure 9.4: Area to Area Corridor Service Analysis ......................................................................... 9.17
Figure 9.5: Route Recommendation Sheet...................................................................................... 9.20
Figure 10.1: Roll-Out Strategy for the .............................................................................................. 10.1
ANNEXURES
A
B
C
SERVICE AND TRIP CHARACTERISTICS
ENFORCEMENT SERVICE AGREEMENT
SERVICE LEVEL AGREEMENT FOR
PUBLIC TRANSPORT LAW ENFORCEMENT
eThekwini’s Public Transport Plan
iv
A.1-A.6
B.1-B.4
C.1-C.7
Contents
1
TINTRODUCTION
The Public Transport Plan (PTP) forms a component part of the Integrated
Transport Plan (ITP). It includes a long term strategic plan which provides
the context for short term planning. Projects from the short term planning
components of the PTP are carried forward into the ITP as a part of the
2005-2010 programme.
This document, being the first Public Transport Plan for eThekwini in terms
of National Transport legislation sets out the proposed mission statement,
goals and broad public transport policy. It also describes the current and
future public transport systems.
---------------------------------The Current Public Transport Record (CPTR) as described in this report is
based on public transport service data collected from August 2003 to
August 2004.
---------------------------------The Operating Licence Strategy (OLS) which also forms a part of the PTP
gives direction to the decisions of the Operating Licence Board (OLB) in
respect of issuing of, or changes to public transport licences required in
terms of the public transport planning.
---------------------------------The Rationalisation of subsidised bus services (RAT) Plan has not been
developed as a separate plan, but the general principals incorporated into
the OLS.
CPTR
OLS
Vision &
Policy
When each subsidised contract needs to be re-tendered, a detailed
rationalisation plan needs to be undertaken with current information.
The policy contained within the PTP and the proposed public transport
system give clear direction to the formulation of the implementation strategy
documented in this report.
Leopold
St
Marke
t
Eil
V
at
uc
iad
t
reet
Road
Warwick
Old
Du
t
ch
Avenue
Ro
ad
Public Transport
Terminal Activity in
Warwick Avenue Area
eThekwini’s Public Transport Plan
The public transport plan including
the operating licence strategy is a
living document constantly under
review and responsive to the
impact of planning decisions in
achieving the City’s vision for
transport.
1.1
A ‘living’
document
Introduction
As the first version of the PTP, this document provided the basis for an
extensive consultation process within the context of the ITP. This has
enabled the newly established transport authority to review, confirm, revise
and consolidate a programme of plans and actions which give effect to an
agreed way forward for public transport in the eThekwini area.
eThekwini’s Public Transport Plan
1.2
Consultation
Introduction
2
PUBLIC TRANSPORT VISION AND GOALS
ision creates the framework for the definition of goals and the
V
development of policy. This section defines the eThekwini Transport
Authority’s vision and the goals that are attached to this vision. The vision
for public transport is framed within the vision for transport overall. It has
been developed within the context of the national and provincial visions for
transport.
---------------------------------Public transport has a major influence on development. At the same time it
is impacted by development and land use. Consequently, the ETA’s vision
for public transport recognises the imperatives of the IDP vision and sets a
framework for goals and related policy which will have a positive impact on
development and activities in the metropolitan area.
2.1
IDP Vision
National and Provincial DOT Transport Visions
The national visions are as follows:
NDOT vision
NDOT Vision for Transport:
“Provide safe, reliable, effective, efficient, and fully
integrated transport operations and infrastructure which
will best meet the needs of freight and passenger
customers at improving levels of service and cost in a
fashion which supports government strategies for
economic and social development whilst being
environmentally and economically sustainable:
NDOT Vision for Public Transport:
“Promote a safe, reliable, effective, efficient, co-ordinated,
integrated and environmentally friendly land passenger
transport system in South Africa urban and rural areas,
and the southern African Region, managed in an
accountable manner to ensure that people experience
improving levels of mobility and accessibility”
eThekwini’s Public Transport Plan
2.1
Public Transport Vision and Goals
The KwaZulu-Natal vision is strongly aligned with the National vision, with
added emphasis on improved quality of life for public transport users, along
with sustainability and support for economic and social upliftment.
The Provincial vision reads as follows:-
“To improve the quality of life of public transport users and
to enhance the viability of all sectors reliant on public
transport within KwaZulu-Natal, through the development
of a safe, efficient, effective, economically and
environmentally sustainable public transport system which
drives the economic and social upliftment of the Province”
Key issues and concerns for public transport that emerge from these
statements are:
¾
¾
¾
¾
¾
¾
¾
¾
¾
¾
KZNDOT Public
Transport Vision
Key issues
for PT
safety
reliability
effectiveness
efficiency
affordability
integration
improved levels of accessibility and mobility
quality of life
support for economic and social upliftment
economic and environmental sustainability
Collectively, these perspectives on transport give direction to local
authority vision, goals and policy for transport and within that context,
public transport.
Further direction is provided by the eThekwini IDP vision as set out in the
next section.
eThekwini’s Public Transport Plan
2.2
Public Transport Vision and Goals
2.2
eThekwini IDP Vision & City Development Strategy
2.2.1
IDP Vision
The following is eThekwini's IDP vision statement:-
IDP Vision for eThekwini:
By 2020, eThekwini Municipality will enjoy the reputation
of being Africa’s most caring and liveable city, where all
citizens live in harmony. This Vision will be achieved by
growing its economy and meeting peoples needs so that
all citizens enjoy a high quality of life with equal
opportunities, in a city that they are truly proud of.
The ways in which public transport can contribute to a high quality of life
in terms of the broad objectives of the IDP vision are:1. Meet people’s needs through:IDP Vision
¾ improved access to opportunity
¾ safe, affordable, efficient and effective public transport
¾ reliable, convenient public transport ensuring employees
can arrive on time without undue discomfort from adverse
weather
2. Grow the economy through:¾ dependable public transport supporting a stable workforce for
industry
¾ opportunities for growth within the public transport industry
3. Build people skills and technology by:¾ providing assistance and creating opportunities for SMME’s
to participate in various aspects of the public transport
industry
¾ applying effective technology for security, good
communications to passengers, operating safety and
efficiency
¾ by ensuring services and infrastructure are environmentally
acceptable
eThekwini’s Public Transport Plan
2.3
Public Transport Vision and Goals
2.2.2
South African Cities Network City Development Strategy
South African Cities Network (SACN) has developed and adopted a City
Development Strategy with four primary programmes as shown in the
following diagram.
Productive
City
City
Development
Strategy
Inclusive
City
Sustainable
City
Well-governed
City
This framework provides a context for the development of transportation
policy and system strategy which lends support to the eThekwini IDP vision
set out above.
The following description relates transportation to each of these four
programmes highlighting the major role transport can play in the
development of a dynamic, well-balanced city.
Transportation and the Productive City
It is almost universally accepted that transport has played a predominant
role in the economic development of all modern civilisations. Production
and consumption on the scale and tempo of today would be inconceivable
without a well developed and operated transport system forming a vital link
in supply chain management logistics. The provision of safe, effective,
efficient and affordable transport is the cornerstone of sustainable
economic and social development. Conversely, it has been observed that
an underdeveloped or poorly maintained transport system acts as a serious
constraint on economic growth.
¾ Efficient transport is an essential component in the production
and distribution process.
Increased transport efficiency
contributes directly towards lower production costs which
encourages more consumption and production.
eThekwini’s Public Transport Plan
2.4
Public Transport Vision and Goals
¾ It facilitates domestic competition and makes exports more
attractive in the world of competitive globalisation.
¾ An effective transport system can therefore increase the
commercial and labour market efficiency of a city, and help
provide an attractive platform for investors, and thereby grow the
economy and create jobs.
¾ Productivity of the workforce, which is an area of possible
competitive advantage, is negatively impacted on by unduly long
travel times due to poor transport planning and infrastructure.
¾ Mobility is critical for people to access jobs.
Transportation and the Inclusive City
Accessibility is a basic, daily need for almost all the residents of a city. A
transportation system provides access to business, social and recreational
opportunities, which is fundamental to experiencing a good quality of life.
This is especially important for the poor and the fight against poverty.
¾ An efficient public transport system allows the poor to access job
opportunities, perhaps the single most effective way of dealing
with poverty reduction.
¾ Transport imposes a daily cost on the poor. It has been
estimated that in developing Africa, the poor can spend up to
30% of their income on transport alone. This results in less
money for essential items such as food, clothing, education and
medical treatment.
¾ Due to high transport costs, the poor only travel out of necessity,
resulting in social seclusion. This is particularly damaging, as
social relations are often a safety net for the very poor in many
societies.
Accessibility for the physically challenged needs to also be addressed
holistically.
Road safety in urban areas is of major concern. South African cities have a
very poor accident record, with a high proportion of accidents involving
pedestrians and children. Obviously, this has direct and major impact on
quality of life.
eThekwini’s Public Transport Plan
2.5
Public Transport Vision and Goals
Transportation and the Sustainable City
Transport can be a large consumer of economic resources, typically in the
form of high transport subsidies and massive investment in infrastructure.
The transport sector therefore has a responsibility to maximise the use of
existing infrastructure and where possible to reduce subsidies in the
process of providing a sufficient transport system.
Also, spatially efficient land-use patterns, that support public transport and
minimise congestion are critical to long-term sustainability.
Transportation also has a significant impact on the environment, which has
implications for the quality of life experienced by residents of a city.
¾ Atmospheric pollution: The
transport sector is a major
user of non-renewable fossil
fuels and the highest source
of greenhouse gas emissions.
Other emissions include lead,
carbon monoxide and other
oxides,
which
are
all
detrimental to health and
therefore quality of life.
¾ Noise: Traffic generated noise pollution, although not at levels to
be considered a hazard, does considerably reduce quality of life.
¾ Severance: Heavily trafficked roads in particular are dangerous
and difficult to cross, causing community severance.
¾ Excessive land take for new roads due to poor public transport
resulting in low utilisation and traffic congestion.
Taking these problems into consideration, there is a strong case to be
made for developing and sustaining an efficient public transport system. In
doing so there is also a strong case to be made for promoting public
transport over private transport in developing transport system solutions.
eThekwini’s Public Transport Plan
2.6
Public Transport Vision and Goals
Transportation and the Well-governed City
Local government faces huge developmental challenges, placing great
demand on urban governance and management. Good governance
demands inclusion and representation from all groups in society, and
requires accountability, transparency and integrity in defining and pursuing
goals.
Two issues are critical from a transport point of view:¾ First, the provision of basic access to allow all sectors of society,
especially the poor and marginalised, to participate in the
democratic processes. An effective, affordable Public Transport
system is of particular importance;
¾ Secondly, the transport sector needs capacity to fulfill its public
responsibilities in terms of knowledge, skills and resources.
2.3
The ETA’s Transport Mission Statement
Within this context of the national vision for transport and eThekwini’s IDP
vision the following is the ETA’s mission statement for transport. Prior to
establishment of the eThekwini Transport Authority, Council was only
responsible for fixed transport infrastructure. With the establishment of the
ETA this responsibility now extends to the provision, management and
control of all of the following:¾ Transport infrastructure
¾ Public transport services
¾ Modes and fleet
The following mission statement recognises and responds to this wider role
and responsibility for transport.
ETA’s Transport Mission Statement:
“To provide and manage a world-class transport system
with a public transport focus, providing high levels of
mobility and accessibility for the movement of people and
goods in a safe, sustainable and affordable manner”.
eThekwini’s Public Transport Plan
2.7
ETA’s
Transport
Mission
Statement
Public Transport Vision and Goals
2.4
The ETA’s Public Transport Goals
The extension of ETA’s vision into goals for public transport has identified
five basic goals which directly support the main thrust of eThekwini’s IDP.
They are the following:
Goal 1: Effective Public Transport
Goal 2: Efficient Public Transport
Basic Goals
for PT
Goal 3: Sustainable Public Transport
Goal 4: Safe and Secure Public Transport
Goal 5: Black Empowerment
These are unpacked in the following section to create a framework for
the ETA’s public transport policy.
eThekwini’s Public Transport Plan
2.8
Public Transport Vision and Goals
3
BROAD PUBLIC TRANSPORT POLICY
he five planning goals for public transport are a framework for identifying
T
the basic characteristics of the future public transport system for the
eThekwini metropolitan area. As set out below these characteristics
expand the definition of each goal thereby giving direction to the formulation
of the ETA’s public transport policy.
The measurement of the attainment of goals is achieved through the
monitoring of key performance indicators (KPI's). The particular KPI's that
relate to each goal are shown below and described in Section 12 of this
report.
Goal 1: Effective Public Transport
¾
¾
¾
¾
¾
¾
¾
Needs driven
Inclusive of Special Needs groups
Promotes PT over private transport
Subscribes to a quality service charter
Increases mobility and accessibility
Targets use of subsidy
Recognises needs of the poor
Effective PT
Affordable to
Users
Relevant KPI's:
♦ Passenger satisfaction with public transport service
♦ Promotion of use of public transport
♦ Promotion of accessible and affordable public transport
Goal 2: Efficient Public Transport
¾
¾
¾
¾
¾
Regulates all modes and reduces duplicated services
Optimises role/positioning of modes
Improves system cost efficiency
System integration (fares & services)
Land use integration
Efficient PT
Relevant KPI's:
♦ Effective regulation and control of public transport vehicles
♦ Road-based public transport service regulation and legislation
♦ Efficient rail service
♦ Efficient bus operation
♦ Taxi Re-capitalisation progress
♦ City compactness
eThekwini’s Public Transport Plan
3.1
Broad Public Transport Policy
Goal 3: Sustainable Public Transport
¾
¾
¾
¾
¾
Financially
Environmentally
Technologically
Adequate skills & resources
Adequate maintenance
Sustainable PT
Relevant KPI's:
♦ Good delivery of public transport projects
♦ Land-use restructuring
♦ Effective regulation and control of public transport vehicles
♦ Road-based public transport service regulation and legislation
Goal 4: Safe & Secure Public Transport
¾ Personal security at P.T. ranks, rail stations and in-vehicle
¾ Safety from accidents at P.T. ranks, rail stations and in-vehicle
Safe & Secure
PT
Relevant KPI's:
♦ Improved public transport security
♦ Improved public transport safety
Goal 5: Black Empowerment
Black
Empowerment
in PT
¾ Participation in contracts
¾ Investment opportunities
¾ Training and support
Relevant KPI's:
♦ Extent of ownership & participation in public transport and
related activities
♦ Procurement of PDI services
eThekwini’s Public Transport Plan
3.2
Broad Public Transport Policy
National legislation has assigned a wide range of new responsibilities for
public transport to local level government. A part of this responsibility
involves the preparation of a comprehensive policy framework reflecting the
over-arching policy of national government. This is a complex process
which requires policy to be developed over a period of years.
Evolution of
Policy
During this period the inter-active impact of public transport policy on other
sectors of service provision and development within the metropolitan areas
will become more apparent. At the same time, various related projects and
investigations will be carried out providing additional information which
impacts on policy.
This document, the first Public Transport Plan for eThekwini, provides the
public transport policy framework which will be further developed and
refined over years to come.
In some instances projects have already been identified which can give
support to refining or implementing a particular policy. In such cases a
description of the project follows the policy statement.
3.1
Proposed Policy for Effective Public Transport
To be effective public transport should be promoted over private transport.
It should be customer-focused and needs-driven. Recognising the
differences between the needs of urban and rural areas, different standards
of service should be used to provide appropriate, affordable levels of
access to opportunity for different segments of the community.
Within this context, the ETA’s public transport policy is the following:No.1
To identify and prioritise accessibility and mobility needs in
terms of market segments based on categories defined in
NDOT’s Moving South Africa (MSA) Report. These are:¾ the ‘strider’
those who walk or cycle
¾ the ‘stranded’
those without access to affordable
public transport
¾ the ‘survival’
public transport
passengers
those who are ‘captive’ to the least
expensive transport option
eThekwini’s Public Transport Plan
3.3
Accessibility &
mobility needs
Broad Public Transport Policy
¾ the ‘sensitive’
commuters
who can afford the best forms of
public transport but are dissatisfied
with available service
¾ the ‘selective’
commuters
can afford a car but will use public
transport if service meets their
needs and expectations
¾ the ‘stubborn
commuters
who will choose private transport
over public transport irregardless of
options available
Further in keeping with international best practice in promoting the
upliftment of the urban poor by increasing their accessibility to economic
and social opportunity, through improved public transport, the ETA’s policy
is:No. 2
To promote public transport over private transport.
---------------------------------No.3
To provide an affordable, sustainable PT system in response
to the prioritised needs of the market segments,
acknowledging the importance of accessibility to social,
economic, educational and recreational opportunities, but
recognising it is unaffordable to provide the same level of
service to users in urban and rural areas.
In the rural areas access to employment, the transport needs
of learners, and access to health facilities are priorities.
---------------------------------For public transport to be needs-driven and customer-focused it must
effectively place the commuter at the centre of public transport policy.
Affordable
standards
Rural
accessibility
Communtercentered Policy
Currently, there exists an eThekwini Transport Forum that is representative
of the various communities in all wards and as such can be used as the
vehicle for developing an understanding of passenger needs. In the longer
term the representative voice of the community in matters of public
transport could be further strengthened by rationalising and integrating the
activities of various groups who provide input on such matters.
In this regard the ETA’s policy is:No.4
To support and develop the capacity of the existing and
future consultation structures to enable them to articulate the
needs of the different passenger groups for incorporation
into a Passenger Service Charter.
eThekwini’s Public Transport Plan
3.4
Passenger
Service
Charter
Broad Public Transport Policy
Related Project:
The Passenger Service Charter (PSC) is needed in the short
term to provide input to the formulation of the Quality Service
Charter (See No.7). To achieve this a project will be initiated
to empower and equip the Forum and facilitate the process
of developing the PSC.
---------------------------------Effective public transport must recognise and provide for all categories of
Special Needs passenger groups. These groups include the physically
disabled, the deaf, the unsighted, children, the elderly, pregnant women,
the illiterate and foreign tourists. Their unique needs are quite different and
it would be unrealistic to expect all services throughout the system to cater
for these widely different needs. Within this context therefore and in line
with national policy, the ETA’s policy is the following:No.5
To implement accessible public transport for Special Needs
passengers through a combination of specialised services
(eg. dial-a-ride) and universally accessible mainstream
services where appropriate, subject to resource constraints.
Special Needs
Groups &
Universally
accessible
corridors
To give effect to this the ETA will give input to the SARCC to assist in
developing a programme for fleet upgrading as well as upgrading of rail
stations and fleet to full accessibility standards within these corridors.
Rail Stations
No.6
To ensure that where appropriate new bus contracts have a
minimum percent of fleet designed for special needs access,
and all new fixed infrastructure is fully accessible.
Special Needs
Fleet
For public transport to be both effective and efficient it is essential for all
modes of the system to be regulated within the structure of a Public
Transport Plan. Various policies and programmes are needed before full
regulation can be achieved including, inter alia, the basis for compensation
for removal of operator licences, the devolution or control over the rail
function, and control over the roll-out of the Taxi Re-cap programme in the
metro area. In the absence of these conditions being met in present
circumstances however, there is an opportunity and need to establish
standards for the operation of public transport services in the form of a
Quality Service Charter (QSC).
eThekwini’s Public Transport Plan
3.5
Broad Public Transport Policy
Effective public transport must operate to acceptable standards in every
aspect of its performance. Such standards defined by the ETA with input
from the Community in terms of the passenger service charter (refer No. 3
above) must be subscribed to and enforceable on the operators providing
the public transport services.
In this regard it is the ETA’s policy:No.7
To manage all modes of public transport service, within a
Quality Service Charter which addresses, inter alia, matters
of reliability, differentiated levels of service (coverage, hours
of service, frequency) convenience and comfort, standards
of operation, fare structures, communication and information
services, vehicle age and servicing requirements and code
of conduct for operator/driver behaviour.
---------------------------------No.8
To support formalisation and re-capitalisation of the taxi
industry and to apply various fleet age criteria to all future
contracts (subsidised and unsubsidised) for all modes of
road-based public transport vehicles.
Quality Service
Charter
Taxi Re-cap and
age criteria
Related Projects:In support of Policy No. 8, a project will be initiated to
develop a comprehensive Quality Service Charter which will
address the above
3.2
Proposed Policy for Efficient Public Transport
Efficiency in public transport has many dimensions. It encompasses
amongst others:
¾ system and service efficiency which impacts on reliability
and quality of service to the users
¾ cost efficiency which is necessary for sustainability
¾ mode efficiency which requires the appropriate use of each
mode and combinations of modes. This may require some
form of regulation and integration of services provided by
the various modes in the system.
¾ Efficient inter-action of the transport/land use system which
requires the two components to be complementary and
mutually supportive.
eThekwini’s Public Transport Plan
3.6
Broad Public Transport Policy
Further to the above, some form of regulation of the modes in the system is
required for efficient public transport. In regard to regulation, the policy of
the ETA is:-
Regulation
No.9
To regulate all public transport services on a phased basis.
---------------------------------No.10
To support the devolution of transport functions for all modes
of public transport to the Transport Authority, including rail
and bus contracts on a phased basis.
Devolution
No.11
To influence the roll-out of the Taxi Re-cap Programme in
eThekwini Municipality once the programme has been
finalised by NDOT.
Re-cap
roll-out
Rationalisation and integration of eThekwini’s public transport system
requires service changes which will necessitate termination of some
services, re-positioning of others and in some instances introduction of new
services.
Required changes may in part be effected through natural attrition.
Where existing operators are affected, they may be accommodated in
different ways including:¾ Re-positioning in the system using the same mode
¾ Re-positioning in the system using a different mode
The issue of compensation still needs to be resolved at a national and
provincial level.
Where new licences are being issued there is a need to ensure existing
operators in over-traded areas are given preferential consideration. In this
regard ETA policy is the following:No. 12
Preferential consideration will be given to existing operators
in over-traded areas or operators adversely impacted by
planned service alterations, when allocating new licences for
new services introduced either through service changes
resulting from restructuring or service requirements for a new
development.
eThekwini’s Public Transport Plan
3.7
Broad Public Transport Policy
Duplication of services, particularly subsidised services, leads to
inefficiencies and unnecessary subsidy expenditure. The following is the
ETA’s policy in this regard:-
Service
Duplication
No.13
To remove duplicate, subsidised services in direct
competition. No new license applications will be approved
where duplication exists except for the selected, preferred
mode mix.
---------------------------------No.14
To allow for duplication where differentiated services are
being offered.
Competition
As regards defining the role of each mode in the public transport system,
the ETA’s policy is:-
Role of
modes
No.15
To position the modes within an integrated system on the
basis of functionality and on the basis of the most costeffective mode for corridor capacity requirements, using the
following indicative guidelines:¾ rail:
greater than 20 000 one
way passengers per day
¾ bus:
500-30 000 one way
passengers per day (35
seater and standard buses)
¾ taxi:
should not be used for
major corridors or long
distance line-haul routes but rather for short
distance routes and/or feeder type services
No.16
To facilitate public transport operator empowerment
enabling operators to reposition in the industry and
participate in tendered contracts.
---------------------------------In terms of economic efficiency, the public transport system must operate
with economic load factors, providing a sustainable system with an
acceptable level of service for different periods of the day and days of the
week.
eThekwini’s Public Transport Plan
3.8
Empowerment
Sustainable
system
Broad Public Transport Policy
In this regard the ETA’s policy is:No.17
To reduce system costs and subsidy while providing an
acceptable level of service to all sectors of the community.
No.18
To recognise the need for subsidy but to change the basis
for subsidy from operator and system-deficit subsidy to
targeted user-side subsidy which does not support and
entrench long distance trips but addresses basic social
needs of various groups in selected locations.
User-side
subsidy
It is acknowledged that in the longer term subsidies need to be on a more
equitable basis and available for all modes.
Note: Any changes to the current subsidy system would need to be phased
in with full consultation to minimise negative impacts during the process.
In respect of integration and co-ordination the ETA’s policy is:No.19
PT Service
integration
To promote integration and co-ordination between all modes
on a system-wide basis to achieve:¾ economies of scale
¾ reduced costs
¾ increased load factors
Some of the strategies to achieve this would be complimentary systems of
through ticketing and effective user information systems to ensure user
convenience is not compromised.
----------------------------------
eThekwini’s Public Transport Plan
3.9
Broad Public Transport Policy
Regarding integration of land-use and transportation and promoting land
use in support of efficient public transport, the ETA strongly supports the
IDP delineation of an urban edge and urban core. This includes related
programmes for densification in selected areas, in particular along corridors
and at transport nodes in the High Priority Public Transport Network
(HPPTN) – See below.
High Priority Public
Transport Network
In regard to the above, the ETA’s policy is:-
No. 20
To promote infilling and densification along public transport
corridors and major public transport routes within acceptable
environmental limits.
No.21
To direct employment opportunities, mixed land use and
high-density residential development into high-utilisation
public transport corridors, and nodes.
eThekwini’s Public Transport Plan
3.10
PT / land-use
integration
Broad Public Transport Policy
No.22
To discourage urban sprawl where public transport services
are inadequate, including careful evaluation of any major
trip-generating development outside the urban edge.
Discourage
urban sprawl
Related Project:
Generally low income housing projects are located in areas
where land prices are low but travel costs are relatively high
due to travel distance. A pilot project is needed for the
development of a low income housing project to be located
on a site convenient to major activity and employment
centres, with a view to subsidising the high cost of land
which will be offset against the lower cost of transport and
reduced need for transport subsidies, if any.
3.3
No.23
To promote Durban CBD and
the South Durban Basin as
two dominant nodes of
transport in the strategic
North-South Corridor.
No.24
To encourage re-development
around stations and major mode interchanges in the form of
major trip generating land use and informal and emerging
economic activities.
Redevelopment
at major
interchanges
No.25
To steer public investment for schools, hospitals, clinics,
police stations and various essential social services towards
development nodes along significant transport corridors.
Steer public
investment
Proposed Policy for Sustainable Public Transport
The goal of sustainability is also multi-facetted and the public transport
system needs to be:¾
¾
¾
¾
¾
¾
financially sustainable
technically sustainable
socially sustainable
environmentally sustainable
sustainable in terms of access to adequate skills resources
maintainable within the above considerations
eThekwini’s Public Transport Plan
3.11
Broad Public Transport Policy
¾ sustainable in terms of complimentary and self-reinforcing
support between the public transport system and land use which
assists in creating a stable investment environment
Policy 17 under Public Transport Efficiency applies equally to the goal of
sustainability. Additional policy in respect of financial and economic
sustainability is:No.26
To identify and promote private-public partnerships in
matters related to the provision, operation, maintenance and
monitoring of public transport systems, service and related
facilities.
---------------------------------The limitations of current funding restrict the Transport Authority’s ability to
effectively carry out their mandate. Further, the limitations of current
legislation restrict their ability to develop adequate dedicated funding. The
following policy however establishes a framework for addressing these
issues through the investigations and projects set out below.
PPP’s
ETA Funding
User pays
principle
No.27
To apply user-pays principles where appropriate.
No.28
To support the most efficient mechanisms for raising funds.
Related Project:In order to give effect to the above policies several projects
are required:¾ to achieve dedicated funding at the local level
¾ to invoke where possible current provincial legislation to
raise additional dedicated transport funding
¾ to position the ETA to raise its own funding and reduce
dependence on other spheres of government whilst
recognising that national and provincial departments
continue to have a level of responsibility for funding of
public transport.
Efficient
funding
mechanisms
The following policy applies in respect of expenditure on capital works and
maintenance of the public transport system:No.29
To ensure capital works expenditure programmes do not
compromise maintenance standards, by identifying and
programming cycles of fleet and system recapitalisation and
maintenance.
----------------------------------
eThekwini’s Public Transport Plan
3.12
Capital &
Maintenance
Expenditure
Broad Public Transport Policy
No.30
To rationalise roles and responsibilities of institutional and
administrative structures involved in funding of capital works
and maintenance in order to reduce administrative costs.
---------------------------------The above policies for sustainable public transport together with the
creation of sustainable land use, are fundamental to establishing a stable
investment environment which further reinforces sustainable public
transport.
Rationalising
funding roles
Access to adequate skills resources for the planning and execution of the
ETA’s programme is an essential element of sustainability. In this regard
the ETA’s policy is:-
Skills
Resource
No.31
To support the broader IDP initiatives in capacity building
and training, ensuring the requirements of transport are
adequately met.
---------------------------------Social sustainability is supported by the following policy:-
To ensure the user cost for services provided is affordable,
within defined limits, for all sectors of the Community. In this
regard, the intention is for the relevant authority to only
approve applications for justifiable fare increases for any
mode after due consultation.
---------------------------------No.33
To involve the community through user forums in
considering various aspects of service provision.
---------------------------------Environmental sustainability has a number of aspects relevant to the ETA’s
public transport policy; these being:-
Social
Sustainability
No.32
Affordable user
costs
User forum
input
¾ the negative impact of transport on the physical
environment which on a daily basis affects quality of life
¾ the longer term impact on atmospheric pollution
¾ the longer term impact on energy conservation
Increasingly, emphasis is being placed on quality of life which is a
fundamental consideration in the IDP mission statement and a major
consideration in international best practice.
Environmental
sustainability
The physical environment we live in is greatly influenced by the transport
system we provide. This environment can be greatly enhanced by the
effective promotion and development of various forms of public transport.
eThekwini’s Public Transport Plan
3.13
Broad Public Transport Policy
The development of public transport systems in preference to private
transport has the major advantage of reducing congestion and atmospheric
pollution.
In subscribing to energy conservation principles and programmes the
benefits of reduced environmental degradation along with the reduced cost
of energy supply should become evident in the short term, with major long
term benefits.
Consideration of these aspects of environmental sustainability suggest
actions to reduce the need for and use of private transport thereby
improving the urban environment through reduced congestion and air
pollution.
Within the above context the ETA’s policy is:No.34
To
promote
public
transport over private
transport through various
measures
including
implementation of high
occupancy vehicle (HOV)
facilities. (Refer also No.
2)
---------------------------------No.35
To investigate phasing
measures.
Public
transport over
private
of
appropriate
car
restraint
Phasing car
restraint
Related Project:Transport Demand Management (TDM) is an effective
strategy in promoting public transport over private transport.
An investigation will be carried out to assess the location
and type of priority strategies which can be applied to
achieve this objective. This investigation will also consider
the implications of various management and control
strategies for access and use of private vehicles.
eThekwini’s Public Transport Plan
3.14
Broad Public Transport Policy
No.36
To promote non-motorised transport (NMT) including
walking and cycling.
NMT
Related Project:A project has been initiated to develop a ‘Cycling Plan’ as
one means of non-motorised transport. This project will
address planning guidelines as well as policy which will be
an expansion of policy no. 34.
3.4
No.37
To encourage the use of environmentally friendly vehicles
and energy.
No.38
To introduce energy efficient measures for transport
operations and infrastructure.
Environmentally
friendly PT
Proposed Policy for Safety & Security in Public Transport
For public transport to have an improved public image and to become an
attractive alternative to private transport it is necessary to address a wide
range of issues around public transport security and safety. These issues
are key problem areas identified by existing public transport users.
In respect of Safety, the ETA’s policy will provide the framework for
addressing safety in all aspects of the public transport system and
operations which will also consider issues such as:¾ the integration of policy with appropriate Education,
Engineering and Enforcement programmes as part of the
ETA’s Safety Plan
¾ standards of policing in rural and urban locations
¾ enforcement of the operator/driver code of conduct and
standards of service as per the Quality Service Charter
Safety
Education/
Engineering/
Enforcement
The introduction and enforcement of the Quality Service Charter (Policy
No.7) will have a major impact on delivery of safe public transport. Further
policy which will compliment the goal of safety is:No.39
To promote passenger safety in respect of PT operations at
ranks, terminals and on board PT vehicles.
eThekwini’s Public Transport Plan
3.15
On-board &
rank safety
Broad Public Transport Policy
As regards matters of Security, the ETA’s policy is:No.40
To ensure passenger security at ranks, terminal facilities and
on board PT vehicles.
On-board &
rank security
Related Project:A comprehensive investigation is required to address
matters of security for public transport users.
The project should consider amongst other issues:¾ requirements for a data base on crime occurrence at
facilities and on board PT vehicles
¾ levels and type of protection services in rural and urban
communities
¾ use of appropriate technology
¾ use of security personnel (private and/or public service)
¾ requirements for a security audit of PT infrastructure
design projects in terms of CSIR developed criteria
3.5
Black Empowerment in Public Transport
A major goal in the provision and operation of eThekwini’s public transport
and related services is the achievement of Black Empowerment.
The ETA’s policy approach on Black Empowerment is:No.41
BEE
Equity
To support the City’s goal of equity which will include:¾ creating opportunity for SMME’s
¾ open tendering on any contracted PT routes
¾ structuring contracts and requirements for contractors to
include PDI operator sub-contracts
¾ providing rules for contract adjudication in respect of PDI
submissions
eThekwini’s Public Transport Plan
3.16
BEE
Equity
Broad Public Transport Policy
¾ empowering existing
through training
and
potential
entrepreneurs
¾ providing support in the process of raising finance within
funding and legal boundaries (eg. guarantees for
financing of vehicles)
¾ creating commercial investment opportunities
¾ creating infrastructure management opportunities/
contracts (eg. cleaning, security, rank management)
eThekwini’s Public Transport Plan
3.17
Broad Public Transport Policy
4
CURRENT PUBLIC TRANSPORT RECORD (CPTR)
A comprehensive CPTR has been prepared for eThekwini Municipality for
the three hour am peak period (05h00-08h00) and where demand
warranted the three hour pm peak period (15h30-18h30).
The CPTR data base of individual public transport routes with one or both
ends in the eThekwini Municipal area provided the information needed to
prepare the tabulations specified by the National Department of Transport.
Further, this same data set provided the information used by the ETA in
preparing the OLS for the Municipal area.
CPTR survey
This section of the ITP is supported by the full CPTR report and schedules
which are available from the ETA. The focus in the ITP is on overall
summaries and broad strategies, the details being available in the support
documentation.
4.1
Extent of Survey
The survey covered some 2 300km2 divided into eight areas as shown in
Figure 4.1. Table 4.1 shows the total number of bus and taxi terminals by
area that were included in the three hour am peak period survey from
05h00 to 08h00. Table 4.2 shows the number of routes, including those
which were not operating on the particular survey days.
Table 4.1:
Bus/Taxi Terminal Points
Area
Terminals
A
B
C
D
E
F
G
H
TOTAL
35
25
81
96
70
118
130
77
632
eThekwini’s Public Transport Plan
Terminal
points
4.1
Current Public Transport Record
Table 4.2:
Bus and Taxi Route Summary
Area
Bus
Taxi
Total
A
B
C
D
E
F
G
H
Total
233
123
67
104
308
272
281
241
1629
244
70
236
259
363
115
284
159
1730
477
193
303
363
671
387
565
400
3359
Bus/taxi
routes
In addition to the above, 8 basic rail routes radiating from Durban were
also surveyed. In total there were 55 unique combinations of start and end
stations and scheduled en route station/halt stops.
eThekwini’s Public Transport Plan
4.2
Rail routes
Current Public Transport Record
H
G
D
A
E
F
C
B
CPTR Areas
Figure 5.1:
ETHEKWINI CPTR
SURVEY AREAS
Figure 4.1: eThekwini CPTR - Survey Areas
4.2
Content of Survey
All public transport routes are geographically defined in detail from point of
origin to destination. These are logged on the Municipalities system which
interfaces with their Public Transport Management System (PTMIS)
developed to capture data and report on various aspects of current
supply, utilisation and performance of the services forming part of the
public transport system.
On the supply side information has been captured by mode and by route
on:¾
¾
¾
¾
¾
route location
route length
fare structures and timetables
departure times from point of origin
capacity
Supply-side
information
At terminals, ranks and selected
holding
areas
information
was
collected and captured on:¾ layout
and
construction
¾ capacity
¾ amenities
type
Terminal,
ranks and
holding areas
of
On the demand side, information by mode and route was collected on:¾ passenger loadings
¾ passenger queue times
¾ maximum vehicle accumulation
Demand-side
information
Using PTMIS this data was analysed to produce the tabulations required
by the NDOT as part of the ITP. These are available as a separate
document forming part of the full CPTR.
A brief description of the rail, bus and minibus taxi components of the
public transport system and a selection of key results are described in the
following section.
eThekwini’s Public Transport Plan
4.4
Current Public Transport Record
4.3
Public Transport System - Key Survey Results
4.3.1
Rail System Component
The commuter rail component of the eThekwini public transport system
comprises a north-south line following the coast from beyond the limits of
the Municipal area to both the north and south with three spur lines
serving the major residential areas of Umlazi, Chatsworth, and
KwaMashu.
The mainline into the hinterland also carries commuters in the east-west
direction within the Municipal area and a circuitous line connects Pinetown
CBD to Rossburgh Station on the north-south line.
There is also a spur line along the south side of the harbour to the lower
Bluff which is largely undeveloped.
In total the rail system component comprises 55 rail routes over 2 543
kilometres of track. At the time of the survey the passenger carrying
capacity of the system during the AM and PM 6 hour period was 504 000
passengers. Total passengers carried during this same period was
135 500.
During peak hours load factors ranged from a low of 15% on one of the
minor routes to 59% on one of the major routes.
4.3.2
Bus System Component
The bus service provided by some 200 operators, in 13 associations
covered approximately 1 600 uni-directional routes in a mix of subsidised
and unsubsidised services. In total a fleet of some 1 500 buses provided
service on these routes and approximately two thirds of the route system
was covered by subsidised service contracts.
The average route length was approximately 26 kilometres and average
one way fare R8.20. The longest route was 92 kilometres and the highest
one way fare R47.50.
In the AM plus PM peak 6 hours the system provided a service capacity of
327 000 passengers. Some 227 000 passengers representing
approximately 70% capacity utilisation were carried during these hours.
eThekwini’s Public Transport Plan
4.5
Current Public Transport Record
4.3.3
Minibus Taxi System Component
This system component comprises some 1 730 taxi routes serviced by
120 taxi associations using a fleet of 1 150 vehicles.
The average route length is approximately 20 kilometres with the longest
route in the AM peak being 62 kilometres and in the PM peak 58
kilometres. The average wait time during the peak, at the start of a route
was 10 minutes.
In total the AM plus PM peak service of 6 hours provided capacity for
some 367 000 passengers. During this same period approximately
320 000 passengers were carried representing 87% of the available
capacity.
The PM peak utilisation of 97% of available capacity was considerably
higher than the AM peak of 85%.
4.3.4
Busiest Public Transport Activity Node
The following destinations were the busiest public transport nodes in terms
of the number of passengers using these areas as a destination in both
the AM and PM peak hour:¾ Durban CBD - 112 000 passengers (AM & PM peak hour)
¾ Pinetown CBD - 27 000 passengers (AM & PM peak hour)
¾ Isipingo CBD - 21 000 passengers (AM & PM peak hour)
The ten busiest surveyed passenger facilities (highest number of
passengers per hour) were:Rank name
Passengers
per Hour
7035
5961
5472
5104
4900
4336
3894
3819
3778
3713
Victoria Bus Rank (Durban CBD)
Umlazi Station - Umlazi J
Ntuzuma E - Dalmeny Road
Pine Street Rank 1 (Durban CBD)
Westmead - Malcolm Road
Soldiers Bus Rank (Durban CBD)
Ntuzuma F
Hill Street Bus Rank - Hill Street, Pinetown
Isipingo Bus Rank
Canongate (Durban CBD)
eThekwini’s Public Transport Plan
4.6
Current Public Transport Record
5
METERED TAXI
5.1
Introduction
Apart from the CPTR study which covered the major commuter transport
modes of minibus taxi, bus and rail, an investigation was also conducted
into metered taxi services. The full report is available in the annexures on
CD.
Although in South Africa metered taxis are not a commonly used form of
transport by the local population for a variety of reasons the industry in
eThekwini is nonetheless well established and performs an essential role
in the transportation of both residents within and visitors to eThekwini. The
function of metered taxis within the municipal transport system, however,
is not clearly defined and the institutional structure of the industry on all
levels is fragmented.
Metered taxi
This section of the ITP looks at the current status of the metered taxi
industry. In addition, the framework for developing policy and strategy are
considered, which will assist in positioning the industry to perform
effectively in serving future demand, in particular extraordinary demand
from events such as the 2010 Soccer World Cup.
5.2
Size of eThekwini Metered Taxi Industry
There are approximately 150 metered taxi operators in eThekwini that
operate some 400 metered taxis. The size of the operations varies
considerably from the largest with a fleet of 45 taxis to the single vehicle
owner-driver. The South African Metered Taxi Association (SAMTA) has
approximately 80 operators as members, the Thekwini Africa Metered Taxi
Association (TAMTA) has approximately 70 operators as members and
the Durban Metropolitan Taxi Association (DMTA) has approximately 70
operators as members. Some operators are members of more than one of
the three associations.
Size of
metered taxi
industry
It is difficult to obtain the metered taxi fleet size in eThekwini as the
available data on vehicle accreditation permits is outdated and not reliable
and the available data on rank permits is listed by permit and not by
vehicle. Taking into consideration the fact that one vehicle can operate on
two or more rank permits, it is estimated that the total legal metered taxi
fleet in eThekwini is approximately 400 vehicles.
eThekwini’s Public Transport Plan
5.1
Metered Taxi
There are an estimated 60 permanent taxi drivers who do not have
permits but are known to operate in the Inner City area. There are also
moonlighters that operate mainly at night and target the low end of the
market. No surveys of these taxis without permits or the illegal taxis have
ever been undertaken and therefore the exact numbers are difficult to
estimate.
5.3
Metered Taxi Routes and Operations
The metered taxi industry provides a 24 hour service throughout the week
in eThekwini. The companies with larger vehicle fleets use their vehicles
on a 24-hour basis with drivers working 12-hour shifts. The smaller
operators, who have one dedicated driver per vehicle, and owner-drivers
also work a 12-hour day but their time is flexible to the market they serve
and also changes according to seasonal demands. The off-peak period
across all market sectors including seasonal demands is from 02:00 to
06:00 in the morning.
Routes &
operations
The most popular metered taxi return routes in eThekwini are listed as
follows:Route
No.
1
2
3
4
5
6
7
Origin
Destination
Distance
Time Period
CBD
CBD
CBD
CBD
CBD
CBD
CBD
Durban International Airport
Pavilion Shopping Centre
Gateway Shopping Centre
Berea / Overport
Sun Coast Casino
Internal within CBD
Residential Suburbs
20km
12km
14km
7km
5km
5km
ave 25km
08h00 – 19h00
08h00 – 19h00
08h00 – 19h00
08h00 – 22h00
08h00 – 00h00
08h00 – 02h00
22h00 – 04h00
Route 1 :
Route 2 :
Route 3 :
Route 4 :
Route 5 :
Route 6 :
Route 7 :
business and tourist markets
private and tourist markets
private and tourist markets
private and tourist markets
private and tourist markets
private and tourist markets
private and shift workers during weekdays, leisure over
weekends
Metered taxi
routes
The average flag fall fee is R5.00 whilst the average fee per kilometre is
R7.00. In most cases fees are negotiable to be discounted or as a flat
fee.
eThekwini’s Public Transport Plan
5.2
Metered Taxi
5.4
Ranks in eThekwini
There are a total of 50 designated formal metered taxi ranks in the Inner
City area containing about 150 bays. Approximately 5 of these ranks,
mostly located outside former night clubs are no longer used due to the
closure of the clubs. There is also a major rank at Durban International
Airport that contains 8 bays. Most of the Inner City ranks are on-street
parking areas that have been designated as metered taxi ranks. None of
the metered taxi ranks have shelters or ablution facilities.
5.5
Metered taxi
ranks
Policies and Strategies
Although these are no formal national policies or strategies for the
metered taxi industry various papers and reports have been prepared by
the Metered Taxi Working Group, a sub-committee of the National Taxi
Task Team, which has been active since 1996.
These include:¾ “The Metered Taxi: Problems and Solutions
Preparation for Provincial Workshops - June 1996”
¾ “Supplementary Final Recommendations relating to
Metered Taxis - May 1997”
¾ “Report and Recommendations on 4+1 Vehicles - May 1997”
In addition to this, the National Department of Transport produced a
“Position Paper on the Regulation and Democratisation of the Metered
Taxi Industry” in October 2002. This paper made recommendations on the
following:¾ National registration and democratisation of the metered taxi
industry
¾ Clear definition of the services rendered by the metered taxi
industry
¾ Law enforcement
¾ Legislative amendments
¾ Arrangements for a national summit or indaba of all role players
to initiate the representation process.
To date, apart from legislative and regulation amendment initiatives at
both the national and provincial level none of the institutional or
operational recommendations have been formally implemented although a
few of the issues have been addressed in eThekwini and possibly
provinces outside of KwaZulu-Natal.
eThekwini’s Public Transport Plan
5.3
Context for
developing
policy &
strategy
Metered Taxi
The KwaZulu-Natal Department of Transport at present does not have any
policies or strategies for the metered taxi industry; however, a Provincial
Bill has been approved by the KwaZulu-Natal cabinet, which gives the
Minister of Transport the power to restructure all modes of land transport
including metered taxis. This Bill will be tabled before Parliament by the
Minister following the public consultation phase. The KwaZulu-Natal
Department of Transport is also in the process of formulating Provincial
regulations that will govern the metered taxi industry.
From the above, the current initiative by KZN-DOT to formulate a legal
framework to accommodate new policies and strategies for the metered
taxi industry and the National Department of Transport initiative to arrange
a summit or indaba for all role players, will provide important background
for the preparation of a policy document for metered taxi operations in
eThekwini Municipality.
eThekwini’s Public Transport Plan
5.4
Metered Taxi
6
LONG TERM TRENDS
6.1
Introduction
The extent and location of growth in population and employment
opportunities, together with other trip attracting opportunities, impacts on
the transport system requirements for the metropolitan area.
The transportation system, and in particular the public transport system,
can support or discourage the land use development pattern based on
Council’s development priorities.
In recent years there has been a move of commercial development from
the Durban central area to the Berea and to the Umhlanga area. Further,
there has been a deterioration and move away from the South Durban
Basin to the Pinetown/Westmead industrial area and the Effingham, Avoca
industrial areas north of the Umgeni River. The ‘Trend’ development
scenario for the future shows this pattern continuing.
Trend shift in
employment
locations
This trend erodes the strength of development along the historic, intensely
developed North-South Coastal corridor from Isipingo in the south to the
northern residential areas of KwaMashu, Ntuzuma, Inanda and Phoenix in
the north. It also has the potential to dilute the effectiveness of an efficient
public transport system serving development along this corridor.
This section of the Public Transport Plan looks at key aspects of the long
term trend growth and related travel pattern.
6.2
Growth and Travel Projections
6.2.1
Population and Employment
Table 6.1 shows the estimated population and employment growth rate
over approximately twenty years.
Table 6.1:
Population and Employment (1000’s)
(Years 2001 and 2020)
Population
Employment
Year 2001
3 063
762
Year 2020
3 047
1 015
Growth
0%
+33%
Source: Long Term Road Infrastructure Plan for eThekwini - 2004
eThekwini’s Public Transport Plan
6.1
Long Term Trends
Whilst there is no anticipated net growth in population over the next 20
years there is an estimated growth of over 1.5% per annum compound
growth in employment. Based on land use modelling, it is estimated that
some 250 000 jobs, representing a net increase of 33% over the next 20
years will be located throughout the metropolitan area in the categories of
General Commercial, General Industrial and Light Industrial.
6.2.2
Population/
employment
growth
Travel Projections and Modal Split
Related to growth in employment there is an estimated overall growth in
peak period travel in the years 2005 to 2020 of some 22% (154 000 person
trips). However, as shown in the following table, based on the projected
trend during this period for reduced use of public transport and increased
use of private transport, all growth in trips will be by car with an estimated
decrease of 3% in public transport trips.
Table 6.2:
Trend travel
growth by PT
and by car
Trend Trip Growth and Modal Split
(AM Peak 2 Hours – Years 2005 and 2020)
(Trips – 1000’s)
Year
2005
699
333
366
52:48
Total Person Trips
Trips by Car
Trips by Public Transport
Modal Split (PT:Car)
Trend Year
2020
853
498
355
42:58
Net Growth
2005-2020
+22%
+50%
-3%
Trend modal
split
This disturbing trend of decline in use of public transport is not sustainable.
It is based on the historic and on-going decline in public transport service
accompanied by a rapid growth in car ownership (See Figure 6.1).
Cars/1000
350
300
298
263
250
200
150
145
122
100
189
168
235
211
50
0
1985
1990
1995
2000
2005
2010
2015
2020
Figure 6.1: Car Ownership Levels per 1000 Population
eThekwini’s Public Transport Plan
6.2
Long Term Trends
This unacceptable pattern of decline in public transport usage is being
addressed through the Public Transport Plan. The Plan sets out the
strategy for restructuring the public transport system accompanied by
various Transport Demand Management measures (TDM) to increase the
relative attractiveness of public transport over the use of private vehicles.
(Refer Sections 7 and 8).
6.3
Public
Transport Plan
Impact of the Trend Land Use on the Travel Pattern
Historically the bulk of formal employment in the metropolitan area has
been located along the coastal corridor from Isipingo in the south to the
northern end of North Coast Road in the north, where it crosses the N2
freeway. The exception is the major employment node, Pinetown-New
Germany approximately 20 kilometres west of the CBD. This hub of
industrial/commercial activity currently accounts for some 65 000 jobs, 8%
of the metropolitan total.
Employment
distribution
At each end of the coastal corridor there is a major concentration of low to
middle income residential development. These communities, Umlazi in the
south and KwaMashu, Ntuzuma, Inanda and Phoenix in the north have a
high dependency on public transport. They are the largest contributors to
peak travel along this heavy demand corridor where most of their work
destinations are located.
Residential
along N-S
corridor
Figure 6.2 shows employment trends and projections from 1996 to 2020.
These estimates used in the transportation modelling show a significant
decline in employment in the established commercial and industrial areas
along the coastal corridor, over the past 10 years. In particular a move of
commercial employment from the Durban Central area to the north and
industry from the South Durban Basin to the north and west are cause for
concern.
eThekwini’s Public Transport Plan
6.3
Long Term Trends
60000
50000
40000
Employment
100000
2010
2020
80000
UMKOMAAS
UMBUMBULU
SOUTH WEST (FUDU)
NORTH WEST (QHODELA)
NORTH WEST (MGEZANYONI)
HAMMERSDALE / MPUMALANGA
CATO RIDGE
FAR WEST (NTURUSO)
HAZELMERE
LA MERCY
TONGAAT
COMPENSATION
ZIMBALI
WESTBROOK
SIBAYA
WATERLOO
VERULAM
N NORTH WEST (BUFFELSDRAAI)
NORTH WEST
INCHANGA
SHONGWENI
ADAMS MISSION
LOVU / KWAMAKHUTA
AMAMZINTOTI / KINGSBURGH
DIA / PROSPECTON
SOUTH WEST (NWABI)
MAGABENI / UMGABABA
PINETOWN / NEW GERMANY
KLOOF / GILLITTS / EVERTON
HILLCREST & SURROUNDS
CLERMONT / KWADABEKA
INANDA (NGLOLOSI)
INANDA / AMATIKWE
PHOENIX
MOUNT EDGECOMBE
UMHLANGA
PHOENIX SOUTH / INDUSTRIAL
KWAMASHU / INANDA / NTUZUMA
NEWLANDS WEST
MARIANNHILL
UMLAZI
CHATSWORTH / SHALLCROSS
JACOBS / MOBENI / MEREBANK
BLUFF
QUEENSBURGH / OLD LINE
CATO MANOR
WESTVILLE / COWIES HILL / RES
SPRINGFIELD / SYDENHAM
EFFINGHAM
DURBAN NORTH
BEREA
HARBOUR
DURBAN CBD WEST
DURBAN CBD NORTH
POINT
DURBAN CBD CENTRAL
Source: Long Term Infrastructure Plan - January 2004
Long Term Trends
6.4
eThekwini’s Public Transport Plan
Figure 6.2: Employment Projections
eThekwini Metropolitan Area
1996 to 2020
Employment Projections
eThekwini Metropolitan Area
1996 to 2020
Figure 6.2:
1996
2005
90000
70000
30000
20000
10000
0
Area
Estimates of future employment indicate that most of this loss in
employment will be recovered over the next 15 years assuming active,
successful interventions by eThekwini Municipality (without any net growth
above 1996 levels of employment.)
To the west, some considerable employment growth is shown in the
Pinetown/New Germany, Shongweni area, Hillcrest and surrounds and to a
lesser degree at Botha’s Hill and Hammersdale. Relative to growth in these
areas major employment growth is predicted to the north at La Mercy,
Umhlanga, Effingham and Mount Edgecombe.
Employment
growth to west
& north
Although considerable growth in population has occurred over the past
decade this will be reversed by a decline over the next 10-15 years largely
due to the impact of aids related deaths.
In the west, the net effect of these changes will be a decreased need for
residents in the west to travel to employment areas along the coastal
corridor. As shown in Table 6.3 the average trip length from residential
areas in the west will be marginally shorter.
Table 6.3
Change in Average Public Transport Trip Length
AM Peak Period (1996 to 2020)
Area
West
North
South
Trip Distance (km)
1996
2020
23.5
22.5
23.2
21.5
21.7
26.4
Total Municipal Area
20.9
Changing PT
trip distances
22.6
Source: Long Term Road Infrastructure Plan for eThekwini - 2004
Trips originating in the northern residential areas will also be marginally
shorter as a result of the considerable growth in employment north of the
Umgeni River. However, trips from the major residential areas in the south
will be considerably longer.
This change in trip pattern for trips along the coastal corridor is highlighted
by figures shown in Table 6.4 which shows changes in am peak hour public
transport trips northbound and southbound between 1996 and 2020, based
on the trend land use development.
eThekwini’s Public Transport Plan
6.5
Long Term Trends
Table 6.4
Public Transport Trips along the North-South Coastal
Corridor: AM Peak Hour (1996 to 2020)
1996
(Persons)
9 799
31 447
2020
(Persons)
7 853
36 154
Growth
1996-2020
-20%
+15%
Umbilo River (Part of) (N-S)
Umbilo River (Part of) (S-N)
18 131
33 517
17 398
42 085
-4%
+26%
Umgeni River (N-S)
Umgeni River (S-N)
41 678
6 461
44 353
18 305
+6%
+180%
Umhlanga River (Part of) (N-S)
Umhlanga River (Part of) (S-N)
9 044
2 620
13 859
5 706
+53%
+118%
Position of Screenline
Umlaas River (N-S)
Umlaas River (S-N)
Changing PT
trip pattern
The following points summarise the impact on the north-south coastal
corridor:¾ Before the development of new employment centres north of
the Umgeni River most trips crossing the Umlaas and the
Umbilo screenlines would have been destined for
employment in the South Durban Basin and the CBD.
¾ The growth in northbound trips across the Umgeni
screenline exceeds growth across the Umlaas and Umbilo
screenlines, indicating a reduction in trips terminating in the
South Durban Basin and the CBD and a dramatic increase
in trips destined for employment areas north of the Umgeni
River
6.4
IDP Response to Development Trend
The IDP recognises the negative impact of the current trend for existing
employment generators to move from the CBD and the South Durban
Basin. In responding, the City has included in their IDP an eight point plan:“ balancing new development with renewal and maintenance:-
IDP response
to trend
¾ rehabilitating and maximising use of existing facilities and
infrastructure
¾ carefully considering and targeting the extension of bulk
infrastructure.”
eThekwini’s Public Transport Plan
6.6
Long Term Trends
In respect of the South Durban Basin and the CBD the City has identified
the following action plans:¾ to significantly upgrade management and infrastructure in core
manufacturing locations, in particular the South Durban Basin.
IDP action
plans
¾ to regenerate core business zones (especially Durban Inner City
and South Durban areas, ….)
In establishing the context for a Spatial Development Framework (SDF)
which integrates the transport systems, as a key component of the
framework, the IDP states the following:The eThekwini Metropolitan Area is characterised by a spatial
legacy of imbalances and fragmentation, manifesting in a racially
divided city form that has high social and economic costs, especially
for historically disadvantaged communities.
It is in this regard that the SDF must ensure that public and private
sector money and activities are located in areas that can best:¾
¾
¾
¾
¾
¾
Context
for SDF
Promote economic generation potential
Maximise opportunities for the poor
Promote accessibility
Minimise the cost of physical expansion
Ensure that people are well located
Promote a sustainable supply of environmental services
These same principles are best exhibited in the north-south public transport
corridor.
Further development of the SDF is required in terms of integrating the
public transport systems into the framework. This work will need to
consider the long term impact of new development north of the Umgeni
River and an adequate response in terms of transport and land use.
Further
development
of SDF
Within the context of this SDF, local area development plans integrated
with local area public transport plans can then be developed.
eThekwini’s Public Transport Plan
6.7
Long Term Trends
7
TRANSPORT DEMAND MANAGEMENT
7.1
Background
Transport Demand Management (TDM) may be described as a system of
actions and interventions used to alleviate traffic congestion-related
problems through improved management of vehicle trip demand.
In the South African context this translates into a
variety of ‘carrot’ and ‘stick’ interventions focused
broadly on increasing the use of public transport
in the peak and decreasing the use of private
transport.
Clearly the type, extent and severity of actions
taken at any point in time needs to be considered
against the severity of the problems being addressed.
7.2
Growth Trends and Target Modal Split
7.2.1
Growth Trend
Current estimates place the trend growth in peak period person trips
between 2005 and 2020 at 22%. This translates into a 50% increase in
trips by car and a 3% decrease in trips by public transport.
Trend growth
in cars
Considering current levels of congestion, accommodating a 50% increase
in private motor vehicles on the road system is unacceptable and
unaffordable in both financial and environmental terms.
7.2.2
Implications of ‘Do Nothing’
In the event no actions are taken to address the trend of increased use of
private transport and decreased use of public transport a number of service
problems will result; these being:¾ a progressive deterioration in all forms of transport services
throughout the city, including public transport, freight transport
and private transport.
Impact of
‘Do Nothing’
¾ Road congestion affecting all forms of transport.
eThekwini’s Public Transport Plan
7.1
Transport Demand Management
¾ Road based public transport will become increasingly costly
and inefficient as sprawling land use patterns continue to
dilute the effectiveness of public transport.
¾ The demand for road capacity will exceed affordability of
providing additional road space.
¾ A significant reduction in accessibility and mobility for the
public
Impact of
‘Do Nothing’
¾ Reduced accessibility for freight movement with the
concomitant effect of increased cost for commercial and
industrial activities and reduced attractiveness for
commercial/industrial development in eThekwini.
Overall these and other consequences of a ‘do nothing’ approach to the
current trend will have significant negative implications on key
components of the IDP vision, these being:¾ Providing a high quality of life
¾ Meeting peoples needs
¾ Growing the economy
7.2.3
Target Modal Split
The extent of the peak hour within the peak period is affected by
increasing levels of congestion which cause a spreading of the peak traffic
demand. This is a natural phenomenon which in the eThekwini area is
expected to result in approximately half of the peak two hour traffic
occurring in the peak hour by year 2020. By implication this also means
that the heaviest traffic demand will also extend well beyond a one hour
period.
Spreading of
peak
Any further reduction in peak travel can only take place with a change in
modal split encouraged by the use of TDM measures. The White Paper
on National Transport Policy published in 1996 advocated a modal split to
public transport of 80:20 (public: private). Based on screenline surveys,
the estimated current modal split in the municipal area overall is 52:48 in
the two hour peak period.
Current
modal split
eThekwini’s Public Transport Plan
7.2
Transport Demand Management
This represents the aggregation of lower income areas such as Umlazi
with a modal split as high as 94:6 through to high income areas with a
very low modal split to public transport.
Recognising the current trend of declining use of public transport a more
realistic target of reversing the trend and achieving a positive growth in
public transport has been set. Table 7.1 highlights the implications of
reversing the trend modal split in year 2020 of 42:58 (public: private) to
55:45, an improvement in the current modal split of 52:48.
Table 7.1
Trend versus Target Modal Split
(AM Peak 2 Hours - Years 2005 and 2020)
(Person Trips - 1000’s)
Year 2005
Year 2020
333
498
384
-114
366
355
469
+114
52:48
42:58
55:45
Trips by Car:
- Trend
- Target
- Difference
Trips by Public Transport (PT):
- Trend
- Target
- Difference
Modal Split (PT:Car):
- Trend
- Target
Trips by Public Transport
(1000's)
Target modal
split
Target
Trend
500
469
400
300
366
366
417
364
355
200
100
0
2005
2010
2020
Year
Figure 7.1: Person Trips by Public Transport (1000’s)
Peak Period (2 Hours) - Years 2005 to 2020
Trend vs Target
eThekwini’s Public Transport Plan
7.3
Transport Demand Management
During the period 2005 to 2020 the ‘target’ modal split will result in
estimated peak period growth in person trips by public transport of
103 000 as opposed to the ‘trend’ decrease of 11 000.
The significant growth of 28% in public transport demand will need to be
taken up by the restructured public transport system which is described in
Section 8.
Private Cars (1000's)
Target
350
300
250
200
150
100
50
0
Target
increase in PT
Trend
299
209
199 199
2005
241
2010
230
2020
Year
Figure 7.2:
Private Cars on Road System (1000’s)
Peak Hour – Years 2005 to 2020
Trend vs Target
As shown in Figure 7.2, the demand for private transport by car in the
peak hour translates into a ‘target’ growth in cars of 31 000 as opposed to
the ‘trend’ demand for an additional 100 000 cars.
7.3
Target growth
in cars
Modal Split Monitoring
Modelled figures for total trips by mode
throughout the municipal area are useful for
establishing overall targets. However, for
monitoring purposes measured modal split
across cordons or screenlines is more
effective. For this purpose the five kilometre
screenline which intercepts the major roads
in the municipal network is used.
Currently, in the peak two hour period, there are approximately 193 000
person trips inbound across the cordon and 87 000 outbound. The overall
modal split is the same in both directions 54%:46% (public:private). The
breakdown by mode however differs slightly as shown below:-
eThekwini’s Public Transport Plan
7.4
Transport Demand Management
Table 7.2
AM Peak Period Modal Split - Year 2004
5 Kilometre Cordon (Inbound & Outbound)
Mode
% Person Trips by Mode
Inbound
Outbound
30%
32%
18%
15%
6%
7%
54%
54%
46%
46%
100%
100%
Taxi
Bus
Rail
Sub-Total Public Transport
Private
All Vehicles
The five year change in modal split is shown below, however, as rail
figures were not available for the cordon in 1999, rail passengers have
been assumed as constant from year 1999 to 2004.
Table 7.3
AM Peak Period Person Trips/Modal Split
Comparison 1999 vs 2004
5 Kilometre Cordon Inbound
Mode
Person Trips (1000’s) / Modal Split
Year 1999
Year 2004
57 (30%)
56 (29%)
35 (18%)
45 (23%)
12 (6%)
12 (6%)
89 (46%)
83 (42%)
196 (100%)
193 (100%)
Taxi
Bus
Rail(1)
Private
Note (1)
7.4
Rail trips not available for Year 1999 therefore assumed the same as 2004
TDM Measures
Apart from TDM measures which are needed to reduce the demand for
private transport there is a range of concomitant measures needed to
retain current public transport ridership whilst attracting new riders from
the private transport group. Certain measures are also needed to manage
the extent and location of demand for freight transport movement. In
many instances issues of system efficiency, effectiveness, safety,
affordability and sustainability under-score the need for effective TDM
measures. This section considers various types of interventions and
measures, the objective of each and the applicability of each in the short,
medium and long term. In the following tables the short term period is
defined as 1-5 years, medium term 6-10 years and long term 11-20 years.
Many of the measures will be introduced on a phased basis and often
extend over more than one period. In each case the first period of
introduction is shown in the table.
eThekwini’s Public Transport Plan
7.5
Transport Demand Management
The measures are tabulated in four main categories, these being:1) Private transport, which includes congestion reduction and
parking measures
2) Public transport, which also embraces the development of
non-motorised transport
3) Land-use development and management
4) Policy and institutional, which relates to one or more of the
other categories.
In many instances individual strategies could be allocated to more than
one category however for simplicity they have been restricted to one only.
7.4.1
Private Transport Measures
Table 7.4 contains measures used to improve system performance,
reduce need to travel particularly during peak periods and various
restrictive measures which would result in a reduction in travel by private
transport.
The restrictive interventions are directed towards active discouragement
of the use of private cars. If such interventions are not to be unduly
restrictive they must be accompanied by provision of attractive public
transport alternatives as discussed in 7.4.2 Public Transport Measures.
7.4.2
Public Transport Measures
Table 7.5 contains a range of measures directed towards improving the
public transport system and services in order to provide a more attractive
service to current riders and to encourage existing private motorists to use
public transport. Generally, attracting the private motorists onto public
transport would also require a variety of disincentives directed at the
motorist such as those identified under the private transport measures.
The public transport measures include physical infrastructure projects for
public transport priority, fleet upgrades for all modes to acceptable
standards, safety and security measures and the effective promotion of
public transport across all income groups.
In recognition of the need for a holistic approach to public transport a
range of measures focused on providing where practical, an adequate
system for non-motorised transport (pedestrian and cycling) have also
been integrated.
eThekwini’s Public Transport Plan
7.6
Transport Demand Management
Selectively and effectively integrated with measures in the other
categories, these public transport initiatives introduced at the appropriate
time, have potential for a significant impact on the reduction of the trend
growth in demand for private transport. Further, such initiatives begin to
give effect to the overall transport policy of prioritising public transport over
private transport.
7.4.3
Land Use Development and Management Measures
Land use plays a key role in the location and demand for various forms of
transport. Table 7.6 identifies measures which in effect are land use
planning and development guidelines encouraging and supporting efficient
transport in a city, with the focus on public transport.
7.4.4
Policy and Institutional Measures
Table 7.7 identifies several measures which address the key issues of
appropriate institutional arrangements, regulation of transport, pricing,
cost recovery and preservation of valuable transport assets.
eThekwini’s Public Transport Plan
7.7
Transport Demand Management
Table 7.4 Private Transport Measures
Implementation Timing
Short
Med
Long
Term
Term
Term
√
TDM Measure
Description
Objectives
Area Traffic Control
system
Intelligent Transportation
Systems
The use of computerised signal control
systems to manage traffic flows
Use of information technologies to
provide the driver with real time
information and/or instructions to avoid
problem locations etc
Compressed work week (CWW) and
staggered shifts, starting/ending outside
of peak periods and/or allowing
employees to work flexitime
Use of telecommunications as a
substitute for physical travel
To optimise traffic flows through signal systems and minimize
congestion and related pollution and cost inefficiencies
To improve system performance, reduce congestion and unnecessary
travel
To reduce need for travel for work and business purposes both in and
out of peak periods
√
Ways to support and encourage
carpooling and vanpooling
Regulatory strategies to limit private
vehicle travel at a particular time and
place
Allow traffic to increase and congestion
to grow in selected areas
Drivers entering defined restricted areas
of city pay an access tax
Congestion pricing, value pricing, road
tolls and HOT lanes
Charge insurance, road use fees,
emission charges and taxes based on a
vehicle’s kilometres
To reduce private vehicles on the road system in peak periods
√
Fuel taxes
Increase fuel taxes
Parking management
Parking cost, pricing and
revenue planning
Parking taxation
Methods for more efficient use of parking
Parking facility cost recovery pricing and
revenue generation planning
Drivers wanting the right to park in
defined restricted areas of city pay
applicable tax for that area
Shared parking facilities among multiple
users
To fund roads and public transport and reduce demand for private
transport
To make best use of available facilities
To prepare a comprehensive parking revenue programme, considering
cost of providing facilities
To limit private transport demand for parking in defined areas of city
whilst raising funding for transport system; preferably public transport
Alternative work
schedules and flexitime
Telework
(Telecommuting,
distance learning, teleshopping, etc)
Ridesharing
Vehicle use restrictions
Limited road
development
Area access taxation
Road pricing
Distance-based pricing
Shared parking
eThekwini’s Public Transport Plan
√
√
To reduce demand for travel in peak periods and in particular the peak
hour
To limit use of private transport in selected areas of the city in particular
during peak periods
√
To encourage peak spreading, use of public transport and reduction in
trend growth of public transport in selected areas
To limit private transport use in defined areas of city whilst raising
funding for transport system, preferably public transport
To recover cost of road infrastructure from the users
√
√
√
√
To reduce use of private transport
To maximise utilization of facilities
7.8
√
√
√
√
√
Transport Demand Management
Table 7.5: Public Transport Measures
TDM Measure
Description
Objectives
HOV ( High occupancy
vehicle) priority
Priority measures focused on public
transport vehicles
Re-routing around
congested areas
To identify points of congestion along PT
routes and identify alternative routing
where practical if priority facilities cannot
be introduced
Rationalise location and use of ranks in
congested areas of the city
To reduce public transport (PT) travel times and give PT noticeable
advantage over private transport in congested areas thereby
encouraging use of public transport
To reduce travel times without reducing accessibility
Optimised configuration
of public transport ranks
and holding areas
Provision for nonmotorised transport
Non-motorised facility
management
Upgrade of PT system
Upgrade of PT fleet
Park & Ride facilities
Address security
concerns
Road space reallocation
Promotion of public
transport
Area Traffic Control
system
Intelligent
Transportation Systems
Plan and implement localized, safe and
effective walking and cycling facilities
integrated into other modes of public
transport where justified by current and
latent demand and where physically
practical
Practices for managing and maintaining
non-motorised facilities such as
walkways, sidewalks and cycle paths
Ensure availability of the appropriate
mode of public transport for an efficient,
user attractive PT system
Investment in fleet to ensure all modes
(rail, bus, taxi) operate with equipment to
defined standards
Park ‘n ride facilities at key locations
inter-faced with prioritised public
transport services through congested
areas
Improved personal safety for walking,
cycling, and public transport
Roadway design and management
practices
Package and market public transport
and develop effective user information
systems
The use of computerised signal control
systems to manage traffic flows incl.
possible priority treatment of PT
Use of information technologies to
provide the PT drivers with real time
information and/or instructions to avoid
problem locations etc
eThekwini’s Public Transport Plan
Implementation Timing
Short
Med
Long
Term
Term
Term
√
√
To reduce congestion by reducing unnecessary loading/holding as well
as movement of PT vehicles in congested areas
√
To minimize the cost of transport for the urban poor where possible and
provide flexibility in transport options
√
To ensure facilities provided are well maintained and remain safe
attractive options to the user
√
To provide a cost efficient, attractive PT system which will retain the
support of current ridership and encourage new riders from the current
private transport group
To provide a safe, efficient and attractive public transport service
√
√
√
To encourage private motorists to change to prioritised public transport
through congested areas where use of private transport may be
discouraged by a variety of measures
To increase the attractiveness and sense of security on all public
transport modes throughout the city
To encourage design and management practice which Improves the
efficiency of PT operations
To raise the profile of public transport and public awareness of PT
benefits and achievements as well as increasing user-friendliness of PT
To minimise delay for PT vehicles
To improve PT system performance
7.9
√
√
√
√
√
Transport Demand Management
Table 7.6: Land Use Development Management Measures
TDM Measure
Description
Objectives
Location Efficient
Development
Locate different categories of
development where accessibility and
mobility needs can be effectively met
Incentives for densification at identified
public transport Nodes and along priority
corridors
Residential development on subsidised
land closer to major employment areas,
and highly accessible to public transport
To ensure people access, with emphasis on public transport, as well as
freight and commercial access and mobility needs can be met by safe,
cost effective transport systems
To increase convenience, effectiveness and cost efficiency of public
transport system
Selected areas and times of minimal
private vehicle use
To humanise selected key areas of city and reduce negative impact of
private transport on these areas
Development
densification in support
of public transport
Public transport
dependent development
closer to major trip
attractors
Car free districts and
pedestrianised streets
eThekwini’s Public Transport Plan
To reduce cost of travel and cost of providing effective, efficient public
transport
7.10
Implementation Timing
Short
Med
Long
Term
Term
Term
√
√
√
√
Transport Demand Management
Table 7.7 Policy and Institutional Measures
TDM Measure
Description
Prioritising
appropriate
transportation measures
Policy which prioritises public transport
in the transportation system and TDM
measures which minimize the negative
impact of private transport on the urban
environment
Policy changes to encourage regulated
competition, innovation, safety and
efficiency in transport systems and
services
Development and support of
appropriate institutional structures and
processes
Policy changes that result in more
efficient and fair transportation pricing
Regulatory
reform
Institutional
reforms
Comprehensive market
reforms
Asset management
Policies and programmes to preserve
valuable assets
eThekwini’s Public Transport Plan
Objectives
To encourage use of public transport and minimize the negative
impact of transport on the city whilst ensuring mobility and
accessibility for all stake-holder groups
To regulate all categories of transport services to increase
accessibility to safe, cost-efficient, environmentally sensitive,
sustainable transport systems and services for all stake-holder
groups
To provide structures that can promote and deliver sustainable,
efficient transport systems and services meeting the needs of all
stake-holder groups
To promote user pays principles whilst increasing transport
affordability and accessibility to the poor and ensuring cost efficient
freight transport
To maximise utility of existing assets that support effective, efficient
sustainable transport
7.11
Implementation Timing
Short
Med
Long
Term
Term
Term
√
√
√
√
√
Transport Demand Management
7.5
eThekwini’s Transport Management Strategy
The ETA’s TDM strategy comprises a series of projects defined within the
context of various possible measures that could be implemented in the
short, medium and long terms (section 7.4).
Although the transportation planning process has identified a range of
short to long term projects in the various aspects of public and private
transportation, the ETA’s TDM strategy focuses on those projects that
should be initiated in the short term period, years 1 to 5. These form a
part of the prioritised implementation programme in the ITP.
The following projects comprise the TDM strategy for the eThekwini area:
1
The current contract for upgrade and expansion of the area traffic
control system (ATC) which provides real time traffic control in
central Durban. This system optimises traffic flows and reduces
congestion and related pollution.
2
A parking investigation to consider more efficient use of available
parking facilities and develop a comprehensive parking
revenue/cost recovery programme, taking into consideration the
cost of providing and maintaining facilities.
Parking
investigation
3
An investigation to identify congestion locations along the public
transport routes and evaluation of possible options for bypassing
the location or introducing some form of PT priority measure to
overcome the congestion or reduce the impact thereof.
PT congestion
alleviation
4
A pilot study for introducing and monitoring the impact of upgraded
public transport security at selected rank (s).
Pilot: PT rank
security
5
Prioritised public transport distribution system in the CBD. This
system introduced on a phased basis would interface with the
various major bus, rail and taxi services to the CBD. Public
transport priority lanes and priority intersection control using
SCOOT would also be accompanied by CCTV linked monitoring
and enforcement.
6
A pilot project for a cycling ‘system’ from Clermont to New
Germany/Pinetown comprising cycle paths/routes and terminal
infrastructure.
eThekwini’s Public Transport Plan
7.12
ATC
upgrade
PT priority
distribution in
the CBD
Cycle
‘system’ pilot
Transport Demand Management
7
Phased implementation of taxi and bus rank rationalisation in
Durban’s Warwick Avenue area; developing towards a partial or
total consolidation of bus and taxi activity in a multi-level Berea
station transport interchange.
8
Modernisation of bus/taxi fleet. Modern reliable buses are required
in all new bus service contracts. In future expanded areas of the
public transport system will be provided in terms of service
contracts. As this happens not only buses but also any taxis
providing service within these contracts will have to meet certain
fleet standard specifications. Apart from the requirement of
contracts for modern, safe equipment the implementation of the
Taxi Re-capitalisation programme will result in the progressive
modernisation of the taxi fleet. These processes will undoubtedly
result in fleet modernisation on an ongoing basis commencing in
the short term.
9
Rail system and service upgrade.
This is at the heart of
eThekwini’s public transport strategy and could extend from the
short term through to the long term programme. As a part of the
TDM strategy the ETA will continue to pursue investment in the rail
system and infrastructure either through national funding or some
form of concession agreement.
10 Co-ordinated, integrated feeder services to rail. This will consist of
a pilot project to initiate a taxi and/or bus feeder service to rail
combined with integrated ticketing and appropriate station upgrade
if required. This pilot location will be selected from one of the
following:-
Warwick Ave
taxi/bus rank
rationalisation
Bus/taxi fleet
modernisation
Rail system
upgrade
Integrated
feeders to rail
• one of the Umlazi stations
• KwaMashu/ Ntuzuma to
one of the KwaMashu
spur line stations
• Maydon Wharf/Bayhead/
Island View to Congella
station
• Jacobs/Clairwood to
Montclair station
• Prospecton to Isipingo station
eThekwini’s Public Transport Plan
7.13
Transport Demand Management
11 Although not a project as such, policy has been developed for this
first ITP giving priority to public transport in the planning and
development of the transportation system and in support of
appropriate TDM measures to minimise the negative impact of
private transport on the environment.
Policy
supporting
public
transport
Completion of pilot projects will undoubtedly give rise to other projects with
some of these being incorporated into the TDM strategy at a later stage in
the planning process.
7.6
Congestion Monitoring
Whilst various types of TDM measures are effective in reducing
congestion, questions arise around the level at which congestion is
unacceptable possibly requiring various types of TDM measures or further
investment in public transport or roads infrastructure.
Further questions related to the above are:¾ What criteria or indices should be used to measure
congestion?
¾ What levels of congestion should be acceptable for
different parts of the city (urban/rural) taking into
consideration dependency on internal road freight
movements?
Investigation
of current
local practice
and o/s
¾ What should targets and
related policy be in
regard to congestion for
these various conditions
including issues related
to greenhouse gases and
carbon emissions?
These questions formed the basis of an investigation conducted by
eThekwini Municipality of international and South African practice.
Whilst various criteria were identified in research and by respondents, no
benchmark values were given with the exception of one major city in South
Africa identifying level of service (LOS) D as their basis for considering an
upgrade of existing facilities.
eThekwini’s Public Transport Plan
7.14
Transport Demand Management
eThekwini Municipality currently conduct a regular comprehensive
programme of traffic counts as well as travel time surveys. Using this data
the Municipality monitors level of service (LOS), volume/capacity (V/C)
and travel time on different elements of the major road network and to a
lesser degree the minor road system. Currently eThekwini also use LOS
D as the basis for an acceptable level of congestion in peak conditions.
eThekwini’s Public Transport Plan
7.15
eThekwini
approach
Transport Demand Management
8
THE ETA’S PUBLIC TRANSPORT STRATEGY
8.1
Background
Against the background of seriously escalating public transport subsidies
country-wide, associated with decreasing levels of public transport services
standards, the National Department of Transport (NDOT) in 1999 initiated
“the Fundamental Restructuring of Durban’s Public Transport System” as a
flagship project. This project, in line with national policy, was aimed at
developing the most cost effective public transport system strategy for the
existing and future metropolitan area, providing a quality system with levels
of service similar to or better than current service levels. An associated
spatial strategy to support public transport was developed.
This section of the Public Transport Plan describes:¾ key characteristics and issues around the existing public
transport system
¾ alternative system strategies investigated
¾ the recommended system and modal strategy
The Operating Licence Strategy (OLS) needed to give effect to the
implementation of the recommended system is discussed in Section 9.
8.2
The Existing Public Transport System
8.2.1
System Description
Figure 8.1 shows the existing system of public transport nodes and
services.
The commuter rail system comprises the following:¾ A north-south line following the coast from beyond the limits of
the metro area to both the north and south.
Rail system
¾ The mainline into the hinterland which carries commuters within
the metropolitan area.
¾ A circuitous line between Pinetown CBD and Rossburgh Station
on the north-south line.
eThekwini’s Public Transport Plan
8.1
Restructuring of eThekwini’s Public Transport System
Tongaat
Verulam
Future
Bridge
City
N2
Phoenix
Inanda
Fredville
Umhlanga
Molweni
Ntuzuma
N3
Bothas
Hill
KwaMashu
KwaDabeka
Pinetown
Hillcrest
CBD
New
Germany
N
Mpumalanga
Westville
Berea
Durban
CBD
Mariannhill
Point
Major Public Transport Nodes
Harbor
Other Significant PT Nodes
Chatsworth
Bluff
Nodes at Rail Stations along N-S Rail Corridor
Umlazi
Existing Rail Commuter Lines
Folweni
Isipingo
Major Road-based Public Transport Routes
Prospecton
N2
KwaMakutha
eThekwini Transport Authority - Integrated Transport Plan 2004/2005
Figure 8.1: Existing Public Transport Nodes and Services
¾ Three spur lines into the major residential areas of Umlazi,
Chatsworth, and KwaMashu.
¾ A spur line along the south side of the harbour to the lower Bluff
which is largely undeveloped.
¾ A section of single line adjacent to North Coast Road, in parallel
to the main north-south line.
The taxi and bus major route system provides extensive coverage
throughout the metro area including services parallel to and in direct
competition with most of the rail services. In most locations the bus and
taxi services follow similar routes except in the Outer West, west of
Pinetown. In these areas most of the routes are taxi routes with limited or
no bus service, with the exception of bus service to Mpumalanga from
Durban and the Pinetown areas.
Bus/taxi
system
The metropolitan area has four major public transport nodes with a number
of other nodes of local significance. The major nodes are located at:-
Major nodes
along N-S
corridor
¾
¾
¾
¾
Isipingo in the south
Durban CBD
Bridge City to the north
Pinetown to the west
Isipingo in the south and Bridge City (which is a key future transport node
in the north) define the limits of the major north-south coastal public
transport corridor. Durban CBD located in the middle of this corridor is a
major attractor for trips from both the north and the south.
The last major node is Pinetown Central which is largely a hub for services
from the Outer West and industrial and residential areas to the south of
Pinetown central and to the north-east.
Pinetown node
Although Pinetown is a major node it is not connected by a major corridor
to any other node of significance. Consequently, the only corridor carrying
sufficiently high volumes of commuters to be defined as major public
transport corridor is the north-south coastal corridor between Isipingo in the
south and Bridge City in the north.
eThekwini’s Public Transport Plan
8.3
Restructuring of eThekwini’s Public Transport System
Tongaat
Verulam
Future
Bridge
City
N2
Phoenix
Inanda
Fredville
Umhlanga
Molweni
Ntuzuma
N3
Bothas
Hill
KwaMashu
KwaDabeka
Pinetown
Hillcrest
CBD
New
Germany
N
Mpumalanga
Westville
Berea
Durban
CBD
Mariannhill
Point
Public Transport Corridor
Harbor
Chatsworth
Bluff
Major Public Transport Nodes
Rail Service Inside Corridor – Existing
Umlazi
Rail Service Inside Corridor – Future
Rail Service Outside Corridor
Folweni
Isipingo
Major Bus/Taxi Routes Inside Corridor
Prospecton
Major Bus/Taxi Routes Outside Corridor
N2
KwaMakutha
eThekwini Transport Authority - Integrated Transport Plan 2004/2005
Figure 8.2:
Proposed Public Transport System Strategy
with North-South Corridor
Figure 8.2:
Proposed Public Transport System Strategy
with North-South Corridor
Other public transport nodes of significance include:¾ In the south
- Prospecton, an industrial area immediately south of the
Isipingo node
Other
significant
nodes
¾ In the west
- Hillcrest which is becoming a sub-regional centre
¾ In the north
- Phoenix town centre
- Verulam with a significant concentration of bus and taxi
activity
- Tongaat also with a major concentration of bus and taxi
activity
- the developing node around the Umhlanga town centre
8.2.2
Rail System, Service Characteristics and Issues
The existing rail system is characterised by decreasing levels of service
and high levels of subsidy support, which is currently provided by the
National Department of Transport. Rolling stock is dilapidated and train
sets that become unsafe will have to be removed from service. Parts of the
signal system are antiquated and raise concerns over reliability of efficient
operations.
Declining rail
system
Many of the eight rail lines operate with very low passenger loads and are
deemed to be economically inefficient. Clearly discontinuation of service
on such lines would only take place based on the outcome of a full
economic evaluation. However for analytical purposes, in terms of the
proposed strategies, assumptions have been made in the public transport
plan on the closure of some of these lines.
Rail line
closures
The major issue around rail is the real possibility of a shut down of all parts
of the system unless there is a major investment in the system either
through existing institutional structures or through some form of
concession.
8.2.3
Bus System, Service Characteristics and Issues
The existing bus service on a system comprising some 1 400 unidirectional routes is provided by approximately 200 operators in a mix of
subsidised contracts and unsubsidised services provided in terms of the
operator route permits.
eThekwini’s Public Transport Plan
8.5
Restructuring of eThekwini’s Public Transport System
Currently there are three tendered, one negotiated and two interim bus
contracts covering approximately 70% of the metropolitan route system.
Some 170 unsubsidised bus operators in thirteen associations along with
approximately 20 independent operators provide service on the remaining
30% of the route system. At this time there are no unsubsidised
commercial contracts.
Over recent years efforts to contain rapidly escalating subsidy
accompanied by reducing levels of service have been addressed in part by
formal subsidised bus contracts. The most recent of these is the
privatisation of Durban Transport which accounts for over one third of the
bus fleet in the metro area operating on approximately half of the bus
routes.
Bus service
issues
Notwithstanding these changes peak passenger load factors on many bus
trips are low. Outside of subsidised service contracts operators
experiencing decreasing ridership and profit margins are unable to upgrade
their fleet and struggle to maintain service levels with aging vehicles.
Major issues around the bus system and service are that bus and rail
services operate in direct competition; unsubsidised bus services are
deteriorating and many bus trips operate with low passenger loads even in
peak periods.
8.2.4
Taxi System and Service Characteristics and Issues
There are approximately 120 taxi associations serving the metro area and
on completion of the provincial taxi data base an accurate figure for the
number of operators will also be known. Data on number of routes and
peak direction passenger loading is documented in the CPTR tabulations.
Generally the taxi industry operates
in direct competition with bus and rail
service throughout the metro area.
Peak passenger loads on most
routes are high although not always
over the full extent of the journey. In
some areas indications are that
over-trading
has
resulted
in
associations operating with split schedules whereby different operators
provide the service on different days of the week. This has the effect of
keeping passenger loading at a reasonably high level.
eThekwini’s Public Transport Plan
8.6
Taxi service
issues
Restructuring of eThekwini’s Public Transport System
Notwithstanding the high passenger loads the unsubsidised taxi industry
does not generate profit margins that support fleet replacement. Most of the
fleet is old and breakdowns are frequent. Safety is a major concern.
In a number of areas the taxi associations ‘roster’ their operators who in
terms of some form of schedule operate at different times on a combination
of lucrative routes and low profit routes. On this basis association members
are assured of their fair share of the potential fare revenue.
Issues around the taxi system and service relate to the overall deterioration
of the taxi fleet, resulting in reduced safety and reliability of service, overtrading in some areas which results in below average profit levels and
association competition for new routes or service which often leads to
aggressive confrontation and violence. Ongoing competition with
subsidised public transport services also reduces the profitability of
subsidised services (bus and rail). This causes pressure for increased
subsidy in future bus contracts.
8.2.5
Combined System Issues
Overall the public transport system is economically inefficient with many
services in direct competition with each other resulting in unprofitable rail
and bus trips and in some instances taxi trips.
Generally, apart from subsidised bus contracts, the rail, bus and taxi
service fleet is in an advanced stage of deterioration with no signs of
significant investment in new fleet in the short term future. Consequently,
service levels are dropping and public transport patronage is reducing.
PT system
issues
Against this background proposals have been developed to rationalise and
restructure the public transport system and services in order to address the
fundamental issues highlighted in this section. The systems tested and the
adopted recommended system are described in the following section.
8.3
Public Transport System Proposals
8.3.1
Introduction
This section, against the background of issues highlighted in Section 8.2,
sets out the public transport proposals for a system strategy which
rationalises and restructures the existing inefficient supply-driven system, in
terms of the policy guidelines documented in Section 3 of this Plan.
The focus is on providing a passenger-orientated, demand-driven,
economically efficient and integrated system.
eThekwini’s Public Transport Plan
8.7
Restructuring of eThekwini’s Public Transport System
This section describes the recommended public transport system which
has an emphasis on the major north-south coastal corridor.
This corridor is the dominant feature of the public transport system best
serving the development in the metropolitan area. It is supported by a
number of spatial strategies which were defined by some of the
departments of the City.
8.3.2
Alternative Public Transport Systems Tested
The process of determining a recommended public transport system for the
metro area included the testing of ten alternative strategies. These were
based on making best use of one of the three principle modes of rail, bus
and taxi. The bus mode included use of articulated bus, the new 35 seater
midibus from the national governments proposed Recapitalisation
Programme, as well as the standard bus. The taxi services were based on
the new 18 seater minibus taxi proposed within the same programme.
Each alternative was a variation on one of the main mode themes. In each
case the principle mode was made to work as effectively as possible with
an optimised support system from the other modes. In some alternatives
the services were planned to operate on dedicated right-of-way in the most
heavily trafficked north-south coastal corridor. In that corridor various
options existed between the use of rail and articulated buses operating on
dedicated right-of-way (busway) within the existing rail reserve. These
services were supported by tailored feeder services with different mode
options.
Ten strategies
tested
The system serving other corridors of lesser demand was defined either in
terms of rail service on existing rail lines or some combination of bus and
taxi on the road system. In the alternative with a busway in the north-south
corridor bus service could operate with articulated buses on routes that
extended beyond the busway, depending on the location and demand.
Feeder services included use of either taxis or midibuses, depending on
demand.
For purposes of the strategic analysis, other areas of the public transport
system, outside of significant demand corridors, were based on use of the
minibus taxis and standard buses, although at the level of detail of service
planning, service options would also consider midibus and articulated bus
modes.
eThekwini’s Public Transport Plan
8.8
Restructuring of eThekwini’s Public Transport System
The alternatives tested fit within one of three groups:1.
The existing system of rail, bus and taxi routes with services
optimised.
2.
Systems with no rail service and an emphasis on bus with a
busway operating in the heavily trafficked north-south
coastal corridor.
3.
Systems with an emphasis on rail, supported by feeder
services.
Alternative PT
systems tested
In developing this wide spectrum of alternatives, the intent was to explore a
range of alternatives from a limited intervention solution through to extreme
options.
8.3.3
The Proposed System
The proposed public transport system for the eThekwini metropolitan area
(Figure 8.2) is based on:¾ Use of the most appropriate
public transport modes for
service effectiveness and
cost efficiency in each part
of the system.
This interprets into rail
providing service in the
heavy demand north-south coastal corridor between the
transport interchange node at Bridge City in the north and a
similar node at Isipingo in the south. The implication of this
strategy would be to extend the commuter rail line from Duff’s
Road Station to Bridge City a distance of approximately three
kilometres. Existing spur lines from the north-south line into the
residential areas of Umlazi in the south and KwaMashu in the
north would form a part of this corridor.
Proposed PT
system
¾ Relocation of road-based public transport services in direct
competition with rail in the high volume north-south coastal
corridor.
eThekwini’s Public Transport Plan
8.9
Restructuring of eThekwini’s Public Transport System
This interprets into a number of subsidised bus as well as
unsubsidised bus and taxi services being relocated or removed
from the system, in a phased process using procedures from the
City’s policy framework.
¾
Where appropriate, the retention/upgrading of rail supported by
integrated feeder systems, in the lower demand corridors, where
service and cost benefit analyses justify such systems.
¾
An attempt using a pilot project to attract ridership back onto the
Chatsworth line which is currently under-utilised but has high
potential for ridership.
Chatsworth rail
pilot
¾ A combination of bus and taxi modes in other parts of the public
transport system with priority for these services where
appropriate.
¾ New or upgraded infrastructure where needed in the system.
¾ Support for nodal development through the integrated design of
major transport transfer/interchanges with land use development
at the nodes.
¾ Support for densification along existing and potential future
corridors through development of high levels of accessibility to
public transport within the corridors.
¾ Phased development of universally
including special needs groups.
accessible
corridors
Figure 8.3 indicates the location of the following feeder/distributor service
areas which will be developed to operate in support of the north-south rail
corridor:¾ In the south, Folweni and KwaMakutha feeding to the Isipingo
transport node with a comprehensive feeder network in Umlazi
to the various rail stations along the Umlazi line.
¾ In the north, a feeder system in the Inanda area operating
to/from Bridge City which would also be the focal point of a
feeder system into parts of the Phoenix area on the north side of
the KwaMashu Highway (M25). A comprehensive feeder service
in the Ntuzuma and KwaMashu areas would operate to/from
stations along the KwaMashu rail spur (predominantly
KwaMashu station) and to a limited degree for parts of the area
to Bridge City.
eThekwini’s Public Transport Plan
8.10
Feeder
services
supporting rail
Restructuring of eThekwini’s Public Transport System
¾ In the Central Durban area, a CBD distribution system providing
easy access to Berea and Durban stations. This distribution
system could be extended to the Berea area.
¾ South of Durban CBD in the South Durban Basin (SDB) a
number of feeder/distribution systems integrated with the rail
service providing convenient access into this intensely
industrialised area extending from the airport north to Bayhead.
Collectively the walk-in catchment area to the north-south rail
system together with the service area coverage provided by the
various feeder/distribution taxi/bus support system, defines the
north-south public transport corridor service area.
8.4
Modal Strategies
8.4.1
Introduction
The proposed public transport strategies required around each mode
forming part of the system are addressed below under the major mode
categories of rail, bus and mini-bus taxi.
8.4.2
Rail Modal Strategy
The broad modal strategy for rail is the following:¾ Focus on a rail-based system solution in the north-south
transport corridor between Isipingo rail station in the south and
Bridge City (a future major rail/bus/taxi mode interchange on the
north); along with spur lines into the heavily populated area of
Umlazi in the south and KwaMashu/Ntuzuma in the north.
Rail strategy
¾ Build a new spur line from Duff’s Road station to Bridge City
which will serve as a major transfer point onto rail from bus and
taxi feeder services into the residential areas of KwaMashu,
Inanda and Phoenix.
¾ Initiate a pilot project on the Chatsworth rail line to attract
commuters back onto rail by implementing security services and
security infrastructure at rail stations.
eThekwini’s Public Transport Plan
8.11
Restructuring of eThekwini’s Public Transport System
To achieve the above requires heavy investment in recapitalising the
rapidly deteriorating rail fleet, replacing the antiquated signal system in
some locations and upgrading various stations within the system. In
addition capital is required for the new spur line to Bridge City.
Rail fleet recapitalisation
Apart from the above, bus and taxi strategies are required which will give
support to the rail system in the potential catchment area of rail services.
Such strategies will need to eliminate destructive competition with the
primary mode of rail. These are discussed below.
Concession
eThekwini’s Public Transport Plan
8.12
Spur line to
Bridge City
Restructuring of eThekwini’s Public Transport System
Verulam
Future
Bridge
City
N2
Phoenix
Inanda
Fredville
Umhlanga
Molweni
Ntuzuma
N3
Bothas
Hill
KwaMashu
KwaDabeka
Pinetown
Hillcrest
CBD
New
Germany
N
Mpumalanga
Westville
Berea
Durban
CBD
Mariannhill
Point
Harbor
Chatsworth
Bluff
Southern Industrial
Basin
Umlazi
Folweni
Isipingo
Prospecton
N2
KwaMakutha
Bus/Taxi Feeder/Distributor Service Areas in
Support of N-S Rail Corridor
Proposed Rail Commuter Line
Existing Rail Commuter Lines
Major Road-based Public Transport Routes
Thekwini Transport Authority - Integrated Transport Plan 2004/2005
Figure 8.3:
Feeder Distributor Service Areas in
Support of North-South Rail Corridor
Figure 8.3:
Feeder Distributor Service Areas in
Support of North-South Rail Corridor
8.4.3
Bus Modal Strategy
The broad modal strategy for bus is contingent upon a firm commitment to
a concession or alternative funding strategy for rail which will ensure the
potential to deliver the rail strategy within a realistic time-frame. The bus
modal strategy is the following¾ removal of services in competition with rail in the north-south
coastal corridor.
¾ phased introduction of bus contracts,
subsidised, taking into consideration:-
commercial
and
use of the most appropriate bus mode (standard or midibus)
for effective use of capacity and high standards of service.
consolidation of uneconomic trips, with allocation of trips to
minibus taxi where warranted by low passenger loading or
service frequency.
upgrade of vehicles to service contract standards.
Bus strategy
Although certain levels of change can be implemented in existing bus
contracts, fundamental change can only be effected through new bus
contracts. Most existing contracts are for four to five years and many were
renewed in 2004. Privatisation of Durban Transport was effected in 2003
on a seven year contract
Bus contracts
-
-
8.4.4
Minibus Taxi Modal Strategy
The modal strategy around the minibus taxi is also contingent upon the
successful development of the rail strategy and the Taxi Recapitalisation
Programme. It includes the following:¾
rationalisation of taxi services in direct competition with rail or
bus contracts.
Taxi strategy
¾
phased
introduction
of
commercial or subsidised
taxi contracts.
¾
regulation
of
the
taxi
industry through contracts as well as a Quality Service Charter
supported by the taxi industry.
eThekwini’s Public Transport Plan
8.14
Restructuring of eThekwini’s Public Transport System
¾
upgrade of vehicles to contract standards, possibly through the
national taxi re-capitalisation programme or some alternative.
¾
empowerment and promotion of the taxi industry to form
consortia to tender on bus as well as taxi contracts.
Clearly the timing of implementation of the taxi modal strategy depends on
a number of factors apart from the rail strategy. The issue of compensation
for removal of licences needs to be resolved at national and provincial
levels. The preferred alternative is to reposition a route or service. This
also requires consultation and negotiation.
It is also important that opportunities are created for minibus taxi operators
who are affected by the restructuring of the public transport system to enter
into contracts using other modes of public transport.
8.5
Public Transport System and Supporting Land Use Strategies
8.5.1
Introduction
Defining the public transport system in terms of
major transport nodes and corridors helps to
identify in geographic terms the areas that require
integration between transport and the land use it
serves. The policy of support for public transport
through densification along established corridors
and attraction of development to significant
transport nodes needs to be structured in terms of
development strategies which recognise this
relationship.
As described in section 8.3.3 the transport strategy not only identifies a
public transport system of nodes and corridors but a spatial strategy which
supports such a system.
8.5.2
Public Transport Nodes and Corridors
As shown in the IDP the City has identified a High Priority Public Transport
Network (HPPTN). As shown in Figure 8.4, this network comprises a
number of sections, some with sufficient public transport demand to be
defined as a ‘public transport corridor’, others with a lower level of demand
that is typical of a combination of routes that would not qualify as a corridor
but are nevertheless key public transport routes.
eThekwini’s Public Transport Plan
8.15
HPPTN
Restructuring of eThekwini’s Public Transport System
Verulam
N2
Phoenix
Future
Bridge City
Inanda
Fredville
Umhlanga
Molweni
Ntuzuma
N3
Bothas
Hill
KwaMashu
KwaDabeka
Hillcrest
Pinetown
CBD
N
New
Germany
Mpumalanga
Westville
Berea
Durban
CBD
Point
Mariannhill
Harbor
Chatsworth
Bluff
Umlazi
North-South Public Transport Corridor
Key Public Transport Routes
Major Transport Nodes along N-S Corridor
& Significant Nodes along Major Routes
Existing Rail Commuter Lines
Future Rail Commuter Line
Folweni
Isipingo
Prospecton
Major Road-based Public Transport Routes
KwaMakutha
eThekwini Transport Authority - Integrated Transport Plan 2004/2005
Figure 8.4: N-S Corridor & Significant Public Transport Route
Figure 8.4: N-S Corridor & Significant
Public Transport Routes
The north-south sections of the system between Mobeni in the south and
Bridge City in the north together with the section into Umlazi are the only
parts of the system with adequate demand to be defined as a corridor.
N-S public
transport
corridor
These sections carry between 25 000 and 30 000 bi-directional passengers
on all public transport modes. Significant transport nodes along this corridor
include:¾
¾
¾
¾
¾
Bridge City
Durban CBD
South Durban Basin
Mobeni
Isipingo
Although the demand along the section of the priority network between
Isipingo and Mobeni is considerably less than on sections to the north, the
location of Isipingo as a major transport node logically extends the northsouth corridor through to this node.
Other segments of the priority network link the major regional transport
node in Pinetown to the South Durban Basin via the M1 and Durban CBD
via the M13. Although there is significant demand along these segments, it
is relatively light (<10 000 bi-directional peak hour person trips), insufficient
to define such routes as corridors. Similarly the demand along the M5,
connecting Malvern Town Centre to Durban CBD and the M10 connecting
Cato Manor to the CBD is relatively light.
Key public
transport
routes
Notwithstanding, these key public transport routes, are important segments
of the priority public transport network which where possible should be
supported by appropriate land use development.
8.5.3
Spatial Strategies in Support of the Priority Public Transport Network
Spatial strategies to support public transport have been developed and are
documented in a report entitled:“A Spatial Strategy in Support of the High Priority Public
Transport Network - March 2002”
The following table has been taken from this document with modifications
related to changes that have occurred over the past several years.
eThekwini’s Public Transport Plan
8.17
Restructuring of eThekwini’s Public Transport System
Various land use strategies have been identified for the combined high
priority public transport areas of the network and the non-priority area.
Strategies for the non-priority area relate to interventions needed to
discourage major employment and trip generating development while those
in priority areas are focused on sustaining and developing the priority
network.
Spatial
strategies
supporting PT
Each of the strategies apply to one or other of five areas within the network;
these being:High Priority Network Area:1.
The Primary Node comprising the CBD and the industrial harbour
area to the south
2.
Outer nodes of which Pinetown is the only major node
3.
The north-south public transport corridor
4.
Key public transport routes
Low-Priority Network Area:5.
Beyond the Priority Network
OBJECTIVES
Protect the current
public transport
ridership on the HPPTN
STRATEGIES
AREAS OF APPLICATION
Strategy 1:
Protect existing employment
opportunities
The R102 route from Isipingo to
KwaMashu, the CBD and the
South Durban Basin (SDB)
Strategy 2:
Maintain the quality of high
value investment office retail,
residential and tourist areas
eThekwini’s Public Transport Plan
8.18
The CBD
Restructuring of eThekwini’s Public Transport System
OBJECTIVES
Protect the current
public transport
ridership on the HPPTN
STRATEGIES
AREAS OF APPLICATION
Strategy 3:
Discourage the development
of major employment
opportunities outside HPPTN
area
Increase public
transport ridership on
the HPPTN
Outside of the Urban Edge
Strategy 4:
Stimulate higher employment
and residential densities
Higher employment densities :- SDB
- R102 corridor
- CBD
Higher residential densities :- along full length of the
North-South corridor
- Pinetown Node
Strategy 5:
Renewal of areas around
major stations and modal
interchanges as high density
residential, office and retail
uses
Along North – South Corridor
and Pinetown node
Strategy 6:
Steer public sector investment North – South Corridor and
(schools, clinics, hospitals and Pinetown Node
police stations) towards nodes
on HPPTN
eThekwini’s Public Transport Plan
8.19
Restructuring of eThekwini’s Public Transport System
9
OPERATING LICENCE STRATEGY (OLS)
9.1
Purpose of the OLS
The OLS is developed from analysis of the CPTR data surveyed in
2003/2004.
The primary purposes of the OLS are:¾ to act as a framework for the eThekwini Transport Authority (ETA)
to give direction to the Operating Licence Board (OLB) on the
issuing/amendment or withdrawal of taxi or bus operating licences.
Purpose of
OLS
¾ to provide a tool for the ETA to implement the requirements of the
Public Transport Plan.
The documentation in this section of the ITP is supported by a separate
comprehensive analysis report.
9.2
General Principles
This section sets out key conditions for granting of an operating licence for
bus or minibus taxi operations. These conditions include some of the key
requirements set down in national legislation (NLTTA 2000) which the
provincial Operating Licence Board (OLB) will apply in reviewing
applications. As such these requirements/policies are also reflected in the
ETA’s policy.
Principles
The following policy relates to general principles that set the framework for
consideration and allocation of road-based public transport licences.
9.2.1
Licence Allocation Principle
Allocating new licences or required changes to existing is clearly the
responsibility of the Operating Licence Board (OLB). In the past the taxi
industry in some locations has attempted to control which associations
should be allocated licences for new service areas. This creates potential
for conflict and is counter-productive in the delivery of a properly
rationalised and restructured public transport system.
eThekwini Public Transport Plan
9.1
Operating Licence Strategy
Problems can also arise when public transport operators take the
viewpoint that they have a right to be allocated a licence.
Allocation of
licences
The fundamental principle which address this issue is:No. 1 The responsibility for determining the number of public
transport licences required vests with the Transport
Authority.
The current problems of over-trading in some areas and the need to
restructure and rationalise the public transport system and services will
necessitate a carefully structured programme of repositioning and in some
instances removal of existing licences.
Outstanding issue:
The ETA needs to be able to re-position operators in addressing
over-trading and under-trading in different areas as well as to
allocate licences in new service areas.
In order that such service changes do not introduce conflict with
those operators directly affected, or with those who perceive
themselves to be affected, a process must be developed which
adequately addresses these potential issues and any others that
could be associated with such changes.
New licences to new operators will not be issued except under exceptional
circumstances until such time as the problems of over-trading and the
need for re-positioning have been dealt with.
9.2.2
New
Licences
Licence Validity Period
In consideration of the validity period for new licence applications the ETA
will give due regard to:Assessment
of current/
future needs
for licencing
¾ Current and expected trends in utilisation of the route(s)
¾ The efficiency of the proposed services in meeting user needs
¾ Where applicable, in terms of planning recommendations for the
future public transport system, the likelihood that the particular
mode of public transport may be replaced by another mode
eThekwini Public Transport Plan
9.2
Operating Licence Strategy
¾ The likelihood that the public transport service may become the
subject of a commercial service contract or a subsidised service
contract
Policy in this regard is:No. 2 As per the requirements of the NLTTA 2000, no new
operating licence will be issued for a period longer than
five years, except where the licence is issued pursuant of a
permit allowed for in terms of provincial legislation, as in the
case of a seven year subsidised bus contract.
9.2.3
Licence validity
period
Transfer of Licence
The ETA’s policy in this regard is:No. 3 The ETA will not support applications for the transfer of an
operating licence from the holder of the operating licence to
another person, for which the holder of the operating
licence has been providing the service for less than a
period of one year.
Where transfers are permitted the first option for purchase
belongs to the ETA.
In the case of the taxi industry, the person to whom the operating
licence is transferred must be registered as a member of an
association or registered as a non-member. To avoid potential
conflict, the ETA will recommend that the person to whom the
operating licence is transferred belongs to the same taxi
association(s) as those operators that are currently operating on
the route.
9.2.4
Number of Taxi Routes per Licence
Outstanding Issue:
The system of route rotation where minibus taxis each have an opportunity
to operate on the more profitable routes within a set of routes is
problematic and needs to be addressed as part of a longer term licence
strategy.
eThekwini Public Transport Plan
9.3
Route rotation
Operating Licence Strategy
9.2.5
Preparation of Recommendations
Section 9.4 addresses the process of licence approval in respect of the
interaction of the Operating Licence Board and the ETA. Within this
context the ETA’s policy on the preparation of licence recommendations is
as follows:-
Preparation of
recommendations
No. 4 The ETA will make its recommendation and any
representations it considers fit, having due regard to the
Passenger Transport Plan and any other relevant
investigations carried out, and submit them to the OLB
within the required period.
The ETA’s recommendation will address:-
9.3
•
rank / holding areas availability at origin and
destination
•
preferred mode on route/corridor
•
utilisation of existing services
•
long term planning requirements
Conditions for Granting of Licences
The following policy relates to conditions that will need to be met for a
licence to be approved. All regulations within the Road Traffic Act (1996)
will need to be complied with and are not repeated in the PTP.
9.3.1
Person Qualifying for Operating Licence
In line with the requirements of the NLTTA 2000, ETA policy is:No. 5 Except on the conversion of a taxi permit to an operating
licence, no person has a right to be issued with an
operating licence. An operating licence in respect of a
minibus taxi type service may only be granted to a person
who is either:-
eThekwini Public Transport Plan
a member of a provisionally or fully registered
association
a registered non-member
9.4
Registered
membership
for minibus
taxi licence
Operating Licence Strategy
-
No. 6
a person who has applied for registration as a nonmember and has been granted a certificate
contemplated in section 113(2) of the NLTTA
Applicants for bus and minibus taxi licences must show
proof of or the ability to secure passenger liability insurance
from a recognised insurer.
Passenger
insurance
Operating licences can only be uplifted on presentation of proof of
passenger liability cover.
The operating licence will become invalid if at any stage passenger
liability cover is terminated and it is the responsibility of the
operator to immediately inform the OLB of termination of cover.
9.3.2
Membership per Route
No.7
9.3.3
A person applying for a new minibus taxi operating licence,
on an existing route, must belong to the same
association(s) as the operators currently providing service
on that route.
Vehicle Standards and Equipment
The following policies apply to vehicle standards for approval of a
licence, replacement of a vehicle and requirements for special
equipment.
SABS / SANS
vehicle standards
No. 8
All vehicles must comply with SABS or SANS standards
and
specifications.
No. 9
Where the holder of an operating licence wishes to replace
the vehicle that is specified in the operating licence with
another vehicle with the same passenger capacity, the
holder must apply to the Board for approval on the basis
that the replacing vehicle meets all requirements in the
original licence and the quality of service is not affected.
No.10
Special equipment (eg. Special needs access) attached to
approval of a licence must be installed and operational
before commencement of service.
eThekwini Public Transport Plan
9.5
Vehicle
replacement
Special
equipment
Operating Licence Strategy
9.3.4
Access to Ranking
No.11 The granting of an operating licence is conditional upon the
necessary rank permits being obtained and annually
renewed and if a rank permit is not renewed the operator
must cease to operate on that route.
Ranking
facilities
The procedure for applying for a minibus taxi or metered
taxi rank permit can be found in the annexures available on
CD. An operating licence must state the authorised ranks or
terminals specific to the route on the licence. Other points
of picking up and setting down of passengers along routes
will only be permissible at points specifically designated by
the ETA
Where the need for public transport services is justified in
terms of user demand, but insufficient capacity exists at the
pick-up and drop-off points, support of the application will
be subject to there being available funding for
rationalisation or upgrading of the required facilities.
9.3.5
Access to Holding for Minibus Taxi Operators
No.12 It will be the responsibility of the minibus taxi licence
applicant to identify suitable holding space in a location
acceptable to the ETA.
9.3.6
Holding
Space
Service Levels for Minibus Taxi
No.13 Subject to other conditions being met the following
guidelines will apply to consideration of licence approvals
for services between defined origin-destinations:-
acceptance if demand 100% or more of existing
service capacity
-
possible acceptance dependent upon other
considerations if demand = 50 - 99% of capacity eg.
(i) pending addressing current issues of overtrading and the possible opportunities to re-position
selected services;
(ii) in CBD other criteria related to service
frequency/wait time may be used to determine need
eThekwini Public Transport Plan
9.6
Demand
criteria
Operating Licence Strategy
-
9.3.7
rejection if demand < 50% of capacity unless
offering a premium user-pays or special needs
service
Timetable and Fare Data
No. 14 Service timetable or frequency of service must be attached
to licence applications.
Timetable and
fare structure
No. 15 Special conditions regarding fares must be attached to
licence applications.
9.4
Licence Application and Approval Process
9.4.1
The Process
The approval process involves the Provincial Operating Licence Board
(OLB), the KZN Department of Transport and the eThekwini Transport
Authority.
In broad terms the process is as follows:-
Loca
¾ The applicant submits application to the OLB in terms of required
content and defined procedures;
¾ the OLB supported by the KZNDOT evaluates the application in
terms of the defined criteria detailed in KZNDOT’s document
‘Operating Licence Strategy’ for KZN.
Application
procedures
¾ if the application meets these criteria it is forwarded to the ETA with
support data for consideration and approval. These criteria include
inter alia:-
demonstrated need for service
demonstrated financial viability
fitting within the PTP
meeting legislated requirements for the applicant and vehicle
Licence
approval
process
¾ the ETA will make recommendation to the OLB for approval,
deferment or rejection based on their own assessment of the
application.
eThekwini Public Transport Plan
9.7
Operating Licence Strategy
Currently in terms of KZNDOT requirements the applicant is responsible
for demonstrating demand and need for service as well as the preparation
of a business plan demonstrating financial viability. The KZNDOT
requires the proposal to be submitted in terms of a proforma which has not
yet been finalised.
The ETA's position regarding the provision of relevant supply and demand
data is that the CPTR is the database. The relevancy of this database will
be maintained on the basis of selective key counts and observations only,
on an annual basis, with a full survey programme being conducted at an
interval yet to be determined, but possibly every five years. Further, the
ETA deems this data set to be suitably accurate to make valid
recommendations on all applications.
9.4.2
CPTR as data
source for
supply/
demand
The ETA's Administrative Structure
The review of licence applications received from the KZNDOT will be
managed by the structure shown in Figure 9.1. This group with their
supporting staff will be able to evaluate an application from any aspect of
current supply, demand, as well as problems and issues within the context
of current and future system needs.
Chair: Deputy Head
Public Transport
Strategic
Transportation
Planning Rep
Public Transport
Services
Metro Police
Rep
Public Transport
Infrastructure
Figure 9.1: ETA Licence Application Adjudication Structure
9.5
Public Transport Enforcement Strategy
Public transport enforcement is a specialised area of law enforcement.
The eThekwini Transport Authority has entered into a service agreement
with the eThekwini Metropolitan Police Service for this purpose. In terms
of this agreement the police services provide a dedicated force for
enforcement which is directly accountable to the ETA in terms of the
Service Agreement, contained in the annexures on CD.
eThekwini Public Transport Plan
9.8
Service
agreement
Operating Licence Strategy
In terms of this agreement the police service referred to as the
Enforcement Agent will be responsible for:¾ On the ground regulation of operators providing public transport
services;
¾ Monitoring and regulating the conduct of operators and drivers of
public transport services, ensuring compliance with the Public
Transport Operational Code prescribed by the MEC for Transport
in KZN in April 2001;
Service
agreement
functions
¾ Enforcement of municipal by laws associated with the operation of
public transport services including access to and use of public
transport facilities such as ranks, holding areas, bus stops, lay
byes, etc.
¾ Enforcement of quality control and safety aspects associated with
the operation of public transport vehicles in terms of the National
Road Traffic Act and relevant regulations.
In support of the above the development of a Quality Service Charter and
Passenger Service Charter (as referred to in Section 3 - Broad Public
Transport Policy) will also integrate into the enforcement strategy
framework.
9.6
Quality Service
and Passenger
Service
Charters
Operating Licence Strategy Analysis - Parameters and Criteria
Full analysis of the CPTR and the preparation of the OLS are contained in
the Operating Licence Strategy available in the annexures on CD,
In evaluating PT system performance there were several parameters for
which values were required, related to individual bus and taxi routes in the
system; these being:-
OLS analysis
parameters &
criteria
¾ Utilisation rate (based on seated capacity for taxi, seated &
standing for bus)
¾ Passenger volume
¾ Frequency/headway and waiting time
¾ Fleet factor with average speed and turnaround time
In analysing route performance for each survey period, it is the peak hour
for each route which is critical. Parameter values for the morning or
afternoon peak hour were therefore used in the analysis.
eThekwini Public Transport Plan
9.9
Operating Licence Strategy
The following sets out the values and considerations used for each of the
above in preparing the OLS:¾ Utilisation Rate (UR)
• Bus under-utilisation -
UR < 40%
• Bus over-utilisation
UR > 100%
-
• Taxi under-utilisation -
UR < 50%
• Taxi over-utilisation
UR > 99%
-
Utilisation
rate
The differences by mode are due to buses carrying standees
and to taxis usually waiting until they are full before departing.
¾ Passenger Volume
Hourly volume was the primary determinant in considering the
most appropriate mode, conditioned by minimum desirable
frequency. In the interests of minimising changes of mode, the
volume threshold for recommending smaller vehicles on bus
routes was made lower than the threshold for larger vehicles on
taxi routes, as shown in the following table.
Passenger
volumes
Passengers/Hour by Vehicle Type
Route
Mode
Bus
Taxi
Route
Passengers/hr
(major direction)
< 100
100 - 200
> 200
< 300
300-500
> 500
Recommended Vehicle
Capacity
Type
16/18
35
80-100
16/18
35
80-100
Taxi
Midibus
Standard Bus
Taxi
Midibus
Standard Bus
¾ Frequency/Headway and Waiting Time
These factors are related in theory but not always in practice.
Allowing for extraordinary circumstances in the analysis, for
general purposes in the peak hour, a 15 minute wait time was
adopted as the threshold between acceptable and poor level of
service. This translates into desirable maximum headway of 20
minutes or 3 vehicles/hour. The values in the following table
show the frequency/headway/waiting time values that are applied
in considering the most appropriate mode.
eThekwini Public Transport Plan
9.10
Frequency/
headway/
waiting time
Operating Licence Strategy
Route
Mode
Route
Pass/hr
Vehicle
Type
Frequency
(Trips/hr)
Headway
(minutes)
Waiting
Time
(minutes)
Bus
< 100
100 - 200
> 200
Taxi
Midibus
Standard Bus
up to 6
3 to 6
3 or more
down to 10
10 to 20
20 or less
5 or more
5 to 15
up to 15
Taxi
< 300
300-500
> 500
Taxi
Midibus
Standard Bus
up to 20
9 to 15
6 or more
down to 3
4 to 7
10 or less
3 or more
3 to 6
up to 6
In framing recommendations, the target frequency was considered
to be 3 vehicles per hour or more when considering vehicle types.
¾ Fleet Factor (FF)
FF is a route related parameter, which is an indication of the
efficiency of fleet. It is the theoretical fleet size needed/actual
fleet to operate the route and for bus and taxi is based on the
route distance, an assumed average speed and layover time
(both controllable), the number of vehicle trips and the number of
unique registration numbers, average vehicle capacity and the
number of passengers. Assumed average speed was 30km/hour
and layover time 10 minutes. Low values of fleet factor represent
inefficient operation and high values more efficient operation.
The normal value ought to be 1.0 if the correct speed was
assumed. The threshold value for reasonable fleet use was
taken as 0.9, which was used, inter alia, in recommending
whether or not new taxi licences should be issued.
9.7
Fleet factor
Categories of Evaluation
Three categories of evaluation were carried out in preparing the OLS;
these being:¾ Corridor analysis of movements between significant residential
and employment areas.
¾ Individual
route
evaluation
of
performance
with
recommendations, including contracted bus services and routes
running through Pinetown CBD split for analysis purposes.
Categories of
OLS evaluation
¾ Taxi association evaluation to assist in consideration of
applications by an association not specifically for an individual
route.
eThekwini Public Transport Plan
9.11
Operating Licence Strategy
9.8
Analysis
As part of the analysis for preparation of the OLS utilisation of surveyed
bus and taxi services was summarised by operator/association (Annexure
A.1). Totals for the eThekwini area are shown in Table 9.1.
Table 9.1:
Mode
Bus
Bus
Taxi
Taxi
Total
9.8.1
Bus and Taxi Utilisation of Surveyed Routes (Peak Hour)
Time
Routes
Vehicle
Trips
Service
Cap
Passengers
Utilisation
Rate
AM
PM
AM
PM
697
467
565
449
2 178
1 489
996
7 389
5 316
15 190
128 056
85 503
111 787
80 546
405 892
94 232
63 790
94 494
78 116
330 632
74
75
85
97
81
Corridor Analysis
The corridor analysis focuses on the peak hour commuter movement
between 55 residential and 23 employment areas of significance which are
composed of groups or single traffic zones used in the metropolitan traffic
model. The major inter-area AM peak hour passenger movements greater
than 1000 are shown in Table 9.2. The following points are also worth
noting:¾ There are only seven employment areas that attract more than
1000 public transport passengers per hour from any of the
individual major residential areas.
¾ Four of these employment areas; Tongaat Central, Verulam
Central Isipingo and Hammarsdale only attract such volumes
from residential areas in close proximity to the employment areas.
Corridor
analysis
¾ Pinetown CBD is the only other
employment area apart from Durban
Central (Durban CBD and Point) which
attracts volumes of > 1000 passengers
per hour from remote residential
areas.
¾ Durban CBD attracts volumes of
>1000 passengers per hour from 21 of
the
residential
areas
located
throughout the Municipality.
eThekwini Public Transport Plan
9.12
Operating Licence Strategy
Table 9.2: AM Peak Hour Bus and Taxi Passengers (Volumes > 1000, to nearest hundred)
No
R01
R03
R04
R05
R07
R08
R09
R10
R11
R12
R16
R17
R20
R21
R23
R25
R27
R34
R38
R39
R40
R43
R46
R47
R48
R50
R53
Analysis Area
Tongaat Residential
Verulam Residential
Phoenix South
Phoenix North
Amaoti/Ohlange
Piesang River
Amatikwe/Goqokazi
Newtown A/Gwala’s House
Ntuzuma
Lindelani
Newlands West
Newlands East
Chesterville
Cato Manor
Berea North
Clare Estate
Clermont/KwaDabeka
Mpumalanga
St Wendolins/Klaarwater
Chatsworth West/Shallcross
Chatsworth East
Merewent
Umlazi North
Umlazi Central
Umlazi South
Folweni/Golokodo
Adams/Msahweni
E01
Tongaat
Central
E02
Verulam
Central
E08
Hammarsdale
E11
Pinetown
CBD
E15
Point
E16
Durban
CBD
E23
Isipingo
2 900
2 500
1800
2800
1200
1200
1500
5800
1100
1400
2600
2700
3800
1400
2200
1700
1800
3600
1100
1100
1900
1200
1500
1900
5000
1400
3700
1300
3300
1600
1600
9.13
eThekwini Public Transport Plan
Operating Licence Strategy
The OLS report shows corridor movements from each major residential
origin area to the 3 major trip transfer centres (Durban, Isipingo and
Pinetown) in the morning peak hour as well as the reverse movement from
the 3 areas in the afternoon peak hour. The overview sheets (example
Figure 9.2) include a table of inter-area service statistics by mode, a small
map showing the routes, a map showing band width arrows and
passenger totals along with a paragraph of comments.
The Durban CBD information for the afternoon peak is shown on the next
three pages. Information on the numerous destinations shown in the OLS
are grouped into 3 regions in the following table with the bus and taxi
routes plotted on the respective maps (Figure 9.3 and 9.4). The salient
feature of the two maps is the wide coverage of the metropolitan area by
Durban-based routes, both bus and taxi. It is also worth noting the high
utilisation levels for both bus and taxi services in the PM peak hour.
Table 9.3: Area to Area Corridor Service Analysis
Durban CBD to Major Employment and Residential Areas: PM Peak Hour
Destination
Area
Mode
No. of
Routes
Vehicle
Trips
Service
Capacity
Passengers
Utilisation
Rate
87
North
Bus
46
129
11891
10313
West
Bus
56
187
12357
8727
71
South
Sub-Total
Bus
44
146
113
429
10673
34921
8482
27522
79
79
No. of
Routes
Vehicle
Trips
Service
Capacity
Passengers
Utilisation
Rate
Destination
Area
Mode
North
Taxi
93
908
14012
13773
98
West
Taxi
47
793
11979
11754
98
South
Sub-Total
Taxi
50
190
767
2468
11550
37541
11343
36870
98
98
eThekwini Public Transport Plan
9.14
Operating Licence Strategy
Figure 9.2: Area to Area Corridor Services Analysis
R07 Amaoti/Ohlanga to Major Employment Areas: AM Peak Hour
Destination Area
Mode
E03
Umhlanga
Bus
No. of
Routes
2
E05
Hypermarket
Bus
1
E11
Pinetown CBD
Bus
2
2
183
150
82
E16
Durban CBD
Bus
1
2
181
150
83
E20
Mobeni
Bus
1
1
90
75
83
7
9
815
707
87
Vehicle
Trips
18
Service
Capacity
279
Passengers
Utilisation Rate
127
46
Sub-Total
Destination Area
Service
Capacity
181
Passengers
Utilisation Rate
150
83
2
180
182
101
E02
Verulam Central
Taxi
No. of
Routes
4
E03
Umhlanga
Taxi
2
8
120
55
46
E16
Durban CBD
Taxi
7
72
1149
992
86
13
98
1548
1174
76
Sub-Total
Mode
Vehicle
Trips
2
Comments
Total passengers some 1900/hr. Bus routes to
Umhlanga (29km) with good utilisation and fleet
factors, Hypermarket (32km) fully utilised with high
fleet factors, Pinetown (41km) fully utilised with high
fleet factor, Durban CBD (38km) with high utilisation
and fleet factor, and Mobeni (51km) with high
utilisation and fleet factor. The Amaoti Taxi
Association operate to Verulam, Umhlanga and
Durban CBD, from several origins on D403 only 1km
apart, inter alia, similar to eTiyeni and Amaotana,
with low and variable utilisation (13-99%) the majority
of routes being between 25 and 75%. Fleet factors
vary from 0.19 to 1.21 which reflect erratic use of the
fleet and of capacity, except for the Durban routes,
most of which are satisfactory. There appears to be
an oversupply situation which could be ameliorated
somewhat
by
route
rescheduling.
When
Fundamental Restructuring is implemented the
Durban services should become feeders to Inanda
Station 1.
E2
R7
Amaoti
E3
Pinetown
E5
E 11
E 16
E 20
Mobeni
E2
127
205
R7
150
E3
182
E5
E 11
Durban
CBD
1142
E 16
75
E 20
Phoenix
Ntuzuma
Pinetown
Mpumalanga
Durban
CBD
kwaNdengezi
Bluff
Folweni
Isipingo
Figure 9.3: Area to Area Corridor Service Analysis
Bus Routes from Durban CBD
Tongaat
Verulam
Inanda
Umhlanga
Pinetown
Westville
Mpumalanga
Durban
CBD
Umlazi
Amanzimtoti
Magabeni
Figure 9.4: Area to Area Corridor Service Analysis
Taxi Routes from Durban CBD
9.9
Individual Routes Evaluation
The area to area corridor analysis provides a good overview of service
utilisation throughout the Municipality but it is not detailed enough to
consider applications for route licences. The OLS therefore evaluates
each of the over 3000 individual routes giving comments and
recommendations
for
each.
The
standard
comments
and
recommendations shown in Table 9.4 cover a range of conditions that are
defined in terms of the criteria discussed in Section 9.2. The taxi industry
is over-traded, therefore recommendations support the issue of new
licences only in proven cases of shortage of capacity on a particular route.
An example of a route evaluation/comments/recommendations summary
sheet is shown in Figure 9.5.
Table 9.4
Standard Route Comments and Recommendations
Standard Comments
for Individual Routes
Recommendations
Related to Comments
0
No peak service found on survey day.
50
Insufficient data for recommendation.
1
Satisfactory bus operation. No action
needed.
51
No further licences at present.
2
Adequate bus capacity and utilisation, but
better frequency needed. 35 Seater would
be appropriate.
52
Possible midibus route to match demand.
No further licences for standard buses at
present.
3
Bus utilisation 100% or more but poor
frequency. 35 Seaters would be
appropriate.
53
Possible midibus route to match demand.
Alternatively 1 or 2 new licences after
verification of patronage.
4
Inter-city or long distance coach or taxi
services. Low frequency not an issue. No
action needed.
54
No further licences at present unless
unequivocally justified by applicant or until
survey data is available.
5
Low frequency, low volume (<100/hr) bus
route. 18 Seaters would be appropriate.
55
Possible route for 18 seater vehicles.
Alternatively no further licences at present
for standard buses.
6
Reasonable to good bus frequency and
utilisation 100% or more. Candidate for
more trips per hour, but boarding volumes
at origin usually much lower than driver
interview volumes. Further verification of
utilisation would be prudent before
approval of further licences or trips.
56
1 or 2 new licences after verification of
patronage.
eThekwini Public Transport Plan
9.18
Operating Licence Strategy
Standard Comments
for Individual Routes
Recommendations
Related to Comments
7
Under-utilised taxi route (<50%).
57
No new licences at present.
8
Fully utilised taxi route (100% or more),
low frequency (3 or less/hr) long wait >15
min. Candidate for more service if fleet
factor >0.9.
581
(FF>0.9) - Up to 3 new licences may be
issued
582
(FF<0.9) - No new licences at present,
unless shown that fleet is used efficiently.
9
Fully utilised taxi route (100% or more),
moderate to high frequency (4 or more/hr),
moderate (5 to 15 min) wait.
59
No new licences to be issued at present.
10
Fully utilised taxi route (100% or more),
moderate to high frequency 4 or more/hr),
short wait (<5 min).
60
No new licences to be issued at present.
11
Fully utilised taxi route (100% or more),
moderate to high frequency (4 or more/hr),
long wait > 15 min. Could be due to rank
throughput limitations (no action on
service) or to insufficient service. Action to
be dependent on examination of rank
operation.
611
(FF > 0.9) If rank is inadequate, reorganise
or enlarge the rank, or relocate route start
point. If insufficient service, up to 3 new
licences may be issued, or more after
demand surveys carried out.
612
(FF < 0.9) If rank is inadequate, reorganise
or enlarge the rank, or relocate route start
point. If insufficient service, the
association should be encouraged to use
the fleet more efficiently.
12
Taxi passenger volume from 300 to
500/hr. Candidate for 35 Seater vehicles.
(The range may differ for reverse route in
other peak).
62
Possible candidate for midibus size
vehicles, if rank can accommodate them
and if not in competition with north-south
rail corridor. Otherwise no new licences.
13
Taxi passenger volume >500/hr.
Candidate for normal buses. (The range
may be less for reverse direction in other
peak).
63
Possible standard bus route if not in
competition with north-south rail corridor. If
rank unsuitable for buses, relocate route
start/end point. Otherwise no new licences.
15
Adequate or well utilised taxi route (50% to
99%), passenger volume 15 to 300/hr. No
action needed.
65
No new licences to be issued at present.
16
Specific vias or Durban destination not
distinguished in survey. Route probably
shares in patronage noted for other vias or
Durban destinations.
66
Check performance of equivalent route
with survey data and apply
recommendation for that route.
eThekwini Public Transport Plan
9.19
Operating Licence Strategy
eThekwini Transport Authority
Route Detail Sheet - Illustrative Example
Route: XXYX
CPTR Route No
Route Name
Origin name & GPS ID No
Destin. Name & GPS ID No
Via Points
Route Length
Mode
Operator/Association
Operator Route No
Service Type
Route Type
Inside Metro
Definite
XXYX
Road A Taxi Rank to Parkside
Road B Taxi Rank (E100)
Parkside (C200)
M1 (S)
22.2km
Mini-Bus Taxi
CCC T.A.
Commuter
Normal Route
Yes
Yes
Figure 9.5: Route Recommendation Sheet
9.10
Taxi Association Evaluation
Currently many taxi licence applications refer to an association and its
routes rather than to one specific route. The aim should be to encourage
operators to apply for a specific route licence, particularly when larger
vehicles commence operation. However, this would reduce an
association’s flexibility of operation, particularly in situations where
marshals are in radio contact and call for vehicles to cater for passenger
demand.
For many years bus owners associations have pooled resources and
shared routes. The list of approved routes accompanies the licence
approval and is kept in the vehicle. This procedure may also work for taxis.
Taxi
associations
evaluation
Of the 1064 taxi routes with survey data, 103 are possibly eligible routes
for additional licences, depending on rank operation. In respect of larger
vehicles, 144 routes have volumes appropriate for 35 Seaters and 15 for
standard buses. In these categories it should be remembered that the
routes in the database are uni-directional, therefore the above numbers of
routes would be approximately halved in respect of two-way routes.
Appropriate hourly passenger volume ranges for buses and taxis and
appropriate frequency/headway/ waiting times have been set out in tables
in Section 9.6.
In respect of taxi routes, 35 seater midibuses are appropriate when
passenger volumes exceed 300/hr, which translates into a frequency of
9/hr or more. Above 500 passengers/hr standard buses are most
appropriate but 35 seaters may still be the best choice depending on other
routes of the association. With a frequency of 9/hr the likely waiting time is
less than 4 minutes, which is short. At the same time, the headway of 7
minutes means the 35 seaters would not be getting in each others way.
Some of the principles that would be taken into consideration in the
conversion process are described below.
The services operating within Durban CBD and Beachfront areas are high
volume in both directions in both peaks. Taxis on these routes are
numerous and clutter up the busy road network. These services should be
among the first for consideration.
eThekwini’s Public Transport Plan
9.21
Operating Licence Strategy (OLS)
In respect of some associations, all their routes warrant conversion to 35
seaters and the conversion process would be expedited if these
associations were to convert at an early stage.
The age of current taxis also needs to be considered. When taxis are
replaced they should be replaced by 35 seaters for the designated routes
irrespective of the priority order based on volume. This will be an on-going
change which cannot be planned in advance.
Other constraints which should be taken into account relate to routes which
are in competition with rail service in the North-South Coastal Corridor.
When the Fundamental Restructuring of Public Transport is implemented,
bus and taxi routes competing with rail should be discontinued or converted
to feeder routes to the nearest rail station. At that time the most
appropriate mode would be considered.
A further constraint relates to the physical limitations of existing taxi ranks in
accommodating the 35 seaters, particularly in Durban CBD. In 2001 an
investigation of taxi ranks throughout the Province was undertaken by the
KwaZulu Natal Department of Transport to determine the extent of this
problem and to recommend changes to ranks. In respect of roofed ranks in
Durban CBD there were few which lent themselves to conversion. In some
cases recommendations were made for relatively inexpensive alterations
but the number of bays for 35 seaters was quite small. In the case of all
routes which could be converted to 35 seaters and where either end is in a
formal rank, site inspections will be necessary to determine the practicality
of converting these routes to 35 seaters. It may be that in some cases the
terminal point would need to be changed to a more suitable location for the
larger vehicles.
Before implementation, the full service implications of converting to 35
seater vehicles needs to be investigated, including the likely impact on
valley period level of service.
eThekwini’s Public Transport Plan
9.22
Operating Licence Strategy (OLS)
9.11
Subsidised Bus Contracts
In total there are six operators with subsidised contract routes in the
eThekwini municipal area. Of these three have tendered contracts
(Combined Transport, Two Line Trading and Thokomala Transit) one has
a negotiated contract (Remant Alton ex Durban Transport) and two have
interim contracts (Marinpine and South Coast). For survey and analysis
purposes in the CPTR the Combined Transport services were split into
North and West.
The performance of the contract operations excluding the interim contracts
is summarised in Table 9.5 for the morning peak hour.
Table 9.5
Contracted Bus Operations (AM Peak Hour)
Operator
Durban Transport
Combined Transport (N)
Combined Transport (W)
Two Line Trading
Thokomala Transit
Total
Total all Bus Operators
Contract as % of All
Surveyed
Routes
353
51
32
4
16
456
697
65
Vehicle
Trips
681
77
51
8
27
844
1489
57
Trips/
Route
1.9
1.5
1.6
2.0
1.7
1.85
2.14
Service
Cap
56504
7210
4300
611
2474
71099
128056
56
Pass.
Volume
43537
5590
2996
442
1670
54235
94232
58
The contracts cover roughly two thirds of all bus services and their peak
hour utilisation is slightly better than all services, utilisation of non-contract
services being 70%. The utilisation rates of contract operators are
reasonably similar, maximum variation being 10%. The number of peak
hour trips per contracted route averages a low 1.85 which reflects a low
frequency of service. For this reason, many routes would be better served
by 35 Seaters and even 18 Seaters, to provide better frequency for
passengers.
eThekwini’s Public Transport Plan
9.23
Utilisation
Rate
77
78
70
72
68
76
74
Preferred PT
modes
Operating Licence Strategy (OLS)
Table 9.6
Bus Routes by Operator with Particular Recommendations
Operator
Durban Transport
Combined Transport (N)
Combined Transport (W)
Two Line Trading
Thokomala Transit
Total
Total all Bus Operators
Suitable for
35 Seater
18 Seater
252
190
32
42
26
19
3
3
8
9
321
263
429
381
Need
More
Surveyed
Routes
20
3
0
0
0
23
33
532
84
48
8
21
693
1022
It is noteworthy that, to give a reasonable frequency, 46% of surveyed
contracted routes would be better served with 35 Seater vehicles and 38%
with 18 Seaters. Only 3% appear to need more buses to improve service
capacity. These proportions for all bus services are only fractionally lower.
9.12
Rail Services
There are 8 basic rail routes, all radiating from Durban. There are 51 rail
routes in the database with trains in either or both peak hours, but with
different start or end points on the 8 basic routes. For example, the south
coast line has services from Durban to Isipingo, Amanzimtoti, Umkomaas,
Scottburgh, Park Rynie and Kelso, some in the morning peak, some in the
afternoon peak and some in both peaks. Some services on the KwaMashu
and north coast lines run via Redhill, the majority running via Effingham.
Rail services
Grouped and simplified peak hour rail passenger totals are shown in
Table 9.7. The largest number of peak hour passengers is 7000, from
Umlazi to Durban in the morning peak. Even so, average utilisation on this
route is only half of capacity. Only 3 other routes with more than one train
have utilisations over 50%: Stanger and Cato Ridge to Durban in the
morning peak, and Durban to Stanger in the afternoon peak. The one train
from Umlazi to Wests in the morning peak is full. A larger train (1530
capacity) would be appropriate.
eThekwini’s Public Transport Plan
9.24
Operating Licence Strategy (OLS)
Table 9.7
Origin
Peak Hour Rail System Utilisation
Destination
a) Inbound: AM Peak Hour
Durban
Umlazi
Durban
KwaMashu
Durban
Stanger
Durban
Isipingo & beyond
Durban
Cato Ridge
Durban
Pinetown
Durban
Crossmoor
Wests
Umlazi
TOTAL
b) Outbound: PM Peak Hour
Umlazi
Durban
KwaMashu
Durban
Stanger
Durban
Isipingo &
Durban
beyond
Durban
Cato Ridge
Durban
Pinetown
Durban
Crossmoor
Wests
Umlazi
TOTAL
eThekwini’s Public Transport Plan
No of
Trains
Service
Capacity
Pass.
Util.
Rate (%)
9
9
3
5
4
2
2
1
35
13770
13770
3950
6050
6120
2420
2420
1210
49710
7000
4000
2800
2400
3600
400
500
1200
21900
51
29
71
40
59
17
21
100
44
7
7
4
4
3
1
1
2
10710
10710
5800
4840
4590
1210
1210
2420
4300
2200
3200
1500
2100
200
400
700
40
21
55
31
46
17
33
29
29
41490
14600
35
9.25
Rail Services
Operating Licence Strategy (OLS)
10
IMPLEMENTATION STRATEGY
10.1
Introduction
This section of the Public Transport Plan provides input to the preparation
of the prioritised implementation plan for the Integrated Transport Plan.
The following public transport implementation strategy is documented
within the context of the modal strategies and key aspects of the Public
Transport Plan. In effect, it catalogues the recommended initiatives and
projects forming part of the PTP, highlighting where appropriate key
issues around the roll-out of the Plan in the short to medium term.
10.2
Unfolding of the Public Transport Strategy
The following figure gives a broad context to the roll-out of the long term
restructured public transport system for the metropolitan area.
Rail system & service upgrade
System & service
restructuring in
‘North-South
Public Transport
Corridor’
Legalisation and
regulation of minibus taxi
industry
Regulation of unsubsidised bus
operations & introd of commercial
bus/taxi contracts
System/service restructuring in
‘Other Areas’ based on local area
plans integrated with detailed
spatial plans
FULLY
INTEGRATED
RESTRUCTURED
METRO PT SYSTEM
Figure 10.1: Roll-Out Strategy for the
Restructured eThekwini Public Transport System
The timeframe for delivery of the restructured metropolitan-wide system
depends on achieving various milestones in the development of each
modal strategy. These milestones are identified in the following sections.
eThekwini’s Public Transport Plan
10.1
Implementation Strategy
For the public transport plan to be properly integrated with the full range of
land use development strategies, the development of such strategies
should run concurrently. The Spatial Development Framework (SDF)
which interprets the development strategies in geographic terms also
provides the framework for the preparation of detailed local area spatial
plans. As these plans are being developed, local area public transport
plans can also be prepared and integrated as part of a parallel process.
10.3
Rail Strategy
Rail is planned as the backbone of the north-south public transport
corridor system; however, the currently run-down, deteriorating rail system
must be radically upgraded for this to be achieved.
Outside of this corridor the need to upgrade some rail services needs to
be addressed as part of an implementation programme for the rail
component of the public transport system.
The following are the five key strategies which comprise the Rail Strategy
for the eThekwini Municipal area:-
Strategy 1:
Rail Investment for the North-South Public Transport
Coastal Corridor
¾ Finalise memoradum of agreement with SARCC for upgrading of
rail rolling stock and other infrastructure.
Strategy 2:
New Rail Spur Line to Bridge City
¾ Plan, design and award construction contract for new rail spur from
Duff’s Road Station to Bridge City development
Strategy 3:
Chatsworth
line security
upgrade
Marketing of North-South Public Transport Corridor System
¾ Plan and implement marketing strategy including system branding,
integrated with information systems.
Strategy 5:
New spur line
Upgrade and Revitalisation of Chatsworth Rail Service
¾ Implement security systems, on board, at rail stations and at park ‘n
ride locations
Strategy 4:
Rail
investment
Marketing N-S
corridor
Kings Park Rail Station
¾ Design and construct in preparation for 2010 World Cup
eThekwini’s Public Transport Plan
10.2
Kings Park
Station
Implementation Strategy
10.4
Bus Strategy
In the proposed public transport system bus plays a support role in the
north-south public transport corridor by providing some of the feederdistribution systems. Currently, a number of bus services operate in direct
competition with the rail service in the transport corridor and this is one of
the problems that must be addressed in the implementation strategy for
bus.
Beyond the north-south corridor, bus also plays a major role in an
integrated system of bus and taxi services.
Strategy 1:
Feeder-distribution services as integral part of the N-S
public transport corridor system
¾ Formalisation of relevant minibus taxi services
¾ Develop and implement programme for introduction of feederdistribution bus/taxi services including:Strategy 2:
Durban CBD PT priority system
Berea system
Remove/reposition bus services in direct competition with
rail service in N-S public transport corridor
¾ Negotiate repositioning of non-contract services and rationalise
contract services on completion of contracts
Strategy 3:
¾
¾
¾
¾
Services in
competition
with rail
Rationalise bus system and service contracts in areas
removed from the N-S corridor
Analyse existing bus/taxi system needs by local area
Rationalise subsidised bus service contracts when each is renewed
Identify opportunities/need for commercial service contracts
Negotiate service changes with non-contract operators
Strategy 4:
Feeder/
distributor
services
Rationalise
bus system
Improve infrastructure and operating conditions for existing
bus services
¾ Implement short term (Years 1-5) programme for construction of
shelters and laybys
¾ New bus rank at Mansfield
eThekwini’s Public Transport Plan
10.3
Infrastructure
upgrades
Implementation Strategy
10.5
Minibus Taxi Strategy
The minibus taxi currently plays a major role in the metropolitan public
transport system and will continue to do so into the future. In doing so
however there will be a changing focus on the role of the taxi.
Increasingly, the emphasis will be on quick turn-around routes where
operators can operate more profitably. Feeder-distribution services in
particular will benefit from the high frequency quick turn-around type of
service that can be offered by the minibus taxi mode.
Minibus taxi
strategy
In the north-south public transport corridor minibus taxi will provide many
of the feeder-distribution services. In the areas beyond the north-south
corridor minibus taxi will play an important role in the integrated system of
bus and taxi services. However, to become an effective part of the
integrated systems the minibus taxi industry needs to become fully
legalised and regulated. The following highlights the components of a
minibus taxi implementation strategy to achieve these objectives.
Strategy 1:
Develop the OLS for all road-based PT operations and
implement service changes
¾ Evaluate OLS recommendations on route and service changes
required in terms of over and under-supply of service
¾ Analyse cost implications for service rationalisation
¾ Negotiate and introduce service changes
Strategy 2:
Regulate and control minibus taxi operations in the
eThekwini Metropolitan area
¾ Provide route and service data to public transport law enforcement
team and implement enforcement programme in terms of service
agreement
¾ Implement a driver training programme for awareness and
commitment to Quality Service Charter and Passenger Service
Charter
Strategy 3:
Minibus taxi
OLS
Regulation
Feeder-distribution services as integral part of N-S public
transport corridor system (Refer also to 10.4 - Strategy 1)
¾ Prepare a prioritised programme for introduction of feederdistribution bus/taxi services
¾ Develop and implement a programme for allocating service
contracts to existing operators, a) from over-traded areas, b) from
parts of system impacted by restructuring in PTP
eThekwini’s Public Transport Plan
10.4
Feeder/
distribution
services
Implementation Strategy
Strategy 4:
Remove/reposition minibus taxi services in direct
competition with rail service in N-S transport corridor
¾ Identify minibus taxi services in direct competition with rail and
develop a programme for repositioning of services
Strategy 5:
Rationalise minibus taxi routes and services in areas
removed from the N-S Corridor
¾ Analyse existing bus/taxi system needs by local area
¾ Rationalise subsidised bus service contracts when each is renewed,
identifying opportunities/needs for minibus taxi services
¾ Identify opportunities/need for commercial and/or subsidised
minibus taxi service contracts and implement
Strategy 6:
10.6
Rationalisation
Improve infrastructure and operating conditions for existing
minibus taxi services
¾ Implement the short term (Years 1-5) programme for construction
of:-
Services in
competition
with rail
Infrastructure
upgrades
taxi laybys and shelters
rural area ranks
urban area ranks and holding areas
Non-motorised Transport (NMT) Strategy
Non-motorised transport apart from walking includes bicycles and animaldrawn carts/wagons for carrying people from point-to-point. Although
slower than motorised public transport these modes have the advantage
of being personalised to the needs of individuals in terms of when the
journey is made and the routing.
Animal-drawn transport needs to be largely restricted to rural parts of the
metropolitan area however, cycling can be used in many parts of metro
where topography permits. The focus of the current programme is on the
cycling component of NMT.
Strategy 1:
NMT
strategy
Develop and implement programme of cycle projects
¾ Develop cycle policy
¾ Possible cycle pilot project - Clermont
¾ Develop an implementation programme
eThekwini’s Public Transport Plan
10.5
Cycle projects
Implementation Strategy
10.7
Special Needs Public Transport Strategy
Special needs public transport passengers may include not only those with
physical challenges, but children, the elderly, pregnant women, the
illiterate and foreign tourists unable to communicate in any locally used
language.
A range of initiatives will be introduced to meet these different needs.
However as documented in the PTP policy - Section 3, the initial main
focus will be on the development of the N-S public transport corridor as a
universally accessible corridor, as this will impact on the greatest number
of public transport passengers.
Strategy 1:
Develop N-S PT Corridor as a universally accessible
corridor
¾ Identify system needs in CBD and along N-S Corridor in terms of
infrastructure, fleet and communication requirements (eg. Signage,
auditory messaging, etc)
¾ Develop and implement a prioritised, phased implementation
programme
Strategy 2:
SUKUMA
project
Accessible Buses in New Bus Contracts
¾ Develop specification requirements for ‘accessible buses’
¾ Determine number of units and routing as part of the system design
specification for preparing bus contract tenderers
Strategy 4:
Universally
accessible
corridor
SUKUMA Project - Umlazi and KwaMashu
¾ Evaluate the SUKUMA project (2 retro-fitted buses on fixed routes
in Umlazi and KwaMashu) and identify other locations where this
or a similar type of service could be introduced
¾ Introduce service contracts in a phased programme for extending
this service if funds are available
Strategy 3:
Special needs
strategy
Accessible
buses
Driver Training Programme
¾ Introduce into bus driver training programmes a training module on
acceptable and required procedures for embarking, disembarking
and carrying of special needs passengers with different categories
of mobility impairment.
eThekwini’s Public Transport Plan
10.6
Implementation Strategy
10.8
Intermodalism Strategy
Intermodalism is an inherent aspect of the restructured, rationalised public
transport system. In its broadest application in the N-S Corridor it includes
rail, bus and minibus taxi.
The rail strategy for the N-S public transport corridor will include all modes
forming a part of the corridor system solution. Further, the system solution
will incorporate sub-systems essential to the effective performance of the
overall system, including inter alia:-
Intermodalism
strategy
¾ Through ticketing
¾ Security systems
¾ Information systems (Phase 1 - A Call Centre)
Apart from the N-S corridor, intermodalism will be incorporated into other
parts of the metropolitan public transport system. These sub-systems will
be developed and implemented as various parts of the overall public
transport system are implemented.
Strategy 1:
Public Transport Information System
¾ Develop the requirements (system architecture) for components of a
comprehensive system for the metropolitan area
¾ Roll out a phased implementation programme including a PT
Service Call Centre
Strategy 2:
Through-ticketing System
Through
ticketing
¾ Develop system architecture
¾ Conduct a pilot
Strategy 3:
Information
system & call
centre
Develop inter-modal system in N-S Corridor as part of Rail
Strategy
Note - Refer to:10.3 Rail Strategy
10.4 Bus Strategy
10.5 Minibus Taxi Strategy
N-S Corridor
inter-modal
system
These collectively form a part of the inter-modal system strategy for
the N-S public transport corridor.
eThekwini’s Public Transport Plan
10.7
Implementation Strategy
¾ Prepare and implement a prioritised roll-out programme for various
rail, bus and taxi components of system incorporating integrated
ticketing, information systems and security systems.
10.9
Integrated
system
implementation
TDM Strategy
Whilst TDM projects have been identified for implementation in the short
term programme, there is need to identify other projects as the various bus
and taxi routes and services are restructured. Projects in this section
address this need.
Strategy 1:
TDM
strategy
Develop and implement TDM Programme
¾ Investigate full range of TDM measures and potential sites for
implementation
¾ Implement TDM measures in CBD (including CBD public transport
priority measures - 10.4 - Strategy 1) in short term programme
10.10 Bus Subsidy Strategy
For some of the subsidised bus services the benefit does not reach many
of the poor. Consequently, there is a need to investigate ways in which the
available subsidies can be focused on defined areas/services impacting
on a larger segment of this sector of the commuter market.
Strategy 1:
Targeted Subsidy Project
¾ Investigate the basis for and locations for introducing targeted
subsidies and implement a pilot project
Targeted bus
subsidies
10.11 Land Use Restructuring Strategy
Section 3 sets out a number of public transport policies related to userside subsidy, more efficient public transport, and land use policies in
support of these principles.
Apart from the targeted subsidy project (10.10) there is need to introduce
a pilot project on more efficient residential land use in support of public
transport. In effect this will be achieved by subsidising land costs.
eThekwini’s Public Transport Plan
10.8
Implementation Strategy
Strategy 1:
Subsidised Low Income Housing
¾ Investigate location opportunities for low income housing which will
be highly accessible to public transport and reduce the trip distance
for essential travel.
¾ Recognising the reduced need for expenditure on essential services
for such communities, consider various models for subsidising such
development.
¾ Implement a pilot project.
10.12 Customer Focus Strategy
Apart from cost, the major concerns of public transport passengers, are for
safe, reliable, convenient service. Two projects identified in Section 3 Policy, focus on these aspects of public transport. They are the
development and adoption of:¾ A Passenger Service Charter
¾ A Quality Service Charter
These provide the definition and terms of reference for the type of service
passengers have requested in the Stated Preference Surveys conducted
by the Municipality.
They also provide the context for effective
enforcement by the dedicated public transport enforcement team
contracted to the ETA by the Metropolitan police services.
Strategy 1:
Quality Service Charter
Quality service
charter
¾ Engage operator forums and prepare the Charter
¾ Adopt and implement
Strategy 2:
Passenger Service Charter (PSC)
¾ Taking into consideration the national initiative to develop a PSC,
engage local passenger/community forums and adapt the national
charter as necessary
¾ Adopt and implement Charter
Strategy 3:
Passenger
service charter
See also Customer Call Centre 10.8 - Strategy 1
eThekwini’s Public Transport Plan
10.9
Implementation Strategy
10.13 Tourism Strategy
The public transport needs of tourists are recognised as quite different
from those of daily commuters and residents. At the same time unique
modes and/or service for tourists can add to the attractiveness of
eThekwini as a tourist destination thereby having a positive impact on the
local economy. The People Mover project described in the following
section is such a project.
10.14 The People Mover Project
10.14.1
Objective of People Mover System
This project is planned as a tourist focused public transport system and
service in the Durban CBD, connecting key activity centres in that area of
the City.
The existing public transport system and services to the Durban CBD serve
the needs of daily commuters and the introduction of a prioritised public
transport CBD distribution system, will significantly enhance public
transport services for commuters with CBD origins/destinations.
People Mover
System in CBD
Whilst this system provides a measure of mobility in the CBD for tourists, it
does not focus specifically on the needs of this group.
The concept of the People Mover System is to provide the alternative of an
upmarket system and service with levels of convenience, comfort and
security expected by tourists travelling in any first world city throughout the
world. The objective then is to ensure tourists can reach various interest
and activity destinations in the CBD using such a public transport system.
10.14.2
Phased Implementation
It is intended to develop and implement the
People Mover System on a phased basis.
The capital and operating cost along with the
complexity of implementing such systems
preclude introducing such technology and
levels of sophistication in the short term.
Consequently, as an interim 3 year solution, a pilot system will be
introduced based on the use of state-of-the-art midibus vehicles operating
in mixed traffic along defined routes in the CBD.
eThekwini’s Public Transport Plan
10.10
Implementation Strategy
Ten such vehicles with seated capacity of 35 will
be used to provide this service. These vehicles
will be fully air-conditioned, with a spacious
seating configuration, and fully accessible for
wheel chair passengers.
CCTV camera
surveillance on-board and at terminals will ensure
a high level of personal security.
Drivers will be highly trained in areas of vehicle operation and in
communicating with tourists thereby ensuring a safe and pleasant trip for
the passengers.
The route system will comprise two routes;
one along the beachfront, the other
extending from a timed-transfer point of
this route through the CBD as far as the
Warwick Triangle. These routes will link
together tourist accommodation and
facilities along the beachfront, uShaka
Marine World, the beachfront Casino, the
ICC,
and
Central
Shopping
and
accommodation.
High level
personal security
Specially trained
drivers
Route system
The point of transfer from the beachfront to the east-west route will be a
high-security, user convenient facility where through-ticketing and timed
transfers will ensure minimum wait time.
Convenient
transfers
This pilot people mover will be evaluated in terms of cost, utilisation and
projected demand. If warranted, a more sophisticated system (eg. trams or
monorail) will be proposed.
The People Mover System will also be integrated into the World Cup 2010
transport strategy.
10.14.3
Integration with
WC 2010 transport
Implementation Programme
Tenders have been received for the system vehicles which will be owned
by eThekwini Municipality. The service will be operated under contract to
the Municipality, and it is anticipated that a functional system will be
operational before year end, 2005.
eThekwini’s Public Transport Plan
10.11
Implementation Strategy
11
RURAL TRANSPORT STRATEGY
11.1
Introduction
Some 68% of eThekwini’s Municipal area can be considered as rural in
nature. This means that a rural transport strategy for eThekwini is
essential.
68% of
municipal
area is rural
The ETA is busy preparing a rural transport strategy at present. This
section will therefore highlight some of the existing issues that have been
identified, and give an indication of the development of the full transport
strategy.
11.2
Identification of Key Issues
General rural issues that need to form the background to a transport
strategy are:General rural
issues
¾ High unemployment
¾ Difficult terrain making transport difficult
¾ Lack of connectivity
The following transport issues have been identified and need to be
addressed in a transport strategy:¾ Road improvements focused on accessibility
¾ Formalisation of public transport facilities to provide locations for
trading and other services
¾ Extending public transport services to provide greater coverage
¾ Road safety, especially with regard to pedestrian movements and
visibility
¾ Dealing with transport for the disabled
¾ Responsibility and provision for scholar transport, including
issues of “bakkie transport”
¾ Non-motorised transport, including walking, cycling and animal
drawn vehicles
¾ Levels of PT service that are appropriate for rural transport
eThekwini’s Public Transport Plan
11.1
Transport
issues
Rural Transport Strategy
11.3
Development of a Rural Transport Strategy
It is critical that the rural strategy be developed within the framework of the
rural component of the NLTSF. There needs to be a focus on improved
access to social services, education, markets and business support
services. It is envisaged that it will be crucial to develop viable
transportation services from villages to rural service centres. One of the
critical pillars will need to encompass the management of transport
infrastructure and services to support economic and social sector clusters.
The notion of identifying a robust pilot project to test some of the ideas
would be seriously considered.
eThekwini’s Public Transport Plan
11.2
Improved
access to
services &
opportunities
Rural Transport Strategy
12
MONITORING AND KEY PERFORMANCE INDICATORS
Part of the IDP vision includes "...growing the economy and meeting
peoples needs so that all citizens enjoy a high quality of life with equal
opportunities..."
Public transport's contribution to achieving this vision requires
performance on the delivery of the PTP, as well as performance of the
system in achieving the various public transport goals. Consequently,
performance monitoring using various key performance indicators (KPI's)
is an essential part of the delivery of the PTP.
12.1
Key Performance Indicators (KPI's)
Table 12.1 sets out a range of KPI's for the five public transport goals
identified in Section 3 of this report.
Apart from defining each goal this table notes the probable source of data
needed to measure performance and the recommended frequency of
measurement.
Table 12.1
KPI’s
Monitoring of the ETA’s Public Transport Plan
Key Performance Indicators (KPI’s)
Key Performance Indicator
Output to be Evaluated
KPI
No
Description
Source
Comments
Report
Frequency
Goal 1 – Effective Public Transport:
¾ Passenger satisfaction with
public transport service
1
No of complaints/1000
passengers per month
•
•
¾ Promotion of use of public
transport
2
3
¾ Promotion of access to public
transport
4
¾ Promotion of accessibility to
public transport
5
¾ Accommodation of Special
Needs Groups
6
eThekwini’s Public Transport Plan
Monitored in
Remant Alton
contract
Requires call
centre for
system
•
Needs call centre
(Note: Section
10.8)
Monthly
Modal split (% of
motorised transport
users on public
transport in peak
period)
Average age of
subsidised bus and
commuter rail coach
fleet
•
ETA
•
Part of annual
monitoring
programme
Every 3-5
years
•
KZNDOT and
SARCC
•
Annual
Kilometers of roads
used for PT per
hectare in rural areas
% of households
spending more than
10% of disposable
income on public
transport
No of corridors with
fully accessible P.T.
• No of dedicated
vehicles for special
needs
•
ETA
KZNDOT
(becomes ETA
responsibility as
bus contracts
are taken over)
-
•
Quality of life
survey
-
Annual
•
ETA/KZNDOT
-
Annual
12.1
Every 2-3
years
Monitoring and Key Performance Indicators
Key Performance Indicator
Output to be Evaluated
KPI
No
7
Description
Source
% of contracted bus
fleets fully accessible
in select areas still to
be determined
Comments
Report
Frequency
•
KZNDOT
-
Annual
Goal 2 – Efficient Public Transport:
¾ Efficient PT operations
8
Average travel time to
work for all public
transport commuters
•
Quality of life
survey
-
Annual
¾ Efficient bus operation
9
Average no of
passengers carried per
subsidised bus per day
•
KZNDOT
-
Annual
Average number of rail
passengers per service
per day
•
Metrorail
•
Currently
Metrorail
function. Info
available only
when provided
2-3 years
•
Only possible
when Re-cap
programme
operational
Annual
-
Annual
¾ Efficient rail service
10
¾ Taxi-Recapitalisation progress
11
% of minibus taxi fleet
re-capitalised
•
OLB
¾ Good delivery of public
transport projects
12
% of capital projects
delivered within time
and budget
•
ETA
¾ Effective regulation and control
of public transport vehicles
13
% fully legal public
transport operators
•
OLB
•
Measurable once
provincial taxi
database is fully
updated
Annual
•
OLB
•
Currently an OLB
function;
available only
when Board
provides
Annual
•
Exact measures
to be developed
5 years
Goal 3 – Sustainable Public Transport
¾ Road-based public transport
service regulation and
legislation
14
% of services
operating with a fixed
route permit
¾ Land-use restructuring
(for monitoring)
15
Development density
along PT priority
corridor(s)
-
Goal 4 – Safe & Secure Public Transport:
¾ Improved public transport
security
16
Reported incidents
monthly per 10 000
passengers
•
SAPS
•
Access
procedures need
to be set up
Annual
¾ Improved public transport
safety
17
Various KPI's from
Road Safety Plan
•
ETA
•
Documented in
Road Safety
Plan & ITP
Annual
Goal 5 – Black Empowerment in Public Transport:
¾ Extent of ownership and
participation in public
transport and related
activities
¾ Procurement of services
18
Number of contracts
and value by type of
contract
•
ETA
-
Annual
19
% of budgets allocated
to PDI firms
•
ETA
-
Annual
eThekwini’s Public Transport Plan
12.2
Monitoring and Key Performance Indicators
ANNEXURE A
Public Transport Service
and
Trip Characteristics
A.1
Service and Trip Characteristics - Transport Supply
from Route Origin Zone (Year 2000 AM Peak Hour)
A.1
A.2
Service and Trip Characteristics - Levels of Service
by Origin Zone (Year 2000 AM Peak Hour)
A.2
A.3
Service and Trip Characteristics - Demand by Route Group
from Origin Zone (Year 2000 Peak Hour)
A.4
A.4
Service and Trip Characteristics - Annual Service Kilometres
(Year 2000)
A.5
A.5
Service and Trip Characteristics - Service Utilisation
by Route Group from Origin Zones (Year 2000 AM Peak Hour)
A.6
eThekwini’s Public Transport Plan
Annexure A
ANNEXURE A
Table A.1
eThekwini Public Transport Plan
Service and Trip Characteristic
Transport Supply from Route Origin Zones (Year 2000 AM Peak Hour)
Origin Zone
1
2
3
4
5
6
7
8
9
10
11
12
13
14
15
16
17
18
19
20
21
22
23
24
25
26
27
CBD
Berea
Sydenham
Cato Manor
Congella
Clairewood
Merewent
Jacobs
Prospecton
Isipingo
Folweni
Umlazi
Chatsworth
Pinetown South
Pinetown
Mpumalanga
New Germany
Clermont
Effingham
Newlands
KwaMashu
Ntuzuma
Inanda
Phoenix
Verulam
Tongaat
Other
Totals
Averages
Total
Passenger
Rides
23,840
1,788
2,349
4,406
1,063
91
3,919
377
786
4,423
4,242
37,395
7,362
7,636
3,626
4,606
316
6,927
158
3,821
14,167
19,401
9,688
10,694
4,555
4,884
14,618
197,138
No of Routes (Transit Lines)
Total
165
21
21
21
15
1
35
6
7
12
15
129
58
32
22
22
2
38
6
37
44
114
40
59
23
20
82
1,047
Rail
6
1
1
2
1
1
1
1
2
16
Taxi
60
8
13
14
9
9
1
4
3
14
56
32
21
6
16
38
1
19
31
46
16
50
20
8
56
551
Vehicle Trips
Bus
99
12
8
7
6
1
25
5
3
9
1
71
25
11
15
6
2
5
18
12
68
24
9
3
11
24
480
Total
757
78
98
226
31
1
151
12
32
191
177
879
303
260
73
172
3
345
19
164
271
602
367
552
221
140
441
6,568
Taxi
12
2
2
10
1
1
6
1
4
39
Bus
362
14
57
208
18
105
2
25
152
170
714
235
234
44
159
345
0
120
234
466
324
521
213
86
380
5,188
Rail km
Taxi
km
Bus
km
384
61
41
19
13
1
44
10
7
39
7
156
67
26
27
13
3
19
44
31
136
43
31
9
53
57
1,341
17.1
A.1
eThekwini’s Public Transport Plan
Rail
Average TripDistance
15.7
12.1
Table A.2:
eThekwini Public Transport Plan
Service and Trip Characteristics
Levels of Service by Origin Zone – (Year 2000 AM Peak Hour)
Origin Zone
1
2
3
4
5
6
7
8
9
10
11
12
13
14
15
16
17
18
19
20
21
22
23
24
25
26
27
CBD
Berea
Sydenham
Cato Manor
Congella
Clairewood
Merewent
Jacobs
Prospecton
Isipingo
Folweni
Umlazi
Chatsworth
Pinetown South
Pinetown
Mpumalanga
New Germany
Clermont
Effingham
Newlands
KwaMashu
Ntuzuma
Inanda
Phoenix
Verulam
Tongaat
Other
Totals
Averages
No of
passenger
OD trips
9,616
1,710
2,623
4,646
2,967
933
3,546
1,955
3,897
5,717
3,577
29,993
7,807
8,217
2,170
5,107
81
6,019
1,291
4,121
15,380
11,571
8,778
12,585
4,814
4,211
11,357
174687
Average connection times
Walk
minutes
Total wait
minutes
st
Average in-vehicle times
1 wait
minutes
Transfer
minutes
Trip
minutes
Rail
minutes
Bus
minutes
Average
fare
Rand
Total
travel time
minutes
2.43
2.98
2.56
2.62
1.72
1.98
2.66
2.32
1.96
2.47
3.62
2.96
3.08
2.84
2.67
3.51
3.27
2.77
2.76
3.12
2.90
3.67
4.07
3.41
3.18
2.39
39.7
39.5
32.9
35.3
40.4
39.4
34.0
35.0
31.2
38.0
59.0
48.7
48.0
48.6
46.1
67.2
54.4
41.9
39.3
48.5
57.5
58.4
63.3
52.7
47.9
50.4
9.3
10.6
10.8
11.0
13.4
10.1
7.8
9.4
10.3
9.4
19.1
12.0
10.6
14.1
19.1
21.4
21.1
11.8
10.7
9.1
13.6
10.7
10.8
9.2
12.5
15.4
3.9
4.1
2.7
4.4
4.2
6.3
4.2
3.9
3.2
6.1
4.9
3.8
4.7
4.9
4.7
5.6
5.9
4.2
4.0
4.1
4.6
3.6
3.7
3.4
5.6
6.0
3.7
3.4
2.4
3.7
3.5
5.1
3.8
3.5
2.8
5.6
3.6
3.0
4.4
4.6
3.6
5.1
4.1
3.4
3.1
3.9
4.0
3.2
3.4
3.3
4.7
5.1
4.2
4.4
4.8
3.9
9.0
8.2
4.7
5.8
6.2
5.6
3.9
4.7
3.5
3.6
10.3
4.0
5.6
4.8
3.9
3.9
5.1
3.7
4.0
3.9
3.6
4.5
26.5
24.8
19.4
19.9
22.8
22.9
22.0
21.6
17.7
22.5
34.9
32.9
32.7
29.6
22.4
40.2
27.5
25.9
24.6
35.3
39.4
44.2
48.8
40.1
29.9
29.1
34.3
34.0
30.1
31.6
20.6
19.7
25.3
21.0
19.3
22.3
36.7
27.7
27.7
33.4
28.9
43.6
14.6
24.1
19.0
27.4
32.7
19.2
28.0
26.2
28.4
52.6
23.0
20.9
14.2
15.1
25.2
12.0
18.8
16.7
11.5
20.9
26.6
27.8
30.4
23.3
24.1
32.5
10.8
22.4
21.3
32.1
33.5
38.1
43.1
40.1
23.5
13.8
22.3
20.1
21.2
20.5
29.2
24.2
22.7
21.7
20.6
19.3
23.3
29.2
31.6
30.1
21.9
37.6
26.4
20.4
22.0
36.1
39.9
41.2
49.1
40.5
25.5
21.8
1.047
1.161
1.063
1.179
1.082
1.158
1.088
1.086
1.070
1.080
1.334
1.179
1.091
1.093
1.125
1.128
1.360
1.162
1.239
1.061
1.112
1.120
1.091
1.040
1.257
1.207
12.7
4.6
3.9
5.0
29.3
28.3
24.0
27.7
1.14
A.2
eThekwini’s Public Transport Plan
Taxi
minutes
Average
rides
per trip
46.5
Table A.2 (continued):
eThekwini Public Transport Plan
Service and Trip Characteristics
Levels of Service by Origin Zone – (Year 2000 AM Peak Hour)
Origin Zone
1
2
3
4
5
6
7
8
9
10
11
12
13
14
15
16
17
18
19
20
21
22
23
24
25
26
27
CBD
Berea
Sydenham
Cato Manor
Congella
Clairewood
Merewent
Jacobs
Prospecton
Isipingo
Folweni
Umlazi
Chatsworth
Pinetown South
Pinetown
Mpumalanga
New Germany
Clermont
Effingham
Newlands
KwaMashu
Ntuzuma
Inanda
Phoenix
Verulam
Tongaat
Other
Totals
No of
passenger
OD trips
9,616
1,710
2,623
4,646
2,967
933
3,546
1,955
3,897
5,717
3,577
29,993
7,807
8,217
2,170
5,107
81
6,019
1,291
4,121
15,380
11,571
8,778
12,585
4,814
4,211
11,357
174,687
Passenger kilometres
Total
x1000
Rail
x1000
Taxi
x1000
Passenger Rides
Bus
x1000
130.51
20.59
19.53
39.51
38.42
11.92
42.92
22.35
39.17
72.36
62.73
511.65
131.08
130.27
33.76
120.67
1.00
76.57
15.16
61.35
289.67
218.87
219.03
262.54
80.23
76.52
62.28
3.44
0.73
1.19
28.69
8.34
5.14
10.11
20.48
26.48
1.29
159.17
20.31
33.69
4.34
27.40
0.07
2.30
4.89
0.77
116.91
1.36
1.80
22.29
9.41
46.47
33.91
9.91
7.59
25.56
2.31
0.28
28.33
2.34
11.52
29.95
54.47
229.49
71.26
66.19
19.99
69.34
0.15
70.29
2.85
39.51
87.54
120.25
158.24
198.12
61.33
23.02
34.32
7.23
11.20
12.76
7.41
3.31
9.45
9.89
7.16
15.93
6.97
122.99
39.52
30.39
9.42
23.93
0.79
3.99
7.42
21.07
85.22
97.25
58.98
42.13
9.49
7.02
2,957.68
682.87
1,557.38
717.43
Transfers
454
275
165
832
243
147
313
169
274
458
1,193
5,371
707
766
270
651
29
972
309
252
1,720
1,392
800
506
1,235
870
2,063
22,435
A.3
eThekwini’s Public Transport Plan
Rail
3,113
174
42
64
2,392
725
348
826
1,820
2,034
60
9,853
1,258
1,729
258
1,078
8
163
440
48
6,133
122
110
1,460
568
1,514
3,073
39,412
Average fares paid per ride
Taxi
Bus
2,591
801
1,126
3,589
157
40
2,483
234
1,520
2,146
3,922
14,889
4,094
4,767
1,188
3,482
21
6,427
257
2,564
5,051
6,581
6,598
8,959
4,616
2,829
7,597
98,529
4,366
1,010
1,620
1,825
661
315
1,029
1,064
832
1,995
788
10,621
3,162
2,486
994
1,199
81
401
902
1,760
5,917
6,260
2,870
2,672
864
737
2,750
59,181
fare
Rand
2.43
2.98
2.56
2.62
1.72
1.98
2.66
2.32
1.96
2.47
3.62
2.96
3.08
2.84
2.67
3.51
3.27
2.77
2.76
3.12
2.90
3.67
4.07
3.41
3.18
2.39
3.17
Rail
Rand
1.54
1.53
1.44
1.48
1.23
1.21
1.34
1.24
1.20
1.27
1.60
1.39
1.39
1.52
1.42
1.75
1.09
1.31
1.19
1.38
1.50
1.20
1.40
1.36
1.41
1.96
1.57
Taxi
Rand
2.59
2.52
1.93
1.97
2.77
1.95
2.42
2.27
2.02
2.68
2.68
2.83
3.04
2.68
2.98
3.30
1.95
2.37
2.38
2.38
3.03
3.13
3.73
3.53
2.61
2.08
3.06
Bus
Rand
2.90
2.85
2.83
2.84
3.15
3.10
3.00
3.01
2.96
2.91
2.97
3.17
3.24
3.22
3.02
3.79
3.04
3.06
2.93
3.20
3.38
3.46
3.83
3.48
3.13
3.02
3.18
Table A.3:
eThekwini Public Transport Plan
Service and Trip Characteristics
Demand by Route Group From Origin Zone – (Year 2000 Peak Hour)
Route Origin
1
2
3
4
5
6
7
8
9
10
11
12
13
14
15
16
17
18
19
20
21
22
23
24
25
26
27
CBD
Berea
Sydenham
Cato Manor
Congella
Clairewood
Merewent
Jacobs
Prospecton
Isipingo
Folweni
Umlazi
Chatsworth
Pinetown South
Pinetown
Mpumalanga
New Germany
Clermont
Effingham
Newlands
KwaMashu
Ntuzuma
Inanda
Phoenix
Verulam
Tongaat
Other
Totals
Total
Passenger
Rides
23,840
1,788
2,349
4,406
1,063
91
3,919
377
786
4,423
4,242
37,395
7,362
7,636
3,626
4,606
316
6,927
158
3,821
14,167
19,401
9,688
10,694
4,555
4,884
14,618
197,138
Passenger rides by vehicle type
Rail
8,093
687
507
12,387
897
708
8,181
1,913
6,040
39,413
Taxi
6,270
330
945
3,241
417
1,839
25
424
2,046
3,889
14,859
4,078
4,761
926
3,566
6,927
3
2,158
4,069
8,581
6,129
8,736
4,133
2,696
7,491
98,539
Mynah
2,457
727
339
3,523
A.4
eThekwini’s Public Transport Plan
Passenger-km by vehicle type
Std Bus
7,020
44
1,065
1,165
646
91
1,573
352
362
2,377
353
10,149
2,387
2,875
1,992
1,040
316
155
1,663
1,917
10,820
3,559
1,958
422
275
1,087
55,663
Rail
138,196
7,443
4,327
193,682
12,378
7,438
139,927
54,666
124,813
682,870
Taxi
75,540
6,381
5,633
20,234
4,785
21,084
69
1,515
29,303
51,073
227,046
69,493
67,577
15,900
73,813
77,652
15
33,964
71,603
157,204
138,485
194,532
60,668
22,359
131,456
1,557,380
Mynah
8,890
2,206
1,040
12,136
Std Bus
64,185
213
7,277
8,084
5,346
373
13,454
4,969
1,988
17,902
2,974
127,830
30,762
36,734
22,378
23,184
2,629
1,159
18,693
22,793
166,437
67,520
34,742
5,301
2,148
16,556
705,229
Table A.4:
eThekwini Public Transport Plan
Service and Trip Characteristics
Annual Service Kilometres (Year 2000)
Utilisation by vehicle type
Route Origin
1
2
3
4
5
6
7
8
9
10
11
12
13
14
15
16
17
18
19
20
21
22
23
24
25
26
27
Rail
million km
CBD
Berea
Sydenham
Cato Manor
Congella
Clairewood
Merewent
Jacobs
Prospecton
Isipingo
Folweni
Umlazi
Chatsworth
Pinetown South
Pinetown
Mpumalanga
New Germany
Clermont
Effingham
Newlands
KwaMashu
Ntuzuma
Inanda
Phoenix
Verulam
Tongaat
Other
Totals
0.76
0.12
0.07
0.63
0.02
0.06
0.45
0.07
0.41
2.60
Taxi
million km
Mynah
million km
7.55
0.61
0.60
2.00
0.47
2.01
0.01
0.17
2.80
4.54
21.94
6.71
6.45
1.56
7.24
7.50
0.00
3.18
7.11
15.45
13.78
18.93
5.67
1.97
12.60
150.84
1.75
0.60
0.14
2.49
Std Bus
million km
7.66
0.27
0.66
0.41
0.54
0.08
1.67
.029
0.23
0.91
0.18
6.98
2.52
1.19
1.43
0.77
0.10
0.42
1.71
1.55
7.62
2.41
1.41
0.26
0.55
1.84
43.66
A.5
eThekwini’s Public Transport Plan
Table A.5:
eThekwini Public Transport Plan
Service and Trip Characteristics
Service Utilisation by Route Group from Origin Zones (Year 2000 AM Peak Hour)
Utilisation by vehicle type
Route Origin
1
2
3
4
5
6
7
8
9
10
11
12
13
14
15
16
17
18
19
20
21
22
23
24
25
26
27
Overall
CBD
Berea
Sydenham
Cato Manor
Congella
Clairewood
Merewent
Jacobs
Prospecton
Isipingo
Folweni
Umlazi
Chatsworth
Pinetown South
Pinetown
Mpumalanga
New Germany
Clermont
Effingham
Newlands
KwaMashu
Ntuzuma
Inanda
Phoenix
Verulam
Tongaat
Other
Averages
0.20
0.09
0.31
0.60
0.30
0.09
0.20
0.32
0.24
0.57
0.82
0.39
0.46
0.73
0.27
0.74
0.50
0.83
0.05
0.41
0.32
0.54
0.69
0.74
0.79
0.55
0.36
0.40
Rail
Taxi
0.15
0.05
0.81
0.84
0.75
0.81
0.82
0.05
0.84
0.73
0.74
0.84
0.91
0.83
0.83
0.84
0.82
0.82
0.25
0.40
0.10
0.25
0.60
0.25
0.21
0.83
0.34
0.86
0.81
0.82
0.81
0.83
0.86
0.92
0.84
0.83
Mynah
Std Bus
0.31
0.22
0.46
0.16
0.02
0.21
0.37
0.19
0.09
0.15
0.32
0.16
0.37
0.31
0.35
0.23
0.58
0.30
0.57
0.50
0.05
0.21
0.28
0.41
0.53
0.46
0.39
0.07
0.17
0.31
0.30
A.6
eThekwini’s Public Transport Plan
ANNEXURE B
Enforcement Service Agreement
B.1
Application Procedure and forms for Rank Permit
B.1
B.2
Section 12 – Traffic Bylaws for Metered Taxi’s
B.2
eThekwini’s Public Transport Plan
Annexure B
ANNEXURE ‘B’ :
B.1 MINI BUS AND METERED TAXI RANK PERMITS AND HOLDING SPACE
ALLOCATION.
1.
Minibus Taxi Rank Permit – Submission of Application
Where an operating licence has been approved subject to the operator
obtaining a rank permit, the procedure set out below must be followed :a) The applicant must submit the following documentation with an
application form obtained from the Metro police :¾
¾
¾
¾
¾
¾
Original ID document
Certified copy of ID document
Original Certificate of Fitness
Certified copy of Certificate of Fitness
Original of OLB permit/licence
Certified copy of OLB permit/licence
Note: The application must be signed and stamped by the taxi
association Chairman with a DB number
b) Metro Police check with NATIS to ensure the Association is
registered.
c) The operator must agree to the following conditions.
(i)
Number of taxi’s per destination must be restricted to
the number of taxis that can be accommodated within
marked bays in the rank.
(ii)
No washing of vehicles is allowed to take place other
than in dedicated washbays.
(iii)
Excess vehicles may not hold/park in or near the rank.
(iv)
Vehicles must be driven slowly in ranks with due regard
to the safety of pedestrians.
(v)
No hooting or loud music is permitted at or near ranks.
Note: Other conditions may be added from time to time.
2.
Issuing of Minibus Taxi Rank Permit
The rank permit will be issued on approval of the above documentation
and checks. Currently no check is made on availability of loading space at
ranks; however, in future availability of ranking space will form part of the
approval process.
3.
Minibus Taxi Holding Space
Currently no check is made on the availability of holding space for a
minibus operator applying for a rank permit.
eThekwini’s Public Transport Plan
B.1
Annexure B
In future this check will be carried out as part of the process and it will be a
requirement of the conditions of approval of a rank permit that a suitable
holding space can be allocated to the applicant.
4.
Metered Taxi Rank Permit – Submission of Application
The applicant must submit the following documentation :¾
¾
¾
¾
¾
¾
5.
Original ID document
Certified copy of ID document
Original Certificate of Fitness
Certified copy of Certificate of Fitness
Original of OLB permit/licence
Certified copy of OLB permit/licence
Priority in Issuing of Metered Taxi Rank Permits
In issuing of metered taxi rank permits first preference will be given to
operators who currently hold a valid operating permit but have no rank
permit. Amongst these operators priority will be based on those who have
operated the longest.
6.
Rank Permit Conditions – Section 12
A Section 12 (Rank Permit Conditions) must be attached to the operating
licence.
B2
CITY OF DURBAN : ROAD TRAFFIC BY – LAWS
SECTION 12 TRAFFIC BYLAWS FOR METERED TAXIS
(1)
Every taxi plying for hire in the City shall be fitted with a taximeter in
compliance with this By-law.
(2)
The taximeter shall be fitted to the taxi in such a position that the dial shall be
plainly visible to any passenger in the rear seat of the taxi, and at night time
the dial shall be illuminated so as to be so visible.
(3)
The dial of a taximeter fitted to a taxi shall at all times be kept free of all
forms of obstruction.
(4)
After a taxi has been fitted with a taximeter it shall be submitted to the Chief
Constable, who, if he is satisfied that the requirements of this By-law have
been complied with and the taximeter is in good and correct working order,
shall fix his official seal to the taximeter.
B.2
eThekwini’s Public Transport Plan
Annexure B
(5)
Every taximeter shall be maintained in good working order, with the seal
intact.
(6)
Whenever a taximeter requires repair or re-adjustment, it shall be submitted
to the Chief Constable, who shall destroy and remove the seal therefrom.
After the taximeter has been repaired or re-adjusted, or whenever the seal
upon any taximeter has been inadvertently broken or damaged, the Chief
Constable, upon application, on being satisfied that such taximeter is in good
an correct working order, shall affix a fresh seal thereto.
(7)
a – The driver of any taxi, fitted with a taximeter, which has been hired shall,
as soon as he has been hired, and not sooner, set the taximeter in motion
and shall stop it immediately upon the termination of such hiring.
b – Immediately upon the occurrence of any stoppage of any taxi, except a
stoppage caused by traffic congestion or a stoppage in obedience to a
direction by a passenger, the driver shall stop the taximeter, indicate such
stoppage on the taximeter, and shall not re-start the taximeter until such
stoppage has ended.
(8)
The driver of a taxi shall at all times have available in the taxi a copy of this
By-law and shall produce the same for inspection by any passenger or police
officer at any time upon demand.
(9)
It shall be an offence for any person :a – to destroy, break or tamper with the seal upon any taximeter, unless it is
proved that such destruction or breaking was not wilful;
b – to adjust, tamper or interfere with any taximeter or any fitting thereof so
as to cause the taximeter to register a fare other than the correct fare
authorised and chargeable by law.
(10) The driver of any taxi (except a taxi registered under the laws governing the
registration of motor vehicles at some place outside the City of Durban which
is plying for hire from a point outside the City to a point within it or vica-versa)
shall be guilty of an offence who within the City :a – plies for hire with a taxi which is not fitted with a taximeter in good
working order with the Chief Constable’s seal intact;
b – plies for hire with a taxi which is fitted with a taximeter, duly sealed, but is
fitted with tyres of a size different from those specified for use with such
taximeter.
B.3
eThekwini’s Public Transport Plan
Annexure B
c – plies for hire with a taxi which is fitted with a taximeter, duly sealed, but
whose tyres are inflated to a lower pressure than the pressure prescribed
therefore, unless it is proved that such lower pressure has not been wilfully
caused;
d – contravene Sub-section (7) or (8) of this By-law.
(11) No person travelling in a taxi shall, without lawful cause, fail or refuse to pay
the legal fare therefor as recorded on the taximeter.
(12) The driver of a taxi, when engaged, shall drive to his destination by the
shortest route, unless otherwise directed by the hirer.
B.4
eThekwini’s Public Transport Plan
Annexure B
ANNEXURE C
Service Level Agreement
for
Public Transport Law Enforcement
eThekwini’s Public Transport Plan
Annexure C
FINAL DRAFT
SERVICE LEVEL AGREEMENT
FOR
PUBLIC TRANSPORT LAW ENFORCEMENT
IN THE
ETHEKWINI TRANSPORT AUTHORITY AREA
ENTERED BETWEEN
THE ETHEKWINI TRANSPORT AUTHORITY
AND
THE ETHEKWINI METROPOLITAN POLICE SERVICE
May 2003
eThekwini’s Public Transport Plan
Annexure C
INDEX
Clause
1.
2.
3.
4.
5.
6.
7.
8.
9.
10.
11.
12.
13.
14.
15.
16.
17.
18.
Addendum:
Subject Matter
Parties to the Agreement
Scope of the Agreement and Jurisdiction
Specific Functions Required to be Performed
Coverage Requirements and Performance Measurement
Service Commencement
Duration of Agreement
Resourcing and Training
Reimbursement for Services Rendered
Management of the Contract and Taking of Instructions
Right of Inspection and Investigation
Powers of Authorised Officers and Impartiality
Impoundment
Required Conduct and Indemnification
Cession, Delegation and Assignment
Breach and Non Performance
Disputes
Totality of the Agreement and Amendments
Signatories to the Agreement
Service Specification
eThekwini’s Public Transport Plan
Page No.
C.1
C.1
C.2
C.2
C.3
C.3
C.3
C.4
C.4
C.5
C.5
C.6
C.6
C.7
C.7
C.8
C.8
C.8
C.9-10
Annexure C
SERVICE LEVEL AGREEMENT FOR PUBLIC LAW ENFORCEMENT
1.
PARTIES TO THE AGREEMENT
The parties to this Agreement are as follows:
1.1
1.2
The eThekwini Transport Authority (hereinafter referred to as the “Client”)
and
The eThekwini Metropolitan Police Service (hereinafter referred to as the
“Enforcement Agent”) with whom the Client concludes this service level
agreement.
2.
SCOPE OF THE AGREEMENT AND JURISDICTION
The Agreement governs the provision of the following services:
2.1
public transport law enforcement as envisaged in Part 18 of the National
Land Transport Transition Act, 2000 (Act No. 22 of 2000) (hereinafter
referred to as the NLTTA), Part XII of the KwaZulu-Natal Interim Minibus
Taxi Act, 1998 (Act No. 4 of 1998) (hereinafter referred to as the IMTA)
and Sections 31 to 34 of the Road Transportation Act, 1977 (Act No. 74 of
1977) (hereinafter referred to as the RTA).
In terms of this Agreement the Client appoints the Enforcement Agent to
regulate market entry by operators who provide public transport services
within the area of jurisdiction of the Client (hereinafter referred to as the
“designated transport area”).
2.2
monitoring and regulating the conduct of operators and drivers of public
transport services to ensure compliance with the Operational Code of
Conduct for Operators of Public Transport Services and Drivers of Public
Transport Vehicles (hereinafter referred to as the “Public Transport
Operational Code”), prescribed by the MEC for Transport in KwaZuluNatal in Provincial Gazette No. 6020 dated 23 April 2001 (Provincial
Notice No. 149, 2001).
2.3
enforcement of all municipal by-laws associated with the operation of
public transport services, including the regulation of access to and use of
transport facilities such as ranks, termini, holding areas, bus stops and lay
byes.
2.4
enforcement of quality control and safety aspects associated with the
operation of public transport vehicles, as provided for in the National Road
C.1
eThekwini’s Public Transport Plan
Annexure C
Traffic Act, 1996 (Act No. 93 of 1996) (as amended) and relevant
regulations.
3.
SPECIFIC FUNCTIONS REQUIRED TO BE PERFORMED
More specifically the Enforcement Agent shall be required to perform the
following functions on behalf of the Client:
3.1
Enforcement of operating licences and public road carrier permits
necessary for authorised operation of public transport services within the
designated area;
3.2
Enforcement of rank permits;
3.3
Enforcement of public transport operations from a Road Traffic Act
perspective;
3.4
Monitoring for operator and driver compliance with the “Public Transport
Operational Code”;
3.5
Impoundment of vehicles of public transport operators found to be
operating illegally;
3.6
Provision of security at vehicle pounds to safeguard impounded vehicles;
3.7
Implementation of administrative procedures to ensure accountability for
the receipt and subsequent release of impounded vehicles;
3.8
Submission of regular reports containing detailed statistics to substantiate
the frequency of checking and the extent of enforcement coverage
undertaken; and
3.9
Submission of regular progress reports covering all contractual obligations
covered by this Agreement.
4.
COVERAGE REQUIREMENTS AND PERFORMANCE MEASUREMENT
4.1
The Enforcement Agent shall be required to provide for the checking of
operating licences, public road carrier permits and rank permits within the
designated transport area in such a manner as will guarantee that the
following broad requirements prescribed by the Client are met:
4.1.1
Systematic coverage of all public transport routes, corridors or
areas on a programmed basis;
C.2
eThekwini’s Public Transport Plan
Annexure C
4.1.2
4.1.3
4.1.4
Monitoring on weekdays, weekends and public holidays, as well as
during peak and off-peak periods;
Comprehensive monitoring of each individual route at least every
second month; and
An element of ad hoc random checking.
4.2
The Client shall provide the Enforcement Agent with a detailed service
specification clearly setting out the level of enforcement coverage required
in terms of this Agreement. The detailed service specification shall be laid
down in an addendum to this Agreement signed by both parties.
4.3
The basis for performance measurement shall be agreed between the
parties at the inception of this Agreement. Thereafter, any changes shall
be committed to writing and agreed between the parties.
4.4
The written approval of the Client shall be obtained before the level of
monitoring may be changed by the Enforcement Agent.
5.
SERVICE COMMENCEMENT
The enforcement services required to be performed shall commence on
…………………………… or such later date as may be agreed between the
parties.
6.
DURATION OF AGREEMENT
6.1
This Agreement shall be valid for an initial period of …… years.
6.2
Thereafter the Client may renew the contract annually on terms and
conditions to be renegotiated.
6.3
Should the client, at any stage, decide to terminate the contract the
Enforcement Agent may at the Client’s discretion be called upon to
continue rendering the contracted services on the same terms and
conditions as will be applicable at that time, for an additional period not to
exceed (3) months.
7.
RESOURCING AND TRAINING
7.1
The Enforcement Agent shall be required to deploy a dedicated Public
Transport Enforcement Squad (hereinafter referred to as the “PTES”) to
provide the public transport law enforcement services specified in this
Agreement.
C.3
eThekwini’s Public Transport Plan
Annexure C
7.2
At the onset of this Agreement, the PTES shall comprise of thirty (30)
enforcers. The initial deployment of enforcement officers by rank shall be
as follows:
-
one (1) Superintendent (Divisional Commander) to head up the
PTES
-
two (2) Inspectors
-
four (4) Sergeants
-
twenty-three (23) Constables
7.3
The complement of enforcers shall be reviewed annually in the light of
Client requirements affecting levels of coverage, frequency of checking or
any other changes required to satisfy Client needs. Amended service
specifications arising out of this annual review shall be agreed between
the Enforcement Agent and the Client in sufficient time to enable
implementation of any changes to coincide with the start of the municipal
financial year.
7.4
The training of members of the PTES on the specialised enforcement
activities required to be performed in terms of this Agreement shall be the
responsibility of the Enforcement Agent. In this regard, the Enforcement
Agent shall ensure that members of the PTES are fully conversant with all
legislation relevant to the enforcement services required to be performed
in terms of this Agreement.
8.
REIMBURSEMENT FOR SERVICES RENDERED
8.1
The budgetary requirement necessary for delivery of the services covered
by this Agreement shall be agreed to and confirmed in writing at the
inception of the Agreement and annually thereafter to coincide with the
start of the municipal financial year.
8.2
The administrative arrangements pertaining to the method and frequency
of reimbursement of the Enforcement Agent for services rendered shall be
agreed between the parties at the inception of this Agreement.
9.
MANAGEMENT
INSTRUCTIONS
9.1
Compliance with the terms of this Agreement will be monitored by a
Steering Committee consisting of representatives from both parties. A
representative of the Client shall chair the Steering Committee meetings.
The Client shall provide secretarial support at such meetings.
OF
THE
CONTRACT
AND
TAKING
OF
C.4
eThekwini’s Public Transport Plan
Annexure C
9.2
The Steering Committee shall meet on a monthly basis. The Enforcement
Agent shall as a matter of course table a report containing a description of
the work done, the utilization of human resources and details of the
incidental expenses incurred during the period under review.
9.3
In the discharge of its obligations under this Agreement the Enforcement
Agent shall be required to take instructions from designated officials of the
Client. The names of such officials shall be communicated by the Client to
the Enforcement Agent at the onset of this Agreement.
9.4
The Client through its designated officials shall, at any time, be entitled to
instruct the Enforcement Agent to alter the planned activities of the PTES
in order to respond to specific Client needs or emergencies dictating that
the activities of the PTES be concentrated on a particular route, area or
hotspot identified by the Client as requiring priority or urgent attention.
10.
RIGHT OF INSPECTION AND INVESTIGATION
10.1
The Client shall, without prior notification, have the right at any time to
undertake inspections of the activities of the PTES. Such inspections will
in no way exempt the Enforcement Agent from any of its duties and
obligations.
10.2
The Client and any person authorised by the Client shall, at all reasonable
times, have access to all premises, offices, vehicles and equipment
utilised by the Enforcement Agent in the provision of the services covered
by this Agreement, including vehicle pounds and impounded vehicles
under the control of the Enforcement Agent. The Enforcement Agent shall
render the Client every assistance in terms of obtaining such access or the
right thereto.
10.3
The Client shall have the right, at any time, to investigate any complaints,
objections or representations made by operators, drivers, passengers or
other interested persons or institutions relating to the services provided in
terms of this Agreement.
11.
POWERS OF AUTHORISED OFFICERS AND IMPARTIALITY
11.1
The Enforcement Agent shall be responsible for ensuring that enforcers
deployed in terms of this Agreement are, at all times, empowered in line
with the legal requirements of an “authorised officer” referred to in Section
1 (1) (ii) of the NLTTA, Section 1 of the IMTA and Section 1 of the RTA. In
addition, thereto, the Enforcement Agent shall ensure that members of the
PTES are fully conversant with all legislation governing the aspects of
enforcement required to be undertaken in terms of this Agreement.
C.5
eThekwini’s Public Transport Plan
Annexure C
11.2
The Enforcement Agent shall be expected to conduct the enforcement
function envisaged in this Agreement in a fair and impartial manner,
thereby ensuring equality of treatment for all operators of public transport,
regardless of the particular mode that they may operate.
11.3
Notwithstanding that, under the terms of this Agreement, the duties and
responsibilities of members of the PTES refer to specialised activities
associated with public transport law enforcement, the Client gives consent
for members of the PTES in parallel with contracted duties to deal with all
other forms of enforcement normally associated with the positions of
enforcer which they hold as members of the Enforcement Agent, on the
understanding that the focus of their attention shall not unduly shift from
the specialised enforcement functions required to be performed in terms of
this Agreement.
12.
IMPOUNDMENT
12.1
The Enforcement Agent shall be required to establish vehicle pounds for
use in the storage of impounded vehicles. In addition the Enforcement
Agent shall be required to provide the necessary security and manpower
at vehicle pounds.
12.2
The Enforcement Agent shall be responsible for the safekeeping of
impounded vehicles whether such vehicles are in transit following
impoundment or in storage at a vehicle pound. To this end the
Enforcement Agent shall be required to develop detailed impoundment
procedures for approval by the Client.
12.3
For purposes of ensuring accountability for impounded vehicles the
Enforcement Agent shall be required to utilize the prescribed
Impoundment Control Form enclosed as Appendix “A” to this Agreement.
This form shall be made up in triplicate. The original shall be kept by the
Enforcement Agent. The first copy shall be handed to the driver of the
vehicle and the second copy shall be submitted to the Client once the
vehicle has been collected from the pound.
13.
REQUIRED CONDUCT AND INDEMNIFICATION
13.1
The Enforcement Agent shall exercise the highest degree of
professionalism, care and diligence in the provision of the services and
shall provide the services to the satisfaction of the Client, in strict
accordance with the terms of this Agreement.
C.6
eThekwini’s Public Transport Plan
Annexure C
13.2
Should the Enforcement Agent become aware of any circumstances or
problems preventing it from discharging its obligations under this
Agreement, it shall immediately advise the Client and also indicate the
extent to which the provision of the services will be affected thereby. Such
advice must be confirmed in writing as soon as reasonably possible.
13.3
The Enforcement Agent shall indemnify the Client against any claims that
may arise as a consequence of any of the following circumstances:
13.3.1 The use of enforcers as members of the PTES who do not comply
with the definition of an authorised officer as set out in Section 1 (1)
(ii) of the NLTTA, Section 1 of the IMTA and Section 1 of the RTA;
13.3.2 Damage to impounded vehicles or the release of vehicles to
persons other than registered owners;
13.3.3 Gross negligence on the part of members of the PTES whilst
carrying out the functions set out in this Agreement; and
13.3.4 Gross negligence on the part of any other officials of the
Enforcement Agent who may directly or indirectly be involved in
activities related to this Agreement.
14.
CESSION, DELEGATION AND ASSIGNMENT
The Enforcement Agent shall not cede its rights or delegate its obligations
under the Agreement or any part thereof, or assign or transfer any benefit,
interest or obligation connected with this Agreement to another entity
without the prior written consent of the Client.
15.
BREACH AND NON PERFORMANCE
15.1
Where any party finds the other to be in breach of this Agreement
notification of such breach shall, in the first instance, be reported in writing
by the aggrieved party at the next meeting of the Steering Committee
referred to in Clause 9.1.
15.2
The report referred to in Clause 15.1 shall specify the period within which
the aggrieved party expects the breach to be rectified.
15.3
The aggrieved party shall give the party in breach of this Agreement a
reasonable time to remedy the situation having regard for the nature of the
breach and the period reasonably required to remedy such breach,
provided that such period shall not exceed thirty (30) days. Should the
breach not be remedied within the stipulated period to the satisfaction of
the aggrieved party, a formal dispute may be declared in terms of Clause
16.
C.7
eThekwini’s Public Transport Plan
Annexure C
15.4
Where it is apparent that the functions entrusted to the Enforcement Agent
as referred to in Clause 3 of this Agreement are not being satisfactorily
performed, the Client shall raise the matter for discussion at the next
meeting of the Steering Committee. Should the problem not be resolved to
the satisfaction of the Client, a formal dispute may then be declared in
terms of Clause 16.
16.
DISPUTES
16.1
In the event of unresolved disputes arising between the parties, the matter
in dispute shall be referred to the Head of the eThekwini Transport
Authority and the Head of the eThekwini Metropolitan Police Service for
consideration.
16.2
Should the step outlined in Clause 16.1 above fail to settle the dispute, the
matter shall then be jointly referred by the parties to the City Manager for
decision on whether to rule thereon or have the dispute reported to
Council for a final ruling.
16.3
Where the City Manager elects to rule on a dispute the parties shall be
bound to accept such ruling as final.
17.
TOTALITY OF THE AGREEMENT AND AMENDMENTS
This Agreement inclusive of any appendices and addenda contains the full
contract between the parties. No amendment to or cancellation of this
Agreement shall be valid unless reduced to writing and signed by both
parties.
18.
SIGNATORIES TO THE AGREEMENT
Signed at ………………………………….. on this …………….. day of ..………………………… 2003.
By: ________________________________
On behalf of the Head: Transport Authority
By: _____________________________
On behalf of the Head: Metropolitan
Police Service
Witnesses:
1.
__________________________
2.__________________________
C.8
eThekwini’s Public Transport Plan
Annexure C
ADDENDUM A
ETHEKWINI TRANSPORT AUTHORITY
PUBLIC TRANSPORT ENFORCEMENT STRATEGY
SERVICE SPECIFICATION
1.
PREAMBLE
The ETA has as one of its main objectives to promote and assist
public transport. The public transport enforcement strategy is
aimed at restoring and maintaining law and order in the industry,
for the benefit of passengers, and the legal operators. Those who
comply with the law will have nothing to fear.
2.
STAFF AVAILABLE
1 Superintendent
4 Sergeants
2 Inspectors
28 Constables
Four teams will operate each with one sergeant and seven
constables.
3.
PROBLEMS TO BE TARGETED AT RANKS
(both off street and on street ranks and stops)
Rank permits issued by the City
¾ Enforce and fine
¾ For second offenders, eviction from the rank and impound
if they disobey.
Other Activities
¾ Illegal vehicles on the rank
¾ Public Transport vehicles parking / ranking outside of
demarcated areas.
¾ Washing of vehicles other than in washing bays.
¾ Obstruction of vehicle or pedestrian movements.
¾ Double Parking.
¾ Ranking at stops.
¾ Illegal signage.
¾ Repairing vehicles.
¾ Illegal informal traders.
C.9
eThekwini’s Public Transport Plan
Annexure C
4.
PROBLEMS TO BE TARGET ON ROUTES
Route permits issued by Permit Board
¾ Enforce and fine.
¾ For second offenders impound vehicles.
Other activities
¾
¾
¾
¾
¾
¾
¾
¾
¾
5.
Check for valid C.O.F.
Check for vehicle roadworthiness
Check for stolen vehicles.
Check that driver has
Valid licence
Valid PDP
Check for moving offences including recklessness.
Speed enforcement.
Touting.
Loud music.
Overloading.
ONGOING MONTHLY ENFORCEMENT PROGRAMME
Week 1
Week 2
Week 3
Week 4
6.
-
All central area ranks
All central area routes
All outer area ranks
All outer area routes
EVALUATION REPORT
Monthly evaluation report to be submitted to ETA to indicate what
areas were covered, the number of offences, the service provided,
and the outcomes / result.
C.10
eThekwini’s Public Transport Plan
Annexure C
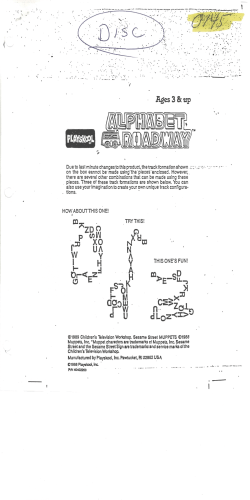
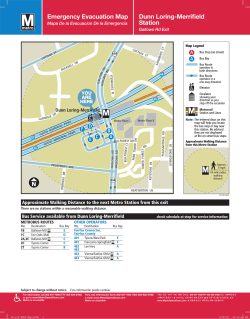


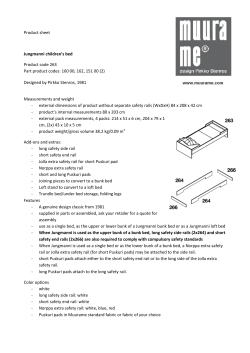

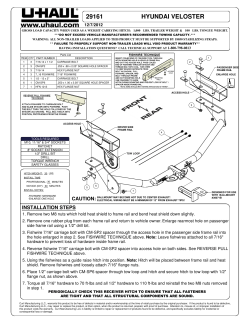
© Copyright 2026