
Document 168432
National Railroad Passenger Corporation AMTRAK Fiscal Year 2013 Budget and Comprehensive Business Plan Operating, Capital Programs And Debt Service Expense Budget May 2013 Table of Contents Introduction ..................................................................................................................................... 4 Strategic Vision and Key Management Actions ......................................................................... 4 Financial Foundation .................................................................................................................. 5 Corporate Realignment ............................................................................................................... 6 Superstorm Sandy ..................................................................................................................... 10 Federal Support ......................................................................................................................... 11 Budget Development ................................................................................................................ 13 Operating Budget .......................................................................................................................... 16 Revenue..................................................................................................................................... 16 Expenses ................................................................................................................................... 20 Salaries, Wages, Taxes and Employee Benefits ................................................................... 21 Fuel, Power and Utilities....................................................................................................... 21 Other Expenses ..................................................................................................................... 23 Capital Budget .............................................................................................................................. 24 ADA Compliance...................................................................................................................... 24 Fleet Programs .......................................................................................................................... 25 Northeast Corridor (NEC) Investments .................................................................................... 31 State of Good Repair (SOGR): A Foundation for Growth ................................................... 31 Beyond SOGR: A Vision for the Future ............................................................................... 33 Implementing the Vision: The Gateway Program ................................................................ 33 Debt Service and Debt Related Equipment Purchases ................................................................. 36 Principal and Interest ................................................................................................................ 36 Sources and Uses of Cash – Budget Basis .................................................................................... 37 Department Operating and Capital Programs ............................................................................... 38 Amtrak Police Department ....................................................................................................... 38 Corporate Research and Strategy .............................................................................................. 40 Chief of Customer Service ........................................................................................................ 41 Emergency Management and Corporate Security .................................................................... 42 Engineering ............................................................................................................................... 45 Finance ...................................................................................................................................... 50 Government Affairs and Corporate Communications .............................................................. 52 NEC Infrastructure and Investment Development .................................................................... 54 Human Capital Department ...................................................................................................... 56 Information Technology ........................................................................................................... 58 Marketing and Sales .................................................................................................................. 60 Mechanical ................................................................................................................................ 64 Office of the General Counsel .................................................................................................. 67 Chief of Operational Research .................................................................................................. 70 Procurement & Materials Management .................................................................................... 71 Real Estate Development .......................................................................................................... 73 Chief Safety Officer .................................................................................................................. 75 Transportation ........................................................................................................................... 76 Corporate Common ................................................................................................................... 79 Appendices .................................................................................................................................... 81 Summary Income Statement by Major Account ....................................................................... 81 Summary Income Statement by Department and Major Account ............................................ 82 Revenue and Expenses by Department ..................................................................................... 89 Summary Income Statement by Major Account and Activity .................................................. 90 2 of 95 Reconciliation of FY2013 Operating Budget to FY2012 Operating Budget ........................... 91 GAAP Basis Summary Income Statement ............................................................................... 92 Monthly Average and End of Year Headcount by Department ................................................ 93 Summary Metrics FY2011- FY2013 ........................................................................................ 94 Route Level Metrics .................................................................................................................. 95 Tables and Charts Chart 1 – History of Operating Deficits in 2012 Dollars ................................................................ 5 Chart 2 – History of Outstanding Debt ........................................................................................... 6 Table 3 – Recent Federal Appropriations ..................................................................................... 11 Chart 4 – Historical General Federal Appropriations (DOT Grant) ............................................. 12 Table 5 – New Activities and Initiatives....................................................................................... 14 Table 6 – Profit and Loss Statement ............................................................................................. 16 Table 7 – Summary of Changes in Operating Revenue ................................................................ 18 Chart 8 – Ridership ....................................................................................................................... 19 Chart 9 – Ticket, Food and Beverage Revenue ............................................................................ 19 Table 10 – Reconciliation of FY2013 Operating Expense Budget to FY2012 Actuals ............... 20 Chart 11 – Salaries, Wages, Taxes and Employee Benefits ......................................................... 21 Chart 12 – Diesel Fuel .................................................................................................................. 22 Chart 13 – Fuel, Power and Utilities............................................................................................. 23 Table 14 – Summary Capital Programs ........................................................................................ 24 Table 15 – Summary FY2013 Capital Program Budget by Department ...................................... 24 Table 16 - Rolling Stock Count and Availability ......................................................................... 29 Table 17 – Infrastructure Funding Plan ........................................................................................ 32 Table 18 – Debt Service ................................................................................................................ 36 Table 19 – Leases in Treasury MOU – Early Buyout Options ..................................................... 36 Table 20 – Simple Sources and Uses ............................................................................................ 37 3 of 95 Introduction The National Railroad Passenger Corporation (Amtrak) was incorporated in 1971 pursuant to the Rail Passenger Service Act of 1970 and is authorized to operate the national rail passenger transportation system as defined in the Passenger Rail Investment and Improvement Act of 2008 (PRIIA). Amtrak operates more than 300 trains per day over more than 40 routes, carries a daily average of 85,000 passengers and employs approximately 20,000 people. Amtrak’s FY2012 revenue totaled $2.8 billion and FY2013 revenue is projected to be $2.9 billion. In addition to providing the full range of functions and activities required to operate the national train system, Amtrak engages in related ancillary business activities, including: Operating commuter railroads under contract to their agencies Providing infrastructure access to commuter agencies and freight railroads Performing rail services for other rail operators, both commuter agencies and freight railroads, on a reimbursable basis Management and leasing of commercial real estate Strategic Vision and Key Management Actions In October 2011 Amtrak released its new Strategic Plan, covering fiscal years 2011 through 2015. This plan communicates the vision of Amtrak’s management and Board of Directors for the company and elaborate set of supporting strategies designed to achieve that vision. The plan is focused on improving financial performance, safety, and customer service. It contains the following vision statement for Amtrak: Amtrak is America’s first intercity travel choice for connections to and between the nation’s key metropolitan areas, providing customer-driven, safe, environmentally-sustainable, energy-efficient and inter-modally linked service to passengers, communities and partners. Through recognized organizational excellence, Amtrak’s diverse and talented team will lead the development and growth of the high-speed and intercity passenger rail system in North America. In support of this statement, the Strategic Plan establishes the following corporate goals that align with the Amtrak vision: Goal 1 – Safety and Security: Become North America’s safest, most secure railroad by creating a collaborative, team-oriented workplace culture that minimizes risks and maximizes passenger and employee safety. Goal 2 – Customer Focus: Advance customer service quality by responding to the wants, needs and expectations of our customers in order to improve their experience and maximize passenger and partner satisfaction. Goal 3 – Mobility and Connectivity: Improve national mobility and connectivity by growing Amtrak’s business through new partnerships, routes and frequencies to increase ridership system wide. Goal 4 – Environment and Energy: Contribute to the nation’s environmental health by attracting automobile and air travelers to trains, while improving Amtrak’s efficiency and reducing transportationrelated carbon emissions and fossil fuel consumption. Goal 5 – Financial and Organizational Excellence: Attain a standard of organizational excellence by aligning our products, services, processes and culture with stakeholder expectations to improve financial performance and overall business results. The Strategic Plan includes measurable metrics and improvement targets for each of these goals. In order to accomplish these corporate goals and achieve the improvement targets, the Strategic Plan specifies the following seven corporate strategies: Strategy 1 – Continue and expand Safe-2-Safer, our proven behavior-based change initiative in order to improve our culture and other areas critical to financial and organizational excellence. Strategy 2 – Integrate our field operating departments within geographic divisions to maximize collaboration, efficiency and service delivery. 4 of 95 Strategy 3 – Implement best practices related to human capital management in order to develop a workforce that is best equipped to achieve our corporate goals. Strategy 4 – Expand our use of risk management principles to further improve our multi-layered security program so we can better prevent and deter acts of terrorism and criminal behavior within our system. Strategy 5 – Expedite our ongoing programs to make Amtrak accessible for all individuals. Strategy 6 – Identify and invest in systems and technologies that will reduce both energy usage and operating expenses. Strategy 7 – Establish business lines within the company to better manage our financial performance and respond to the wants, needs and expectations of our various customer groups. Amtrak’s Strategic Plan is designed to be a living document that is updated periodically. A refreshed Strategic Plan that will update and extend the vision beyond FY2015 is under development and is expect to be delivered in early FY2014. Financial Foundation Corporate goal 5 establishes Financial Excellence as a primary objective. Amtrak has devoted considerable effort to improving our financial position in recent years. Corporate debt today stands at less than half the level it reached in 2002, and in terms of constant-value dollars our need for operating support is roughly half of what it was in 2004. Amtrak’s financial condition has improved significantly in recent years, and the company has a strong financial base on which to build. Operational Efficiency Improvement In nominal dollars, Amtrak’s operating deficit in FY2012, excluding non-cash expenses, reached its lowest level since 1975, Amtrak’s fourth year of operations. Stated in constant dollars, the FY2012 deficit was the lowest in Amtrak’s history. A common measure of financial efficiency in passenger rail transportation is the proportion of operating expenses which are paid by the company’s revenue. In FY2012 Amtrak’s operating revenues covered 88% of operating expenses (excluding non-cash items) the highest passenger rail operating ratio in the United States and one of the highest in the world. When viewed in constant dollars, Amtrak’s history of operating deficits demonstrates consistent improvement over a long period. The chart below shows Amtrak’s operating deficits in constant 2012 dollars. As this chart demonstrates, Amtrak’s nominal 1975 operating deficit of $315.8 million would have been $1,373.1 million in 2012 dollars, peaking in 1981 at $1,858.7 million. Chart 1 – History of Operating Deficits in 2012 Dollars $2,000 $1,800 $1,600 $ millions $1,400 $1,200 $1,000 $800 $600 $400 2011 5 of 95 2009 Dollar conversion data for Chart 1 obtained from http://www.bls.gov/data/inflation_calculator.htm 2007 Constant 2012 Dollars 2005 2003 2001 1999 1997 1995 1993 Nominal Dollars 1991 1989 1987 1985 1983 1981 1979 1977 1975 $200 Debt Reduction Amtrak has worked hard to cut its debt. Total indebtedness peaked at $3.9 billion in FY2002, following financing of the Acela train sets, and had declined to $1.4 billion by December 31, 2012. Benefits of the reduction in debt include lower debt service payment, a better credit rating, and improved capacity to finance new equipment acquisitions. Chart 2 – History of Outstanding Debt 3.94 3.89 3.72 3.80 3.66 3.49 3.30 3.20 2.89 2.84 1.99 1.89 1.84 1.56 1.40 2013 2012 2011 2010 2009 2008 2007 2006 2005 2004 2003 2002 2001 2000 1999 Outstanding Debt - $ billions The reduction in debt has accelerated in recent years in part because Amtrak enjoyed special financing from the U.S. Treasury, authorized by Section 205 of the Passenger Rail Investment and Improvement Act of 2008 (PRIIA), that funded approximately $420 million of equipment lease buyouts. This investment will save approximately $582 million in future debt payments, in effect saving the taxpayers about $162 million in future interest payments. Amtrak has similar opportunities in FY2014. As the PRIIA-authorized Treasury program is ending at the conclusion of FY2013, Amtrak is requesting $196.5 million in FY2014 to exercise additional early buyout options that will save approximately $304 million dollars in future debt payments, saving the taxpayers another $107.5 million in future interest payments. Rating Agencies In the last few years, Moody’s raised Amtrak’s credit rating to A1 from A2, the highest rating that Moody’s has ever assigned to Amtrak, and Standard & Poor’s raised Amtrak’s credit rating from BBB+ to A –. Corporate Realignment As described above, Corporate Strategies 2 and 7 of the Strategic Plan lays out a comprehensive realignment of Amtrak’s business operations: Corporate Strategy 2: Integrate operational functions (Transportation, Mechanical, Engineering) within divisions to maximize collaboration, efficiency and improve service delivery. The product of this integration provides the building blocks for the creation of business lines (Corporate Strategy 7) and therefore the successful completion of Strategy 2 can be considered the key component of enacting the entire strategic plan. Corporate Strategy 7: Establish a business line focus within the company to better respond to the wants, needs and expectations of customer segments and improve financial performance. 6 of 95 The implementation of these strategies began with the creation of the Northeast Corridor Infrastructure and Investment Development (NECIID) business line in late 2011 (Strategy7). The implementation of Strategy 2 began in April, 2012. The initial phases of the realignment are expected to be complete in FY2014. Amtrak will require another year to fully align support systems and technologies to the new organization and thus FY2015 will be the first year in which all corporate capabilities are fully aligned. At the present time, many key reorganization decisions remain in the planning and development phase. Consequently, this document describes the realignment in current terms, with the stipulation that some aspects of the plan will be subject to revision. Corporate Strategy 2: Integrate Transportation, Mechanical & Engineering Functions Amtrak’s current structure follows a traditional department-based railroad organization, with three departments providing all of the railroad-specific operational functions. All train operations are staffed and managed by the Transportation Department, all rolling stock is maintained by the Mechanical Department, and all track infrastructure and stations are maintained by the Engineering Department. The guiding principle of the operations integration plan is the assignment of direct supervisory responsibility to the General Managers who will oversee each train operations business line (Strategy 7). The General Managers will supervise delivery of each element of train service delivery (train operations, station operations, mechanical services, and other services) in their geographic or service territory, rather than having those functions segregated along traditional departmental lines. The most important aspect of this approach is the integration of these functions within terminal groups. A terminal is an organization with geographic boundary that includes all stations, crew bases and mechanical facilities and functions within the geographically defined area. A terminal manager will have direct management authority and accountability over all operations functions within his or her territory. Each Amtrak terminal will have a single manager who is accountable for ensuring that passengers arrive at clean stations with excellent ticketing and boarding services, trains depart on time with superior customer service, and that equipment is clean, comfortable, and reliable. All terminal managers residing within a business line will report to the business line General Manager, in accordance with the general principles established by Strategy 7. Examples of integrated functions that will report to a terminal manager include: Crew bases that provide train crews (conductors, locomotive engineers, on-board services) to all trains operating from those crew bases. Terminal managers will be accountable for all personnel decisions including hiring and training. Mechanical facilities that provide train turnaround and repair services Station operations and personnel Those existing departments will continue as scaled-down and redefined organizations that support the business lines. “Support functions” will include provision of administrative, policy, and other services to support the terminals. These support functions include: Transportation Services: set, manage, and maintain operating rules and policies that ensure trains operate within Federal requirements; maintain relationships with host railroads; lead fuel conservation and cost reduction efforts Customer Services: oversee system operations including the Consolidated National Operations Center (CNOC); manage central food & beverage operations; provide crew management and scheduling services; establish and monitor station and on-board service level expectations; coordinate special trains and intermodal connectivity Safety Services: establish and enforce health and safety standards, policies, programs, initiatives, and reporting to ensure customer and employee safety; oversee environmental control issues; oversight of Operation RedBlock Mechanical Services: provide major overhaul work to rolling stock at Amtrak’s three mechanical back shops; provide rolling stock engineering and standards; manage fleet assignments The Engineering Department will remain intact, operate as a “Service Center”, and continue to provide maintenance and capital improvements to Amtrak’s owned infrastructure and facilities including the Northeast Corridor (NEC) Corporate Strategy 7: Establish a Business Line Focus Amtrak is establishing six “business lines” that focus on the overall performance of specific Amtrak products and services. The Strategic Plan includes detailed goals for each business line which are aligned with the corporate goals, as well as performance metrics and improvement targets. The six business lines are: 7 of 95 1. Northeast Corridor Infrastructure and Investment Development (NECIID) NECIID establishes a host railroad organization within Amtrak that is responsible for the planning, development, and delivery of Amtrak-owned Northeast Corridor infrastructure in support of train operations. NECIID will establish the capital investment priorities for Amtrak’s infrastructure and will manage the relationships and operating agreements with users that operate service on Amtrak’s NEC infrastructure, including Amtrak’s four train-operating business lines. NECIID will manage track assets as well as Amtrak’s stations and facilities within the Northeast Corridor. Key NECIID responsibilities presently include: NEC infrastructure planning and development NEC station planning and development Management of access agreements with all services and tenants operating on or making use of Amtrak’s NEC infrastructure including Amtrak’s own train operations business lines Establishment of a new cost allocation methodology for the use of NEC infrastructure as required by Section 212 of the Passenger Rail Investment and Improvement Act of 2008 (PRIIA) Capital project agreements with external partners NEC high-speed rail planning and development NECIID was the first business line to be established and key managers are in place. At this time the details of how the department will manage and price its business are under development. It is anticipated that new access agreements with train operators will be negotiated according to the requirements established by PRIIA Section 212. 2. Northeast Corridor Operations This business line will deliver integrated high-speed rail train operating services in the Northeast Corridor, including Acela Express, Northeast Regional and Keystone Service trains and subsequent generations of high-speed services within the NEC, as well as NEC train operations on behalf of Amtrak’s other operating business lines that use the NEC, including Long Distance, State-Supported, and Commuter services. This business line was established in October 2012. 3. State Supported Services Rail transportation and related services provided in partnership with state governments, including conventional passenger train operations, development of new high-speed rail services, equipment maintenance, service planning, marketing, and reservation systems. This business line was established in November 2012. 4. Commuter Services Rail transportation and related services provided as a contractor to local or regional commuter authorities, including passenger train operations, equipment maintenance and maintenance-of-way. This business line is currently under review. 5. Long-Distance Services This business line will operate Amtrak’s national network of 15 interstate routes of 750 miles or more in length that connect communities with the nation’s major regions. This business line was established in November 2012. 6. Corporate Asset Development The Corporate Asset Development business line will be a small group of professionals focused on identifying new revenue opportunities, including advancing the development and commercialization of Amtrak real estate, mechanical services, technical expertise, intellectual property and other resources in partnership with other Amtrak Business Lines. This business line remains in development. The four business lines that deliver Amtrak train operations (NEC Operations, Long Distance, State Supported, and Commuter Services) will be largely comprised of terminal groups supported by central operations services. The General Managers of the business lines will have direct management responsibility for the vast majority of Amtrak’s operating personnel. There will, however, be significant overlap in the train operations of the business lines. In the Northeast Corridor, terminals support train operations from all business lines, while off-corridor terminals may support any or all business lines other than NEC Operations. The owning business line will have the budget for all 8 of 95 functions and will be accountable for service delivery to the other business lines utilizing the terminal. Those relationships will be established via written service level agreements. In order to properly manage and fund these disparate businesses, Amtrak must properly assign costs to each business line. The exact methodology for distributing the costs of shared terminal services is under development. It is anticipated that FY2015 will be the first detailed Amtrak budget to be created in the new Business Line alignment. Corporate Department Realignments In addition to the integration of the operations functions and the creation of the six business lines, Amtrak is also realigning portions of its corporate support groups in order to provide better support to business line operations. These changes will include: Reassigning the former Policy & Development department’s State Contract responsibilities into the StateSupported Business Line. With the operations reorganization into terminals that comprise business lines, the remaining elements of the former Transportation department will be incorporated into the new Customer Service and Safety departments to better support the business lines. The Product Development and Food & Beverage functions have been consolidated into the new Customer Service support group within Operations. Advertising and sales continue as the Marketing and Sales organization. Functions relating to corporate security, threat assessment, emergency preparedness and response to incidents, and continuity of operations have been consolidated under a single command reporting directly to the Chief Executive Officer (CEO). Previously these functions were spread among multiple departments. The Environmental, Health, and Safety functions have been split and divided between the Law department (environmental compliance, public health), the Human Capital Management department (employee health services), and the Safety Services department (safety policies and programs, safety reporting, industrial hygiene). Realignment Progress and Milestones The following major milestones have been achieved in the Amtrak realignment: October 2011 – Strategic Plan published, establishing the realignment vision and outline November 2011 – Vice-President (VP) of Northeast Corridor Infrastructure and Investment Development business line is named. Government Affairs department absorbs the State Partnerships organization, thereby uniting Federal and state governmental relationships under common leadership until ultimate transfer to the State-Supported Services Business Line occurs. Voluntary separation program announced in advance of large scale reorganization. April 2012 – VP of Operations named and given responsibility for integrating operations functions. Emergency Management and Corporate Security department established, centralizing under one executive the responsibility for responding to emergencies, maintaining continuity of operations, and corporate security. June 2012 – Recruiting begins for General Managers of NEC Operations and Long Distance Operations business lines; Operations Transition Team named and tasked with managing the integration of operations functions July 2012 – Recruiting begins for Chief Transportation Officer and Chief of Customer Service October 2012 – General Manager named for the NEC Operations business line; the former Environmental Health and Safety department is dissolved and its functions shifted to the Operating, Law, and Human Capital departments November 2012 – General Manager named for the Long Distance business line December 2012 – Chief Transportation Officer named February 2013 – Chief of Customer Service named; recruiting begins for Chief of Operations Research and Planning 9 of 95 Superstorm Sandy Background On the evening of Monday, October 29, 2012 Superstorm Sandy made landfall on the New Jersey coast and slowly moved westward, covering the Northeast Corridor. As a precaution, Amtrak suspended service throughout the NEC prior to the storm’s arrival. The storm flooded four of the six underwater tunnels in the New York City area, flooded electrical power substation 41 in Kearny, New Jersey, caused washouts, and left debris on the track in numerous places, some of which also damaged the electric traction or signal systems. The flooded tunnels curtailed rail access to New York City for Amtrak and commuter rail carriers, and service disruptions continued after the tunnels were drained because the damage to the Kearny substation limited the number of trains that could be run per hour on the southern entry into New York. Partial service was restored between Washington, DC, and Newark, New Jersey on October 31, 2012. Full service in the NEC was restored on November 11, 2012. Identified direct operating repair costs associated with Superstorm Sandy damages for Amtrak are currently estimated at $66 million, but could increase over time. The estimate includes, but is not limited to, the costs associated with pumping and cleaning the tunnels in New York City, pumping, cleanup and electrical repairs to the Kearny, New Jersey electrical substation and the cost of removing debris from the right of way and repairing the damage from wind, water and deadfall. It is also estimated that Amtrak lost $28 million in direct ticket revenue during the time train service was suspended within the NEC. As of this date, the total estimated operational economic impact of Superstorm Sandy on Amtrak is $94 million. Need For Immediate Infrastructure Hardening The unprecedented flooding of Amtrak’s New York City rail tunnels and the resulting service outage into Manhattan highlighted the serious need for vital improvements, improved resiliency, and redundant capacity that will protect the existing Penn Station tunnel system from floods and other emergencies. Since no two flooded locations were breached in exactly the same way, a combination of solutions is needed to prevent future flooding or enhance the redundancy of the system. In December of 2012 Amtrak requested $276 million in supplemental FY2013 Federal funding to advance these measures. The improvements would include: Penn Station and Tunnel Improvements: Enhanced Protection Against Flooding or Emergency Disruptions – This package includes improvements to protect the existing tunnels and station complex from flooding and other emergency disruptions, and to improve system resiliency. Fully submersible dewatering pumps, control systems, and power supplies will be installed in the Hudson River and East River tunnels and at dikes and/or levees to protect tunnel portals, Penn Station, and Hudson Rail Yard in Harrison, New Jersey. Other measures include raising ventilation gratings in Manhattan, and flood protection for Penn Station Control Center’s electrical, power and control systems. Substation 41 in Kearny, NJ, which was completely flooded by Superstorm Sandy, would also be completely replaced and rebuilt at a new location and higher elevation, making it less susceptible to flooding. Penn Station and Tunnel Improvements: Enhanced Recovery Capability – These measures accelerate a recovery effort in the event that future flooding of the tunnels or Penn Station terminal complex does occur. Emergency generators would be installed at Penn Station, with sufficient capacity to run the complete station ventilation and dewatering systems. Amtrak would also acquire mobile pumps and a pipeline for water discharge, and reconfigure the dry standpipe system for secondary dewatering capacity. A program to provide alternative power feeds in cooperation with PSE&G and Consolidated Edison would be completed. The Gateway Program: Advancing Design and Early Construction Elements – In order to provide permanent and substantial new levels of flood prevention, redundancy, and capacity, Amtrak will advance design and early construction elements of the Gateway Program. This includes completing design and beginning construction of an 800-ft right of way preservation project through the Hudson Yards development between 10th and 11th Avenues to preserve the right-of-way for a future tunnel to Penn Station. It also includes construction of the first phase of the “Portal North” high-level bridge over the Hackensack River to replace the existing, century-old, swing-span Portal Bridge. This category includes design work for new track configuration, signaling, and electrical traction elements to support the new infrastructure that will be created by the Gateway Program. Planning for pedestrian flows and design of the new Moynihan/Penn Station complex in Block 780 is also included. 10 of 95 Of these requested amounts, up to $112 million (after sequestration) is available for grants to Amtrak through the Department of Transportation from the Hurricane Sandy-related Disaster Relief Appropriations Act of 2013, including up to $30 million to cover storm-related repair costs and $82 million to advance capital projects that address Northeast Corridor infrastructure recovery and resiliency in the Hurricane-affected areas. Additionally, Amtrak intends to seek further funding for these mitigation efforts that may be available from this Act or other sources in FY2013. If funding for these additional efforts is not available in FY2013, then Amtrak’s FY2014 request will likely be increased over the coming months to fund this important mitigation work. Our first priority is the hardening of Amtrak’s current infrastructure against the risks that were revealed by Superstorm Sandy. However, in order to truly address the full range of known vulnerabilities, and to eliminate the potential for future catastrophic outages, additional system redundancy and prevention measures must be taken to improve our resiliency. These additional improvements can only be realized through completion of the Gateway Program which is discussed in detail in the Infrastructure Investments section of the Capital Request that follows. Federal Support Our company has been working hard to trim operating costs, and the results are summarized in the table below. For a number of years Amtrak’s operating results have improved as a result of improvements in ridership and revenue, debt buyouts, and other cost control measures. While we have undertaken these measures to trim our dependence on Federal support, it should be noted that larger economic trends continue to drive costs upward. Amtrak’s budget has been increased by contractual wage increases for agreement employees, volatile and increasing energy prices, and rapidly rising health care costs. Our ability to generate offsetting revenue is in large part a product of the careful capital investments made in Amtrak’s infrastructure and fleet in preceding decades. There is, however, a pressing need for higher levels of capital investment if this trend is to be sustained. Recent investment levels allow Amtrak to maintain the current status of the infrastructure and rolling stock but leave little room for improvements; there are few available funds for addressing deferred maintenance or replacing aged rolling stock. The long-term stability and improvement of the infrastructure and the development of high-speed intercity passenger rail service in coming years will depend upon continued Federal capital investment. FY2013 Federal funding for Amtrak totals $1,374 million, distributed as shown in the table below Table 3 – Recent Federal Appropriations $ Millions Recent Appropriations FY2010 Capital/Debt Service Capital Grants - Ongoing ADA Capital NEC Gateway Hardening of NYC Area Infrastructure Rolling Stock Acquistions Equipment Lease Buyouts Total Federal General Capital Debt Service Total Capital and Debt Service $594 144 0 FY2011 $658 0 0 FY2012 $616 50 15 FY2013 $642 47 14 0 Operating Grant 738 264 1,002 658 264 922 681 271 952 703 199 902 563 562 466 442 Superstorm Sandy Operating Supplemental Total Grants Less Amount Retained by FRA Net Grants to Amtrak 30 1,565 1,484 1,418 1,374 (10) (9) (10) (9) $1,555 11 of 95 $1,475 $1,408 $1,365 In addition to the information shown in Table 3, Amtrak’s FY2013 budget includes funding from other Federal grants and loan programs such as the following: Railroad Rehabilitation & Improvement Financing (RRIF) loan to replace aging rolling stock and increase revenue capacity: US Treasury Department Equipment Lease Early Buy-Outs: High-Speed Intercity Passenger Rail Grant: DHS Grants: DOT, Positive Train Control (V-ETMS) Grant: $130.8 million $109.9 million $ 51.4 million $ 35.1 million $ 8.2 million The chart below displays the history of Federal support for Amtrak for operating expenses, capital investment and debt service from FY2009 to FY2013 from annual general appropriations from the Department of Transportation. Chart 4 – Historical General Federal Appropriations (DOT Grant) 1,600 1,400 1,200 1,000 $ Millions 800 600 400 200 - Total ADA Compliance Federal Capital NEC Gateway Project Retroactive Labor Payments Superstorm Sandy Suplemental Debt Service Amtrak Operating Grant FY2009 $1,488 653 75 285 475 FY2010 $1,565 144 594 264 563 12 of 95 FY2011 $1,484 658 264 562 FY2012 $1,418 50 616 15 271 466 FY2013 $1,374 47 642 14 30 199 442 Budget Development Each year Amtrak departments and finance staff formulate one-year budgets and five-year plan documents. These efforts are greatly impacted by the timing of Federal appropriation actions and are governed by the Passenger Rail Investment and Improvement Act of 2008 (PRIIA). Typically our planning cycles involve the following major milestones: 1. 2. 3. A detailed one-year budget is developed in February of each year as part of Amtrak’s budget request justification. Revisions to the one-year budget are performed throughout the ensuing months and finalized when a Federal appropriation is enacted. Amtrak is statutorily required to submit this final document within sixty days after passage of the bill. The Five Year Financial Plan is revised as necessary after passage of the annual appropriations bill and Amtrak is statutorily required to submit this document within sixty days of passage of the appropriations bill or October 1, whichever is later. The current version of this document is the FY2013-FY2017 Five Year Financial Plan. Although the Amtrak Office of the Inspector General (OIG) is a part of the National Railroad Passenger Corporation, Federal funding is appropriated directly to the OIG and is not a part of this budget. Continuing and New Activities Consistent with the methodology of previous years, the FY2013 operating budget request segregates costs by Continuing and New Activity. New activities in this document are defined in relation to base year FY2012. 1. 2. Continuing Activity consists of activity in FY2013 that is consistent with FY2012 activity including, as necessary, annualized costs of partial year activity and cost inflation or deflation of prior year expenses. New Activity captures costs and revenues of any activity that is wholly or primarily new as compared to FY2012. This includes changes to service or business methods, new activity related to achieving corporate strategies and objectives, and other company priorities. The table below lists the net impact for items categorized by activity in the FY2013 Budget. 13 of 95 Table 5 – New Activities and Initiatives $ Millions New Revenue Initiatives Richmond to Norfolk VA service extension Rebuild of 14 passenger coach cars for a third party Acela stronger advertising presence Northeast Regional - media and production support for pricing initiatives Promote events and tourism for Amtrak key cities Promote and participate in additional travel agent trade shows Replenishment and addition of new items to Amtrak's merchandise inventory Reimbursable feasibility studies Total New Revenue Initiatives Customer Additional resources in product management to meet mandated CSI target Focus Update sales promotion brochures with current photographs and images Additional market research studies Additional resources for contact center Subtotal Customer Focus Initiatives Safety & Police department expansion - add 50 officers Security Convert 5 police officers to special agents in Chicago Corporate ID cards not covered by grants Subtotal Safety & Security Initiatives Financial & Additional resources in food & beverage to support POS system Organizational Staffing and additional resources for Finance group Excellence Procurement support Michigan and Hudson lines Additional administrative resource for Police department Additional resource for Revenue Management HCM department expansion Implementation of Success Factor system suite Government Affairs & Corporate Communications staffing needs Social media contract transfer to Government Affairs & Corporate Communications Additional rent due to added space for new department Law Department reorganization Subtotal Organizational Excellence Initiatives Total FY13 New Activity Revenue Expenses $2.2 17.0 17.0 6.0 0.8 0.9 0.2 0.3 44.3 $2.5 13.1 8.5 3.0 0.4 0.4 0.6 0.3 28.8 0.5 1.3 1.2 0.3 3.3 2.1 0.5 0.5 3.1 0.3 3.0 0.7 0.1 0.1 8.6 3.4 0.7 0.5 0.2 1.0 Net 0.0 18.7 ($0.3) $3.9 $8.5 $3.0 $0.4 $0.4 ($0.4) $0.0 $15.5 ($0.5) ($1.3) ($1.2) ($0.3) ($3.3) ($2.1) ($0.5) ($0.5) ($3.1) ($0.3) ($3.0) ($0.7) ($0.1) ($0.1) ($8.6) ($3.4) ($0.7) ($0.5) ($0.2) ($1.0) ($18.7) $44.3 $53.9 ($9.6) 0.0 0.0 Capital Budget Processes When planning and documenting capital investment projects, Amtrak submits specific information to comply with Federal Railroad Administration (FRA) mandatory reporting requirements. In addition, Amtrak conducts a review of the projects according to Generally Accepted Accounting Principles (GAAP) to properly account for operating versus capital costs. The following is a summary and brief description of the information that is required for Capital budget submissions: Project Scope - A description of what the project is and its intended purpose/objective. Project Justification - An explanation of why the project is necessary and how performance will be measured. Funding Sources - The assumed source of funds that will pay for the project. National Environmental Policy Act (NEPA) Codes - Codes that describe the status of environmental impact of a project. Project Phases - The capital planning process requires that costs be budgeted by phases. This information is required to conduct a Generally Accepted Accounting Principles (GAAP) review of the projects. Return on Investment Analysis - The submissions included an analysis estimating the return on a capital investment. All projects that claim business improvement benefits were required to have this analysis completed; state of good repair programs including rolling stock rehabilitation are excluded. 14 of 95 Project Outcome and Performance Measures - The submission included a worksheet to input outcomes and performance measures. This is a brief description of major outcome or outcomes anticipated upon completion of the project, and the metrics to measure the outcome(s). Risks We must address the possibility that matters beyond our control may alter our current estimate of our needs for capital and operating funding. Fluctuations in the political process and the economy, weather events and the fluctuations of fuel prices are serious concerns. Fuel prices have been particularly volatile in recent years and the potential for price increases poses a serious risk to the financial health of the company. Similarly, an economic downturn, particularly in the Northeast Corridor region could lead to unfavorable results in ridership and revenues. Budgetary issues faced by some of our state partners could likewise pressure our operating budget needs. Risks that can impact Amtrak’s operating and capital funding needs include: If Amtrak does not receive sufficient Federal government funding, Amtrak’s ability to operate in our current form may be adversely affected. Amtrak’s business is capital intensive, and without sufficient capital investment, Amtrak will be unable to maintain and improve current infrastructure and rolling stock. Instability or unavailability of Amtrak’s information technology systems could have a detrimental effect on Amtrak’s business. Legal proceedings may adversely affect Amtrak’s business operations. Amtrak’s business is subject to numerous operational risks – such as changes in general economic, weather or other conditions, equipment failure, disruption of its supply chain, war, acts of terrorism and other catastrophic events – which could result in significant disruptions to Amtrak’s operations, increased expenses or decreased revenue. Amtrak’s costs and revenues could be substantially adversely or positively affected by competition from airlines, buses and other modes of transportation. Amtrak’s business is vulnerable to rising fuel costs and disruptions in fuel supplies. Amtrak's business is subject to Federal, and in some cases, state and local, laws and regulations. Amtrak’s business is subject to environmental laws and regulations that may result in significant costs. Most of Amtrak’s employees are covered by collective bargaining agreements, and failure to reach agreements may result in strikes, work stoppages or substantially higher ongoing labor costs. Catastrophic events could result in liabilities exceeding Amtrak’s insurance coverage. Amtrak has a mature work force, with substantial employee retirements expected in upcoming years, and therefore has large potential pension and other post-employment benefit obligations. Significant changes in the amount of those obligations could result from small changes in assumptions about healthcare cost trends and other variables. 15 of 95 Operating Budget As previously noted, Amtrak is focused on growing revenues and containing costs in order to reduce reliance upon Federal operating support. Our FY2013 operating budget, compared to recent years, is summarized in the table below. FY2013 contains $51 million in unusual losses from Superstorm Sandy; excluding this impact our FY2013 budget is virtually the same as FY2012, which produced the best operating ratio in Amtrak’s history. Table 6 – Profit and Loss Statement $ Millions Revenues: Passenger Related: Ticket Revenue Food and Beverage State Supported Train Revenue Subtotal Passenger Related Revenue Commuter Reimbursable Commercial Development Other Transportation Freight Access Fees and Other Subtotal Other Revenue Total Operating Revenue Expenses: Salaries, Wages and Benefits: Salaries Wages & Overtime Employee Benefits Employee Related Subtotal Salaries, Wages and Benefits Train Operations Fuel, Power, & Utilities Materials Facility, Communication, & Office Advertising and Sales Other Non-labor Fees and Services Subtotal Non-Wage Expenses Total Expenses Operating Loss (Cash Basis) FY2011 Actual FY2012 Actual FY2013 Budget FY2013 Fav/(Unfav) to FY2012 $ % $1,851.5 109.4 191.1 2,152.0 169.5 87.9 76.2 138.9 51.2 523.8 2,675.9 $1,968.2 122.0 179.0 2,269.2 140.4 121.4 93.9 147.2 72.1 574.9 2,844.1 $2,099.1 123.0 195.4 2,417.6 109.9 135.8 80.0 138.0 60.0 523.8 2,941.3 $130.9 1.0 16.4 148.4 (30.5) $14.4 ($13.8) ($9.2) ($12.1) (51.2) 97.2 6.7% 0.8% 9.2% 6.5% -21.7% 11.9% -14.8% -6.2% -16.7% -8.9% 3.4% 258.3 1,008.4 543.4 33.5 1,843.6 253.6 337.9 193.6 170.8 112.9 209.6 1,278.3 3,122.0 ($446.1) 267.2 1,033.3 608.5 29.4 1,938.5 245.2 355.3 184.8 166.5 78.5 237.2 1,267.4 3,205.9 ($361.8) 267.4 1,068.8 610.7 29.1 1,976.1 283.7 375.5 188.3 169.5 98.4 264.8 1,380.2 3,356.3 ($415.0) (0.2) (35.5) (2.2) 0.3 (37.6) (38.6) (20.2) (3.5) (3.0) (19.9) (27.6) (112.8) (150.4) ($53.2) -0.1% -3.4% -0.4% 0.9% -1.9% -15.7% -5.7% -1.9% -1.8% -25.4% -11.6% -8.9% -4.7% -14.7% This income statement represents the total federal support required for Amtrak operations. This income statement does not represent a Generally Accepted Accounting Principles (GAAP) financial statement. As compared to a GAAP financial statement, this income statement excludes costs for Amtrak's Office of the Inspector General (funded independently), non-capitalizable costs and certain contributions associated with capital projects (funded by capital appropriation), and net interest expense (funded by debt service appropriation), depreciation (non-cash expense), and accruals for estimated future post-retirement employee benefits (non-cash expense). Revenue Passenger Revenue, including ticket sales, was developed with the assistance of a consulting firm. The consultant employs a complex model that takes into account numerous factors such as population growth, shifts, and preferences, employment, household income, travel industry competition including the price of gasoline, economic conditions, service schedules, and proposed pricing actions. Ticket Revenue: Other than a temporary setback in 2009 due to recession, Amtrak has experienced consistent growth in ticket revenue since 2003 through continued delivery of quality service, proactive revenue growth actions and modest pricing actions. In FY2012 Amtrak once again delivered record ridership and passenger 16 of 95 revenues, and we are positioned to deliver continued strong ridership in FY2013. Despite incurring $28 million of ticket revenue losses as a result of Superstorm Sandy, FY2013 ticket revenue is expected to achieve $2.1 billion in FY2013, representing an increase of $130.9 million (6.7%) over FY2012. Food and Beverage Revenue: Amtrak has Food and Beverage operations which provide consumers with meal options while onboard our trains with projected revenues of $123.0 million in FY2013. State Supported Revenue was budgeted in accordance with existing state contracts and projected route performance in those states. Currently, Amtrak has contractual agreements to with 15 states to provide services across 19 states. These contracts will account for approximately $195.4 million of revenue in FY2013. Ancillary Business Revenue, consisting of Commuter, Reimbursable, and Commercial Development revenue was budgeted according to the operating agreements and operating expenses needed to deliver those services. Commuter Revenue: In addition to providing 15 states with Amtrak service, we also partner with the states or regional transportation authorities in Maryland, Florida, Connecticut, California and Washington to provide commuter services with annual revenue contribution of $109.9 million in FY2013. Reimbursable Revenue: Amtrak performs reimbursable project work for a number of state agencies on an as-needed basis. Commercial Development; Amtrak leverages and maximizes revenue from its real estate holdings through retail, parking, advertising real property leases/easements/sales and right-of-way fees. Other Revenue; Amtrak charges other railroads access fees in relation to their use of the NEC. Other revenue sources include resale of electric propulsion to state commuter agencies, commissions from cobranded credit cards, and revenue from other travel partners. Total operating revenue in FY2013 is budgeted to be $2.94 billion, an increase of $97.2 million (3.4%) from FY2012. Included is $44.3 million from new revenue initiatives. A summary of changes in operating revenue in FY2013 follows in Table 7. Projected ridership and revenue growth follow in Charts 8 and 9. 17 of 95 Table 7 – Summary of Changes in Operating Revenue $ Millions $2,844.1 FY2012 Actual Fare increase Impact of changes in demographics and the economy State supported revenue lower than expected in FY12 due to unsigned contracts Contractual increases in Commuter revenue Impact of improved OTP on selected routes Reduction in service disruptions due to completing construction and weather Improved Acela WiFi Impact of WiFi on short distance routes Food and Beverage Impact of eTicketing Decrease in base Reimbursable revenue Impact of removing leap year day One time perpetual easement of land at Hartford, CT in FY12 Loss revenue associated with Superstorm Sandy Loss of Caltrain commuter contract offset by decrease in Commuter expenses All Other Base Activity Increase/(Decrease) from Prior Year Total Base Activity Budget 49.6 47.4 16.4 7.0 6.7 5.9 2.2 1.5 1.0 0.9 (2.6) (4.9) (17.4) (28.2) (39.8) 7.1 52.9 $2,897.0 New Activity Rebuild of 14 passenger coach cars for a third party Acela stronger advertising presence Northeast Regional - media and production support for pricing initiatives Richmond to Norfolk, VA service extension Promote and participate in additional travel agent trade shows Promote events and tourism for Amtrak key cities Reimbursable feasibility studies Replenishment and addition of new items to Amtrak's merchandise inventory Total FY13 New Revenue Initiatives FY2013 Final Budget 17.0 17.0 6.0 2.2 0.9 0.8 0.3 0.2 44.3 $2,941.3 18 of 95 Chart 8 – Ridership 30 Millions 25 20 15 10 5 0 FY2009 FY2010 FY2011 FY2012 27.2 4.2 13.0 10.0 28.7 4.5 13.9 10.4 30.2 4.5 14.8 10.9 31.2 4.7 15.1 11.4 TOTAL Long Distance State Supported NEC FY2013 Budget 31.9 4.8 15.5 11.5 Chart 9 – Ticket, Food and Beverage Revenue $2,000 Millions $1,500 $1,000 $500 $0 Ticket Revenue Food & Beverage FY2009 $1,563.5 $92.6 FY2010 $1,702.1 $97.5 19 of 95 FY2011 $1,851.5 $109.4 FY2012 $1,968.2 $122.0 FY2013 $2,099.1 $123.0 Expenses Expenses in the FY2013 budget are segregated between ongoing (base) activity and activity in support of corporate goals that is wholly or primarily new in FY2013. The table below reconciles the FY2013 expense budget to the FY2012 actual expenses and differentiates between ongoing and new expenses. Table 10 – Reconciliation of FY2013 Operating Expense Budget to FY2012 Actuals $ Millions FY2012 Actual $3,205.9 Changes to Base Activity Inflation including labor agreements, fuel prices and other Costs associated with Superstorm Sandy Non-recurring credit from performance payments settlement Decrease in hedge settlements due to changes in oil price Increase in schedule adherence due to annual increase per contract and better on time performance Increase in casualty and other claims Increase in credit card commissions due to higher revenue Decrease in overhead transfer credits due to reduced capital Decrease in salaries due to vacancies during first half of FY13 Decrease in pension plan contribution per actuaries recommendation Loss of Caltrain commuter contract Other Base Activity Increase/(Decrease) from Prior Year Total FY2013 Base Activity 82.8 27.0 23.3 12.2 9.7 6.1 4.1 (5.8) (8.3) (14.0) (38.4) (2.1) 96.5 $3,302.4 New Activity New Revenue Initiatives Rebuild of 14 passenger coach cars for a third party Acela stronger advertising presence Northeast Regional - media and production support for pricing initiatives Richmond to Norfolk, VA service extension Replenishment and addition of new items to Amtrak's merchandise inventory Promote and participate in additional travel agent trade shows Promote events and tourism for Amtrak key cities Reimbursable feasibility studies Total New Revenue Initiatives Customer Update sales promotion brochures with current photographs and images Focus Additional market research studies Additional resources in product management to meet mandated CSI target Additional resources for contact center Subtotal Customer Focus Initiatives Safety & Police department expansion - add 50 officers Security Convert 5 police officers to special agents in Chicago Corporate ID cards not covered by grants Subtotal Safety & Security Initiatives Financial & HCM department expansion Organizational Implementation of Success Factor system suite Excellence Staffing and additional resources for Finance group Law Department reorganization Procurement support Michigan and Hudson lines Government Affairs & Corporate Communications staffing needs Social media contract transfer to Government Affairs Additional resources in food & beverage to support Point-of-Sale system Additional rent due to added space for new department Additional resource for Revenue Management Additional administrative resource for Police department Subtotal Organizational Excellence Initiatives Total FY13 New Activity 13.1 8.5 3.0 2.5 0.6 0.4 0.4 0.3 28.8 1.3 1.2 0.5 0.3 3.3 2.1 0.5 0.5 3.1 8.6 3.4 3.0 1.0 0.7 0.7 0.5 0.3 0.2 0.1 0.1 18.7 53.9 $ 3,356.3 FY2013 Total Budget 20 of 95 Salaries, Wages, Taxes and Employee Benefits Salaries: In FY2012, Amtrak elected not to award non-agreement pay increases for one year. By not increasing wages in FY2012, the company expects it will save about $50 million in salary and payroll taxes over the coming five years. A modest merit-based pay increase was reinstated for FY2013 and is included in the budget. Wages: Wage rates are governed by the new labor agreements that began being ratified in the summer of 2010 and which remain in effect until June 30, 2015. Agreements with all unions follow the same wage increase patterns, and accordingly all unions including those still not yet ratified by the unions were budgeted using the terms of the new agreements. Employee Benefits: Employee benefit costs were calculated using total planned payroll expense across all business activity including capital and reimbursable projects. An outside consulting firm provided actuarial projections for the pension and retirement expense planning. Insurance costs were projected by Amtrak’s Benefit Accounting group, with assistance from the outside firm, using the projected participation in each plan and the projected costs of those plans. Railroad taxes were planned in accordance with the prevailing tax rates applied to wage and salary budgets. Chart 11 – Salaries, Wages, Taxes and Employee Benefits $1,200. $1,000. $800. Millions $600. $400. $200. $0. Salaries Wages & OT Employee Benefits FY2009 225.7 887.8 483.5 FY2010 239.1 941.8 482.2 FY2011 258.3 1,008.4 543.4 FY2012 267.2 1,033.3 608.5 FY2013 Budget 267.4 1,068.8 610.7 Fuel, Power and Utilities Train Propulsion: Electricity to power electric locomotives operating in the NEC was budgeted in accordance with projected contractual power costs and projected consumption based on the service schedule. Amtrak negotiates multi-year contracts for bulk electric power to be used for train propulsion. All propulsion power distribution is provided by the Philadelphia Electric Company (PECO) but three companies – Exelon, Constellation New Energy, 21 of 95 and GDF Suez – are utilized as power generation resources. The most recent contracts became effective January 1, 2011 and provide favorable pricing that has kept this major expense at little to no inflation for several years. Consumption of diesel fuel to power the off-corridor diesel locomotives was planned in accordance with the service schedule and historical per-mile consumption statistics. The price per gallon of diesel fuel was computed using a historic correlation between the price of oil (per barrel), retail gasoline, and diesel fuel. Diesel fuel prices vary by geographic region due to the sourcing, delivery and transportation options available in each area. Overall, the diesel fuel budget averages $3.42 per gallon. Two charts follow that show the trends for these costs. Chart 12 – Diesel Fuel $3.50 $120 $3.00 $100 $2.50 $2.00 $60 $1.50 $40 $1.00 $20 $0.50 $0.00 Diesel Cost Per Gallon Cost Per Barrel FY2009 FY2010 FY2011 FY2012 $1.85 $2.24 $3.11 $3.11 FY2013 Budget $3.42 $62 $79 $93 $96 $99 22 of 95 $0 Cost per Barrel Cost per Gallon $80 Chart 13 – Fuel, Power and Utilities $400 $350 Millions $300 $250 $200 $150 $100 $50 $0 Diesel Propulsion Utilities FY2009 119.5 100.6 50.6 FY2010 147.4 104.1 48.2 FY2011 182.5 106.3 49.4 FY2012 210.2 103.2 41.9 FY2013 Budget 227.3 103.8 44.4 Utilities: FY2013 utility budgets were developed with the assistance of an energy management consultant based upon historical utility cost analyses at a detail level. Other Expenses Materials: Materials consumed in the maintenance of track infrastructure and train equipment were budgeted by the Engineering and Mechanical departments according to the work production plans in each department. Occupancy: Rent, Common Area Maintenance, and other occupancy costs were budgeted by the Real Estate department to reflect lease agreement terms in fiscal 2013 and are part of the “Facility, Communications and Office” Account. Casualty Claims: Estimates for casualty claims including employee Federal Employers’ Liability Act (FELA) and passenger liability were developed with actuarial assistance from outside actuarial consultants. 23 of 95 Capital Budget Amtrak receives funds from state and local entities for capital programs as well as from Federal appropriations. The total FY2013 Capital Budget (not including debt service) is $1,294.7 million from all sources. A total of $703.3 million will come from general Federal appropriations. This budget includes $130.8 million Railroad Rehabilitation & Improvement Financing Loan, $35.1 million from Department of Homeland Security (DHS) grants, $109.9 million for US Treasury Department equipment lease early buy-outs and $315.9 million from state and local agencies and other sources. Table 14 – Summary Capital Programs $ Millions Federal General Capital 1 Internally Generated Funds Total Federal General & Internal Funds RRIF Equipment Early Buy-Out State, Local, Other Total Capital Program Funding before Stimulus Economic Stimulus Grand Total Capital Programs FY2011 Actual FY2012 Actual FY2013 Budget FY2013 Variance to FY2012 $648.9 134.0 782.9 97.9 0.0 244.0 1,124.8 568.5 $1,693.3 $668.2 15.7 683.9 84.8 104.0 147.8 1,020.5 2.9 $1,023.4 $703.3 61.9 765.2 130.8 109.9 288.3 1,294.2 0.8 $1,295.0 $35.1 46.2 81.4 46.0 5.9 140.5 273.7 (2.1) $271.6 Table 15 – Summary FY2013 Capital Program Budget by Department Department ($Millions) Engineering Gateway ADA Rolling Stock Acquisitions Mechanical Transportation Chief Financial Officer Emergency Management & Corporate Security General Counsel Information Technology Marketing & Sales NEC IID Procurement Real Estate OIG Total Capital Programs General Federal Capital $290.0 20.0 50.0 68.2 236.9 13.3 2.8 0.0 4.6 0.0 0.0 2.5 0.0 15.0 $703.3 Other RRIF Federal Internal Loan Grants $61.6 $1.2 $0.0 14.2 0.0 0.0 3.1 0.0 0.0 0.0 1.2 130.8 3.2 (0.0) 0.0 0.0 9.0 0.0 0.7 0.5 0.0 0.8 1.2 0.0 0.0 1.3 0.0 0.5 36.0 0.0 0.4 8.7 0.0 0.0 1.8 0.0 0.0 1.0 0.0 0.0 0.0 0.0 0.1 $84.6 $61.9 $130.8 Equipment Homeland State, Total Early Buy- Security Local, and Capital Out Grants Other $0.0 $0.0 $160.2 $513.0 0.0 0.0 0.0 34.2 0.0 0.0 0.0 53.1 0.0 0.0 3.3 203.5 0.0 0.0 2.5 242.6 0.0 0.0 0.1 22.4 109.9 0.0 0.0 113.9 0.0 35.1 0.0 37.1 0.0 0.0 0.0 5.9 0.0 0.0 0.0 36.5 0.0 0.0 0.0 9.1 0.0 0.0 3.2 7.5 0.0 0.0 0.0 1.0 0.0 0.0 0.0 15.0 0.2 0.3 $109.9 $35.1 $169.4 $1,295.0 ADA Compliance Amtrak is updating train station platforms, elevators, escalators, restrooms, and other station facilities to ensure compliance with the requirements of the Americans with Disabilities Act (ADA). Amtrak serves over 500 stations and has at least partial ADA responsibility for some component (i.e., station structure, platform or parking lot) of approximately 380 stations. Amtrak presented an estimate of its needs to the Congress on February 1, 2009, in its report “Intercity Rail Stations Served by Amtrak: A Report on Accessibility and Compliance with the Americans with Disabilities Act of 1990”. This report, which was delivered pursuant to section 219 of the PRIIA, detailed the scope of Amtrak’s needs and proposed the level of Federal assistance necessary to attain full compliance. Subsequent updates to this report were issued in August 2011, May 2012, August 2012 and December 2012. 24 of 95 On September 19, 2011, the U.S. Department of Transportation (DOT) issued a final rule (“Rule”) amending its ADA regulations regarding, among other things, level boarding, alternatives to level boarding, and procedures for obtaining approval of FRA and/or FTA in situations where level boarding is not provided. The Rule is based on a Notice of Proposed Rule Making (“NPRM”) that DOT issued on February 27, 2006, as well as a public hearing held on August 20, 2010. The Rule as a whole became effective on October 19, 2011, though certain provisions did not become binding until February 1, 2012. In accordance with the Rule, Amtrak is generally required to provide level boarding at new or altered stations where platforms are adjacent to passenger-only tracks, regardless of ridership volume. Amtrak operates a 21,300 mile system, and over 20,000 of those miles of track belong to other companies, principally freight railroads. The platforms in these locations are owned primarily by the freight railroads but typically Amtrak has the responsibility to ensure they are ADA accessible. The DOT has issued subsequent guidance on “existing freight operations” that expands on the level boarding obligations and requires a detailed station by station evaluation to determine where level boarding is required. Also, at stations where multiple tracks are available to carry freight, a platform by platform and track by track analysis and subsequent negotiation with the host railroad must be conducted to determine the proper approach. Finally, FRA review and approval will be required for platform designs where level boarding is not provided. The complexity of the challenge and the scale of the system have created a requirement for considerable additional analysis which will result in additional time and likely higher costs than previously estimated. Amtrak’s Accessible Stations Development Program (ASDP) includes a complete master schedule for the stations for which Amtrak has some degree of responsibility for accessibility. Nearly all of the 110 stations for which Amtrak has some degree of ADA responsibility and that have fewer than 7,500 boardings and alightings annually are currently in the early phases of the ASDP, with construction underway at some locations. Work is also progressing on identifying opportunities to provide level boarding or a solution close to level boarding at certain stations that have more than 7,500 boardings and alightings annually. Approximately 221 of these stations are served by tracks that carry freight adjacent to the platform and, in most cases, the freight carriers set the clearance (platform setback) requirements at these stations. In some cases, the platform setback requirement would create a gap of four feet or more between a passenger railcar and the platform, making level boarding infeasible. For these situations Amtrak is engaging the services of a contractor to study and propose alternate designs that will satisfy both the requirements of freight service and the needs of our passengers. . Fleet Programs Comprehensive Fleet Plan The following discussion responds to the direction in Consolidated and Further Continuing Appropriations Act, 2013, incorporating direction from the Consolidated and Further Continuing Appropriations Act, 2012, that the Corporation’s budget, business plan and 5-Year Financial Plan, be accompanied by a comprehensive fleet plan. Amtrak has prepared comprehensive fleet plans in each of the last three fiscal years. The most recent such plan, Amtrak Fleet Strategy: Building a Sustainable Fleet for the Future of America’s Intercity and High Speed Railroad Version 3.1, was published on March 29, 2012 (March 2012 Fleet Strategy) and is available at www.amtrak.com. There have been no significant changes to inventory of Amtrak’s rolling stock or plans and time frames for rolling stock maintenance, refurbishment or replacement since the publication of that document, other than that identified below. Therefore Amtrak is resubmitting the March 2012 Fleet Strategy this year by reference, with the explanation and qualifications provided below, as the FY2013 comprehensive fleet plan. Amtrak’s management believes that this is the best approach within the time frames available this year, to be responsive to this direction. Amtrak’s independent Inspector General has recommended that Amtrak management seek to have Congress suspend any requirements for a FY2013 fleet strategy document, in recognition of the changes in fleet planning underway at Amtrak. 25 of 95 Amtrak’s New Approach to Fleet Strategy Amtrak is implementing a different approach to fleet planning which is still in its developmental phase. Moreover, there are a number of challenges and uncertainties Amtrak faces today that directly and adversely impact our ability to develop a more meaningful update for the need for long-term fleet investments than that contained in the March 2012 Fleet Strategy. Amtrak rarely orders new rolling stock and thus there has not been a consistent approach to developing the requirements for such acquisitions. Early versions of Amtrak’s fleet strategic planning focused on identifying the cost to recapitalize Amtrak’s aging fleet in timely manner based upon assumptions that Amtrak’s services would remain essentially unchanged and that ridership would increase uniformly system-wide by a modest annual growth rate. This provided a high-level estimate of the cost of recapitalizing Amtrak’s fleet in an orderly manner assuming that the capital needed for such recapitalization would be available on a predictable multi-year basis. Amtrak is transitioning its fleet planning to a more “bottom’s up” approach that focuses on fleet needs articulated by specific business strategies. Amtrak’s new approach to fleet strategy is being designed to emphasize the commercial nature of Amtrak’s business. The foundation for fleet strategy is articulation of the commercial strategy for the operating business lines that will be based on a strategic evaluation of the markets they serve. The business line general managers will recommend how the service be positioned and designed to maximize net income, while meeting customer expectations. From this will flow proposed operating schedules and the equipment requirements needed to meet these schedules (e.g. number of trains, seats and amenities for each train, performance attributes of trains). The next step is an assessment of Amtrak’s current assets, including assets that might need to be repurposed to meet equipment requirements, as well as options and opportunities for supplementing Amtrak’s fleet through acquisition of existing or new equipment. This assessment will develop into the business case for the proposed service including costs of various scenarios involving equipment, opportunities for internal synergies, opportunities for external partnerships, opportunities for external financing, and estimates of return on investment, external benefits, and risks. The business case will then flow into Amtrak’s resource allocation decision making process where the recommendations for use of Amtrak’s resources and future investment will be prioritized against other investment needs. At this point the theory intersects with the reality of Amtrak in that Amtrak does not know from year to year the level of capital resources that will be available to meet those needs. The end result will still be aspirational in many respects, but the link between investment needs to strategic outcomes will be better than in the past. Past fleet plans provided an inventory of Amtrak’s entire fleet, including the age and average mileage accumulated by specific equipment types with an indication of when as part of a total recapitalization of the fleet, replacement equipment should be ordered. These plans however did not emphasize the distinctions between where Amtrak had affirmatively made a decision to order equipment in the near-term and where the information was being provided to policy makers as to the rough size of the challenge of recapitalization of the fleet over the long-term. The fleet plan of the future most likely will consider fleet needs in three different time frames and thus provide for a better distinction between short-term actions and long-term plans. The first time frame will be one-year and align with the Corporation’s legislative and grant request. It will address the status of equipment acquisitions previously committed to and those specific fleet-related actions for which we will seek financing in the next year or public capital investment in the next Appropriations Act. The second time frame will reflect the five-year mid-term plans of the business lines and align with the Corporation’s five-year financial plan. These requests will identify the fleet needs required to implement the fiveyear plans but not necessarily reflect decisions on the prioritization of the use of capital. It is during this time frame that business cases will be developed that address specific equipment needs and address such options as the use of existing equipment, repurpose/rebuild of existing equipment, and/or acquisition of new equipment. Thus the fiveyear mid-term plan will be less specific as to the cost and timing. The third time frame will be a longer-term outlook that among other things addresses the aging and additional wear and tear being placed upon our fleet. This will help provide policy makers an opportunity to see the long-term but not immediate financial needs of intercity passenger rail service and help inform decisions such as the development of a reliable, long-term source of capital investment and opportunities to develop domestic manufacturing of rail equipment that is sustainable over the long-term. 26 of 95 Challenges and Uncertainties Facing Strategic Fleet Planning The greatest challenge to any strategic planning at Amtrak is that the nature, amount or conditions related to funds available for capital investment are not known with any sense of assurance from year to year. There is no better example than this year. As of March 20, 2013, almost half way through the fiscal year, Amtrak did not yet have a completed capital grant agreement for FY2013. This lack of certainty makes it difficult to commit to long-term projects, even those with very good returns on investment. It drives up costs as Amtrak frequently cannot take advantage of economies of scale or respond to unexpected opportunities. To address this, in Amtrak’s FY2014 legislative and grant request, Amtrak has proposed to Congress creation of a predictable multi-year funding program for Amtrak similar to enacted legislation currently in place for highways, transit and aviation. A similar proposal has been made by the Administration in the President’s FY2014 budget request. A second significant challenge is the atrophied nature of the domestic passenger rail equipment manufacturing base. The interchange standards of the Association of American Railroads, the promulgation of safety regulations by the Federal Railroad Administration (FRA), and statutory and regulatory requirements addressing Buy America and the Americans with Disabilities Act have effectively precluded equipment manufactured overseas from being used in the U.S. rail market up until this time. While the more robust funding of transit has caused some foreign manufacturers to produce equipment for the commuter rail market in U.S., periodic spikes in orders for that market rather than extended periods of relatively constant orders, and the tendency of many commuter properties to “customize” their equipment, have limited the opportunities for Amtrak to benefit from that manufacturing base. Amtrak cannot order one or two additional pieces of passenger equipment at reasonable costs for delivery in reasonable time frames. Instead, Amtrak’s experience in acquiring equipment for passenger rail service can best be described as infrequent, episodic and limited to batches frequently separated by decades from the acquisition of equipment for similar purposes. Amtrak has been required to base its equipment orders not just on existing needs but also in anticipation of growth in demand and equipment that might become unserviceable before the end of its commercial life. A third significant challenge is the uncertainty that comes with the upcoming end of the authorizations contained in the Passenger Rail Investment and Improvement Act of 2008 (PRIIA). PRIIA enacted fundamental changes in the roles of Amtrak, the Federal Government and the states as they relate to the provision of intercity passenger rail service. Some of these changes materially affect Amtrak’s ability to undertake fleet planning for the long-term. The timing and nature of the provisions contained in PRIIA’s successor may also have significant but as yet unknown ramifications for Amtrak’s fleet planning. As an example, the President’s FY2014 budget proposal, which contains the outline of a five-year authorization of investments in intercity passenger rail service, would if enacted significantly accelerate the timing of certain fleet acquisitions outlined in the March 2012 Fleet Strategy. It can be safely assumed that there might be alternative views on reauthorization in the Congress. A fourth significant challenge relates to the fleet strategy for short-distance trains, which account for over 36 percent of our passenger cars and over 40 percent of our locomotives. Under Section 209 of the Passenger Rail Investment and Improvement Act of 2008 (PRIIA), starting in FY2014 states will begin and/or expand their financial support for short-distance trains, defined as those that operate over routes 750 miles in length or less. Included within this financial support will be a capital charge reflecting Amtrak’s costs, including capital and maintenance costs of equipment, associated with providing this service. The effect of PRIIA section 209 is to have Amtrak’s relationship to the states for short-distance trains take on many of the attributes of a contract operator. Amtrak will run the trains the states compensate us to run. Some short distance services may be terminated. For those that are not, the states will play the major role in the design of the service including determining the equipment that is provided for each of these services. Among the states’ options are: 1) to compensate Amtrak for the use of Amtrak-owned and maintained equipment; 2) to compensate Amtrak for acquiring equipment for the benefit of a specific service; 3) to compensate Amtrak for operating and maintaining equipment owned by the state; 4) to compensate Amtrak to operate equipment owned and maintained by the state; or 5) various combinations of the above. Adding further to the complexity of addressing this part of fleet strategic planning, is that under past practice, certain types of equipment have been shared between short distance and long distance trains and it is unclear whether and how that will continue in the future. This represents a new environment in which Amtrak must plan its fleet needs. With limited exceptions, primarily California, North Carolina, and Washington, for the previous 40+ years the market for intercity passenger rail equipment was largely defined by Amtrak. Now there are other entities, (albeit with some degree of Amtrak’s support) that are taking the lead in defining equipment specifications, ordering equipment, testing prototypes and 27 of 95 entering the new equipment into revenue service. On November 20, 2012, California, on behalf of itself, Illinois, Michigan and Missouri, ordered 130 section 305-compliant multi-level coaches for corridor service in California and the Midwest. In the near future, Illinois will initiate procurement on behalf of several states for 125 mph capable diesel locomotives. This changed environment will lessen Amtrak’s need to acquire equipment for short distance service. It will also offer Amtrak opportunities to benefit from having the states assume the responsibility for overseeing the design, initial fabrication and prototype testing (and the unexpected costs that frequently accompany such activities) and from the economies of scale that can be realized by placing options on state orders where the equipment being ordered meets Amtrak’s needs. No doubt with time Amtrak will be better able to judge how to plan for the states’ decisions concerning equipment, but the early years of transition will be filled with ambiguity. As an example, for the states participating in the order of multi-level coaches that will replace Amtrak-owned equipment many questions remains to be answered. When will this equipment be delivered and ready for revenue service; will Amtrak or some other entity maintain the equipment; which states will acquire section 305 locomotives or ask Amtrak to supply the power; will the FRA have funds in the future to assist the states in translating their other equipment desires into reality; and, what becomes of the older single-level coaches freed up by this acquisition? While states’ obligations under section 209 begin in FY2014, thus far we have heard affirmatively from just two of the 18 Section 209 states that they are committed to continuing the state-supported service after September 30 of this year. Moreover, Amtrak expects that at least the initial state commitments under section 209 will be for time periods of one or two years – too brief on which to base a decision to order new equipment. Thus, for the time being, Amtrak’s fleet strategy for the State-Supported Service business line will be very much a wait and see how section 209 develops. Timing of the Evolution of Fleet Strategic Planning Amtrak is in the final stages of the reorganization of those functions of the Corporation that will report to the Vice President of Operations. This reorganization includes establishment of three operating business lines – LongDistance Service, Northeast Corridor Operations, and State-Supported Services. These three business lines will be the prime actors in developing recommendations for future fleet needs, supported by Amtrak’s existing Mechanical and Transportation departments and the new Operations Research and Customer Service departments. Selections for the Chiefs of these departments are now nearly complete. Amtrak anticipates the initial five-year business plans for these departments will be developed by early FY2014, with the analysis of fleet issues to follow shortly thereafter. It will likely be FY2014 at the earliest and more likely FY2015 before the combination of the standup of this new approach to managing our business and the uncertainty about State-Supported Service equipment needs under PRIIA section 209 can be reflected in a meaningful update to our fleet strategy. In the meantime, the new approach to fleet decision-making is being piloted as part of our efforts, in partnership with the California High-Speed Rail Authority (CHSRA), to explore and possibly procure the next generation highspeed rail trainsets. This equipment would supplement and possibly replace the current Acela trainsets used for premium service on the spine of the NEC while also meeting the requirements for the initial operating segment of the California High-Speed Train. Amtrak at this time is assessing the market needs and opportunities for high-speed service on the current NEC infrastructure which we anticipate will be completed this summer. Amtrak and the CHSRA jointly released a Request for Information to builders of high-speed trainsets in operation overseas, to help inform the partners as to what is available in the market place that can meet the requirements of Amtrak and California and the emerging flexibility of FRA from a safety regulatory perspective. The acquisition would be the first major effort by Amtrak to undertake a significant equipment acquisition with an outside partner and the first major use of performance-based rather than design-based specifications. Working groups are being established to help define what those performance-based specifications will be. A decision as to whether to proceed with this acquisition and, if so, selection of a vendor will likely happen in mid to late 2014. Existing Equipment The following table shows the planned units to be active and “shopped” for maintenance and overhaul activity in Amtrak’s mechanical facilities. 28 of 95 Table 16 - Rolling Stock Count and Availability End FY2012 Active End FY2013 Projected Planned Net S hop Available Active Planned Net S hop Available Car Fleet Amfleet I Horizon Surfliner California Cars North Carolina Cars Amfleet II Heritage Baggage Cars Heritage Diner/New Diner Heritage Dome/Parlor Cars Viewliner/LDSL 1 SuperLiner Auto Carrier Cab Cars / NPCU Other 2 Total Car Fleet 463 94 49 78 11 145 64 20 6 51 429 80 40 10 1,540 46 18 9 10 2 26 11 5 2 10 77 9 5 1 231 417 76 40 68 9 119 53 15 4 41 352 71 35 9 1,309 463 94 49 78 11 145 64 20 6 51 429 80 40 10 1,540 48 16 9 10 22 12 5 2 10 76 9 8 1 228 415 78 40 68 11 123 52 15 4 41 353 71 32 9 1,312 62 289 45 396 17 45 62 45 244 45 334 62 289 45 396 17 45 6 68 45 244 39 328 121 40 24 8 97 32 121 40 24 8 97 32 60 6 227 2,163 32 325 60 6 195 1,838 85.0% 60 6 227 2,163 3 1 36 332 57 5 191 1,831 84.7% Locomotives Electric Locomotives Diesel Locomotives Switchers 4 Locomotives Totals 3 Trainsets Acela (20 Trainsets) - Cars - Locomotives Talgo (5 Trainsets) - Cars - Locomotives Total Trainsets Grand Total Planned Availability % 1 Long Distance Single Level cars to replace Heritage Baggage Cars and Diner Cars and augment Single Level Sleeper fleet (130 car order comprised of 25 diners, 25 bag/dorm cars, 25 sleepers and 55 baggage cars) 2 Other cars include two service dorm cars, three exhibit cars, two wheel cars, two maintenance of way parts cars and one conference car. 3 Electric locomotive deliveries begin FY2013 and continue thru FY2016; Electric locomotives will not be in revenue service until FY2014. 4 Switchers were not previously included in planned shop counts. Adding has no effect on passenger service. Anticipated Equipment Acquisition Activities, 2013-2017 At this time Amtrak anticipates that its equipment acquisition over the five-year time period covered by the 5-Year Financial Plan will consist of: 29 of 95 1) Completing the acquisition of 70 ACS-64 electric locomotives pursuant to a contract entered into with the Mobility Division of Siemens Corporation in September 2010. The initial three units of this order are in testing. Amtrak anticipates that the initial unit will enter revenue service in early FY2014 with the final unit entering revenue service by January 2016. The total cost, including program management, spare parts and facility improvements will be $562.9 million. These locomotives are being funded by a loan agreement under the Railroad Rehabilitation and improvement Financing (RRIF) Program. Amtrak’s debt service payments related to this loan will come from net operating revenues from Amtrak’s Northeast Corridor operations. 2) Completing the acquisition of 130 single level long distance passenger cars pursuant to a contract entered into with CAF USA in August 2010. Amtrak anticipates the delivery of the first cars for testing by end of calendar year 2013 with the final unit entering revenue service by late calendar 2015. The total project cost will be $342.8 million. The FY2013 payments for acquisition of these cars and related spare parts are being requested as part of the Federal capital appropriation request. 3) Acquisition of up to eight low emission switcher locomotives. Amtrak has previously taken delivery of four such switch locomotives – 2 funded by a grant by the U.S. Environmental Protection Agency and 2 funded by grants from the Illinois Environmental Protection Agency and Illinois Department of Transportation. 4) Initiating the acquisition of equipment for premium Acela service on the spine of the Northeast Corridor. Other than these four specific acquisitions, Amtrak’s current plans are to continue to maintain and refurbish its fleet. With regard to the equipment for the Acela service, the March 2012 Fleet Strategy included a plan to acquire 40 additional coaches to expand the capacity of the existing Acela trainsets. After undertaking further analysis of this option, Amtrak has decided to proceed with acquisition of next generation high-speed trainsets to supplement and perhaps eventually replace equipment used to provide Acela service. This will involve the first application of the Tier III equipment standards recently approved by the engineering task force of FRA’s Rail Safety Advisory Committee. The current goal is to issue a request for proposals no later than the end of FY2013, award the contract no later than the end of FY2014, begin testing a prototype in FY2016, with the first equipment entering revenue service on the Northeast Corridor during FY2017 or FY2018. Amtrak’s FY2014 request includes an estimated cost to begin this procurement and associated improvements to support the new trainsets of $200 million. This would cover program management costs and initial start-up payments to the vendor that are normal for these types of procurements. Important details of this order of equipment have not been finalized, including the total number to be ordered, the expected cost per unit, the timing when the equipment will enter into revenue service, and how the deliveries of equipment will be shared if both Amtrak and CHSRA commit to a joint order. These will be resolved during the review of proposals which is anticipated to begin in the second quarter of FY2014. The timing, number and cost estimates related to this acquisition in Amtrak’s out-year budget estimates therefore will be revised late in FY2014 when better information on cost and delivery schedule is available. Other adjustments to the March 2012 Fleet Strategy The March 2012 Fleet Strategy projected that acquisition of additional single level cars and diesel locomotives would begin in FY2016 and acquisition of additional bi-level cars would begin in FY2018. Decisions on such acquisitions are being deferred to allow additional time for Amtrak to develop strategies to reflect the challenges to fleet planning discussed above. 30 of 95 Northeast Corridor (NEC) Investments State of Good Repair (SOGR): A Foundation for Growth While 70% of Amtrak’s train-miles are run on the rail infrastructure of the private freight railroads, Amtrak controls and is directly responsible for the condition and reliability of 363 route miles of the 457 mile Northeast Corridor (NEC) between Boston, New York, and Washington. This route hosts the most intense and complex passenger train operations on the North American continent. Additionally, Amtrak owns the Harrisburg and Springfield lines that connect with it; the 11-mile “Empire” connection linking Penn Station with Spuyten Duyvil on the Albany Line; a number of stations and yard facilities in major urban hubs; and approximately 100 miles of the Michigan Line serving the Chicago to Detroit corridor. Also, the Empire Corridor agreement with CSX adds considerable mileage and responsibility The cost of managing, maintaining and improving these assets is substantial. Amtrak’s most recent estimate is that the State of Good Repair (SOGR) backlog on Amtrak-owned/operated NEC infrastructure is about $5.8 billion in FY2012 dollars. It is important to note that Amtrak reprioritizes SOGR spending when necessary to address safety and operability issues as they arise. A backlog of SOGR should not, therefore, be understood as an accumulation of disintegrating or unsafe structures; it is rather a list of projects that have passed the end of their designed life but may continue to carry traffic safely, albeit at times with the additional burden of increased maintenance costs or impacts on reliability and performance. The infrastructure backlog includes: More than 200 bridges, most dating to the turn of the last century; Baltimore’s B&P and Union Tunnels, built in 1873; Many rail interlockings (junctions and crossovers) that are functionally obsolete; and Electric traction systems relying on 1930s-era components. Amtrak estimates that even with adequate funding, resources and equipment, it will take a minimum of 15 years to resolve the backlog while still maintaining a reliable level of rail service – a requirement that complicates the maintenance and construction work considerably. Failure to adequately invest in this work on an annual basis will increase the exposure to costs and performance impacts stemming from the use of out-of-SOGR assets and merely push the completion date out further and raise the costs and impacts of the capital work, as the backlog increases and Amtrak is forced to reprioritize to address new and pressing problems. Amtrak’s infrastructure assets will require an average of $760 million per year to achieve its 15 year state of good repair plan (SOGR) – $380 million per year for the normalized replacement of assets and $380 million per year to address the SOGR backlog. In addition to state of good repair needs, the Northeast Corridor is operating at or near capacity on many segments. Some 2,200 trains operate on the corridor on a daily basis, including Amtrak, commuter and freight, and traffic is expected to increase by approximately 50% by 2040 and more than double by 2050, being driven in part by increasingly congested highway and air networks. With Amtrak’s recently released Northeast Corridor Vision Update report issued in July, 2012 serving as a base, Amtrak is currently working closely with the Northeast Corridor Infrastructure and Operations Advisory Commission, the U.S. Department of Transportation, the Northeast states and other commuter and freight railroads to prepare an NEC Comprehensive Infrastructure Investment Plan that will identify, in addition to SOGR needs, high priority capacity improvements that are essential to move forward in the next five years to accommodate increasing demand for improved and expanded rail services in the heavily congested Northeast. The following table summarizes Amtrak’s infrastructure capital plan for FY2013. 31 of 95 Table 17 – Infrastructure Funding Plan FY2012 $Million Bridges/Culverts/Tunnels Facility/Station/Other Signal Systems Communication Systems Overhead Catenary and Transmission Systems Substations/Frequency Converter Track Replacement Interlocking Renewal Equipment Purchase/Replacement Seattle King St. Coach Yard Freight Railroad Improvements Fire & Life Safety Trenton NJ HSR Improvements Mechanical Facilities Improvements NEC Stations Improvements Renovations to Philadelphia 30th Street Garage Gateway ADA Other Total Federal & Amtrak Third Party & Special Grants $85.2 51.0 27.8 0.9 13.6 7.8 99.4 6.6 8.6 7.5 3.7 0.7 4.2 1.2 46.9 0.2 $365.3 $5.5 15.9 0.5 (0.0) 1.2 3.7 41.8 4.7 (0.3) 27.1 4.3 2.2 $106.7 FY2013 Total $90.7 67.0 28.4 0.9 14.8 11.4 141.2 11.3 8.6 7.5 3.4 27.8 4.3 4.2 1.2 46.9 2.3 $472.0 Third Party Federal & & Special Amtrak Grants $36.2 46.5 33.1 0.8 10.0 14.0 127.2 6.0 14.7 3.4 3.8 2.5 15.0 20.0 50.0 2.0 $385.2 $17.8 25.5 14.4 0.4 4.0 4.9 73.0 17.8 0.0 0.3 0.5 13.1 51.4 14.2 3.1 2.4 $242.6 Total $54.0 72.0 47.5 1.2 14.0 18.9 200.2 23.8 14.7 0.3 0.5 16.5 51.4 3.8 2.5 15.0 34.2 53.1 4.4 $627.8 * Includes improvements and upgrades beyond SOGR Additional funding provided under the FRA-Administered High-Speed Intercity Passenger Rail Program (HSIPR) is providing resources for the design and environmental review of other major backlog projects, including the planned replacement of the 140 year old Baltimore and Potomac (B&P) tunnel south of Baltimore and the century old Susquehanna River Bridge in Northern Maryland. Amtrak is also investing $450 million between 2012 and 2017 under a HSIPR grant to upgrade catenary, track, signal and electric power systems on the four-track NEC main line between New Brunswick and Trenton, New Jersey. This budget includes $51.4 million in funding from this grant. When completed in 2017, this project will increase the top speed for high-speed train operations from 135 mph to 160 mph and will improve reliability for all passengers including intercity and commuters on one of the most heavily trafficked sections of the Northeast Corridor. Additional projects underway with HSIPR funding awarded to third parties, but impacting the Amtrak network, include a new third track and platform improvements at Kingston, Rhode Island and double tracking key portions of the Springfield Line in Connecticut. Also planned is the construction of a new grade-separated “flyover” at Harold Interlocking in New York, at the junction where Amtrak and MTA Long Island Rail Road trains converge east of New York Penn Station; installation of a third NEC Main Line track segment in Delaware and upgrade of State Interlocking in Harrisburg on the Keystone Line in Pennsylvania. The above projects reinforce Amtrak’s approach to SOGR which is to ensure that every project undertaken not only replaces an aging asset and improves the reliability of existing services, but provides a solid foundation for future growth as discussed in the following section. 32 of 95 Beyond SOGR: A Vision for the Future In addition to state of good repair needs, the Northeast Corridor faces capacity constraints. Over 2,100 passenger trains operate on the corridor on a daily basis, including Amtrak and commuter trains together with up to 70 freight trains. Amtrak’s New York Penn Station and the Hudson River Tunnels that feed it traffic from New Jersey are at capacity today, and a number of other major segments are at or nearing their capacity limits, as documented in the Northeast Corridor Infrastructure Master Plan, published in May 2010 and in The Amtrak Vision for the Northeast Corridor 2012 Update Report published in July 2012. In addition, Amtrak faces increasing demand for service due to high fuel prices combined with congestion and capacity constraints affecting many of the region’s major highways and airports. This situation is likely to worsen in coming years as growth outpaces the region’s ability to add transportation capacity due to funding, environmental, and land constraints. To help address these issues, Amtrak in September 2010 published A Vision for High-Speed Rail in the Northeast Corridor. The “Vision” outlined a conceptual framework and provided an initial review of the feasibility of improving the existing NEC alignment to handle growth in regional, commuter and freight services, while simultaneously planning and building a new, dedicated, two-track, high-speed rail alignment between Boston and Washington, DC to serve the fast-growing intercity rail market, provisionally known as the NEC Next Generation High-speed Rail or “NextGen HSR” system. In July 2012, Amtrak completed a Business & Finance Plan (BFP) for the NEC. This work was an independent assessment of the earlier work and confirmed the growth in ridership that was expected in the corridor to 2040. It verified that the annual revenue expected if all the work was undertaken would reach $4.86 billion annually by 2040, and made recommendation of how to involve the private sector in the investment. The highlights of the BFP were published in The Amtrak Vision for the Northeast Corridor 2012 Update Report. Also, early in 2012, the Federal Railroad Administration (FRA) began work on a Tier 1 Programmatic Environmental Impact Statement (PEIS) for the Northeast Corridor, known as NEC FUTURE, that considers various alternative development strategies and configurations for the future of the NEC with the aim of determining and mitigating (where necessary) environmental impacts from the improvement and expansion of NEC intercity rail service. Amtrak expects that the concept set forth in the Vision will be one of the major alternatives evaluated under the PEIS. To advance these plans, Amtrak is also working closely with the Northeast Corridor Infrastructure and Operations Advisory Commission, which is primarily made up of representatives of the FRA, Amtrak and the Northeast states. The Commission, created under the Passenger Rail Investment and Improvement Act (PRIIA) of 2008, aims to help guide the EIS process and is developing policy, funding and financing options to improve intercity passenger rail service in the Northeast. Amtrak’s work with the Commission, in close coordination with the FRA, includes development of a NEC Comprehensive Infrastructure Investment Plan, including an update of the long-range NEC Master Plan and a five-year plan, FY2014 through FY2018. This comprehensive plan will incorporate the service plans and investment needs of all Northeast states, commuter and freight railroads, and is scheduled for publication in September 2013. Implementing the Vision: The Gateway Program The Gateway Program is a comprehensive program of infrastructure improvements that will improve current assets, increase track, tunnel, bridge and station capacity serving New York City, and allow the eventual doubling of passenger trains into Manhattan. The new tunnels and supporting infrastructure will be designed to comply with updated FEMA flood criteria – a level of protection which would have prevented the recent flooding. The Gateway Program will also permit the closing of the existing century-old tunnels for extended periods so that much-needed repair and improvement work can be done. The current volume of traffic through the tunnels is so dense that longterm closures are impossible because the disruption of the daily traffic into and out of Manhattan would be too great. Today, work is done on one tunnel at a time, during elaborately scheduled 55 hour weekend periods to avoid service disruptions, but longer-term closures are needed to support a full program of flood prevention retrofits and other state of good repair improvements to the tunnels. While some improvement work in today’s tunnels can be accomplished during these existing outage periods, even the relatively small ongoing Fire and Life Safety program of improvements to the New York tunnels will have taken more than a decade to complete, once it is finished. 33 of 95 While the Gateway Program is a long-term project spanning more than a decade, elements of it must begin immediately in order to meet the critical time schedule imposed by the ongoing Hudson Yards development project west of Penn Station. Failure to advance these crucial first elements will permanently preclude new tunnel alignments from connecting to Penn Station, and raise the costs of future track and terminal capacity improvements in Manhattan significantly. The Gateway Program is envisioned as a critical incremental investment to maintain the Northeast Corridor as the nation’s premier rail corridor for the next century. As such, the design of the program elements has been carefully crafted to permit anticipated capacity additions in the decades ahead, including the future construction of a new lower-level “Penn South” concourse for additional capacity; a future extension of selected “Penn South” station tracks eastward to Manhattan’s eastside, Queens and points north; and additional future tunnels under the Hudson river. Planning is also underway to coordinate Gateway Program elements with the recommendations of the ongoing Penn Vision Study, which is considering the future of Penn Station upon the opening of Moynihan Station. Gateway’s modular design allows the entire terminal complex to expand in a cohesive, integrated manner, transforming Penn Station into one of the greatest railway facilities in the world. Key Components of the Gateway Program New Trans-Hudson River Tunnels – Two new trans-Hudson River rail tunnels from the Bergen Palisades in New Jersey to Manhattan, New York will directly serve the Penn Station/Moynihan complex. These new tunnels will provide operational benefits for the existing Penn Station and increased capacity for commuter and intercity rail operations including New Jersey Transit and Amtrak’s proposed next generation high-speed rail project (NextGen HSR) by providing a connection to a future “Penn South” concourse discussed below. Preservation of a 800-foot right of way through the Hudson Yards development site in west midtown Manhattan must begin construction in summer 2013 in order to preserve a future right of way alignment for the Gateway tunnels into Penn Station. Amtrak has begun design work for this tunnel segment and is currently in negotiations with the Related Companies and the Long Island Railroad to progress construction. Amtrak is presently seeking approximately $182 million of funding in FY2013 supplemental Federal funding for this construction project over the next two years. Expanded Moynihan/Penn Station – An expansion of existing New York Penn Station tracks and platforms and the creation of new “Penn South” concourses with direct connections to the future Moynihan Station. These improvements will support the long-term growth of commuter and intercity passenger rail service at both Penn Station and the historic Farley Post Office Building, which is being transformed into the new “Moynihan Station”. The expanded Moynihan/Penn Station complex creates a consolidated Amtrak operation on Manhattan’s west side and the high level of service and connectivity required for the growth of Amtrak’s Acela and future NextGen high-speed rail services. New Portal Bridges – Two new high-level bridges, known as Portal North and South Bridges, will replace the vulnerable 100-year-old moveable Portal Bridge over the Hackensack River between Kearny and Secaucus, New Jersey, doubling Corridor capacity. Amtrak is requesting $100 million in FY2014 funding for obligation of initial construction elements of the Portal North Bridge. Final design for this bridge will 34 of 95 be completed in FY2013 and an approximately $900 million, 5-year construction program will then be ready to commence. Amtrak’s request would advance the first year of construction of this project with the expectation that contributions proportional to the planned commuter usage of this structure and in accordance with the new cost allocation method developed under Section 212 of the Passenger Rail Investment and Improvement Act of 2008, would be available to cover a portion of the additional costs of the project, once such methodology is available. Newark-to-Secaucus Improvements – The existing NEC will be greatly improved between Newark and Secaucus, New Jersey. The mainline will be expanded from two to four tracks between Newark and the Bergen Palisades tunnel portals, better connections will be built to link the NEC with the New Jersey Transit Morris and Essex Lines, and various bridges will be upgraded. Reconstruction of Existing Hudson River tunnels - The existing Hudson River tunnels, completed in 1910 by the Pennsylvania Railroad, will be rebuilt and modernized once the new Hudson River tunnels are completed and rail traffic can be shifted away to allow for an extended outage. The century-old tunnels will be substantially reconstructed to meet 21-century standards for structural integrity, operations, fire and life safety, and resiliency to flooding and other potential emergencies. Timeline and Cost Amtrak projects that the first two phases of the Gateway Program could be completed in approximately 12 years, under a best case scenario, at a preliminary cost estimate of approximately $15 billion (in constant 2011 dollars). If funding is available to begin preliminary engineering and environmental review in FY2013, in coordination with the Federal Railroad Administration’s NEC FUTURE Tier 1 PEIS, and construction funds are available to permit tunnel construction in the Hudson Yards development site, it is estimated that the Program could be completed in 2025, with the significant construction period beginning in 2017, assuming unconstrained funding. Further refinement of these costs and schedules will be available upon completion of additional planning and preliminary engineering and design work. The project phases are as follows: Phase One – Newark, NJ to Penn Station, New York, 2013-2025: Construct new two-track mainline and Hudson River tunnels from Swift Interlocking to Penn Station and improve existing NEC mainline and tunnel infrastructure. Phase Two – Penn Station Expansion and Elizabeth-Newark Improvements, 2017-2025: Expand Penn Station to Block 780 to create the upper-level concourse of Penn South and add a 5th track from Elizabeth to Newark, New Jersey to provide increased capacity to access new Gateway trackage and capacity. Phase Three – Penn South Expansion: Expand Penn South through the addition of the lower-level concourse and tunnel connections to Gateway Tunnels at 12 th Avenue. New Urgency – Connecting to Penn Station through the Hudson Yards The Gateway Program has taken on new urgency in recent months, as engineers have determined the only feasible route to connect the Gateway Tunnel directly to Penn Station will intersect the Hudson Yards development over the Long Island Rail Road’s West Side Yards, where Related Companies is breaking ground on a multi-billion dollar, mixed-use commercial and residential development project. Amtrak is working with Related Companies and the Long Island Rail Road, which owns the maintenance yards (which are also impacted by the development project and tunnel) to design and begin construction of an 800-foot structure to secure a right of way for a future Gateway Tunnel through the site, which lies between 11 th and 12th avenues and 30th and 33rd streets in Manhattan. Amtrak is seeking approximately $182 million in FY2013 to cover the costs of completed design and construction of this project. Design efforts are currently underway and construction will begin in summer 2013, with a planned completion in FY2016. 35 of 95 Debt Service and Debt Related Equipment Purchases Principal and Interest Principal and interest payments for FY2013 amount to $199.2 million and are detailed in the table below. Table 18 – Debt Service $ Millions Q1 Q2 Q3 Q4 FY2013 Principal $32.3 $49.3 $31.1 $25.3 $138.0 Interest 18.5 14.8 16.2 11.7 61.2 $50.8 $64.1 $47.3 $37.0 $199.2 Total Cash P&I (DOT Debt Service Grant) Early Buyout Options (EBO) An Early Buyout Option is a contractual right for Amtrak to terminate a long term lease of equipment, in part or in whole, on favorable terms. The EBO gives Amtrak the rights to: a) buy the equipment which is owned by a bank; and b) pay off the rest of Amtrak’s lease payment obligations to the bank. The EBO occurs at a specified, fixed price, one time only, late in the term of the lease. It is the only right of voluntary pre-payment in the lease. PRIIA Section 205 provides that the Secretary of the Treasury may make agreements to restructure (including repaying) Amtrak’s indebtedness, including leases, outstanding as of the date of enactment of PRIIA upon such terms as Treasury deems favorable to the interests of the United States Government. Amtrak, Treasury and the Department of Transportation, acting through the Federal Railroad Administration (FRA) entered into a Memorandum of Understanding (MOU) to fund the exercise of certain EBOs on select leases entered into by Amtrak, up to the amounts and on the dates shown in the table below. Table 19 – Leases in Treasury MOU – Early Buyout Options $ Millions EBO Payment FY2011 FY2012 FY2013 Date Lease Name Trust 2001-L-B (2nd closing) for 16 GE P42-DC Locomotives 03-Jan-11 $28.4 Trust 2000-L-A (2nd closing) for 16 GE P42-DC Locomotives Trust 94B-A for 6 Superliners 30-Sep-11 3-Jan-12 23.3 $11.9 Trust 94B-C for 8 Superliners 3-Jan-12 17.7 Trust 98C for 107 Superliners (Secured Note matures on 3-29-12) Trust 96A-B for 13 of 98 GE P-42 DC Single Mode Diesel Locomotives 31-Jan-12 1-Jul-12 134.0 20.2 Trust 96B for 20 of 98 GE P-42 DC Single Mode Diesel Locomotives 1-Jul-12 31.0 Trust 97D for 50 Amerail Viewliner Passenger Cars Trust 96A-C for 7 of 98 GE P-42 DC Single Mode Diesel Locomotives 2-Jul-12 1-Oct-12 44.0 Trust 97A for 25 of 98 GE P-42 DC Single Mode Diesel Locomotives 1-Oct-12 39.7 Trust 96A-D for 19 of 98 GE P-42 DC Single Mode Diesel Locomotives Trust 94B-B for 7 Superliners 1-Jul-13 1-Jan-13 28.7 13.4 Trust 2000 SD-A (2nd closing) for 10 Surfliners 19-Jun-13 17.0 Total Leases in Treasury Memorandum of Understanding Grand Total 36 of 95 $11.1 $51.7 $258.8 $109.9 $420.5 Sources and Uses of Cash – Budget Basis Amtrak’s FY2013 Simple Sources and Uses (Cash flow) is based on this budget and the receipt of Federal funding of $1,365.0 million during the year. Amtrak continues to have no access to short-term credit lines. The following summarizes Amtrak’s planned source and use of funds for FY2013 based upon this budget assuming funding will be appropriated as presented in this document. Table 20 – Simple Sources and Uses $Millions Beginning Available Cash (after outstanding payments) $134.9 Uses: Operating Expenses (Net operating loss including Depreciation & Non-Cash OPEB's )(1) Non-Cash Adjustments (Depre & Non-Cash OPEB's) Net Operating loss 1,203.0 (788.0) 415.0 Net Operating Loss Capital Expenditures Debt Service Principal & Interest Equipment Lease Buyout Total Uses 415.0 1,184.8 199.2 109.9 $1,908.9 Sources: Federal Grants: Operating 441.6 Capital 703.0 Debt Service Principal & Interest 199.2 Superstorm Sandy Supplemental 30.2 Less Retained by FRA (9.0) Subtotal Federal DOT Grants 1,365.0 Subtotal Federal DOT Grants 1,365.0 EBO (from EBO Grant) 109.9 RRIF Loan Financing of Equipment Acquisitions 130.8 Third Party and Special Grants 294.1 Net change in assests & liabilities 17.4 Total Sources $1,917.2 Total Cash (1) $143.2 OPEBs - Other Post Retirement Employee Benefits 37 of 95 Department Operating and Capital Programs Amtrak Police Department Overview of the Department The Amtrak Police Department is committed to maintaining the safety and security of the rail traveling public, improving the quality of life of Amtrak personnel and safeguarding the trains and rails through customer-oriented policing. This will be accomplished by building partnerships to enhance capacity to protect a nation in transit. The Amtrak Police organization consists of two divisions: 1. 2. Patrol Division makes up the majority of the department with officers nationwide at more than 30 locations protecting our passengers, employees and assets. The Patrol Division consists of professionally trained sworn police officers who work closely with Local, State and Federal agencies. Special Operations Division includes a contingent of sworn Special Agents who work in concert with police officers to protect Amtrak passengers, employees and assets. This Division has oversight and coordination responsibilities of Amtrak’s nationwide robust and expertly trained explosive detection canine program. Special Operations also includes Amtrak’s Intelligence Unit consisting of contract intelligence analysts and sworn personnel assigned to Joint Terrorism Task Forces (JTTFs) in New York, Washington, and Chicago. The Amtrak Police Department total budget request for FY2013 is $68.8 representing an increase of $4.8M compared to FY2012 Actual. Base Activity: The FY2013 base budget is $66.2M, increasing by $2.2M over the FY2012 Actual due to: Inflation of non-labor expenses - $0.4M Inflation Wages & OT - $0.9M Provision for management merit increase - $0.2M Decrease in salaries due to transfer of positions to Emergency Management and Corporate Security department - ($0.5M) Increase in wages and overtime due to vacancies not filled in FY2012 - $1.3M Changes in employee benefits -$0.8M Decrease in employee related expenses due to one-time purchases in FY2012 - ($0.5M) Anticipated decrease in material expenses due to one-time purchases in FY2012 - ($0.3M) Costs associated with Superstorm Sandy - $0.1M Other - ($0.1M) New Activity: Increase in policing and security scope coverage - $2.1M Additional administrative resource - $0.1M Conversion of 5 police officers to special agents in Chicago and additional training, weapons, and tactical gear - $0.5M 38 of 95 Operating Expense Summary FY2011 – FY2013: Amtrak Police Department FY2013 Incr/(Decr) vs FY2012 $ Millions FY2011 Actual FY2012 Actual FY2013 Budget $ % $4.3 29.5 18.5 1.7 54.0 0.0 0.2 2.6 0.7 0.7 0.1 0.4 1.4 0.0 $60.2 $4.4 32.0 19.3 1.9 57.6 0.0 0.4 3.3 0.0 0.6 0.1 0.0 1.8 0.2 $64.0 $4.1 35.5 21.0 1.8 62.4 0.0 0.1 3.4 0.0 0.8 0.1 0.0 1.9 0.0 $68.8 ($0.3) 3.5 1.7 (0.2) 4.8 0.0 (0.3) 0.2 (0.0) 0.2 (0.1) 0.0 0.2 (0.2) $4.8 -6.7% 11.0% 8.9% -8.2% 8.3% 243.3% -84.7% 5.2% -63.5% 36.5% -58.1% 50.0% 9.1% N/A 7.5% Salaries Wages & Overtime Employee Benefits Expenses Employee Related Salaries, Wages and Benefits Train Operations Materials Facility, Communication, & Office Casualty & Other Claims Professional Fees Expenses Data Processing Services Environmental & Safety M of W Services Expense Transfer Total Operating Expenses Summary of Changes FY2012 to FY2013 $ Millions $64.0 FY2012 Actual Changes to Base Activity Inflation of non-labor expenses 0.4 Inflation Wages & OT 0.9 Provision for management merit increase 0.2 Decrease in salaries due to transfer of positions to Emergency Management and Corporate Security department Increase in wages and overtime due to annualization of positions filled during FY2012 and additional vacancies Changes in benefit expenses Decrease in employee related expenses due to one time purchases in FY2012 Anticipated decrease in material expenses due to one time purchases in FY2012 Costs associated with Superstorm Sandy Other Base Activity Increase/(Decrease) from Prior Year Total FY2013 Base Activity New Activity (0.5) 1.3 0.8 (0.5) (0.3) 0.1 (0.1) $2.2 $66.2 Increase in policing and security scope 2.1 Additional administrative resource for Police department 0.1 Conversion of 5 police officers to special agents in Chicago and additional training, weapons, and tactical gear 0.5 $2.7 Total FY2013 New Activity $68.8 FY2013 Total Budget 39 of 95 Corporate Research and Strategy Overview of the Department Corporate Research and Strategy has responsibility for leading the development and periodic updating of Amtrak’s strategic plan, the development and implementation of Amtrak’s strategy management system and enterprise risk management system, coordinating strategy management and risk management with Human Capital’s performance management system; supporting other Amtrak departments in implementation of corporate strategies; research into and analysis of strategic issues potentially affecting Amtrak; and coordinating technology research within Amtrak and with outside entities. Corporate Research and Strategy’s goals include: Aligning corporate activities with achieving corporate goals; Developing/managing processes that allocate resources with strategic priories; Assuring there is a comprehensive and coordinated approach to incorporating consideration of enterprise risk into corporate programmatic and investment decisions; Supporting Amtrak’s senior leadership in making well informed decisions through high quality research and analysis. The FY2013 budget request is $2.1M representing an increase of $1.3M versus the FY2012 actual of $0.8M. Base Activity: The FY2013 base budget request is $2.1M and it is mainly driven by labor cost and professional fees. The FY2013 base operating request, as compared to FY2012 actuals has increased by $1.3M. This is a new department created in the second half of FY2012. The FY2013 budget reflects a full year of expense compared to a partial year for FY2012. Increase due to full year of Salary - $0.5M Benefit increase due to full year of expense - $0.5M Professional fees increase - $0.2M Corporate Strategy & Research - Operating Expenses Summary FY2011 - FY2013 FY2013 Incr/(Decr) vs FY2012 $ Millions Salaries Employee Benefits Expenses Salaries, Wages and Benefits Professional Fees Expenses Total Operating Expenses FY2011 Actual FY2012 Actual FY2013 Budget $ % $0.0 0.0 0.0 0.0 $0.0 $0.2 0.1 0.3 0.5 $0.8 $0.7 0.6 1.4 0.7 $2.1 $0.5 0.5 1.1 0.2 $1.3 295.3% 396.4% 344.8% 33.2% 150.3% Summary of Changes FY2012 to FY2013 $ Millions $0.8 FY2012 Actual Changes to Base Activity Salary increased due to full year of expense compared to partial year of expense in FY12 0.5 Employee benefits increase due to full year expense compared to a partial year FY12 0.5 Professional Fees - 8 months of expense for Palladium Group to assist with development of balance scorecard 0.2 Other 0.1 Base Activity Increase/(Decrease) from Prior Year $1.3 $2.1 Total FY2013 Base Activity $2.1 FY2013 Total Budget 40 of 95 Chief of Customer Service Overview of the Department The Chief of Customer Service is a newly created department which will lead all customer service initiatives as part of the continuing company reorganization. This department is charged with ensuring that Amtrak provides service that meets the wants, needs and expectations of customers and that the customer is always the first consideration in the daily administration of Amtrak’s operations. This department oversees the Food and Beverage (F&B) and Product Development groups that were previously part of the Marketing and Sales department. During fiscal year 2013 this department will take responsibility of certain operations functions including the Consolidated National Operations Center (CNOC), crew management services, intermodal connectivity, space and equipment control, as well as administration of special trains which are currently part of the Transportation Department. Base Activity: Customer Service’s FY2013 base budget is $102.3M which represents an increase of $2.7M as compared to FY2012 actual. The major drivers for this increase are: Inflation of non-labor expenses - $1.6M Provision for management merit increase - $0.1M Decrease in salaries due to one-time severance paid in FY2012 – ($0.6M) Increase of Food & Beverage costs and distribution offset by increase in Food & Beverage revenue - $1.8M Decrease in office and distribution expenses - ($0.5M) Other - $0.3M New Activity: Increase in headcount to support Consumer Satisfaction Index (CSI) efforts and new systems being deployed - $0.8M Operating Expense Summary FY2011 – FY2013: Chief of Customer Service FY2013 Incr/(Decr) vs FY2012 FY2011 Actual FY2012 Actual FY2013 Budget $ % Salaries $4.2 $4.0 $4.0 ($0.0) -0.4% Wages & Overtime 0.1 0.1 0.1 (0.0) -14.5% Employee Benefits Expenses 2.5 2.6 3.2 0.6 24.2% Employee Related 0.3 0.2 0.2 (0.0) -14.3% $ millions Salaries, Wages and Benefits 7.0 6.9 7.4 0.6 8.3% Train Operations 87.9 88.4 91.7 3.3 3.8% Fuel, Power, & Utilities 0.1 0.1 0.1 0.0 6.0% Materials 0.0 0.1 0.0 (0.1) -81.8% Facility, Communication, & Office 2.1 2.1 2.3 0.2 8.5% Professional Fees Expenses 0.1 0.0 0.0 0.0 31.1% Data Processing Services 0.1 1.0 0.3 (0.7) -67.0% M of W Services 0.4 0.6 0.5 (0.1) -16.6% Passenger Inconvenience 0.3 0.4 0.6 0.2 55.0% Financial 0.0 (0.0) 0.1 0.1 100.0% $98.1 $99.5 $103.1 $3.5 3.6% Total Operating Expenses 41 of 95 Summary of Changes FY2012 to FY2013 $ Millions $99.5 FY2012 Actual Changes to Base Activity Inflation of non-labor expenses 1.6 Provision for management merit increase 0.1 Decrease in salaries due to one time severance paid in FY2012 Increase of Food & Beverage costs and distribution offset by Food & Beverage revenue (0.6) 1.8 Decrease in office and distribution expenses (0.5) Other 0.3 $2.7 Base Activity Increase/(Decrease) from Prior Year $102.3 Total FY2013 Base Activity New Activity 3 new positions requested for the Product Management group in order to meet CSI targets 0.5 2 new positions requested for the Food and Beverage group to support POS system 0.3 $0.8 Total FY2013 New Activity $103.1 FY2013 Total Budget Emergency Management and Corporate Security Overview of the Department The Emergency Management and Corporate Security department is responsible for continually developing Amtrak’s corporate skill and competency to identify and minimize risk through better preparation, effective response and recovery. This effort will be supported through the development and implementation of a comprehensive crisis and security incident management system. In order to effectively respond to incidents in the field while still fulfilling the regulatory requirements for planning, training and exercising, the department is structured around three main functions: Continuity and Preparedness, Emergency Management and Corporate Security. Continuity and Preparedness - Responsibilities include plan development and maintenance, training and exercise, and continuity of operations. Emergency Management - Responsible for facilitation and conduction of emergency preparedness planning, training, and exercises, utilizing the National Incident Management System (i.e. Incident Command) structure via online, classroom and practical instruction, as well as the coordination and maintenance of divisional emergency, COOP and Station Action Plans, policies, procedures, relating to response, recovery, evacuation, and continuity of operations, within the assigned division through 11 Program Managers located throughout the Amtrak system focusing on major stations and geographic regions. Corporate Security - Responsible for the planning, directing and implementation of the Corporate Security Risk Strategy, utilizing the Transit Risk Assessment Module (TRAM). The Emergency Management and Corporate Security department total budget request for FY2013 is $10.1M representing an increase of $2.1M compared to FY2012 actual. Base Activity: The FY2013 base budget is $9.4M, increasing by $1.4M over the FY2012 actual. Salaries increase $0.7M related to the reorganization and merit increases. Benefits increase by $1.1M. New Activity: New activity in includes increased security expense $0.5M due to end of Department Homeland Security (DHS) grant funding for Roman Secure Network and Rent due to relocation of organization $0.2M. 42 of 95 Operating Expense Summary FY2011 – FY2013: Emergency Management and Corporate Security FY2013 Incr/(Decr) vs FY2012 FY2011 Actual FY2012 Actual FY2013 Budget $ Salaries $2.7 $2.7 $3.5 $0.8 28.3% Wages & Overtime 0.0 0.0 0.1 0.1 194.7% Employee Benefits Expenses 1.6 1.7 2.9 1.1 65.0% Employee Related 0.2 0.2 0.2 0.0 13.2% 4.6 4.7 6.7 2.0 $0.0 Facility, Communication, & Office 0.6 2.7 1.5 (1.2) -45.9% Professional Fees Expenses 0.4 0.4 1.8 1.4 328.7% Data Processing Services 0.0 0.1 (0.0) (0.1) N/A M of W Services 0.1 0.0 0.0 0.0 4.6% Total Operating Expenses $5.8 $8.0 $10.1 $2.1 26.8% $ Millions Salaries, Wages and Benefits % Summary of Changes FY2012 to FY2013 $ Millions FY2012 Actual $8.0 Changes to Base Activity Inflation of non-labor expenses Inflation wages & OT Management salary increase Salary increase due to re-organization Employee benefits Professional fees Data processing service reduction Other Base Activity Increase/(Decrease) from Prior Year Total FY2013 Base Activity 0.1 0.0 0.1 0.6 1.1 (0.2) (0.1) (0.1) $1.4 $9.4 New Activity Security cost increase - corporate Smart ID cards and Roman Secure Network New rent due to consolidation of departments Total FY2013 New Activity FY2013 Total Budget 0.5 0.2 $0.7 $10.1 Capital Projects: Emergency Management and Corporate Security $ in millions Program Title Communications & Situational Awareness Equipment and Security Operations Exercises Infrastructure Protection Planning & Assessments Security Awareness Safety & Security Training Total Emergency Management & Corporate Security 43 of 95 GCAP $0.0 0.0 0.0 0.0 0.0 0.0 0.0 0.0 $0.0 State & Local / Other $1.7 2.8 0.4 20.1 4.2 0.5 3.4 3.2 $36.4 Total $1.7 2.8 0.4 20.1 4.2 0.5 3.4 3.2 $36.4 Communications & Situational Awareness $1.7M Communication & Situational Awareness Hardware $0.1M: this project will pay for contracts and the purchase and installation of equipment and supplies to support further integration and maintenance of the CCTV and alarms systems into the Amtrak Secure and Business networks. Communications & Situational Awareness Software $1.0M: this project will provide funding to hire a vendor to complete Phase II of the Amtrak’s Integrated Communication and Operations Program (iCOP). Communication & Situational Awareness $0.6M: this project will provide funding to support activities associated with enhancing Amtrak’s incident management and response capabilities. These activities build on previously funded TSGP and IPR projects. Equipment and Security Operations $2.8M Equipment Upgrades $2.3M: uses Intercity Passenger Rail (IPR) funds to support the continuation of critical counter-terrorism efforts, specifically for surge operations utilizing patrol officers within the Amtrak Police Department. Security Operations $0.5M: Amtrak proposes using IPR funds to send forty-five of its Canine Officers to a two-week refresher/advanced training course including various training scenarios based on Auburn University instructor field observations when they work with Amtrak K9 Teams at Amtrak stations, terminals and facilities. Exercises $0.4M Station Action Plan Test $0.1M: this project will allow Amtrak Police Department (APD), Mobile Teams and Station Managers to conduct full scale exercises and tabletop exercises to test and work through station action plans. Security Awareness Program $0.3M: the program will create an environment where standardized training, exercise, evaluation and improvements are institutionalized within the plans, procedures and protocols at Amtrak. Homeland Security Exercise and Training (HSET) will allow Amtrak to draw upon past exercises, including the comprehensive after action report and implementation plan resulting from Amtrak’s recovery and resilience exercises, to identify training needs and establish goals of preparedness utilizing an all hazards approach. Infrastructure Protection Program: $20.1M Security Hardening $2.9M: This will allow Amtrak workforce and hired contractors to create designs, make security improvements to new or existing rail infrastructure, and to purchase and install equipment necessary to enhance security at stations and rail facilities identified in the DHS funded risk and needs assessments as key intercity rail transportation assets, at bridges and tunnels, at key sites along the right-ofway, and with the concurrence of DHS, wherever impending security threats become evident.. Bridge/Tunnel/Substation Security Improvements $3.3M: this project is to control access, detect unauthorized entry and deter the ability to carry out terrorist activities against critical infrastructure by hardening substations, bridges and tunnels in the national passenger rail system. CCTV & Communications $5.2M: This project will continue to create new CCTV and Communications capabilities in stations on the East Coast Operations and Western Operations that will the integrate into a video management system. The signals results can be transmitted to National Communications Center (NCC) or remote locations. The APD will have the ability to intelligently dispatch resources and give responding personnel real-time information. Station Hardening $3.7M: the project will provide funds to hire contractors to design and to install station hardening systems including new bollards (fixed barriers and/or retractable barricades), gateway checkpoints, and protection for pillars integral to the stability of the building. Communication Control Center $2.8M: this project will support facility and equipment improvements at Amtrak Command Centers to increase capacity for monitoring the CCTV and alarm systems installed at critical infrastructure sites throughout the national passenger rail. Infrastructure Project $1.4M: Amtrak will use Transit Security Grant Program (TSGP) funding to continue implementing its hardening efforts at risked ranked facilities where risk mitigation strategies have not been fully implemented. Projects will be chosen from a prioritized list of approximately 135 of the 554 assets that make up the Amtrak System. Decisions to pursue projects will be based on risk and need as well as other factors such as opportunities to leverage concurrent project work at priority assets and internal and external resource availability. TSGP Operations Package - $0.8M: Amtrak will use these grant funds to pay for personnel costs such as salary, overtime, and benefits for 16 officers for a 36 month period plus the costs to outfit them with 44 of 95 standard equipment such as uniforms and radios as well as specialized equipment to carry out their appointed duties such as explosive detection equipment and consumables for screening teams and vehicles and kennels for canine teams. Planning & Assessments Program: $4.2M Station Action Plan $2.1M: the Station Action Team (SAT) Toolkits are mutually reinforcing, assessment, planning and analytical tools used to augment and/or determine infrastructure protection risk remediation strategies and to create appropriate operational plans for Amtrak's most critical stations and facilities. Planning and Assessments $2.1M: TSGP funds will be used to hire a vendor to conduct a follow-up to its previous risk and needs assessments, using TRAM -Transportation Risk Assessment Methodology- funded by DHS Security Awareness $0.5M Security Planning Program $0.5M: Amtrak intends to continue implementing recommendations of its recently developed Employee Security Training Plan and the Recovery and Resilience Exercise project, as well as necessary Sensitive Security Information (SSI) planning and training. Safety & Security Program: $3.4M Security/Protect Inoperability $0.8M: Amtrak proposes hiring a contractor to conduct a technical and operational capabilities assessment and design a comprehensive interoperable communication plan that will enable Amtrak’s counter-terrorism agents and the APD to exchange data on demand, in real time, across separate systems, with each other as well as with jurisdictionally appropriate law enforcement agencies, transit departments, emergency responders, and Federal agencies (i.e., FEMA, etc.). Police K9 Expansion $1.6M: Starting with a baseline of 55 teams, Amtrak proposes to use this funding to expand its canine explosive detection team program by 12 teams to a total of 67. Funds will provide 12 canine teams with training and startup equipment and supplies, including vehicles. Amtrak also proposes using funds to pay for refresher training and recertification of K-9 teams. DHS Operational Packages $1.0M: The request funds a four-person mobile screening team in the New England region to supplement screening efforts conducted by Amtrak special operations teams. Training Program: $3.2M Security Canine Procurement & Training - $0.6M: This project allows the Transportation Security Administration (TSA) Canine Project to set up to provide free canines, training and reimbursement of operating and equipment costs through its National Explosive Detection Canine Team Program (NEDCTP). Amtrak is responsible for partial operating expense. Security Training $0.5M: this project will provide ongoing counterterrorism training to APD, Amtrak Mobile Teams and security related training for Amtrak employees. Department of Homeland Security (DHS) Training and Public Awareness - $2.1M: This program supports the planning and implementation of security awareness programs to inform and enlist public support for security efforts. It will also provide security awareness training to employees by providing opportunities to learn to detect a variety of threat scenarios and take appropriate actions to protect themselves and passengers. Engineering Overview of the Department Amtrak’s Engineering department can be described as an engineering firm and operating/construction company responsible for keeping infrastructure in a state of good repair. Engineering is responsible for activities that include engineering, design, maintenance, testing, and inspection of Amtrak’s physical infrastructure, including track, signals, electric traction, tunnels, and bridges on Amtrak owned right of way and stations and facilities along the right of way. The group is responsible for the maintenance and overhaul of roadway machines and equipment used in the operation. In addition to the core maintenance activities, the group is also responsible for developing and executing the plan to bring the infrastructure into a state of good repair, and supporting reimbursable project activity in conjunction with state and local agencies on and along the Amtrak right of way. Base Activity: Engineering’s FY2013 base budget is $348.4M which includes $21.6M of Superstorm Sandy response expense. Excluding Superstorm Sandy this is a decrease of ($3.3M) versus FY2012 actual operating expenses. 45 of 95 A summary of the FY2013 changes includes the following: Inflation of non-labor expenses - $3.6M Inflation wages and overtime - $4.7M Management salary merit increases - $1.0M Increase overall management headcount – $0.3M Decrease due to reduction in overtime expenses - ($4.3M) Decrease in employee benefits related to wages and fringe benefits - $0.6M Employee related expenses decrease due to payroll and travel - ($1.5M) Decrease in utilities: Steam and fuel oil reduction to FY2011 levels - ($0.5M) Decrease in facility expenses driven by Los Angeles yards maintenance - ($0.4M) Professional Fees Services – driven by tunnel fans service and maintenance expenses - $1.7M Decrease in data processing services due to reduction of outside services - ($1.7M) Increase in maintenance of way services due to tree and vegetation cutting - $4.0M Transfer labor costs for equipment repair - ($2.3M) Superstorm Sandy response - $21.6M Capital transfer credits due to expected higher activity in capital projects - ($8.6M) Other expenses - $0.2M Operating Expense Summary FY2011 – FY2013: Engineering FY2013 Incr/(Decr) vs FY2012 $ Millions Salaries Wages & Overtime Employee Benefits Expenses Employee Related Salaries, Wages and Benefits Train Operations Fuel, Power, & Utilities Materials Facility, Communication, & Office Casualty & Other Claims Professional Fees Expenses Data Processing Services Environmental & Safety M of W Services Financial PCard Transactions Expense Transfer Indirect Costs Capitalized to P&E Total Operating Expenses FY2011 Actual FY2012 Actual FY2013 Budget $ % $27.2 149.4 90.0 7.2 273.9 0.4 9.3 21.9 17.3 2.7 7.2 3.0 4.1 30.1 1.6 0.2 (1.2) (94.6) $275.8 $29.5 163.0 98.6 7.2 298.3 0.1 7.5 22.8 21.9 0.0 5.8 4.0 2.1 27.4 0.1 0.5 2.7 (63.1) $330.1 $31.0 170.6 102.9 6.4 310.9 0.2 7.4 26.9 22.4 0.0 8.4 2.4 2.2 33.7 0.1 0.1 0.4 (66.9) $348.4 $1.5 7.6 4.3 (0.7) 12.6 0.1 (0.1) 4.1 0.5 (0.0) 2.6 (1.5) 0.2 6.2 (0.0) (0.3) (2.3) (3.7) $18.4 5.0% 4.7% 4.3% -10.3% 4.2% 52.5% -1.2% 18.0% 2.4% -42.9% 44.8% -38.6% 7.9% 22.7% -4.2% -69.7% -84.7% -5.9% 5.6% 46 of 95 Summary of Changes FY2012 to FY2013 $ Millions FY2012 Actual $330.1 Changes to Base Activity Inflation of non-labor expenses Inflation wages & OT Management merit increase Increase in management headcount by 30 new employees Wages & OT driven by enforcement in overtime reduction Employee benefits expenses driven by fringe benefits on salary, wages & OT Decrease in Employee Related expenses mainly driven by travel expenses Decrease in fuel, power, & utilities driven mainly by steam and fuel oil reduction Decrease in facility, communication, & office primarily due to LA yards maintenance and small tool reduction Increase in professional fees due to NYC tunnel fans service and maintenance expenses Decrease in data processing services due to reduction of outside services Increase in maintenance of way services driven by tree and vegetation cutting Decrease in transfer labor costs for equipment repair Cost associated with Superstorm Sandy response Indirect costs capitalized to property & equipment Other Base Activity Increase/(Decrease) from Prior Year Total FY2013 Base Activity 3.6 4.7 1.0 0.3 (4.3) 0.6 (1.5) (0.5) (0.4) 1.7 (1.7) 4.0 (2.3) 21.6 (8.6) 0.2 $18.4 $348.4 FY2013 Total Budget $348.4 Capital Projects: Engineering $ in millions Program Title Bridges/Culverts/Tunnels Facility/Station/Other Signal Systems Communication Systems Overhead Catenary and Transmission Systems Substations/Frequency Converters Track Replacement Interlocking Renewal Equipment Purchase/Replacement Fire & Life Safety NYC - Trenton NJ HSR Improvements ADA Compliance Gateway Total Engineering GCAP $36.2 46.5 31.1 0.8 10.0 14.0 127.2 6.0 14.7 3.4 0.0 50.0 20.0 $360.0 State & Local/Other $17.8 26.3 14.4 0.4 4.0 4.9 73.0 17.8 0.0 13.1 51.4 3.1 14.2 $240.2 Total $54.0 72.8 45.5 1.2 14.0 18.9 200.2 23.8 14.7 16.5 51.4 53.1 34.2 $600.2 Bridges, Culverts and Tunnels $54.0M Movable Bridges $5.1M - The scope of this program is to bring Amtrak's movable bridges to a state of good repair. Some of the bridges will be brought to a state of good repair through selective component replacement while others require complete replacement of movable structure, mechanical and electrical systems. Fixed Bridges Upgrade $14.7M - The scope of this program is to address under grade bridges and to convert open deck under grade bridges to ballast deck for improved train performance. Tunnels $10.1M - The scope of this program is to bring all tunnels to a state of good repair. This will be accomplished primarily through component replacement or through complete replacement of the tunnel under extreme circumstances. 47 of 95 Major Bridge Special Projects $16.6M - The scope of this program is to address major bridges currently not in a state of good repair for improved train performance, eliminating slow orders that would occur when bridge components fail and disrupt the train traffic and continuous maintenance costs due to temporary repairs. Other programs $7.5M – Includes replacement of timber bridge ties, upgrade culverts, fence repair and installation, and retaining wall masonry and concrete work. Facility, Station and Other $72.8M Maintenance of Equipment Facilities $11.2M - Upgrades to equipment maintenance facilities such as HVAC replacement, roof replacement, electrical upgrades, and lighting improvements. The construction of a new Maintenance Facility in Hialeah, FL. This facility will make the Amtrak system more efficient in executing maintenance and repairs on its Viewliner, Amfleet II and Heritage Diner equipment fleets. Maintenance of Way Base $7.2M - Various upgrades to maintenance of way facilities such as HVAC replacement, roof replacement, electrical upgrades, and lighting improvements. Station Upgrades $48.8M - Upgrades to stations to include HVAC, roofing, lighting, and other interior improvements. Transportation Department Facilities $0.6M - The scope of this program is the renewal of interlocking control towers such as the “K” tower and Dock interlocking tower. Sunnyside Yard New Mechanical Facility $5.0M - The scope of this program is to build a new consolidated Mechanical, Engineering, and Transportation maintenance facility and warehouse at Sunnyside Yard outside of New York Penn Station. Signal Systems $45.5M Automatic Block Signal (ABS) $3.4M - The scope of the program is to bring ABS assets to a state of good repair. ABS component failures have been identified as a major contributor to train delay. Upgrading of outdated components will result in increased reliability, improved on-time performance and railroad safety. Advanced Civil Speed Enforcement System (ACSES) $22.7M - This program involves the installation of Positive Train Control on the Amtrak system. This includes upgrades to Central Instrument House (CIH), radio transmission equipment, and wayside interface units. For interoperability with freight carriers operating on the NEC, Amtrak will install an Interoperable Electronics Train Management System (IETMS) overlay that will allow freight trains and some commuter trains to operate on the NEC without ACSES equipment. Interlocking – Communications & Signals $7.4M - This program will upgrade signal systems at interlocking(s) to eliminate equipment failures and reduce maintenance costs. The program involves conversion of air switch machines to electric machines, automation of manual towers and replacement of obsolete interlocking signal system components. Crossings $0.2M - The scope of this program is to upgrade highway crossing detection devices for more reliable operation of warning systems. It will enhance grade crossing system safety and reduce maintenance costs. Centralized Traffic Control (CETC) $11.8M - The scope of this program is to replace centralized traffic control equipment in CETC locations with modern server-based systems. The three existing locations do not have back-up capability. Server-based systems will allow for simplified back up in case of a disaster. Communications Systems $1.2M The objective of this program is the renewal and replacement of radio assets to bring Amtrak in compliance with the Federal Communications Commission. Work performed under this program includes the renewal of battery back-up systems at radio locations and the replacement of analog radio equipment with digital narrowband equipment. Overhead Catenary and Transmission Systems $14.0M Catenary $6.7M - The scope of this program is the replacement and renewal of catenary wire, insulators and hardware currently not in a state of good repair. Elements of this program include not only replacement of components that are beyond their useful life, but also the replacement of wire that is beyond the allowable wear percentages. Catenary Pole $6.5M - Many of the catenary poles are over 90 years old and are beyond their designed service life. Replacement of the poles will provide physical support to the power transmission and catenary systems. 48 of 95 Transmission $0.8M - The scope of this program is the replacement of traction power transmission cable and associated hardware. Much of the existing cable has been in service for over 70 years and has far exceeded its useful life. Substations Frequency Converters $18.9M The scope of this program is to make improvements of the electric traction and substations along the Northeast Corridor. Some examples of work performed under this program are: replacement of rotary traction power frequency converters, replacement or renewal of existing power machine, and renewal of substation components such as power transformers, circuit breakers and control cables. The reliable operation of these assets is critical to on-time performance. Track Replacement $200.2M Track Ballast $2.7M - The scope of this program is to perform work that will bring the ballast assets to a state of good repair. Examples of work performed under the program are replacement through spot undercutting and shoulder cleaning where total replacements are not needed. Track Drainage $1.3M - The scope of this program is to renew and replace track drainage assets currently not in a state of good repair. If not corrected, poor drainage will result in slow orders and higher maintenance costs associated with the accelerated degradation of track geometry. Track Rail Replacement $17.2M - The objective of this program is the replacement of rail that is currently not in a state of good repair. There is roughly 1,600 miles of main line track that is 40 to 50 years old. Amtrak replaces an average of 35 miles of rail per year. Useful service life of rail has been exceeded once horizontal or vertical wear limits, internal defect rates, or surface conditions are approaching safety limits. This program will help to reduce maintenance costs and slow orders. Crosstie / Timber $15.2M - This program will replace crosstie and track timber along the NEC which will reduce train delays, track geometry degradation, FRA track defects, and switch failures. Track Laying System (TLS) $56.3M - This program is the utilization of TLS for the complete replacement of wood cross tie track with concrete cross ties including replacement of concrete ties that have been found to be defective. This replacement program will reduce maintenance costs, potential slow orders, and provide for an increase in on-time performance. Track Turnouts $7.2M - This program involves the replacement of standard wood turnouts and associated components not currently in state of good repair. Associated components include frogs, switch points, and wood and concrete switch timbers and other track turnout material. Track Geometry $18.6M - Surfacing, realignment and re-profiling of track surface as required to meet FRA Track Safety Standards, maintain ride quality standards, and extend the life of track components. Track Renewal/Construction $72.6M - The scope of this program includes the addition of new double track between MP 21.2 and MP 31.3 on the Springfield Line and the rehabilitation and realignment of approximately one mile of track. It also includes rehabilitating all four (4) railroad tunnels, Lines 1 through 4, from MP 0.2 (Penn Station) to approximately MP 2.7 (East Portal). Other $9.1M - Includes infrastructure management systems, crossing road and safety & security systems. Interlocking Renewal $23.8M The scope of this program is the total renewal of the existing track structure within interlocking limits with new advanced technology; updates include repair or replacement of turnouts, concrete switch ties, moveable point frogs, and switches. These interlocking renewal projects will move the railroad towards a state of good repair by eliminating failures and reducing maintenance costs. Equipment Purchase/Replacement $14.7M The program involves the replacement of existing equipment at the end of its useful service life. The replacement program will increase efficiency, utility and production capacity of the equipment by taking advantage of technological advances within the industry. Fire & Life Safety $16.5M New York 1st Ave. Vent Shaft Design $13.5M - The scope of the project is to prepare plans, specifications, estimates, engineering and other regulatory documents for the construction of new vent in the East River Tunnel 1st Avenue Site. The scope of the project covers the construction of a vent shaft to mitigate fire and smoke conditions in the East River Tunnel at 1 st Avenue in New York City. Miscellaneous Design & Construction $3.0M - The scope of the projects is to provide Amtrak passengers with a better opportunity to survive a catastrophic event in the New York Tunnels and Penn Station. This program will provide emergency access/egress in the tunnels, provide proper ventilation and remove smoke 49 of 95 from the affected areas. The system will provide responding local Fire Department with access to the fire suppression system within the tunnels. NYC Trenton NJ HSR Improvements $51.4M The general objective of the program is to upgrade and improve the catenary, power, track and signal systems on the NEC primarily between New Brunswick, NJ and Trenton, NJ, and to improve the western approach tracks in Penn Station New York in order to facilitate increased speeds and improved reliability for all users and eventual higher levels of service. The program will also support the goals of increased service capacity, helping Amtrak to meet near-term rising demand for high-speed service on the NEC by operating additional trains in the 2018 to 2023 timeframe and beyond. ADA Compliance $53.1M The objective of these programs is to update railroad facilities for which Amtrak is responsible under the American’s with Disabilities Act to achieve ADA compliance.. Gateway $34.2M The scope of the program is to increase capacity expansion into and through Midtown Manhattan. This is critical to delivering expanded high speed rail service by 2025 and providing next generation high speed rail service starting in 2030. The project includes two new tracks between Newark and New York, including new Hudson River tunnels, Penn Station capacity expansion and Portal Bridge replacement. The System Level Design of Gateway: Includes analysis of various operating plans and train throughput under each; conceptual block layout and ventilations; plans for landside station operations and "connectivity" and integration with Moynihan station. Also includes concepts for eastward extension of track. Finance Overview of the Department The Finance Department is comprised of the CFO Staff, Treasury, Controller (Corporate Accounting, Payroll, Capital Accounting, Accounts Receivable, and Accounts Payable), NEC Advisory Commission, Financial Analysis, Financial Planning, and Internal Audit functions. The NEC Advisory Commission costs are reimbursable; however, the revenue collected for the costs is recorded in another center. In addition to the operating costs of these departments, the Finance operating expense budget contains significant costs for the company as a whole that are not directly attributable to any single department. Of the FY2013 Finance operating budget of $250.4M, only $52.4M (20.9%) is for departmental costs; the remaining $198.0M (79.1%) is for general Amtrak expenses, most notably the cost of electric power for propulsion of the electric locomotive fleet in the NEC, expenses incurred for ticket sales using credit cards, property and liability insurance, financing related costs, and bank and armored car fees. Base Activity: The FY2013 base budget request is $247.4M an increase of $27.9M over the FY2012 actual $15.8M expected lower revenue from fuel hedging program $3.4M increase for NEC Advisory Commission, the costs are reimbursable $2.0M increase in employee benefit expense $4.1M increase for credit card commissions, based on projected revenues $2.8M for financing expense related to RRIF loan and increased expense for purchase insurance $3.0M in professional fees ($2.0M) decrease in salaries, wages and overtime New Activity: FY2013 budget contains $2.4M for filling current vacant positions and employees returning from the SAP implementation project. The NEC Advisory Commission is increasing by $0.6M for additional positions, this cost is reimbursable. 50 of 95 Finance - Operating Expenses Summary FY2011- FY2013 $ millions Salaries Wages & Overtime Employee Benefits Expenses Employee Related Salaries, Wages and Benefits Fuel, Power, & Utilities Facility, Communication, & Office Advertising & Sales Casualty & Other Claims Professional Fees Expenses Data Processing Services Financial Indirect Costs Capitalized to P&E Total Operating Expenses FY2011 Actual $15.3 4.9 11.7 0.5 32.4 90.7 2.4 41.2 0.1 5.7 1.2 38.9 (0.4) $212.2 FY2012 Actual $16.9 4.4 12.9 0.4 34.7 92.5 3.1 40.4 0.0 5.3 1.7 42.5 (0.8) $219.4 FY2013 Budget $18.0 3.8 16.3 0.7 38.8 109.2 2.4 44.5 0.0 8.5 1.7 45.4 0.0 $250.4 FY2013 Incr/(Decr) vs FY2012 $ % $1.1 6.7% (0.6) -14.4% 3.4 26.2% 0.3 60.6% 4.1 11.9% 16.7 18.1% (0.7) -23.9% 4.1 10.1% 0.0 N/A 3.2 59.9% 0.0 N/A 2.9 6.7% 0.8 N/A $31.0 14.1% Summary of Changes FY2012 to FY2013 $ Millions $219.4 FY2012 Actual Changes to Base Activity Inflation of non-labor expenses Inflation Wages & OT Increased employee benefits Reduction in core salary expense NEC Advisory Commission increase, costs are reimbursable Fuel hedging program - increased expense due to higher premium and reduced revenue Credit Card Commissions Financing related expenses - increase in costs for RRIF Loan and Purchase Insurance Reduction in core wages and OT Form supplies reduction Professional fees Reduction in building maintenance services Reduced data communications expense Other Base Activity Increase/(Decrease) from Prior Year Total FY2013 Base Activity New Activity Filling vacancies Benefits associated with vacancies NEC Advisory Commission additional positions for FY13, the costs are reimbursable Total FY2013 New Activity FY2013 Total Budget 51 of 95 0.4 0.1 2.0 (1.2) 3.4 15.8 4.1 2.8 (0.8) (0.5) 3.0 (0.3) (0.3) (0.7) $27.9 $247.4 1.4 1.0 0.6 $3.0 $250.4 Capital Projects: Finance $ in millions Program Title Energy Efficiency Financial Management Early Buy Outs Total Finance GCAP $1.0 1.8 109.9 $112.7 State & Local/Other $0.0 1.2 0.0 $1.2 Total $1.0 3.0 109.9 $113.9 Energy Efficiency $1.0M Install high efficiency lighting at Mechanical facilities $1.0M - This project continues the work commenced in FY 2010 to install high efficiency lighting at mechanical facilities and shops. This project will replace HID lighting fixtures with fluorescent technology to produce higher quality light with lower overall cost. Financial Management $3.0M Credit Card Interchange reduction costs $1.8M - The purpose of the project is the modernization of Amtrak's credit card processing systems in order to comply with payment card industry requirements, reduce Credit Card Interchange costs, and be consistent with other Amtrak projects to update financial and ticketing systems. This project contributes to making Amtrak safer because it improves the protection of credit card information from fraud, crime, and theft. Section 305 Equipment Pool Committee $0.6M - The PRIIA Section 305 Next Generation Equipment Pool Committee (NGEC) is directed to design, develop specifications for, and procure standardized next generation corridor equipment. Participants in the NGEC effort include Amtrak, States, and FRA, host railroads, equipment manufacturers and other operators as appropriate. The NGEC will determine the number of different types of equipment required; establish a pool of equipment for use on routes funded by participating states, and subject to agreement, utilize Amtrak provided services to design, maintain and remanufacture equipment. This project (grant) is administered by Amtrak on behalf of the NGEC to perform work activities associated with the Section 305 NGEC scope of work as approved by the NGEC and the grant agreement. Program Administration Non Security and Life Safety - $0.6M: This is for retainage related to program management and administrative expenses that could not be directly charged to a specific ARRA project. Equipment Early Buy Out (EBO) $109.9M PRIIA Section 205 provides that the Secretary of the Treasury may make agreements to restructure (including repaying) Amtrak’s indebtedness, including leases, outstanding as of the date of enactment of PRIIA upon such terms as Treasury deems favorable to the interests of the United States Government. Amtrak, Treasury and the Department of Transportation, acting through the Federal Railroad Administration (FRA) entered into a Memorandum of Understanding (MOU) to fund the exercise of certain EBOs on select leases entered into by Amtrak up to a certain amount. Government Affairs and Corporate Communications Overview of the Department The Government Affairs Department is divided into three functional areas: Government Affairs, State Partnerships, and Corporate Communications. In FY2012, the department assumed responsibilities for state partnerships from the Policy & Development department and assumed social media functions from the Marketing department. FY2013 reflects the first full year with the new responsibilities. Government Affairs: Federal grants account for almost half of Amtrak’s overall budget. The Department provides Congress and the Administration with funding requests and documentation required to support the requests, prepares for related hearings before House and Senate Appropriations Committees, and responds to follow-up questions from the Committees. The Department makes annual legislative requests and follows through with appropriate Congressional staff at each step of the process. When multi-year reauthorization bills are in play, the Department provides Congress and the Administration with information relating to reauthorization proposals, prepares for related hearings before the House Transportation and Infrastructure and Senate Commerce Committees, and responds to follow-up questions from the Committees. 52 of 95 Government Affairs field staff provide education and intelligence to support other departments in advancing the company’s needs and business interests. The field staff is active in all states with Amtrak service but with focus on those with state-supported services. Field staffs visit the Mayor or other leaders of every community served by Amtrak at least once a year. This staff is located in Chicago, Oakland, New Orleans, and Albany. The Department educates Congressional staff and advocacy groups who wish to advance Amtrak’s legislative agenda and convenes regular related meetings. It also represents Amtrak at meetings and hearings at all levels of government and regularly meets with local officials in Amtrak communities. The Department responds to external and internal inquiries, provides written responses for the signature of the CEO and Board Members, prepares speeches and presentations, and assists with public officials’ travel arrangements. State Partnerships: Amtrak currently has contractual relationships with 15 states for the operation and planning of state-supported short-distance corridors. This number is expected to grow when Section 209 of PRIIA takes full effect, requiring states to cover the operating loss on all services less than 750 miles in length. This group, with staff in Chicago, Oakland, Raleigh, and Philadelphia, is responsible for negotiating and administering the contracts with these states. They also coordinate new-service studies that are requested by state partners. Corporate Communications: Employee and Customer Communications produces the monthly Amtrak Ink employee magazine, provides content for the on-board Arrive magazine, issues the Amtrak This Week weekly employee newsletter, writes special employee advisories from the president and CEO, and provides employee messaging for most of the corporate departments. Employee and Customer Communications contain three other projects. The Great American Stations Project creates new content for and maintains the Great American Stations website (www.GreatAmericanStations.com), which educates local officials and the public about the benefits of station improvements and the importance of ADA compliance projects at stations and how Amtrak can help advance such projects. It also performs outreach to station communities, including through two annual “Civic Conversations,” regional conferences of local officials and Amtrak officials to discuss station projects. The Amtrak Archives website (www.history.Amtrak.com) was recently launched as an ever-expanding archive of Amtrak through the years. The Amtrak Exhibit Train is an outgrowth of our successful Amtrak 40th anniversary exhibit train, with the cars repurposed for future use. The interior exhibits are in the process of being redesigned and the Exhibit Train will then be used to support public events and station openings across the country. The train has a sales car for which new merchandise is being designed and procured. Also within Corporate Communications, the Media Relations group responds to media inquiries, prepares news releases, statements, and service alerts, organizes media events, develops corporate messaging, and is heavily involved in crisis communications activities. The Social Media group manages Amtrak’s presence and messages on platforms such as Twitter and Facebook. The Graphics Design group designs and produces print material for the department and for other departments, including the annual wall calendar sold through the online Amtrak store. It also maintains a photo library. In addition, Corporate Communications administers the Amtrak Corporate Contributions program and provides support services to the Finance Department in producing the Annual Report. Base Activity: Government Affairs FY2013 base budget is $9.9M, a decrease of $0.2M over FY2012 actual. Salaries and benefits typically make up more than 70% of the budget. A summary of FY2013 changes includes the following: Inflation of prior year expenses - $0.1M Inflation for salaries - $0.2M Benefit expense increase - $0.5M Reduction in base salary expense - ($0.6M) Reduction in outsourced services – ($0.4M) New Activity: FY2013 new activities budget for the department is $1.6M. A summary of new FY2013 activities includes the following: Additional staff - $0.7M Reimbursable feasibility studies - $0.3M Social media - $0.6M 53 of 95 Operating Expense Summary FY2011 – FY2013: Government Affairs $ Millions Salaries Wages & Overtime Employee Benefits Expenses Employee Related Salaries, Wages and Benefits Facility, Communication, & Office Advertising & Sales Professional Fees Expenses Data Processing Services Total Operating Expenses FY2011 Actual $5.1 0.1 3.0 0.4 8.6 0.4 0.1 1.1 0.0 $10.2 FY2012 Actual $5.2 0.1 3.3 0.3 8.9 0.3 0.1 0.3 0.4 $10.1 FY2013 Budget $5.1 0.0 4.1 0.3 9.5 0.4 0.1 1.2 0.1 $11.5 FY2013 Incr/(Decr) vs FY2012 $ % ($0.1) -1.3% (0.1) -110.9% 0.8 22.5% 0.0 2.8% 0.6 7.3% 0.1 36.1% 0.0 30.9% 0.9 254.3% (0.3) -62.3% $1.4 13.7% Summary of Changes FY2012 to FY2013 FY2012 Actual Changes to Base Activity Inflation of non-labor expenses Inflation wages & OT Inflation of management salary Reduction in core salary Increase of benefits Reduction in outsourced services Other Base Activity Increase/(Decrease) from Prior Year Total FY2013 Base Activity New Activity Additional staffing resources Reimbursable feasibility studies Social media Total FY2013 New Activity FY2013 Total Budget $ Millions $10.1 0.1 0.0 0.2 (0.6) 0.5 (0.4) 0.1 ($0.2) $9.9 0.7 0.3 0.6 $1.6 $11.5 NEC Infrastructure and Investment Development Overview of the Department The new NEC Infrastructure and Investment Development Business Line (NECIID) is focused on coordinating, managing and developing Amtrak-owned infrastructure in the Northeast Corridor (NEC) to maximize the financial performance of the NEC and to support the current and future operations on the Corridor, including Amtrak, commuter and freight railroad service. NECIID is charged with leading high-speed rail projects, advancing a state of good repair, managing capacity allocation and creating new capacity for existing and new rail services on the NEC. NECIID will continue to work on a NEC high-speed rail business and financial plan that will address a variety of project financing issues and will identify strategies for financing, including opportunities to maximize private investment in the future development of the NEC. Base Activity: Reduction in base expenses of ($0.5M) results in a FY2013 budget request of $11.7M. Base activity is as follows: Inflation from prior year and management merit increase - $0.3M Delay in full staffing levels in FY2013 – ($0.4M) 54 of 95 Employee benefits salaries - $0.5M Professional fees, data processing, and other - ($0.7M) Other - ($0.2M) Operating Expense Summary FY2011 – FY2013: NEC Infrastructure and Investment Development FY2013 Incr/(Decr) vs FY2012 $ Millions FY2011 Actual FY2012 Actual FY2013 Budget $ % $4.3 2.5 0.3 7.0 0.5 2.2 0.6 $10.3 $3.9 2.4 0.2 6.5 0.2 5.3 0.2 $12.2 $3.7 2.9 0.1 6.7 0.2 4.7 0.1 $11.7 ($0.3) 0.5 (0.0) 0.2 (0.0) (0.6) (0.1) ($0.5) -6.6% 21.8% -13.9% 3.1% -14.7% -11.2% -58.9% -4.5% Salaries Employee Benefits Expenses Employee Related Salaries, Wages and Benefits Facility, Communication, & Office Professional Fees Expenses Data Processing Services Total Operating Expenses Summary of Changes FY2012 to FY2013 $ Millions $12.2 FY2012 Actual Changes to Base Activity Inflation of non-labor expenses Management merit increase Increase in employee benefits expenses driven by department reorganization Management full staffing levels delayed until end of FY13 Decrease in professional fees expenses Decrease in data processing services Other Base Activity Increase/(Decrease) from Prior Year Total FY2013 Base Activity FY2013 Total Budget 0.2 0.1 0.5 (0.4) (0.6) (0.1) (0.2) $(0.5) $11.7 $11.7 Capital Projects: NEC Infrastructure and Investment Development $ in millions Program Title Reimbursable Commuter Projects Corridor Fleet Acquisition Stations Program Total NECIID GCAP $0.0 0.0 2.5 $2.5 State & Local/Other $3.2 0.8 1.0 $5.0 Total $3.2 0.8 3.5 $7.5 Reimbursable Commuter Program $3.2M Maryland Area Regional Commuter (MARC) $3.2M - Amtrak will spend contractually obligated funds developed through the joint benefit capital program process for commuter railroads. Corridor Fleet Acquisition $0.8M The scope of this project is to employ the services of a contractor to assist Amtrak personnel with the evaluation of the technical proposals regarding Next Generation High Speed Rail train sets. Stations Program $3.5M Design Improvements at Washington Terminal $2.3M - Includes detailed phasing and planning work in support of implementation of Master Plan. Phase I begins construction at the Washington Union Terminal (WUT) to advance improvements critical to mitigating congestion at WUT, resulting in reduced delays, improved on-time service, expanded services, and improved regional mobility and accessibility. Purchase 55 of 95 of REA building and accompanying air rights to support operational functions currently handled within existing station facility but must be relocated to support Master Plan implementation. Relocation of crew base and support facilities for Amtrak Transportation and/or Mechanical forces from west side of station to permit new track and platform construction. Replace existing traction power substation which is in severe disrepair. Alternately, undertake rehabilitation of the existing substation to prolong its useful life. Baltimore Penn Station Planning Studies $0.2M - The project funds the SOGR study which will perform a full evaluation of the station’s current condition and will provide recommended improvements. In addition, Amtrak will fund the Master Plan to create a long-term vision for integrating Amtrak’s future transportation and infrastructure requirements with commercial development. Sacramento Station Service Tunnel $1.0M - Amtrak will spend contractually obligated funds developed through the joint benefit capital program process for intercity passenger rails service. Human Capital Department Overview of the Department The Human Capital Management (HCM) department at Amtrak is aligned with Amtrak’s strategic priorities and goals which include running Amtrak like a business with customer centricity, talent management, and employee development as key differentiators. For Human Resources to effectively partner with the business and support Amtrak’s mission and strategic goals, the Department is organized by the following key functions: Recruitment and staffing including employment testing and evaluation Employee Relations and Employee Recognition Services. Employee Shared Services which includes HCM Technology. Total Rewards and Wellness which includes Compensation, Benefits, Retirement Management, Medical Services and Employee Assistance Program. Employee Development including new hire training, supervisory and leadership training, talent management and succession planning. Strategic Workforce Planning including human capital management, workforce analytics and succession planning. Labor Negotiations and Agreement Administration. Human Capital Business Partners. To operationalize Amtrak’s strategic goals, HCM has developed a three year strategic plan. Human Capital’s Strategic Plan entails seven key initiatives to drive Amtrak’s vision in terms of customer service and high performance organizational outcomes: 1. Implement new Integrated Talent Management and Total Rewards strategy (ITM). 2. Implement a more effective and efficient Employee Service Center. 3. Implement supporting investment in HCM technologies as an enabler to drive the talent strategy. 4. Implement the HCM business partner model to drive strategic partnerships with the business. 5. Implement Lean Six-Sigma initiatives to promote process excellence and reduce waste in the operating costs with a laser focus on running Amtrak like a business. 6. Develop and implement a comprehensive Labor strategy and target contracts. 7. Develop and implement an Employee Engagement strategy. The FY2013 total budget request is $46.0M representing an increase of $12.5M compared to FY2012 actual. The $12.5M increases include $1.6M in base activities and $10.9M in new activities. Base Activity: The Human Capital Management department’s FY2013 base budget is $35.1M, an increase of $1.6M over FY2012 actual. A summary of FY2013 changes includes the following: Inflation of prior year expenses including labor agreements - $0.3M Increase in salaries - $0.5M Increase in employee relocation costs and course fees - $1.0M Increase in employee education reimbursements - $0.3M Reduction in software license and maintenance expense – ($0.7M) New Activity: FY2013 budget for new activities is $10.9M. HCM will use $7.3M for additional staff. The majority of these resources will be in the new Organizational Effectiveness group which is responsible for organizational design and 56 of 95 development plus training and development of employees. Three functional groups will acquire the remaining staff. Beside additional staff to build the new HCM team, HCM plans to lease five new software modules for $1.9M. These five modules will assist HCM in the area of compensation analysis, electronic recruiting, succession planning, workforce planning and workforce analytic. Implementation, customization and user training for these new software models are estimated to be $0.4M. Finally, $1.3M was requested for staff development which includes course and seminar fees plus travel expenses. Operating Expense Summary FY2011 – FY2013: Human Capital Department $ Millions Salaries Wages & Overtime Employee Benefits Expenses Employee Related Salaries, Wages and Benefits Train Operations Fuel, Power, & Utilities Facility, Communication, & Office Advertising & Sales Professional Fees Expenses Data Processing Services M of W Services Total Operating Expenses FY2011 Actual $15.9 0.1 9.2 4.0 29.2 0.0 0.0 2.0 0.1 0.9 0.4 0.1 $32.7 FY2012 Actual $15.3 0.1 9.6 3.1 28.1 0.2 0.0 2.3 0.0 2.2 0.6 0.1 $33.5 FY2013 Budget $17.9 0.0 14.3 5.0 37.3 0.1 0.0 3.1 0.1 3.7 1.6 0.1 $46.0 FY2013 Incr/(Decr) vs FY2012 $ % $2.6 17.2% (0.1) -120.2% 4.7 48.8% 1.9 61.2% 9.2 32.8% (0.1) -59.7% 0.0 42.1% 0.8 35.0% 0.1 471.0% 1.5 66.8% 1.0 187.7% (0.0) -12.0% $12.5 37.3% Summary of Changes FY2012 to FY2013 $ Millions $33.5 FY2012 Actual Changes to Base Activity Inflation of non-labor expenses Inflation wages & OT Management salary increase Reduction in core salary and benefit expense Increase for relocation costs for new hires and seminar expense Increase in meetings and temporary help Reduction in software license & maintenance Increase for reimbursable education expense Other Base Activity Increase/(Decrease) from Prior Year Total FY2013 Base Activity New Activity HCM department expansion Consultants for software implementation, customization and training Upgrade and additional Software Total FY2013 New Activity FY2013 Total Budget 57 of 95 0.3 0.0 0.5 (0.5) 1.0 0.3 (0.7) 0.3 0.3 $1.6 $35.1 8.6 0.4 1.9 $10.9 $46.0 Information Technology Overview of the Department The Information Technology Department (IT) drives the development and support and maintenance of the information and technology tools required by the enterprise to safely and reliably provide rail passenger services and meet Amtrak’s business partners’ needs. The department’s mission is to be a collaborative and excellence-driven component of Amtrak's business ecosystem that delivers innovative and world-class business technology solutions which enable the continued transformation of passenger rail and reliably meet the evolving needs and expectations of customers and business partners. IT is focused on improving operational stability, enhancing organizational excellence and transparency, promoting a culture of safety and increasing customer and business partner focus and delivery of key projects. The department is currently organized with three Group Information Officers aligned to support the following areas: Enterprise Resource Planning, Marketing & Sales, and Operations. There are also Information Technology Officers aligned to the business and supporting teams for Architecture, Technology Operations, Information Security, and Program Management/Business Services. The department is rolling out a new organizational structure designed to more quickly meet business partner’s needs as well as drive technological innovation throughout the Amtrak enterprise. The FY2013 budget request is $209.3.0M. The FY2013 total request is $0.9M increase compared to FY2012. The budget request is mainly driven by expenses related to IT infrastructure, labor and contracted services. Base Activity: The base budget includes the entire infrastructure, labor and contracted services cost required to maintain and operate the organization’s systems and equipment. The base budget increase is $0.9M in FY2013. A summary of FY2013 base changes includes the following: Inflation of prior year expenses including labor agreements - $1.6M Salary and benefit reduction due to reorganization - ($5.2M) Replace outdated PC and field equipment, expected relocation expense - $0.9M Increase spending for SAP Center of Excellence operation - $5.0M One time FY2012 expenses associated with discontinued capital projects - ($1.7M) Additional data circuit - $0.6M Operating Expense Summary FY2011 – FY2013: Information Technology $ millions Salaries Wages & Overtime Employee Benefits Expenses Employee Related Salaries, Wages and Benefits Train Operations Facility, Communication, & Office Professional Fees Expenses Data Processing Services PCard Transactions Expense Transfer Total Operating Expenses FY2011 Actual $24.0 0.3 14.2 1.2 39.7 0.1 43.4 2.0 110.1 0.0 0.0 $195.3 FY2012 Actual $29.7 0.3 20.9 0.8 51.7 0.0 34.8 3.3 116.9 0.1 1.7 $208.4 58 of 95 FY2013 Budget $25.6 0.3 19.7 1.1 46.7 0.0 36.5 16.2 109.7 0.2 0.0 $209.3 FY2013 Incr/(Decr) vs FY2012 $ % ($4.1) -13.9% (0.0) -3.9% (1.2) -5.8% 0.3 43.4% (5.0) -9.7% (0.0) -88.7% 1.7 4.9% 12.9 395.7% (7.2) -6.1% 0.1 228.0% (1.7) N/A $0.9 0.4% Summary of Changes FY2012 to FY2013 $ Millions $208.4 FY2012 Actual Changes to Base Activity Inflation of non-labor expenses Inflation wages & OT Management salary merit and related benefit increase Salary decrease due to operating headcount reduction Benefit decrease due to operating headcount reduction Increase in computer equipment/maintenance & relocation expense One time expense transfer in FY12 Increased expense for SAP Center of Excellence Increased telephone expense Other Base Activity Increase/(Decrease) from Prior Year Total FY2013 Base Activity FY2013 Total Budget 1.6 0.0 1.8 (5.2) (1.4) 0.9 (1.7) 5.0 0.6 (0.7) $0.9 $209.3 $209.3 Capital Projects: Information Technology $ in millions Program Title Enterprise Resource Planning Cyber/Information Security Reservation Ecosystem Next Generation IT Infrastructure Modernization & SOGR Amtrak Foundation Program Total Information Technology GCAP $0.0 0.0 0.0 0.0 0.0 $0.0 State & Local/Other $3.9 1.1 15.2 12.9 3.5 $36.5 Total $3.9 1.1 15.2 12.9 3.5 $36.5 Enterprise Resource Planning $3.9M Human Capital Management (HCM) Foundations $1.0M - The intent of this project is to improve communication to employees, and to automate several HCM processes. The FY2013 scope of this project includes: Employee Information Management system enhancements, Employee Communications Portal, eRecruiting Resume Parsing Module, Family Medical Leave Act Administration System, Human Capital eForms and New Hire Onboard Automation System ERP Foundation $2.2M - The intent of this project is to increase operating efficiency of enterprise SAP system. The FY2013 scope of this project includes: Logistics Warehouse Management system and additional SAP licenses. Amtrak Foundation-Reporting & Dashboards $0.2M - The intent of this project is to improve the reporting tool, increase situation awareness of management, reducing costs and increasing revenue for food and beverage operation. The FY2013 scope of this project will complete Enterprise Data Warehouse (EDW) data table design and migrate reports to utilize EDW data for reporting of revenue and ridership via EDW implementing strategic Key Performance Indicators (KPI) dashboard and CSPMI One-Stop reporting enhancements for food and beverage operation. Strategic Asset Management Enterprise (SAM) $0.5M – This is the completion of a multi-year strategic project designed to integrate key operational, financial, and human resource business processes and replace outdated systems. Cyber Information Security $1.1M Cyber Information Security $1.1M - This is a multi-year project for ongoing enhancement and refresh of Amtrak’s information security program and technology components. It will improve Amtrak’s ability to ensure confidentiality, integrity, and availability of Amtrak’s critical infrastructure systems. It also involves 59 of 95 the safeguarding of customer transaction information. Failure to complete this project may result in the failure to quickly identify and respond to vulnerabilities in Amtrak’s information technology infrastructure and non-compliance with regulatory and legal requirements. In FY2013 this project includes Identity and Access Management state of good repair and other infrastructure upgrades with focus on maintaining compliance with the Payment Card Industry standards, assessing our compliance with Federal Information Security Management Act of 2002 (FISMA) standards and acquiring improved tools for the programmers creating custom applications to verify their program code is secure. Reservations Next Generation $15.2M Reservations Ecosystem Next Generation $15.2M - The purpose of this program is to modernize, streamline and significantly reduce business and technical risks from Amtrak’s Sales, Reservation and Ticketing system in support of Amtrak’s current and future business needs and opportunities. This involves updating the underlying system, “Arrow” that is over 30 years old and is based on significantly outdated technology which is the backbone foundation for Amtrak’s sales, ticketing and operational processes, including customer service and train operations. Potential failure of this system is a critical business risk that must be addressed as soon as possible. In FY2013 this project will deliver key milestones that include software and platform upgrades, decommissioning archaic hardware, further reduce system downtime, enhanced ability to share data and information, middle layer infrastructure for reservation and train inventory and other operational upgrades to mitigate risk and deploy a “next generation” platform including Web Services and improved Customer Management infrastructure, that can flexibly lead and respond to emerging travel industry standards and needs of state sponsored services. IT Infrastructure Modernization & SOGR $12.9M Network Redesign and Expansion $2.8M -This is an ongoing program to refresh and expand network infrastructure to provide a highly secure and available network for the enterprise. The scope for the FY2013 project includes: Field work facilities infrastructure improvements identified, which are required to improve network performance for end users of IT systems, upgrade of Network Distribution Frames, replacing old cable and upgrade of network infrastructure inside of building network closets. Technology SOGR and Cost Optimization $10.1M - This is an ongoing program to refresh and expand the IT core infrastructure to ensure reliability standards are met, including network, servers, and workstations. The scope for this project includes: refresh network, servers, and storage infrastructure not covered by the new outsource contract; refresh workstations on a three year cycle; begin the upgrade to the new Desktop Operating system and Office Automation software; acquire hardware to stage in field to improve response time to failures; and replace key IT equipment used in field system. Amtrak Foundation Program $3.5M Train Ops Technology $3.5M - The intent of this project is to improve train operation efficiency through upgrade of current systems, elimination of obsolescent system, introducing mobile devices into work flow and better system integration. The FY2013 scope of this project includes integration of Supply and Demand planning process, consolidating Enterprise Asset Management to one system for linear, mobile and facility assets, warranty serialization for replacement parts, and using mobile devices for work order integration to enable repair and replacement beyond shop environment. Marketing and Sales Overview of the Department The Marketing and Sales (M&S) department drives Amtrak ridership, ticket revenue, and market share through integrated marketing and sales capabilities and a constant focus on increasing customer satisfaction through targeted product and service improvements. Major departmental functions include sales distribution, customer relations, marketing and sales promotion, and pricing and revenue management. M&S budgeted operating expenses of $184.3M including new initiatives of $15.8M. Major operating expense drivers of the department include advertising and promotional costs, wages and benefits for the reservation/sales call centers, and departmental salaries. Meeting the new customer satisfaction and route performance targets mandated by PRIIA in Section 207 and route performance improvement plans in Section 210 is the responsibility of M&S’s groups in collaboration with the Operations and Government Affairs departments. 60 of 95 Targeted metrics as defined under PRIIA Section 207 for financial/operating, on-time performance, train delays, and customer satisfaction will be the focus of management actions to improve and expand passenger rail services. To that end, M&S will continue to deliver the in-depth customer research program began in FY2010 to evaluate the customer experience and assess customer expectations and help Amtrak prioritize its operating and capital programs. Continued investments to leverage, build and mature marketing capabilities will be critical to meeting top-line objectives. These will focus on the following: Building loyalty (increasing repeat ridership) from the existing customer base. Stimulating trial to attract new riders from competing travel modes. Growing Amtrak’s air/rail market share in the NEC. Building market share of total trips in high frequency corridors outside of the NEC. Key M&S advances from capital programs towards these goals will include greater sophistication in the use of electronic direct-to-customer communications, through targeted online interactions, and the development of integrated brand marketing campaigns that communicate the benefits of rail travel across digital, print, broadcast, and entertainment/events/sports marketing venues. Decision support capabilities in Pricing/Revenue Management and Market Research/Analysis will continue to play a critical role in improving revenue performance and guiding the application of marketing resources. Base Activity: Marketing’s FY2013 base budget is $168.5M. A summary of FY2013 base changes includes the following: Inflation of prior year including labor contract requirements - $1.0M Salaries - $0.6M Increase in Employee Benefits - $3.3M Advertising ( partial restoration of FY2012 reduction of $39M) - $1.7M Professional service for CRM and eCommerce - $3.6M Wage & OT for call center - $2.5M Expansion of Wi-Fi service - $2.4M Reduction in Travel Agency commissions and Airline Reservation System access fees - ($1.0M) Costs associated with Superstorm Sandy response - $0.2M New Activity: Marketing’s FY2013 budget for new activities is $15.8M. A summary of FY2013 new activities includes the following: National and Acela Express advertising program - $11.5M Professional service for Market Research - $1.2M Sales and promotions - $2.6M Additional resources - $0.5M 61 of 95 Operating Expense Summary FY2011 – FY2013: Marketing & Sales $ millions Salaries Wages & Overtime Employee Benefits Expenses Employee Related Salaries, Wages and Benefits Fuel, Power, & Utilities Materials Facility, Communication, & Office Advertising & Sales Casualty & Other Claims Professional Fees Expenses Data Processing Services Environmental & Safety Passenger Inconvenience Total Operating Expenses FY2011 Actual $17.5 38.7 31.4 0.8 88.4 0.5 0.1 8.7 71.6 0.8 15.3 2.5 0.0 4.6 $192.4 FY2012 Actual $17.5 39.8 31.3 0.6 89.2 0.5 0.1 8.7 37.8 0.0 10.4 3.5 0.0 4.5 $154.7 FY2013 Budget $16.7 42.5 34.8 0.8 94.9 0.5 0.1 9.4 53.6 0.0 15.2 6.1 0.0 4.5 $184.3 FY2013 Incr/(Decr) vs FY2012 $ % ($0.8) -4.6% 2.7 6.9% 3.5 11.2% 0.2 25.9% 5.6 6.3% 0.0 5.4% 0.0 60.9% 0.7 8.2% 15.8 41.8% 0.0 0.0% 4.8 46.6% 2.6 73.1% 0.0 242.0% 0.0 0.2% $29.6 19.1% Summary of Changes FY2012 to FY2013 $ Millions $154.7 FY2012 Actual Changes to Base Activity Inflation of non-labor expenses Inflation wages & OT Management salary increase Benefit increase Reduction in core salary expense Additional advertising Professional services for CRM and E-Commerce Wages & OT for call center Expansion of Wi-Fi service Reduction in travel agency commissions Reduction for access to airline reservation systems Cost associated with Superstorm Sandy response Other Base Activity Increase/(Decrease) from Prior Year Total FY2013 Base Activity New Activity Additional resources National and Acela Express advertising programs Update sales promotion brochures Market research Promotional events, trade shows and additional merchandise Total FY2013 New Activity FY2013 Total Budget 62 of 95 1.5 1.0 0.6 3.3 (0.9) 1.7 3.6 2.5 2.4 (0.6) (0.4) 0.2 (1.0) $13.8 $168.5 0.5 11.5 1.3 1.2 1.4 $15.8 $184.3 Capital Projects: Marketing & Sales Development $ in millions Program Title GCAP $0.0 0.0 0.0 0.0 0.0 $0.0 e-Ticketing E-Commerce Revenue Management Facilities and Infrastructure Marketing - Future Projects Total Marketing And Sales State & Local/Other $2.8 1.9 2.8 1.1 0.6 $9.1 Total $2.8 1.9 2.8 1.1 0.6 $9.1 eTicketing Related Programs $2.8M The core eTicketing Development project implemented a new ticket validation model that will facilitate customer self-service and transform ticket validation and revenue accounting from a paper based system to an electronic one. Connecting conductors to the central ticketing system using mobile technology enables this transformation while also dramatically improving the accuracy of passenger manifests. The initial phase of eTicketing was deployed on July 30, 2012 and provides the eTicketing solution for approximately 90% of Amtrak customers. In order for Amtrak to realize the full benefit of eTicketing, Amtrak will need to complete some additional work in FY2013. This will include extending the eTicketing capabilities to following types of passengers: Multi-Rides, Groups, Onboard Sales, GDS/Travel Agency and both revenue and non-revenue pass passengers. In addition to delivering enhanced functionality for conductors, customers and improved data for Amtrak and state partners. eCommerce Program $1.9M Amtrak Marketing eCRM Platform Upgrade $1.0M - Due to IBM's discontinuation of the Unica IMOD product, Amtrak’s current eCustomer Relationship Management (eCRM) platform, Amtrak will not be able to perform email and online/ecommerce marketing. A replacement platform is needed. The FY2013 scope for eCRM platform will include: Web Site Personalization; Email Marketing; Amtrak Customer2/CDI Integration; and Campaign Performance Measurement. Amtrak Chase Instant Credit System Upgrade $0.5M - The Chase Instant Credit functionality on Amtrak.com is a contractual requirement with Chase Bank, the issuer of the AGR Chase MasterCard. This functionality allows Amtrak.com customers to apply for a Chase credit card while in the booking path. The new credit card number is returned into the booking engine and used as the method of payment for that reservation. The current functionality is provided via integration in the IB booking path with a Chase third party supplier. The specifications have been provided to Amtrak IT for the web services development that will be required. Customer Experience Programs $0.4M – The program will deliver customer capabilities in a consistent manner across all of Amtrak’s distribution channels. This will allow the customer to do business with Amtrak is a straight forward and efficient way and have the ability to customize to their needs. It will allow Amtrak to provide appropriate communications to customers during their travel life cycle and to ensure the information provided is accurate and consistent. Revenue Management $2.8M Amtrak Revenue Management Forecasting System (RMS) $2.8M - Amtrak Revenue Management System (RMS) is a multi-year project that will automatically and accurately forecast demand by city pair and by price point plus optimizing ticket revenue. RMS will provide price point inventory authorizations to Arrow, Amtrak’s reservation system, and passenger demand forecasting to Capacity Management System, to be developed by Operations. RMS algorithm was rigorously tested using Acela Express, Northeast Regional and Long Distance service. The system trial based on Jun/2010 to May/2011 transactions projected a +2% revenue increase for Long Distance trains and +4% revenue increase for Short Distance trains. Facilities & Infrastructure $1.1M Call Center Facility Needs Assessment $1.1M - The project will fund the replacement of the HVAC System in the Philadelphia Contact Center that has reached end of life. 63 of 95 Marketing - Future Projects $0.6M Human Emulation Technology (HET) $0.6M - Human Emulation Technology allows users to query an automated system to answer questions and/or provide issue resolution. It engages users through natural language dialog and has intelligence to understand a question and determine the correct answer with a high degree of accuracy. It will also significantly improve customer service and reduce agent call handling time. Mechanical Overview of the Department The Mechanical Department is responsible for the maintenance, repair and upgrade of all of Amtrak’s rolling stock (cars and locomotives). With a labor force of approximately 4,600 employees who are located at 11 major terminals and 3 back shops throughout the Amtrak system, this department cleans, maintains repairs, modifies and overhauls the fleet of cars and locomotives to provide daily service to our passengers. Our staff of engineers also provides process expertise as well as technical assistance with the design and procurement of new equipment and the upgrading of existing rolling stock. Base Activity: The FY2013 base budget request is $547.8M for existing operations and $13.1M for new initiatives for a total budget request of $560.9M. The major driving force of the increased operating budget for FY2013 and beyond is the costs for the maintenance and inspections for rolling stock passenger cars that were returned from storage to revenue service in FY2010 and FY2011 as part of the ARRA grant. The budget provides funding for: Turnaround servicing and inspection. Operation and maintenance of our Mechanical facilities across the Amtrak system. Preventive maintenance and mandatory FRA required inspections on the cars and locomotives. A summary of FY2013 base changes includes the following: Inflation of non-labor expenses - $4.4M Inflation wages & OT - $6.1M Management salary merit increase - $1.2M Lower overall management headcount – ($0.7M) Increase in wages due to rebalancing between capital and operating work – ($1.7M) Increase in OT above inflation anticipating a "normal" winter vs. 2012 - $0.9M Employee benefit increase - $5.1M Employee related expense reduced due to less travel - ($0.2M) Train operations expenses - ($0.2M) Utilities - primarily increases in electricity and heating oil offset by natural gas - $2.0M Materials - primarily change in inventory reserve – ($2.6) Professional fees / data processing – ($0.2M) Reduction in facilities office & communications, primarily warehousing & storage. - ($2.3M) Cost associated with Superstorm Sandy - $0.2M Change in capital transfer credits - $6.3M Other - ($0.9M) New Activity: A third party has requested Amtrak to upgrade up to 14 coach cars for use on state-supported intercity routes. In addition, any other work necessary to integrate these cars into the state-supported Amtrak service may be performed by Amtrak at the request of the third party as appropriate. Design and material procurement began in FY2012 with production beginning in FY2013 and it is anticipated that the project will be completed in mid FY2014. Labor requirements for this project are approximately 50 positions at the Amtrak Beech Grove facility which will come from existing workforce. The estimated cost of $13.1M will be reimbursed by the third party. 64 of 95 Operating Expense Summary FY2011 – FY2013: Mechanical FY2013 Incr/(Decr) vs FY2012 $ Millions Salaries Wages & Overtime Employee Benefits Expenses Employee Related Salaries, Wages and Benefits Train Operations Fuel, Power, & Utilities Materials Facility, Communication, & Office Casualty & Other Claims Professional Fees Expenses Data Processing Services Environmental & Safety M of W Services Financial PCard Transactions Expense Transfer Indirect Costs Capitalized to P&E Total Operating Expenses FY2011 Actual FY2012 Actual FY2013 Budget $ % $33.1 212.4 134.2 2.6 382.4 0.2 20.1 141.2 19.6 5.1 4.3 1.9 4.9 0.8 0.2 0.0 0.6 (32.3) $549.0 $33.2 212.9 131.5 2.7 380.3 0.5 17.7 136.9 20.3 0.0 4.2 1.9 3.9 1.0 0.2 0.2 0.2 (36.8) $530.4 $33.7 235.3 139.3 2.5 410.8 0.3 20.8 130.3 18.3 0.0 5.3 0.8 3.6 0.9 0.1 0.1 0.1 (30.5) $560.9 $0.4 22.5 7.8 (0.2) 30.6 (0.2) 3.1 (6.6) (2.0) (0.0) 1.1 (1.1) (0.3) (0.1) (0.1) (0.1) (0.1) 6.3 $30.5 1.3% 10.6% 5.9% -6.2% 8.0% -33.5% 17.3% -4.8% -9.7% -60.3% 26.4% -59.2% -8.4% -7.5% -50.7% -48.7% -43.5% 17.2% 5.7% Summary of Changes FY2012 to FY2013 $ Millions $530.4 FY2012 Actual Changes to Base Activity Inflation of non-labor expenses Inflation wages & Overtime Management salary merit increase Lower overall Management headcount Change in wages due to rebalancing between capital and operating work Increase in Overtime wages above inflation anticipating a "normal" winter vs. 2012 Employee benefit lncrease (non-inflation) Employee related expense, primarily reduced travel Train operations expenses Utilities increase in electricity and heating oil offset by reduction in natural gas Materials - change in inventory reserve Professional fees / data processing Reduction in facilities office & communications, primarily warehousing & storage Cost associated with Superstorm Sandy response Change in capital transfer credits Other Base Activity Increase/(Decrease) from Prior Year Total FY2013 Base Activity New Activity Rebuild of 14 coach cars for thrid party ($4.0M wages/benefits and $9.1M materials) Total FY2013 New Activity FY2013 Total Budget 4.4 6.1 1.2 (0.7) (1.7) 0.9 5.1 (0.2) (0.2) 2.0 (2.6) (0.2) (2.3) 0.2 6.3 (0.9) $17.4 $547.8 13.1 $13.1 $560.9 65 of 95 Capital Programs: Mechanical $ in millions Program Title Passenger Car Locomotive Acela Program Fleet Acquisitions Non-Passenger Equipment Facility Improvements Mechanical IT Projects General Safety And Reliability Total Mechanical GCAP $144.0 37.8 43.6 68.2 0.5 3.8 1.8 5.5 $305.1 State & Local / Other $5.4 0.0 0.0 135.3 0.6 0.0 0.0 0.0 $141.2 Total $149.3 37.8 43.6 203.5 1.1 3.8 1.8 5.5 $446.3 Passenger Car Programs $149.3M The passenger car program will fund the various levels of overhauls that range from mandatory maintenance to complete equipment overhauls, reconfigurations and conversions of equipment, and modifications required by statutes including the Americans with Disabilities Act (ADA) and the Federal Railroad Administration (FRA). The equipment to be overhauled includes Amfleet, Superliners, Viewliner, Talgo, Heritage and Horizon/Surfliner, and encompasses various configurations including diner, café/club, lounge, sleeper, passenger coach, and cab cars. These passenger car programs will enable Amtrak to maintain equipment in a state of good repair, to return the assets to current Amtrak standards, improve reliability and availability of equipment, enhance overall customer experience, comply with applicable Federal regulations and mitigate equipment failures which result in customer discomfort and inconvenience. Locomotive $37.8M Amtrak locomotive programs will involve the various levels of overhaul for electric locomotives (AEM-7 DC, AEM-7 AC and HHP-8) and certain diesel locomotives including F-59, P32-8-ED and Non Powered Control Units (NPCU) and Life Cycle Progressive Maintenance (LCPM) for P40/42 diesel locomotives. Also included are modifications required by Federal agencies including Transportation Security Administration (TSA), Environmental Protection Agency (EPA) and Federal Railroad Administration (FRA). This program will enable Amtrak to bring the locomotive fleet to a state of good repair, increase locomotive reliability and availability, extend the useful life of the locomotive, comply with applicable Federal rules and regulations, and mitigate future expenses associated with an aging fleet. Acela Program $43.6M Funding is included to continue the Acela Overhaul Program. This activity is the second year of a multiyear program addressing the system overhaul needs of the Acela train sets. Overhaul requirements were identified by major system condition assessments, fatigue life calculations, and reliability data trends. Fleet Acquisition Program $203.5M Amtrak will continue its investment in its fleet acquisition programs for the purchase of 130 single level cars including dining cars, baggage cars and sleeper; 70 electric locomotives (RRIF loan); and 2 lowemission switcher locomotives (Internally funded). This program will help the company meet its operating requirements, state of good repair requirements, and capacity needs for its rolling stock equipment fleet. Non-Passenger Equipment Program $1.1M Funding is included to continue the overhaul or modification of various non-passenger equipment types such as baggage cars and auto carriers. Facility Improvements $3.8M 66 of 95 Amtrak plans to continue to invest in facility improvements for modernization and upgrades for various Service and Inspection (S&I) division facilities and heavy overhaul shops. The work to be performed ranges from improvements such as electrical power systems, upgrades to existing facilities, improvements to employee areas, updating tooling, machinery and shop vehicles. The project will enable Amtrak to comply with the Code of Federal Regulations (CFR#49) Parts 229 and 238, to bring the facilities to a state of good repair, increase operations safety, reduce employee injuries, increase efficiency, and improve assets safeguarding initiatives. Mechanical IT Technology Projects $1.8M The Mechanical Department will continue its support of three applications: Work Management System, Mobile Data Management System and Locomotive Health Monitoring & Analysis System. These investments are expected to improve the ability to schedule and monitor mandatory rolling stock maintenance, eliminate cumbersome manual processes and improve reliability and performance. General Safety and Reliability Program $5.5M General Safety and Reliability programs consist of various projects geared towards locomotive and passenger car reliability and safety measures that are associated with the equipment. The projects are expected to improve customer service, mitigate operating costs, improve operational efficiencies, ensure compliance with the Rail Safety Improvement Act of 2008 (RSIA) and improve the safety of Amtrak’s rolling stock equipment. Positive Train Control (PTC): involves the continued purchase and installation of PTC equipment as mandated by the FRA. This activity is expected to continue through FY2015. Engineering Modification Project: involves funding for modification work on rolling stock equipment that is not scheduled for capital overhaul and will be performed at divisional facilities. Cracked Wheel Detector Project: funds the purchase and installation of two machines for Wilmington Shop and Beech Grove Shop to continue this program to eventually equip all major Mechanical wheel facilities with this technology. Office of the General Counsel Overview of the Department The Amtrak Law department is responsible for supporting virtually every aspect of Amtrak’s business. Every member of the department works to achieve four goals: 1) to ensure the company’s compliance with all applicable laws and regulatory requirements. 2) To minimize risks to the company. 3) To protect corporate assets. 4) To assist the company to achieve its business and financial objectives. The Amtrak Law department consists of three organizational or budget entities and nine functional or operational groups. The three budget organizations are the General Counsel, the Office of the Corporate Secretary, and Corporate & Litigation Support; the seven functional/operational groups include: two corporate practice groups (one for real estate, procurement and some engineering matters, and a second for the company’s host railroad relations, state-supported contracting and commuter services and environmental matters); a general litigation, employment and labor practice group; a claims management and litigation group; Corporate and Litigation Support (the company’s document management, including FOIA, program and all legal assistants); the Corporate Secretary’s office; the General Counsel’s office (overall management); Public Health and Environmental. The General Counsel’s budget structure includes the two corporate practice groups, the litigation, employment and labor practice group and the claims litigation and adjustment practice group. These groups advise management on all corporate, commercial, contractual, real estate, financial, statutory and regulatory matters and transactions. Responsibilities include review, negotiation and interpretation of contracts, management and protection of Amtrak’s intellectual property portfolio, and compliance with statutory and regulatory requirements. In addition, the litigation, employment and labor group manages all non-tort claims (i.e., injuries to Amtrak employees, passengers, trespassers and other third parties); litigation and outside counsel engaged to represent the company, all employment complaints against the company, provides labor law advice and manages the company’s internal disciplinary proceedings for agreement employees. The Claims group manages all personal injury and wrongful death claims against the company and employee claims filed under the Federal Employers’ Liability Act (FELA). Primary responsibilities include investigation of accidents, preservation of evidence, litigation management and support, 67 of 95 evaluation of claims, settlement negotiations, trial support, management of outside counsel, review and approval of outside counsel and expert fees, and advice matters ranging from risk management to health and safety issues. Corporate Secretary: The Corporate Secretary’s office supports the Amtrak Board of Directors and serves as liaison between management and the Board of Directors. The Corporate Secretary also advises the Board of Directors on matters of corporate governance under the company’s articles of incorporation, bylaws and Board resolutions. Corporate & Litigation Support: This group administers the company’s document management (retention and destruction) program including the Law department’s litigation and advice files and the company’s FOIA responsibilities. In addition, this group is responsible for supporting the General Counsel in developing and monitoring the department’s budget. Public Health: This group oversees Food and Drug Administration (FDA) food service and sanitation compliance (including Food Service Car, Amtrak Commissary, and Contracted Food Vendor Inspections), Environmental Protection Agency (EPA) drinking water compliance (including sampling passenger car water systems and inspections of Watering Points), passenger and employee food-borne illness investigations, Sanitation Task Force facility audits, pest control service contract management, investigations and follow-up to biting insect claims, Pandemic Flu preparation, and FDA food car design requirements. Environmental: This group supports Amtrak facilities and functions by providing both companywide and facility specific compliance guidance. Compliance activities include development and delivery of training programs, permit applications, routine inspections, and monitoring and submittal of required agency reports. The environmental audit and assessment program is a part of the Environmental Management System (EMS) and is used to identify noncompliance issues and develop corrective actions to prevent these non-compliance issues from re-occurring which could lead to enforcement actions. In addition, the Environmental group provides project management for both operating and capital projects. These projects include remediation of contamination or risk reduction projects at facilities. These projects keep Amtrak in compliance with environmental regulations and clean-up requirements, and create more valuable property. Amtrak’s Environmental Reserve Schedule, in compliance with GAAP, lists almost $60 million in known contamination needing to be remediated over the next 5-15 years. In addition to tracking emissions from the company’s carbon footprint and assisting with programs to reduce greenhouse gas emissions, the Environmental group provides support to Marketing and Government Affairs regarding sustainable practices and the environmental attributes of passenger rail travel. Base Activity: Legal department’s FY2013 budget is $60.5M, a decrease of ($0.1M) from FY2012 Actual. A summary of FY2013 changes includes the following: Inflation of non-labor expenses - $1.0M Provision for management merit increase - $0.5M Decrease in salaries due to severance payments made in FY2012 and no increase in base pay - ($0.7M) Changes in employee benefits - $2.1M Less anticipated usage of service from out-side legal firms and claims - ($3.5M) Other – ($0.4M) New Activity: In response to recommendations made by the Office of the Inspector General, the Law department will reorganize certain aspects of the department: $1.0M. 68 of 95 Operating Expense Summary FY2011 – FY2013: Office of the General Counsel FY2013 Incr/(Decr) vs FY2012 $ Millions FY2011 Actual FY2012 Actual FY2013 Budget $ % $14.3 8.2 0.7 23.2 1.5 6.4 26.9 0.1 3.1 0.0 $61.2 $14.6 9.3 0.6 24.5 1.9 4.4 28.0 0.1 1.7 0.0 $60.6 $14.4 11.5 0.5 26.4 2.0 5.9 23.7 0.0 1.9 0.6 $60.5 ($0.2) 2.2 (0.1) 1.9 0.0 1.6 (4.3) (0.1) 0.2 0.6 ($0.1) -1.0% 23.3% -23.0% 7.7% 1.8% 35.8% -15.3% -86.4% 13.2% 0.0% -0.1% Salaries Employee Benefits Expenses Employee Related Salaries, Wages and Benefits Facility, Communication, & Office Casualty & Other Claims Professional Fees Expenses Data Processing Services Environmental & Safety Other Expenses Total Operating Expenses Summary of Changes FY2012 to FY2013 $ Millions $60.6 FY2012 Actual Changes to Base Activity Inflation of non-labor expenses Provision for management merit increase Decrease in salaries due to severance payments made in FY12 and no increases in base pay Changes in employee benefits Less anticipated usage of service from outside legal firms and claims Other Base Activity Increase/(Decrease) from Prior Year Total FY2013 Base Activity New Activity Reorganization of the Law Department Total FY2013 New Activity FY2013 Total Budget 1.0 0.5 (0.7) 2.1 (3.5) (0.4) ($1.0) $59.6 $1.0 $1.0 $60.5 General Counsel Capital Project $ in millions Program Title Enterprise Resource Planning Environmental Remediation Program Environmental Risk Reduction Total General Counsel GCAP $0.0 3.7 1.0 $4.6 State & Local / Other $1.3 0.0 0.0 $1.3 Total $1.3 3.7 1.0 $5.9 Enterprise Resource Planning $1.3M Corporate Systems Foundation $1.3M - The FY2013 Program will upgrade the Documentum platform to the vendor supported version which will ensure continuous support without additional charges. Specific projects included in this program are: Enhancements to Labor Relations Documentum Repository, Claims System Electronic Document Storage, and General Counsel Electronic Document Storage. 69 of 95 Environmental Remediation Program $3.7M Environmental remediation involves cleanup at work sites due to a Court or an Agency Administrative Order. In FY2013, Amtrak plans to spend $3.7M on environmental remediation to meet ordered clean ups. The various projects being undertaken as part of this program include: Asbestos, Lead Paint and Mold Abatements $0.7M - As part of multi-year initiative, asbestos, mold and lead paint will be removed or remediated during construction projects, as these are encountered. As part of Federal, State, and Local regulations, asbestos containing materials (ACM) must be abated prior to construction or demolition activities. Mold findings have occurred in facilities occupied by Amtrak employees or at Stations. Penn Station Track Remediation $0.2M - This mandatory project is for the protection of employees and the environment by properly disposing of PCB contaminated soil during track work. There are track areas of Penn Station New York which have known PCB contamination and are in need of remediation and track replacement. As Engineering continues its track replacements this project will cover remediation of any PCB-contaminated soil encountered. Sunnyside Yard Oil/PCB Remediation $1.1M - Train operations continuing until the1970's caused polychlorinated biphenyl (PCB) and diesel fuel releases at Sunnyside Yard which contaminated the subsoil. Amtrak and New Jersey Transit (NJT) signed a consent order with the New York State Department of Environmental Conservation (NYSDEC) to clean up the soil in order to reduce potential PCB exposure to employees. Wilmington Facility Remediation $1.3M - This project encompasses remediation of PCB and other contaminants and initiating erosion control measures at the Wilmington maintenance facility. The soil at the facility is contaminated with PCBs and petroleum. Amtrak signed a Voluntary Cleanup Agreement (VCA) with Delaware Department of Natural Resources and Environmental Control (DNREC) and is legally obligated to perform this work. Cedar Hill Remediation $0.1M - This project is mandatory to maintain compliance with Connecticut State Department of Environmental Protection requirements, and for the protection of employees and the environment through removal of PCB-contaminated soil. PCB-contaminated soil in the vicinity of Tracks 28 - 30 at the MOW Base will be excavated and transported offsite to a licensed disposal facility. Following removal of the soil, the area will be backfilled and returned to productive use. Brunswick Commuter Yard Remediation $0.1M – This project is mandatory by the New Jersey Department of Environmental Protection to clean up PCB contamination. Trenton NJ Commuter Yard Remediation $0.1M – This project is required by the New Jersey Department of Environmental Protection to clean up PCB contamination. Hialeah FL Remediation $0.1M – This project encompasses remediation of polyaromatic hydrocarbons soil contamination as required by Miami-Dade Department of Regulatory and Economic Resources. Environmental Risk Reduction $1.0M The goal of the Environmental Risk Reduction program is to use preventive measures to mitigate potential environmental issues. Los Angeles Facility - Wastewater Treatment System Upgrades $0.2M - This project covers the potential elimination or reduction in use of 80 year old wastewater treatment ponds at Los Angeles Yards that has considerable potential for non-compliant discharges. This project anticipates design of subsurface storm water diversion features and construction of storm water diversion devices such as containment curbs, canopies or other enclosures. The design for eliminating and converting existing wastewater treatment ponds will continue in FY2013. Beech Grove Facility - Wastewater Treatment System Upgrades - $0.6M – The existing wastewater treatment system is 60 years old and includes underground components that must be replaced to avoid leaks and seepage. Wilmington Shop Petroleum Tanks Replacement - $0.2M - Two petroleum storage tanks at the Wilmington shops have failed inspection and testing and must be replaced during FY2013. These tanks are very old and of riveted construction, therefore the tanks cannot be repaired. These tanks must be removed and replaced to prevent a catastrophic release of petroleum on to the site. Chief of Operational Research Overview of the Department The Chief of Operational Research Planning is a newly created department in FY2013 as part of the continuing company reorganization. This department will provide analytical support to the Operations team. The focus of the 70 of 95 department will be to conduct operations research (optimizing business processes), scheduling and delay reporting (working with Marketing and Sales), revenue protection, administration (budgeting, IT liaison, host RR compliance, audits) and conducting performance metrics. Operating Expense Summary FY2011 – FY2013: Chief of Operational Research $ Millions $0.0 FY2012 Actual Changes to Base Activity Salaries and Benefits - Establishment of Department Base Activity Increase/(Decrease) from Prior Year FY2013 Total Budget 0.7 $0.7 $0.7 Procurement & Materials Management Overview of the Department The department consists of several functional areas supporting Logistic Operations: Procurement, Inventory Management, Materials Management and Corporate Administration. Procurement is tasked with developing and managing optimal purchasing processes for all capital and operating parts, components and end items for rolling stock, maintenance of way and equipment consumption as well as bidding and contracting for all other outside services and commodities. Inventory Management is tasked with optimizing the inventory to minimize investment and maximize material availability. The Materials Management group operates supply chain activity such as warehousing, transportation and logistics, and inventory control. In addition, this department manages all corporate administrative functions at the corporate offices including mail communications, reprographics center, facility management, construction and space planning. The FY2013 total budget request is $57.5M compared to $55.3M for FY2012 actual. Base Activity: The FY2013 base budget request is $56.8M and it is mainly driven by labor cost and facility expenses. The FY2013 base core operating request, as compared to FY2012 actual has increased by $1.6M primarily due to: Benefit increase - $1.7M Materials /inventory reserve - $1.1M Inflation - $1.2M Reduction in payroll due to department reorganization – ($0.7M) Reduction in professional fees, data processing service and outsourced services – ($1.4M) New Activity: The addition of Michigan and Hudson lines is expected to add $0.7M in payroll, benefits and materials costs to maintain the track. The costs will be reimbursed by the states; the revenue is accounted for in another department. 71 of 95 Procurement & Materials Management: Operating Expenses Summary FY2011 - FY2013 $ millions Salaries Wages & Overtime Employee Benefits Expenses Employee Related Salaries, Wages and Benefits Fuel, Power, & Utilities Materials Facility, Communication, & Office Advertising & Sales Casualty & Other Claims Professional Fees Expenses Data Processing Services Environmental & Safety M of W Services PCard Transactions Expense Transfer Indirect Costs Capitalized to P&E Total Operating Expenses FY2011 Actual $11.6 16.8 16.0 0.6 45.0 0.3 1.2 5.6 0.1 0.4 2.3 1.9 0.0 (0.9) 0.3 0.0 (12.3) $43.9 FY2012 Actual $11.8 18.2 16.8 0.3 47.2 0.3 (0.7) 5.2 0.1 0.0 2.2 1.0 0.1 0.2 (0.1) (0.1) 0.0 $55.3 FY2013 Budget $11.8 17.9 18.8 0.6 49.1 0.3 0.4 4.9 0.0 0.0 1.8 0.5 0.1 0.4 0.0 0.0 0.0 $57.5 FY2013 Incr/(Decr) vs FY2012 $ % ($0.0) -0.1% (0.3) -1.6% 2.0 11.7% 0.3 82.8% 2.0 4.1% 0.0 9.8% 1.1 N/A (0.2) -4.7% (0.0) -57.2% (0.0) -100.0% (0.4) -19.2% (0.6) -56.6% (0.0) -76.8% 0.3 N/A 0.2 N/A 0.1 -100.0% 0.0 0.0% $2.3 4.1% Summary of Changes FY2012 to FY2013 $ Millions $55.3 FY2012 Actual Changes to Base Activity Inflation of non-labor expenses Inflation management salary Inflation wages & OT Management salary decrease Wages & Overtime - adjusting staffing levels to expected operational needs Employee benefit increase Materials - at the end of FY12 there was a credit in inventory reserve account Travel Professional fees Data processing services Reduction in use of outsourced services Road Vehicle Supplies Other Base Activity Increase/(Decrease) from Prior Year Total FY2013 Base Activity New Activity Salary and Wage expense for new Michigan and Hudson lines - costs are reimbursable Associated employee benefit expense - costs are reimbursable Material and Facility costs to support the new Michigan and Hudson lines - costs are reimbursable Total FY2013 New Activity FY2013 Total Budget 72 of 95 0.3 0.4 0.5 (0.3) (0.4) 1.7 1.1 0.3 (0.4) (0.5) (0.5) 0.3 (0.9) $1.6 $56.8 0.4 0.2 0.1 $0.7 $57.5 Capital Projects – Procurement $ in millions GCAP State & Local / Other Facility Purchases and Improvements $0.0 $1.0 $1.0 Total Procurement $0.0 $1.0 $1.0 Program Title Total Facility Purchases and Improvements $1.0M Material handling equipment facilities state of good repair $0.7M - To replace and upgrade material handling equipment at Materials Management warehousing facilities system wide. Equipment being replaced is generally beyond its useful life (8-10 years) and beyond economical repair. Material management facilities state of good repair $0.3M - To make improvements to Material Management store rooms, warehouses, and rail yards. Improvements include: storage racking system and decking to improve storage capacity; security fencing/cameras/doors; upgrades to sprinkler system; roll up doors; dock levelers; upgrades to rail yard and bases, including cable storage barns, heating and lighting improvements, floor resealing, paving and roof replacements. Real Estate Development The Real Estate Development Department (RED) has national responsibility for leveraging and maximizing the revenue opportunities for all Amtrak owned, leased and licensed real estate used for railroad, corporate and commercial purposes, providing facilities planning and providing support to the Operating Departments. RED is comprised of several major components as follows: Revenue Production Revenue production through the long term leasing of Amtrak owned real estate; leasing excess fiber optic capacity in stations and along the right-of-way to telecommunications companies; revenue generation through advertising in stations, along the right-of-way and on-board trains; management of parking facilities through management agreements; retail leases in stations; special events in stations and filming; pipe and wire occupations; automated teller machines, vending machines and payphones in stations; the sale/lease/easement of excess property and the purchase/lease of property required for Amtrak operations. Facilities Planning Planning, implementing, and administering a comprehensive facilities plan for corporate-wide real estate assets, train stations and right-of-way real estate assets. Activities will include short, medium and long range facilities asset utilization including master planning, space utilization, facility design and sustainability programs. Facilities Planning coordinates its efforts with strategic planning and operations planning. Operations Support Real estate property management including current property maps and title information; enforcement of all terms and conditions of revenue generating leases for Amtrak-owned property; acquisition of, negotiation of, and management of lease documents for properties (station, office, warehouse) occupied by Amtrak to secure cost efficient operations; working with commuter agencies in the joint development and use of stations; working with Federal, state and local agencies in development projects; and providing general real estate services to Amtrak’s Engineering, Operations and Law Departments. The goals of this Department are: Meeting the needs of Amtrak internal and external customers for efficient operation of the Railroad; Revenue production focused on long term revenue generation; Achieve highest returns and best use of Amtrak owned real estate; Agreement compliance and enforcement of real estate documents; Guardianship of Amtrak real property rights and protection from encroachment; 73 of 95 Corporate-wide facilities planning; and Maintenance of real estate records. The Department manages approximately: 1,100 real estate leases, licenses, easements and management agreements; 190 retail leases; 160 telecommunication agreements; 2,300 pipe & wire agreements; and 500 requests for property maps/plans/descriptions per year. The FY2013 total budget request is $11.8M representing an increase of $1.9M compared to the total FY2012 actual of $9.9M. Base Activity: The FY2013 base budget request is $11.8M and it is mainly driven by labor and benefit costs and the 30th Street Station (Philadelphia, PA) and Chicago West Loop (Chicago, IL) parking garage operating expenses. A reorganization occurred in mid FY2012 resulting in the creation of a Facilities Planning group within the Real Estate Department. This resulted in an increase to salaries, benefits and expenses for planning/studies/due diligence required to execute the new planning function. Salary increase due to reorganization - $0.5M Benefit increase - $0.8M Professional Fees - $0.6M Real Estate - Operating Expenses Summary FY2011 - FY2013 $ millions Salaries Wages & Overtime Employee Benefits Expenses Employee Related Salaries, Wages and Benefits Fuel, Power, & Utilities Facility, Communication, & Office Professional Fees Expenses Financial Total Operating Expenses FY2011 Actual $2.4 0.1 1.4 0.1 4.0 0.5 3.1 1.4 0.3 $9.3 FY2012 Actual $2.6 0.1 1.7 0.1 4.6 0.3 3.2 1.5 0.3 $9.9 FY2013 Budget $3.1 0.1 2.5 0.2 5.9 0.2 3.2 2.1 0.3 $11.8 FY2013 Incr/(Decr) vs FY2012 $ % $0.5 19.0% 0.0 2.1% 0.8 45.9% 0.1 52.3% 1.3 29.6% (0.1) -32.8% 0.0 0.0% 0.6 39.3% 0.0 0.1% $1.9 19.0% Summary of Changes FY2012 to FY2013 $ Millions $9.9 FY2012 Actual Changes to Base Activity Inflation of non-labor expenses Inflation for management salary & benefits Increase in salary due to reorganization Employee benefits Professional fees Other Base Activity Increase/(Decrease) from Prior Year Total FY2013 Base Activity FY2013 Total Budget 0.1 0.1 0.5 0.8 0.6 (0.2) $1.9 $11.8 $11.8 74 of 95 Capital Project – Real Estate $ in millions Program Title Philadelphia-30th St. Station Total Real Estate GCAP $15.0 $15.0 State & Local / Other $0.0 $0.0 Total $15.0 $15.0 Philadelphia – 30th Street Station Garage Reconstruction $15.0M This is a continuing project and involves the permanent replacement of deteriorated structural columns, beams and surface decking of the under- street parking facility below 30th Street Station, Philadelphia, PA. The work also includes remedying the water infiltration problems throughout the facility, which requires the replacement of the waterproofing membrane and plaza at street level. Additional scope will include sandblasting, inspecting, replacing and painting the structural steel below the North Parking Deck (NPD) that has not already been improved or replaced. Chief Safety Officer Overview of the Department The Amtrak Chief Safety Officer Department provides support to Amtrak’s operations in three functional areas: System Safety (including Industrial Hygiene), Operation Redblock and Regulatory Reporting. The System Safety group is responsible for the System Safety program, evaluation of the safety of proposed new chemical products and maintenance of the electronic material safety data sheet database, Occupational Safety and Health Administration (OSHA) regulations, Federal Railroad Administration (FRA) safety compliance, management of Operation Lifesaver program, facility safety audits, employee exposure surveys and controls, safety training program development, and expert OSHA testimony for Claims. The group provides direct support to field supervision and craft personnel on safety matters and addresses field concerns about employee exposures to hazardous chemicals, solvents, metals, and working conditions. The Safety group audits Amtrak’s compliance with FRA, OSHA and company regulations, policies and guidelines. The focus is on compliance, prevention, and corrective action. The Operation RedBlock group is a labor-developed, company-adopted drug prevention and intervention program. The program emphasizes awareness, education, and prevention committees. The program aims to change attitudes, to reduce the tolerance of nonusers to job-related drug and alcohol use, and to encourage users to seek assistance. The Regulatory Reporting group is responsible for compliance with FRA injury/illness and rail equipment/grade crossing reporting, system administration and maintenance of the Amtrak Safety Information System (ASIS), and input and tracking of passenger safety incident reports. They also provide support to the Amtrak Claims Department and prepare injury reports that identify trends to help field supervision more effectively focus their injury/accident prevention efforts. Base Activity: The Chief Safety Officer Department’s FY2013 base budget is $3.8M, a decrease of ($0.7M) over FY2012 actual operating expenses. 75 of 95 Operating Expense Summary FY2011 – FY2013: Chief Safety Officer FY13 Incr/(Decr) vs FY12 $ Millions Salaries Wages & Overtime Employee Benefits Expenses Employee Related Salaries, Wages and Benefits Facility, Communication, & Office Advertising & Sales Professional Fees Expenses Data Processing Services Environmental & Safety Total Operating Expenses FY11 Actual FY12 Actual FY13 Budget $ % $1.7 0.3 1.2 0.2 3.4 0.3 0.0 0.9 0.0 0.2 $4.9 $1.7 0.3 1.2 0.2 3.4 0.4 0.1 0.3 0.2 0.2 $4.5 $1.4 0.3 1.3 0.2 3.3 0.4 0.0 0.0 0.1 0.1 $3.8 ($0.2) (0.0) 0.0 0.1 (0.1) 0.0 (0.0) (0.3) (0.1) (0.1) ($0.7) -12.9% -9.3% 2.7% 38.2% -4.4% 5.5% -77.3% -93.3% -70.6% -46.9% -15.0% Summary of Changes FY2012 to FY2013 $ Millions $4.5 FY2012 Actual Changes to Base Activity Inflation of non-labor expenses Inflation wages & OT Management salary increase Wages & OT Employee benefits expenses Employee related Facility, communication, & office Professional fee expense Data processing services Environmental & safety Other Base Activity Increase/(Decrease) from Prior Year Total FY2013 Base Activity 0.0 0.0 0.1 (0.0) 0.0 0.1 0.0 (0.3) (0.1) (0.1) (0.3) ($0.7) $3.8 FY2013 Total Budget $3.8 Transportation Overview of the Department The Transportation Department consists of six operating divisions, one customer service division and five support areas including: System Operations (CNOC), Host Railroads, Safety and Operating Rules Compliance, Service Delivery and Operations Management groups. Transportation is responsible for providing a safe, comfortable and on-time national rail passenger service as well as developing train schedules and dispatching of trains for Amtrak and five Commuter agencies. It has the responsibility for all operations, maintenance and staffing for Amtrak and non-Amtrak owned Stations. Crew Management and Scheduling (CNOC) create cost efficient crew couplets to support train operations. Transportation’s funding request is largely based on the number of train miles in the Amtrak timetable, train schedules and the equipment consist book. Salaries, labor and benefits comprise 65% of FY2013 Operating expenses; other major cost categories are train fuel, host railroad payments, connecting transportation services, utilities, and station/facilities costs. 76 of 95 Base Activity: Transportation’s FY2013 budget is $1,472.8M with $1,470.3M for continuing activity and $2.5M for new initiatives. A summary of changes versus FY2012 actual includes the following: Inflation of non-labor expenses - $11.4M Inflation wages & OT - $14.6M Provision for management merit increase - $2.2M Changes in employee benefits - $16.3M Loss of Caltrain commuter contract in FY2012 - ($38.4M) Non-recurring credit from performance payments settlement with CSX in FY2012 - $23.3M Increase in schedule adherence due to annual increase per contract and better OTP - $7.0M Increase in other railroad accounts - $4.3M Less estimated usage of fuel and utilities - ($5.8M) Increase in facility expense due to station rent and building maintenance services - $3.8M Higher professional fees due to extension of Safe-2-Safer contract - $2.2M Decrease in passenger inconvenience - ($1.6M) Decrease in indirect cost transfer to capital due to reduce capital portfolio - $1.9M Costs associated with Superstorm Sandy - $0.4M Other - $0.3M New Activity: New initiative in FY2013 Plan to add $2.5M for service extension from Richmond to Norfolk. Operating Expense Summary FY2011 - FY2013: Transportation FY2013 Incr/(Decr) vs FY2012 $ Millions Salaries Wages & Overtime Employee Benefits Expenses Employee Related Salaries, Wages and Benefits Train Operations Fuel, Power, & Utilities Materials Facility, Communication, & Office Advertising & Sales Casualty & Other Claims Professional Fees Expenses Data Processing Services Environmental & Safety M of W Services Passenger Inconvenience Financial PCard Transactions Other Expenses Related (Lag Accr) Indirect Costs Capitalized to P&E Total Operating Expenses FY2011 Actual FY2012 Actual FY2013 Budget $ % $67.6 554.8 288.0 8.8 919.2 165.6 215.6 25.0 55.3 0.1 13.1 10.1 0.4 1.5 3.3 11.6 0.3 0.0 0.0 (4.9) $1,416.4 $67.0 561.0 307.8 8.1 943.8 154.5 236.4 21.4 55.2 0.0 0.0 4.9 3.7 1.3 2.6 8.1 0.1 0.1 0.0 (3.4) $1,428.7 $65.4 560.9 317.5 6.1 949.9 191.4 236.3 19.6 57.6 0.1 0.0 9.5 0.8 1.2 1.3 6.6 0.1 0.0 0.0 (1.5) $1,472.8 ($1.6) (0.1) 9.8 (2.0) 6.1 36.8 (0.1) (1.8) 2.4 0.1 0.0 4.6 (2.9) (0.1) (1.3) (1.4) (0.0) (0.1) 0.0 1.9 $44.2 -2.4% 0.0% 3.2% -25.2% 0.6% 23.8% 0.0% -8.4% 4.4% 542.9% 111.7% 94.5% -79.2% -8.2% -49.9% -17.9% -13.3% -79.4% 0.0% 56.1% 3.1% 77 of 95 Summary of Changes FY2012 to FY2013 $ Millions $1,428.7 FY2012 Actual Changes to Base Activity Inflation of non-labor expenses including diesel fuel price Inflation wages & OT Provision for management merit increase Changes in employee benefits Loss of Caltrain Commuter contract in FY2012 Non-recurring credit from performance payments related settlement with CSX in FY2012 Increase in schedule adherence due to annual increase per contract and better OTP Increase in other host railroad accounts Less estimated usage in fuel and utilities Increase in facility expense due to station rent and building maintenance services Higher expected expense for professional fees due to extension of Safe2Safer contract Decrease in passenger inconvenience Decrease in indirect cost transfer to capital due to reduced capital portfolio Costs associated with Superstorm Sandy Other Base Activity Increase/(Decrease) from Prior Year Total FY2013 Base Activity New Activity Richmond to Norfolk service extension 11.4 14.6 2.2 16.3 (38.4) 23.3 7.0 4.3 (5.8) 3.8 2.2 (1.6) 1.9 0.4 0.3 $41.7 $1,470.3 2.5 $2.5 $1,472.8 Total FY2013 New Activity FY2013 Total Budget Capital Projects: Transportation $ in millions Program Title GCAP $0.0 6.5 1.3 5.5 $13.3 On-Board System/Business Application Improvement Station and Facility Improvements Transportation Foundation Program Total Transportation State & Local / Other $9.0 0.0 0.1 0.0 $9.1 Total $9.0 6.5 1.4 5.5 $22.4 On-Board $9.0M POS/EATEC Upgrade $9.0M - The new Point of Service technology will drive financial performance improvements by aligning business practices with hospitality industry best practices, improving accessibility and reliability of data, increasing employee productivity and job satisfaction, enhancing inventory controls, enabling pricing flexibility and product differentiation and increasing cost recovery based on sales data analysis. System/Business Application Improvement Program $6.5M Electronic Delay Reporting $1.5M - This project will allow conductors to enter delay data into a hand-held mobile device, which then sends the data directly to the On-Time Performance System in near real time. This application will automate time lost calculations, arrival and departure times will be populated from ARROW TS, and dynamic drop downs and required fields will ensure accurate data entry. This will 78 of 95 eliminate the need for paper-based forms and resulting user input errors, increase the reliability and timeliness of reporting data. LMS Enhancement-Hours of Service $0.5M - Hours of Service Phase 2 enhancements will provide tools that will facilitate an efficient way to use resources. Currently there are no mechanisms for LMS to calculate how much time an employee can work within their tour of duty. The implementation of this application will allow employees to fully utilize their tour of duty limits, thus allowing Amtrak to more fully utilize resources and will reduce mandatory rest times and reduce the risk of FRA HOS violations. LMS SAP-HR Enhancement Interface Upgrade $0.5M - This integration supports processes and replaces paperwork by synchronizing two applications between LMS and SAP-HR which will reduce data discrepancies. These discrepancies cause failures in payroll processing. By synchronizing the LMS-SAP HR applications, it will provide accurate headcount attendance, reporting capabilities, reduce tax implication of work location for personnel, and synchronize master data of LMS to SAP to provide accurate job symbol for SAP Position IDs. Integrated Labor Management System $4.0M - The objective of this project is to replace the existing aging Labor Management System with a new system integrated across the organization. The LMS system provides position assignment, crew scheduling, labor processing verification, earnings and hours tracking, training and certification functions for conductors, engineers and on-board services staff on Amtrak trains. Station and Facility Improvements $1.4M Los Angeles 1st Class Lounge Construction $0.5M - Amtrak leased space available to create a Los Angeles Metropolitan Lounge for the benefit of sleeping car and business class travel, and Amtrak’s guest rewards select plus members. This project will fund the construction of the Los Angeles First Class Lounge. The lounge will include individual seating for approximately 100 individuals to provide a relaxed, secure, and professional atmosphere for our business class customers and first class passengers while waiting for their train to depart. It will also include WiFi, work station availability to further attract regional business travelers, private rest rooms, coffee and beverage bar, baggage check-in and storage capability, widescreen monitors, exclusive pre-boarding and ticket check in, magazines newspaper racks, and concierge and personal train information services. Maryland Station Bathrooms and Signage $0.1M - This project will fund joint benefit capital projects with MTA. The scope includes: design and installation of static signage at BWI Station and restoration of restroom tiling at various stations. State of Good Repair Stations $0.5M - This project will fund a variety of state of good repair improvements for stations and crew facilities. Improvements will include public restroom renovations, roof and canopy replacements, roadway asphalt paving, ticket counter replacements, shelter and parking construction and lighting improvements. Support Equipment $0.3M – This project will enable the Transportation Department to replace a variety of support equipment in our stations and facilities. It will include items such as radios, tractors, people movers, baggage floats, self-service luggage carts, wheelchairs, and wheelchair lifts. By combining orders from several divisions, Transportation can take advantage of volume discounts to purchase more support equipment with less funding. Transportation Foundation Project $5.5M This project will build accurate and accountable data repositories that are fully integrated and enable consolidated views of important operational data. The project will be implemented in series of phases that are prioritized by Transportation stakeholders. The project will include: Variance Reporting, ARROW Migration, and Foundation Data. Corporate Common Overview of the Department The Corporate Common responsibility center is for accounting for transactions that are not directly attributable to a specific department, such as depreciation and accounting transactions that relate to the subsidiaries. The major types of expenses included in Corporate Common are: Employee benefits Claims Insurance including FELA Subsidiary Accounting transactions 79 of 95 Employee Benefits are expected to cost $734.4M in FY2013, although $62.9M of that total is for non-cash postretirement and pension benefits. The benefit costs are allocated to the functional departments. Claims Insurance is expected to be $49.5M, although the vast majority is a non-cash expense that does not impact current year operating funding. Base Activity: The FY2013 budget adjusted by non-cash expenses is ($80.8M) a decrease of ($33.2M) compared to FY2012 actual. This is primarily due to: Increase in employee benefits cash - $2.3M Increase in allocation of benefit expenses. Allocations include Post Employment Benefits - ($45.9M) Changes in casualty and other claims - $3.9M Decrease in material cost allocated to capital projects - ($3.6M) Costs associated with Superstorm Sandy – $4.6M Changes in materials due to repaired leased cars released to service in FY2012 - $7.2M Other – ($1.8M) Operating Expense Summary FY2011 – FY2013: Corporate Common FY2013 Incr/(Decr) vs FY2012 $ Millions Corporate Benefits - Cash Post Retirement Benefits - Non Cash Benefits Allocated to Departments Net Benefit Cost to Corp Common Total cost of Insurance Claims Amort of Gain On Sale/Leaseback Total Other - Change primarily due to increase in allocation of expenses to capital projects Total Operating Expenses Adjustment for Non-Cash Post Retirement Benefits Net Operating Expenses FY2011 Actual $587.0 65.9 (681.6) (28.7) 25.3 (4.1) 9.6 FY2012 Actual $663.5 63.5 (731.2) (4.1) 45.6 (4.1) (21.4) FY2013 Budget $665.9 102.1 (777.1) (9.1) 49.5 (3.8) (15.2) $ $2.3 38.6 (45.9) (5.0) 3.9 0.3 6.2 % 0.3% 60.7% -6.3% 100.0% 8.6% 6.3% 29.0% 2.1 65.9 ($63.8) 15.9 63.5 ($47.6) 21.3 102.1 ($80.8) 5.4 38.6 ($33.2) 33.9% 60.7% -69.7% Summary of Changes FY2012 to FY2013 $ Millions ($47.6) FY2012 Actual Changes to Base Activity Increase in employee benefits cash Allocation of employee benefits Changes in casualty and other claims Decrease in material cost allocated to capital projects Costs associated with Superstorm Sandy Changes in materials due to repaired leased cars released to service in FY12 Other Base Activity Increase/(Decrease) from Prior Year Total FY2013 Base Activity FY2013 Total Budget 80 of 95 2.3 (45.9) 3.9 (3.6) 4.6 7.2 (1.8) (33.2) (80.8) (80.8) Appendices Summary Income Statement by Major Account FY2013 Operating Budget $ millions FY2010 FY2011 FY2012 FY2013 Actual Actual Actual Budget FY2013 Fav/(Unfav) to FY2012 $ % REVENUES: Passenger Related: Ticket Revenue Food and Beverage State Supported Train Revenue Subotal Passenger Related Revenue $1,702.1 97.5 174.3 $1,851.5 109.4 191.1 $1,968.2 122.0 179.0 $2,099.1 123.0 195.4 $130.9 1.0 16.4 148.4 6.7% 0.8% 9.2% 1,973.9 2,152.0 2,269.2 2,417.6 Commuter Reimbursable Commercial Development Other Transportation Freight Access Fees and Other 152.5 100.7 74.8 135.6 47.0 169.5 87.9 76.2 138.9 51.2 140.4 121.4 93.9 147.2 72.1 109.9 135.8 80.0 138.0 60.0 (30.5) 14.4 (13.8) (9.2) (12.1) -21.7% 11.9% -14.8% -6.2% -16.7% Subtotal Other Revenue Total Operating Revenue Salaries, Wages and Benefits: 510.5 2,484.4 523.8 2,675.9 574.9 2,844.1 523.8 2,941.3 (51.2) 97.2 -8.9% 3.4% 239.1 941.8 482.2 26.1 258.3 1,008.4 543.4 33.5 267.2 1,033.3 608.5 29.4 267.4 1,068.8 610.7 29.1 (0.2) (35.5) (2.2) 0.3 -0.1% -3.4% -0.4% 0.9% 1,689.2 1,843.6 1,938.5 1,976.1 (37.6) -1.9% 262.4 299.7 184.2 178.0 113.7 177.1 253.6 337.9 193.6 170.8 112.9 209.6 245.2 355.3 184.8 166.5 78.5 237.2 283.7 375.5 188.3 169.5 98.4 264.8 (38.6) (20.2) (3.5) (3.0) (19.9) (27.6) -15.7% -5.7% -1.9% -1.8% -25.4% -11.6% 2,904.3 3,122.0 3,205.9 3,356.3 (150.4) -4.7% (53.2) 165.0 -14.7% 35.4% Salaries Wages & Overtime Employee Benefits Employee Related Salaries, Wages and Benefits Train Operations Fuel, Power, & Utilities Materials Facility, Communication, & Office Advertising and Sales Other Non-labor Fees and Services Total Expenses Operating Loss (Cash Basis) Federal Appropriation/PRIIA Authorized Over/(Under) Federal Support 1 (419.9) 563.0 ($143.1) 1 (446.1) 561.9 (361.8) 466.0 (415.0) 631.0 ($115.8) ($104.2) ($216.0) 6.5% This income statement represents the total federal support required for Amtrak operations. This income statement does not represent a Generally Accepted Accounting Principles (GAAP) financial statement. As compared to a GAAP financial statement, this income statement excludes costs for Amtrak's Office of the Inspector General (funded independently), non-capitalizable costs and certain contributions associated with capital projects (funded by capital appropriation), and net interest expense (funded by debt service appropriation), depreciation (non-cash expense), and accruals for estimated future post-retirement employee benefits (non-cash expense). 81 of 95 Summary Income Statement by Department and Major Account National Railroad Passenger Corporation (Amtrak) Summary Income Statement by Department & Major Accounts FY2013 Operating Budget Revenue $ millions REVENUES: Passenger Related: Ticket Revenue Food & Beverage State Supported Train Revenue Total Passenger Related Revenue Commuter Revenue Reimbursable Revenue Commercial Development Other Transportation Freight Access Fees & Other Total Other Revenue Total Operating Revenue $2,099.1 123.0 195.4 2,417.6 109.9 135.8 80.0 138.0 60.0 523.8 $2,941.3 EXPENSES: Salaries, Wages and Benefits: Salaries Wages & Overtime Employee Benefits Expenses Employee Related Salaries, Wages and Benefits Train Operations Fuel, Power, & Utilities Materials Facility, Communication, & Office Advertising & Sales Casualty & Other Claims Amort of Gain on Sale/Leaseback Professional Fees Data Processing Services and Supplies Environmental and Safety Maintenance of Way Services Passenger Inconvenience Financial Other Expenses Indirect Costs Capitalized to P&E Total Expenses Operating Loss (Cash Basis) 0.0 0.0 $2,941.3 82 of 95 Transportation Mechanical Engineering 0.0 0.0 0.0 0.0 0.0 0.0 0.0 0.0 0.0 0.0 $0.0 0.0 0.0 0.0 0.0 0.0 0.0 0.0 0.0 0.0 0.0 $0.0 0.0 0.0 0.0 0.0 0.0 0.0 0.0 0.0 0.0 0.0 $0.0 $65.4 560.9 317.5 6.1 949.9 191.4 236.3 19.6 57.6 0.1 0.0 0.0 9.5 0.8 1.2 1.3 6.6 0.1 0.0 (1.5) 1,472.8 ($1,472.8) $33.7 235.3 139.3 2.5 410.8 0.3 20.8 130.3 18.3 0.0 0.0 0.0 5.3 0.8 3.6 0.9 0.0 0.1 0.2 (30.5) 560.9 ($560.9) $31.0 170.6 102.9 6.4 310.9 0.2 7.4 26.9 22.4 0.0 0.0 0.0 8.4 2.4 2.2 33.7 0.0 0.1 0.6 (66.9) 348.4 ($348.4) National Railroad Passenger Corporation (Amtrak) Summary Income Statement by Department & Major Accounts FY2013 Operating Budget Chief Chief Customer Transportation Service Officer $ millions REVENUES: Passenger Related: Ticket Revenue Food & Beverage State Supported Train Revenue Total Passenger Related Revenue Commuter Revenue Reimbursable Revenue Commercial Development Other Transportation Freight Access Fees & Other Total Other Revenue Total Operating Revenue EXPENSES: Salaries, Wages and Benefits: Salaries Wages & Overtime Employee Benefits Expenses Employee Related Salaries, Wages and Benefits Train Operations Fuel, Power, & Utilities Materials Facility, Communication, & Office Advertising & Sales Casualty & Other Claims Amort of Gain on Sale/Leaseback Professional Fees Data Processing Services and Supplies Environmental and Safety Maintenance of Way Services Passenger Inconvenience Financial Other Expenses Indirect Costs Capitalized to P&E Total Expenses Operating Loss (Cash Basis) 83 of 95 Chief of Operations Research Chief Safety Officer 0.0 0.0 0.0 0.0 0.0 0.0 0.0 0.0 0.0 0.0 $0.0 0.0 0.0 0.0 0.0 0.0 0.0 0.0 0.0 0.0 0.0 $0.0 0.0 0.0 0.0 0.0 0.0 0.0 0.0 0.0 0.0 0.0 $0.0 0.0 0.0 0.0 0.0 0.0 0.0 0.0 0.0 0.0 0.0 $0.0 $4.0 0.1 3.2 0.2 7.4 91.7 0.1 0.0 2.3 0.0 0.0 0.0 0.0 0.3 0.0 0.5 0.6 0.1 0.0 0.0 103.1 ($103.1) $5.2 1.2 4.8 2.3 13.5 0.0 0.1 0.0 0.7 0.0 0.0 0.0 0.1 0.3 0.1 0.0 0.0 0.0 0.0 0.2 15.0 ($15.0) $0.4 0.0 0.3 0.0 0.7 0.0 0.0 0.0 0.0 0.0 0.0 0.0 0.0 0.0 0.0 0.0 0.0 0.0 0.0 0.0 0.7 ($0.7) $1.4 0.3 1.3 0.2 3.3 0.0 0.0 0.0 0.4 0.0 0.0 0.0 0.0 0.1 0.1 0.0 0.0 0.0 (0.0) 0.0 3.8 ($3.8) National Railroad Passenger Corporation (Amtrak) Summary Income Statement by Department & Major Accounts FY2013 Operating Budget Operations Staff $ millions REVENUES: Passenger Related: Ticket Revenue Food & Beverage State Supported Train Revenue Total Passenger Related Revenue Commuter Revenue Reimbursable Revenue Commercial Development Other Transportation Freight Access Fees & Other Total Other Revenue Total Operating Revenue EXPENSES: Salaries, Wages and Benefits: Salaries Wages & Overtime Employee Benefits Expenses Employee Related Salaries, Wages and Benefits Train Operations Fuel, Power, & Utilities Materials Facility, Communication, & Office Advertising & Sales Casualty & Other Claims Amort of Gain on Sale/Leaseback Professional Fees Data Processing Services and Supplies Environmental and Safety Maintenance of Way Services Passenger Inconvenience Financial Other Expenses Indirect Costs Capitalized to P&E Total Expenses Operating Loss (Cash Basis) 84 of 95 Total Operations Departments Finance Real Estate 0.0 0.0 0.0 0.0 0.0 0.0 0.0 0.0 0.0 0.0 $0.0 0.0 0.0 0.0 0.0 0.0 0.0 0.0 0.0 0.0 0.0 $0.0 0.0 0.0 0.0 0.0 (0.0) 0.0 0.0 0.0 0.0 0.0 $0.0 0.0 0.0 0.0 0.0 0.0 0.0 0.0 0.0 0.0 0.0 $0.0 $0.8 0.0 0.6 0.1 1.5 0.0 0.0 0.0 0.7 0.0 0.0 0.0 0.0 0.0 0.0 0.0 0.0 0.0 0.0 0.0 2.2 ($2.2) $141.8 968.4 569.8 17.8 1,697.9 283.6 264.7 176.8 102.4 0.1 0.0 0.0 23.3 4.7 7.2 36.4 7.2 0.4 0.8 (98.6) 2,506.9 ($2,506.9) $18.0 3.8 16.3 0.7 38.8 0.0 109.2 0.0 2.4 44.5 0.0 0.0 8.5 1.7 0.0 0.0 0.0 45.4 0.0 0.0 250.4 ($250.4) $3.1 0.1 2.5 0.2 5.9 0.0 0.2 0.0 3.2 0.0 0.0 0.0 2.1 0.0 0.0 0.0 0.0 0.3 0.0 0.0 11.8 ($11.8) National Railroad Passenger Corporation (Amtrak) Summary Income Statement by Department & Major Accounts FY2013 Operating Budget Procurement and Materials Management $ millions REVENUES: Passenger Related: Ticket Revenue Food & Beverage State Supported Train Revenue Total Passenger Related Revenue Commuter Revenue Reimbursable Revenue Commercial Development Other Transportation Freight Access Fees & Other Total Other Revenue Total Operating Revenue EXPENSES: Salaries, Wages and Benefits: Salaries Wages & Overtime Employee Benefits Expenses Employee Related Salaries, Wages and Benefits Train Operations Fuel, Power, & Utilities Materials Facility, Communication, & Office Advertising & Sales Casualty & Other Claims Amort of Gain on Sale/Leaseback Professional Fees Data Processing Services and Supplies Environmental and Safety Maintenance of Way Services Passenger Inconvenience Financial Other Expenses Indirect Costs Capitalized to P&E Total Expenses Operating Loss (Cash Basis) 85 of 95 Corporate Common Total Chief Amtrak Financial Police Officer Department 0.0 0.0 0.0 0.0 0.0 0.0 0.0 0.0 0.0 0.0 $0.0 0.0 0.0 0.0 0.0 0.0 0.0 0.0 0.0 0.1 0.1 $0.1 0.0 0.0 0.0 0.0 (0.0) 0.0 0.0 0.0 0.1 0.1 $0.1 0.0 0.0 0.0 0.0 0.0 0.0 0.0 0.0 0.0 0.0 $0.0 $11.8 17.9 18.8 0.6 49.1 0.0 0.3 0.4 4.9 0.0 0.0 0.0 1.8 0.5 0.1 0.4 0.0 0.0 0.0 0.0 57.5 ($57.5) $0.0 (12.4) (111.2) (0.0) (123.7) 0.0 0.6 10.8 7.9 0.0 49.5 (3.8) 1.8 0.0 (0.1) 0.0 0.1 1.8 4.6 (30.2) (80.8) $80.9 $32.9 9.4 (73.6) 1.4 (29.9) 0.0 110.3 11.2 18.5 44.5 49.5 (3.8) 14.2 2.1 (0.0) 0.4 0.1 47.4 4.7 (30.2) 239.0 ($238.8) $4.1 35.5 21.0 1.8 62.4 0.0 0.0 0.1 3.4 0.0 0.0 0.0 0.8 0.1 0.0 1.9 0.0 0.0 0.0 0.0 68.8 ($68.8) National Railroad Passenger Corporation (Amtrak) Summary Income Statement by Department & Major Accounts FY2013 Operating Budget CEO $ millions REVENUES: Passenger Related: Ticket Revenue Food & Beverage State Supported Train Revenue Total Passenger Related Revenue Commuter Revenue Reimbursable Revenue Commercial Development Other Transportation Freight Access Fees & Other Total Other Revenue Total Operating Revenue EXPENSES: Salaries, Wages and Benefits: Salaries Wages & Overtime Employee Benefits Expenses Employee Related Salaries, Wages and Benefits Train Operations Fuel, Power, & Utilities Materials Facility, Communication, & Office Advertising & Sales Casualty & Other Claims Amort of Gain on Sale/Leaseback Professional Fees Data Processing Services and Supplies Environmental and Safety Maintenance of Way Services Passenger Inconvenience Financial Other Expenses Indirect Costs Capitalized to P&E Total Expenses Operating Loss (Cash Basis) 86 of 95 Marketing & Sales Information Technology Human Capital Management 0.0 0.0 0.0 0.0 0.0 0.0 0.0 0.0 0.0 0.0 $0.0 0.0 0.0 0.0 0.0 0.0 0.0 0.0 0.0 0.0 0.0 $0.0 0.0 0.0 0.0 0.0 0.0 0.0 0.0 0.0 0.0 0.0 $0.0 0.0 0.0 0.0 0.0 0.0 0.0 0.0 0.0 0.0 0.0 $0.0 $0.9 0.0 0.7 0.0 1.6 0.0 0.0 0.0 0.2 0.0 0.0 0.0 0.2 0.0 0.0 0.0 0.0 0.0 0.0 0.0 1.9 ($1.9) $16.7 42.5 34.8 0.8 94.9 0.0 0.5 0.1 9.4 53.6 0.0 0.0 15.2 6.1 0.0 0.0 4.5 0.0 0.0 0.0 184.3 ($184.3) $25.6 0.3 19.7 1.1 46.7 0.0 0.0 0.0 36.5 0.0 0.0 0.0 16.2 109.7 0.0 0.0 0.0 0.0 0.2 0.0 209.3 ($209.3) $17.9 0.0 14.3 5.0 37.3 0.1 0.0 0.0 3.1 0.1 0.0 0.0 3.7 1.6 0.0 0.1 0.0 0.0 0.0 0.0 46.0 ($46.0) National Railroad Passenger Corporation (Amtrak) Summary Income Statement by Department & Major Accounts FY2013 Operating Budget NECIID $ millions REVENUES: Passenger Related: Ticket Revenue Food & Beverage State Supported Train Revenue Total Passenger Related Revenue Commuter Revenue Reimbursable Revenue Commercial Development Other Transportation Freight Access Fees & Other Total Other Revenue Total Operating Revenue EXPENSES: Salaries, Wages and Benefits: Salaries Wages & Overtime Employee Benefits Expenses Employee Related Salaries, Wages and Benefits Train Operations Fuel, Power, & Utilities Materials Facility, Communication, & Office Advertising & Sales Casualty & Other Claims Amort of Gain on Sale/Leaseback Professional Fees Data Processing Services and Supplies Environmental and Safety Maintenance of Way Services Passenger Inconvenience Financial Other Expenses Indirect Costs Capitalized to P&E Total Expenses Operating Loss (Cash Basis) 87 of 95 Office of General Counsel Gov't Affairs & Corporate Emergency Communications Management 0.0 0.0 0.0 0.0 0.0 0.0 0.0 0.0 0.0 0.0 $0.0 0.0 0.0 0.0 0.0 0.0 0.0 0.0 0.0 0.0 0.0 $0.0 0.0 0.0 0.0 0.0 0.0 0.0 0.0 0.0 0.0 0.0 $0.0 0.0 0.0 0.0 0.0 0.0 0.0 0.0 0.0 0.0 0.0 $0.0 $3.7 0.0 2.9 0.1 6.7 0.0 0.0 0.0 0.2 0.0 0.0 0.0 4.7 0.1 0.0 0.0 0.0 0.0 0.0 0.0 11.7 ($11.7) $14.4 0.0 11.5 0.5 26.4 0.0 0.0 0.0 2.0 0.0 5.9 0.0 23.7 0.0 1.9 (0.0) (0.0) 0.0 0.6 0.0 60.5 ($60.5) $5.1 0.0 4.1 0.3 9.5 0.0 0.0 0.0 0.4 0.1 0.0 0.0 1.2 0.1 0.0 0.0 0.0 0.0 0.0 0.0 11.5 ($11.5) $3.5 0.1 2.9 0.2 6.7 0.0 0.0 0.0 1.5 0.0 0.0 0.0 1.8 (0.0) 0.0 0.0 0.0 0.0 0.0 (0.0) 10.1 ($10.1) National Railroad Passenger Corporation (Amtrak) Summary Income Statement by Department & Major Accounts FY2013 Operating Budget Corporate Research & Strategy $ millions REVENUES: Passenger Related: Ticket Revenue Food & Beverage State Supported Train Revenue Total Passenger Related Revenue Commuter Revenue Reimbursable Revenue Commercial Development Other Transportation Freight Access Fees & Other Total Other Revenue Total Operating Revenue EXPENSES: Salaries, Wages and Benefits: Salaries Wages & Overtime Employee Benefits Expenses Employee Related Salaries, Wages and Benefits Train Operations Fuel, Power, & Utilities Materials Facility, Communication, & Office Advertising & Sales Casualty & Other Claims Amort of Gain on Sale/Leaseback Professional Fees Data Processing Services and Supplies Environmental and Safety Maintenance of Way Services Passenger Inconvenience Financial Other Expenses Indirect Costs Capitalized to P&E Total Expenses Operating Loss (Cash Basis) 88 of 95 Total Corporate Subsidiaries & Elimination Total Amtrak 0.0 0.0 0.0 0.0 0.0 0.0 0.0 0.0 0.0 0.0 $0.0 0.0 0.0 0.0 0.0 (0.0) 0.0 0.0 0.0 0.1 0.1 $0.1 2,099.1 123.0 195.4 2,417.6 109.9 135.8 80.0 138.0 59.9 523.6 $2,941.2 2,099.1 123.0 195.4 2,417.6 109.9 135.8 80.0 138.0 60.0 523.8 $2,941.3 $0.7 0.0 0.6 0.0 1.4 0.0 0.0 0.0 0.0 0.0 0.0 0.0 0.7 0.0 0.0 0.0 0.0 0.0 0.0 0.0 2.1 ($2.1) $125.6 88.0 38.9 11.3 263.7 0.1 110.9 11.4 75.2 98.3 55.4 (3.8) 82.5 119.8 1.9 2.5 4.5 47.5 5.5 (30.2) 845.2 ($845.1) $0.0 12.4 2.0 0.0 14.4 0.0 (0.0) 0.1 (8.1) 0.0 1.4 0.0 (0.0) (0.0) 0.0 0.0 0.0 (2.4) (1.2) 0.0 4.1 $2,937.1 $267.4 1,068.8 610.7 29.1 1,976.1 283.7 375.5 188.3 169.5 98.4 56.9 (3.8) 105.8 124.4 9.1 38.9 11.8 45.4 5.2 (128.9) 3,356.3 ($415.0) Revenue and Expenses by Department FY2013 Operating Budget Revenue Base Activity Passenger Revenue - No Specific Dept $2,897.0 New Activity $44.3 Expenses Total Activity Base Activity $2,941.3 $0.0 1,470.3 15.0 547.8 348.4 102.3 0.7 3.8 2.2 2,490.5 247.4 11.8 56.8 (80.8) 235.2 66.2 1.9 168.5 209.3 34.0 11.7 59.6 9.9 9.4 2.1 807.8 4.1 3,302.4 Transportation Chief Transportation Officer Mechanical Engineering Customer Service Chief of Operations Research Chief Safety Officer Operations Staff Total Operations Departments 0.0 0.0 0.0 0.0 0.0 0.0 0.0 0.0 0.0 0.0 0.0 0.0 Finance Real Estate Procurement and Materials Management Corporate Common Chief Financial Officer Police & Security Division CEO Marketing 7 Sales Information Technology Human Capital Management NECIID Office of General Counsel Government Affairs & Corporate Communications Emergency Management Corporate Research & Strategy Total Corporate Subsidiaries & Elimination Total Amtrak Excluding OIG 89 of 95 New Activity 2.5 0.0 13.1 0.0 0.8 0.0 0.0 0.0 16.4 3.0 0.0 0.7 0.0 3.8 2.7 0.0 15.8 0.0 12.0 0.0 1.0 1.5 0.7 0.0 37.5 0.0 53.9 Profit/(Loss) Total Activity 1,472.8 15.0 560.9 348.4 103.1 0.7 3.8 2.2 2,506.9 250.4 11.8 57.5 (80.8) 239.0 68.8 1.9 184.3 209.3 46.0 11.7 60.5 11.5 10.1 2.1 845 4.1 3,356.3 Base Activity $2,897.0 (1,470.3) (15.0) (547.8) (348.4) (102.3) (0.7) (3.8) (2.2) (2,490.5) (247.4) (11.8) (56.8) 80.8 (235.2) (66.2) (1.9) (168.5) (209.3) (34.0) (11.7) (59.6) (9.9) (9.4) (2.1) (807.8) (4.1) (3,302.4) New Activity $44.3 (2.5) 0.0 (13.1) 0.0 (0.8) 0.0 0.0 0.0 (16.4) (3.0) 0.0 (0.7) 0.0 (3.8) (2.7) 0.0 (15.8) 0.0 (12.0) 0.0 (1.0) (1.5) (0.7) 0.0 (37.5) 0.0 (53.9) Total Activity $2,941.3 (1,472.8) (15.0) (560.9) (348.4) (103.1) (0.7) (3.8) (2.2) (2,506.9) (250.4) (11.8) (57.5) 80.8 (239.0) (68.8) (1.9) (184.3) (209.3) (46.0) (11.7) (60.5) (11.5) (10.1) (2.1) (845.2) (4.1) (3,356.3) Summary Income Statement by Major Account and Activity FY2013 Operating Budget Base Activity $ millions New Activity FY2013 Budget REVENUES: Passenger Related: Ticket Revenue Food & Beverage State Supported Train Revenue Total Passenger Related Revenue Commuter Revenue Reimbursable Revenue Commercial Development Other Transportation Freight Access Fees & Other Total Other Revenue Total Operating Revenue $2,072.1 123.0 195.4 2,390.6 109.9 118.5 80.0 138.0 60.0 506.4 $2,897.0 $27.0 0.0 0.0 27.0 0.0 17.3 0.0 0.0 0.0 17.3 $44.3 $2,099.1 123.0 195.4 2,417.6 109.9 135.8 80.0 138.0 60.0 523.8 $2,941.3 EXPENSES: Salaries, Wages and Benefits: Salaries Wages & Overtime Employee Benefits Expenses Employee Related Salaries, Wages and Benefits Train Operations Fuel, Power, & Utilities Materials Facility, Communication, & Office Advertising & Sales Casualty & Other Claims Amort of Gain on Sale/Leaseback Professional Fees Data Processing Services and Supplies Environmental and Safety Maintenance of Way Services Passenger Inconvenience Financial Other Expenses Indirect Costs Capitalized to P&E Total Expenses Operating Loss (Cash Basis) 1 259.9 1,064.1 602.5 27.4 1,953.9 283.6 374.7 179.2 168.5 84.3 56.9 (3.8) 102.2 122.5 9.1 38.9 11.8 45.4 334.1 (128.9) $3,296.8 ($399.8) 7.5 4.8 8.2 1.7 22.2 0.2 0.9 9.1 1.0 14.1 0.0 0.0 3.6 1.9 0.0 0.0 0.0 0.0 6.5 0.0 $59.4 ($15.2) 267.4 1,068.8 610.7 29.1 1,976.1 283.7 375.5 188.3 169.5 98.4 56.9 (3.8) 105.8 124.4 9.1 38.9 11.8 45.4 340.6 (128.9) $3,356.3 ($415.0) 1 This income statement represents the total federal support required for Amtrak operations. This income statement does not represent a Generally Accepted Accounting Principles (GAAP) financial statement. As compared to a GAAP financial statement, this income statement excludes costs for Amtrak's Office of the Inspector General (funded independently), non-capitalizable costs and certain contributions associated with capital projects (funded by capital appropriation), and net interest expense (funded by debt service appropriation), depreciation (non-cash expense), and accruals for estimated future post-retirement employee benefits (non-cash expense). 90 of 95 Reconciliation of FY2013 Operating Budget to FY2012 Operating Budget $ Millions Revenue $2,844.1 FY2012 Base Budget Changes to Base Activity Impact of changes in demographics and the economy Impact of removing leap year day Inflation including ticket price, labor, diesel fuel and other Reduction in service disruptions due to completing construction and weather Impact of improved OTP on selected routes Impact of WiFi on short distance routes Impact of eTicketing Improved Acela WiFi Loss revenue associated with Superstorm Sandy Food and Beverage State supported revenue lower than expected in FY12 due to unsigned contracts Loss of Caltrain commuter contract offset by decrease in Commuter expenses Contractual increases in Commuter revenue One time perpetual easement of land at Hartford, CT in FY12 Decrease in base Reimbursable revenue Decrease in Salaries due to vacancies during first half of FY13 Decrease in Pension plan contribution per actuaries recommendation Non-recurring Credit from performance payments settlement with a freight railroad in FY12 Increase in schedule adherence due to annual increase per contract and better on time performance Decrease in hedge settlements due to changes in oil price Increase in credit card commissions due to higher revenue Increase in Casualty and Other Claims Decrease in overhead transfer credits due to reduced capital program in FY13 Other Base Activity Increase/(Decrease) from Prior Year Total FY2013 Base Activity Budget (Cash Basis) New Activity New Revenue Initiatives Richmond to Norfolk VA service extension Rebuild of 14 passenger coach cars for a third party Acela stronger advertising presence North East Regional - media and production support for pricing initiatives Promote events and tourism for Amtrak key cities Promote and participate in additional travel agent trade shows Replenishment and addition of new items to Amtrak's merchandise inventory Reimbursable feasibility studies Total New Revenue Initiatives Additional resources in product management to meet mandated CSI target Customer Update sales promotion brochures with current photographs and images Focus Additional market research studies Additional resources for contact center Subtotal Customer Focus Initiatives Police department expansion - add 50 officers Safety & Conversion of 5 police officers to special agents in Chicago Security Corporate ID cards not covered by grants Subtotal Safety & Security Initiatives Additional resources in food & beverage to support POS system Financial & Organizational Staffing and additional resources for Finance group Procurement support Michigan and Hudson lines Excellence Additional administrative resource for Police department Additional resource for Revenue Management HCM department expansion Implementation of Success Factor system suite Government Affairs staffing needs Social media contract transfer to Government Affairs Additional rent due to added space for new department Law Department reorganization Subtotal Organizational Excellence Initiatives Total FY13 New Activity FY2013 Final Budget (Cash Basis) 91 of 95 47.4 (4.9) 49.6 5.9 6.7 1.5 0.9 2.2 (28.2) 1.0 16.4 (39.8) 7.0 (17.4) (2.6) 7.1 $52.9 $2,897.0 2.2 17.0 17.0 6.0 0.8 0.9 0.2 0.3 44.3 Expenses $3,205.9 82.8 Net Income / (Loss) ($361.8) 47.4 (4.9) (33.1) 5.9 6.7 1.5 0.9 2.2 27.0 (38.4) (8.3) (14.0) 23.3 9.7 12.2 4.1 6.1 (5.8) (2.1) $96.5 $3,302.4 1.0 16.4 (1.3) (17.4) (2.6) 8.3 14.0 (23.3) (9.7) (6.1) 5.8 9.3 ($43.6) ($405.4) 0.0 $44.3 2.5 13.1 8.5 3.0 0.4 0.4 0.6 0.3 28.8 0.5 1.3 1.2 0.3 3.3 2.1 0.5 0.5 3.1 0.3 3.0 0.7 0.1 0.1 8.6 3.4 0.7 0.5 0.2 1.0 18.7 $53.9 (1.0) (18.5) ($9.6) $2,941.3 $3,356.3 ($415.0) 0.0 0.0 (0.3) 3.9 8.5 3.0 0.4 0.4 (0.4) 0.0 15.5 (0.5) (1.3) (1.2) (0.3) (3.3) (2.1) (0.5) (0.5) (3.1) (0.3) (3.0) (0.7) (0.1) (0.1) (8.6) (3.4) (0.7) (0.5) GAAP Basis Summary Income Statement $ Millions Revenues: Passenger Related: Ticket Revenue Food and Beverage State Supported Train Revenue Subtotal Passenger Related Revenue Commuter Reimbursable Commercial Development Other Transportation Freight Access Fees and Other Subtotal Other Revenue Total Operating Revenue Expenses: Salaries, Wages and Benefits: Salaries Wages & Overtime Employee Benefits Employee Related Subtotal Salaries, Wages and Benefits Train Operations Fuel, Power, & Utilities Materials Facility, Communication, & Office Advertising and Sales Other Non-labor Fees and Services Subtotal Non-Wage Expenses Total Expenses Operating Loss - Federal Operating Support Adjustments to GAAP P&L Post-Retirement Benefits (OPEB) Net Accrual Office of the Inspector General Expenses Depreciation Non-capitalizable Project Expenses Interest Expense, Net Federal & State Capital Payments (Revenue) Total GAAP Exclusions from Operating Loss GAAP Net Operating Loss FY2011 Actual FY2012 Actual FY2013 Budget FY2013 Fav/(Unfav) to FY2012 $ % $1,851.5 109.4 191.1 2,152.0 169.5 87.9 76.2 138.9 51.2 523.8 2,675.9 $1,968.2 122.0 179.0 2,269.2 140.4 121.4 93.9 147.2 72.1 574.9 2,844.1 $2,099.1 123.0 195.4 2,417.6 109.9 135.8 80.0 138.0 60.0 523.8 2,941.3 $130.9 1.0 16.4 148.4 (30.5) 14.4 (13.8) (9.2) (12.1) (51.2) 97.2 6.7% 0.8% 9.2% 6.5% -21.7% 11.9% -14.8% -6.2% -16.7% -8.9% 3.4% 258.3 1,008.4 543.4 33.5 1,843.6 253.6 337.9 193.6 170.8 112.9 209.6 1,278.3 3,122.0 ($446.1) 267.2 1,033.3 608.5 29.4 1,938.5 245.2 355.3 184.8 166.5 78.5 237.2 1,267.4 3,205.9 ($361.8) 267.4 1,068.8 610.7 29.1 1,976.1 283.7 375.5 188.3 169.5 98.4 264.8 1,380.2 3,356.3 ($415.0) (0.2) (35.5) (2.2) 0.3 (37.6) (38.6) (20.2) (3.5) (3.0) (19.9) (27.6) (112.8) (150.4) ($53.2) -0.1% -3.4% -0.4% 0.9% -1.9% -15.7% -5.7% -1.9% -1.8% -25.4% -11.6% -8.9% -4.7% -14.7% 65.9 25.8 602.7 138.4 93.3 (30.9) $895.1 ($1,341.2) 63.5 22.8 667.8 75.7 80.4 (32.7) $877.6 ($1,239.4) 102.1 22.5 685.9 37.2 54.2 (35.6) $866.4 ($1,281.4) (38.6) 0.3 (18.1) 38.5 26.2 2.8 11.2 ($64.4) -60.7% 1.2% -2.7% 50.9% 32.6% 8.6% 1.3% 5.2% 92 of 95 Monthly Average and End of Year Headcount by Department FY2013 Operating Budget Mgmt Transportation 565 Mechanical 386 Engineering 404 Customer Service 38 Operation Research Planning Safety 19 Operations Staff 3 Total Operations Departments 1,464 Finance 182 Real Estate 28 Procurement and Materials Management 147 Corporate Common Chief Financial Officer 357 Police & Security Division 34 CEO 5 Marketing 189 IT 250 HR 181 NEC IID 25 General Counsel 146 Government Affairs 47 Emergency Management 28 Corporate Research & Strategy 5 Total Corporate 1,267 Total Amtrak w/o OIG 2,731 Inspector General 94 Total Amtrak 2,825 FY2012 End of Year Headcount Exempt Total ARASA Total Non-Exempt Interns Headcount 202 767 7,718 3 8,488 387 773 3,736 2 4,511 199 603 2,965 15 3,583 3 41 1 42 1 20 5 25 3 3 794 2,258 14,437 20 16,715 182 77 2 261 28 2 30 24 171 313 484 24 381 392 2 775 34 442 2 478 5 5 189 922 1,111 250 4 1 255 181 1 182 25 25 1 147 147 47 1 48 28 3 31 5 5 25 1,292 1,764 6 3,062 819 3,550 16,201 26 19,777 94 94 819 3,644 16,201 26 19,871 93 of 95 Mgmt 576 374 436 41 3 19 2 1,519 192 30 152 374 35 5 199 264 228 38 158 58 33 5 1,397 2,916 93 3,009 FY2013 End of Year Headcount Budget Exempt Total ARASA Total Non-Exempt Interns Headcount 182 759 7,798 8,556 374 4,286 4,660 436 3,271 3,707 41 5 46 3 3 1 20 5 25 2 2 183 1,702 15,365 17,067 192 82 274 30 2 32 152 343 495 374 427 801 35 524 559 5 5 199 1,007 1,206 264 4 268 228 1 229 38 38 1 159 159 58 58 33 3 36 5 5 1 1,398 1,966 3,364 184 3,100 17,331 20,431 93 93 184 3,193 17,331 20,524 Summary Metrics FY2011- FY2013 FY2013 Budget KPIs RASM - Revenue per Seat Mile (a) CASM - Expenses per Seat Mile (b) (NTS) Cost Recovery Ratio (c) Ridership (000's) Passenger Miles per total core employee (000's) (d) On-Time Performance (Endpoint) Customer Satisfaction Index Host Railroad Performance (e) $0.191 $0.217 87.9% 31,853 33 85.0% 85 900 Other Indicators Seat Miles (000's) Passenger Miles (000's) Train Miles (000's) Average Load Factor Core diesel gallons per train mile (f) Seat Miles per total core employee (000's) (g) Customer Injuries Equipment - % of Units in Service: Locomotive Fleet Passenger Fleet Unadjusted Ticket Revenue ($000's) Average Ticket Yield Average Ticket Price Core Revenue per Train Mile (h) Core Expenses per Train Mile (i) Adjusted Operating Ratio (j) Average cost per gallon of diesel (k) 12,789,009 6,916,447 37,409 54.1% 2.4 61 n/a 85.3% 89.0% $2,149,090 $0.3107 $67.47 $71.30 $82.87 1.14 $3.21 Notes: (a) This is calculated as NTS Total Revenue divided by Available Seat M iles to be consistent with the KPI's. (b) This is calculated as NTS Total Expense less Depreciation and non-cash OPEB's divided by Available Seat M iles. (c) This is calculated as RASM divided by CASM . (d) Average monthly Passenger M iles divided by year-end headcount. (e) Average monthly minutes of delay per ten thousand Train M iles. (f) This is calculated as Total Diesel Gallons excluding those used for commuter services. (g) Average monthly Seat M iles divided by year-end headcount. (h) This is calculated as Total Core Revenue divided by Total Train M iles. (i) This is calculated as Total Core Expense less Depreciation and non-cash OPEB's divided by Total Train M iles. (j) This YTD measure is calculated as Total Operating Expenses (excluding Depreciation, OIG, OPEB's and PRJ) by Total Operating Revenue (excluding state capital payments). (k) This excludes net Fuel Hedge. 94 of 95 Route Level Metrics Budgeted FY2013 Data (1) Dollars in M illions except Contr./(Loss) per Rider statistics Allocation of Federally Funded RT01 RT05 RT99 RT03 RT04 RT07 RT09 RT12 RT14 RT15 RT20 RT21 RT22 RT23 RT24 RT29 RT35 RT36 RT37 RT39 RT40 RT41 RT46 RT47 RT50 RT54 RT56 RT57 RT65 RT66 RT67 RT96 RT16 RT18 RT19 RT25 RT26 RT27 RT28 RT30 RT32 RT33 RT34 RT45 RT48 RT52 RT63 Acela Regional NEC Special Trains NEC Spine Ethan Allen Express Vermonter Maple Leaf The Downeaster New Haven - Springfield Keystone Service Empire Service Chicago-St.Louis Hiawathas Wolverines Illini Illinois Zephyr Heartland Flyer Pacific Surfliner Cascades Capitols San Joaquins Adirondack Blue Water Washington-Lynchburg Washington-Newport News Washington - Norfolk Hoosier State Kansas City-St.Louis Pennsylvanian Pere Marquette Carolinian Piedmont Non NEC Special Trains State Supported Routes Silver Star Cardinal Silver Meteor Empire Builder Capitol Limited California Zephyr Southwest Chief City of New Orleans Texas Eagle Sunset Limited Coast Starlight Lake Shore Limited Palmetto Crescent Auto Train Long Distance Routes Ridership 3,421,814 8,115,337 11,265 11,548,416 55,900 88,262 419,288 565,153 400,477 1,476,484 1,069,229 686,942 815,941 528,060 345,567 232,643 84,313 2,715,266 815,250 1,709,450 1,210,442 134,756 186,143 184,175 579,089 125,442 37,335 198,661 219,462 107,738 319,503 173,219 30,333 15,514,523 415,316 114,135 379,544 538,577 228,100 391,545 358,681 257,763 339,273 103,105 480,884 401,175 214,422 298,082 269,082 4,789,684 Revenue $549.2 596.9 7.4 $1,153.5 5.0 8.4 27.3 14.5 13.0 48.4 46.2 28.8 25.2 21.0 17.9 16.1 5.5 89.7 62.0 61.2 74.7 11.0 12.4 12.4 30.9 9.4 0.9 14.4 10.9 6.1 23.8 6.9 3.4 $707.4 39.2 8.8 44.1 74.1 24.3 56.6 50.8 23.4 30.7 14.1 48.9 37.0 20.1 35.4 76.7 $584.4 National Train Service 31,852,623 $2,445.2 Non-Allocated Capital Expense Capital Projects (2) $296.5 $137.8 450.2 194.9 2.5 2.3 $749.3 $335.0 6.0 0.6 11.1 3.5 31.2 6.1 15.2 2.5 23.6 1.8 47.5 11.7 71.4 10.3 37.4 4.2 25.6 2.7 38.6 4.2 20.7 2.8 17.9 2.2 8.5 1.2 110.4 10.6 69.0 6.7 71.5 4.3 87.5 5.6 13.7 1.5 14.8 1.4 8.6 1.2 33.0 4.2 8.1 1.4 7.4 0.6 16.2 2.0 15.8 6.5 7.0 1.2 21.7 4.8 8.1 0.9 2.4 0.5 $849.8 $107.1 85.8 16.6 25.7 4.1 83.6 17.0 128.2 24.8 47.0 9.3 122.9 24.0 114.5 21.6 44.7 9.2 60.2 12.4 55.0 9.4 101.9 14.8 73.1 12.4 32.6 9.6 80.8 11.1 125.2 9.9 $1,181.1 $206.1 $2,780.3 (4) Avg. PM per Avg. SM per Contr./(Loss) Core employee Core employee per Rider (000's) (3) (000's) (3) $73.84 29 46 $18.07 37 74 $431.61 12 44 $35.00 34 63 (17.49) 23 53 (30.73) 30 66 (9.22) 53 95 (1.26) 41 133 (26.39) 20 39 0.62 35 82 (23.54) 24 70 (12.59) 43 89 (0.54) 34 91 (33.25) 37 69 (8.33) 40 94 (7.55) 29 69 (35.36) 23 53 (7.64) 28 85 (8.59) 24 48 (6.04) 20 71 (10.59) 26 62 (19.90) 40 48 (12.80) 34 77 20.62 65 97 (3.53) 48 75 9.94 42 89 (174.45) 10 22 (8.98) 31 61 (22.25) 42 66 (8.54) 31 52 6.51 58 71 (6.48) 31 58 31.09 53 43 ($9.18) 32 72 (112.23) 32 51 (147.33) 24 42 (104.06) 36 56 (100.37) 41 60 (99.66) 32 47 (169.13) 34 54 (177.61) 36 56 (82.87) 36 50 (87.01) 42 55 (396.31) 21 40 (110.21) 31 46 (89.96) 37 57 (58.51) 37 68 (152.10) 25 48 (179.93) 24 34 ($124.59) 33 51 $648.2 ($10.52) 33 $55.1 Total Capital $703.3 (1) Budget route results are projected based on APT historical ratios. Expenses exclude net Depreciation, OPEB's, PRJ and Interest. (2) T his represents the allocation of Federally Funded Capital Projects to Routes. (3) Employee data is not aggregated by route in Amtrak's Financial Systems. T he data presented here is based on an allocation of Core employees based on total costs of each route. PM equals Passenger Miles and SM equals Seat Miles. (4) Non-Allocated Capital category includes lease buyouts, environmental remediation and commercial projects related to stations. 95 of 95 61

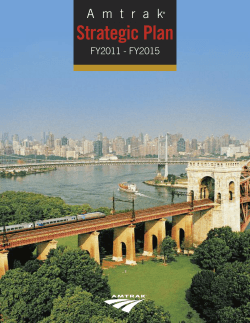


© Copyright 2026