
Business Plan & Budgets Fiscal Year 2011
 Business Plan & Budgets
Fiscal Year 2011
Business Plan & Budgets FY2011
Table of Contents
Transmittal Letter from President and CEO
Section I: Budget Summary
Board Committee Presentation ........................................................................... 1-34
Section II: Scorecards .................................................................. 35-49
Section III: Authority Level Operating Budgets
FY2011 Budgets: Authority Level
Increases & Decreases ....................................................................................50
By Cost Category .............................................................................................53
Variance Summary ....................................................................................54
Budget Elements to Note
Fuel ............................................................................................................56
Power Contract ..........................................................................................58
Labor Agreement .......................................................................................59
Purchased Transportation..........................................................................60
Fare Policy .................................................................................................62
Capitalization .............................................................................................63
Budget Methodology .........................................................................................64
Service Plan ....................................................................................................67
Key Performance Indicators .............................................................................87
Projected Ridership ..........................................................................................90
Organizational Charts .......................................................................................94
Manpower Summary ......................................................................................107
Section IV: Financial Proforma
Projected Cash Flow ......................................................................................109
Debt Service Summary ...................................................................................111
Sales Tax Projection .......................................................................................112
Sources and Uses of Funds (GAAP) ..............................................................113
Balance Sheet (GAAP) ...................................................................................114
Section V: General Mobility and Capital Budgets
Capital Budget FY2011 ..................................................................................115
Project Listings with Funding Sources .....................................................116
General Mobility Budget FY2011 ....................................................................121
Capitalized Operating Expenses ....................................................................122
Business Plan & Budgets FY2011
Section VI: Appendix
This section lists 14 new initiatives that have been reviewed and selected as part of
the FY2011 Business Plan. Funding for these initiatives is included in the Operating
and Capital Budgets for FY2011.
Service Design & Development
Fare Recovery Research Project – Ticket Surcharge at Reliant Park ............124
Explore Underutilized Park & Ride Lots ..........................................................125
Alternative Service Delivery – Poor Performing Routes .................................126
Bike and Ride .................................................................................................130
Service Delivery
METRORail APTA Standard Hours of Service ...............................................131
Customer Service ...........................................................................................132
Rebuilding Employee Morale ..........................................................................133
RideStore Customer Service ..........................................................................134
Bikes on Trains ...............................................................................................135
Capital Programs
Realignment / Rightsizing of Project Staff and Services .................................136
METRO Police
Crime Mapping ...............................................................................................137
Distribution of Police Reports Online ..............................................................138
Grant Funding for 9 Police Officer Positions for Three Years .........................139
Business Services
Sustainability and Energy Management Program ..........................................140
1
Finance Committee Presentation
Monday – September 13, 2010
9:00am
2
•
•
•
•
•
•
•
0 St
ateg c Priorities
o t es
FY2011
Strategic
FY 2011 Operating Principles
Revised Organization Structure
FY2010 Commentary
FY2011 B
Budget
d t Fi
Financial
i l St
Strategies
t i O
Overview
i
FY2011 Budget Assumptions and Decisions
FY2011 Operating and Capital Initiatives
3
Old METRO
New Strategic
Priorities
N
New
Operating
Principles
N
New
Organization
Structure
4
New Financial
Strategies
N
New
Leadership
Practices
NEW
METRO
Customer
Service
What the NEW METRO
Does
Where the NEW
g
METRO’s Going
•Delivers safe,
•Toward an
reliable, affordable
and convenient
public transit and
mobility services
to the Greater
Houston region
economically dynamic,
environmentally
sustainable regional
community whose
quality of life is made
better every day by
METRO’s services
People
Trusted
Community
Partner
Partnering
Great Transit
Infrastructure
Safety
Sustainability
5
Cost Control
First-Class
Customer
Service
Asset
Utilization
6
FY2010 BUDGETED VS. ACTUAL INCOME (as of Sept. 13)
Budgeted
Beginning Fund Balance
Actual
$152,390,000
$135,452,000
$67,941,000
$63,391,000
$
$481,721,000
$
$487,060,000
Interest and other
$2,315,000
$25,286,000
Commercial Paper
$39,913,000
$47,000,000
Grants
$297,027,000
$141,086,000
Debt Funding
$ 344,433,000
$216,315,000
$1 385 740 000
$1,385,740,000
$1 115 590 000
$1,115,590,000
Fares
Sales Tax
TOTAL INCOME
FY2010 BUDGETED VS. ACTUAL EXPENDITURES
General Mobility
$151,694,000
$153,779,000
Operating Expenses
$383,812,000
$383,812,000
Capital Programs
$683 238 000
$683,238,000
$466 917 000
$466,917,000
Debt Service
$99,000,000
$28,961,000
Ending Fund Balance
$67,996,000
$82,121,000
$ 1,385,740,000
$1,115,590,000
TOTAL EXPENDITURES
7
8
• Don’t raise fares
• Stay committed to transit services
• Focus on improved customer service
G
Great
t Transit
T
it Infrastructure
I f
t
t
• Don’t get ahead of ourselves on rail
• Pursue critical non-rail infrastructure opportunities
T
Trusted
t d Community
C
it Partner
P t
• Be candid and complete in reporting NEW METRO finances
• Look for opportunities to leverage NEW METRO dollars through
partnered mobility projects
9
10
• Maintain
M i t i commitment
it
t to
t Transit
T
it Services
S i
• Keep focus on improved customer service
• Introduce innovative service delivery concepts to
meet market needs in a more cost effective
manner
• Recognize that much of customer service
improvement can require minimal dollars
11
• Look for opportunities through partnerships to
leverage NEW METRO dollars
• Aggressively increase community outreach and
relationship rebuilding
• Establish Customer Advisory Council
12
• Keep tight control on expenditures
• Manage budget on Rolling Quarters basis
• Systematically eliminate expenditures of marginal
value
l
y
costs when making
g acquisitions
q
• Consider life-cycle
• Use Process Improvement to eliminate Non-Value
Added activities or practices
13
• Use existing assets to maximum efficiency
• Maintain assets in state of good repair
• Continue good maintenance practices
14
• Avoid short-term financial fixes that cut into the
NEW METRO’s muscle
• Keep the NEW METRO human infrastructure
intact
• Look for opportunities to act responsibly
environmentally and benefit financially
15
` Always keep safety first
` Do nothing in financial management that
jeopardizes the safety of customers, employees
or the general public
16
METRO s human capital
• Maintain NEW METRO’s
• Focus on development of leadership and worker
skills
kill through
th
h programs with
ith minimal
i i l financial
fi
i l
impact
• Emphasize shared responsibility and shared
sacrifice
• Look for commitment to and support of what
NEW METRO does and where we are going
17
18
PRE-SEPTEMBER 8TH ANTICIPATED FY2011 BUDGET
Income
Beginning fund balance
$75,924,000
Fares
$ 62,600,000
Sales Tax
$499,207,00
Interest
$ 524,000
Commercial Paper
$21,181,000
Grants
$ 340,536,000
Debt funding
$338 367 000
$338,367,000
TOTAL INCOME
$ 1,338,339,000
General Mobility
$186,341,000
Operating Expenses
$408,715,000
Capital Programs
$625,761,000
Debt Service
$52,719,000
Ending Fund Balance
$64,803,000
TOTAL EXPENDITURES
19
$1
1,338,339,000
338 339 000
Even before September 8th, the NEW
METRO faced significant financial
i
issues,
including…
i l di
20
PRE-SEPTEMBER 8TH ANTICIPATED FY2011 BUDGET
Income
Beginning fund balance
$75,924,000
Fares
$ 62,600,000
Sales Tax
$499,207,000
Interest and Other
$ 524,000
p
Commercial Paper
$21,181,000
$
,
,
Grants
$ 340,536,000
Debt funding
$338,367,000
TOTAL INCOME
$1
1,338,339,000
338 339 000
Expenditures
General Mobility
$ 186,341,000
Operating Expenses
$ 408,715,000
Capital Programs
$ 625,761,000
Debt Service
$ 52,719,000
Ending Fund Balance
$ 64,803,000
TOTAL EXPENDITURES
21
$ 1,338,339,000
THE GENERAL MOBILITY ISSUE
In recent years…
•The Old METRO effectively operated at a deficit…
•Using the quarter cent for other things than General
Mobility…
y
•And making General Mobility payments by borrowing in
th C
the
Commercial
i lP
Paper market…
k t
•Creating a current Commercial Paper liability of
$167,000,000
22
IN ADDITION
NEW METRO is changing its policy regarding
capitalization of operating expenses…
•Fewer operating expenses will be capitalized…
•Giving the impression operating expenses are going
up…
•When in fact we are providing a more accurate picture of
what it costs to operate our business…
•And making it easier to hold the organization
accountable for efficient operation
23
24
• Must re-procure rail cars
p
, FFGA p
process will
• When NEW METRO re-procures,
resume
$150 million in FY2010 Federal
• NEW METRO’s $
Budget stays put
$150 million in FY2011 Federal
• NEW METRO’s $
Budget stays put
• $50 million will be available for Design / Engineering
• Letters of No Prejudice (LONPs) will become
available
• Recovery (Stimulus) funds of up to $64 million
remain available
25
• Use pragmatic conservative scenario
• Act quickly but think long term
• Keep Transit Services paramount
• Commit to clearer reporting of operating costs
• Be conservative on federal funds expectations
• Pace METRORail Expansion to funds availability
26
•
•
•
•
•
•
•
No
Increase
N Fare
F
I
Maintain commitment to Transit Services
Shape METRORail Expansion pace to funds
Switch to cash-based GMP
Adopt better capitalization policy
Maintain organizational capacity and resilience
Stick with Strategic
g Priorities and Operating
p
g
Principles
27
FY2011 PROPOSED BUDGET
Before September 8th
After September 8th
Income
Beginning fund balance
$75,924,000
$84,121,000
F
Fares
$ 62
62,600,000
600 000
$62 600 000
$62,600,000
$ 499,207,000
$499,207,000
Interest and Other
$ 524,000
$524,000
Commercial Paper
$21,181,000
$0
Grants
$ 340,536,000
$ 147,586,000
Debt funding
g
$338,367,000
$
,
,
$161,187,000
$
,
,
$1,338,339,000
$955,225,000
General Mobility
$186,341,000
$186,341,000
Operating Expenses
$408,715,000
$408,715,000
Capital Programs
$625,761,000
$247,647,000
Debt Service
$52,719,000
$47,719,000
Ending
g Fund Balance
$64,803,000
$64,803,000
$1,338,339,000
$955,225,000
Sales Tax
TOTAL INCOME
E
Expenditures
dit
TOTAL EXPENDITURES
28
Before September 8th
After September 8th
Income
$ 1,338,339,000
$955,225,000
Expenditures
$ 1,338,339,000
$ 955,225,000
FY2010 Budget vs. FY2011 Budget
-$430,000,000
-31.2%
29
▲ FTA awards FFGA
▲ Recovery Act Funds remain available
▲ FTA releases
l
more off FY2010 appropriated
i d ffunds
d
▲ Additional Recovery Act Funds become available
▼ Economy weakens
▼ Sales Tax revenue falls
▼ Ridership declines materially
▼ FTA significantly delays FFGA
30
• Repaying Commercial Paper used for GMP
• Executing successfully against the Strategic
Priorities, Operating Principles and Budget
• Staying the course for 24 to 30 months
31
The Go Forward Strategy
September 2010
Adopt FY2011 Budget
January 2011
Quarterly Review and Revision
April 2011
Quarterly Review and Revision
July 2011
•Quarterly Review and Revision
•FY2012 Look-Ahead
and be prepared to bring budget changes to the
…and
Board apart from quarterly reviews if events warrant
32
“While violations of these [Federal rules and
requirements regarding procurement] could
nullify the ability of the FTA to participate in
any projects tainted by such violations, in
the case of Houston METRO, the
Administration believes that the
commuters of Houston should not be
denied needed transit improvements due
to the actions of prior METRO
management.”
33
Executive Management Team
OMB Group
Brian Rogers
Tony Hawley
34
Business Plan & Budgets FY2011
Scorecards
Section II: Scorecards
Service Design & Development ............................................................................. 36
Service Delivery .................................................................................................... 37
Capital Programs
METRORail Expansion................................................................................... 38
METRO Police ...................................................................................................... 41
Performance Improvement .................................................................................... 42
Business Services
Human Resources & Diversity ........................................................................ 43
Information Technology .................................................................................. 44
Procurement ................................................................................................... 45
Safety .................................................................................................................... 46
Law ...................................................................................................................... 47
Finance ................................................................................................................. 48
Audit ...................................................................................................................... 49
Page 35
Business Plan & Budgets FY2011
Scorecards
Service Design & Development
Asset
Sustainability
Safety
Cost Control
Customer Service
Utilization
Principles
Balanced Scorecard - Service Design &
Development Initiatives
Underutilized Park & Ride Lots
NOTE: Business Plan Initiative
Advance University Line Corridor and 90A/Southwest
Rail Corridor through Federal Projects Development
Process
Alternative Service Delivery - FY2011 Transit Service
Plan
NOTE: Business Plan Initiative
This initiative is proposed to improve Customer Service; introduce new and
innovative concepts for providing sustainable service delivery; and maximize
utilization of fiscal, capital and human assets.
Community School Safety Education Program
(CSSEP)
METRO has developed a Community School Safety Education Program
(CSSEP) to help increase safety awareness for students at schools closest to
rail construction zones. This program is designed to integrate ageappropriate material and interactive lessons about train awareness,
construction and rail safety into academic subject areas, such as science,
language arts, social studies, health, music and movement.
This initiative is proposing a fare recovery research project, to develop a
methodology for implementing a “transit surcharge” on admission tickets to
major events held at Reliant Stadium, including the Houston Livestock Show
& Rodeo (HLSR) and the Houston Texans football games, to ensure full
revenue recovery.
In an effort to balance long-term Authority costs with ongoing project needs,
METRO will continue its long-standing and cost-effective practice of retaining
consultants to provide specialty skills needed for project development.
A transit service plan establishes the Authority's strategy for improving
system-wide services. The goal is to focus on service that is safe, reliable,
timely, affordable, and convenient, with a personal touch in delivering
services to customers.
This initiative expands the availability of commuter bus services to the Gulf
Corridor, Brazoria, Missouri City and Kingsland.
The long-range plan is a 25-year plan that sets context for future projects. HGAC is in the process of developing a Year 2040 update to the Regional
Transportation Plan. This will be an important opportunity for METRO to work
in a collaborative fashion, with maximum opportunities for public input, while
developing METRO's component of its Regional Transit Plan update.
A Downtown Intermodal Terminal should be thoughtfully evaluated for nearterm decisions that could strategically enhance the region’s multimodal transit
services. An intermodal terminal would provide improved regional access to
this major activity center and would expand important regional transit
connectivity. The development and operation of this intermodal center must
preserve and enhance, if possible, the existing freight rail system capacity.
Note - This is part of the Stakeholder Affairs Function, w hich reports on a
matrix basis to Capital Programs.
Fare Recovery Research Project on Surcharge at
Reliant Park
NOTE: Business Plan Initiative
Use of Consultant Services
FY2011 Transit Service Plan
Park & Ride Services
Partnering
Regional Long-Range Transit Plan Update
Advance Downtown Intermodal Terminal
Note - Subject to CIP Funding av ailability .
Staff Training & Development
People
Definition
METRO currently has approximately 34,000 parking spaces available for Park
& Ride (P&R) service. On an average day, METRO has just over 16,000
unused parking spaces, with 12 of METRO’s 29 P&R lots less than 30%
occupied. This initiative will examine methods to increase utilization of the
P&R lots by providing value and benefits to patrons.
Since the Record of Decision granting environmental clearance has been
obtained for the University LRT project, efforts will be advanced to Final
Design. The 90A/Southwest Corridor rail project will advance through the
DEIS phase.
Utilize Employees and Stakeholders to Support
METRO Programs
Ensure that employees have the knowledge and training to do their jobs.
Make available opportunities and resources to provide for staff development
through seminars, conferences and in-house workshops. Encourage the
professional status of staff by promoting the attainment of professional
licensing and certification.
Expand a progressive, two-way dialogue with community leadership to reach
common customers/members. Recruit and maintain (1) an active team of
employee volunteers, and (2) a group of high-level speakers, respectively,
to interface with the community. This initiative includes the METRO
Speaker's Bureau, METRO Citizen's Academy, and the METRO Ambassador
Program.
Page 36
Business Plan & Budgets FY2011
Scorecards
Service Delivery
C ost
C ontrol
S afety
S ustainability
A sset
U tilization
Principles
Balanced Scorecard -Service Delivery Initiatives
Fleet Management
Definition
Purchase 100 new buses; manage H-GAC commitments; retire fleets as
needed; monitor spare ratios; and pursue bus & rail refurbishment programs.
Alternative Service Initiative
Pursue new ways to run the service.
Revenue Opportunities
Pursue advertising on buses.
Energy
Decrease usage/consumption of energy.
Social Responsibility
Indentify an area of social impact outside of METRO.
Accidents
No more than 528 for bus and no more than 39 for rail.
Improve safety culture
Implement mandatory safety meetings in each operational division; reduce
employee accidents; make safety a more integral part of management
decisions
Meet overall budget objectives on schedule and within budget.
Budget
Cost Reductions
P eople
P artnering
C ustom er S ervice
Customer Care
Service reliability (On-Time)
Continue with the alternative parts program; manage the business philosophy;
review what METRO does and why.
Complaints of 17,000 or less; Customer Information Center hold time of 1
minute or less; continue to evaluate Operator behaviors; monitor the
customer philosophy in all divisions and departments.
Weighted Average 69% for Bus; 96% for Rail.
Quality of product
Bus: Mean Distance Between Failure of 6,600 miles; examine repeat
roadcalls. Rail: Mean Distance Between Service Interruptions of 15,000 miles
METROLift: Mean Distance Between Failures of 10,500 miles.
Internal and External Outreach efforts
Union/Management Cooperation efforts
Support external outreach efforts as needed; implement interdepartmental
summit meetings
Monthly issues meetings with Union staff.
Employee Incentive
Developed and administer an incentive program for rank and file staff.
First Line Supervision training
Develop and implement first line supervision training and change
management philosophy
Page 37
Business Plan & Budgets FY2011
Scorecards
Capital Programs – METRORail Expansion
Sustainability
Asset Utilization
Principles
Balanced Scorecard - METRO Rail Expansion
Initiatives
HOV Lanes Conversion to HOT Lanes
Conversion of 84 miles of High Occupancy Vehicle to High Occupancy Toll is
estimated to increase utilization of the HOV system more than 50%. Using
technology to upgrade gates and signal operations will improve reversible
efficiency and more operational flexibility. Consider extending operating
hours and weekend operation.
Ensure 100 % asset utilization; office equipment,
internal professional services: Email Response
Management System (ERMS) - (SAP, ORACLE,)
business practices, Real Estate Database
1. Facilitate intra-departmental and divisional meetings to understand ERMS
capabilities to develop effective and efficient business practices &
procedures.
2. Integrate existing project financial data into SAP database.
3. The Real Estate Acquisition Database will stabilize critical information
currently unsupported. The database will add and hold all parcel information
for past corridors (The Red Line), future corridors (University, Uptown) and all
other METRO real estate assets facilitating the management of historical
information, legally required documentation, FTA required data and
supporting reports, as well as managing METRO leases, licenses and joint
development holdings.
METRO Rail Expansion
1. METRO Rail Expansion will continue to build a safe and quality
transportation infrastructure that promotes and sustains regional transportation
needs linking people with jobs, services and communities far into the future.
Secure corridor Federal Full Funding Grant Agreement 1. Provides for the major funding source for the project. Completion of the
project will improve METRO's level of service to the public and reduce the
number of automobile emissions.
2. Need to secure LONP's from FTA for roadway construction on the North
and Southeast Corridors. Additional ROW for the project which will provide
service to the community along with the added benefit of improved
infrastructure through the City of Houston.
State of Good Repair
Safety
Definition
Provide and promote a "safety first" working
environment for employees, corridor personnel and
general public
MAIN ST ENHANCEMENTS - Bar signal upgrades, signal timing adjustments
and uninterrupted power supplies improvements programmed for the FY2011
Business Plan provides a tremendous benefit to the cost ratio. Work
completed in FY2010 has proven to reduce accidents, improve running time
and provide for a safe and more reliable service.
FACILITIES and HOV O&M - provide the needed inspections and repairs and
upgrades to ensure HOV and Park & Ride Facilities are safe.
1. Reduce lost time accidents and claims.
2. Direct and manage ongoing materials compatibility program to audit
implementation of design and construction of public utilities through Potential
Petroleum Contaminated Areas (PPCA).
3. Incorporate all "Safety - Lessons Learned" into the early utility and
roadwork biddable packages.
4. Ensure communication remains open with HRT, MARSH USA and Chartis
Insurance regarding safety aspects of the project
Page 38
Business Plan & Budgets FY2011
C ost C ontrol
Scorecards
Capital Programs – METRORail Expansion (Con’t)
Monitor cost, schedule and scope of capital projects 1. Develop a plan to evaluate cost savings ideas provided by employees
and capital budgets
and provide an incentive program that rewards employees for cost savings
ideas.
2. Establish final schedule showing a blended "Red Line" vs. "Facility
Provider" implementation approach. Develop implementation phases
consistent with financial constraints.
3. Prepare & monitor departmental and capital budgets within the stated
timelines. Monitor/analyze expenditures and scorecard initiatives via
management reporting requirements.
4. Upon completion of construction, eliminate storefronts and look for
locations that allow for low-cost/no-cost office sharing to maintain a presence
in the corridor communities.
5. Utilize SARs (Stakeholder Affair Reps) to perform work currently done by
construction mitigators. Once pace of construction picks up construction
mitigators can be re-hired.
6. Maintain proper control of capital projects/contracts to eliminate cost
overrun and future claims against the agency which could jeopardize federal
funding.
C ustom er S ervice
Conduct industry outreach forums to ensure that the
procurement and implementation approach is
reflective of input from the local design and
construction customers in the community
1. Schedule and implement a series of meetings aimed at improving
dialogue and understanding between METRO and key stakeholders.
2. Establish and maintain system and process whereby all inquiries are
managed and responses are checked to verify consistent responses to
customers.
Provide internal/external customer service at all times 1. Return all information requests/responses within 24 to 48 hours.
2. Communicate reasons for decisions particularly when customer requests
cannot be met; develop alternative solutions that are mutually agreeable to
METRO and the customer.
3. Minimize complaints from public caused by construction activities by
providing/maintaining clean and orderly construction zones.
4. Provide unobstructed access for bus patrons within construction zones by
having clearly visible and accessible bus stops.
Continue the Passenger Shelter Initiative
Shelters provide customers protection from the elements and have
statistically shown to have a positive effect on ridership. The continuation of
the shelter initiative reaffirms METRO's commitment and investment to the
core bus system.
Page 39
Business Plan & Budgets FY2011
People
Partnering
Scorecards
Capital Programs – METRORail Expansion (Con’t)
Strengthen internal Small Business Enterprise (SBE)
infrastructure
1. Establish inter-agency working group of SBE, procurement, legal and
capital projects to review and eliminate internal barriers to successful SBE
participation and tracking.
2. Through a monthly meeting forum, METRO endeavors to provide SBE's
with access to HRT to discuss outstanding issues relating to HRT's processes
and procedures that affect small business participation on the light-rail project.
As well, these meeting will provide a forum for the SBE's to provide
feedback on HRT's past activities, with the purpose of improving and refining
methods to maximize small business participation on the project.
Improved communication and intra-agency
coordination
1. Improve civic, private and public relationships through commitment and reestablishment of trust and better communication. Building these relationships
will allow METRO Rail Expansion the ability to expedite interagency
processes and approaches in a more expeditious manner. METRO will
become a better partner in its interactions with external agencies, personnel
and the general public at large.
2. Provide ongoing program coordination between City of Houston and
METRO Rail Expansion for all light-rail programs, commuter rail, signature
bus, and other related work efforts.
3. Establish trust among all of the project participants. Work closely with the
Joint Venture to establish common schedule goals and look for ways to build
trust and working relationships. METRO's goals should and need to align with
the Joint Venture's goals. Trust needs to be the foundation for establishing
the working relationships and should set the tone for the project.
Utilize METRO Staff (in lieu of consultant support,
whenever practical) in the completion of FTA
Readiness Documents and the preparation of graphics
needed for community interface meetings and the
completion of biddable packages in critical areas
targeted for early construction.
1. Building upon those already completed for entry into Preliminary
Engineering, develop and update FTA readiness documents and
management plans. Use in-house resources to prepare project graphics in
support of the community and City of Houston interface meetings.
2. Develop and complete biddable procurement packages to advance utility
and roadwork elements in critical areas. Manage complete technical and
financial aspects of the requirements contracts.
1. Develop "job family" and "job classifications" within family
2. Develop and provide training opportunities based on job classification,
certification and licensing as described within job family.
3. Provide leadership through employee mentoring, exposure and
supervision.
4. Provide an environment where employees are respected, encouraged
and given the opportunity of professional development and to be future
leaders of the Authority.
Workforce development and succession planning.
Page 40
Business Plan & Budgets FY2011
Scorecards
METRO Police
Customer Service
Cost
Control
Safety
Sustainability
Asset
Utilization
Principles
Balanced Scorecard - METRO Police Initiatives
Improve efficiency of HOV Lanes
Accident Optimization Initiative
Police will respond and report back to Legal, Risk Management, Safety and
Service Delivery, minimizing the number of personnel required to respond to
an accident by establishing a common shared accident database.
Utilize technology available at TranStar
Utilize technology available at TranStar to ensure that traffic flow moves as
efficiently as possible on HOV lanes and in freeway corridors, and to monitor
and respond to incidents impacting rail and bus operations throughout the
region on a daily basis and during special events.
Maximizing METRONet Security Surveillance System Encourage and support choice riders to use Park & Rides by reducing actual
crime incidents and adding a greater perception of security. Increased
ridership sustains METRO infrastructure and assets while providing another
mobility choice for the region.
Ensure the safety and welfare of METRO’s passengers Strategically respond to Part I crime on the transit system by targeting
and employees
enforcement efforts to mitigate monthly reported crime trends onboard buses,
trains, rail platforms, Park & Ride lots and transit centers to no more than 28
incidents per month.
Reduce Bus Accidents
Use technology and both leading and lagging indicators to identify and target
high accident locations and address with education, enforcement and
engineering.
Seek and apply for grants from state and federal law Fund projects using grant funding instead of using local money.
enforcement funding agencies
More effective use of camera technology
Expand and replace cameras instead of repairing gates at Park & Rides.
Motorists Assistance Program
Crime Mapping Initiative
Partnering
Enhanced Emergency Management Operations and
Coordination
City of Houston Public Safety Video Initiative
Law Enforcement Training Initiative
People
Definition
Clear incidents quickly to maximize HOV Lane capacity and flow.
Public Safety Leadership Training at HCC and LEMIT
Continue operation, management, and oversight of the Motorist Assistance
Program to support disabled and stranded regional motorists.
Customers will be able to go online and check crime statistics on bus routes,
rail platforms, transit centers and Park & Rides. Also allows department to
better target police resources based on data and tools provided by mapping
software.
Maintenance of METRO's Emergency Operations plan requires close
coordination with all METRO departments and both the City of Houston and
Harris County Offices of Emergency Management, and other regional, state
and federal partners.
Sharing of video for public safety. This effort would provide additional video
monitoring of METRO locations by the Houston Police Department and others
as well as providing METRO access to video of key downtown locations and
special event/activity centers affecting bus and rail operations.
Exceed state required police training of 20 hours to 40 hours by utilizing
METRO's recently developed transit training village at Houston Community
College to provide METRO officers and other local law enforcement the
opportunity to learn from scenario based training in a transit environment.
Prepare future leaders in the department to implement succession plans by
participating in a six week Public Safety Leadership Training Program in
cooperation with Houston Community College. Also by participating in the
LEMIT (Law Enforcement Management Institute of Texas) Program.
Page 41
Business Plan & Budgets FY2011
Scorecards
Performance Improvement
People
Partnering
Customer Service
Cost Control
Safety
Sustainability
Asset
Utilization
Principles
Balanced Scorecard - Performance Improvement
Department Initiatives
Improve monitoring of METRO's ratio of ridership to
capacity.
Definition
The number of available seats divided by total ridership.
An accurate analysis of equipment maintenance,
repair, and replacement records will lead to operating
more efficiently.
The performance measurement system will require
each department to adhere to METRO's strategic plan
ensuring equipment purchased be monitored for
predetermined ROI.
Business Process Reengineering will develop a
comprehensive plan to ensure efficiencies are being
met at the task level.
Monitor transportation safety problems to provide data
useful for developing performance indicators.
METRO will develop a yearly report outlining the life expectancy of
equipment.
Monitor and enforce daily safety briefings throughout
the Authority.
Safety consciousness must be part of METRO's daily business practices,
processes and decisions, and each employee must consider safe
operations in his/her personal responsibility.
A METRO Cost Control Initiative is being introduced in
October 2010. The plan is to involve front-line
employees to participate and benefit from cost control
strategies.
Business Services Department will embark on several
cost control strategies aimed toward streamlining
support services.
Cost Control refers to management's effort to influence the actions of
individuals who are responsible for performing tasks, incurring costs, and
generating revenues.
In cases where there is an expectation of a return on investment, departments
will be required to track proposed cost savings.
The Performance Improvement Department will develop a plan for time and
motion studies to take place specifically in bus and train maintenance areas.
Performance measure-based information is the foundation of a transparent
and accountable policy-making process. The collection of this data is
valuable and gives clarity to safety challenges facing METRO.
Each will have to change the way he/she works, and the way he/she works
with one another, in order to streamline operations and produce meaningful
savings.
Measuring time to answer incoming calls; responding to complaints in a
METRO will manage incoming complaints, process
them in a timely manner and fix operational problems timely fashion and partnering with other departments to fix reoccurring
operational problems will be emphasized in FY2011.
that drove the complaint.
The Performance Improvement will work with Safety
and Service Delivery Departments in the development
of Bus Operator training and performance evaluations.
METRO will continue to monitor industry best practices
in an effort to remain an industry leader in performance
initiatives.
METRO realizes that good customer service starts with frontline Bus
Operators. Development of how Operators will be evaluated with regard to
performance is critical to METRO's success.
Various transit agencies provide performance results to national databases.
METRO Performance Improvement Department will have the responsibility to
monitor these databases.
Performance Improvement Department will work with
other METRO divisions to ensure strategic priorities
and principles are being met.
METRO will set standards for employees and hold
managers accountable for the performance of their
departments.
Balanced Scorecards will be developed for
employees in every division within METRO.
Balanced Scorecards will be developed within divisions of METRO to ensure
the strategic plan is being followed and goals are being met.
Employee evaluations will support the strategic plan for METRO.
Individual scorecards will reflect the seven principles outlined in the strategic
plan.
Page 42
Business Plan & Budgets FY2011
Scorecards
Business Services – Human Resources & Diversity
Definition
Design and implement expanded management and leadership development
program.
Performance Management Process
Aligned with METRO's goals and principles, enhance performance
management process and develop new appraisal instruments.
External customer: Expand Customer Service Training to
Bus Operators.
Internal customer: Develop and deliver expanded HR
services to the Authority.
Partner with Service Delivery, area colleges and community organizations to
provide training to operators.
Ascertain needs through focus groups or survey instruments. Utilizing Sr.
Human Resources Partners (SHRPs) and Human Resources Partners (HRPs)
to increase the number of department and facility visits to share information
and provide HR&D services.
College Recruitment
Partner with local area colleges and universities to develop a pipeline of
future talent for METRO.
Partner with METRO departments, community organizations and individuals to
recruit and retain a diverse workforce as well as to support Title VI and Title
VII initiatives.
Communicate advantages (cost and convenience) of utilization of less costly
auxiliary support services over more costly alternatives.
Cost Control
Partnering
People
Balanced Scorecard - Human Resources & Diversity
Initiatives
Management and Leadership Development
Customer Service
Principles
Community Organizations
Promote EAP & Nurse Line and enhance Employee
Wellness Program to reduce healthcare costs and
motivate employees towards healthier lifestyles.
Communicate and promote mail-order pharmaceutical
services to help reduce healthcare expenses.
Safety
Actively participate in METRO's Emergency Management
Plan
Communicate cost and convenience advantages of maintenance type
pharmaceuticals over retail through vendors, use of direct mail and other
communications modes.
Maintain readiness status by: 1) encouraging employees to provide current
emergency contact information; 2) conducting periodic HR&D meetings to
ensure participants are familiar with their respective roles; 3) maintaining
ongoing communication with the Safety Department and 4) actively participate
in all METRO planning and preparation meetings.
Promote safety and security of METRO facilities/personnel Using new badging software, enhance current badging processing of
employees and contractors.
Sustainability
Asset Utilization
Partner with IT to provide SAP-ESS (Employee Self
Service) training for all union employees.
Enable employees to access and maintain their personal data using the
Employee Self Service module thus allowing HRIS personnel to focus on
other higher level records management responsibilities.
Use METRO employees and/or professional organizations Provide information in various areas (i.e. safety, HR best practices,
and other entities to provide volunteer
communication skills, METRO specific "Lost and Found" and/or other similar
facilitators/presenters to conduct training on relevant
topics).
topics. By "filling in" will provide cross-training
opportunities for employees so that they develop skills
and knowledge in other areas.
Employment Planning - "Hire Houston"
Target hiring opportunities and work with Houston area community
organizations, colleges, universities to place local area applicants thus
facilitating METRO's ability to maintain its human infrastructure.
Enhance and promote Title VI and Title VII Compliance.
Implement required training for salaried employees to ensure compliance
with federal regulations and support of METRO's strategic goals.
Page 43
Business Plan & Budgets FY2011
Scorecards
Business Services – Information Technology
A sset
S u stain ab ility U tiliz atio n
Balanced Scorecard - Business Service Information Technology Initiatives
Principles
Consolidate applications into a single Enterprise
Resource Planning (ERP)
Continue consolidation of servers, storage and
desktops
Develop strategic technology plan for METRO's future
Enhance Disaster Recovery site
P eo p le
P artn erin g
C u sto m er
S ervice
C o st C o n tro l
S afety
Maintain METRO's Data Center in a safe manner
Definition
Initiate pilot to prepare procurement for consolidation into single ERP
Using virtualization technology, METRO will leverage existing hardware to
slow hardware growth and maximize utilization.
Partner with other departments in developing a strategic roadmap for
METRO's technology, based on the organization's strategic plan.
Finalize site changes that move METRO from a "cold" site to a "warm" site.
This will provide quicker business resumption in the case of disaster.
Finalize environmental enhancements to the data center (power upgrade, fire
suppression); maintain clean unobstructed area for the Main Data Center and
all off-site data rooms
Evaluate and renegotiate large maintenance contracts Audit large IT maintenance contracts for opportunities to renegotiate for cost
stabilization or reductions.
Apply "green" solutions to IT equipment
Simplify IT request processes
Partner with the City of Houston on regional video
surveillance sharing.
Utilize software and hardware options to reduce the energy consumption of
existing equipment
Develop an online process for standard IT requests to simplify and streamline
these processes
Work with METRO Police to ensure the video surveillance partnership is
successful, by establishing network interfaces between METRO and the City
of Houston.
Partner with other METRO business units to enhance Initiate user group meetings for stakeholders of major applications to develop
system knowledge and skills
mutual understanding and learning that enhances system use.
Provide technical training to enhance staff skills
Training is needed to ensure that staff can fully support and maintain the
systems that METRO is implementing.
Enhance communications within the IT department
Initiate working sessions with staff to solicit feedback for communication
needs and improvement
Page 44
Business Plan & Budgets FY2011
Scorecards
Business Services – Procurement
S u stain ab ility
A sset
U tiliz atio n
Principles
Balanced Scorecard - Procurement Initiatives
Maintain materials availability at 99% systemwide.
Definition
Ensure that parts are available 99% of the time at any Bus Operating Facility.
Reduce Obsolete/Surplus Inventory by $200,000.
Attain optimum utilization by returning, selling or disposing of items not being
used.
Reduce the cost of parts and other commodities by $1 Attain through alternative sourcing, equivalent products and increased
million.
competition.
Develop "Green" Procurement alternatives.
Identify products and services that minimize environmental impacts.
P artn erin g
C u sto m er
S ervice
C o st
C o n tro l
S afety
Create a safe working environment.
Through leadership (Department Safety Officer) training and drills ensure
compliance with Safety Regulations.
Handling and storage of hazardous materials.
Proper use of any material which could harm humans, animals or the
environment.
Maintain bus component inventory below $10 Million. Reduce the average monthly spend to $1 million.
Reduce cost to spend ratio to 1.5%.
Ratio of departmental operating cost versus total dollars obligated.
Sound Procurement Processes.
Provide internal and external customers a process that is simple, transparent,
fair and equal.
Update website to provide information which is timely accurate and easily
accessible.
Reduce cost and improve service delivery through joint procurement and
cooperative agreements.
Benefit from just-in-time delivery, quality assurance and reduced
administrative costs.
Develop more effective communication and training, measurement tools and
improvement goals.
Develop ways and means for upward mobility for everyone in the department.
Timely dissemination of data.
Collaboration with colleagues.
Strategic Partnerships.
P eo p le
Quality Work Environment.
Establish Career Paths.
Page 45
Business Plan & Budgets FY2011
Scorecards
Safety
P artn erin g
C u s to m e r
S e rv ice
C ost
C o n tro l
S a fety
S u stain a b ility
A s set
U tiliz atio n
Principles
Balanced Scorecard - METRO Safety Initiatives
Definition
Safety Inspections at all Operating Facilities
Routine monthly inspections and quarterly safety blitzes at operating facilities
ensuring our physical assets are in safe operable condition
Fire and Life Safety Oversight
Perform routine fire drills to ensure METRO assets are minimally affected by
fire or other elements and to improve emergency preparedness
Environmental Compliance
Comply with all local, state and federal regulations including air, waste and
water
Rail Expansion Safety
Involved with all aspects of safety with expansion of the rail system including
compliance with Design Criteria, Construction Safety Oversight and Final
Testing and Certification prior to Revenue Service.
Reduce Bus Accidents
Ensure that preventable bus accidents do not exceed the total of 431 in
FY2011
Reduce Rail Accidents
Ensure that rail accidents do not exceed the total of 39 accidents in FY2011
Reduce employee injuries
Reduce non-revenue vehicle accidents
Ensure on-board Operator Evaluation
Conduct 1,000 quality ride checks per quarter evaluating safe driving
performance of Operators.
Hazard Analysis
Ensure customer and employee safety at transit centers, Park & Rides, rail
corridors and all bus routes by conducting routine inspections.
Partner with all METRO departments, contractors and Work with internal and external partners to identy and target high accident
local, state and federal entities and stakeholders
locations.
Transportation Safety Training
In cooperation with the Service Delivery Department, develop and implement
safety training courses for transportation operators and conduct quarterly
safety meetings at operating facilities.
Professional Certification and Cross-Training
P eo p le
Ensure that employee Lost Time and Medical Injuries do not exceed the total
of 242 in FY2011
Ensure non-revenue accident rates do not exceed the total of 119 in FY2011
Industrial Hygiene/Health Safety
Ensure safety employees retain the proper level of certification and training to
maximize value to customers and employees.
Maintain acceptable standard of industrial hygiene ensuring safety and well
being of METRO employees; ensure employees are supplied the
necessary personal protective equipment; ensure employees are provided
necessary safety training
Page 46
Business Plan & Budgets FY2011
Scorecards
Law
People
Partnering
Customer Service
Cost
Control
Safety
Sustainability
Asset
Utilization
Principles
LAW DEPARTMENT Balanced Scorecards - Law
Department Initiatives
Definition
Maximize the use of existing resources. We work our • Provide training to management and staff on Open Government.
assets to get the maximum benefit for our customers • Continue to provide the highest quality of legal services to METRO.
and our community.
Build economic, environmental and social factors into • Create a shared electronic library for access to board resolutions.
all our business practices. Make decisions that
• Maintain Conflicts Disclosure webpage.
ensure we can continue to deliver same or better
levels of service year after year. Run our business to
have as much positive impact on the environment as
possible.
Never risk the safety of our customers, employees
and the general public.
• Provide advice and counsel to Operations, Public Safety, and Risk
Management departments to identify areas where more training is needed;
avoidance of hazardous activities.
• Reduce Outside Counsel Services.
Understand the difference between cost cutting and
cost control. Treat taxpayer money like your own and
manage public resources openly and transparently.
Focus on safety, reliability, timeliness, affordability and • Promptly reply to open records requests in the new open and transparent
environment.
the personal touch in delivering services to our
• Conduct business roundtables with each department/business client to (1)
customers.
assess their legal needs, (2) manage expectations, (3)engage their
feedback, and (4) provide exceptional customer service.
Look for opportunities to actively pursue external
relationships with governments, community groups,
individuals and the public to help mobility in our
region. Inside METRO, work with each other to
achieve this goal through team efforts.
• Actively attend other department meetings to better anticipate legal needs.
• Establish better working relationship with law departments of other
government entities.
• Invite representatives from other departments to Law Department meetings
to receive more Information about various topics of interest such as Title VII
and Open Records Act.
• Provide additional training to legal staff and attorneys to diversify legal
Support our employees every day by making our
expertise and to better serve the client.
expectations clear. Ensuring they have the
knowledge and training to do their jobs, providing
tools and resources to get the job done, and giving
them coaching, feedback and reinforcement that
motivates them to give their best to our customers and
our community.
Page 47
Business Plan & Budgets FY2011
Scorecards
Finance
People
Partnering
Customer Service
Cost Control
Safety
Sustainability
Asset Utilization
Definition
Principles Balanced Scorecard - Finance Department Initiatives
Meet or exceed the average yield on U.S. Treasury Securities and this will
Manage the Investment Portfolio to comply with the
be measured on a monthly basis.
Texas Public Fund Investment Act and METRO
Investment Guidelines while earning a highest yield
available in the market.
Working with Service Delivery and Service Design &
Development to review future bus replacement to
ensure appropriateness of type and quantity.
Finance will initiate formation of a working group including Service Design &
Development, Service Delivery, Business Services: Procurement, Finance:
Grants and Finance: OMB to review all future bus
replacements/procurements.
Finance will develop a model for financial sustainability/cost benefit analysis.
Review new project, program and asset addition
requests to ensure that they are financially sustainable
in the future by including life-cycle costs and potential
savings.
Review records of fixed assets, age and service to
dispose of non-essential tangible and intangible
assets.
Enhance Finance employee awareness of
surroundings and safe practices.
Give the highest priority to safety related activities
when allocating funds for programs and projects.
Assist departments in exercising aggressive cost
control of FY2011 budgets to ensure Authority-wide
expenses come under budget.
Develop summary fixed assets report to determine assets for removal by 3rd
quarter of FY2011. Report will serve as a guide for asset sustainability.
Develop handbook on safe practices for Finance by 3rd quarter of FY2011.
This initiative will develop a process for rating programs; projects based on
safety and will be completed by 3rd quarter FY2011.
Save at least $1 million from METRO's FY2011 operating budget by the end
of the fiscal year (excluding fuel), without impacting service on the street.
Review METRO Q® Fare Card operations and costs to Finance will bring forth cost control initiatives for METRO Q® Fare Card
identify opportunity for cost control and improvements. beginning first quarter FY2011.
Enhance public trust by completing the FY2010
external audit including single audit with an unqualified
auditor’s opinion.
Provide accurate financial reports to the METRO
Board, executive management and the public on a
timely basis. Revise and simplify METRO’s overhead
cost allocation model to reflect the new capitalization
policy and organizational structure.
METRO will complete the audit.
This initiative will provide on an ongoing basis the results of METRO
operations in a transparent format. Reports will be posted on METRO's
website on a monthly basis.
Finance proposes to have the overhead cost allocation model redone by
end of 2nd quarter FY2011.
Partner with the Business Services: Procurement and This initiative is proposed to improve vendor relations and tighten control
over the procurements as to due dates.
project managers to ensure the payment of
contracts/purchase orders match receipts and are paid
within payment terms.
Partner with Service Design & Development regarding H-GAC is developing long range transportation plans; this initiative will help
project funding and inclusion in regional and state
examine opportunity for maximizing METRO financial participation. Finance:
plans.
Grants will work with Service Design & Development to obtain maximum
amount of grants possible.
Identify key Finance employees for advance training in This initiative will assist Finance employees to gain system knowledge and
advance their opportunity for professional growth. Finance will put together
Finance technology applications to improve
the plan and program for execution of this program during the FY2011 first
professional competency and train them for higher
quarter and will implement thereafter.
responsibilities.
Promote team work/environment within the Finance
Finance will develop a program for opportunities to share information and
Department and for interactions with other departments. expertise. Program to be ready by 2nd quarter in FY2011.
Page 48
Business Plan & Budgets FY2011
Scorecards
Audit
S u stain ab ility
A sset
U tiliz atio n
Definition
Principles Balanced Scorecard - Audit Department Initiatives
Enhance Maintenance internal controls.
Complete audit of Central Support and Manufacturing Group activities and
make recommendations for improvement.
Improve Information Technology asset utilization
Complete audits of the VoIP phone system and the UNIX operating system
and make recommendations for improvement.
Ensure sustainability of operations during a disaster. Observe and comment on ongoing Disaster Recovery testing of computer
systems.
Ensure sustainability of operations during normal rail Evaluate adequacy of controls within the IT data center located at the Rail
operations.
Operations Center.
P eo p le
P artn erin g
C u sto m er
S ervice
C o st
C o n tro l
S afety
Improve bus operator safety.
Enhance security at METRO facilities.
Ensure rail expansion quality controls are in place.
Ensure Procurement cost controls are effective.
Ensure compliance with Title VI requirements.
Ensure compliance with ADA requirements.
Complete audits of Employee Background Check procedures and Bus
Operator Moving Violations and make recommendations for improvement.
Complete audit of security at selected METRO facilities and make
recommendations for improvement.
Implement continuous audit approach in reviewing Rail Expansion quality
assurance activities.
Complete audits to ensure that prices/costs paid via METRO contracts are fair
and reasonable.
Observe and comment on METRO ongoing efforts to comply with federal Title
VI requirements.
Observe and comment on METRO ongoing efforts to comply with federal
ADA requirements.
Complete audits to ensure that FTA Buy America requirements are met.
Provide assistance in ensuring METRO compliance
with FTA requirements.
Provide assistance in ensuring that METRO provides Complete audit observation of annual physical inventory process and provide
requested materials for external audit review
results to KPMG.
purposes.
Ensure that training of internal audit staff is adequate. Provide training sufficient to ensure that all Audit Department auditors meet
federal continuing education requirements for internal auditors.
Improve training of METRO staff.
Complete audit of Customer Service training and make recommendations for
improvement.
Page 49
Business Plan & Budgets FY2011
dAuthority Level
Operating Budget
Increases and Decreases
FY2010 Board Approved Operations Budget
$
330,000,000
Increases for FY2011 due changes in Capitalization
(stricter application of accounting rules)
$
26,587,000
Net Change due to other budget items - net reduction
$
(1,684,292)
FY2011 OPERATING BUDGET
$
354,902,708
$
24,902,708
$
$
$
$
$
$
$
26,587,000
7,883,000
1,095,000
2,036,000
406,000
400,000
1,554,784
Total Increases
$
39,961,784
Lower hedged price for diesel fuel and better fuel efficiency
Lower workers compensation cost
Increased efficiency in deploying bus operators
Savings in bus, rail and farebox parts
Increased cost recovery for Energy Corridor service
Contingency
Other reductions (elimination of mystery riders, etc.)
Total Decreases
$
$
$
$
$
$
$
$
(11,059,000)
(1,170,000)
(699,000)
(478,000)
(335,000)
(803,000)
(515,076)
(15,059,076)
Net Increase in Operating Budget
INCREASES & DECREASES
Increases
Capitalization (stricter application of accounting rules)
Contractual Increases
Employee Morale Initiative (increase straight runs for operators)
Effect of performance pay carryover and upgrades
Increased telephone expenses primarily associated with SAFEBus
Increase in legal fees
All Other Increases (payroll taxes, document retention, healthcare, etc.)
Decreases
Page 50
Business Plan & Budgets FY2011
Authority Level
Increases and Decreases
Explanations
Capitalization (stricter application of accounting rules)
In FY2010, accounting rules were more strictly interpreted resulting in
a shift of expense allocations from the capital to the operating budget
for both labor and non-labor items.
$ 26,587,000
Contractual Increases
As a result of the agreement with the collective bargaining unit, union
labor costs will increase in FY2011. A 3% average wage increase
and a 6% healthcare increase result in increased costs of
approximately $4.7 million. In addition, Contractual inflation in
purchased transportation, facility maintenance and security guard
contracts offset by savings from a new cell phone contract results in
increased costs of approximately $3.2 million.
$
7,883,000
Employee Morale Initiative (increase straight runs for operators)
In FY2011, METRO proposes to reduce split shift work for bus
operators and increase the number of straight runs to improve
employee morale.
$
1,095,000
Effect of performance pay carryover and upgrades
Carryover effect of performance pay earned in FY2009 and upgrades
in FY2010.
$
2,036,000
$
406,000
$
400,000
Increased telephone expenses primarily associated with
SAFEBus
In FY2011, as equipment is installed on buses under the SAFEBus
project, the resulting monthly communications charges will add to
expense.
Increase in legal fees
Resulting from certain employment and other legal matters that arose
in FY2010, legal fees are expected to increase in FY2011 for
continuing work.
Page 51
Business Plan & Budgets FY2011
Authority Level
Increases and Decreases
Explanations (Con’t)
All Other Increases (payroll taxes, document retention, healthcare,
etc.)
Other increases accommodated in the FY2011 Budget include
increases in unemployment taxes (extended benefits), document
retention (inplementation of a newly adopted policy), and healthcare.
(adding previously excluded working spouses)
$
1,554,784
Lower hedged price for diesel fuel and better fuel efficiency
METRO's fuel costs will decrease because a fuel hedging program
has been put into place at a price below what METRO is paying now.
$ (11,059,000)
Lower workers compensation cost
Resulting from fewer and less severe Workers Compensation claims,
expenses will be reduced in FY2011.
$ (1,170,000)
Increased efficiency in deploying bus operators
Through more efficient use of bus operators.
$
(699,000)
Savings in bus, rail and farebox parts
Resulting from new buses and completion of capital campaign work,
parts costs will be lower in FY2011.
$
(478,000)
Increased cost recovery for Energy Corridor service
Annualization of Energy Corridor service initiated in mid FY2010 will
produce increased cost recovery in FY2011.
$
(335,000)
Contingency
In FY2010, some of the savings in different categories of the budget
were transferred to form a contingency account which now stands at
$5,803,358. For FY2011, it is proposed to have only a $5,000,000
contingency, making it to be under FY2010 by $803,000.
$
(803,000)
Other reductions (elimination of mystery riders, etc.)
$
(515,076)
Page 52
Business Plan & Budgets FY2011
Authority Level
Operating Budget by Cost Category
Expense Category
Wages
Salaries
Fringe Benefits - Union
Fringe Benefits - Non Union
Total Labor and Fringe Benefits
FY2010
FY2011
Current Year
Proposed
Budget
Budget
99,996,189 102,944,991
73,618,955
75,382,855
51,689,230
53,022,626
36,215,555
36,888,127
261,519,929 268,238,599
Purchased Transportation
Fuel & Utilities
Materials and Supplies
Services
Casualty and Liability
Leases, Rentals and Miscellaneous
Total Non-Labor
72,833,365
49,057,729
19,081,797
18,449,716
2,614,230
2,918,949
164,955,786
75,750,347
38,309,473
19,526,141
25,667,756
2,591,778
7,240,259
169,085,754
Total Labor and Non-Labor
426,475,715
437,324,353
Contingency
Cost Reimbursement (cost recovery) (1)
Operating Expense before Allocations
Allocation to Capital - Direct (2)
Allocation to Overhead (2)
Operating Expenses before Federal
Grants for Capitalized Operating Expenses
Capitalized Operating Expenses Federal Grants (3)
Operating Budget (4)
5,803,358
(7,839,775)
5,000,000
(9,348,455)
Variance
$
2,948,802
1,763,900
1,333,396
672,572
6,718,670
%
2.95%
2.40%
2.58%
1.86%
2.57%
2,916,982
4.01%
(10,748,256) -21.91%
444,344
2.33%
7,218,040
39.12%
(22,452)
-0.86%
4,321,310 148.04%
4,129,968
2.50%
10,848,638
(803,358)
(1,508,680)
2.54%
-13.84%
19.24%
424,439,298
432,975,898
8,536,600
2.01%
(27,290,080)
(13,337,282)
(17,388,708)
(6,872,546)
9,901,372
6,464,736
-36.28%
-48.47%
383,811,936
408,714,644
24,902,708
6.49%
(53,811,936)
(53,811,936)
0
0.00%
330,000,000
354,902,708
24,902,708
7.55%
Notes:
1. Cost Recovery consists of expense reimbursement by others for certain transportation services relating primarily to METRO
STARVanpool, Energy Corridor and Texas Medical Center service. It is tak en as a credit.
2. Allocation to capital (Direct and Overhead) consist of expenses for staff assigned to capial projects.
3. Capitalzied Operating Expenses are funds received primarily as federal grants.
4. Operating Budget is the total expenses less cost recovery, capitalized operating expenses and allocation to capital. The
increase in the Operating Budget from FY2010 to FY2011 is almost entirely due to the change in accounting policy regarding
capitalization of operating expenses.
Page 53
Business Plan & Budgets FY2011
Authority Level
Variance Summary
● Wages rise by 3.0%, primarily resulting from implementation of the collective
bargaining agreement (3.0% wage increase in FY2011 and adjustment of operator
progression) and increased bus operator wages due to a proposed increase in the
number of straight runs.
● Salaries and Hourly Non-Union Wages increase by 2.4%, reflecting the effect of
the past year's performance pay and a few salary changes.
● Fringe Benefits - Union increase by 2.6%, primarily reflecting increases in fringe
benefits associated with implementation of the collective bargaining agreement.
Monthly healthcare cost increased from $753 to $800 per month per employee.
Offsetting this increase are savings in Workers' Compensation expense.
● Fringe Benefits - Non Union increase by 1.9%, reflecting fringe benefit increases
associated with higher salaries as discussed above and increased healthcare
costs to cover addition of previously excluded working spouses to salaried
healthcare.
● Purchased Transportation increases by 4.0%, reflecting contractual price
increases in the METROLift and Northwest Bus Operating Facility service
● Fuel and Utilities decrease by 21.9%, primarily reflecting the decline in diesel fuel
cost. METRO's hedging program has resulted in budget stability and at this time,
METRO has hedged all of FY2011 diesel fuel requirements at an average market
price of $1.95 per gallon (excluding additives and transportation), a $0.70
decrease from the FY2010 hedged price of $2.65.
● Materials and Supplies increase by 2.3%, primarily due to stricter application of
accounting rules in areas such as fare media.
● Services increase by 39.1%, primarily due to stricter application of accounting
rules governing expensing of outside consultant use, legislative coordination, legal
fees and IT system maintenance costs, etc.
● Casualty and Liability decrease by 0.9%, reflecting savings in Vehicle Liabilty
partially offset by a rate related increase in property insurance.
Page 54
Business Plan & Budgets FY2011
Authority Level
Variance Summary (Con’t)
● Leases, Rentals and Miscellaneous increase by $4.3 million due to stricter
application of accounting rules in areas such as HOV repair, Main Street traffic
signal and IT systems software costs.
● Contingency will decrease by 13.8%. In FY2010, some of the savings in different
categories of the budget were transferred to form a contingency account which now
stands at $5,803,358. For FY2011, it is proposed to have only a $5,000,000
contingency.
● Cost Recovery increases by 19.2%, resulting from increases in Department of
Homeland Security grant funding and increased cost recovery for Energy Corridor
service.
● Allocation to Capital decreases by 17.3%, due to stricter application of
accounting rules.
Page 55
Business Plan & Budgets FY2011
Authority Level
Budget Elements to Note – Fuel
The market prices of diesel and gasoline have been extremely erratic over the past few
years with a strong upward trend. This has put enormous pressure on METRO’s fuel
bill as illustrated in the following tables:
Gallons Used (METRO & Contractors)
Diesel
Gasoline
Total
FY03
FY04
FY05
FY06
15,607,482
16,746,698
14,964,649
14,431,528
725,966
723,128
700,488
727,601
16,333,448
17,469,827
15,665,136
15,159,129
FY07
FY10
Budget
FY11
Budget
FY08
FY09
13,955,984
13,798,020
13,655,476
13,553,387
749,019
807,518
839,395
1,157,726
966,437
14,705,003
14,605,538
14,494,872
14,711,113
14,166,501
FY10
Budget
FY11
Budget
13,200,063
Expenditures (METRO & Contractors)
FY03
Diesel
$ 13,722,561
Gasoline
$
Total
$ 14,385,885
663,324
FY04
FY05
FY06
FY07
FY08
FY09
$ 19,001,484
$ 22,834,852
$ 27,552,712
$ 30,633,825
$ 26,313,230 $ 57,687,033 $ 37,706,187 $ 26,768,826
$
769,533
$ 1,093,547
$ 1,459,587
$ 1,488,547
$ 2,197,023 $ 1,382,207 $ 1,631,152 $ 1,877,945
$ 19,771,017
$ 23,928,400
$ 29,012,299
$ 32,122,372
$ 28,510,253 $ 59,069,240 $ 39,337,339 $ 28,646,771
In FY2005 and FY2006 METRO contracted with Valero for a bulk purchase, Citgo for
fixed price future contracts, Motiva (Shell) for fixed price future contracts and Love’s for
storage fuel. This resulted in a $6.71 million total savings against buying at the current
rack price.
In February 2006, the METRO Board approved a Fuel Hedge Policy (Fuel Price Risk
Management Policy). However, the price of a FY2007 hedge was not favorable and the
budget was funded for increasing fuel costs. At the start of the fiscal year NYMEX
based fixed price future delivery contracts were executed for October-June deliveries
and storage fuel was to be utilized for July-September. The FY2007 total fuel cost was
$6.98 million less than budgeted.
In January 2007, two financial hedges for diesel fuel were executed for FY2008. A total
of 13.5 million gallons or 95.2% of the required diesel for FY2008 was hedged at an
average market price (excluding $0.0828 additional for additives and transport) per
gallon of $1.83. In FY2008, the fuel hedge saved $17.25 million as compared to
prevailing market prices.
Page 56
Business Plan & Budgets FY2011
Authority Level
Budget Elements to Note – Fuel
In FY2009, METRO hedged 98.1% of the fuel requirements at an average market price
of $3.55 (excluding $0.0828 additional for additives and transport) and had 4.2 million
gallons of diesel fuel at an average price of $3.36 (excluding $0.0789 additional for
additives and transport) in off-site storage. These prices reflect the extraordinary
escalations in the market place in FY2009. In FY2009, due to declining market prices
the fuel hedge cost METRO $26.01 million. In addition, at the end of FY2009, METRO
wrote down the offsite diesel fuel inventory to market price at a cost of $3.93 million.
In FY2010, METRO hedged 100% of the fuel requirements at an average market price
of $2.65 (excluding $.0717 additional for additives and transport) and had 2.54 million
gallons at $1.82 per gallon (excluding $.0643 additional for additive and transport) in offsite storage.
At this time, METRO has hedges in place for 13.31 million gallons at an average market
price of $1.95 (excluding $.0755 additional for additives and transport) for FY2011. No
hedges are in place for FY2012.
($000s)
$70,000
$60,000
$50,000
$40,000
$30,000
$20,000
$10,000
$0
2003
Does not include taxes
2004
2005
2006
2007
2008
2009
2010
Budget
2011
Budget
Page 57
Business Plan & Budgets FY2011
Authority Level
Budget Elements to Note – Power Contract
METRO has two major uses of electrical power: electricity for METRO facilities and
electricity for rail propulsion power. In October 2006 METRO put in place a three year
fixed rate contract including a floating Transmission and Distribution Service Provider
(TDSP) unit rate with Suez Energy Resources. This contract was extended through
March 2010. In March 2010 the Board approved a new three year contract with the
Texas General Land Office (GLO) to supply METRO electricity from April 1, 2010
through March 31, 2013. The contract rate of $0.05866 per kilowatt hour is fixed for the
term of the contract while the TDSP unit rate floats. This contract hedges METRO's
electricity requirements for 3 years, providing budget certainty on price in accord with
the Board's Fuel Price Risk Management Policy adopted February 2006.
METRO has projected its FY2011 power requirements as follows:
Quantities in Millions of kWh
Power Usage
Facilities
Propulsion
Total
FY2010
Budget
48.822
7.668
56.490
FY2011
Budget
52.058
7.175
59.233
Δ
Δ%
3.236
(0.493)
2.744
6.6%
-6.4%
4.9%
The FY2011 Operating Budget has assumed the overall price to be $0.0777 as
compared to $0.0852 budgeted in FY2010. The Budget reflects a full year rather than 6
months of lower rates associated with the new contract. This savings is partially offset
by increased usage primarily at 1900 Main and extended lighting at Park & Ride
facilities.
Budgeted Expenses in Millions of $
Power Cost
Facilities
Propulsion
Total
FY2010
Budget
4.054
0.761
4.816
FY2011
Budget
4.043
0.557
4.600
Δ
Δ%
0.011
(0.204)
(0.216)
-0.3%
-26.8%
-4.5%
Page 58
Business Plan & Budgets FY2011
Authority Level
Budget Elements to Note – Labor Agreement
METRO’s current labor agreement approved in February 2009 covers the time period
from August 1, 2008 to September 30, 2011. The key terms of the agreement
impacting FY2011 are as follows:
•
Wages
3% increase for FY2011 for non-second tier operators, and
adjustment of the wage progression for second tier operators.
FY2011 Budget Increase = $3,227,777
•
Health Benefits
METRO’s contribution to Health & Welfare Trust will
increase from the FY2010 rate of $753 per month per
participant to $800 per month per participant in FY2011.
FY2011 Budget Increase = $1,502,363
During FY2011, METRO will negotiate a new labor agreement with Local 260 of the
Transport Workers Union of America. Any changes in the terms and conditions from
the current labor agreement made during the collective bargaining process will not
impact the FY2011 budget.
Page 59
Business Plan & Budgets FY2011
Authority Level
Budget Elements to Note – Purchased Transportation
METRO has three service components run by private contractors:
•
Fixed-route service based out of the Northwest Bus Operating Facility (one of six
METRO Bus Operating Facilities) by First Transit, Inc. The Contractor operates
a turnkey operation including administration, staffing, bus transportation services,
and maintenance of METRO-furnished buses and facilities. The contract
incorporates adherence to METRO key performance indicators of On-Time
Performance, Accidents per 100,000 Miles and Complaints per Boardings as well
as contract specific goals such as vehicle reliability by bus fleet. The Northwest
BOF operates seven (7) days a week and will provide about 20% of the fixed
route bus revenue hours scheduled by METRO in FY2011.
•
METROLift van service run by First Transit, Inc. The Contractor provides all
resources, administration, personnel, paratransit transportation service, facilities
and all maintenance required to operate and maintain a fleet of one hundred
eighteen (118) METROLift vans. METRO is in the process of implementing a
new fleet of 2010 Chevrolet 6.6L diesel-powered low emission vehicles, with
vehicle delivery expected to be complete by midyear FY2011. The new vehicles
have new mobile data terminals with global positioning systems (GPS) and invehicle mapping for turn-by-turn street navigation to improve on-time
performance and minimize wait time for METROLift patrons; as well as new rear
light-emitting diode (LED) “STOP” signs for increased safety awareness and
accident prevention.
During FY2011, a new METROLift van service contract will be awarded that
incorporates new customer service performance indicators to emphasize driver
behavior and driver safety as well as language for addressing service concerns
such as operator infractions, safety infractions and non-compliant vehicles.
•
METROLift sedan / wheelchair accessible mini-van service is operated by
Greater Houston Transportation Company (Yellow Cab) using Contractor
owned / furnished vehicles.
The Contractor provides all resources and
administration required to operate and maintain a fleet of wheelchair accessible
mini-vans. There are contract-specific performance indicators for customer
complaints and accidents to ensure quality service for METROLift patrons.
Page 60
Business Plan & Budgets FY2011
Authority Level
Budget Elements to Note – Purchased Transportation (Con’t)
The Contractor is currently providing up to one-hundred fifty six (156) wheelchair minivans consisting of Dodge Caravans as well as model year 2010 or newer Toyota
Sienna wheelchair accessible vehicles. During FY2011, some of the current paratransit
service provided by METROLift vans will be shifted to sedan / mini-van service for cost
savings and greater operating flexibility by accepting an offer from the Contractor to
increase their fleet size to accommodate this change in paratransit service delivery.
Based on the FY2011 projected service levels and negotiated contract rate increases
for the service components discussed in this section, an additional $3,056,280 has been
incorporated into the FY2011 budget, reflecting a 4.6% increase from the FY2010
budget. As noted as a best practice in the most recent FTA Triennial Review of
METRO, Transportation Programs staff will continue its partnership with all of its
contractors by monitoring and meeting with them on a regular basis in order to ensure
continued quality transportation services for METRO customers.
Page 61
Business Plan & Budgets FY2011
Authority Level
Budget Elements to Note - Fare Policy
METRO Board policy provides “…that the fare structure and fare rates will be reviewed
annually and that fares will be increased as necessary to account for the effects of
inflation on operating costs and to maintain or improve the revenue/operating expense
ratio.” (Resolution 85-18) In 2008 the METRO Board voted to approve the fare structure
shown below for Fiscal Years 2009 through 2011 (Resolution 2008-77).
Board-Approved Fare Structure: Resolution 2008-77
FY2009
Fare
FY2010
Fare
Increase
from
FY2009
% Change
from
FY2009
Local/
METRORail
$1.25
$1.30
$0.05
4%
Zone 1
$2.00
$2.10
$0.10
5%
Zone 2
$3.25
$3.40
$0.15
5%
Zone 3
$3.75
$3.90
$0.15
4%
Zone 4
$4.50
$4.70
$0.20
4%
All fares are rounded to the nearest nickel, dime, or quarter.
FY2011
Fare
Increase
from
FY2010
% Change
from
FY2010
$1.35
$2.20
$3.55
$4.10
$4.90
$0.05
$0.10
$0.15
$0.20
$0.20
4%
5%
4%
5%
4%
Although the above Board action in 2009 allowed METRO to implement fare increases
of 4 – 5% in both FY2010 and FY2011, the fares were not raised in FY2010 and will not
be raised in FY2011 either.
Page 62
Business Plan & Budgets FY2011
Authority Level
Budget Elements to Note - Capitalization
The Government Accounting Standard Board (GASB) introduced strict Fixed Assets
accounting rules effective after METRO’s fiscal year 2009 closed. These rules are
intended to reduce inconsistencies while establishing comparability in accounting and
financial reporting requirements among State and local governments. Inconsistencies
noted in the reporting of intangible capital assets include recognition, initial
measurement, and amortization. For example, the accounting and financial reporting of
intangible assets, such as software, will have a significant impact on METRO’s
Information Technology operating expense.
A review of FY2010 revealed
approximately $3 million in capitalized cost associated with software that will be
transferred to operating expense.
KPMG, METRO’s external auditors, in consideration of GASB’s stricter stance on Fixed
Assets and consistencies with other transit agencies, has advised METRO to tighten its
current classification criteria for allocation of costs to Capital Projects. The effect of
these changes is expected to transfer approximately $27 million in cost from the Capital
Program budget to the Operating budget.
Implementation Challenges:
•
•
•
•
Identification of non-capitalizable costs for active projects
Development of new overhead allocation rates to meet both Generally Accepted
Accounting Principles (GAAP) and National Transit Database (NTD)
requirements
Identification of retroactive implementation requirements
Meeting Financial Statement disclosure requirements
Page 63
Business Plan & Budgets FY2011
Authority Level
Budget Methodology
Total Operating Expenses:
The Total Operating Expense is the sum of all employee labor, the cost of supporting
that labor (e.g., insurance, space, utilities, etc.), and the direct costs for operating the
bus and rail system, including purchased transportation and the support vehicles (parts,
fuel, tires, batteries, other materials, etc.). This total also includes the labor expenses of
METRO employees working on capital improvement projects.
METRO allocates the Total Operating Expenses into four areas on a full-cost basis:
Transit, Traffic Management, Expensed Small Capital Purchases, and Capital. The
combination of the Transit, Traffic Management, and Expensed Small Capital
Purchases comprise the Operating Budget.
Page 64
Business Plan & Budgets FY2011
Authority Level
Budget Methodology (Con’t)
Operating Budget:
•
Transit: This category refers to the full cost of operating, maintaining, and
securing the bus and rail system (Local, Park & Ride, Rail, METROLift, and
METRO STAR Vanpool) less any service cost allocated to Capital.
•
Traffic Management: The full cost of congestion management activities, including
the operation and enforcement on the HOV System, major activity center traffic
management, and METRO’s share of the operational expenses used to run the
Transtar facility.
•
Expensed Small Capital Purchases: METRO recognizes capital purchases less
than $1,000 under this category. The sum of the purchases are not rolled into
Transit operating costs or Traffic Management operating costs, but it is included
in the Board-approved Operating Budget. The purpose of this category is to
reduce the cost of inventorying, tracking, and accounting for small value capital
purchases.
Page 65
Business Plan & Budgets FY2011
Authority Level
Budget Methodology (Con’t)
Capital Program:
From the Operating Expenses, METRO transfers individual capital purchases that have
a cost of $1,000 or greater to Capital, where it is recorded as an asset and appropriately
depreciated over its expected life. This capitalized amount is then combined with
METRO’s labor and support costs to plan, manage, and implement Capital
Improvements, METRO Rail Expansion, General Mobility, Debt Service plus any of
METRO’s labor and support costs for bus service funded by formula and CMAQ capital
funds. The sum of this total amount is referred to as the Capital Program.
The Debt Service budget was established to support the bonds and master lease
programs for capital items and the accruing interest of any outstanding commercial
paper.
Page 66
Business Plan & Budgets FY2011
SERVICE PLAN
\
Page 67
Business Plan & Budgets FY2011
Authority Level
Service Plan
The FY2011 Transit Service Plan attempts to expand ridership and meet the growing
demand for METRO services by reallocating unproductive service to other existing or
new routes that have the potential for higher ridership. A majority of the service
reductions occurred in the August 2010 Service Change, where a large number of
individual trips with very low ridership were discontinued. In January 2011, two of
METRO’s worst performing routes are proposed to be discontinued entirely and
replaced with a taxicab voucher program. A third poorly performing route is proposed to
be discontinued in June 2011 and replaced with a similar type program.
While there are several service improvements in the August 2010 Service Change, a
majority of the planned improvements will be implemented in the January and June
2011 Service Changes. Overall, service is proposed to be enhanced in FY2011 utilizing
the following strategies:
•
•
•
•
•
Adding new routes where there is proven demand
Expansion of service into new markets
Increasing frequency to match demand
Discontinuation/redeployment and adjustment of unproductive services
Ongoing adjustment of schedules to improve on-time performance
Park & Ride Services
A new Park & Ride service between Brazoria County and the TMC Transit Center is
expected during FY2011. While METRO searches for a site on which to build a
permanent Park & Ride facility, service is proposed to be initiated to one of several
temporary locations under consideration. This new route will operate weekdays only,
providing peak direction service. Job Access Reverse Commute (JARC) funds received
by Connect Transit, in addition to funding from the City of Pearland and anticipated fare
revenue, are expected to completely cover METRO’s operating cost for providing this
service.
Local Services
Several additional local services are proposed to be added in FY2011. The Washington
Avenue Shuttle will provide late night service to an increasingly active social scene
along Washington Avenue. Building on the successful implementation of weekday only
service on the 32 Renwick in June 2009, Saturday service is proposed to be added.
Several routes will also be extended to provide service to new areas that are currently
underserved by transit, including the 87 Sunnyside along Reed Road and the 4
Beechnut to S.H. 6. Finally, several other local routes will be restructured slightly to
make them easier for customers to understand.
Page 68
Business Plan & Budgets FY2011
Authority Level
Service Plan (Con’t)
The first will be in the northwest portion of Houston where the 58 Hammerly, 46
Gessner, and 36 Kempwood will be simplified.
The second will be the 9 Gulfton, where a one-way loop will be eliminated and replaced
with bi-directional service to better serve a school, medical facility, and new community
center.
Schedule Enhancements
On the 137 Northshore, wait time for customers will be reduced and some standing
loads eliminated on Saturdays and Sundays by improving the frequency of those
services. Two earlier morning trips on the 426 Swiftline will also be added, which were
requested by TMC employees after the route’s implementation in August 2009. During
each of the three service changes in FY2011, staff has set aside a small amount of
funding to adjust schedules as needed to address changing route conditions, street
construction delays, etc.
Route Eliminations
During FY2011, three poorly performing routes are recommended for discontinuation:
the 38 Manchester, 39 Parker, and 64 Lincoln City. As part of the Transit Service Plan,
staff will examine the possibility of implementing a new taxi voucher system to replace
these poorly performing routes to maintain service to those customers in a more costeffective manner.
The results of the above changes are reflected in the revenue hours of service
summarized as follows:
Annual Revenue Hours of Service
FY 2011*
New
Service
Annualized
FY2010
Budget
FY2010
Estimate
FY2011
Budget
Difference
Fixed Route: Bus
Fixed Route: Rail
FixedRoute Total
2,839,909
64,565
2,904,474
2,843,822
64,493
2,908,315
2,849,256
64,672
2,913,928
5,434
179
5,613
2,856,298
64,672
2,920,970
METROLift
Internal Service
Total
816,902
489
3,721,865
824,597
709
3,733,621
835,526
709
3,750,163
10,929
0
16,542
835,526
709
3,757,205
FY10 Estimate
vs. FY11
Budget
*FY2011 includes new service
Maps of the key changes proposed in the FY2011 Transit Service Plan, along with
additional details of each, are included on the following pages.
Page 69
Business Plan & Budgets FY2011
Authority Level
Service Plan (Con’t)
Service Plan: Total Service Hours
Revenue Hours in Thousands: Bus + Rail + Special Bus
4,000
3,800
3,600
3,400
3,200
3,000
1999
2000
2001
2002
2003
2004
2005
2006
2007
2008
2009
2010
2011
(Estimate) (Budget)
Page 70
Business Plan & Budgets FY2011
Authority Level
Service Plan (Con’t)
S.H. 288/Brazoria County P&R Service
Route Characteristics
• Operates between the TMC and a proposed Park & Ride lot along the growing
S.H. 288 corridor
• Weekdays, peak direction service
• First Year Ridership – 131,472
• Annual Fare Revenue of $212,985, plus $411,734 in JARC revenues or City of
Pearland funding
Benefits
• Last major freeway corridor in Houston without Park & Ride service
• Zip codes adjacent to proposed lot contain the largest residential concentration of
TMC employees
Page 71
Business Plan & Budgets FY2011
Authority Level
Service Plan (Con’t)
Washington Avenue Shuttle
Route Characteristics
• Circulates between Downtown, along Washington Avenue to the Westcott traffic
circle
• Serves expanding venue of restaurants and night clubs
• Enhance and supplement corridor service in coordination with the current private
service provider, The Wave, and local community interests
• Operates Wednesday through Saturday nights
• Annual Ridership – 13,007
• Annual Revenue - $7,804
Benefits
• Helps address parking shortage in rapidly revitalizing area
Page 72
Business Plan & Budgets FY2011
Authority Level
Service Plan (Con’t)
426 Swiftline
Route Change Characteristics
• Add two early morning trips between the Southeast and TMC Transit Centers, to
provide earlier service. This was a frequent request of the initial passenger
satisfaction survey
• Operates Weekdays
• Annual Ridership – 3,036
• Annual Revenue - $1,822
Benefits
• Improves access to earlier morning work start times
Page 73
Business Plan & Budgets FY2011
Authority Level
Service Plan (Con’t)
Extension of 87 Sunnyside
Route Change Characteristics
• Extends the 87 along Reed Road to service a residential neighborhood and two
new apartment complexes (one senior and one mixed age). This has been
requested in several neighborhood meetings
• Operates 7 days a week
• Annual Ridership – 12,331
• Annual Revenue - $7,399
Benefits
• Connects residents to 52 Scott, 30 Cullen, 352 Swingle, and the TMC
• Would allow the northbound 52 Scott to be removed from Rosehaven and bidirectional service to be added to Scott
• Necessary for future extension of the 52 Scott to the MLK Health Center
Page 74
Business Plan & Budgets FY2011
Authority Level
Service Plan (Con’t)
Northwest Restructuring of 36 / 46 / 58
Route Change Characteristics
• Restructure the northern/western terminal loops of the 36 Kempwood, 46
Gessner, and 58 Hammerly. Routes would be changed so that a single route
operates along each individual corridor
• Operates 7 days a week
• Annual Ridership – 44,545
• Annual Revenue - $26,727
Benefits
• This will simplify all three routes for customers, resulting in fewer branches,
resolving community complaints, and making METRO service easier to
understand
• All day service would be provided to Goodwill Industries on Hammerly, instead of
the peak only service it currently receives
Page 75
Business Plan & Budgets FY2011
Authority Level
Service Plan (Con’t)
9 Gulfton
Route Change Characteristics
• Currently the 9 Gulfton operates via a one-way loop, shown inside the dashed
circle on the map
• Revised alignment would operate via Rookin / Highstar in both directions
• Operates Weekdays and Saturdays
• Annual Ridership – 4,705
• Annual Revenue - $2,823
Benefits
• Provides two-way service to a hospital/health center, and the new Baker-Ripley
Neighborhood Center
• Simplifies the route and makes METRO easier to understand by providing bidirectional service
Page 76
Business Plan & Budgets FY2011
Authority Level
Service Plan (Con’t)
137 Northshore Weekend Headway Improvement
Route Change Characteristics
• Improves headways on the 137 from 50 minutes to 35 minutes on Saturdays and
Sundays, between approximately 9 AM and 8 PM
• Annual Ridership – 31,030
• Annual Revenue - $18,618
Benefits
• Allow customers to travel between Downtown and the east side of town with
reduced waiting time
• Would eliminate standing loads that occur regularly on the weekends
Page 77
Business Plan & Budgets FY2011
Authority Level
Service Plan (Con’t)
Miscellaneous Schedule Adjustments
Route Change Characteristics
• Provides limited operating funds to modify bus schedules in order to address
unforeseen on–time performance issues, construction delays, detours, etc., on a
timely basis
• Represents 5 weekday, 5 Saturday, and 5 Sunday hours of service, per service
change
• Would be available for implementation at each of the three regular service
changes
Benefits
• Improves system on-time performance
• Solves problems that regularly occur such as construction, changes to street
conditions, shifts in boardings and alightings
Page 78
Business Plan & Budgets FY2011
Authority Level
Service Plan (Con’t)
38 Manchester – Alternative Service
Route Characteristics
• Route has ranked in the bottom of the 4th quartile every year since inception in
2007
• Route has a subsidy per boarding of over $11.00
• Majority of route is duplicated by the 50 Harrisburg route
• Average daily boardings of 136, but only 22 along Manchester
• Annual Ridership – Loss of 6,831
• Annual Revenue – Loss of $4,099
• Could be replaced by a Taxicab Voucher program
Page 79
Business Plan & Budgets FY2011
Authority Level
Service Plan (Con’t)
39 Parker – Alternative Service
Route Characteristics
• Route has ranked in the bottom of the 4th quartile every year since inception in
2007
• Route has a subsidy per boarding of almost $27.00
• Average daily boardings of 34
• Annual Ridership – Loss of 5,060
• Annual Revenue – Loss of $3,036
• Could be replaced by a Taxicab Voucher program
Page 80
Business Plan & Budgets FY2011
Authority Level
Service Plan (Con’t)
4 Beechnut Extension
Route Characteristics
• Extends the 4 Beechnut from the current layover to State Highway 6
• 7 days a week
• Annual Ridership – 192,524
• Annual Revenue - $115,514
Benefits
• Provides customers with improved access to retail/commercial activities along
S.H. 6, including HEB & Fiesta, and provides a connection to the 2 Bellaire
• Removes service from Wellington Park neighborhood, where some residents
have petitioned for the removal of METRO bus service
Page 81
Business Plan & Budgets FY2011
Authority Level
Service Plan (Con’t)
32 Renwick
Route Characteristics
• Add Saturday service to the 32 Renwick, between 7 AM and 7 PM
• This was a frequent request in METRO’s initial customer satisfaction survey
• Annual Ridership – 26,594
• Annual Revenue - $15,956
Benefits
• Daily ridership has already climbed into the low 900’s for a typical weekday
• Implementing Saturday service should also increase weekday ridership
Page 82
Business Plan & Budgets FY2011
Authority Level
Service Plan (Con’t)
64 Lincoln City – Alternative Service
Route Characteristics
• This route has consistently ranked in the bottom of the 4th quartile
• Route has a subsidy per passenger of over $19.00
• Majority of route is within walking distance of the 44 Acres Homes, 79 West Little
York, or the 40 Pecore
• Average daily boardings of 258; all are within ½ mile; 222 are within ¼ mile of
other local routes
• Annual Ridership –Loss of 29,348
• Annual Revenue – Loss of $17,609
• Could be replaced by a Taxicab Voucher program
Page 83
Business Plan & Budgets FY2011
Authority Level
Service Plan (Con’t)
52 Scott
Route Characteristics
• Extends the 52 Scott to the Martin Luther King (MLK) Health Clinic, replacing the
352 Swingle route
• When Harris County completes the Scott Street road improvements and
extension, select 52 trips would be extended to the clinic
• Extension to clinic would only operate on Weekdays
• Annual Ridership – 6,325
• Annual Revenue - $3,795
Benefits
• This change would provide direct connection between the clinic and the
Southeast Transit Center
• Having one principal route on Scott Street is easier for customers to understand
Page 84
Business Plan & Budgets FY2011
Authority Level
Service Plan (Con’t)
FY2011 Service Levels
Fixed Route
Resource
Revenue Miles
Revenue Hours
Total Miles
Total Hours
Number of Vans
METRO First Transit
Bus
Bus (1) Total Bus
32,704,089
8,449,493
2,277,653
571,602
38,661,174
10,463,871
2,513,172
644,441
Special Bus
Rail
41,153,582 758,659
Total Bus Internal
and Rail Service (2) METROLift METROVan
41,912,241
4,795
14,543,836
-
64,672
2,913,928
709
835,526
-
49,125,045 761,236
49,886,281
4,795
16,530,825
-
3,223,166
709
912,847
-
2,849,256
3,157,613
65,553
758
FY2010 Service Levels - Estimate
Fixed Route
Resource
Revenue Miles
Revenue Hours
Total Miles
Total Hours
Number of Vans
METRO First Transit
Bus
Bus (1) Total Bus
32,682,825
8,706,615
2,267,947
575,876
38,633,501
10,742,080
2,504,042
648,784
Special Bus
Rail
41,389,439 754,459
2,843,822
Total Bus Internal
and Rail Service (2) METROLift METROVan
42,143,899
4,795
14,329,719
-
64,493
2,908,316
709
824,597
-
49,375,581 757,190
50,132,771
4,795
16,295,484
-
3,218,198
709
900,026
-
3,152,826
65,371
708
FY2010 Service Levels - Budget
Fixed Route
Resource
Revenue Miles
Revenue Hours
Total Miles
Total Hours
Number of Vans
METRO First Transit
Bus
Bus (1) Total Bus
32,869,295
8,585,124
2,274,918
564,991
38,936,746
10,612,052
2,518,716
637,073
Special Bus
Rail
41,454,419 763,106
2,839,909
Total Bus Internal
and Rail Service (2) METROLift METROVan
42,217,525
3,371
14,208,262
-
64,565
2,904,474
489
816,902
-
49,548,798 765,706
50,314,504
3,371
16,061,730
-
3,221,234
489
894,217
-
3,155,789
65,445
840
(1) First Transit excludes Northwest Shuttle Service. METRO does not pay for this service.
(2) Special Events service discontinued per new FTA guidelines
Page 85
Business Plan & Budgets FY2011
Authority Level
Service Plan (Con’t)
Change to Service Levels: FY2010 Estimate to FY2011 Proposed Budget
Fixed Route
Resource
Revenue Miles
Revenue Hours
Total Miles
Total Hours
Number of Vans
METRO First Transit
Bus
Bus
Total Bus
Special Bus
Rail
Total Bus Internal
and Rail Service (2) METROLift METROVan
21,264
(257,122)
(235,857)
4,200
(231,658)
-
214,117
9,707
(4,273)
5,433
179
5,612
-
10,929
27,673
(278,210)
(250,536)
4,046
(246,490)
-
235,341
9,130
(4,343)
4,787
181
4,968
-
12,821
50
Fixed Route
Resource
Revenue Miles
Revenue Hours
Total Miles
Total Hours
Number of Vans
METRO First Transit
Bus
Bus
Total Bus
Special Bus
Rail
Total Bus Internal
and Rail Service (2) METROLift METROVan
0.07%
-2.95%
-0.57%
0.56%
-0.55%
0.00%
1.49%
0.43%
-0.74%
0.19%
0.28%
0.19%
0.00%
1.33%
0.07%
-2.59%
-0.51%
0.53%
-0.49%
0.00%
1.44%
0.36%
-0.67%
0.15%
0.28%
0.15%
0.00%
1.42%
7.05%
Change to Service Levels: FY2010 Budget to FY2011 Proposed Budget
Fixed Route
Resource
Revenue Miles
Revenue Hours
Total Miles
Total Hours
Number of Vans
METRO First Transit
Bus
Bus
Total Bus
(165,206)
(135,631)
(300,837)
Special Bus
Rail
(4,447)
Total Bus Internal
and Rail Service (2) METROLift METROVan
(305,284)
Revenue Miles
Revenue Hours
Total Miles
Total Hours
Number of Vans
335,574
2,735
6,611
9,347
107
9,454
220
18,624
(275,572)
(148,181)
(423,753)
(4,470)
(428,223)
1,424
469,095
(5,544)
7,368
1,824
108
1,932
220
18,630
(82)
Fixed Route
Resource
1,424
METRO First Transit
Bus
Bus
Total Bus
Special Bus
Rail
Total Bus Internal
and Rail Service (2) METROLift METROVan
-0.50%
-1.58%
-0.73%
-0.58%
-0.72%
100.00%
2.36%
0.12%
1.17%
0.33%
0.17%
0.33%
100.00%
2.28%
-0.71%
-1.40%
-0.86%
-0.58%
-0.85%
100.00%
2.92%
-0.22%
1.16%
0.06%
0.16%
0.06%
100.00%
2.08%
-9.77%
Page 86
Business Plan & Budgets FY2011
Authority Level
Key Performance Indicators
Key Performance Indicator
On-Time Performance (Service Reliability)
● Bus - Local
FY2010
Goal
YTD
August
FY2010
Actual
FY2011
Goal
66%
67%
67%
● Bus - Park & Ride
● Bus - Weighted Average
70%
67%
77%
70%
75%
69%
● Rail
96%
97%
96%
6,350
7,797
6,600
552
462
528
0.84
0.74
0.81
41
30
39
5.35
3.50
5.12
20,088
16,157
17,000
0.0221%
0.0218%
0.0215%
600
0.659
312
0.421
540
0.684
384
183
336
0.422
0.247
0.426
1 minute or
less
48
seconds
1 minute
or less
Mean Distance Between Mechanical
Failures (all buses)
Bus Accidents
● Absolute Number
● Per 100,000 Vehicle Miles
Rail Accidents
● Absolute Number
● Per 100,000 Vehicle Miles
Complaint Contacts
● Absolute Number
● As A Percent Of Boardings
Major Security Incidents
● Total
● Per 100,000 Boardings
Major Security Incidents – METRO
Properties
● Total
● Per 100,000 Boardings
Average Call Center Answer Delay
Page 87
Business Plan & Budgets FY2011
Authority Level
Key Performance Indicators (Con’t)
The primary element in building a first-rate transit system is dedication to the quality of
its service. METRO has devoted itself to bringing transit passengers service that is
safe, clean, comfortable, reliable, attractive, and economical.
To maintain a sharp focus on quality, a number of quality indicators are tracked,
monitored, and reported throughout the year. Eight (8) of these quality indicators
focusing on different aspects of transit service are reported to the Board on a monthly
basis:
On-Time Performance (OTP): A local bus is considered on-time if it does not leave
early and is within a five (5) minute window after the scheduled departure time. A Park
& Ride bus is considered on-time if it does not depart early (except in the morning when
a bus can leave from a Park & Ride lot when full) and is within a five (5) minute window
after the scheduled departure time, with measurements during peak hours. OTP is
measured by the IVOMS system which calculates data to the second, and the five (5)
minute window is defined as anything less than six (6) minutes. For METRORail, a train
departing from the beginning of the line or arriving at the end of the line less than five
(5) minutes after the scheduled time is considered on-time.
Mean Distance Between Mechanical Failures (MDBF): MDBF mechanical roadcalls
are defined as any mechanical issue encountered during operation of the vehicle in
revenue service that requires a maintenance action resulting from a mechanical failure.
Mechanical failures include warranty and fleet defects but exclude accidents. This
indicator is for the bus system but excludes METROLift.
Bus and Rail Accidents: An accident is a transit incident with passenger injuries that
require immediate medical treatment away from the scene or a collision between a
revenue vehicle and an object such that the amount of damage exceeds $1,000. Bus
accidents (which include METROLift) and rail accidents are reported separately and in
terms of the absolute number of accidents and the relative number of accidents per
100,000 vehicle miles. Rail accidents only reflect collisions between METRORail and
other vehicles.
Page 88
Business Plan & Budgets FY2011
Authority Level
Key Performance Indicators (Con’t)
Complaint Contacts: Patrons contact METRO’s Customer Information Center to
express dissatisfaction with METRO. Contacts made via telephone and over the
Internet which result in a complaint record being generated in the Public Comment
System are reported both in terms of the absolute number of contacts received and the
number of contacts as a percentage of total boardings.
Major Security Incidents: The total “Major Security Incidents” is based on two industry
standards: the Federal Bureau of Investigation (FBI) Uniform Crime Report and the
National Transit Database (NTD) Report issued by the Federal Transit Administration
(FTA). The eight (8) categories included are: homicide, forcible rape, robbery,
aggravated assault, burglary, larceny and theft, motor vehicle theft, and arson. This
metric is reported both in terms of the absolute number of incidents and the number of
incidents per 100,000 boardings.
Major Security Incidents – METRO Properties: The total “Major Security Incidents –
METRO Properties” is the number of incidents that occur at Park & Ride lots, Transit
Centers, onboard buses and trains, and on Light Rail Vehicle (LRV) platforms. This
metric is reported both in terms of the absolute number of incidents and the number of
incidents per 100,000 boardings.
Average Call Center Answer Delay: METRO is committed to providing customers
with accurate, customer-friendly bus and service information in a timely manner.
Customers may obtain bus information over METRO's website and by telephone using
an interactive voice response system without speaking to a representative and with no
customer wait time. For those customers who prefer to speak with a representative,
METRO's goal is to answer their call in 60 seconds or less. In addition to bus
information, METRO’s Customer Service/Information Center provides general
information, supports METRO Q® Fare Card requests, documents and researches
public comments, aids with Lost and Found inquiries, and provides general vanpool and
HOV information. In order to further improve customer service, several initiatives are
being put forth for FY2011. Plans include: introducing METROLift staff at neighborhood
centers to conduct METROLift In-Person Interviews and Assessments; creating a
Customer Care Team to ensure customer complaints are thoroughly documented,
investigated, and customers' issues are resolved; and placing a representative in the
RideStore to provide bus information and assistance.
Page 89
Business Plan & Budgets FY2011
Authority Level
Projected Ridership
(000’s)
Service Category
Fixed-Route Bus
Local
Park & Ride
Total Fixed-Route Bus
METRORail
Total Fixed-Route Bus and Rail
Special Bus Services
METROLift
Internal Services
METROVan
Total Special Bus Services
Total All Bus and Rail Services
HOV Carpools, Vanpools, and
Non-METRO Buses
TOTAL SYSTEM RIDERSHIP
FY2010
Estimate
Change
FY2011
Target FY2010 vs. FY2011
58,476
7,979
66,455
56,996
7,383
64,379
-1,480
-596
-2,076
-2.53%
-7.47%
-3.12%
10,574
10,497
-77
-0.73%
77,029
74,876
-2,153
-2.80%
1,541
4
2,449
3,994
1,571
4
2,488
4,063
30
0
39
69
1.95%
0.00%
1.59%
1.73%
81,023
78,939
-2,084
-2.57%
24,014
24,450
436
1.82%
105,037
103,389
-1,648
-1.57%
Note:
Fixed Route Services - Ridership
► The forecast includes approved FY2010 Transit Service Plan projects
► The forecast includes potential adjustments for the possible retirement of 60' buses
► The forecast includes potential adjustments for unemployment
Page 90
Business Plan & Budgets FY2011
Authority Level
Projected Ridership
METRO fixed-route ridership has declined annually since it peaked in FY2006. The
table below shows the annual ridership from FY2006 to FY2010:
Table 1. Fixed-Route Ridership – By Fiscal Year
By Fiscal Year
Boardings
Change
% Change
FY2006
98,518,251
FY2007
96,801,356
(1,716,895)
-1.7%
FY2008
96,348,287
(453,069)
-0.5%
FY2009
84,408,919
(11,939,368)
-12.4%
FY2010 (Estimated)
77,028,531
(7,380,388)
-8.7%
Combined Change
(21,489,720)
-21.8%
SOURCE: FY2006 – FY2009 from National Transit Database; FY2010 based on Fourth Quarter Ridership Forecast, 13-Sep-10.
The estimated FY2011 fixed-route ridership forecast as shown is a compilation of the
base case methodology based upon current ridership trends.
The base case for ridership extrapolates the existing data based upon historical
ridership trends. As shown above, the ridership trends are negative for the past four
years. Key factors contributing to the current trends are the continuing level of high
unemployment (8.8% in July 2010 which is identical to that for January 2010, but higher
than any single month unemployment rate since June 1994), impacts from fare
enforcement and fare changes, inclement weather, and lower than expected ridership
growth on new routes.
The continuing level of high unemployment is a critical factor affecting METRO
ridership. Beginning in September 2007, the unemployment rate has been higher each
month than the year before and has risen from 4.4% to the present 8.8%. This is a
100% increase in the unemployment rate at a time when the available workforce has
actually increased. Over 90% of METRO’s Park & Ride ridership and roughly 33% of
both Local and METRORail ridership involved work-related trips (2007 Transit Onboard
Survey Final Report for Houston-Galveston Area Council, September 2007). Simply
put, METRO loses work-related ridership when people no longer have work.
Increased fare enforcement on METRORail has resulted in increased fare revenues but
decreased ridership. As the current level of fare enforcement began in January 2010,
the revenue and ridership trends should be expected through at least the first quarter of
FY2011 (October – December 2010).
Page 91
Business Plan & Budgets FY2011
Authority Level
Projected Ridership
The fare restructuring and the 25% fare increase in FY2008 and FY2009 contributed to
significant ridership losses. METRO consultants estimated a – 11.6% ridership change
from the fare restructuring alone, a – 8.2% ridership change from the 25% fare increase,
and a – 19.7% ridership change from the combination. Using these estimates, the
expected FY2008 - FY2009 ridership change was – 12.0M boardings, while the actual
FY2008 - FY2009 ridership change was – 11.9M boardings. Although the majority of
the ridership losses associated with a fare change occur within the first 12 months
following implementation, METRO did continue to experience ridership loss on local
routes beyond the 12 month time period following the previous fare increase in October
1994.
Ridership growth on new routes has also lagged behind expectations. Some of the
ridership growth lag can be attributed to the unusually cold temperatures from
December 2009 – March 2010.
Additional adjustments for the estimated FY2011 fixed-route ridership forecast include:
the proposed FY2011 Transit Service Plan, the retirement of 60’ articulated buses
replaced one-for-one with 40’ buses, and changes in unemployment.
The proposed FY2011 Transit Service Plan includes three new services (Brazoria
County / TMC Park and Ride, Washington Avenue Circulator – Wednesday – Saturday
evenings, and 32 Renwick – Saturday) as well as route extensions and restructuring.
The combination of these services, improvements, and the reduction of bus trips with
low ridership will not increase the Operating Budget; however, these changes could
provide nearly 300,000 new boardings.
In an effort to standardize the bus fleet and reduce maintenance expenses, METRO is
proposing to retire the remaining 60’ articulated buses during mid-year FY2011. These
60’ articulated buses have 62 seats and can hold up to 84 customers including
standees. The proposed equipment replacement is 40’ buses having 38 seats and
holding up to 51 customers including standees on a one-for-one basis. The equipment
replacement plan would result in some customers being unable to board bus trips that
they currently ride. A ridership change of -40,000 boardings is forecast for FY2011.
Page 92
Business Plan & Budgets FY2011
Authority Level
Projected Ridership
As noted in the discussion of the base case, current local unemployment trends are not
favorable. With a work force of roughly 3 million people in the greater Houston
metropolitan area, each 1% increase in the unemployment rate results in roughly
30,000 more unemployed people. It is unreasonable to assume that continuation of this
trend will not affect METRO’s fixed-route ridership. With a 0.1% increase in the
unemployment rate month-to-month, the estimated ridership change could be –120,000
boardings annually.
Table 2. Estimated FY2011 Fixed-Route Ridership Forecast
Local
Park & Ride
Total - Bus
Light Rail
Total
Fixed Route
FY2010 Estimate
58,475,819
7,979,211
FY2011 - Base Case plus Potential Adjustments
66,455,030
10,573,500
77,028,531
Base Case
10,507,493
74,757,635
56,924,055
7,326,087
64,250,142
Transit Service Plan
Gasoline Prices
Retirement of 60'
Buses
147,198
-
131,472
-
278,670
-
Unemployment
Weather
(35,000)
-
(75,000)
-
(110,000)
-
(10,000)
-
56,996,253
7,382,559
64,378,812
10,497,493
Cumulative
(40,000)
-
(40,000)
-
278,670
-
(40,000)
-
(120,000)
74,876,305
SOURCE: FY2011 Business Plan, Estimated Fixed‐Route Bus and Rail Ridership Forecast, 13‐Sepl‐10 Page 93
Business Plan & Budgets FY2011
Authority Level
Organization Structure
A plan for restructuring the current organization is underway. High level charts outlining the
resulting structure are attached.
The plan will come into effect at the beginning of FY2011 and the current departmental
budgets will be rearranged to match the new structure. There will be no change to the total
Authority budget.
The restructuring is designed to increase transparency and accountability, focus us on our
core mission as stated in our Strategic Priorities and promote greater partnering within the
company. It is intended to help us make better use of our human resources, as well as the
taxpayer and customer dollars for which we are stewards. It will make us more easily
understood by the community and allow us to be a more effective partner with others
engaged in providing transit services that promote mobility in our region.
Page 94
Business Plan & Budgets FY2011
Authority Level
Organizational Chart
BOARD OF DIRECTORS
Capital Programs
Customer Service
People
Finance & Audit
Gov’t & Public Affairs
Strategic Leadership Council
Tactical Leadership Council
PRESIDENT & CEO
Diversity Council
Customer Advisory Council
Executive
Assistant
EEO
SERVICE DESIGN
& DEVELOPMENT
Board
Liaison
Press
Office
Gov’t
Affairs
Constituent
Service
CHIEF ADMINISTRATIVE OFFICER
Partnering
Strategy
AUDIT
SERVICE
DELIVERY
METRO
POLICE
PERFORMANCE
IMPROVEMENT
FINANCE
DEPARTMENT
CAPITAL
PROGRAMS
BUSINESS
SERVICES
SAFETY
LAW
DEPARTMENT
Total Authorized: 3,587
Page 95
Business Plan & Budgets FY2011
Authority Level
Organizational Chart (Con’t)
PRESIDENT & CEO
SERVICE DESIGN &
DEVELOPMENT
SYSTEM PLANNING &
DEVELOPMENT
LONG-RANGE
PLANNING
SERVICE PLANNING &
DEVELOPMENT
SHORT-RANGE
PLANNING
SCHEDULING
COMMUNITY OUTREACH
&
STAKEHOLDER AFFAIRS
Total Authorized: 43
Page 96
Business Plan & Budgets FY2011
Authority Level
Organizational Chart (Con’t)
PRESIDENT & CEO
SERVICE
DELIVERY
METRO Rail
RAIL
TRANSPORATION
RAIL
MAINTENANCE
METROLIFT
METRO STAR
VANPOOL
CUSTOMER CARE
&
CUSTOMIZED SVC.
CUSTOMER
CARE – CALL
CTR, COMPL. RES.
LABOR
RELATIONS
CONTRACT
OPERATED
BUS SERVICE
METRO BUS
BUS
TRANSPORTATION
BUS
MAINTENANCE
OPERATIONS
MANAGEMENT
SUPPORT
Total Authorized: 2,700
SERVICE DELIVERY
BUDGET
REVENUE
COLLECTION,
RIDESTORE, SALES
Page 97
Business Plan & Budgets FY2011
Authority Level
Organizational Chart (Con’t)
PRESIDENT & CEO
CAPITAL
PROGRAMS
METRO RAIL
EXPANSION
CAPITAL
PROJECTS
STATE OF
GOOD REPAIR
Total Authorized: 67
Page 98
Business Plan & Budgets FY2011
Authority Level
Organizational Chart (Con’t)
PRESIDENT & CEO
CHIEF ADMINISTRATIVE OFFICER
METRO POLICE
TRANSTAR
FIELD
OPERATIONS
HOMELAND
SECURITY
MANAGEMENT
SERVICES
EMERGENCY
MANAGEMENT
Total Authorized: 237
Page 99
Business Plan & Budgets FY2011
Authority Level
Organizational Chart (Con’t)
PRESIDENT & CEO
CHIEF ADMINISTRATIVE OFFICER
PERFORMANCE
IMPROVEMENT
BEST TECHNOLOGY
& MANAGEMENT
PRACTICES
BUSINESS
PROCESS
REENGINEERING
SUSTAINABILITY
Page 100
Business Plan & Budgets FY2011
Authority Level
Organizational Chart (Con’t)
PRESIDENT & CEO
CHIEF ADMINISTRATIVE OFFICER
BUSINESS SERVICES
IT
MARKETING
/CORPORATE
COMMUNICATION
HUMAN
RESOURCES
& DIVERSITY
REAL ESTATE &
PROPERTY
MANAGEMENT
FACILITY
MAINTENANCE
SMALL
BUSINESS
RECORDS
MANAGEMENT
PROCUREMENT
PRINT
SERVICES
Total Authorized: 387
Page 101
Business Plan & Budgets FY2011
Authority Level
Organizational Chart (Con’t)
PRESIDENT & CEO
CHIEF ADMINISTRATIVE OFFICER
SAFETY
CUSTOMER
SAFETY
RISK
MANAGEMENT
HEALTH
SAFETY
TRAINING
DESIGN &
DELIVERY
WORKPLACE SAFETY
& ENVIRONMENTAL
SAFETY
Total Authorized: 42
Page 102
Business Plan & Budgets FY2011
Authority Level
Organizational Chart (Con’t)
PRESIDENT & CEO
LAW
Total Authorized: 14
Page 103
Business Plan & Budgets FY2011
Authority Level
Organizational Chart (Con’t)
PRESIDENT & CEO
FINANCE
BUDGET
ACCOUNTING
GRANTS
TREASURY
Total Authorized: 77
Page 104
Business Plan & Budgets FY2011
Authority Level
Organizational Chart (Con’t)
BOARD OF DIRECTORS
PRESIDENT & CEO
AUDIT
INFORMATION
TECHNOLOGY
INTERNAL
FUNCTIONS
MS II
QA OVERSIGHT
Total Authorized: 11
Page 105
Business Plan & Budgets FY2011
Authority Level
Organizational Chart (Con’t)
BOARD OF DIRECTORS
PRESIDENT & CEO
Executive
Assistant
EEO
Board
Liaison
Press
Office
Government
Affairs
Constituent
Service
Partnering
Strategy
Total Authorized: 9
Page 106
Business Plan & Budgets FY2011
Authority Level
Manpower Summary
Authority
Service Delivery
Service Delivery Full-time
Service Delivery Part-time
Capital Programs
Service Design & Development
METRO Police
Business Services
Safety
Performance Improvement
Finance
Law
Audit
Chief Admin. Officer
Executive Office
Total Full-Time
Total Part-Time
FY2010
Auth.
FTE
FY2011
Auth.
FTE
2,300
381
66
42
240
385
43
0
78
16
11
5
9
3,195
2,276.9
233.9
55.0
43.0
232.0
371.7
39.0
0.0
74
13.7
11.0
4.8
9.0
3,130.1
2,319
381
67
43
237
385
42
0
77
14
11
2
9
3,206
2,317.5
213.5
67.0
43.0
232.0
385.0
41.5
0.0
77
14.0
11.0
2.0
9.0
3,199.0
381
233.9
381
213.5
Auth. = Number of authorized full-time and part-time positions at the end of the year.
FTE = Full-time equivalent employees in person years for the total fiscal year.
*Part-time personnel work varied hours up to 32 hours per week.
Manpower Added/Deleted
Service Delivery
Union
FT Bus Mechanics
FT Rail Operators
Support Vehicle Cleaners
Support Vehicle Technicians
NonUnion
Construction Coordinator
Superintendent Support Vehicles
General Foreman Support Vehicles
Electronic Communications Specialists
Electronic Systems Specialists
Executive Assistant V
RideStore Sales Associates
Revenue Collection Foreman
Labor Relations Specialist
Rail Training Instructor
FY2011
Additions
Deletions
-15
-2
2
12
-1
1
1
6
5
1
6
1
1
1
Page 107
Business Plan & Budgets FY2011
Authority Level
Manpower Summary (Con’t)
FY2011
Manpower Added/Deleted
Capital Programs
Manager, Construction Services
Service Design & Development
Senior Cad Technician
METRO Police
Safety & Security Data Analyst
System Support Specialist
HOVL Supervisor
Police Officer
Business Services
Materials Coordinator FSC
Contracts Admin I
Buyer-Materials 2
Sr. Contracts Administrator
NRV Foreman
NRV Storeroom Attendant
Graphic Designer
Corporate & Organizational Development Manager
Compensation Analyst
Employee Advocacy Officer
Wellness Coordinator
Records Manager
Safety
System Safety Officer
Finance
Director of Revenue
Law
VP Corporate Development
EA V Corporate Development
Chief Admin. Officer
Associate Vice President
Director, Strategic Technology
Strategic & Tactical Project Coord.
Subtotal
Additions
Deletions
1
1
1
1
-1
-4
-1
-1
-1
-1
1
1
1
1
1
-1
-1
1
-1
-1
-1
-1
-1
-1
-1
47
-36
Page 108
Business Plan & Budgets FY2011
Financial Proforma
Projected Cash Flow
Projected Cash Flow
Revenues
Fares
Sales Tax Income
Interest Income
(1)
(2)
Grants Income
Commercial Paper
Total Revenue FY2011
Debt Funding
Beginning Fund Balance
Total Sources
(3)
Expenditures
Operating Expenses – Transit & Traffic
Capitalized Operating Expenses
Total Operating Expenditures
FY2011
$ millions
62.600
499.207
0.524
147.586
0.000
709.917
161.187
84.121
955.225
354.903
53.812
408.715
General Mobility
186.341
Capital Improvement Program Budget
METRO Rail Expansion
Subtotal Capital Expenditures
104.076
143.571
247.647
Debt Service
Total Expenditures FY2011
47.719
890.422
64.803
Ending Fund Balance
Total Uses
(3)
955.225
Page 109
Business Plan & Budgets FY2011
Financial Proforma
Projected Cash Flow (Con’t)
No commercial paper is used in the cash flow to balance sources and uses. The
Capital Budget assumes the use of up to $161.187M from financing sources. This cash
flow assumes a minimal holding in METRO’s investment portfolio.
Note:
(1)
(2)
(3)
For fiscal conservatism, projected cash flow uses sales tax revenue of
$499.207M. Barton Smith’s June 2010 projection for FY2011 is $502.470M.
Includes capital projects and capitalized operating expenses.
METRO Board approved Debt Policy adopted June 2005 sets minimum target
fiscal year ending fund balance (cash and investment portfolio) at 15% of the
forward 12 month operating expenditures which is $53.235M. To this is added
the following: Reserves of $11.568M not to be used in FY2011 will be
maintained to bring the total minimum balance to $64.803M.
Page 110
Business Plan & Budgets FY2011
Financial Proforma
Debt Service Summary
FY2011
Debt
Service
Type of Debt
Purpose
Commercial Paper
General Mobility
Principal,
Reserve
Interest &
Funding
Fees
$ 167,000,000 $ 3,474,918 $
-
Interest
Subsidy
Par Value
Grant
Funding
Total FY2011 Available for
Debt Service Debt Service
$
-
$ 3,474,918 $
Sales & Use Tax Contractual
Obligations Series 2009D
40 Orion HEV Buses
$ 35,050,000 $ 3,714,775 $ 619,469 $
20 MCI HEV Buses
-
$ 4,334,244 $ 3,084,000
Sales & Use Tax Contractual
Obligations Series 2010A
80 Orion HEV Buses $ 40,290,000 $ 1,529,819 $ 742,008 $
-
$ 2,271,827 $ 1,270,000
-
$ 6,776,244 $ 4,266,000
-
$ 5,156,375 $ 4,280,000
-
$ 22,013,608 $ 12,900,000
$ 42,780,000 $ 2,960,900 $ 493,483 $
-
$ 3,454,383 $
-
$ 94,465,000 $ 7,451,225 $ 990,906 $
-
$ 8,442,131 $
-
$ 82,555,000 $ 5,675,656 $ 865,974 $ (1,986,480) $ 4,555,150 $
-
$ 462,000,000 $ 8,775,136 $
-
$
-
$ 8,775,136 $
-
$ 23,000,000 $ 478,592 $
-
$
-
$ 478,592 $
-
$ 704,800,000 $ 25,341,509 $ 2,350,363 $ (1,986,480) $ 25,705,392 $
-
Certificates of Participation (COPS) 46 Orion HEV Buses
$ 62,255,000 $ 6,776,244 $
Series 2008A
52 MCI HEV Buses
-
$
Certificates of Participation (COPS) 10 Signature Orions
$ 45,785,000 $ 5,156,375 $
- $
Series 2008B
50 MCI HEV
Total Non-METRO Rail Expansion
$ 350,380,000 $ 20,652,131 $ 1,361,477 $
Sales & Use Tax Contractual
Obligations Series 2009B
Sales & Use Tax Bonds Series
2009A
Sales & Use Tax Bonds Series
2009C - Build America Bonds
Future FY2011 Sales & Use Tax
Bonds/Revenue Appropriation
Bonds
Commercial Paper
Total METRO Rail Expansion
Total Debt
Rail Vehicles & SetUp
NTP #1 North and
Southeast Corridors
NTP #1 North and
Southeast Corridors
NTP #1 North and
Southeast Corridors,
East End
METRORail
Expansion
-
$ 1,055,180,000 $ 45,993,640 $ 3,711,840 $ (1,986,480) $ 47,719,000 $ 12,900,000
Notes:
1. The Debt schedule was prepared using cash basis
2. Debt for new buses issued in FY2011 with first payment due in FY2012
Page 111
Business Plan & Budgets FY2011
Financial Proforma
Sales Tax Projection
($000's)
Projected Sales Tax
Revenue
Rate of Change
from Prior Year
FY2010
FY2011
FY2012
FY2013
$ 481,721
$ 499,207
$ 527,312
$ 553,784
NA
3.6%
5.6%
5.0%
NOTES ON THE SALES TAX PROJECTION:
1. The above FY2011 Sales Tax figure is also used in both METRO's Projected
Cash Flow and Sources and Uses of Funds.
2. The methodology of the above projection uses the FY2010 budgeted amount of
sales tax revenue as its base and then applies the growth rate presented in the
June 2010 Edition of the METRO-commissioned quarterly analysis by Dr.
Barton Smith, Professor of Economics at the University of Houston. In this
report, Dr. Smith forecasts sales tax revenue, net of rebates, to be:
($000’s omitted)
FY2010
FY2011
FY2012
FY2013
$484,869
$502,470
$530,759
$557,403
(Base Figure)
3.6%
5.6%
5.0%
3. In the report, Dr. Smith projects the Houston economy will continue to proceed
towards recovery and experience some sense of normalcy by FY2012.
4. FY2007 sales tax revenue actual = $481.721M
FY2008 sales tax revenue actual = $521.179M
FY2009 sales tax revenue actual = $517.973M
Page 112
Business Plan & Budgets FY2011
Financial Proforma
Sources & Uses of Funds (Income Statement)
Per GAAP format
($000's)
FY2010
FY2011
Budget
Projection
Difference
FY10 Budget
vs. FY2011
Proj.
67,941
481,721
1,993
297,027
322
62,600
499,207
524
147,586
0
-5,341
17,486
-1,469
-149,441
-322
849,004
709,917
-139,087
383,812
383,812
408,715
408,715
24,903
24,903
General Mobility
Transit Mobility Street/Traffic Related
151,694
2,400
186,341
1,481
34,647
-919
TOTAL EXPENSES
537,906
596,537
58,631
Net before Depreciation
311,098
113,380
-197,718
Depreciation and Loss on Disposal
of Fixed Assets
Net after Depreciation
139,000
172,098
129,081
-15,701
-9,919
-187,799
Revenues
Fares
Sales Tax Income (Accrual Basis)
Interest Income
Grants Income
Other Income
TOTAL REVENUES
Expenses
Transit Operating
Subtotal Operating
Page 113
Business Plan & Budgets FY2011
Financial Proforma
Balance Sheet (GAAP)
($000's)
Estimated
September 2010
Projected
September 2011
Assets
Cash
Receivables
Inventory
Investments
Other Assets
Capital Assets Net of Depreciation
Total Assets
87,000
128,558
22,182
243,387
38,632
2,151,719
2,671,478
64,803
130,029
17,200
143,387
38,202
2,621,719
3,015,340
Liabilities
Trade Payables
Accrued Payroll
Short-term Debt
Other Liabilities
Total Liabilities
Net Assets - Retained
109,207
23,493
190,000
509,918
832,618
1,838,860
120,207
23,685
190,000
806,918
1,140,810
1,874,530
2,671,478
3,015,340
1,612,771
226,089
1,838,860
35,670
Total Liabilities and Net Assets
Net Assets
Change in Net Assets
Page 114
Business Plan & Budgets FY2011
General Mobility & Capital Budgets
Discussion
The total budget for METRO Rail Expansion, Capital Improvement Program, General
Mobility, Capitalized Operating Expenses and Debt Service is shown below. Details of
projected expenditures and funding sources by individual project follow:
Program
$ millions
Funding Source
FY2011 Budget
Grants
A. METRO Rail Expansion
143.571
50.000
B. Capital Improvement Program
104.076
30.874
C. General Mobility
186.341
0.000
D. Capitalized Operating Expenses
67.265
53.812
E. Debt Service
47.719
12.900
548.972
147.586
Total
METRO Rail Expansion grants are from North and Southeast corridor appropriations for
FY2010 and prior.
Page 115
Business Plan & Budgets FY2011
General Mobility & Capital Budgets
Capital Budget
Project Listings with Funding Sources
($000’s)
FUNDING SOURCE FY2011
DESCRIPTION
METRO Rail Expansion
LRT Corridors & Transit Facilities
Phase 2 Design/Build
4 LRT Lines
North Line
ROW/Land Acquisition
METRO - Agency Costs
Design/Build, Vehicles, FP and O&M
Design/Build
Light Rail Vehicles
Facility Provider
Operation & Maintenance
Subtotal - Design/Build, Vehicles, FP & O&M
Total - North Corridor
Southeast Line
ROW/Land Acquisition
METRO - Agency Costs
Design/Build, Vehicles, FP and O&M
Design/Build
Light Rail Vehicles
Facility Provider
Operation & Maintenance
Subtotal - Design/Build, Vehicles, FP and O&M
Total - Southeast Line (Including Storage & Wash Facility)
FY2011
Budget
97
2,972
Federal
Grants
Local
Funds Financing
0
0
97
2,972
20,120
0
307
58
20,485
0
0
0
0
0
0
0
0
0
0
0
0
0
20,120
0
307
58
20,485
23,554
0
0
23,554
119
3,641
0
0
119
3,641
24,652
0
376
71
25,099
0
0
0
0
0
0
0
0
0
0
0
0
0
24,652
0
376
71
25,099
28,859
0
0
28,859
East End Line
ROW/Land Acquisition
METRO - Agency Costs
Design/Build, Vehicles, FP & O&M
Design/Build
Light Rail Vehicles
Facility Provider
Operation & Maintenance
Subtotal - Design/Build, Vehicles, FP & O&M
4,391
8,876
0
0
0
0
4,391
8,876
59,575
0
917
171
60,663
0
0
0
0
0
0
0
0
0
0
59,575
0
917
171
60,663
Total - East End Line (Including Service & Inspection Facility)
73,930
0
0
73,930
Page 116
Business Plan & Budgets FY2011
General Mobility & Capital Budgets
Capital Budget
Project Listings with Funding Sources
($000’s)
FUNDING SOURCE FY2011
DESCRIPTION
Uptown Line
ROW/Land Acquisition
METRO - Agency Costs
Design/Build, Vehicles, FP and O&M
Design/Build
Light Rail Vehicles
Facility Provider
Operation & Maintenance
FY2011
Budget
Federal
Grants
2,353
0
0
0
0
0
0
0
0
0
0
0
0
0
0
0
0
0
2,353
0
0
0
2,353
0
0
2,353
2,353
0
0
2,353
128,696
0
0
128,696
9,775
0
0
9,775
University Line
ROW/Land Acquisition
METRO - Pre DB Engineering
METRO - Agency Costs
0
200
50
0
0
0
0
0
0
0
200
50
Total - University Line
250
0
0
250
Vehicle Re-Procurement Support
1,000
0
0
1,000
Allocated Overhead Expenses - METRO Rail Expansion
3,850
0
0
3,850
143,571
0
0
143,571
Subtotal - Design/Build, Vehicles, FP & O&M
Total - Uptown Line
Total - 4 LRT Lines (Excluding Other Agency Costs)
Other Agency Costs 4 LRT Lines
Total - Phase 2 Active Projects
0
0
Local
Funds Financing
Grants
North & Southeast Corridors (2010 & Prior)
TOTAL - METRO Rail Expansion
0
0
50,000
143,571
50,000
0
93,571
0
0
0
0
500
200
150
850
400
160
0
560
100
40
150
290
0
0
0
0
Capital Improvement Program
New Service
US 90 SW Corridor Commuter Rail Study $1MM included in Operating Budget
Clear Lake/EL Dorado P&R Lot
Brazoria County SH 288 - Joint Development
Intermodal Terminal Development
Subtotal - New Service
Page 117
Business Plan & Budgets FY2011
General Mobility & Capital Budgets
Capital Budget
Project Listings with Funding Sources
($000’s)
FUNDING SOURCE FY2011
DESCRIPTION
HOT Lane Conversion
HOT Lane Conversion
HOV Lane TranStar Control & Integration (ARGO)
Slip Ramp Access/Egress Locations
HOV Lane Program
Static Traffic Control Devices Rehab
Automated Traffic Devices Rehab Phase 3
Subtotal - HOT/HOV Lane Program
Passenger Shelters & Bus Pads
TOTAL
FY2011
Budget
Federal
Grants
Local
Funds Financing
14,569
1,429
4,002
14,569
1,429
4,002
0
0
0
0
0
0
285
172
228
138
57
34
0
0
20,457
20,366
91
0
650
625
25
0
21,957
21,551
406
0
52,378
603
0
0
0
603
52,378
0
1,280
4,427
5,497
1,438
12,642
0
330
3,557
0
3,887
1,280
4,097
1,940
1,438
8,755
0
0
0
0
0
2,726
2,354
372
0
68,349
6,241
9,730
52,378
Buses & Support Equipment
Revenue Vehicles
Bus Acquisitions
Bus Procurement (100)
New Bus Make Ready (Includes Zonar Units & Plant Inspection)
Bus Improvements
Axles
HC/METRO Radio System - Voice
Engines
Transmissions
Subtotal - Bus Improvements
METROLift Vans
Sub-Total Revenue Vehicles
Page 118
Business Plan & Budgets FY2011
General Mobility & Capital Budgets
Capital Budget
Project Listings with Funding Sources
($000’s)
FUNDING SOURCE FY2011
DESCRIPTION
Support Equipment & Systems
Support Vehicles
Tools & Equipment
Subtotal - Support Equipment & Systems
FY2011
Budget
Federal
Grants
Local
Funds Financing
140
750
890
0
0
0
140
750
890
0
0
0
69,239
6,241
10,620
52,378
200
0
200
0
Main St. Corridor Enhancements
Bar Signal Upgrade
Bar Signal Overrun
Power Track Switch at Pierce/Gray
836
226
1,463
836
0
1,463
0
226
0
0
0
0
Subtotal - Main St. Corridor Enhancements
2,525
2,299
226
0
500
0
500
0
Rail System Upgrades
Mid - Truck Overhaul
Doors
Ballast Track Clean Outs
Substation Battery Replacement
Bogie Build-Up
Subtotal - Rail System Upgrades
288
145
39
55
40
567
0
0
0
0
0
0
288
145
39
55
40
567
0
0
0
0
0
0
Total Operating Facilities & Upgrades
3,792
2,299
1,493
0
Total Buses & Support Equipment
Operating Facilities & Upgrades
Operating Facilities
Admin. Services (Copiers, AOB Improvements, Furniture & Equipment)
Facility Upgrades
Facility Upgrades
HVAC
Page 119
Business Plan & Budgets FY2011
General Mobility & Capital Budgets
Capital Budget
Project Listings with Funding Sources
($000’s)
FUNDING SOURCE FY2011
DESCRIPTION
Information Technology
SafeBus Data System
SAP Human Capital Management
End User Hardware/Software
Network Communication Enhancements
Data Center Server & Storage Enchancements
IT - Core Applications
Exec Office Record Mgt System
Subtotal - Information Technology
FY2011
Budget
Federal
Grants
Local
Funds Financing
300
1,700
505
1,500
2,600
1,200
500
8,305
0
0
0
0
0
0
0
0
300
1,700
505
1,500
2,600
1,200
500
8,305
0
0
0
0
0
0
0
0
582
201
783
582
201
783
0
0
0
0
0
0
TOTAL - Capital Improvement Program
104,076
30,874
20,824
52,378
TOTAL - METRO Rail Expansion & Capital Improvement Program
247,647
80,874
20,824
145,949
SAFETY
ROC Perimeter Security
Cameras on Buses
Subtotal - Safety
Page 120
Business Plan & Budgets FY2011
General Mobility Budget
( $000 )
City of Houston Projects
Pre-Agreement Designated Projects
Future Designated Projects
Unexpended Carryover from Prior Years
Subtotal
Harris County Projects
Pre-Agreement Designated Projects
Future Designated Projects
Unexpended Carryover from Prior Years
Subtotal
Multi-Cities Projects
Pre-Agreement Designated Projects (incl. Congestion Mitigation)
Future Designated Projects
Unexpended Carryover from Prior Years
Subtotal
Area-Wide Projects
Pre-Agreement Designated Projects
Future Designated Projects
Unexpended Carryover from Prior Years
Subtotal
Total
Pre-Agreement Designated Projects
Future Designated Projects
Unexpended Carryover from Prior Years
Total
10,673
69,170
45,675
125,518
0
19,709
20,839
40,548
14,526
0
N/A
14,526
5,749
N/A
N/A
5,749
30,948
88,879
66,514
186,341
Page 121
Business Plan & Budgets FY2011
General Mobility and Capital Budgets
Capitalized Operating Expenses
Since 1999, METRO has allocated each year some of its formula grants to fund
allowable operating expenses in accord with FTA regulation pertaining to capital
grants. It is proposed that the following FY2011 operating activities be funded
with the listed capital grants.
FY2011 Budget
Description
Type of Grant
$ millions
Bus & Rail Maintenance
New Service (Bus)
METROLift Service
TOTAL
POP / FGM
CMAQ
POP
45.785
1.330
6.697
53.812
The 20% local match is provided with ‘in-kind” expenditures so that these cash
flows are 100% grant funded. (POP = Program of Projects Section 5307 grants;
FGM = Fixed Guideway Modernization; CMAQ = Congestion Mitigation and Air
Quality)
Page 122
Business Plan & Budgets FY2011
Section VI: Appendix
This section lists 14 new initiatives that have been reviewed and selected as part of the
FY2011 Business Plan. Funding for these initiatives is included in the Operating and
Capital Budgets for FY2011.
Service Design & Development
Fare Recovery Research Project – Ticket Surcharge at Reliant Park ........... 124
Explore Underutilized Park & Ride Lots ......................................................... 125
Alternative Service Delivery – Poor Performing Routes ................................. 126
Bike and Ride ................................................................................................ 130
Service Delivery
METRORail APTA Standard Hours of Service .............................................. 131
Customer Service .......................................................................................... 132
Rebuilding Employee Morale ......................................................................... 133
RideStore Customer Service ......................................................................... 134
Bikes on Trains .............................................................................................. 135
Capital Programs
Realignment / Rightsizing of Project Staff and Services ................................ 136
METRO Police
Crime Mapping .............................................................................................. 137
Distribution of Police Reports Online ............................................................. 138
Grant Funding for 9 Police Officer Positions for Three Years ........................ 139
Business Services
Sustainability and Energy Management Program ......................................... 140
Page 123
Business Plan & Budgets FY2011
Service Design & Development
Fare Recovery Research Project –
Ticket Surcharge at Reliant Park
Description:
This initiative is proposing a fare recovery research project to develop a methodology for
implementing a “transit surcharge” on admission tickets to major events held at Reliant
Stadium, including the Houston Livestock Show & Rodeo (HLSR) and Houston Texans’
football games. As a first step, METRO would research and gather information from
other rail properties in North America that use a ticket surcharge method to help recover
revenue. Then a series of meetings would be set up with the Harris County Sports &
Convention Corporation and the HLSR to discuss effective strategies for implementing a
transit surcharge that would work at events hosted at Reliant Park. The cost of this
research is estimated to be about $10,000.
Costs/(Savings):
$10,000
FY2011 Operating Cost
$0
Recurring Annual Cost
$0
Total Capital Cost
Proposed Schedule:
• Contact peer agencies and develop a proposal for the surcharge - October December 2010
• Meet with Harris County Sports & Convention Corporation and HLSR officials to
discuss initiative feasibility / implementation – January thru April 2011
• Develop promotional/marketing materials for an “All-In-One” program for future
Reliant Park events – May 2011 and forward
Benefits/Outcome:
• Increased fare revenue, which would far exceed the cost required to promote and
implement the new ticket
• Reduced METRORail fare evasion
• Increased ridership
• Reduced event-related traffic at and around Reliant Park
Departments Responsible for Execution:
Service Design & Development, Service Delivery, Finance
Page 124
Business Plan & Budgets FY2011
Service Design & Development
Explore Underutilized Park & Ride Lots
Description:
METRO currently has approximately 34,000 parking spaces available for Park & Ride
(P&R) service. On an average day METRO has just over 16,000 unused parking
spaces with 12 of METRO’s 29 P&R lots less than 30% occupied. This initiative will
examine methods to increase utilization of the P&R lots by providing value and benefits
to patrons:
• Examining fare incentives (discounted or reduced fares) to attract new customers
to specific P&R’s as well as to bring patrons from other, more heavily utilized
P&R’s
• Installing additional “way-finding” signage to direct customers to METRO P&R
facilities
• Executing strategic marketing route promotions using specific advertising
elements from current and new METRO marketing materials
• Exploring patron concierge services (such as car washing, detailing or vehicular
maintenance services)
• Conducting a preliminary evaluation to sell or lease surplus property at 3 or 4
P&R locations (advancing only the Joint Development/Transit Oriented
Development opportunities that protect METRO’s long-term interests). The
potential revenue from the sale of surplus property is estimated between $750K
and $1.2M per site; the annual potential lease revenue is $50K to $80K per site
Costs/(Savings):
$35,000
FY2011 Operating Cost (0.25 FTE)
$35,000
Recurring Annual Cost (if program continues)
$20,000
Total Capital Cost
Proposed Schedule:
• Begin project scoping and market research by December 2010
• Identify underutilized P&R’s and recommend implementation strategies by April
2011
Benefits/Outcome:
• Increased ridership by reaching new potential customers
• More effective utilization of METRO assets
• Increased awareness and improved image of METRO
• Fully examines the need to expand and build new P&R’s
• Increased income from leases or sales, which could be reinvested into capital
programs
Departments Responsible for Execution:
Service Design & Development, Business Services, Service Delivery
Page 125
Business Plan & Budgets FY2011
Service Design & Development
Alternative Service Delivery – Poor Performing Routes
Objective:
• Improve customer service
• Introduce new and innovative concepts for providing sustainable service
• Maximize utilization of human capital and fiscal assets
Description:
Each year, METRO staff identifies poorly performing routes based on the current fiscal
year and projected for the upcoming fiscal year. A poor performing route has been
defined as routes that are subsidized 80 to 100 percent above the average subsidy per
boarding for its respective service type. In the past, these routes have been considered
for elimination based on their lack of cost efficiency. In FY2009, Route 326 – TMC
Circulator was eliminated on this basis in agreement with the Texas Medical Center. No
other routes meeting this definition have been eliminated since FY2005.
Based on an analysis of the performance of all routes from October 2009 to May 2010,
there are 16 Local routes and four Park & Ride routes that are subsidized 80 to 100
percent above the average subsidy per boarding for its respective service type. Of the
16 Local routes, six of these routes have met this definition of poor performance for 10
years or more. Another four routes have met the definition for the last five years. All of
the four Park & Ride routes identified for evaluation have met the definition of a poor
performing route since their implementation.
In recognition that many of these routes provide transportation to persons in METRO’s
service area, staff is recommending that alternative approaches for delivering service
along these routes be evaluated before route elimination is recommended. The goal of
this initiative is to maintain mobility services to the community through alternative
delivery approaches while reducing associated costs. This initiative creates the
opportunity for staff to examine the provision of new transit services and alternate
approaches to delivering transit services.
The working team will review and evaluate all routes that are subsidized 80 to 100
percent above the average subsidy per boarding for its respective service type for the
potential applicability of a method of alternative service delivery. At a minimum, the
methods considered will include:
Page 126
Business Plan & Budgets FY2011
Service Design & Development
Alternative Service Delivery – Poor Performing Routes
a. Using smaller vehicles on the existing fixed routes
b. Realignment of existing fixed route service for better integration with other
services
c. Flex routing based on temporal and geographic appropriateness; and
d. Replace any version of fixed route service on the route with a taxi voucher
program
Due to the unique market focus of the 500 Airport Direct route, some additional delivery
approaches have been considered to improve the efficiency of this service. Several
service modifications were analyzed for implementation and evaluation to improve
operational efficiencies on this route.
Based on this evaluation, the staff recommended approach is to provide express
service from downtown Houston (multiple pickup locations) to the IAH airport (Terminal
C) during the morning and evening peak periods. The service will have the following
characteristics:
•
•
•
•
•
Hours of Operation – 5:00 am to 10:00 am and 3:00 pm to 7:00 pm
Service departs hourly
Travel time from Downtown to IAH is estimated to be about 45 minutes. (Actual
travel time will be finalized through further evaluation.
Brand focused marketing
Proposed Downtown pickup locations include the Downtown Transit Center
(DTC), the Hyatt Hotel, Main Street at the METRO Rail Red Line, and the Hilton
Americas Hotel.
Staff will define performance metrics for this service and evaluate the performance of
the modified service after six months of revenue operations.
Costs/(Savings):
($5M to $7M) FY2011 Cost Savings (based on an annualized cost)
$0
Recurring Annual Cost
$0
Total Capital Cost
Page 127
Business Plan & Budgets FY2011
Service Design & Development
Alternative Service Delivery – Poor Performing Routes
The current FY2011 Transit Service Plan estimates a savings of $139,000 if the 38
Manchester, 39 Parker Rd., and 64 Lincoln City routes are delivered through a taxi
voucher program. If the routes that are subsidized 80 to 100 percent above the average
subsidy per boarding for their respective service type are eliminated from operation, the
Authority could potentially save approximately $12 million in annual variable operating
cost. The total savings would vary based on when the services are eliminated during
the fiscal year.
This initiative to deliver these services through alternative methods forecasts that 50
percent of the total annual variable operating costs for each route may be saved. This
approach estimates a potential annual savings of $6 million in annual variable operating
cost. Based on the success of this initiative, staff will consider the applicability of the
defined service delivery approaches to other routes in the system.
This initiative expects to net a savings of $5 million (minimum) to $7 million (maximum)
in FY2011 Operating Budget – based on 50 percent of the total annual variable
operating costs for routes that are subsidized 80 to 100 percent above the average
subsidy per boarding for their respective service type.
Proposed Schedule:
1st Quarter of FY2011
• Establish an internal Alternative Service Delivery working team to advance the
project with representatives from Service Delivery, Service Design &
Development, Finance (Budget), Business Services, Government Affairs, and the
Executive Office
• Prioritize routes and determine implementation timing and strategy
• Analyze proposed route changes based on federal Title VI impacts before
finalizing service modifications
• Determine method of contracting and costs impacts to the Authority
• Brief the Board of Directors’ Operations working committee, elected officials and
schedule public hearing
• Establish schedule for briefing community stakeholders
Page 128
Business Plan & Budgets FY2011
Service Design & Development
Alternative Service Delivery – Poor Performing Routes
2nd Quarter of FY2011
• Implement FY2011 route changes scheduled for January service change
• Begin monitoring performance of modified routes
3rd Quarter of FY2011
• Implement FY2011 route changes scheduled for June service changes
• Evaluate performance of modified routes and report to the Board
• Incorporate routes prioritized for FY2012 implementation into draft FY2012
Transit Service Plan
4th Quarter of FY2011
• Evaluate performance of modified routes and finalize alternative service delivery
routes for FY2012
Benefits/Outcome:
• Supports Authority strategic operating principles of customer service, asset
utilization, people, and sustainability
• Develops a transit plan that maintains a community focus
• Enhances operational efficiencies
Departments Responsible for Execution:
Service Design & Development, Finance, Business Services, Service Delivery,
Executive, Government Affairs
Page 129
Business Plan & Budgets FY2011
Service Design & Development
Bike and Ride
Description:
The objective of the project is to leverage General Mobility funds programmed for Harris
County under its Hike and Bike Trail initiative to build easier and safer connectivity to
access METRO’s transit system.
Harris County is planning an expansion of its hike and bike trails network. The Interstate
MUD II Hike and Bike Project, planned for FY2011, connects residential areas in west
Harris County and is located near the Kingsland Park & Ride. The proximity of the
project to METRO’s Kingsland Park & Ride offers an opportunity to build direct
connectivity with METRO’s transit system and provides a benefit to transit patrons with
an option to access the Kingsland Park & Ride via bicycle in lieu of motorized vehicles.
Under this initiative, METRO’s participation is on two key responsibilities (1) Ensure the Park & Ride facility is easily and safely accessible from the trails by
providing the needed directional signage and pavement markings to the Park &
Ride facility
(2) Upgrade lighting and security along with bike lockers to offer improved security
and protection from the elements
There will be an interagency agreement with Harris County.
Costs/(Savings):
$0
FY2011 Operating Costs/(Savings)
$0
Recurring Annual Cost /(Savings)
$250,000
Total Capital Cost (METRO’s contribution)
$750,000
General Mobility Funds (Harris County)
Proposed Schedule:
• Survey / Design:
• Approvals:
• Construction:
6 months
2 months
6 months
Benefits/Outcome:
• Promotes new markets
• Increases ridership
• Defers the need to expand Park & Ride parking spaces
• Promotes a livable community
Departments Responsible for Execution:
Service Design & Development, METRO Police, Service Delivery
Page 130
Business Plan & Budgets FY2011
Service Delivery
METRORail APTA Standard Hours of Service
Description:
Operating rules are created to promote safe, efficient, timely and customer-oriented
transit operations. Adherence to these operating rules is necessary to achieve these
objectives. The Hours of Service (HOS) program creates the condition in which train
operators have an opportunity to get sufficient rest (8 hours of uninterrupted sleep)
between work shifts to minimize the impact of fatigue on their job performance.
According to the American Public Transportation Association (APTA) standard, any Rail
Transit System (RTS) shall not schedule a train operator shift which has an overall
elapsed time from start to finish greater than 16 hours. The RTS shall require a
minimum time-off period between shifts of 10 hours.
In order for METRO to achieve the APTA recommended HOS, the Authority needs to
hire an additional four (4) train operators to cover the following: Basic Schedule,
Vacation, Unscheduled Work, Chargeable Occurrences and Non-Chargeable
Occurrences.
Costs/(Savings):
$155,562
FY2011 Operating Cost (assume hiring date of 8-31-10)
$155,562
Recurring Annual Cost
$0
Total Capital Cost
Proposed Schedule:
September FY2010
Benefits/Outcome:
• METRO will be in compliance with APTA HOS requirements
• Personnel available for Flagging, Special Events, Extra Service, Relief
Supervision
Department Responsible for Execution:
Service Delivery
Page 131
Business Plan & Budgets FY2011
Service Delivery
Customer Service
Description:
METRO’s focus for the next fiscal year is to concentrate on improving customer
service. The philosophy on accomplishing this initiative begins with METRO’s trusted
workforce. The following proposals will be used to improve customer service:
• Customer Service focus groups
• A revised Customer Service class with additions from the Customer Service
focus groups (Bus Operators)
• Development and dissemination of key Operator behaviors to include how they
are measured and conveyed
• A public outreach plan to publicize what behavior is expected from METRO’s
riding customers as well what the public can expect from METRO Operators as
they use the system
• Informal management training for Service Delivery staff starting with 1st and 2nd
level supervision giving managers the tools to more effectively interact with their
internal customers and foster a better working relationship
• Expand the number of cleaning trips at METRO serviced shelters. The cleaning
of the shelters on a frequent basis is essential to the comfort of patrons
• An Employee Development and Training Group focused on the call center
employees
• A Customer Care Team to focus on customer complaints in order to build trust
with customers as well as to provide a better customer experience
• METROLift Outreach Centers to serve customers
Costs/(Savings):
$513,131
FY2011 Operating Cost
$513,131
Recurring Annual Cost
$0
Total Capital Cost
Proposed Schedule:
• 1st Quarter FY2011 – Begin implementing
• 4th Quarter FY2011 – Fully implemented
Benefits/Outcome:
• Improved Customer Service
Department Responsible for Execution:
Service Delivery, Business Services
Page 132
Business Plan & Budgets FY2011
Service Delivery
Rebuilding Employee Morale
Description:
This initiative focuses on the morale of METRO’s front line staff, especially hourly
employees. The following is list of recommended proposals:
Employee Incentive Program: Develop and implement an incentive program (operators/
mechanics) to reengage employees.
Program would track and score various
performance measures and based on the aggregate, pay out quarterly incentive checks
to 85% of the Service Delivery staff.
Top Operators/ Mechanics: Currently, there is no mechanism in place to recognize top
Operators and Mechanics. This initiative will recognize METRO’s best Operators/
Mechanics quarterly from each Bus Operating facility. The quarterly winners will be
considered for the top honor, Operator/ Mechanic of the Year Award.
One Million Mile Club: Operators who have traveled, while operating a METRO bus,
more than one million miles will be recognized with a certificate and patch during the
quarterly safety luncheons.
Run Cuts: The majority of the Transportation run cuts for the senior Bus Operators are
split runs, i.e., not a continuous 8 hour shift. This initiative will adjust the Transportation
run cuts to better utilize the current Bus Operator workforce.
Internal Customer: Informal management training for Service Delivery staff starting with
1st and 2nd level supervision.
Costs/(Savings):
$1,121,665
FY2011 Operating Cost
$1,121,665
Recurring Annual Cost
$0
Total Capital Cost
Proposed Schedule:
• 1st Quarter FY2011 – Begin implementing (Top Operator)
• 2nd Quarter FY2011 – Begin implementing Run Cuts
• 4th Quarter FY2011 – Complete both projects
Benefits/Outcome:
• Increase full time Bus Operator morale
• More efficient and effective manpower utilization
Departments Responsible for Execution:
Service Delivery, Business Services
Page 133
Business Plan & Budgets FY2011
Service Delivery
RideStore Customer Service
Description:
The goal of this initiative is to better utilize limited resources by proposing to move six
(6) Bradlink, LLC temporary employees to METRO as part-time employees assigned to
the RideStore, adding an FTE of 4.95 to the Custom Care Division. The savings from
this initiative will be in the elimination of the overhead charged by Bradlink, LLC as the
employees will continue to earn their same salaries.
In an effort to extend additional service to METRO’s customers, one of these Bradlink,
LLC temporary employees, a former call center representative, will provide customers
additional assistance with routing, service issues, filing complaints and questions at the
Help Desk window of the RideStore. The remaining service windows will continue to
assist each customer on a daily basis with his/her needs and questions regarding
routing and METRO Q® Fare Card transactions. For additional customer service
assistance, a “red phone” will also be installed and readily available inside the
RideStore with direct routing to the METRO Call Center. This will minimize customers
having to use the lobby pay-phones to contact customer service.
Costs/(Savings):
$127,032
$127,032
$0
FY2011 Operating Cost
Recurring Annual Cost
Total Capital Cost
Proposed Schedule:
• 1st Quarter FY2011
Benefits/Outcome:
• METRO cost savings of $72,393 by moving six temporary employees to METRO
as part-time employees from Bradlink, LLC, where their current annual cost is
$199,426.
•
An available Help Desk in the RideStore with a designated window in order to
provide customer assistance with routing, questions, service issues, and filing
complaints.
Department Responsible for Execution:
Service Delivery
Page 134
Business Plan & Budgets FY2011
Service Delivery
Bikes on Trains
Description:
In METRO’s ongoing efforts to be responsive and inclusive to the Houston Biking
Community, the Authority has come up with a solution which would allow for two
dedicated spaces on each train for bike berthing. This will improve passenger ingress
and egress flow around the passenger doors when bikes are on the on trains during
revenue operations by removing 8 seats from each of the S-70 light rail vehicles (18
total).
The actual in-service design loads realized during normal operation for the S-70 vehicle
is 150 riders. This is the point at which some patrons prefer to wait for the next train vs.
riding in a cramped environment. The removal of 8 seats from the vehicle will add
additional capacity (12 riders for a single train & 24 riders for a two car train) for
appropriate loading conditions. This additional capacity may give METRO the ability to
remove the bike restrictions during the peak service hours (6:30 am - 9:00 am; 3:00 pm
– 6:00 pm) and allows bikes on trains anytime of the day.
Service Delivery will continue to monitor the passenger loads during peak service in an
attempt to remove the bike restrictions in the future.
Costs/(Savings):
($2,760)
FY2011 Operating Savings
($2,760)
Recurring Annual Savings
$0
Total Capital Cost
Proposed Schedule:
Fleet was modified end of FY2010.
Benefits/Outcome:
• No restrictions for bikes on trains any time of the day
• Increased capacity for special events (additional 250 people/hr)
• Annual Operating Savings: $2,760
• Increased capacity per vehicle during normal operations (162 vs. 150)
Department Responsible for Execution:
Service Delivery
Page 135
Business Plan & Budgets FY2011
Capital Programs
Realignment/Rightsizing of Project Staff & Services
Description:
Realign/rightsize METRO Rail Expansion staff and Contract Support Services
contingent on receiving FTA’s Letter of No Prejudice and Full Funding Grant Agreement
on the North, Southeast, East End and University lines.
Costs/(Savings):
This initiative will continue to keep project costs on budget as shown under
“Benefits/Outcome” section below.
Proposed Schedule:
Annually
Benefits/Outcome:
METRO Rail Expansion strives to efficiently manage the Authority’s light rail program.
Program activities grow and contract consistent with program progress. Projects are
set-up and executed so that staffing/consultants can be adjusted based on funding or
change in plans of execution. By FY2011 Real Estate activity will have reached its peak
and staffing/consultants will decrease from FY2010 levels of 7 staff and 25 consultants
to 6 staff and 2 to 3 supporting consultants. Realigning/right staffing for the University
and Uptown lines will also grow or contract contingent on Board and FTA actions in
FY2011.
Department Responsible for Execution:
Capital Programs
Page 136
Business Plan & Budgets FY2011
METRO Police
Crime Mapping
Description:
METRO has the responsibility to operate openly and with transparency, the
responsibility to make available the greatest possible amount of information, and the
responsibility to provide the public with a full picture of what has happened within its
jurisdictional boundaries. To this end the Authority has researched and found a software
package which provides transit customers easy-to-read, up-to-date crime data.
CrimeReports, out of Salt Lake City, Utah, is the largest and most-comprehensive
crime-mapping network in the world and has over 700 partner agencies across North
America.
CrimeReports standardizes crime reporting through 15 crime types based on Uniform
Crime Reporting (UCR) definitions. All addresses are rounded to the block level to
protect victim and suspect identities. In addition, all crime information for the entire
network is available to METRO Police and the community. This software will also allow
METRO Police access to crime maps in participating neighbor agencies, furthering the
Authority’s regional knowledge.
The software will provide up-to-date data in order to command staff and METRO
administrators not only in their offices but any place where internet access is available.
With additional handheld hardware (iPhones), the data can also be portable.
Costs/(Savings):
$16,328
FY2011 Operating Cost
$16,328
Recurring Annual Cost
$0
Total Capital Cost
Proposed Schedule:
• 2nd Quarter FY2011
Benefits/Outcome:
While the full benefits will not be known in the first year, there are some immediate
benefits to METRO:
• The mapping of crime and accident data without expensive software licensing
and training as required in other mapping programs.
• No need for METRO Information Technology staff to support the software
associated with this application since it is web-based.
• Public access to crime data as maps can be exported to METRO’s web page.
Department Responsible for Execution:
METRO Police
Page 137
Business Plan & Budgets FY2011
METRO Police
Distribution of Police Reports Online
Description:
PoliceReports.US helps law enforcement agencies distribute accident reports over the
internet so citizens have the ability to retrieve, print and purchase the reports online.
This initiative allows citizens and businesses access to police accident reports
electronically via the web, based on a fee charged by PoliceReports.US. In addition,
METRO will receive all funds received by Police Reports.US in excess of their $3 per
report charge. PoliceReports.US provides installation, training, maintenance and
upgrades, and there are no direct costs to distributing reports online with this service.
Costs/(Savings):
$0*
FY2011 Operating Costs/(Savings)
$0*
Recurring Annual Costs/(Savings)
$0
Total Capital Cost
*Savings from funds received in excess of the report charge cannot be estimated at this
time.
Proposed Schedule:
• 2nd Quarter FY2011
Benefits/Outcome:
Many Texas police departments and agencies support the system; by adding web
distribution of police accident reports it has provided better service to the citizens and
has increased available resources for recordkeeping and data analysis.
This project will give the records personnel additional time to expand crime analysis and
crime trending, resulting in a more efficient and effective use of police manpower.
Department Responsible for Execution:
METRO Police
Page 138
Business Plan & Budgets FY2011
METRO Police
Grant Funding for 9 Police Officer Positions for Three Years
Description:
METRO will request $1,725,102 in grant funding to cover salaries, fringe benefits and
equipment for 9 police officer positions for 3 years (36 months). A grant application has
been submitted in June 2010 to request funding for 9 officer positions from the
Community Oriented Policing Services (COPS) Hiring Program. Under the COPS
grant, METRO would be obligated to retain 9 positions for a minimum of 12 additional
months, beyond the initial 36 months, using local funds to cover salary expenses.
There are no matching requirements.
Costs/(Savings):
$0
FY2011 – FY2013 Operating Costs/(Savings)
$691,500
4th Year FY2014 Operating Annual Cost
$0
Total Capital Cost
Proposed Schedule:
The COPS Hiring Program grant application was submitted in June 2010 and is now
pending review by the funding source administrators. The notice of grant award is
anticipated in late August or September. Positions would be filled as quickly as possible,
starting in October 2011.
Benefits/Outcome:
Improved ability to staff to geographic areas and provide maximum police visibility
during times when customers are most vulnerable to undesirable or criminal activity.
Improved visibility of uniformed police officers onboard buses, trains and at busy transit
centers so customers and all residents in METRO’s jurisdiction can recognize the
Authority’s commitment to their safety.
To provide visible and unpredictable deterrence in furtherance of METRO’s objectives
to mitigate acts of terrorism and protect the riding public, employees, assets, and the
community at large.
Department Responsible for Execution:
METRO Police
Page 139
Business Plan & Budgets FY2011
Business Services
Sustainability and Energy Management Program
Description:
The goal of this initiative is to develop an official Authority-wide formal Sustainability and
Energy Management Program. This program will create a formal structure to tie in the
various ongoing efforts spread throughout the Authority in the areas of energy
management, emissions control, waste reduction, recycling, and others.
Included in the program will be strategic long-term goals to maximize the environmental
benefits of the Authority’s mass transportation system while reducing and managing its
own energy footprint. METRO will do this by providing reliable mass transportation
services, by using the cleanest technologies available in bus and rail, by conserving water
and energy in all of its facilities, and through a commitment to be a good environmental
steward.
Costs/(Savings):
$10,000
FY2011 Operating Cost
$10,000
Recurring Annual Cost
$0
Total Capital Cost
Proposed Schedule:
• 1st Quarter FY2011 – Setting Vision – This is a key step involving the President &
CEO and Board buy in, perhaps even a resolution from the Board making the
commitment of the Authority for sustainable and responsible operations
• 1st Quarter FY2011 – Staffing the Effort- Formal designation of persons that will play
key roles in this program as well as creating a steering committee to lead all
planning efforts
• 1st Quarter FY2011 – Establishing metrics to measure progress – Developing key
performance indicators and other metrics to track progress
• 2nd Quarter FY2011 – Implementing Strategic Initiatives – with efforts in energy
management, recycling etc.
• 4th Quarter FY2011 – Communicating Results
Benefits/Outcome:
If properly executed this initiative could bring in benefits in various areas:
• Budget – By reducing the Authority’s energy footprint, electricity, water and gas
costs can be saved every year.
• Goodwill and Public Relations – By creating a formal commitment to sustainability
and energy management METRO will show that it is environmentally conscious and
committed to enhancing the quality of life for its customers, neighbors and
employees.
Department Responsible for Execution:
Business Services
Page 140
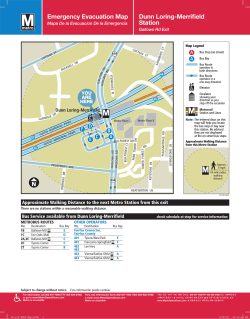


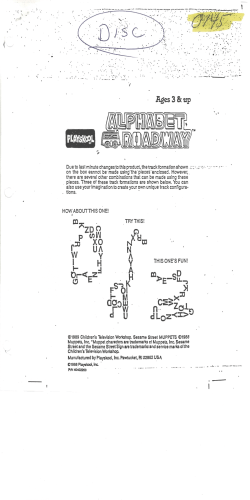

© Copyright 2026