
2015 Cost of Data Breach Study: Global Analysis
2015 Cost of Data Breach Study:
Global Analysis
Benchmark research sponsored by IBM
Independently conducted by Ponemon Institute LLC
May 2015
Ponemon Institute© Research Report
20151 Cost of Data Breach Study: Global Analysis
Ponemon Institute, May 2015
Part 1. Introduction
2014 will be remembered for such highly publicized mega breaches as Sony Pictures
Entertainment and JPMorgan Chase & Co. Sony suffered a major online attack that resulted in
employees’ personal data and corporate correspondence being leaked. The JPMorgan Chase &
Co. data breach affected 76 million households and seven million small businesses.
IBM and Ponemon Institute are pleased to release the 2015 Cost of Data Breach Study: Global
Analysis. According to our research, the average total cost of a data breach for the 350
2
companies participating in this research increased from 3.52 to $3.79 million . The average cost
paid for each lost or stolen record containing sensitive and confidential information increased
from $145 in 2014 to $154 in this year’s study.
In the past, senior executives and boards of directors may have been complacent about the risks
posed by data breaches and cyber attacks. However, there is a growing concern about the
potential damage to reputation, class action lawsuits and costly downtime that is motivating
executives to pay greater attention to the security practices of their organizations.
In a recent Ponemon Institute study,
Global study at a glance
79 percent of C-level US and UK
§
350 companies in 11 countries
executives surveyed say executive
§
$3.79 million is the average total cost of data breach
level involvement is necessary to
achieving an effective incident
§
23% increase in total cost of data breach since 2013
response to a data breach and 70
§
$154 is the average cost per lost or stolen record
percent believe board level oversight
is critical. As evidence, CEO Jamie
§
12% percent increase in per capita cost since 2013
Dimon personally informed
shareholders following the JPMorgan
Chase data breach that by the end of 2014 the bank will invest $250 million and have a staff of
3
1,000 committed to IT security.
For the second year, our study looks at the likelihood of a company having one or more data
breach occurrences in the next 24 months. Based on the experiences of companies participating
in our research, we believe we can predict the probability of a data breach based on two factors:
how many records were lost or stolen and the company’s industry. According to the findings,
organizations in Brazil and France are more likely to have a data breach involving a minimum of
10,000 records. In contrast, organizations in Germany and Canada are least likely to have a
breach. In all cases, it is more likely a company will have a breach involving 10,000 or fewer
records than a mega breach involving more than 100,000 records.
In this year’s study, 350 companies representing the following 11 countries participated: United
States, United Kingdom, Germany, Australia, France, Brazil, Japan, Italy, India, the Arabian
region (United Arab Emirates and Saudi Arabia) and, for the first time, Canada. All participating
organizations experienced a data breach ranging from a low of approximately 2,200 to slightly
4
more than 101,000 compromised records . We define a compromised record as one that
identifies the individual whose information has been lost or stolen in a data breach.
1
This report is dated in the year of publication rather than the fieldwork completion date. Please note that the majority of
data breach incidents studied in the current report happened in the 2014 calendar year.
2
Local currencies were converted to U.S. dollars.
3
New JPMorgan Chase Breach Details Emerge by Mathew J. Schwartz, Bankinfosecurity.com, August 29, 2014
4
The terms “cost per compromised record” and “per capita cost” have equivalent meaning in this report.
Ponemon Institute© Research Report
Page 1
In this report, for the first time, we will examine two factors that affected the financial
consequences of a data breach. The first is executive involvement in their organization’s IT
security strategy and response to data breaches. The second is the purchase of cyber insurance
to mitigate the cost of a data breach. With the increasing cost and volume of data breaches, IT
security is quickly moving from being considered by business leaders as a purely technology
issue to a larger business risk. This shift has spurred increased interest in cyber insurance.
The three major reasons contributing to a higher cost of data breach in 2015:
Cyber attacks have increased in frequency and in the cost to remediate the consequences.
The cost of data breaches due to malicious or criminal attacks increased from an average of $159
in last year’s study to $170 per record. Last year, these attacks represented 42 percent of root
causes of a data breach and this increased to 47 percent of root causes in this year’s study.
The consequences of lost business are having a greater impact on the cost of data breach.
Lost business has potentially the most severe financial consequences for an organization. The
cost increased from a total average cost of $1.33 million last year to $1.57 million in 2015. This
cost component includes the abnormal turnover of customers, increased customer acquisition
activities, reputation losses and diminished goodwill. The growing awareness of identity theft and
consumers’ concerns about the security of their personal data following a breach has contributed
to the increase in lost business.
Data breach costs associated with detection and escalation increased. These costs typically
include forensic and investigative activities, assessment and audit services, crisis team
management and communications to executive management and board of directors. This total
average cost increased from $.76 million last year to $.99 million in this year’s report.
More companies are integrating forensic tools into their incident response procedures. In the
long-term, deployment of these solutions will prove beneficial to companies because they will
provide a clearer picture of the root causes of their data breaches. However, in many cases,
these tools enable companies to discover the full extent of the breach. This may result in the
reporting of higher data breach costs than in previous years.
Key findings
Data breaches cost the most in the US and Germany and the lowest in Brazil and India.
The average per capita cost of data breach is $217 in the US and $211 in Germany. The lowest
cost is in Brazil ($78) and India ($56). The average total organizational cost in the US is $6.5
million and in Germany $4.9 million. The lowest organizational cost is in Brazil ($1.8 million) and
India ($1.5 million).
The cost of data breach varies by industry. The average global cost of data breach per lost or
stolen record is $154. However, if a healthcare organization has a breach the average cost could
be as high as $363 and in education the average cost could be as high as $300. The lowest cost
per lost or stolen record is in transportation ($121) and public sector ($68). The retail industry’s
average cost increased dramatically from $105 last year to $165 in this year’s study.
Hackers and criminal insiders cause the most data breaches. Forty-seven percent of all
breaches in this year’s study were caused by malicious or criminal attacks. The average cost per
record to resolve such an attack is $170. In contrast, system glitches cost $142 per record and
human error or negligence is $134 per record. The US and Germany spend the most to resolve a
malicious or criminal attack ($230 and $224 per record, respectively).
Malicious or criminal attacks vary significantly by country. Fifty-seven percent of all
breaches in the Arabian Cluster and in France 55 percent of all breaches are due to hackers and
criminal insiders. Only 32 percent of all data breaches occurring in India are due to malicious
Ponemon Institute© Research Report
Page 2
attacks and in Brazil it is 30 percent. However, India and Brazil have the most data breaches due
to system glitches. Breaches due to human error are highest in Canada.
Board involvement and the purchase of insurance can reduce the cost of a data breach.
For the first time, we looked at the positive consequences that can result when boards of
directors take a more active role when an organization had a data breach. Board involvement
reduces the cost by $5.5 per record. Insurance protection reduces the cost by $4.4 per record.
The loss of customers increases the cost of data breach. Certain countries have more
problems retaining customers following a data breach and, therefore, can have higher costs.
These are France, Italy, UK and Japan. Countries with the lowest churn rate are Canada, India
and Brazil. Industries with the highest churn are health, pharmaceuticals and financial services.
Notification costs remain low, but costs associated with lost business steadily increase.
Lost business costs are abnormal turnover of customers, increased customer acquisition
activities, reputation losses and diminished good will. The average cost has increased from $1.45
million in 2014 to $1.57 million in 2015. Notification costs have declined from $0.19 million in
2014 to $0.17 million in this year’s study.
Certain countries are more likely to have a data breach. Last year’s study introduced a new
analysis on the likelihood of one or more data breach occurrences. It is interesting that the
likelihood of a data breach varies considerably across countries. Brazil and France are most likely
to have a data breach involving a minimum of 10,000 records. Canada and Germany are least
likely to have a data breach.
Time to identify and contain a data breach affects the cost. For the first time, our study shows
the relationship between how quickly an organization can identify and contain data breach
incidents and financial consequences. Malicious attacks can take an average of 256 days to
identify while data breaches caused by human error take an average of 158 days to identify. As
discussed earlier, malicious or criminal attacks are the most costly data breaches.
Business continuity management plays an important role in reducing the cost of data
breach. The research reveals that having business continuity management involved in the
remediation of the breach can reduce the cost by an average of $7.1 per compromised record.
Ponemon Institute© Research Report
Page 3
Cost of Data Breach FAQs
What is the purpose of this research? Our goal is to quantify the economic impact of data
breaches and observe cost trends over time. We believe a better understanding of the cost, the
root causes and factors that influence the cost will assist organizations in determining the
appropriate amount of investment and resources needed to prevent or mitigate the consequences
of an attack.
What is a data breach? A breach is defined as an event in which an individual’s name plus a
medical record and/or a financial record or debit card is potentially put at risk—either in electronic
or paper format. In our study, we have identified three main causes of a data breach: a malicious
or criminal attack, system glitch or human error. The costs of a data breach can vary according to
the cause and the safeguards in place at the time of the data breach.
What is a compromised record? We define a record as information that identifies the natural
person (individual) whose information has been lost or stolen in a data breach. Examples can
include a retail company’s database with an individual’s name associated with credit card
information and other personally identifiable information. Or, it could be a health insurer’s record
of the policyholder with physician and payment information. In this year’s study, the average cost
to the organization if one of these records is lost or stolen is $154.
How do you collect the data? Ponemon Institute researchers collected in-depth qualitative data
through more than 1,500 separate interviews conducted over a ten-month period. Recruiting
organizations for the 2015 study began in January 2014 and interviews were completed in March
2015. In each of the 350 participating organizations, we spoke with IT, compliance and
information security practitioners who are knowledgeable about their organization’s data breach
and the costs associated with resolving the breach. For privacy purposes we do not collect any
organization-specific information.
How do you calculate the cost? To calculate the average cost of data breach, we collect both
the direct and indirect expenses incurred by the organization. Direct expenses include engaging
forensic experts, outsourcing hotline support and providing free credit monitoring subscriptions
and discounts for future products and services. Indirect costs include in-house investigations and
communication, as well as the extrapolated value of customer loss resulting from turnover or
diminished customer acquisition rates.
How does benchmark research differ from survey research? The unit of analysis in the Cost
of Data Breach study is the organization. In survey research, the unit of analysis is the individual.
We recruited 350 organizations to participate in this study. Data breaches ranged from a low of
2,200 to slightly more than 101,000 compromised records.
Can the average cost of data breach be used to calculate the financial consequences of a
mega breach such as those involving millions of lost or stolen records? The average cost
of a data breach in our research does not apply to catastrophic or mega data breaches such as
Sony because these are not typical of the breaches most organizations experience. In order to be
representative of the population of global organizations and draw conclusions from the research
that can be useful in understanding costs when protected information is lost or stolen, we do not
include data breaches of more than approximately 100,000 compromised records in our analysis.
Are you tracking the same organizations each year? Each annual study involves a different
sample of companies. In other words, we are not tracking the same sample of companies over
time. To be consistent, we recruit and match companies with similar characteristics such as the
company’s industry, headcount, geographic footprint and size of data breach. Since starting this
research in 2005, we have studied the data breach experiences of 1,629 organizations globally.
Ponemon Institute© Research Report
Page 4
Global at a glance
This year’s annual study was conducted in 11 countries: United States, Germany, Canada (for
the first time), France, United Kingdom, Italy, Japan, Australia, Arabian Cluster, Brazil and India,
with a total benchmark sample of 350 organizations. Country-specific results are presented in 11
separate reports.
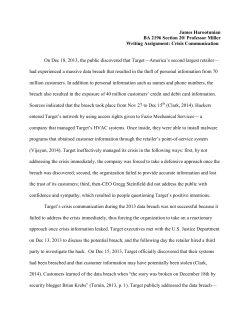
Figure 1 presents the average per capita cost of data breach over three years expressed in US
5
dollars for 11 country studies. As shown, there is significant variation among country samples.
The consolidated average per capita cost for all countries was $154 compared to a $145 average
cost calculated last year (excluding Canada). The US and Germany continue to have the highest
per capita costs at $217 and $211, respectively. India and Brazil had the lowest costs at $56 and
$78, respectively.
Figure 1. The average per capita cost of data breach over three years
*Historical data is not available
Consolidated view (FY 2015 = 350, FY 2014 = 315, FY 2013 = 277)
Measured in US$
$188
US
DE
$201
$195
CA*
$217
$210
$211
$207
$177
$183
$186
FR
$143
UK
$158
$163
$131
$141
$146
IT
JP
$120
$127
$135
AU
$131
$135
$133
AB*
$109
$52
BZ
$37
ID
$-
$122
$70
$78
$51
$56
$50
$100
FY2013
$150
FY2014
$200
$250
FY2015
5
Per capita cost is defined as the total cost of data breach divided by the size of the data breach (i.e., the number of lost
or stolen records).
Ponemon Institute© Research Report
Page 5
Part 2. Key Findings
In this section, we provide the detailed findings of this research. Topics are presented in the
following order:
§
§
§
§
§
§
§
§
Global and industry differences in cost of data breach
Root causes of a data breach
Factors that influence the cost of data breach
Trends in the frequency of compromised records and customer turnover or churn
Trends in the cost components of data breach
The likelihood an organization will have a data breach
Mean time to identify and contain a data breach
The impact of business continuity management on the cost of data breach
The following table lists 11 countries, legend, sample sizes and currencies used in this global
study. It also shows the number of years of annual reporting for each country ranging from one
year for Canada to 10 years for the United States.
Table 1. Global Study at a Glance
Countries
Sample
Pct%
Currency
Years of study
Arabian Cluster*
25
7%
AED/SAR
2
Australia
23
7%
AU Dollar
6
Brazil
34
10%
Real
3
Canada
21
6%
CA Dollar
1
Germany
32
9%
Euro
7
France
29
8%
Euro
6
India
36
10%
Rupee
4
Italy
22
6%
Euro
4
Japan
27
8%
Yen
4
United Kingdom
39
11%
GBP
8
United States
62
18%
US Dollar
10
Total
350
100%
*AB is a combined sample of companies located in Saudi Arabia and the United Arab Emirates
Legend
AB
AU
BZ
CA
DE
FR
ID
IT
JP
UK
US
The following chart shows the distribution of 350 participating organizations within 11 countries.
As can be seen, the US represents the largest segment with 62 organizations and Canada the
smallest sample with 21 organizations.
Pie Chart 1. Frequency of benchmark samples by country
Consolidated view (n=350)
21
62
22
23
25
39
27
36
United States
United Kingdom
India
Brazil
Germany
France
Japan
Arabian Cluster
Australia
Italy
Canada
29
32
Ponemon Institute© Research Report
34
Page 6
Global and industry differences in the cost of data breach
The average organizational cost of a data breach varies by country. Figure 2 presents the
total average cost of a data breach for 11 countries in this year’s study. As can be seen, all
countries experienced an increase in the average total cost over the past year. The US sample
experienced the highest total average cost at more than $6.53 million, followed by Germany at
$4.89 million. In contrast, Brazilian and Indian companies experienced the lowest total average
cost at $1.77 million and $1.46 million, respectively.
Figure 2. The average total organizational cost of a data breach over three years
*Historical data is not available
Consolidated view (FY 2015 = 350, FY 2014 = 315, FY 2013 = 277)
Measured in US$ (millions)
$5.40
US
$5.85
$6.53
$5.09
$4.74
$4.89
DE
CA*
$4.40
$3.97
$4.19
$4.34
FR
AB*
$3.12
$3.80
$3.40
$3.68
$3.72
UK
$2.40
$2.69
$2.75
IT
$2.19
$2.36
$2.68
JP
$2.52
$2.59
$2.61
AU
$1.18
BZ
$1.61
$1.77
$1.00
$1.37
$1.46
ID
$-
$1.00
$2.00
$3.00
FY2013
Ponemon Institute© Research Report
$4.00
FY2014
$5.00
$6.00
$7.00
FY2015
Page 7
Number of exposed or compromised records. Figure 3 reports the average size of data
breaches for organizations in the 11 countries represented in this research. As shown,
organizations in the Arabian region, India and US had the largest average number of records lost
or stolen. In this report, we also show the relationship between the number of records lost or
stolen and the cost of a data breach.
Figure 3. The average number of breached records by country
Consolidated view (n=350)
AB
29,199
ID
28,798
US
28,070
DE
24,103
BZ
22,902
UK
21,695
FR
20,650
CA
20,456
AU
19,788
JP
19,214
IT
18,983
-
5,000
10,000
Ponemon Institute© Research Report
15,000
20,000
25,000
30,000
35,000
Page 8
Certain industries have higher data breach costs. Figure 4 reports the per capita costs for the
consolidated sample by industry classification. Heavily regulated industries such as healthcare,
education, pharmaceutical and financial services have a per capita data breach cost substantially
above the overall mean of $154. Public sector, transportation, research and media organizations
have a per capita cost well below the overall mean value.
While the cost of data breach stayed relatively constant for most industries, the retail sector
experienced a significant increase from $105 in 2014 to $165 in 2015. Media reporting of these
events and consumers’ concerns about identity theft caused retail companies to spend more
money to address the consequences of data breaches.
Figure 4. Per capita cost by industry classification
Consolidated view (n=350), measured in US$
Health
$363
Education
$300
Pharmaceuticals
$220
Financial
$215
Communications
$179
Retail
$165
$155
Industrial
Services
$137
Consumer
$136
Energy
$132
Hospitality
$129
Technology
$127
Media
$126
Research
$124
Transportation
$121
Public sector
$68
$-
$50
Ponemon Institute© Research Report
$100
$150
$200
$250
$300
$350
$400
Page 9
The root causes of data breach
6
Malicious or criminal attacks are most often the cause of a data breach globally. Pie Chart
2 provides a summary of the main root causes of a data breach on a consolidated basis for all 11
countries represented in the research. Forty-seven percent of incidents involve a malicious or
criminal attack, 25 percent concern a negligent employee or contractor (human factor), and 29
7
percent involve system glitches that includes both IT and business process failures.
Pie Chart 2. Distribution of the benchmark sample by root cause of the data breach
Consolidated view (n=350)
25%
47%
Malicious or criminal attack
System glitch
Human error
29%
Malicious attacks are more costly globally. Figure 5 reports the per capita cost of data breach
for three root causes of the breach incident. In 2015, the cost of data breaches due to malicious
or criminal attacks increased from an average of $159 in last year’s study to $170 in 2015. This is
significantly above the per capita cost for breaches caused by system glitch and human factors
($142 and $137, respectively). Last year, system glitches averaged $126 and human error
averaged $117.
Figure 5. Per capita cost for three root causes of the data breach
Consolidated view (n=350), measured in US$
$180
$170
$160
$142
$137
System glitch
Human error
$140
$120
$100
$80
$60
$40
$20
$Malicious or criminal attack
6
Negligent insiders are individuals who cause a data breach because of their carelessness, as determined in a post data
breach investigation. Malicious attacks can be caused by hackers or criminal insiders (employees, contractors or other
third parties).
7
The most common types of malicious or criminal attacks include malware infections, criminal insiders, phishing/social
engineering and SQL injection.
Ponemon Institute© Research Report
Page 10
Figure 6 presents the main root causes of data breach for 11 country samples. At 56 percent,
organizations in the Arabian region are most likely to experience a malicious or criminal attack. In
contrast, Indian and Brazilian companies are least likely to experience such data breaches.
Instead, Indian companies are most likely to experience a data breach caused by a system glitch
or business process failure. Brazilian and Australian companies are most likely to experience a
data breach caused by human error.
Figure 6. Distribution of the benchmark sample by root cause of the data breach
Consolidated view (n=350)
56%
AB
DE
20%
54%
CA
31%
52%
UK
49%
US
49%
FR
48%
JP
48%
AU
39%
BZ
38%
0%
10%
20%
24%
23%
28%
32%
19%
28%
24%
26%
26%
26%
41%
ID
16%
24%
43%
IT
24%
31%
32%
27%
42%
19%
30%
30%
40%
Malicious or criminal attack
Ponemon Institute© Research Report
50%
32%
60%
System glitch
70%
80%
90%
100%
Human error
Page 11
Figure 7 reports the per capita cost of data breach by country sample for three root causes.
These results clearly show data breach costs resulting from malicious or criminal attacks are
consistently higher than those costs resulting from system glitches or human error. This graph
also shows wide variation across country samples. That is, the US cost of a malicious or criminal
data breach incident is $230 per compromised record. In India, this per capita cost is only $71
Figure 7. Per capita cost for three root causes of the data breach
Consolidated view (n=350), measured in US$
US
$230
DE
$224
$194
CA
$227
$184
FR
$210
$201
UK
$173
IT
$174
$201
$177
$176
$169
$157
$152
$133
$119
JP
$151
$115
$125
AU
$153
$122
$114
$132
AB
BZ
$90
$71
ID
$-
$198
$115
$75
$45
$106
$67
$49
$100
$200
$300
Malicious or criminal attack
Ponemon Institute© Research Report
$400
System glitch
$500
$600
$700
Human error
Page 12
Factors that influence the cost of data breach
Table 2 provides a list 11 factors that accelerate or moderate the per capita cost of data breach.
Table 2. Factors that impact the per capita cost of data breach
Factors
Percentage of companies
Employee training
51%
BCM involvement
50%
Incident response team
48%
CISO appointed
45%
Extensive use of encryption
44%
Third party involvement
36%
Consultants engaged
35%
Lost or stolen devices
33%
Insurance protection
32%
Board-level involvement
31%
Rush to notify
29%
Using an incremental analysis method, we compile the positive or negative values for each factor.
The positive dollar values in Figure 8 represent the per capita cost savings. The negative dollar
values represent an increase in the average per capita cost. These dollar values are not additive.
As shown, an incident response team, extensive use of encryption, employee training, business
continuity management, CISO leadership, board-level involvement and insurance protection
decrease the per capita cost of data breach. Third party involvement in the incident, lost or stolen
devices, rush to notify, and consulting services increase the per capita cost of data breach
(shown as negative numbers). For example, an incident response team can reduce the cost of a
data breach by $12.60, from $154 to $141.40. In contrast, third party involvement in the cause of
the data breach results in an increase of $16.00, from $154 to $170.
Figure 8. Impact of 11 factors on the per capita cost of data breach
Consolidated view (n=350), measured in US$
$12.6
Incident response team
Extensive use of encryption
$12.0
Employee training
$8.0
$7.1
BCM involvement
CISO appointed
$5.6
Board-level involvement
$5.5
$4.4
Insurance protection
Consultants engaged
$(4.5)
Rush to notify
$(8.9)
Lost or stolen devices
$(9.0)
Third party involvement
$(16.0)
$(25.0)
$(15.0)
$(5.0)
$5.0
$15.0
Consolidated for all country samples
Ponemon Institute© Research Report
Page 13
Trends in frequency of compromised records and customer turnover
The more records lost, the higher the cost of the data breach. Figure 9 shows the
relationship between the total cost of data breach and the size of the incident for 350
organizations in ascending order by the size of the breach incident. The regression line clearly
indicates that the size of the data breach incident and total costs are linearly related. In this year’s
study, the cost ranged from $116,995 to $28,290,631.
Figure 9. Total cost of data breach by size
Regression = Intercept + {Size of Breach Event} x β, where β denotes the slope.
Consolidated view (n=350), measured in US$
$30,000,000
$25,000,000
$20,000,000
$15,000,000
$10,000,000
$5,000,000
$-
Ascending order by the size of the data breach
Total average cost
Regression
The more churn, the higher the per capita cost of data breach. Figure 10 reports the
distribution of per capita data breach costs in ascending rate of abnormal churn for 350
organizations. The regression line is upward sloping, which suggests that abnormal churn and
per capita costs are linearly related.
Figure 10. Distribution of abnormal churn rates in ascending order by per capita costs
Regression = Intercept + {abnormal churn rate) x β, where β denotes the slope.
Consolidated view (n=350), measured in US$
$600
$500
$400
$300
$200
$100
$-
Ascending order by abnormal churn rates
Per capita cost
Ponemon Institute© Research Report
Regression
Page 14
Certain countries are more vulnerable to churn. Figure 11 reports the average abnormal
churn rates for the 11 countries represented in this research. Results show marked differences
among countries. France continues to experience the highest rate of churn followed by Italy. India
and Brazil experience the lowest abnormal churn or turnover.
The implication of this finding is that organizations in countries with high churn rates could
significantly reduce the costs of data breach by putting an emphasis on customer retention
activities to preserve reputation and brand value.
Figure 11. Abnormal churn rates over three years by country sample
*Historical data is not available
Consolidated view (FY 2015 = 350, FY 2014 = 315, FY 2013 = 277)
4.4%
4.5%
4.5%
FR
3.8%
4.0%
4.1%
IT
3.1%
3.4%
3.6%
UK
3.0%
3.3%
JP
2.8%
US
DE
3.3%
3.4%
3.2%
3.1%
3.8%
2.9%
3.1%
3.1%
AU
AB*
2.7%
3.0%
CA*
2.9%
2.7%
ID
2.5%
2.4%
BZ
0.0%
3.6%
2.4%
0.5%
1.0%
1.5%
2.0%
FY 2013
Ponemon Institute© Research Report
2.5%
FY 2014
3.0%
2.8%
3.0%
3.5%
4.0%
4.5%
5.0%
FY 2015
Page 15
Certain industries are more vulnerable to churn. Figure 12 reports the abnormal churn rate of
benchmarked organizations for the 2014 and 2015 studies. While a small sample size prevents
us from generalizing the affect of industry on customer churn rates, health, pharmaceutical,
financial services and service organizations tend to experience relatively high abnormal churn
8
and public sector and research companies tend to experience a relatively low abnormal churn.
Figure 12. Abnormal churn rates by industry classification of benchmarked companies
Consolidated view (FY 2015 = 350; FY 2014 = 315)
Health
5.9%
6.1%
Pharmaceuticals
6.2%
6.0%
Financial
5.6%
4.2%
4.5%
Services
4.1%
4.4%
Technology
3.6%
3.5%
Industrial
2.9%
Hospitality
3.5%
3.6%
3.3%
Communications
Consumer
3.0%
3.0%
Transportation
3.0%
2.7%
2.8%
2.5%
Energy
2.1%
2.2%
Media
1.3%
Retail
2.1%
2.4%
2.0%
Education
2.3%
1.9%
Research
Public sector
6.1%
0.3%
0.0%
0.0%
1.0%
2.0%
3.0%
FY 2014
4.0%
5.0%
6.0%
7.0%
FY 2015
8
Public sector organizations utilize a different churn framework given that customers of government organizations typically
do not have an alternative choice.
Ponemon Institute© Research Report
Page 16
Trends in the cost components of a data breach
Figure 13 presents four costs components associated with the data breach. As can be seen, lost
business has potentially the most severe financial consequences and has steadily increased over
the past three years. This cost component includes the abnormal turnover of customers,
increased customer acquisition activities, reputation losses and diminished goodwill.
The costs associated with ex-post response and detection are also increasing over three years.
Ex-post costs include help desk activities, inbound communications, special investigative
activities, remediation, legal expenditures, product discounts, identity protection services and
regulatory interventions. Data breach costs associated with detection and escalation typically
include forensic and investigative activities, assessment and audit services, crisis team
management and communications to executive management and board of directors.
Notification-related activities represent the lowest data breach cost component. These costs
typically include IT activities associated with the creation of contact databases, determination of
all regulatory requirements, engagement of outside experts, postal expenditures, secondary
contacts to mail or email bounce-backs and inbound communication set-up.
Figure 13. Trends in four data breach cost components over three years
Consolidated view (FY 2015 = 350, FY 2014 = 315, FY 2013 = 277)
Measured in US$ (millions)
$1.80
$1.60
$1.40
$1.23
$1.20
$1.05
$1.00
$0.80
$1.57
$1.45
$0.86
$0.75
$1.07
$0.99
$0.84
$0.60
$0.40
$0.20
$0.18
$0.19
$0.17
$FY 2013
Detection & escalation
Ponemon Institute© Research Report
FY 2014
Notification
Ex-post response
FY 2015
Lost business
Page 17
The proportion of direct and indirect costs of data breach varies by country
Direct costs refer to the direct expense outlay to accomplish a given activity such as engaging
forensic experts, hiring a law firm or offering victims identity protection services. Indirect costs
include the time, effort and other organizational resources spent during the data breach
resolution. It includes the use of existing employees to help in the data breach notification efforts
or in the investigation of the incident. Indirect costs also include the loss of goodwill and customer
churn.
Figure 14 reports the indirect and direct components of a data breach on a percentage basis for
11 countries. As shown, companies in the US have the highest indirect costs. Brazil and the
Arabian region have the highest direct costs.
Figure 14. Percentage direct and indirect per capita data breach costs
Consolidated view (n=350)
US
66%
CA
34%
59%
41%
DE
57%
43%
AU
56%
44%
FR
54%
46%
IT
53%
47%
UK
53%
47%
IN
50%
JP
50%
47%
AB
53%
44%
BZ
56%
41%
0%
10%
20%
59%
30%
40%
50%
Indirect per capita cost
Ponemon Institute© Research Report
60%
70%
80%
90%
100%
Direct per capita cost
Page 18
The likelihood that an organization will have a data breach
Our research provides an analysis of the likelihood of one or more data breach occurrences in the
next 24 months. Based on the experiences of organizations in our research, we believe we can
predict the probability of a data breach based on two factors: how many records are lost or stolen
and the company’s industry.
Figure 15 shows the subjective probabilities of breach incidents involving a minimum of 10,000 to
9
100,000 compromised records. As can be seen, the likelihood of a data breach steadily
decreases as the size increases. While the likelihood of a data breach involving a minimum of
10,000 records is estimated at approximately 22 percent over a 24-month period, the chances of
a data breach involving a 100,000 records is less than 1 percent.
Figure 15. Probability of a data breach involving a minimum of 10,000 to 100,000 records
Consolidated view (n=350)
0.300
0.245
0.250
0.200
0.153
0.150
0.112
0.089
0.100
0.069
0.045
0.050
0.031
0.020
0.010
0.009
0.000
10,000
20,000
30,000
40,000
50,000
60,000
70,000
80,000
90,000 100,000
Probable size of the data breach (compromised records)
9
Estimated probabilities were captured from sample respondents using a point estimation technique. Key
individuals such as the CISO or CPO who participated in cost assessment interviews provided their estimate
of data breach likelihood for 10 levels of data breach incidents (ranging from 10,000 to 100,000 lost or stolen
records). The time scale used in this estimation task was the forthcoming 24-month period. An aggregated
probability distribution was extrapolated for each one of the 350 participating companies.
Ponemon Institute© Research Report
Page 19
Organizations in certain countries are more likely to have a data breach. Figure 16
summarizes the probability of a data breach involving a minimum of 10,000 records for the 11
countries in this research. While a small sample size prevents us from generalizing country
differences, the estimated likelihood of a material data breach varies considerably across
countries.
Brazil and France appear to have the highest estimated probability of occurrence. Germany and
Canada have the lowest probability of data breach.
Figure 16. Probability of a data breach involving a minimum of 10,000 records by country
A minimum of 10,000 compromised records
*Historical data is not available
Consolidated view (FY 2015 = 350, FY 2014 = 315)
0.301
BZ
0.245
FR
0.356
0.304
0.298
ID
0.210
AB
JP
0.211
0.226
IT
0.213
0.225
0.187
US
0.292
0.220
0.210
0.213
UK
0.178
0.174
AU
CA*
0.163
0.165
0.159
DE
0.000
0.370
0.050
0.100
0.150
0.200
FY 2014
Ponemon Institute© Research Report
0.250
0.300
0.350
0.400
FY 2015
Page 20
Time to identify and contain data breaches impact cost
Figure 17 provides data on the mean time to identify (MTTI) and mean time to contain (MTTC)
the data breach. For our consolidated sample of 350 companies, we estimate a mean time to
identify at 206 days with a range of 20 to 582 days. The mean time to contain is 69 days with a
range of 7 to 175 days.
Figure 17. Mean time to identify and contain data breach incidents (in days)
Consolidated view (n = 350)
700
582
600
500
400
300
206
206
175
200
100
70
69
20
7
0
Minimum
Mean
Median
MTTI
Maximum
MTTC
Figure 18 provides MTTI and MTTC by three root causes of the data breach incident. As shown,
both the time to identify and time to contain is highest for malicious and criminal attacks (256 and
82 days, respectively) and much lower for human-caused data breaches (158 and 57 days,
respectively).
Figure 18. Mean time to identify and contain data breach incidents by root cause (in days)
Consolidated view (n = 350)
300
256
250
200
173
158
150
100
82
60
57
50
0
Malicious or criminal attack
System glitch
MTTI
Ponemon Institute© Research Report
Human error
MTTC
Page 21
Figure 19 shows an upper-sloping linear relationship between total data breach cost and mean
time for 350 companies in 11 countries. This significant relationship suggests the failure to quickly
identify the data breach will lead to higher costs.
Figure 19. Relationship between mean time to identify with total average cost
Regression = Intercept + {MTTI} x β, where β denotes the slope.
Consolidated view (n=350), measured in US$
$30,000,000
$25,000,000
$20,000,000
$15,000,000
$10,000,000
$5,000,000
$-
Ascending order by mean time to identify the breach
Total average cost
Regression
Figure 20 also shows an upper-sloping linear regression line between total data breach cost and
MTTC. Similar to the above, this significant relationship suggests the failure to quickly contain the
data breach will lead to higher costs.
Figure 20. Relationship between mean time to identify with total average cost
Regression = Intercept + {MTTC} x β, where β denotes the slope.
Consolidated view (n=350), measured in US$
$30,000,000
$25,000,000
$20,000,000
$15,000,000
$10,000,000
$5,000,000
$-
Ascending order by mean time to contain the breach
Total average cost
Ponemon Institute© Research Report
Regression
Page 22
The impact of business continuity management on the cost of data breach
Organizations that involved their business continuity management personnel in the data breach
incident response process experienced a lower per capita cost and lower total average cost.
Figure 21 shows more than a $14 difference between the BCM and non-BCM groups in the data
breach cost for one compromised record. A separate report, 2015 Cost of Data Beach Study:
Impact of Business Continuity Management, focuses on the impact business continuity
management has on the financial and reputational consequences of a data breach.
Figure 21. The impact of BCM involvement in the incident response process
Consolidated view (n = 350), measured in US$
$180.00
$160.00
$161.10
$146.90
$140.00
$120.00
$100.00
$80.00
$60.00
$40.00
$20.00
$BCM involvement
No BCM involvement
Per capita cost of a data breach
The following chart shows there is more than a $500,000 difference between the BCM and nonBCM groups in terms of the total average cost of a material data breach incident.
Figure 22. The total average cost of data breach for organizations that involve or fail to
involve BCM in the incident response process
Consolidated view (n = 350), measured in US$ (millions)
$4.50
$4.00
$4.04
$3.54
$3.50
$3.00
$2.50
$2.00
$1.50
$1.00
$0.50
$BCM involvement
No BCM involvement
Total average cost of a data breach (US$ millions)
Ponemon Institute© Research Report
Page 23
In addition to cost differences, we found organizations involving their BCM personnel in the data
breach incident response process were less likely to experience a material data breach involving
10,000 or more compromised records over a one-year period. Figure 23 shows the likelihood of
a material data breach for the BCM and non-BCM groups were 21.1 percent and 27.9 percent,
respectively.
Figure 23. The likelihood of a data breach for organizations that involve or fail to involve
BCM in the incident response process
Consolidated view (n = 350)
27.90%
30.00%
25.00%
21.10%
20.00%
15.00%
10.00%
5.00%
0.00%
BCM involvement
No BCM involvement
Likelihood of a material data breach involving 10,000 or more compromised records within a
12-month period
Previously we showed that the mean time to identify (MTTI) and mean time to contain (MTTC)
were linearly related to data breach costs. Figure 24 shows another interesting interrelationship.
That is, both days to identify and days to contain the data breach incident are substantially lower
for organizations that involved BCM.
Figure 24. MTTI and MTTC for organizations that involve or fail to involve BCM in the
incident response process
Consolidated view (n = 350)
234
250
200
178
150
83
100
55
50
0
BCM involvement (days)
No BCM involvement (days)
MTTI
Ponemon Institute© Research Report
MTTC
Page 24
Part 3. How we calculate the cost of data breach
To calculate the cost of data breach, we use a costing methodology called activity-based costing
(ABC). This methodology identifies activities and assigns a cost according to actual use.
Companies participating in this benchmark research are asked to estimate the cost for all the
activities they engage in to resolve the data breach.
Typical activities for discovery and the immediate response to the data breach include the
following:
§
§
§
§
§
§
Conducting investigations and forensics to determine the root cause of the data breach
Determining the probable victims of the data breach
Organizing the incident response team
Conducting communication and public relations outreach
Preparing notice documents and other required disclosures to data breach victims and
regulators
Implementing call center procedures and specialized training
The following are typical activities conducted in the aftermath of discovering the data breach:
§
§
§
§
§
§
§
Audit and consulting services
Legal services for defense
Legal services for compliance
Free or discounted services to victims of the breach
Identity protection services
Lost customer business based on calculating customer churn or turnover
Customer acquisition and loyalty program costs
Once the company estimates a cost range for these activities, we categorize the costs as direct,
indirect and opportunity as defined below:
§
Direct cost – the direct expense outlay to accomplish a given activity.
§
Indirect cost – the amount of time, effort and other organizational resources spent, but not as
a direct cash outlay.
§
Opportunity cost – the cost resulting from lost business opportunities as a consequence of
negative reputation effects after the breach has been reported to victims (and publicly
revealed to the media).
Our study also looks at the core process-related activities that drive a range of expenditures
associated with an organization’s data breach detection, response, containment and remediation.
The costs for each activity are presented in the Key Findings section (Part 2). The four cost
centers are:
§
Detection or discovery: Activities that enable a company to reasonably detect the breach of
personal data either at risk (in storage) or in motion.
§
Escalation: Activities necessary to report the breach of protected information to appropriate
personnel within a specified time period.
§
Notification: Activities that enable the company to notify data subjects with a letter, outbound
telephone call, e-mail or general notice that personal information was lost or stolen.
§
Post data breach: Activities to help victims of a breach communicate with the company to ask
additional questions or obtain recommendations in order to minimize potential harms. Post
data breach activities also include credit report monitoring or the reissuing of a new account
(or credit card).
Ponemon Institute© Research Report
Page 25
In addition to the above process-related activities, most companies experience opportunity costs
associated with the breach incident, which results from diminished trust or confidence by present
and future customers. Accordingly, our Institute’s research shows that the negative publicity
associated with a data breach incident causes reputation effects that may result in abnormal
turnover or churn rates as well as a diminished rate for new customer acquisitions.
To extrapolate these opportunity costs, we use a cost estimation method that relies on the
“lifetime value” of an average customer as defined for each participating organization.
§
Turnover of existing customers: The estimated number of customers who will most likely
terminate their relationship as a result of the breach incident. The incremental loss is
abnormal turnover attributable to the breach incident. This number is an annual percentage,
which is based on estimates provided by management during the benchmark interview
10
process.
§
Diminished customer acquisition: The estimated number of target customers who will not
have a relationship with the organization as a consequence of the breach. This number is
provided as an annual percentage.
We acknowledge that the loss of non-customer data, such as employee records, may not impact
11
an organization’s churn or turnover. In these cases, we would expect the business cost
category to be lower when data breaches do not involve customer or consumer data (including
payment transactional information).
10
In several instances, turnover is partial, wherein breach victims still continued their relationship with the
breached organization, but the volume of customer activity actually declines. This partial decline is
especially salient in certain industries – such as financial services or public sector entities – where
termination is costly or economically infeasible.
11
In this study, we consider citizen, patient and student information as customer data.
Ponemon Institute© Research Report
Page 26
Part 4. Organizational characteristics and benchmark methods
Pie Chart 3 shows the distribution of benchmark organizations by their primary industry
classification. In this year’s study, 16 industries are represented. The largest sector is financial
services, which includes banks, insurance, investment management and payment processors.
Pie Chart 3. Distribution of the benchmark sample by industry segment
Consolidated view (n=350)
11
10
5 54
7 6
52
12
15
46
27
34
44
35
37
Financial
Services
Industrial
Retail
Public
Technology
Consumer
Transportation
Energy
Communications
Hospitality
Media
Pharmaceutical
Health
Research
Education
Pie Chart 4 shows the distribution of benchmark organizations by total headcount. The largest
segments include companies with more than 1,000 employees.
Pie Chart 4. Global headcount of participating companies
Consolidated view (n=350)
21
22
40
Less than 500
26
500 to 1,000
67
1,001 to 5,000
5,001 to 10,000
10,001 to 25,000
76
25,001 to 75,000
More than 75,000
98
Ponemon Institute© Research Report
Page 27
Data collection methods did not include actual accounting information, but instead relied upon
numerical estimation based on the knowledge and experience of each participant. Within each
category, cost estimation was a two-stage process. First, the benchmark instrument required
individuals to rate direct cost estimates for each cost category by marking a range variable
defined in the following number line format.
How to use the number line: The number line provided under each data breach cost category is one way to
obtain your best estimate for the sum of cash outlays, labor and overhead incurred. Please mark only one
point somewhere between the lower and upper limits set above. You can reset the lower and upper limits
of the number line at any time during the interview process.
Post your estimate of direct costs here for [presented cost category]
LL
______________________________________|___________________________________
UL
The numerical value obtained from the number line rather than a point estimate for each
presented cost category preserved confidentiality and ensured a higher response rate. The
benchmark instrument also required practitioners to provide a second estimate for indirect and
opportunity costs, separately.
To keep the benchmarking process to a manageable size, we carefully limited items to only those
cost activity centers that we considered crucial to data breach cost measurement. Based upon
discussions with learned experts, the final set of items included a fixed set of cost activities. Upon
collection of the benchmark information, each instrument was re-examined carefully for
consistency and completeness.
For purposes of complete confidentiality, the benchmark instrument did not capture any
company-specific information. Subject materials contained no tracking codes or other methods
that could link responses to participating companies.
The scope of data breach cost items contained within our benchmark instrument was limited to
known cost categories that applied to a broad set of business operations that handle personal
information. We believed that a study focused on business process – and not data protection or
privacy compliance activities – would yield a better quality of results.
Ponemon Institute© Research Report
Page 28
Part 5. Limitations
Our study utilizes a confidential and proprietary benchmark method that has been successfully
deployed in earlier research. However, there are inherent limitations with this benchmark
research that need to be carefully considered before drawing conclusions from findings.
§
Non-statistical results: Our study draws upon a representative, non-statistical sample of
global entities experiencing a breach involving the loss or theft of customer or consumer
records during the past 12 months. Statistical inferences, margins of error and confidence
intervals cannot be applied to these data given that our sampling methods are not scientific.
§
Non-response: The current findings are based on a small representative sample of
benchmarks. In this global study, 350 companies completed the benchmark process. Nonresponse bias was not tested so it is always possible companies that did not participate are
substantially different in terms of underlying data breach cost.
§
Sampling-frame bias: Because our sampling frame is judgmental, the quality of results is
influenced by the degree to which the frame is representative of the population of companies
being studied. It is our belief that the current sampling frame is biased toward companies
with more mature privacy or information security programs.
§
Company-specific information: The benchmark information is sensitive and confidential.
Thus, the current instrument does not capture company-identifying information. It also allows
individuals to use categorical response variables to disclose demographic information about
the company and industry category.
§
Unmeasured factors: To keep the interview script concise and focused, we decided to omit
other important variables from our analyses such as leading trends and organizational
characteristics. The extent to which omitted variables might explain benchmark results cannot
be determined.
§
Extrapolated cost results: The quality of benchmark research is based on the integrity of
confidential responses provided by respondents in participating companies. While certain
checks and balances can be incorporated into the benchmark process, there is always the
possibility that respondents did not provide accurate or truthful responses. In addition, the
use of cost extrapolation methods rather than actual cost data may inadvertently introduce
bias and inaccuracies.
Ponemon Institute© Research Report
Page 29
If you have questions or comments about this research report or you would like to obtain
additional copies of the document (including permission to quote or reuse this report), please
contact by letter, phone call or email:
Ponemon Institute LLC
Attn: Research Department
2308 US 31 North
Traverse City, Michigan 49686 USA
1.800.887.3118
[email protected]
Complete copies of all country reports are available at www.ibm.com/security/data-breach
Ponemon Institute LLC
Advancing Responsible Information Management
Ponemon Institute is dedicated to independent research and education that advances responsible
information and privacy management practices within business and government. Our mission is
to conduct high quality, empirical studies on critical issues affecting the management and security
of sensitive information about people and organizations.
As a member of the Council of American Survey Research Organizations (CASRO), we
uphold strict data confidentiality, privacy and ethical research standards. We do not collect any
personally identifiable information from individuals (or company identifiable information in our
business research). Furthermore, we have strict quality standards to ensure that subjects are not
asked extraneous, irrelevant or improper questions.
Ponemon Institute© Research Report
Page 30
SEW03053-WWEN-03


© Copyright 2026