
Alberta Health Services 2011/2012 Operating Budget and Business Plan
Alberta Health Services 2011/2012 Operating Budget and Business Plan Final June 10, 2011 Table of Contents 1 Message from Chief Executive Officer ............................................................................................ 1 2 Executive Summary ........................................................................................................................ 2 3 About This Document...................................................................................................................... 2 4 Alberta Health Services – quick facts .............................................................................................. 3 5 2010/2011 in review ........................................................................................................................ 5 6 5.1 Overview ............................................................................................................................. 5 5.2 2010/11 Year End Results ................................................................................................... 6 5.3 Beds Increased ................................................................................................................... 6 2011/2012 Budget & Business Plan ................................................................................................ 7 6.1 Five-Year Funding Commitment .......................................................................................... 7 6.2 AHS Health Plan & Strategic Direction ................................................................................ 8 6.3 2011/2012 Funds Available for Innovation ......................................................................... 10 6.4 Discussion of Key Priority Measures.................................................................................. 12 7 The Overall Goal ........................................................................................................................... 25 8 Building the Budget ....................................................................................................................... 25 9 8.1 Sources of Funding and Revenue ..................................................................................... 25 8.2 Allocation of Expenses ...................................................................................................... 26 8.3 Consolidated Budget ......................................................................................................... 26 8.4 Budgeted Expenses by Service Category .......................................................................... 26 8.5 2011/2012 Forecast Risks ................................................................................................. 28 8.6 Internally Funded Equipment and Information Technology ................................................ 30 AHS Four-Year Outlook ................................................................................................................ 30 10 Appendices ................................................................................................................................... 32 10.1 Statement of Operations .................................................................................................... 32 10.2 Schedule of Revenues and Expenses by Object ............................................................... 33 10.3 Statement of Changes in Net Assets ................................................................................. 34 10.4 Statement of Financial Position ......................................................................................... 35 10.5 Statement of Cash Flows................................................................................................... 36 10.6 Expense Detail Breakdown ................................................................................................ 37 10.7 Funds Allocated for Key Innovation Initiatives.................................................................... 38 1 Message from Chief Executive Officer Looking back, it‟s reassuring to see that you, the men and women of Alberta Health Services (AHS), have made a substantial start on what will be a continuous journey. AHS started laying down a foundation in its inaugural year of 2008/09, when 12 former health entities were merged into the largest integrated health system in Canada. Goals were set, values and priorities established, and 90,000 of the country‟s best and brightest providers and supporters of health services were ready to move forward, together and in collaboration, on behalf of all Albertans. AHS is now building on that foundation, using the energy and expertise of our physicians and staff, the stability of a five-year funding commitment with the Province, and the directions outlined in the FiveYear Health Action Plan. The targets outlined in the health action plan are key, recognized system indicators that, once achieved, will enable AHS to demonstrate to Albertans that we have become the best-performing, publicly funded health system in Canada. The health action plan, developed in conjunction with Alberta Health and Wellness, reflects a five-year vision of significant improvements in three major service and patient experience areas: primary and community care; access to treatment; and support in older age. In addition, we have identified two other priorities for action: one, enabling AHS staff and physicians to achieve excellence; the other, maximizing the benefits of the largest health-care merger in Canada. Our mission remains the same: to provide a patient-focused, quality health system that is accessible and sustainable for all Albertans. Alberta is the only province with a multi-year funding commitment for health care and, with this commitment we‟ve begun transformational, system-wide actions that will help us achieve both immediate gains and long-term improvements in our priority areas. Our 2011/12 Operating Budget and Business Plan outlines how we propose to use our funding during the second year of our Five-Year Health Action Plan. It describes investments that will bolster primary, home and community care; support and improve existing services; add new capacity, and put AHS in a position to meet Albertans‟ future health needs. AHS plans to focus on 10 key metrics in 2011/2012 and will target our investments and organizational focus to accomplishing these objectives. This will be done within our funding resources. There is still much to accomplish but we are implementing plans, both clinical and financial, to move forward with confidence and purpose. Dr. Chris Eagle President and Chief Executive Officer Alberta Health Services Operating Budget and Business Plan Prepared by AHS Finance Page |1 2 Executive Summary This 2011/2012 Operating Budget and Business Plan is intended to serve the population of Alberta by ensuring appropriate access to quality, sustainable health services. This is the second year of a five year funding commitment made by Government to support AHS in fulfilling its mandate. This arrangement provides funding increments of 6 percent for the next two years and four and one-half percent in each of the final two years. The increase in operating funding for 2011/12 amounts to $545 million. The 2011/2012 Operating Budget and Business Plan represents the operating plan for the strategic direction set out in AHS‟s 2011-2015 Health Plan. The 2011/12 Operating Budget and Business Plan include an allocation of over $550 million of budget for innovation in key targets and priorities identified in the Health Plan (outlined in Appendix 10.7). The Operating Budget and Business Plan outlines $11,974 million of revenue and $11,994 million in expenses resulting in an operating deficit of $20 million. During the course of the 2011/12 fiscal year, AHS will also invest $65 million of internal funds in capital equipment and $135 million in information technology projects. This $200 million plus an additional $15 million for the repayment of long-term debt and $20 million operating deficit is offset by $121 million in amortization of internally funded assets resulting in a $114 million deficit in unrestricted net assets. This deficit will be funded by the unrestricted accumulated surplus from 2010/11 of $116 million and a portion of the other internally restricted net assets from 2010/11 of $34 million, resulting in an unrestricted accumulated surplus of $36 million at March 31, 2012. 3 About This Document The 2011/2012 Operating Budget and Business Plan has been prepared for the AHS Board of Directors and Alberta Health and Wellness. It is a public document and a statement of our commitment to Albertans. The Business Plan explains how available financial resources will be allocated for the 2011/2012 fiscal year. It communicates the results Alberta Health Services (AHS) expects to achieve for the year and links allocations to expectations to AHS‟s 2011-2015 Health Plan (which is a separate document). The 2011/2012 Operating Budget and Business Plan describe how AHS will meet Health Plan performance expectations while living within its means. AHS‟s Operating Budget and Business Plan is comprised of the organization‟s revenues and expenditure allocations for the fiscal year. These include all unrestricted and restricted funds, all AHS subsidiary entities (including Carewest, Calgary Laboratory Services, Capital Care Group), and the proportionate share of primary care networks. The consolidated budget represents the full, comprehensive picture of AHS for 2011/2012. While the 2011/12 Operating Budget and Business Plan describes funding, it cannot, with any justice, describe what the women and men of AHS do every day to improve the health of Albertans and their communities. Section 4 provides a numerical sketch of some of the many services provided daily by AHS staff. The document will describe how funding allocations for 2011/12 will further the priorities outlined in AHS‟s 2011-2015 Health Plan. A brief overview of the Health Plan measures and priorities is provided in Section 6 of this document. In the 2011/2012 fiscal year, the emphasis will be on continued improvement to emergency department wait times and length of stay, initiatives to improve wait times in surgery and radiation therapy, improved choices and access to services for seniors, primary care, Operating Budget and Business Plan Prepared by AHS Finance Page |2 home care and the opening of innovative service delivery facilities such as the South Health Campus in Calgary. This document also outlines the process that was used in building the Operating Budget and Business Plan for this year, an indication of general forecast risks and discussion of specific forecast risks for particular revenues and expenditures. A four-year outlook for revenue and expenditure is provided along with assumptions and discussion. 4 Alberta Health Services – quick facts Alberta Health Services (AHS) is responsible for planning, delivering and evaluating the effectiveness of health services for more than 3.7 million adults and children living in Alberta. Its mission is to provide a patient-focused, quality health system that is accessible and sustainable for all Albertans. AHS was formed in April 2009 through the amalgamation of nine former health regions as well as the Alberta Mental Health Board, the Alberta Cancer Board and the Alberta Alcohol and Drug Abuse Commission. In addition, Emergency Medical Services and health care services to Provincial Correctional Services were subsequently merged with AHS, making this the largest merger in Canadian history. AHS is now the largest health care organization in Canada and the largest employer in Alberta. Some quick facts about AHS are outlined below: 2009 / 2010 2010 / 2011 Preliminary 107,000 112,000 1,030,192 758,971a 377,000 377,280 1,952,803 1,941,798 Urgent Care Visits 125,916 177,158 Hospital Discharges 362,314 364,021 50,738 49,756 2,511,251 2,545,269 6.9 7.0 Alberta Health Services Primary Care Home Care Clients Health Link Calls EMS Calls / Events Acute Care Emergency Department Visits Births Total Hospital Days Average Length of Stay (in days) Operating Budget and Business Plan Prepared by AHS Finance Page |3 2009 / 2010 2010 / 2011 Preliminary Total Primary Hip Replacements 3,131 3,156 Total Primary Knee Replacements 4,128 4,395 28,601 33,714 Main Operating Room Activity 239,999 249,997 MRI exams 165,948 177,422 CT exams n/a b 333,163 Lab Tests 59,135,200 61,260,258 510,532 524,420 46,047 46,889 18,395 18,394 10 98 c Alberta Health Services Diagnostic / Specific Procedures Cataract Surgery Cancer Care Cancer Patient Visits Cancer Patients Receive Treatment, Care & Support Addiction & Mental Health Mental Health Hospital Discharges (acute care sites) Community Treatment Orders (CTO) Issued Notes: a. b. c. Health Link Calls high volumes in 2009/2010 were due to H1N1. CT exam count converted to new methodology effective October 1, 2010. As CTO legislation came into effect in January 2010, the 2009/10 numbers reflect only the last quarter. The information reported is based on number of CTO First Issuances. The goal of CTO is to assist individuals in maintaining compliance with treatment for mental disorders while they live in the community to prevent hospitalization. Operating Budget and Business Plan Prepared by AHS Finance Page |4 5 2010/2011 in review 5.1 Overview Spring 2011 marks the second anniversary of Alberta Health Services (AHS) and the beginning of the second year of the five-year funding commitment between AHS and Government, which was announced in 2009/10. The funding commitment is a first of its kind in Canada and has allowed AHS to begin making longer-term investments to support its key strategic priorities. The strategic priorities for improving health and health care in Alberta are articulated in a document jointly created by Alberta Health and Wellness and AHS entitled “Becoming the Best: Alberta‟s 5-Year Health Action Plan.” This document includes priority actions that will be implemented by both organizations. AHS will contribute to the Government‟s vision of building the best-performing, publicly funded health care system in Canada through a focus on improving quality, access and sustainability. AHS‟s role is outlined in the AHS 2011-2015 Health Plan (available at www.albertahealthservices.ca/3238.asp). Across the province, AHS is engaging with local Health Advisory Councils in an effort to hear and understand regional and community issues. AHS continues to collaborate with the Province of Alberta to establish health care priorities and policies that will benefit all Albertans. Quality, access and sustainability will continue to serve as the cornerstones of our strategic planning. The 2010/11 Operating Budget and Business Plan represented $11.2 billion in operating expenses, which included maintenance of all existing activity and operations as well as priority investment in two critical areas of service: improved choice and access for seniors; and reduced wait times in emergency departments. More than $200 million was invested in key priority initiatives in 2010/11. The full-year annual impact of these and other initiatives will result in an additional $128 million investment in 2011/2012. Key 2010/11 budget investments included: Funding of up to $135 million to improve choice and quality of care for seniors, including the addition of 1,300 continuing care beds. This is part of a three-year plan to increase the number of continuing care beds by approximately 3,000. Funding of up to $50 million for investment in Transformational Improvement Programs, including initiatives to reduce emergency department wait times and surgery wait times. Medical assessment units (MAU) were opened at the Rockyview General Hospital in Calgary and the Royal Alexandra Hospital in Edmonton. Rockyview General Hospital opened the pilot MAU in the spring of 2010 while the Royal Alexandra Hospital unit opened in the fall of 2010. These units improve emergency department flow by accommodating patients who need ongoing care but are not yet admitted to hospital. Patients waiting for an inpatient bed are transferred to this unit, where physicians and nurses initiate consultations, treatment and diagnostics. Information technology investment initiatives to enhance necessary foundational infrastructure to enable one health system. Operating Budget and Business Plan Prepared by AHS Finance Page |5 5.2 2010/11 Year End Results As at March 31, 2011, AHS reported an accumulated surplus of $183 million, of which $50 million is internally restricted for the South Health Campus and $17 million is internally restricted for ongoing parking maintenance, resulting in an unrestricted accumulated surplus of $116 million. The surplus arises primarily from two factors. The first factor relates to challenges in recruiting appropriate skill sets and hiring staff for the implementation of strategic priorities approved in the 2010/11 Business Plan. Once these initiatives are fully implemented, costs for the full year will be incurred and the annual budget provision allocated to them will be consumed. The second major factor related to the fact that the 2010/11 Budget and Business Plan was approved on June 30, 2010, which resulted in only nine months to implement an Operating Budget and Business Plan that reflected a full year of projected activity. This 2010/11 surplus will be targeted toward initiatives supporting our key measures and priorities. AHS is expected to have a balanced accumulated surplus position at the end of the five-year term of the funding commitment with Government. 5.3 Beds Increased By March 31, 2012, AHS estimates it will have increased the number of acute care beds, supportive living spaces and facilities for those with mental health, addiction or other complex needs across the province. Expansion of continuing care beds will continue to be a priority in the years ahead (see table below). The increase in beds is one of the key actions in Alberta‟s 5-Year Health Action Plan. Number of Beds/Spaces Hospital - Acute Care As of March 31, 2010 As of March 31, 2011 Difference % Change 7,762 8,071 309 4.0% Sub-acute in Auxiliary Hospitals 408 408 0 0.0% Psychiatric - Standalone Facilities 867 884 17 2.0% 1,338 1,343 5 0.4% 19,622 20,777 1,155 5.9% Palliative and Hospice 177 181 4 2.3% Mental Health Community Beds/Spaces 436 436 0 0.0% 30,610 32,109 1,499 4.9% Addiction Treatment Continuing Care Alberta Total Source: AHS Bed Survey as of March 31, 2011; Revised May 31, 2011 Note: March 31, 2010 bed numbers were adjusted from 2009/2010 Annual Report to reflect the Lloydminster Hospital in Saskatchewan beds reduced to 35 acute care beds from 65 acute care beds to reflect the number of beds utilized by Albertans as well as incorporating other updated information. Operating Budget and Business Plan Prepared by AHS Finance Page |6 6 2011/2012 Budget & Business Plan This section presents the background and rationale to support the 2011/2012 Budget allocations. It provides an overview of the priorities of the 2011-2015 Alberta Health Services (AHS) Health Plan, with an emphasis on the near-term actions. Expected changes in health system performance for the fiscal 2011/2012 year are specified in the Health Plan. 6.1 Five-Year Funding Commitment The five-year funding commitment by Government to AHS increased the base funding by 6 percent for the 2010/11 fiscal year and additional 6 percent increases in each of the 2011/2012 and 2012/13 fiscal years. Further increases of 4.5 percent will be provided for in each of the remaining two years of the commitment. The funding commitment will provide AHS with an increase of $545 million to the 2011/2012 Operating Budget and Business Plan. The five-year funding commitment provides AHS the ability to make longer-term plans, while maintaining budget control. In previous years, AHS‟s predecessor organizations were increasing spending by between 10 and 11 percent annually. Therefore, even with the significant increase in funding in the five-year funding commitment, AHS must invest carefully, take actions to increase efficiency and maintain tight controls over its spending to ensure sustainability. Costs increase as a result of increases in service volumes, changes in technology, contract rates and inflationary pressures. Since the formation of AHS, the rate of increase in costs has been reduced from an average of over 10 percent to 6 percent and projected to 4.5 percent. AHS has been focusing on financial sustainability as an important element of its strategy since its inception. Savings have been achieved and costs avoided in the past two years by: adding new facilities and capacity with existing resources; negating inflationary pressures through contract re-negotiation; and investing savings in operations to support priority transformational change initiatives. The table below demonstrates how cost savings and avoidance allow AHS to continue to live within its means and invest in key strategic priorities contributing to AHS‟s sustainability in the long term: Historical and Projected Dollar Increases in Health Authority Expenses 18,000,000 16,000,000 14,000,000 Projected total expenses using historical trends1 Avoided cost increases 12,000,000 Reinvested Savings 10,000,000 8,000,000 Current AHS total expenditure forecast AHS Cost Projections (before reinvestment) 6,000,000 1 Increases based on historical cost trend was calculated as 10.5%, starting in 09/10. 2 For comparative purposes, historical expenditures (pre 08/09) were adjusted for inter company eliminations, based on the 2008/2009 audited results. 3 All amounts exclude EMS and Health Corrections Services. Operating Budget and Business Plan Prepared by AHS Finance Page |7 In 2009/10, AHS announced it would achieve approximately $660 million in administrative savings and cost avoidance on an annualized basis. At the end of 2009/10, AHS had achieved $285 million in savings. The annualized impact of 2009/10 savings and additional savings realized in 2010/11 will have a cumulative value of approximately $660 million. Further savings in the 2011/2012 fiscal year and each year after, targeted at one percent annually (in excess of $120 million), will provide an additional source of funds for investment in key operational priorities discussed in Section 6.3 of this document. 6.2 AHS Health Plan & Strategic Direction In December 2010, Alberta Health and Wellness and AHS released a joint 5-year Health Action Plan, entitled “Becoming the Best: Alberta‟s 5-Year Health Action Plan,” which outlines key strategies to drive improvements in our health system. This document lists specific actions and clear performance measures that will be undertaken by each organization to help achieve the ultimate goal of becoming the best-performing, publicly funded health system in Canada. As part of its legislative accountability, on an annual basis, AHS prepares a Health Plan, which outlines the key priorities and actions that AHS will undertake to fulfill its mandate and responsibilities. While it is more common to develop three-year plans, the 2011-2015 Health Plan has been developed as a four year plan, so it aligns to the remaining years of the five-year funding commitment. The 2011-2015 Health Plan is closely aligned with the “Becoming the Best” document, providing detail on AHS‟s role in fulfilling expectations. The 2011/12 Budget and Business Plan is closely aligned with the 2011-2015 Health Plan. To track our progress on improving health and health care, a number of performance measures will be monitored on a quarterly basis. A complete list of performance measures and targets can be found at http://www.albertahealthservices.ca/3201.asp. Operating Budget and Business Plan Prepared by AHS Finance Page |8 The 2011-2015 Health Plan outlines health care improvements for AHS and Albertans through several key strategies. These strategies are aligned with AHS‟s Strategic Direction 2009-2012, which focuses on three goals, eight areas of focus, 20 strategic priorities, and our four values as outlined below: In 2011/2012, AHS‟s key priorities will include initiatives in all three strategic areas: access, quality and sustainability. It is important to note that these three strategic priorities are interrelated. Initiatives in one area will impact the other two areas. For example, initiatives to move alternate level care patients out of acute facilities and into the community result in more appropriate care for the patient (quality) and greater access for patients waiting for an acute bed (access). With the interdependence in mind, below is an outline of the key priorities for 2011/2012: Priorities related to access include initiatives to reduce wait times in key surgery areas (such as cancer, cardiac, hip replacement, knee replacement and cataracts), reduce cancer treatment wait times and continued focus on reducing emergency department wait times and length of stay. Priorities, related to quality and sustainability, include initiatives to improve primary care and population health. These initiatives, described in Section 6.3, will contribute toward long-term sustainability. Additionally, sustainability will be pursued through ensuring the right care at the right location, continued emphasis on strategic procurement initiatives, contract negotiations, utilizing the right staff, acuity-based funding and process-improvement initiatives. Union negotiations such as the United Nurses of Alberta (UNA) increase of two percent in 2011/2012 that will be offset by productivity gains reflect innovative ways the organization is working with its stakeholders to achieve sustainability. Operating Budget and Business Plan Prepared by AHS Finance Page |9 6.3 2011/2012 Funds Available for Innovation The 2011-2015 Health Plan and “Becoming the Best” documents outline several measures that AHS is working toward. Funds available for innovation in 2011/12 will be directed toward 10 key measures focused on access and wait times and toward quality and sustainability initiatives. The 2011/12 Operating Budget and Business Plan include an allocation of over $550 million of budget for innovation in key targets and priorities identified in the Health Plan (see Appendix 10.6). Some of the initiatives supporting these 10 measures were launched in 2010/11. The 2011/12 Operating Budget and Business Plan includes funds committed in 2010/11, the full-year budget impact of initiatives started part-way through the year and incremental allocations for 2011/12. The 10 key priorities for 2011/2012 are outlined in the table below followed by an overview of each of these measures and related strategies: Performance Measures 2009/2010 Actual 2010/2011 Actual Target Target 20112012 20142015 Percentage of patients treated and discharged from the Emergency Department within four hours – busiest 16 sites 63% 64% 75% 90% Percentage of patients treated and admitted to hospital from the Emergency Department within eight hours – busiest 15 sites 38% 41% 60% 90% 7.4 wks 6.0 wks 4 wks 2 wks Urgent 2.4 wks 2.1 wks 1 wks 1 wks · Semi-Urgent 7.0 wks 6.4 wks 2 wks 2 wks · Scheduled 31 wks 24.0 wks 6 wks 6 wks Wait time for hip replacement surgery 36.4 wks 39.4 wks 27 wks 14 wks Wait time for knee replacement surgery 49.1 wks 49.1 wks 35 wks 14wks Wait time for cataract surgery 41 wks 46.9 wks 30 wks 14 wks Wait time for cancer surgery n/a n/a n/a n/a Wait time for cancer (radiation) therapy referral to consultation 2011/12 Funding Commitment (total including 10/11) 2011/12 Funding Commitment (Incremental) $43M (including $24M invested in 2010/11) and $23M of capital commitments for diagnostic imaging (DI) equipment and software $19M $15M $15M Wait time for cardiac surgery : · Number of patients waiting in acute care hospital bed for continuing care placement Number of clients waiting in community (at home) for continuing care placement $87M (including $41M invested in 2010/11) * some of these investments reflect investments in capacity, while others relate to rate increases, staffing and other flow and access improvements $46M $246M (including $136M invested in 2010/11) 707 1,039 Operating Budget and Business Plan Prepared by AHS Finance 471 1,115 375 900 250 750 * some of these investments reflect investments in capacity, while others relate to rate increases, staffing and other flow and access improvements $110M P a g e | 10 In addition to initiatives to achieve the aforementioned targets, the 2011/12 Operating Budget and Business Plan include funds allocated for the following priorities: Funding of up to $84 million for South Health Campus. The campus has been programmed for 800,000 ambulatory visits at full build (twice the capacity of the Foothills Medical Centre). The site will provide a full range of services to support the community and provide new capacity to Calgary in several priority areas, including women‟s health, special care nursery, emergency, surgery and mental health. The facility will integrate care with primary care networks, allowing primary care physicians and specialists to work together to facilitate diagnostics and treatment without having patients wait lengthy periods of time in the emergency department. The model allows the patient to get the right care and rapidly transition back to the community with the right supports, including a plan of care with the local primary care network. Clinical services on the site will be introduced in stages that are anticipated to be completed in early 2013. Funding of up to $11 million for a provincial obesity and chronic disease management initiative that will build a foundation for provincial approaches to chronic diseases, such as diabetes, and focus on long term reductions in the demand on the health system. Nearly two million Albertans (two-thirds of the population) are overweight or obese. No other condition matches obesity‟s far-reaching health consequences. Obesity is both a root cause and complicating factor for Type 2 diabetes, high blood pressure, heart disease, arthritis, depression and many cancers. It is the second highest driver of health costs in the province, after aging. Of equal concern is the prevalence of childhood obesity, which tends to persist through adulthood and is now projected to produce an entire generation of Albertans who can expect early onset of chronic disease, premature disability and reduced life expectancy. Over the next five years, AHS will continue to add and improve the range of services that help people stay well and avoid injuries and chronic diseases. The overall goal is to help Albertans live longer and enjoy an improved quality of life. This funding will provide for an additional 120 bariatric surgeries and approximately 2,000 new patients to be seen for non-surgical specialty care. It will also expand primary care teams in the zones to address obesity and other chronic diseases. Funding of up to $9 million for colorectal cancer reduction initiatives. Colorectal cancer is the second leading cause of cancer deaths in Alberta. There is strong medical evidence to show that colorectal cancer screening can reduce colorectal cancer deaths. An evidence-based provincial colon cancer screening program will allow for consistent colorectal cancer screening practices across the province. An additional 13,350 colonoscopy procedures will be introduced to address wait lists. Funding of a minimum of $5 million for initiatives to improve workforce planning and process improvement. Restricted funding of up to $18 million will be directed toward children‟s mental health programs and the development of a comprehensive Addiction and Mental Health strategy for the province. It will provide Albertans with timely access to addiction and mental health services and programs, and better integrate mental health and addiction services into the overall health system. Funding of up to $37 million (of which $17 million is restricted) will be directed toward home care initiatives to strengthen standardized, accessible and equitable home care services across the province. Initiatives include: expansion of pilot programs designed to reduce the number of seniors requiring emergency department and acute care services; increasing registered nursing resources for home care; increasing case management resources, developing additional programs to support caregivers, developing a team to ensure new capacity is commissioned on time; increasing home care capacity by 3,000 clients, standardizing province wide eligibility criteria for self-managed care funding and reducing the self-managed care wait list. Operating Budget and Business Plan Prepared by AHS Finance P a g e | 11 Funding of up to $200 million in capital investments in initiatives to enhance necessary infrastructure to enable one health system. Funding of up to $10 million to open 11 beds in Neonatal Intensive Care Unit to improve the quality of care for neonate babies in the Calgary zone. 6.4 Discussion of Key Priority Measures The discussion in the following sections outlines each of the 10 key measures and related strategies to address them. Addressing Emergency Department Wait Times AHS recognizes Albertans currently wait too long in emergency departments prior to receiving treatment. Through various actions described over the next few pages, it is our goal that Albertans will spend less time waiting in emergency. Nine out of ten patients treated and discharged from emergency will do so within four hours of arriving if they do not require overnight stay. People who need to be admitted to hospital will be admitted within eight hours or less. Here are the specific measures and actions related to these two priorities: Patients Discharged from Emergency Department within Four Hours WHAT IS BEING MEASURED? Patients discharged from an Emergency Department (ED) or Urgent Care Centre (UCC) measures the length of time from the first documented time after arrival at the ED/UCC to the time they are discharged (16 higher volume EDs). The percentage of patients discharged whose length of stay in ED/UCC is less than four hours is reported. WHY IS THIS IMPORTANT? The amount of time spent waiting for treatment is a measure of access to the health care system. Patients treated in the ED/UCC should receive care in a timely fashion. Excessive wait times for care can result in treatment delays for individual patients and reduced efficiency in the flow of patients. WHAT IS THE TARGET? Alberta Health Services has established a 2010/11 target of 70 per cent of patients discharged within four hours for the 16 higher volume EDs. Source: Calgary and Edmonton Emergency Department Information System Data (REDIS,EDIS) and AHS Ambulatory Care Reporting System Data (ACRS, NACRS) HOW ARE WE DOING? In Q4 2010/11, 65 per cent of patients at the 16 higher volume EDs were discharged within four hours. This is below the target. WHAT ACTIONS ARE WE TAKING? Actions completed to date: Staffing schedules at Health Link Alberta have been optimized to match call presentation patterns, a radio campaign was launched to promote the benefits of Health Link Alberta and urgent care centres, additional efforts have been focused at those sites remaining below target. Calgary Zone (Foothills Medical Centre, Rockyview Operating Budget and Business Plan Prepared by AHS Finance P a g e | 12 General Hospital, Peter Lougheed Centre): Added an extra physician shift on Mondays due to high activity (Foothills) Revised criteria for activating the on-call ED physician to ensure a more proactive response Addition of the equivalent of 10 FTE‟s of physician support in the ED (e.g. the on-call ED physician has been accessed 70-80per cent of the time) Assigned a triage nurse to focus on patient flow within the ED (Foothills) Implemented ED physician huddles each morning Installed greeters in the waiting rooms to answer questions and to assist patients and families Increased use of transporting EMS patients to alternate destinations (i.e. Urgent Care Centers) Daily discharge rounds at all sites The use of an electronic decision support tool by nurses and doctors, MEDWORXX, to identify those patients who are ready for discharge (Foothills & Rockyview) In the Edmonton zone (University of Alberta Hospital, Royal Alexandra Hospital, Grey Nuns Community Hospital, Misericordia Community Hospital, Sturgeon Community Hospital): Implementation of LEAN improvement projects to improve patient flow and access: o Grouping of like patients to designated ED spaces with specific physician/nurse teams and reorganization of common supplies/equipment for each patient type. Preliminary results of 18 per cent more patients discharged within target (Royal Alexandra) o Strategies developed to reduce specific process times; e.g. triage to bed location; to physician assessment; to consult times; to admission to ward or discharge from ED (U of A, Misericordia) o Improved turn-around times for lab testing (Grey Nuns, Misericordia) The Sturgeon facility moved into its new physical ED space; education on redesigned ED processes delivered to physicians and nurses Addition of Care Manager to facilitate elderly population accessing community resources (Misericordia) Enhanced multidisciplinary support in ED (Physiotherapy and Social Work) to identify patients that can go home with added resources (Grey Nuns) Increased staffing in Rapid Assessment Zone and Fast Track to improve turn-around time and thus free up treatment spaces (Grey Nuns) Subsequent actions planned: In the Calgary zone (Foothills, Rockyview, Peter Lougheed): Process improvement review to reduce the time from triage to patient registration (Rockyview) Review feasibility of adding an extra surge shift for ED physicians on Monday/Tuesday (busiest days) (Rockyview) Potential relocation of Transition Services support within the ED to better manage complex discharge processes (Foothills) In the Edmonton zone (U of A, Royal Alexandra, Grey Nuns, Misericordia, Sturgeon): Implementation of software using real-time information from the ED to display patient volumes, incoming EMS volumes and the severity of patient conditions across Edmonton sites (the system has been used in Calgary since 2007 and has helped to provide a window into ED workload, assist with managing existing capacity and allow EMS to return to service faster) Implementation of LEAN improvement project to identify and decrease obstacles to timely patient discharge from the ED (Royal Alexandra) Investigate with Diagnostic Imaging ability for enhanced after hours services (Sturgeon) Add Care Manager to facilitate elderly population accessing community resources (Grey Nuns) Benchmark and model efficiencies gained from the Royal Alexandra LEAN improvement project (U of A) Operating Budget and Business Plan Prepared by AHS Finance P a g e | 13 Addition of 12 new treatment spaces to the Stollery Children‟s Hospital ED is on track for March 2012 Complete process mapping to identify opportunities to improve patient flow from triage to admission/discharge (Stollery) ED physicians will enhance coverage by modifying shift rotations to ensure maximum coverage during peak times (U of A, Stollery) HOW ARE WE RESOURCING THIS? The 2011/12 Operating Budget and Business Plan includes $43 million toward initiatives to reduce ED wait times and length of stay including initiatives that began in 2010/11, plus an additional $23M of capital commitments for Diagnostic Imaging equipment and software. Patients Admitted from Emergency Department within Eight Hours WHAT IS BEING MEASURED? The total time patients spend in an Emergency Department (ED) is calculated from the first documented time after arrival at emergency until the time they enter the hospital as an inpatient (15 higher volume EDs). The percentage of admitted patients whose length of stay in ED is less than eight hours is reported. This measure does not apply to Urgent Care Centre (UCC) facilities as these facilities do not have inpatient spaces to receive admitted patients. Sites in this grouping are based on criterion of high volume or in a category of teaching, large urban and regional emergency centre. WHY IS THIS IMPORTANT? ED patients requiring hospital admission should be admitted to the appropriate inpatient environment in a timely fashion. Total time spent can be a measure of access to the health care system and a reflection of efficient use of resources. WHAT IS THE TARGET? Alberta Health Services (AHS) has established a target of 45 per cent of patients admitted leaving the ED within eight hours for the 15 higher volume EDs for 2010/11. HOW ARE WE DOING? In Q4 2010/11, 44 per cent of admitted patients at the 15 higher volume EDs left the ED within eight hours. Chart Source: Calgary and Edmonton Emergency Department Information System Data (REDIS,EDIS) and AHS Ambulatory Care Reporting System Data (ACRS, NACRS) WHAT ACTIONS ARE WE TAKING? Actions completed to date: A total of 323 new hospital beds have been opened in Calgary and Edmonton as of March 31, 2011 to improve patient flow. Staffing schedules at Health Link Alberta have also been optimized to match call presentation patterns, and a radio campaign was launched to promote the benefits of Health Link Alberta and urgent care centres. Additional efforts have been focused at those sites which remain below target. Operating Budget and Business Plan Prepared by AHS Finance P a g e | 14 Calgary Zone (Foothills Medical Centre, Rockyview General Hospital, Peter Lougheed Centre): Addition of the equivalent of 10 FTE‟s of physician support in the ED (e.g. the on-call ED physician has been accessed 70-80 per cent of the time) Bed huddles implemented three times a day Software implemented to initiate earlier discharge planning on inpatient units Optimization of Medical Assessment Unit (Rockyview) Ongoing implementation of over-capacity protocols Monitoring of Length of Stay data for those services that are above the national average and developing strategies and processes to reduce LOS Edmonton Zone (University of Alberta Hospital, Royal Alexandra Hospital, Grey Nuns Community Hospital, Misericordia Community Hospital, Sturgeon Community Hospital): Medicine Unit Manager coverage expanded to the weekend and initiation of weekend bed huddle meetings to enhance patient movement out of ED seven days per week (Royal Alexandra) Expanded bed huddles with support services to develop daily plans to expedite transfer of patients to inpatient bed spaces Addition of a Triage Liaison Physician to facilitate timely consults, review admission issues, need for telemetry and suggest orders to ensure patients requiring admission are moved in a timely manner The Sturgeon facility moved into its new physical ED space; education on redesigned ED processes delivered to physicians and nurses Length of stay (LOS) task force established and LEAN training delivered to managers, directors, educators and unit supervisors to identify further opportunities for reducing LOS Subsequent actions planned: The five-year expansion plan for additional continuing care spaces is expected to reduce ED length of stay for patients requiring admission from ED. Calgary Zone (Foothills, Rockyview, Peter Lougheed): Process improvement efforts to reduce: (1) time between triage and admission process; and (2) turn-around time for inpatient bed availability Additional community capacity planned for Alternate Level of Care, Mental Health and Home Care Ongoing work with Mental Health on transition units to support transfer of mental health patients where appropriate Work is ongoing with Community partners to identify opportunities for decreasing the number of patients on delay for supported living Edmonton Zone (U of A, Royal Alexandra, Grey Nuns, Misericordia, Sturgeon): Implementation of software using real-time information from the ED to display patient volumes, incoming EMS volumes and the severity of patient conditions across Edmonton sites (the system has been used in Calgary since 2007 and has helped to provide a window into ED workload, assist with managing existing capacity and allow EMS to return to work faster) Increases to the number of daily bed huddles Sharing of the most effective/efficient triage models across inpatient services to improve flow I-Care Unit to open at U of A to accommodate general internal medicine patients that require closer observation and telemetry for a further 24-48 hours (patients previously boarded in ED) Ongoing review of ED patients exceeding the eight hour target: examination of barriers, issues and opportunities for improvement Addition of 12 new treatment spaces to the Stollery Children‟s Hospital ED is on track for March 2012 Operating Budget and Business Plan Prepared by AHS Finance P a g e | 15 HOW ARE WE RESOURCING THIS? The 2011/12 Operating Budget and Business Plan includes $43 million toward initiatives to reduce ED wait times and length of stay including initiatives that began in 2010/11, plus an additional $23M of capital commitments for Diagnostic Imaging equipment and software. Wait Times for Radiation Therapy AHS recognizes that currently Albertans wait too long prior to receiving radiation therapy treatment. Through various actions described below it is our goal that Albertans will spend less time waiting for treatment. Through the initiatives described below, Cancer patients will get radiation therapy sooner and closer to home where appropriate. WHAT IS BEING MEASURED? AHS-Cancer Care is currently measuring two important wait times: referral to consultation by radiation oncologist and ready-to-treat to first radiation therapy. Referral to Consultation by Radiation Oncologist Wait Time The first wait time, referral to consultation by radiation oncologist, is described as the time from the date that a referral was received from a physician outside a cancer facility to the date that the first consult with a radiation oncologist occurred. Currently this data is only collected on patients referred to a tertiary cancer facility [Cross Cancer Institute (CCI) in Edmonton, Tom Baker Cancer Centre (TBCC) or Holy Cross in Calgary]. There is a project underway to collect this data at four additional cancer centres that provide consultations to patients in Lethbridge, Medicine Hat, Red Deer, and Grande Prairie. The 90th percentile is the time it takes in weeks for 90 per cent of patients to have had their first consult. Ready-to-Treat to First Radiation Therapy Wait Time The second wait time, ready-to-treat to first radiation therapy, is described as the time from the date the patient was physically ready to commence treatment to the date that the patient received his/her first radiation therapy. Currently this data is only reported on patients who receive radiation therapy at the CCI or the TBCC. The data apply only to patients receiving external beam radiation therapy (i.e. brachy therapy is not included). The 90th percentile is the time it takes in weeks for 90 per cent of patients to have had their first treatment after being assessed as ready for treatment. WHY IS THIS IMPORTANT? Wait times are an important measure of how quickly people are getting access to cancer care. They reflect the ability of Alberta Health Services to meet the needs of cancer patients. It is important to use wait time information to improve access because in cancer care, outcomes of treatment are adversely affected by prolonged wait times. WHAT IS THE TARGET? The Alberta target for referral to radiation oncologist consultation is four weeks for 90 per cent of patients and the target for radiation treatment is that 90 per cent of patients will receive their first treatment within four weeks of being ready to treat. HOW ARE WE DOING? Referral to Consultation by Radiation Oncologist Wait Time Operating Budget and Business Plan Prepared by AHS Finance P a g e | 16 Wait times from cancer referral to consultation by radiation oncologists are outside the target. However, in the majority of tumour groups, patients are seen within the target timeline. The wait time is 5.5 weeks in Q4 2010/11. Ready-to-Treat to First Radiation Therapy Wait Time The proportion of patients receiving radiation therapy within the expected time period is better than the target. Significant improvement has occurred since Q4 2009/10. The Q4 2010/11 90th percentile time was 3.7 weeks. WHAT ACTIONS ARE WE TAKING? Referral to Consultation by Radiation Oncologist Wait Time Actions completed to date: The First Contact program teams have been established at both the Tom Baker Cancer Centre (four tumour groups) and the Cross Cancer Institute (two tumour groups). This enables new patients to be contacted within 48 hours and given appointment dates. In addition, a Radiation Therapy Wait Time plan has been designed to meet the four-week target by the end of the 2011/12 year, consisting of: (1) improvements in referral management; (2) re-engineering of clinical scheduling processes; and (3) a strategic frontline staff adjustment. Subsequent actions planned: Subject to approval, implementation of the Radiation Therapy Wait Time plan is scheduled to begin in summer 2011. As well, implementation will continue on rolling out the First Contact program to all sites and for all tumour groups by the end of 2012/13. Ready-to-Treat to First Radiation Therapy Wait Time Actions completed to date: The Jack Ady Cancer Centre in Lethbridge is now fully operational and to March 31, 2011 has delivered almost 250 courses of radiation therapy to patients since opening. All three sites are currently performing better than target. Subsequent actions planned: Performance at all sites will continue to be monitored and action plans established in the event targets are not being met. Expansion of tumour sites treated at the Jack Ady Cancer Centre will expand in 2011/12 to include radical lung cancer patients. Re-engineering of business processes for radiation therapy consultation will occur in Edmonton and Calgary. In addition, planning remains on track to open the Central Alberta Cancer Centre in Red Deer in 2013. HOW ARE WE RESOURCING THIS? The 2011/12 Operating Budget and Business Plan includes funding of up to $9 million for initiatives including the Radiation Therapy Corridor ($7 million) and for the continued support of the First Contact Program, process planning and staffing optimization ($2 million). Wait Times for Cardiac Surgery Coronary Artery Bypass Graft (CABG) Wait Time WHAT IS BEING MEASURED? Coronary artery bypass graft (CABG) wait time is calculated as the time from the date of cardiac catheterization to the date surgery was completed. If a cardiac catheterization was not performed, the wait time is calculated from the date of alternate imaging, or from the date of cardiology referral to surgery. Only scheduled CABG surgeries on adults 18 years of age and older are included in this measure; emergency procedures are not included. Urgency levels for patients are determined during peerreviewed physician rounds in Edmonton, and by guidelines reviewed by surgeons in Calgary. Patients whose urgency level changed are excluded. Operating Budget and Business Plan Prepared by AHS Finance P a g e | 17 The 90th percentile is the time it takes in weeks for 90 percent of patients to have had their surgery. Median wait time is the point at which 50 percent of patients have had their surgery. WHY IS THIS IMPORTANT? Wait times for surgical procedures are used as an indicator of access to the health care system and reflect the efficient use of resources. WHAT IS THE TARGET? There are three targets depending on the urgency of the surgery. The provincial/territorial benchmark for Urgency I CABG surgeries is within two weeks. The AHS target for 2010/11 is 1.5 weeks for urgent CABG surgeries. Chart Source: AHS Open Heart Waitlist Database (Edmonton), VELOS, APPROACH and OR data from ORIS (Calgary) The provincial/territorial benchmark for Urgency II CABG surgeries is within six weeks. The AHS target for 2010/11 is five weeks for semi-urgent CABG surgeries. The provincial/territorial benchmark for Urgency III CABG surgeries is within 26 weeks. The AHS target for 2010/11 is 15 weeks. HOW ARE WE DOING? The wait time for urgent and scheduled CABG surgery is somewhat longer than target. Significant improvement has been seen since the last quarter on the wait time for semi-urgent CABG surgery and performance is now better than target. WHAT ACTIONS ARE WE TAKING? Actions completed to date: A computerized “flagging” system was implemented to identify patients who are close to exceeding the allowable wait time in their applicable urgency category. A clinical assessment is then made to ensure patient safety. As well, a process was implemented for daily triage of urgent and semi-urgent cases based on patient needs and operating room availability. Operating Budget and Business Plan Prepared by AHS Finance P a g e | 18 Subsequent actions planned: A three-year plan for cardiac surgery to meet AHS targets will be completed by Fall 2011. Both Calgary and Edmonton are working on refining the booking process and continuing with a central intake/wait list for urgent and semi-urgent patients. As well, we are refining the development and implementation of a process to increase surgeon awareness of patients on the waiting list and length of time waiting- alerts for patients nearing access benchmarks. In this process we are ensuring that patients requiring other types of cardiovascular surgeries are not impacted.Wait time definitions have been refined and standardized between Calgary and Edmonton to ensure consistent reporting of data. A new cardiac surgeon has been recruited to Edmonton effective March 2011. A new division chief of Cardiovascular Surgery will be hired by the fall of 2011 in Calgary. In Calgary and Edmonton, a waitlist review was completed in which outliers in the scheduled category were identified and the reason for delay was classified; i.e. delay due to surgeon issues, patient preference, vacation, medical conditions, etc. This resulted in the ability to remove patients because of „patient decision‟ or „medical reason‟ from the total wait time. In Edmonton, an improvement project is already underway involving 3 key components: 1. The wait list will be actively managed to identify patients who are falling outside of the identified target for their urgency level. This will parallel successful national workdone in pediatric wait times and mirror work being done by the Surgical Network led by Dr.Bill Cole. Key in this management will be effective communication with the referring cardiologists at all sites including Covenant Health. A system to monitor patients post catheterization will be developed to ensure accurate wait time data are collected, the patient‟s condition is assessed regularly and the referring cardiologist and primary care physician are aware of the patient‟s status. 2. OR Efficiencies: To ensure that the system is functioning to maximum efficiency all processes will be reviewed with the available data. This will include reviewing OR slate management, start and end times, case and turnover times. Of the approximate 100 same day postponements in 2009, there was lost opportunities to utilize surgical capacity 50% of the time. Opportunities to better manage will be explored. 3. Ward Efficiencies: To ensure system flow operates efficiently, length of stay data will be measured against like facilities. The heart institute management team, surgeons and front line staff will play a major role in this initiative. HOW ARE WE RESOURCING THIS? The 2011/12 Operating Budget and Business Plan includes funding of up to $1.1 million for initiatives to reduce CABG wait times. This is included in the $87 million allocation for initiatives to reduce surgery wait times including related investments and initiatives that began in 2010/11. Hip and Knee Replacement Wait Times Hip Replacement Wait Time WHAT IS BEING MEASURED? Hip replacement wait time is the time from the date the patient and clinician agreed to hip replacement (arthroplasty) surgery as the treatment option of choice, to the date surgery was completed. Only scheduled, elective hip replacements are included in this measure. Emergency cases are not included in the calculation. The 90th percentile is the time it takes in weeks for 90 percent of patients to have had their surgery. Chart Source: AHS; DIMR from Site Surgery Wait List and Surgical Databases Operating Budget and Business Plan Prepared by AHS Finance P a g e | 19 WHY IS THIS IMPORTANT? Wait times for surgical procedures are used as an indicator of access to the health care system and reflect the efficient use of resources. WHAT IS THE TARGET? The provincial/territorial benchmark for hip replacement surgeries is within 26 weeks. The Alberta target for 2010/11 is 28 weeks. HOW ARE WE DOING? The wait time for hip replacement surgery is significantly longer than the target. As there is variation across the province in how definitions of urgency are applied and data is collected, the actual wait time may be less than reported. Alberta Health Services (AHS) is developing standard definitions for measurement of wait times, to improve the accuracy of the measure for future reports. WHAT ACTIONS ARE WE TAKING? Actions completed to date: A new central intake process has been established in all five zones. A new 56 bed, four operating room orthopedic surgery centre was opened in Edmonton. The provincial Hip and Knee Replacement Transformational Improvement Program (TIP) continues with a view to reducing wait times and length of stay. A provincial plan to achieve the 14 week wait time targets by 2014/15 for hip and knee replacement has been developed. Subsequent actions planned: Funding for year one of the five-year provincial hip and knee replacement plan will increase knee replacement volumes starting in Summer 2011, once staff/physician resources are in place. These increased volumes, along with ongoing improvement work to eliminate inefficient processes and use of inpatient and sub-acute bed days, will help to achieve wait time targets. Variation in central intake processes across the province will also be addressed. As well, better linkage of primary health care providers to medical and surgical specialists will occur through a standardized approach for assessing, referring and booking patients with specialists (cancer, cardiac, hip/knee, and cataract), to be developed by early 2012. HOW DO WE COMPARE? Using a similar measure in 2009, Alberta ranked fifth among nine provinces for hip replacement surgery wait times, with Alberta at 35.7 weeks and the best-performing province (Ontario) at 22.9 weeks (CIHI, 2009). HOW ARE WE RESOURCING THIS? The 2011/12 Operating Budget and Business Plan includes funding of up to $14 million for initiatives to reduce hip and knee surgery wait times. This is included in the $87 million allocation for initiatives to reduce surgery wait times including related investments and initiatives that began in 2010/11. Knee Replacement Wait Time WHAT IS BEING MEASURED? Knee replacement wait time is the time from the date the patient and clinician agreed to knee replacement (arthroplasty) surgery as the treatment option of choice, to the date surgery was completed. Only scheduled, elective knee replacements are included in this measure. Emergency cases are not included in the calculation. The 90th percentile is the time it takes in weeks for 90 percent of patients to have had their surgery. Operating Budget and Business Plan Prepared by AHS Finance P a g e | 20 Chart Source: AHS, DIMR from Site Surgery Wait List and Surgical Databases WHY IS THIS IMPORTANT? Wait times for surgical procedures are used as an indicator of access to the health care system and reflect the efficient use of resources. WHAT IS THE TARGET? The provincial/territorial benchmark for knee replacement surgeries is within 26 weeks. The Alberta target for 2010/11 is 42 weeks. HOW ARE WE DOING? The wait time for knee replacement surgery is longer than the target. As there is variation across the province in how definitions of urgency are applied and data is collected, the actual wait time may be less than reported. Alberta Health Services (AHS) is developing standard definitions for measurement of wait times, to improve the accuracy of the measure for future reports. WHAT ACTIONS ARE WE TAKING? Actions completed to date: A new central intake process has been established in all five zones. A new 56 bed, four operating room orthopedic surgery centre was opened in Edmonton. The provincial Hip and Knee Replacement Transformational Improvement Program (TIP) continues with a view to reducing wait times and length of stay. A provincial plan to achieve the 14 week wait time targets by 2014/15 for hip and knee replacement has been developed. Subsequent actions planned: Funding for year one of the five-year provincial hip and knee replacement plan will increase knee replacement volumes starting in Summer 2011, once staff/physician resources are in place. These increased volumes, along with ongoing TIP work to eliminate inefficient processes and use of inpatient and sub-acute bed days, will help to achieve wait time targets. Variation in central intake processes across the province will also be addressed. As well, better linkage of primary health care providers to medical and surgical specialists will occur through a standardized approach for assessing, referring and booking patients with specialists (cancer, cardiac, hip/knee, and cataract), to be developed by early 2012. HOW DO WE COMPARE? Using a similar measure in 2009, Alberta ranked fourth among nine provinces for knee replacement surgery wait times with Alberta at 50.3 weeks and best-performing province (Ontario) at 26.3 weeks (CIHI, 2009) HOW ARE WE RESOURCING THIS? The 2011/12 Operating Budget and Business Plan includes funding of up to $14 million for initiatives to reduce hip and knee surgery wait times. Cataract Surgery Wait Time WHAT IS BEING MEASURED? Cataract surgery wait time is defined as the time from the date when the patient and clinician agreed to cataract surgery as the treatment option of choice, to the date the surgery was completed. Only the first eye cataract surgery is included in the measure. Patients who voluntarily delayed their procedure, those who had a scheduled follow-up procedure, and those who received emergency care Operating Budget and Business Plan Prepared by AHS Finance P a g e | 21 are excluded from the measure. The 90th percentile is the time it takes in weeks for 90 percent of patients to have had their surgery. Chart Source: Alberta Health and Wellness WHY IS THIS IMPORTANT? Wait times for surgical procedures are used as an indicator of access to the health care system and reflect the efficient use of resources. WHAT IS THE TARGET? The provincial/territorial benchmark for cataract surgeries is within 16 weeks. The Alberta target for 2010/11 is 36 weeks. HOW ARE WE DOING? The preliminary result for 90th percentile wait time for Cataract Surgery for Q4 2010/11 was 46.1 weeks which exceeds the target time of 36 weeks. WHAT ACTIONS ARE WE TAKING? Actions completed to date: Cataract volumes for the 2010/11 year increased to 12,180 in Calgary and 13,961 in Edmonton, an increase of 2,889 and 2,136 cases from the previous year, respectively. Of all the Zones, Calgary continues to have the highest backlog of cases, yet this was reduced from 9,500 people waiting in October 2010 to 6,050 people waiting in April, 2011. As well, the average wait time in Calgary also decreased from 28 (April 2010) to 24 weeks (April 2011). Subsequent actions planned: Contract extensions with non-hospital surgical facilities in Edmonton and Calgary have been negotiated. Calgary and Edmonton cataract activity will continue into the 2011/12 fiscal year with increased volumes allocated as in 2010/11. In addition, a 3-year plan for meeting longterm wait time targets is scheduled for completion in Fall 2011. Plans are underway to manage the waitlist by ensuring that all patients who need to be waitlisted are. HOW DO WE COMPARE? Using a similar measure, Alberta ranked 10th among 10 provinces for cataract surgery wait times with Alberta at 38.6 weeks and the best-performing province (Ontario) at 14.9 weeks (CIHI, 2009). HOW ARE WE RESOURCING THIS? The 2011/12 Operating Budget and Business Plan includes funding of up to $1.6 million for initiatives to reduce cataract surgery wait times. This is included in the $87-million allocation for initiatives to reduce surgery wait times. Wait time for Cancer Surgery AHS and Alberta Health and Wellness will launch a co-ordinated provincial cancer strategy to reduce the incidence of cancer, increase access to cancer treatment across Alberta, and improve the quality of life for those living with the disease. The strategy will address immediate and future needs for prevention, detection and treatment of cancer, as well as workforce requirements. HOW ARE WE RESOURCING THIS? The 2011/12 Operating Budget and Business Plan includes funding of up to $11 million for initiatives to reduce cancer surgery wait times. Some of these investments reflect increases in capacity, while other relate to rate increases, staffing and other flow and access improvements. Operating Budget and Business Plan Prepared by AHS Finance P a g e | 22 This is included in the $87 million allocation for initiatives to reduce surgery wait times including related investments and initiatives that began in 2010/11. People Waiting in Acute/Sub-Acute Beds for Continuing Care Placement WHAT IS BEING MEASURED? People waiting in acute/sub-acute (hospital) beds for continuing care placement is a count of the number of persons who have been assessed and approved for placement in continuing care, who are waiting in a hospital acute care or sub-acute bed. This includes acute care palliative and acute mental health. The numbers presented represent a snapshot of the last day of the reporting period. Chart Source: AHS "Snapshots" of the wait list at the end of the month WHY IS THIS IMPORTANT? Access to continuing care services is a significant issue in Alberta. As such, a focused, multiplestrategy approach is needed to provide both seniors and persons with disabilities more options for quality accommodations specific to their service needs and lifestyles. By reducing the number of people waiting in a hospital environment for continuing care, we will be able to improve patient flow throughout the system, provide more appropriate care to meet patient needs, decrease wait times and deliver care in a more cost-effective manner. WHAT IS THE TARGET? The target for 2010/11 is for 400 or fewer people to be waiting in acute/sub-acute (hospital) beds for continuing care placement. This is a decrease from the baseline of 700 in 2008/09. HOW ARE WE DOING? At the end of Q4 2010/11, 471 people were waiting in acute/sub-acute (hospital) beds for continuing care placement, which is above the target of 400. WHAT ACTIONS ARE WE TAKING? Actions completed to date: 1,166 continuing care spaces were opened across the province as of March 31, 2011. This represents the number of incremental continuing care spaces established. In addition, Home Care services continue to be expanded across the province. As well, implementation has begun on an “ED2Home” program to expedite discharge of seniors and disabled adults from the Emergency Department to their homes with appropriate connections to community supports, thus reducing avoidable stays in a hospital bed. Subsequent actions planned: An additional 1,000 continuing care spaces are planned to open during the 2011/12 year. This number builds off the 1,166 spaces opened in 2010/11, and serves as the next phase towards the long-term target of opening 5,300 new continuing care spaces by 2015. Roll-out of new programs such as ED2Home will be expanded. Planning is also underway to identify additional strategies to reduce the number of persons waiting in acute/sub-acute beds for continuing care (including expansion in the number of clients receiving Home Care services). Operating Budget and Business Plan Prepared by AHS Finance P a g e | 23 HOW ARE WE RESOURCING THIS? The 2011/12 Operating Budget and Business Plan includes funding of up to $246 million (including $136 million invested in 2010/11 plus an incremental $110 million in 2011/12) for initiatives to provide more choice for continuing care. People Waiting in Community for Continuing Care Placement WHAT IS BEING MEASURED? People waiting in community for continuing care placement is a count of the number of persons who have been assessed and approved for placement in continuing care, and are waiting in the community (at home). The numbers presented are a snapshot of the last day of the reporting period. Chart Source: AHS “Snapshots” of the Wait List at the end of the quarter WHY IS THIS IMPORTANT? Access to continuing care services is a significant issue in Alberta. As such, a focused, multiplestrategy approach is needed to provide both seniors and persons with disabilities more options for quality accommodations specific to their service needs and lifestyles. WHAT IS THE TARGET? The target for 2010/11 is for 975 or fewer people to be waiting in the community (at home) for continuing care placement. This is a decrease from the baseline of 1,065 in 2008/09. HOW ARE WE DOING? At the end of Q4 2010/11, 1,115 people were waiting in the community (at home) for continuing care placement, which is above the target of 975. WHAT ACTIONS ARE WE TAKING? Actions completed to date: 1,166 continuing care spaces were opened across the province as of March 31, 2011. This represents the number of incremental continuing care spaces established. In addition, plans have been approved to expand Home Care hours to allow at least 3,000 more people to receive Home Care services in the year (e.g. through increased funding for Home Care service providers, enhancing existing services, as well as expanding eligibility for Home Care support). Subsequent actions planned: An additional 1,000 continuing care spaces are planned to open during the 2011/12 year. This number builds off the 1,166 spaces opened in 2010/11, and serves as the next phase towards the long-term target of opening 5,300 new continuing care spaces by 2015. Planning is also underway to identify additional strategies to reduce the number of persons waiting in the community for continuing care (including expansion in the number of clients receiving Home Care services). HOW ARE WE RESOURCING THIS? The 2011/12 Operating Budget and Business Plan includes funding of up to $246 million (including $136 million invested in 2010/11 plus an incremental $110 million in 2011/12) for initiatives to provide more choice for continuing care. Operating Budget and Business Plan Prepared by AHS Finance P a g e | 24 7 The Overall Goal WHAT DOES SUCCESS LOOK LIKE FOR AHS? The 2011-2015 Health Plan outlines a series of specific performance measures that will gauge our progress toward meeting our goals and objectives. In four years, Albertans can expect a stronger, more integrated province-wide health system with a focus on achieving health outcomes. The health system will deliver improved access to health information, treatment and care services, and other supports. The system will also focus on early detection and prevention of illness – helping people stay healthy. The achievement of the targets outlined in the Health Plan are key recognized system indicators that will enable AHS to demonstrate to Albertans that we have become the best-performing publicly funded health system in Canada. 8 Building the Budget Alberta Health Services (AHS) will continue to work with Alberta Health and Wellness (AHW), and with Albertans, to build the best-performing publicly funded health system in Canada. The budget for each fiscal year supports the next 12 months of the Health Plan. AHS‟s Operating Budget and Business Plan process begins with a series of internal discussions to establish cost and volume scenarios as described below. This is followed by alignment of initiatives with strategic priorities and discussion within the AHS executive team followed by presentations to the Board and ultimate approval of an Operating Budget and Business Plan. As a general principle, funds for new initiatives and contract increases are held centrally. These funds are allocated to program areas once the initiatives are implemented and it is clear the allocations are necessary. The starting point for the 2011/2012 Operating Budget and Business Plan was the 2010/11 Operating Budget and Business Plan, which was approved by the Board in June 2010. This starting point was then adjusted by making provisions for initiatives started part-way through the 2010/11 year; known and estimated rate increases; activity pressures resulting in cost increases; as well as for new initiatives (including savings). 8.1 Sources of Funding and Revenue Alberta Health and Wellness (AHW) Contributions are AHS‟s primary source of funding providing 87 percent of AHS 2011/2012 Operating Budget and Business Plan through operating and restricted grants. AHW base funding for 2011/2012 includes a $545 million, or 6 percent, increase to the 2010/11 Alberta Health and Wellness operating funding. (Appendix 10.1 - Statement of Operations). 2011-12 Consolidated Revenue $11,974 million AH&W Base Funding $9,582 80% Amortized External Capital Contributions $370 3% Other Revenue Investment and Other Income $252 $307 2% 3% AH&W Other Contributions $818 7% Fees and Charges $645 5% Operating Budget and Business Plan Prepared by AHS Finance Other sources of funds include Fees and Charges, Ancillary Operations (such as parking and food services), Investment Income, Amortized External Capital Contributions, Restricted Grants and Donations. P a g e | 25 Increases in Fees and Charges result from increases to patient activity or increases to rates. AHS receives restricted capital grants, which are accounted for as deferred capital contributions and decreased as they are matched to amortization expenses for the assets that these contributions were used to fund. Hence, increases in Amortized External Capital Contributions are offset by increased amortization expense of externally funded capital assets coming into service. $12 billion will be recognized as revenue in 2011/2012. Components of total revenue and funding are outlined in the chart above. $12 billion will be used to provide health services to Albertans in 2011/2012. 8.2 Allocation of Expenses 2011-12 Consolidated Expenses by Object $11,994 million The chart on the left outlines the total expenditures by expense object. Appendix 10.2 provides a breakdown of total expenses by service area. Salaries and Benefits $6,212 52% Contacts with health service organizations $2,166 18% Amortization $495 4% Other expenses $1,145 10% Other contracted services $1,218 10% Medical and surgical supplies $354 3% Surgical services contracts $18 0% Drugs and gases $386 3% 8.3 Consolidated Budget AHS‟s 2011/12 Operating Budget and Business Plan reflects the entire organization, including all unrestricted and restricted funds, all wholly owned subsidiaries and the proportionate share of all primary care networks. The consolidated Operating Budget and Business Plan is submitted to the Minister of Health and Wellness and represents the full and comprehensive picture of AHS. The 2011/12 Operating Budget and Business Plan is prepared under Canadian Generally Accepted Accounting Principles (GAAP) and Financial Directives issued by Alberta Health and Wellness. These principles and directives outline how and when revenues and expenditures are to be recognized within the budget. Restricted funding received is recorded as deferred contributions until expenditures have been incurred, at which point the funding is recognized as revenue. In addition to operating expenses, AHS also incurs costs related to capital equipment, information technology and debt repayment. These items are funded through accumulated surplus and amortization. As a result, AHS is projecting a budgeted operating deficit of $20 million (Appendix 10.1 Statement of Operations) for the period April 1, 2011, to March 31, 2012, to achieve a surplus position at March 31, 2012. 8.4 Budgeted Expenses by Service Category The Statement of Operations and Business Plan schedule depicts how the operating expenses align with the services AHS delivers. The schedule in Appendix 10.1 outlines financial costs in each service category. A brief commentary on related statistics and performance measures in each category is provided below: Inpatient acute care services are comprised predominantly of nursing units, including medical, surgical, intensive care, obstetrics, paediatrics and mental health. This category also includes operating and recovery rooms. Budget for inpatient services is approximately $2.8 billion (or 24 percent of total operating expenses) supporting more than 2.5 million hospital days and nearly 400,000 hospital discharges in an average year. Operating Budget and Business Plan Prepared by AHS Finance P a g e | 26 Emergency and outpatient services are comprised primarily of emergency, day/night care, clinics, day surgery, and contracted surgical services. Emergency and outpatient services total budget of nearly $1.4 billion (or 11 percent of total operating expenses) provides for nearly 2 million emergency department visits, over 1 million Health Link calls, and more than 125,000 urgent care visits. Facility-based continuing care services are provided in long-term care facilities and include chronic and psychiatric care services managed by AHS and contracted providers. $935 million (or 8 percent of total operating expenses) is budgeted for continuing care supporting more than 14,500 long term care beds. Ambulance services refers to emergency medical services (EMS), including ambulance, patient transport and EMS central dispatch. $370 million (or 3 percent of total operating expenses) is budgeted for ambulance services supporting nearly 400,000 EMS calls/events. Community-based care is comprised primarily of assisted living, including designated assisted living, and palliative and hospice care. This category also includes community programs, primary care networks (PCNs), urgent care centres and community mental health. Approximately $881 million (or 7 percent of total operating expenses) is budgeted for community-based care supporting nearly 400,000 community mental health visits and nearly 6,000 designated assisted living, palliative and hospice care beds/spaces. Home care is comprised of home nursing and support with a budget of $445 million (or 4 percent of total operating expenses) in funding. This budget will allow AHS to provide service to more than 100,000 home care clients. Diagnostic and therapeutic services is comprised primarily of clinical lab (both in the community and acute), diagnostic imaging, pharmacy, acute and community therapeutic services such as physiotherapy, occupational therapy, respiratory therapy and speech language pathology. Slightly more than $2 billion (or 17 percent of total operating expenses) is budgeted in diagnostic and therapeutic services supporting nearly 60 million laboratory tests/procedures, more than 350,000 CT exams, and more than 165,000 MRI exams. Prevention, etc. (referred to as Promotion, Prevention and Protection Services by Alberta Health and Wellness) is comprised primarily of health promotion, disease and injury prevention, health protection, and emergency preparedness, which includes pandemic planning and preparedness with $312 million (or 3 percent of total operating expenses) in total budget. Research and education is comprised primarily of formally organized health research and graduate medical education, primarily funded by donations and third-party contributions, total budget of $230 million (or 2 percent of total operating expenses). Administration is comprised of human resources, finance and general administration. Administration costs are budgeted at approximately $324 million (or 3 percent of total operating expenses) to provide support to more than 90,000 staff and physicians across the province. Information technology is comprised of infrastructure and systems support, device and print services, data processing, system development and software with slightly more than $420 million (or 4 percent of total operating expenses) budgeted. Support services is comprised of building maintenance operations (including utilities), materials management (including purchasing, central warehousing, distribution and sterilization), housekeeping, laundry and linen services, patient registration, health records and food services. Approximately $1.7 billion (or 14 percent of total operating expenses) in budgeted expenses supporting more than 100 acute care hospital sites with nearly 8,000 acute care hospital beds. Operating Budget and Business Plan Prepared by AHS Finance P a g e | 27 Amortization of facilities and improvements is comprised of amortization of buildings, building service equipment and land improvements capitalized by AHS totalling more than $198 million (or 2 percent of total operating expenses) in expenses (exclusive of the portion of amortization charged to ancillary operations). Amortization of equipment is not disclosed separately on the statement of operations but is instead included in each of the other expense classifications above. 8.5 2011/2012 Forecast Risks Maintaining a balanced and sustainable operating budget is critical to Alberta Health Services (AHS). Providing a complex array of quality health services tailored to individual and population health needs generates significant inherent risks to maintaining a balanced budget. AHS is committed to providing these services and mitigating financial risks. High-Level Risks Although there are risks associated with specific revenues and expenditures which will be described in this section, there are broader organizational and environmental risks that could have an impact on the 2011/2012 forecast. The schedule below outlines these risks and identifies AHS‟s mitigating strategies: Risk Mitigating Strategy AHS‟s ongoing operations are large, complex and challenging. Merger activities are also significant. Many staff and physicians are necessarily involved in both of these activities. All of this activity increases the risks of unintended events and results. Focusing on priorities and effectively managing these priorities as projects. Recognizing staff will require support with both activities. 2011/2012 Operating Budget and Business Plan is predicated on achievement of savings targets of approximately one percent. There is a risk of not achieving these due to delays in implementation and other circumstances. Savings target in the 2011/2012 Budget has been risk adjusted based on discussions with each operating area through budget review meetings. Continue to monitor progress on initiatives. Unexpected or unforeseen costs. A contingency is provided for one-time unforeseen events. Funds for future investments will be reduced to the extent that the contingency is used for permanent items. Increases to operating budgets going forward will not be at historical rates. Alignment of activities, performance and funding must be maintained. Effective and ongoing communication with operational managers and the continued inclusion of specific financial performance expectations in senior managers‟ performance agreements. Visibility of the funding available in future years including impact of decisions made. Feedback from community engagement processes will support decision making. Ability to recruit necessary staff to carry out planned initiatives. Work with educational institutions on recruitment strategies as well as future staff needs. Develop proactive recruitment strategies. Implement effective staff mix strategies. Expiration of restricted grants that fund operational programs. Alberta Health and Wellness (AHW) provides targeted grant funding for specified programs, many of which have been in operation for several years. As these grants expire AHS runs the risk of having to absorb the costs through operational funding. Ongoing discussions with AHW and operating managers with enough lead time to mitigate this challenge. Significant unanticipated increases in health service utilization. Manage activity levels and achieve committed improvements in system performance. Continue to review and improve efficiency of business units Operating Budget and Business Plan Prepared by AHS Finance P a g e | 28 Revenue Risks AHW base funding of $9,582 million is AHS‟s primary source of revenue. Given the five-year funding commitment with the Government, this (base) funding has been assured. AHW other contributions which amount to $818 million present some risks to AHS. Maintaining the operation of programs without these grants will require additional operating funding, reallocating existing budget or adjustment to service levels. For 2011/2012, $37 million in restricted grants will expire. In some instances, the related expenditures cannot be eliminated and AHS has deemed the program necessary as part of the services it delivers. Overall revenue from sources other than the Province represents relatively small risk. Approvals to changes in rates which can be charged to clients and patients for uninsured services can be delayed or denied by the Province. Revenues from ancillary operations, such as parking and food services, can vary with activity or market conditions and investment income will vary with market conditions. Risks surrounding other government contributions, Fees and Charges, and Investment and Other Income originate from uncertainty around funding continuance, residential and acute patient volumes and financial market conditions and volatility. Although these revenues only represent a small portion of AHS‟s overall revenue, these risks could impact AHS‟s ability to meet budget expectations. Expenditure Risks The AHS expense budget is comprised largely of human resource costs (approximately 52 percent arising from AHS staff salaries and benefits, and an additional 18 percent for contracted health service provider staff). Rate and volume changes in staffing and contracted providers pose a significant budget risk. Negotiated collective agreements are in place for 2011/12 for United Nurses of Alberta (UNA) and Alberta Union of Provincial Employees (AUPE) Auxiliary Nursing. These contracts contain provisions for increases of 2 percent and 4.5 percent respectively and, therefore, there are no rate risks related to these two contracts. The UNA contract increase is expected to be offset by productivity improvements. The timing of and ability to implement these productivity improvements in 2011/2012 poses a risk to AHS. The current quantum of contract increases would not be sustainable in the out years of the fiveyear funding commitment. Expenses for contracted service providers also pose a risk to AHS. Negotiating increases for providers has proven difficult in the past. Staffing issues, maintenance of aging facilities, and increases in service levels result in funding pressures and risks for AHS. The introduction of acuity-based funding in some areas will improve transparency of funding and tie funding to productivity. This can help mitigate many of these risks. However implementation of acuity-based funding is phased over a number of years, mitigating risks for contractors and leaving residual risks with AHS over the implementation period. Utility costs (which represent approximately $100 million of the budget) are always an area of risk. While electricity and natural gas prices have been relatively low since the economic downturn in 2009, energy prices are highly volatile reacting to unpredictable environmental, political and economic drivers. To mitigate some of this risk, AHS has begun a hedging program to reduce volatility risks related to utility pricing. While overall inflation is expected to remain low, costs for medical equipment, drugs and supplies have typically exceeded the overall inflationary average. These cost pressures are being mitigated with savings initiatives in procurement. Operating Budget and Business Plan Prepared by AHS Finance P a g e | 29 8.6 Internally Funded Equipment and Information Technology During the course of the 2011/12 fiscal year, AHS will invest $65 million of internal funds in capital equipment and $135 million in information technology projects. This $200 million, plus an additional $15 million for the repayment of long-term debt and an operating deficit of $20 million, is offset by $121 million in amortization of internally funded assets, resulting in a $114 million deficit in unrestricted net assets. This deficit will be funded by the accumulated surplus from 2010/11 of $116 million and a portion of the other internally restricted net assets from 2010/11 of $34 million. 9 AHS Four-Year Outlook Consistent with the five-year funding commitment from Government, Alberta Health Services‟ five-year revenue outlook includes a 6 percent base funding increase for 2010/11, 2011/2012 and 2012/13, and a 4.5 percent increase for 2013/14 and 2014/15. This four-year outlook assumes restricted grants funded by AHW will be discontinued based upon their current end dates and that there will be no increase in base operating funds to offset these amounts (judged to be low risk at this time). A provision has been made for Transformational Improvement Program expenditures in the final three years of this outlook. An updated provision will be made in future outlooks once we have stabilized the organization and have a more detailed assessment of our success with improved wait times, better emergency access, and provincial requirements for acute care. This also involves further efficiencies in existing service delivery to facilitate reprioritization. The only provision included in the four-year outlook for acute capacity (other than the cost of South Health Campus) is the cost related to relocating services to new facilities referenced earlier in this document. Costs for relocating to new facilities reflect utility and support services costs based on the timing of opening facilities. The seniors plan is based on the number of continuing care beds being opened in each year: approximately 1,300 beds were opened in 2010/11; at least 1,000 will open in 2011/2012; more than 1,000 in 2012/13, and a total of 2,000 for the final two years. Rate increases over the next four years are assumed to be decreasing as a result of investments and efforts to reduce the rate of cost increase (or “bend the cost curve”). Salary and benefit provisions include both the union rate increases and projected out-of-scope compensation increases. Each year after 2011/2012 provides for savings of one percent of operating expenses to be re-invested into operations. This four-year forecast demonstrates that with judicious management, a stable environment, and modest increases in costs, AHS will be able to manage and achieve improvements in the effectiveness of services it provides. It also demonstrates quite clearly AHS does not have a lot of room to manoeuvre. A spike in labour costs, a requirement for unanticipated new acute beds or any one of many other material events could impact the organization‟s financial sustainability. Continuous improvement in the manner AHS deploys and utilizes available resources will be essential to achieving success for AHS and the population it serves. The schedule on the next page outlines the forecast increases in costs and revenues over the next four years. Incremental investments in years 2012/13 and beyond have been prorated equally across the service categories. These would be further refined as the Budget for each year is developed: Operating Budget and Business Plan Prepared by AHS Finance P a g e | 30 Alberta Health Services Four Year Budget Outlook - Preliminary Financial Plan FOUR YEAR BUDGET OUTLOOK 2010/11 to 2014/15 (in millions) 2010/2011 Budget 2010/2011 Budget Restated 2011/2012 Budget 2012/2013 2013/2014 2014/2015 Outlook Outlook Outlook 1 REVENUE Alberta Health and Wellness base funding Alberta Health and Wellness other contributions Fees and charges Investment and other income Other revenue Amortized external capital contributions TOTAL REVENUE $ 9,038 $ 9,037 $ 9,582 $ 10,156 $ 10,613 $ 11,091 1,272 1,263 818 765 748 748 598 612 645 652 659 666 256 289 307 314 321 328 225 240 252 252 252 252 371 370 370 370 370 370 $ 11,760 $ 11,811 $ 11,974 $ 12,509 $ 12,963 $ 13,455 $ 2,681 $ 2,665 $ 2,823 $ 2,932 $ 3,027 $ 3,143 EXPENSES Inpatient acute nursing care services Emergency and outpatient services Facility-based continuing care services Ambulance services 1,231 1,266 1,350 1,402 1,447 1,502 871 853 935 971 1,002 1,040 353 364 372 386 398 413 Community-based care 747 768 881 915 945 981 Home care 411 404 445 462 477 495 1,907 1,909 2,025 2,103 2,171 2,254 Diagnostic and therapeutic services 2 Prevention etc. 353 296 312 324 334 347 Research and education 219 215 230 239 247 256 Administration 397 375 324 336 347 360 Information technology 344 385 424 440 454 471 1,414 1,479 1,675 1,740 1,796 1,865 202 202 198 206 213 221 Support services Amortization of facilities and improvements Capital assets write down TOTAL EXPENSES $ 11,130 $ 11,181 $ Excess/(deficiency) of revenue over expenses $ 630 $ 630 Internally Funded Capital $ (200) $ 11,994 $ 12,456 $ 12,858 $ 13,351 $ (20) $ 53 $ 105 $ 104 (200) $ (200) $ (200) $ (200) $ (200) Payment of Long Term Debt (10) (10) (15) (19) (20) (20) Amortization of Internal Capital 107 107 121 114 115 116 (527) (527) 116 36 0 34 16 Accumulated Surplus/(Deficit) Interanally Restricted Net Assets for SHC Net Accumulated Surplus/(Deficit) $ - $ - $ 36 $ - $ 0 (0) $ (0) 1 2011/12 Expense budget allocations to be restated once detailed budget is completed 2 Prevention etc. is comprised primarily of health promotion, disease and injury prevention, health protection, and emergency preparedness which includes pandemic planning and preparedness. Operating Budget and Business Plan Prepared by AHS Finance P a g e | 31 10 Appendices The following appendices outline AHS‟s financial Operating Budget and Business Plan for 2011/2012. Two Statements of Operations (10.1 and 10.2) provide alternate views of AHS‟s expenses. Also included are a Statement of Changes in Net Assets (10.3), Statement of Financial Position (10.4), Statement of Cash Flows (10.5) and a detailed breakdown of the expenses (10.6). The detailed breakdown in expenses reflects only actual expenses as the budget is allocated at this level once new initiatives are implemented. Finally, funds allocated toward key innovation initiatives are provided in Appendix 10.7. 10.1 Statement of Operations Alberta Health Services 2011/12 Preliminary Financial Plan For the year ended March 31, 2012 (in millions) CONSOLIDATED STATEMENT OF OPERATIONS 2010/2011 Budget 2010/2011 Budget Restated Net Change from 2010/11 Budget Restated Variance % Net Increase/ Change (Decrease) 2011/2012 Budget1 REVENUE Alberta Health and Wellness base funding Alberta Health and Wellness other contributions Fees and charges Investment and other income Other revenue Amortized external capital contributions TOTAL REVENUE $ 9,038 1,272 598 256 225 371 $ 9,037 1,263 612 289 240 370 $ 9,582 818 645 307 252 370 $ 545 (445) 33 18 12 - $ 11,760 $ 11,811 $ 11,974 $ 163 Inpatient acute nursing care services Emergency and outpatient services Facility-based continuing care services Ambulance services Community-based care Home care Diagnostic and therapeutic services Prevention etc.2 Research and education Administration Information technology Support services Amortization of facilities and improvements TOTAL EXPENSES $ 2,681 1,231 871 353 747 411 1,907 353 219 397 344 1,414 202 $ 2,665 1,266 853 364 768 404 1,909 296 215 375 385 1,479 202 $ 2,823 1,350 935 372 881 445 2,025 312 230 324 424 1,675 198 $ 158 84 82 8 113 41 116 16 15 (51) 39 196 (4) $ 11,130 $ 11,181 $ 11,994 $ 813 Excess/(deficiency) of revenue over expenses $ 630 $ 630 $ (20) $ (200) $ (10) 107 (527) $ (200) $ (15) 121 116 34 36 $ 6.0 % (35.2 %) 5.4 % 6.2 % 5.0 % - % 1.4 % EXPENSES Internally Funded Capital Payment of Long Term Debt Amortization of Internal Capital Accumulated Surplus/(Deficit) Internally Restricted Net Accumulated Surplus/(Deficit) $ $ (200) $ (10) 107 (527) - $ (650) (5) 14 643 34 36 5.9 % 6.6 % 9.6 % 2.2 % 14.7 % 10.1 % 6.1 % 5.4 % 7.0 % (13.6 %) 10.1 % 13.3 % (2.0 %) 7.3 % (103.2 %) - % 50.0 % 13.1 % (122.0 %) 100.0 % 100.0 % 1 2011/12 Expense budget allocations to be restated once detailed budget is completed 2 Prevention etc. is comprised primarily of health promotion, disease and injury prevention, health protection, and emergency preparedness which includes pandemic planning and preparedness. Operating Budget and Business Plan Prepared by AHS Finance P a g e | 32 10.2 Schedule of Revenues and Expenses by Object Alberta Health Services 2011/12 Preliminary Financial Plan For the year ended March 31, 2012 (in millions) CONSOLIDATED SCHEDULE OF EXPENSES BY OBJECT 2010/2011 Budget 2010/2011 Budget Restated Net Change from 2010/2011 Budget Restated Variance % Net Increase/ Change (Decrease) 2011/2012 Budget 1 REVENUE Alberta Health and Wellness base funding Alberta Health and Wellness other contributions Fees and charges Investment and other income Other revenue Amortized external capital contributions TOTAL REVENUE $ 9,038 1,272 598 256 225 371 $ 9,037 1,263 612 289 240 370 $ 9,582 818 645 307 252 370 $ 545 (445) 33 18 12 - 6.0 % (35.2 %) 5.4 % 6.2 % 5.0 % - % $ 11,760 $ 11,811 $ 11,974 $ 163 Salaries and Benefits Contacts with health service organizations Surgical services contracts Drugs and gases Medical and surgical supplies Other contracted services Other expenses Amortization Loss on disposal of capital assets TOTAL EXPENSES $ $ 6,212 2,166 18 386 354 1,218 1,145 495 11,994 $ $ 5,803 1,950 21 384 314 1,165 1,065 478 1 11,181 $ $ 5,721 2,027 24 349 340 1,187 1,003 478 1 11,130 $ 409 216 (3) 2 40 53 80 17 (1) 813 7.0 % 11.1 % (14.3 %) 0.5 % 12.7 % 4.5 % 7.5 % 3.6 % (100.0 %) 7.3 % Excess/(deficiency) of revenue over expenses $ 630 $ 630 $ (20) $ (650) (103.2 %) (200) $ (10) 107 (527) $ (200) $ (15) 121 116 34 36 $ 1.4 % EXPENSES Internally Funded Capital Payment of Long Term Debt Amortization of Internal Capital Accumulated Surplus/(Deficit) Internally Restricted Net Accumulated Surplus/(Deficit) 1 $ $ (200) $ (10) 107 (527) - $ $ (5) 14 643 34 36 - % 50.0 % 13.1 % (122.0 %) 100.0 % 100.0 % 2011/12 Expense budget allocations to be restated once detailed budget is completed Operating Budget and Business Plan Prepared by AHS Finance P a g e | 33 10.3 Statement of Changes in Net Assets Alberta Health Services 2011/2012 Financial Plan For the year ended March 31, 2012 (in millions) CONSOLIDATED STATEMENT OF CHANGES IN NET ASSETS Accumulated Internally Internally net unrealized restricted net funded net Accumulated gains/ (losses) assets for assets surplus / on other general invested in (deficit) investments operations capital assets BALANCE AT MARCH 31, 2011 $ Excess/ (deficiency) of revenue over expenses Capital assets purchased with internal funds Amortization of internally funded capital assets 116 $ (9) $ 67 $ 777 Sub Total $ 951 Endowments $ 10 TOTAL $ 961 (20) - - (20) - (20) (200) - 200 - - - 121 - (121) - - - (15) - 15 - - - - - - Repayment of long-term debt used to fund capital assets Transfer of funds from internally restricted for other general purposes to accumulated surplus 34 (34) - Net unrealized gains/(losses) arising during the year on investments - (1) - (1) - (1) investments to revenue - (4) - (4) - (4) Other - Transfer of net realized losses/(gains) on BALANCE AT MARCH 31, 2012 Operating Budget and Business Plan Prepared by AHS Finance $ 36 $ (14) $ 33 $ 871 $ 926 $ 10 $ 936 P a g e | 34 10.4 Statement of Financial Position Alberta Health Services 2011/2012 Financial Plan For the year ended March 31, 2012 (in millions) CONSOLIDATED STATEMENT OF FINANCIAL POSITION 2010/2011 Actuals Net Change from 2010/2011 Actuals Variance % Increase/ Net Change (Decrease) 2011/2012 Budget ASSETS Current: Cash Accounts receivable Contributions receivable from Alberta Health and Wellness Inventories Prepaid expenses Non-current cash and investments Capital contributions receivable Capital assets Other assets TOTAL ASSETS $ $ 1,721 $ 201 200 2,215 131 212 99 62 2,283 95 60 2,713 599 12 6,708 215 9,817 $ $ 82 100 7,955 210 11,060 $ 494 (70) 12 28.7 % (34.8 %) 6.0 % (4) (2) 430 (4.0 %) (3.2 %) 18.8 % (517) 88 1,247 (5) 1,243 (86.3 %) 733.3 % 18.6 % (2.3 %) 12.7 % 212 9 36 (93) 164 18.6 % 2.3 % 6.1 % (60.4 %) 7.2 % LIABILITIES and NET ASSETS Current: Accounts payable and accrued liabilities Accrued vacation pay Deferred contributions Current portion of long-term debt $ Non-Current: Deferred contributions Deferred capital contributions Long-term debt Unamortized external capital contributions Other liabilities Net assets: Accumulated surplus/(deficit) Internally funded net assets invested in capital assets Internally restricted net assets for other general puposes Accumulated net unrealized gains/(losses) on investments Operating net assets Endowments TOTAL LIABILITIES AND NET ASSETS Operating Budget and Business Plan Prepared by AHS Finance $ 1,137 $ 386 595 154 2,272 1,349 395 631 61 2,436 $ 164 542 182 5,599 97 8,856 174 386 307 6,713 108 10,124 10 (156) 125 1,114 11 1,268 6.1 % (28.8 %) 68.7 % 19.9 % 11.3 % 14.3 % 116 36 (80) 69.0 % 777 871 94 12.1 % 67 33 (34) (50.7 %) (9) 951 (14) 926 (5) (25) 10 961 9,817 $ 10 936 11,060 $ (25) 1,243 55.6% 2.6 % - % (2.6 %) 12.7 % P a g e | 35 10.5 Statement of Cash Flows Alberta Health Services 2011/2012 Financial Plan For the year ended March 31, 2012 (in millions) CONSOLIDATED STATEMENT OF CASH FLOWS 2010/2011 Actuals (Unaudited) Cash generated from (used by): OPERATING ACTIVITIES: Excess (deficiency) of revenue over expenses Non-cash transactions: Amortization expense Amortized external capital contributions Other Changes in non-cash working capital account $ 856 2011/2012 Budget $ (20) 471 (365) (3) (2) 495 (370) 16 (53) 957 68 (245) (138) (467) (71) (7,344) 5,996 1,775 76 (200) (290) (60) (62) (5,365) 5,229 658 378 (418) 288 FINANCING ACTIVITIES: Capital contributions received Capital contributions returned Principal payments on long term debt Proceeds from long term debt 203 (58) (13) 73 107 (209) 240 Cash generated by financing activities 205 138 744 977 1,721 599 494 1,721 2,215 82 $ 2,320 $ 2,297 $ 1,150 1,170 2,320 $ 858 1,439 2,297 Cash generated from (used by) operations INVESTING ACTIVITIES: Purchase of capital assets: w internally funded - equipment w internally funded - facility and improvements w externally funded - equipment w externally funded - facility and improvements w debt funded Purchase of investments Proceeds on sale of investments Allocations from non-current cash Changes in non-cash working capital Cash (used by) investing activities Net increase (decrease) in cash Cash, beginning of year Cash, end of year Non-current cash and investments, end of year Total Cash and Investments at end of year Additional information: (1) Total Cash and investments are comprised of: Externally restricted Unrestricted Total Operating Budget and Business Plan Prepared by AHS Finance P a g e | 36 10.6 Expense Detail Breakdown Operating Budget and Business Plan Prepared by AHS Finance P a g e | 37 10.7 Funds Allocated for Key Innovation Initiatives Alberta Health Services 2011/12 Allocation of Key Innovation Initiatives For the year ended March 31, 2012 (in millions) Reducing Emergency Wait Times Reducing Cancer Wait Times Reducing Surgery Wait Times Increasing Continuing Care Capacity South Health Campus Obesity, Diabetes, and Chronic Disease Management Colorectal Cancer Screening Improve Workforce Planning and Process Improvement Calgary NICU Capacity Newborn Metabolic Screening Children's Mental Health Home Care Capital Investments Total Key Innovation Initiatives Operating Budget and Business Plan Prepared by AHS Finance 2011/12 Funding Commitment 19 15 46 110 84 11 9 5 10 3 18 37 200 567 P a g e | 38
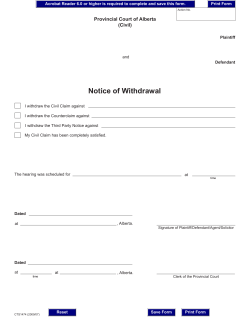


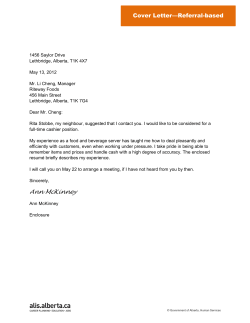
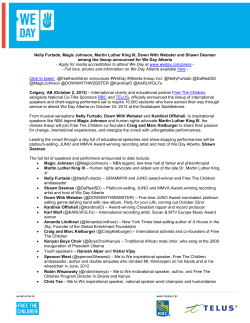


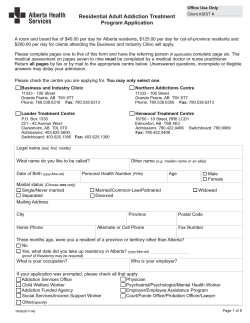

© Copyright 2026