
i( !,, .y Iof IF
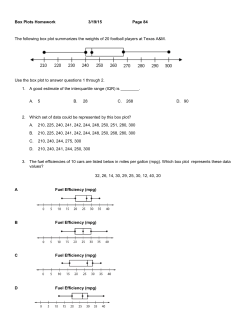
Box Plots
3/19/15
On each of the problems, follow the steps above to find
Page 85
DO NOW: Determine the range, median, first and third
the median, Ist Quartile, 3rd Quartile, and Least
number, and Greatest number and IQR. Then construct
quartiles, and interquartile range for each data set.
Determine any outliers.
a box plot for the data.
Miles driven to see a Space Shuttle launch:'ÿ9, 2,ÿ, ÿIÿ,
'ÿ8, 30, 51,"2.8
1.
A cell phone provider gathered information from
several students on the number of texts sent on an
average day:
Least to Greatest: \!
%%
%
-fq
= ii
Median.,ÿ lstQuartile:l$ 3rÿQuartile:ÿi" t
Least" /! Greatest:I{1 IQR: W
A box plot is used to display a set of data so that you
can easily see where most of the numbers are.
Ex: Suppose you were to catch and measure the length
of 13 fish in a lake:
12, 13, 5, 8, 9, 20, 16, 14, 14, 6, 9, 12, 12
Step 1: Rewrite the data in order, from smallest to
largest:
Step 2: Find the Median of all of the numbers. Hint: (the
number in the middle)
Coach Williams timed the Spartan basketball
.
team to see how many free-throws each player
could make in a minute:
Step 3: Now find the 1st Quartile. Circle all of the data
to the left of the median, and now find the middle of that
14, ÿ,ÿ, 15, 1ÿ, ÿ, I,,.1, ÿ,,,,9, 13
data.
Step 4: Now find the 3rd Quartile. Circle all of the data
to the right of the median, and now find the middle of
that data.
I-\|1(f fÿ
i( !,, .y Iof IF
Least to Greatest:
.1
iv
"3
0
Median:i1s' Quartile: ÿ/ 3rd Quartile: !t
Step 5: Find the Least and Greatest number in the
data.
Least: Greatest:! ÿ
m
IQR:
? i J-- 'ÿ-* iÿ
Step 6: To find the Interquartile Range (IQR), find the
difference of the 3rd Quartile and 1st Quartile.
°
?
$ÿ ' fo
17>
i$
_ÿ
Answer the following questions using the box plot shown
below.
5. The foltowingbox4nd-whiskerplotrepresentsthe numberofbooks hventy
.,ÿ I)-/
students read dunng a summer vacation,
n- Ltl
-t0 12 t4
5 10 I5 20 25 30 35 40 45 50 55 60
Median. ÿJ,.ÿQua :
_ Least:
fÿ' ÿu, iw',
16
)
....
j
t8 20 22 24 26 28
9. Which choice shows a set of data that could be
represented by the box plot shown above?
w
a. 10, 10,
14, 17,117, 20
26, 28
10, 11, t2ÿ, 12, 16,i18, 18@26,28 (ÿ
o. 10,11,11,12,15ÿ17,19,20,27,28 ÿ•
10. Which statement about the box plot is not true?
Compare box and whisker plots A and B to answer the
a. 25% of the values are above 20. q
questions below.
b. The range of the data is 18. ÿ"t 0,2,- {
-
T T
.[
r
w
A
T
,
T
oj i.. ÿ_r,/. 7,ÿ<11
--B
50
60
70
90
80
"ÿ "1 Z ÿ ÿ
7-,ÿ ÿ" ÿ ÿ :
fr\
"> $-:/ÿ
I I I I I I I I I I I , I
40
c. The interquartile range is equal to the range of the 4th
quartile.
,k
/t
I00
-qÿr-t)
a. What is the median of both plots?
Io9 -$'o =Sÿ
b. Which plot has a smaller range? .A
c. Which plot has a greater interquartile range?
d. What percent of the data in plot B is between 60 and
e. What percent of the data in plot A is greater than 80?
f. Which pÿt has the greater variability in the bottom
oo, o?
r,,or
"7
L/'d'ÿ 11 and13 are part of the 2nd quartile, ÿ.D


![Connor MacIVOR Exec Summary [Condo]_CA_CANYON COUNTRY](http://cdn1.abcdocz.com/store/data/001697361_1-01eddd22dcff9eeea5f888c359346f97-250x500.png)


© Copyright 2026