
Objective Measures for Pregnancy Related Low Back and Pelvic Pain
Objective Measures for Pregnancy Related Low Back and Pelvic Pain Mirthe de Groot Objective Measures for Pregnancy Related Low Back and Pelvic Pain Thesis, Erasmus University Rotterdam, The Netherlands © 2005, M. de Groot ISBN 90-9020066-5 All rights reserved. No part of this dissertation may be reproduced, stored in retrieval system or transmitted in any other form or any means without the prior written permission of the author. Objective Measures for Pregnancy Related Low Back and Pelvic Pain Objectieve maten voor zwangerschapsgerelateerde lage rug en bekkenklachten Proefschrift ter verkrijging van de graad van doctor aan de Erasmus Universiteit Rotterdam op gezag van de rector magnificus Prof.dr. S.W.J. Lamberts en volgens het besluit van College voor Promoties. De openbare verdediging zal plaatsvinden op donderdag 15 december 2005 om 16.00 uur door Mirthe de Groot geboren te Leidschendam Promotiecommissie Promotoren: Prof.dr.ir. C.J. Snijders Prof.dr. H.J. Stam Overige leden: Prof.dr.ir. N. de Jong Prof.dr. P. Patka Prof.dr. E.A.P. Steegers Copromotor: Dr.ir. C.W. Spoor This research was supported by the Technology Foundation STW, applied science division of NWO and the technology programme of the Ministry of Economic Affairs of the Netherlands. Contents Chapter 1 General introduction 7 Chapter 2 Terminology used in the analysis of joint function 13 Chapter 3 How to describe sacroiliac joint function? 23 Chapter 4 Doppler Imaging of Vibrations of the knee joint 31 Chapter 5 Critical notes on the technique of Doppler Imaging of Vibrations 37 Chapter 6 Doppler Imaging of Vibrations test on a physical model 47 Chapter 7 Contact pressures on a flat and a concave surface 57 Chapter 8 Objective measures for the Active Straight Leg Raising test (ASLR) for pregnant women 65 Chapter 9 Support contact pressure of the pelvis during the Active Straight Leg Raising test (ASLR) 75 Chapter 10 General discussion 85 Summary 91 Samenvatting 95 References 101 Dankwoord 113 Curriculum Vitae 117 Chapter 1 General Introduction 8 Chapter 1 Pelvic region The pelvis forms the base of the trunk and consists of four bones: two hipbones, the sacrum and the coccyx. Each hipbone is a fusion of the ilium, ischium and pubic bone. The two pubic bones are connected anteriorly in the symphysis pubis, with a disc in between. Posteriorly, the ilium is connected to the sacrum at the sacroiliac joints (SI-joints). The SI-joint is surrounded by a capsule and is strengthened by a complex entity of several ligaments and muscles. The pelvis forms the intermediary between the spinal column and the lower extremities and plays an essential role in load transfer from the trunk to the legs and vice versa. Figure 1.1 Pelvic anatomy. Pregnancy Related Low Back and Pelvic Pain Pain in the lumbar spine and pelvic region is a frequent complication during pregnancy and delivery. The prevalence of pregnancy related low back and pelvic pain (PLBP) varies between 14.2% and 56% (Albert et al. 2000, 2001, Berg et al. 1988, Björklund et al.1999, Fast et al. 1987, Heiberg-Endresen 1995, Larsen et al. 1999, Mantle et al. 1977, Orvieto et al. 1994, Östgaard et al. 1991, 1994, 1996, Wergeland and Strand 1998). The wide range in reported prevalence may partly be the result of different population samples and partly because of a lack of standardisation. The symptoms of PLBP vary widely among patients and time. The pain is often quite mild but in 6 to 15% the pain is considered to be severe, interfering with daily life activities (Berg et al. 1988, Björklund et al. 1999, Heiberg-Endresen 1995, Mantle et al. 1977). Several daily activities, like standing, sitting, forward bending, lifting, climbing stairs and walking, tended to increase the pain (Fast et al. 1987, Kristiansson et al. 1996, Mens et al. 1996). The onset of pain occurs around the eighteenth week and reaches peak intensity between the twenty-fourth and thirty-sixth week. The pain is often reported in the sacral area and the region of the symphysis pubis with or without radiation to the groins, General introduction 9 thighs, buttocks and coccygeus region (Fast et al. 1987, Kristiansson et al. 1996, Mens et al. 1996, Östgaard et al. 1996, Perkins et al. 1998). Several terms are used to describe these symptoms, such as pelvic pain in pregnancy (Heiberg-Endresen 1995), pregnancy related pelvic joint pain (Albert et al. 2000, Wu et al. 2002), pregnancy related low back pain (Perkins et al. 1998), low back pain during pregnancy (Berg et al. 1988, Fast et al. 1987, Orvieto et al. 1994), symptom giving pelvic girdle relaxation (Hansen et al. 1996, Larssen et al. 1999), posterior pelvic pain since pregnancy (Mens et al. 2001, Östgaard et al. 1994), peripartum pelvic pain (Mens et al. 1996) and pelvic insufficiency during pregnancy (Wormslev et al. 1994). In this thesis the term pregnancy related low back and pelvic pain (PLBP) is chosen because of the functional unit of the fifth lumbar vertebra, the ilium and the sacrum together with ligaments and muscles. PLBP is used to describe pain around the pelvic joints with or without radiation to other parts of the pelvis, started during pregnancy or within three weeks after delivery. Several hypotheses have been formulated to explain the causes of PLBP, some explanations are however contradictory: The hormone relaxin, detected in 1926, increases the laxity of ligaments and joint capsule in order to prepare the females for parturition. MacLennan et al. (1986) reported a significant increase in concentration of relaxin in women with severe PLBP as compared to a control group of normal pregnancies. However, this could not be confirmed in other studies (Albert et al. 1997, Hansen et al. 1996). Due to the increased weight, most pregnant women develop changes in posture during pregnancy to maintain balance. Postural changes were related to PLBP (Sands 1958), however, this remains speculative because the nature of these changes is still not understood (Dumas et al. 1995, Fast et al. 1987). According to several authors, stability of the SI-joints plays an important role in PLBP. Stability describes the mechanical control of a joint, including muscles, limiting or controlling unwanted movement and preventing injuries of ligaments and capsules (Dahlkvist and Seedhom 1990, Pool-Goudzwaard et al. 2003, Richardson et al. 2002). Stability of the SI-joint depends on specific anatomic features (form closure) and on tension of ligaments and muscles crossing the SI-joints (force closure) allowing effective load transfer (Snijders et al. 1993a, 1993b, Vleeming et al. 1990a, 1990b). Normally, the SI-joints permit little movement of a few degrees (Egund et al. 1978, Jacob and Kissling 1995, Smidt et al. 1995, Sturesson et al. 1989). Increase of movement of the SI-joints during pregnancy is documented by many radiographic studies (Farbrot 1952, Johanson and Järvinen 1957, Thoms 1936). Mens et al. (1999) cited an asymmetric laxity of the SI-joints as an underlying cause of PLBP. Besides active and passive forces, also the control mechanisms play an important role in 10 Chapter 1 stability. It is hypothesised that stability of the pelvis may be affected by changes in propriocepsis, change in muscle activity and/or changes in timing of muscular recruitment (Ebenbichler et al. 2001, Lamoth et al. 2002, O’Sullivan et al. 1997, 2002, Solomonow et al. 1998, Wu et al. 2002). However, none of these variables adequately explained why certain women develop PLBP and others do not. It is quite possible that multiple mechanisms play a role in the causation of PLBP. Diagnosis of Pregnancy Related Low Back and Pelvic Pain The patient’s story about her complaints is a very useful tool for diagnosing PLBP. Besides that, objective signs are requested. A great variety of examinations are used in the evaluation of women with PLBP, like pain provocation and mobility tests, X-ray radiography and strength measurements. However, the value of most of these tests is limited because their relation to clinical parameters is questionable or weak (Albert et al. 2000, Deyo et al. 1998, Laslett and Williams 1994, Michel et al. 1997, Strender et al. 1997, van Tulder et al. 1997, Wormslev et al. 1994). Pain provocation tests are the most reliable tests; however, these tests stress the structures and do not give an objective indication of joint function (Albert et al. 2000, Kokmeyer et al. 2002, Laslett and Williams 1994). Mens et al. (1999, 2001) developed the Active Straight Leg Raising test (ASLR) to measure the load transfer from legs to trunk and vice versa. This test is a valid, reliable, sensitive and specific test to discriminate between patients with PLBP and healthy subjects and to test the severity of PLBP (Mens et al. 2001, 2002). However, the patient only scores the test subjectively. Outline of this thesis In describing joint function, terms as laxity, stability, stiffness and mobility are mentioned. Often, these terms are mixed up and not used unambiguously. To get clear terminology in describing joint function, a literature survey is done (Chapter 2). The SI-joint is a special joint, because of its orientation parallel to the loading forces, its functional unity with the pubic symfysis and the fifth lumbar vertebra, and the very limited movement. As a result, diagnosing SI-joint (dys)function is very complicated. Moreover, the parameters describing SI-joint function are poorly defined. This is worrying because as a consequence it is difficult or impossible to compare measurements and also the base for therapies is very insecure. Chapter 3 describes the results of a review of the terminology used in the analysis of SI-joint function and its consequences for the use in the clinical situation and biomechanical research. General introduction 11 A lot of diagnostic tests are available, but there is still no method to measure the function of the SI-joints in an objective and non-invasive manner. In 1995, Buyruk et al. introduced the technique of Doppler Imaging of Vibrations (DIV), with which they aimed to measure the laxity of the SI-joints (Buyruk et al. 1995a, 1995b). Clinically, the results of this technique are very promising, however, the technique functioned like a black box. In Chapter 4 the applicability of DIV on the knee joint is investigated. The objective was testing the technique rather than finding clinically relevant results for the knee joint. The results obtained from these measurements, forced us to look more critically to the technique of DIV. A review of the technique of DIV was performed and is described in Chapter 5. Several assumptions of DIV appeared to be, at least in general, not correct and needed further investigations. The technique was not validated thoroughly and the mechanism of the transfer of vibrations through the pelvic bones was not studied. This led to research into the suitability of Colour Doppler Imaging for the measurement of the velocity of a vibrating target (Chapter 6). The conclusion of this study was that DIV, as used with Colour Doppler Imaging, is not suitable for joint laxity measurements. Consequently, a new technique has to be developed. In the new technique too, vibrations will be utilised. Although the best site for excitation is not known yet, the best form of the excitator in terms of comfort was investigated (Chapter 7). This was done indirectly by studying the influence of the form of a seating surface on the contact pressure and the subjectively experienced comfort. As there is still no technique to measure the laxity of the SI-joints objectively, the Active Straight Leg Raising test (ASLR) is used as a diagnostic instrument to assess PLBP. With this test it is possible to discriminate between patients with PLBP and healthy subjects (Mens et al. 2001) and to test the severity of PLBP (Mens et al. 2002). The impairment as indicated by the ASLR is only scored subjectively by the subject on a 6-point Likert scale. Chapter 8 describes the study to obtain objective parameters by the assessment of the ASLR. It is reported that during the ASLR subjects with PLBP will have a distinct laterodorsal shift of the pelvis at the side of the raised leg. The aim of the study described in Chapter 9 was to investigate if the pelvic shift during the ASLR is more pronounced in pregnant women with PLBP than the shift in pregnant women without PLBP and healthy non-pregnant controls. Finally, in the general discussion (Chapter 10) the main issues are brought together and an overview is given. Chapter 2 Terminology used in the analysis of joint function Mirthe de Groot, Cornelis W. Spoor, Chris J. Snijders. Journal of Back and Musculoskeletal Rehabilitation 2005; 18(1-2):45-49 14 Chapter 2 Abstract Joint function is described by biomechanical parameters like range of motion (ROM), stiffness, laxity and stability. However, these terms are frequently used ambiguously. Due to the lack in standardisation, it is difficult to compare results of examinations. A literature survey is performed and an inventory is made about the definitions used for the terms. Finally, an overall conclusion is drawn. The descriptions for several terms are not clear, sometimes even contradictary. The final definition for ROM is the range of translation and rotation through which a joint may be actively or passively moved in a certain direction. Joint stiffness describes the resistance of the joint to imposed relative movement between two joint surfaces. Laxity is the normal amount of motion that results from passive forces or moments and stability is the ability to control positions or movements of joints. Terminology used in the analysis of joint function 15 Introduction A human joint can be viewed as a collection of movable parts whose purpose is to accept, transfer and dissipate loads generated at the lever arms of bones (Dye 1996). The joint should manifest normal biomechanical parameters such as laxity, stiffness, range of motion and stability to achieve normal function in daily life. These terms are closely related to each other. A lot of articles describe studies of the assessment of these parameters. However, clinicians and researchers do not always give a clear description of the joint function they measured (Kocher et al. 2003, Pollet et al. 2004). In other cases, descriptions are given, but they are not unambiguous (Oliver and Coughlin 1987, Sharma et al. 1999). It is hard to communicate and it is also very difficult to compare measurements when the definitions are not clear or even not given. To come to clear terminology, a literature survey is done. The definitions are studied and compared to each other. Finally, overall conclusions about the terms are made. The findings of this literature survey are considered below and they are summarised in Table 2.1. Clinical relevance Range of motion Range of rotation or translation through which a joint is actively or passively moved between two extreme positions in a certain direction Hypermobility An increase in the range of motion beyond the normal range Stiffness Resistance presented by the joint to imposed relative movement between two joint surfaces in any one particular direction Laxity Normal amount of motion that results from the passive application of forces and moments for movements that cannot be actively controlled Hyperlaxity Excessive laxity Stability Mechanical controllability of a joint within a range of physiological loading An abnormal insufficient mechanical controllability Instability resulting in uncontrolled patterns of displacement Biomechanical relevance Stiffness Measure of resistance against a change of shape Stability Consistent relation between deviations from the stable position and the force or moment needed to maintain this position Table 2.1 Summary of biomechanical relevance. definitions for primary clinical and 16 Chapter 2 Terminology • Range of motion With the combination of uniaxial, biaxial and multiaxial joints, the body is able to adopt a multitude of functional positions. The range of motion (ROM) of a joint is the range of rotation or translation through which a joint can be moved between the physiologic extremes. The ROM can be expressed for each of the six degrees of freedom. For example, one ROM of the shoulder joint (Figure 2.1) would be the number of degrees rotated between the points of full extension and full flexion (Hoppenfeld and Zeide 1994, Noyes et al. 1989, Trew and Everett 2001, White and Panjabi 1978, Woo et al. 1999). Figure 2.1 The full range of motion of the shoulder joint in the sagittal plane. The neutral starting point is defined as 0 degrees, usually corresponding to the anatomical position. The ROM is quantified in degrees (rotation) or millimetres (translation) and is qualified as either active (AROM) or passive (PROM). The AROM results from the subject’s voluntary muscle contraction. To determine the PROM the limb is moved passively by the examiner (Greene and Heckman 1994, Hoppenfeld and Zeide 1994, Noyes et al. 1989). The ROM depends on age, gender, culture and sometimes on occupation (Greene and Heckman 1994). An increase in the range of motion of joints beyond the normal range is called hypermobility (Hakim and Grahame 2003, Larsson et al. 1993, Punzi et al. 2001, Seçkin et al. 2004). This is not necessarily negative: joint hypermobility could be beneficial e.g. to musicians or ballet dancers performing fine repetitive movements (Larsson et al. 1993, McCormack et al. 2004). However, hypermobility could be a risk factor for developing osteoarthritis (Grahame 1989, Sharma et al. 1999). Table 2.1 lists the summarising conclusion of the ROM and the other terms described in this article. • Stiffness of a structure In general, stiffness is a measure of resistance against a change of shape; it represents mechanical behaviour of a structure. Normal joint Terminology used in the analysis of joint function 17 stiffness is the resistance presented by the joint to imposed relative movement between two joint surfaces in any one particular direction without active muscle contraction. So, stiffness is used to describe the force or moment needed to achieve a certain deformation of a structure and is expressed as force per unit linear displacement (N/m or N/mm) or moment per unit angular displacement (Nm/deg) (Baumgart 2000, Bryant and Cooke 1988, Dahlkvist and Seedhom 1990, Matsumoto et al. 1999, McQuade et al. 1999, White and Panjabi 1978). Stiffness is shown graphically in Figure 2.2 as the slope or tangent of the loading curve for the sacroiliac joint. An increase of stiffness of the sacroiliac joint results in a less steep curve (curve 2) as compared to curve 1 (Pool-Goudzwaard 2003). In addition to the applied force and resultant movement, the assessment of passive joint mobility includes the clinician’s perception of the mechanical properties of the joint. End-feel is the palpable sensation of the examiner at the end of passive motion. James H. Cyriax (1904-1985) was the first who attempted to describe this perception (Maitland and Kawachuk 1997). The type of end-feel indicates the anatomical structures that limit passive motion. A bony end-feel is an abrupt halt to movement as when two hard surfaces meet (Hayes et al. 1994). In the case of a capsular end-feel or when motion-checking ligaments are intact, there is a hard end of motion with some give to it. According to Markolf et al. (1984) it corresponds to high terminal stiffness. If the checking ligaments are not intact, the end-point is soft and indistinct (Hayes et al. 1994, Markolf et al. 1984, Marshall and Baugher 1980). An end-feel of soft tissue is a sensation suggesting that motion could continue; a soft end-feel is corresponding to low terminal stiffness (Markolf et al. 1984). Figure 2.2 Two curves representing the relation between the amount of rotation in the sacroiliac joint and the applied load. (From: Pool-Goudzwaard 2003). • Laxity On the one hand, laxity is a characteristic of a ligament; it indicates slackness or a lack of tension. But commonly, the term indicates some 18 Chapter 2 normal amount of joint motion that results from the application of forces and moments (Dahlkvist and Seedhom 1990, Matsumoto et al. 1999, Noyes et al. 1989, Rasenberg et al. 1995, Thompson et al. 2004). Laxity is measured in units of displacement; linear movement is expressed in millimetres and angular movement in degrees (Dalhkvist and Seedhom 1990). Excessive laxity is constrained by soft tissues as ligaments, capsule, cartilage, muscles and skin (Dahlkvist and Seedhom 1990, Matsumoto et al. 1999, Noyes et al. 1980, Woo et al. 1999). When this mechanism fails, the joint is called hyperlax (Gerber and Nyffeler 2002), this can be defined as a wider than normal amount of motion (Acasuso Diaz et al. 1993) and can lead to instability. Contrary, according to other authors, laxity is an abnormal amount of movement. In the opinion of Larsson et al. (1993) laxity is the same as hypermobility and is defined as a range of motion in excess of normal. Sharma et al. (1999) do not make a distinction between laxity and instability; it is an abnormal displacement or rotation of one bone with respect to the other. In our opinion, laxity can only be determined for movements that cannot be actively executed or controlled, like in the anterior drawer test of the knee joint. Dahlkvist and Seedhom (1990) make a distinction between primary and secondary laxity, both being normal properties. Primary laxity is the amount of movement present in the joint at low force levels; only the frictional and viscous forces have to be overcome. It refers to the amount of ‘play’ in the joint (Dahlkvist and Seedhom 1990, Noyes et al. 1989). According to Haldeman (1983), joint-play is the passive motion, elasticity or give in a joint within its physiological range. Secondary laxity is the additional laxity at higher levels of force; this is the maximal displacement recorded during the test. A large force imposed will cause the soft tissue to be strained, causing further relative movement (Dahlkvist and Seedhom 1990). The amount of secondary laxity is dependent on the magnitude of the applied force. • Stability Stability is a general term that describes the mechanical control of a joint, including muscles, limiting or controlling unwanted movement, and preventing injuries of ligaments and capsules (Dahlkvist and Seedhom 1990, Pool-Goudzwaard et al. 2003, Richardson et al. 2002). Stability is provided by congruity of articulating surfaces and by tension in the soft tissues (Adams and Hamble 1995, Mangaleshkar et al. 1998). So, stability is the ability of a joint to bear loading without uncontrolled displacements. Scholten (1986) discriminated between clinical, anatomical and mechanical stability. Clinical stability is the ability of a joint, within a Terminology used in the analysis of joint function 19 range of physiological loading, to limit patterns of displacement and to prevent deformity or pain due to structural changes (White and Panjabi 1978). This definition is in line with the definition by the Committee on the Spine of the American Association of Orthopaedic Surgeons (Council for Organizations of Medical Science). Anatomical stability is based on morphometric parameters and does not take into account the adaptation of structures. Anatomical stability of a joint can be described as a measure of mobility of that joint. A joint in a close packed or locked position is said to be stable. Clinical as well as anatomical stability are more or less qualitative descriptions in contrast to mechanical stability (Scholten 1986). Mechanical stability of a joint can be described as a relation between deviations from the stable position and the muscle forces needed to maintain this position. A large change of this position caused by only a small change of the applied forces is called an unstable situation. An example of a mechanically unstable system is depicted in Figure 2.3. A motion segment of the spine without ligaments and with the nucleus pulposus considered convex is excessively flexible; it is mechanically unstable. A motion segment with ligaments is mechanically stable, but can be clinically unstable (Scholten 1986). Figure 2.3 A mechanically unstable system. The functional stability of a joint is the result of active and passive forces controlling joint motion under physiological loading conditions. This functional stability is provided by the three-dimensional geometry of the articulating surfaces, by the passive restraining forces of ligaments and capsular structures, and by the active forces of the musculotendinous units (Muller et al. 1988, Shultz et al. 2004). Static stability is stability of the joint when the forces and joint position are virtually constant and do not change with time, e.g. during quiescent standing or holding a fixed joint position. Static stability requires active contraction of muscles and passive restraints. Dynamic stability is the stability of the joint when forces and joint position are changing as during motion. This means again that both active and passive restraints 20 Chapter 2 are effective. For this reason it is advised to avoid the terms static and dynamic stability and to combine them into the term functional stability (Muller et al. 1988, Noyes et al. 1980). In the literature the term instability is used to describe a condition of some lack of restraint which allows movement to be excessive or abnormal. It reflects an impairment of the passive restraint system for which muscle activity may or may not compensate. Instability may adversely affect joint mechanics (Adams and Hamble 1995, Hoppenfeld and Zeide 1994, Noyes et al. 1989, Oliver and Coughlin 1987, Sharma et al. 1999). Clinical instability is always associated with an abnormal deformation and a loss of tissue stiffness (Scholten 1986). Most of the joints are complex in their formation, having more than one axis within the joint. This means that, although joints have roughly reciprocallyshaped surfaces, the maximum congruity of the articular surfaces occurs at specific positions within the range of motion and these positions do not necessarily equate with the end of the range of motion. This position of maximum congruity is called the close packed position and is the position of greatest joint stability because the compression caused by the surrounding structures results in less motion. At this position there is maximal joint surface contact and the ligaments are often taut. The loose packed position, on the other hand, is where the apposition of the joint surface is the least; part of the capsule is lax and the joint is in its least stable position (Mangaleshkar et al. 1998, Trew and Everett 2001). As mentioned before, Sharma et al. (1999) do not make a distinction between laxity and instability. In their opinion knee laxity or instability is pathologic, while, in the opinion of Oliver and Coughlin (1987) stability and laxity are the same. As written above, in our opinion, hyperlaxity might well be a sequel to insufficient mechanical control, which could lead to instability. Conclusion Terms such as range of motion, stiffness, laxity and stability, which describe joint function, are closely related to each other. As a result of this relationship, for good communication and to compare measurements, it is appropriate to use clear terminology. To overcome confusion it is recommended to define the used terminology in examination reports. The range of motion reflects the mobility of a joint; it is the range of translation and rotation through which a joint may be actively or passively moved. Stiffness is a term to describe the resistance presented by the joint to imposed relative movement between two joint surfaces in any one particular direction. It is expressed in units load per unit deformation (N/mm or Nm/deg). Laxity is the amount of motion that results from forces or moments measured in units displacement (mm or Terminology used in the analysis of joint function 21 degrees). Laxity is a normal condition of the joint and is only defined for movements that cannot actively be executed or controlled. If the displacement becomes excessive or abnormal, the term hyperlaxity is applied. Stability is the ability to control positions or movements. If there is uncontrolled displacement, the term instability applies; the passive and active restraints fail to control the movement. Chapter 3 How to describe sacroiliac joint function? Mirthe de Groot, Annelies L. Pool, Cornelis W. Spoor, Chris J. Snijders. Resubmitted to Clinical Biomechanics 24 Chapter 3 Abstract Low back pain and pregnancy related pelvic pain (PLBP) is a common complaint in medical practise. Pathological mechanisms underlying PLBP are a matter of debate. In recent literature, dysfunction of the sacroiliac joint (SI-joint) is seen as one possible cause. Diagnosing SIjoint function is very complicated. One of the problems concerns the poorly defined parameters; the same definitions are used for different SI-joint functions. A literature review was performed from 1959 up to November 2004. A total number of 55 articles were included on the following topics: stiffness, laxity, range of motion and stability of the SI-joint. In 12 of the 55 articles authors gave a definition or description of the parameters. From these descriptions and definitions an inventory was made and conclusions were drawn about the terminology and the consequences for daily practise and biomechanical research. Often, the descriptions were vague or contrary to other descriptions, but the following summarizing conclusions were drawn. Stiffness of the SIjoint describes the relation between the applied load and the resultant deformation. The range of motion is the total range of rotation and translation of the joint between physiological limits. Laxity is an indication of SI-joint compression, and stability defines the mechanical controllability of the SI-joint within a physiological range of loading. Unfortunately, so far, it is not possible to measure these parameters objectively in the daily clinic. Under strict conditions it is possible to measure the stiffness and the ROM objectively in vitro. How to describe SI-joint function? 25 Introduction Low back pain and pregnancy related pelvic pain (PLBP) is a common complaint in medical practise (Albert et al. 2001, Björklund et al. 1999, Brolinson et al. 2003, Heiberg-Endresen 1995, Larsen et al. 1999, Michel et al. 1997, Östgaard et al. 1996, Wergeland and Strand 1998). Pathological mechanisms underlying PLBP are a matter of debate, but dysfunction of the sacroiliac joint (SI-joint) is considered as a potential source of pain (Albert et al. 2000, Berg et al. 1988, Dreyfuss et al. 1994, Snijders et al. 1993). In a lot of studies SI-joint dysfunction is ascribed to instability, (hyper/hypo)laxity, (hyper/hypo) mobility or altered stiffness of the joint (Bussey et al. 2004, Harrison et al. 1997, Hungerford et al. 2004, O’Sullivan et al. 2002, Walker 1992). Diagnosing SI-joint (dys)function deals with several problems. In the first place, numerous mobility tests for the SI-joint are described; however, little evidence has been presented to document their reliability and validity (Vincent-Smith and Gibbons 1999, Wormslev et al. 1994). This may partly be the result of the small amount of motion of the SI-joint of only a few degrees (Egund et al. 1978, Jacob and Kissling 1995, Smidt et al. 1995, Sturesson et al. 1989, Walker 1992). Secondly, pain provocation tests have a better reliability and reproducibility than mobility tests; however, they stress the structure in an attempt to reproduce the patient’s symptoms but do not give an objective indication of joint function (Kokmeyer et al. 2002, Laslett and Williams 1994, Östgaard et al. 1994). Thirdly, the SI-joint is complex, because it forms a functional unity with the symphysis pubis and the fifth lumbar vertebra so it cannot move independently. This makes it difficult to investigate (a part of) the system. Further, another serious problem is the poor definition of parameters describing SI-joint function. This is worrying because as a consequence it is very difficult or impossible to compare measurements of SI-joint function. Moreover, for the clinician it is important to diagnose the SI-joint function properly in order to treat the function disorder in an appropriate way. The aim of this study was to make an inventory of definitions used in describing SI-joint function, to come to consensus in terminology and to consider the implications for use in the clinical situation and biomechanical research. Methods For this review, a Pubmed literature search was carried out. The authors included studies that met the following criteria: • Results published in full report before November 2004 • Studies written in English, German, French or Dutch The keywords used were: SI joint or sacroiliac joint in combination with either the term laxity, range of motion, stiffness or stability. One 26 Chapter 3 hundred fifty four articles met the inclusion criteria. Two reviewers (MDG and ALPG) scored these articles on relevance by title and abstract. Studies on animals (6), other joints (15), muscles (9), spondylitis ankylopoetica (17), as well as studies concentrating on injury involved lesions (18), screw stabilisation (19) and diagnosis, like ultrasound and blood analysis (17) were excluded. With these criteria a number of 55 articles were included for further screening. Results In 12 of the 55 articles a definition or description of the SI-joint function parameters is given. From these articles an inventory was made according to the above-mentioned keywords. • Stiffness Stiffness is described as the ratio between the applied moment (Nm) or force (N) and the resultant rotation (deg) or translation (mm) (PoolGoudzwaard et al. 2004, Scholten et al. 1988). Stiffness can be shown graphically in a load-deformation curve. The slopes of the linear regression lines of the curve are considered as a measure for stiffness: with deformation horizontal and load vertical, a steeper curve indicates a greater stiffness of the SI-joint (Pool-Goudzwaard et al. 2004). To determine the stiffness of the SI-joint, Pool-Goudzwaard et al. (2004) secured the sacrum of embalmed specimens and applied the moments to the ilium. In contrast, Scholten et al. (1988) used a physical model of the SI-joint with a fully fixed ilium, while the sacrum was left free. • Range of motion Bussey et al. (2004) define the range of motion as the angular displacement, expressed in degrees, of one ilium with respect to the other ilium. Smidt et al. (1997) consider the range of motion as a relative movement of the ilium with respect to the sacrum. Wang and Dumas (1998) describe relative joint motion as the motion of the sacrum with respect to the ilium. Instead of range of motion or joint motion, the term mobility is also used to describe relative movement between the sacrum and the ilium (Kissling and Jacob 1996, Brunner et al. 1991). According to Kissling and Jacob (1996) mobility is a synonym for range of movement. They describe the displacement of a rigid body as a combination of rotation and translation. To measure the mobility of the SI-joint in vitro, PoolGoudzwaard et al. (2003) apply different moments to the ilium with the sacrum fixed, and measure the amount of SI-joint rotation in the sagittal plane as a result of increasing moments. According to the method of Pool-Goudzwaard et al. (2003) a steeper load-displacement curve, with the applied moment horizontal and the rotation vertical, is considered as an indication for increased mobility of the SI-joint. How to describe SI-joint function? 27 Hypermobility is described as an increased range of movement (high degree of motion) (Jacob and Kissling 1995) or a greater mobility (Kissling and Jacob 1996). • Laxity Only Richardson et al. (2002) give a description. In their opinion, laxity is an indication of joint compression, provided that all other factors remain constant. A greater SI-joint compression force will decrease the laxity. • Stability According to Pool-Goudzwaard et al. (2003), stability is the ability of a joint to bear loading without uncontrolled displacements. It depends on the relative positions of the respective bones: in certain positions the joint can bear physiological load, in others it cannot. Uncontrolled displacements may allow the joint to adopt positions in which the joint is not sufficiently fit to bear loading. In line with this definition, Richardson et al. (2002) describe stability as the mechanical control of the joint, including the muscles, limiting or controlling unwanted movement, and preventing injuries of ligaments and capsules. Vleeming et al. (1992) describe instability as a pathological condition. According to them, pelvic instability can be regarded as abnormal displacement of the pubic bones. They don’t mention the consequences for the SI-joint. Instability, according to Brolinson et al. (2003), occurs as a result of the loss of functional integrity of any of the systems of the lumbosacral and pelvic region that provide stability, like the myofascial or the osteoarticular and ligamentous components. Discussion • Terminology In only 12 out of 55 articles about SI-joint function, a description or definition of the measured parameter is given. Often the description is vague or contrary to other descriptions. In 43 articles no definition or even a description is given. This is worrying because therapies are based on these results. In the present study, four terms describing SI-joint function are defined. Stiffness, range of motion and laxity are more or less quantitative joint parameters and stability gives a qualitative description of the function of the SI-joint. Like in mechanical engineering, stiffness is defined as a measure of resistance against a change of shape, expressed in Nm/deg or N/mm. Scholten et al. (1988) and Pool-Goudzwaard et al. (2004) indicate that for the determination of stiffness, a load-displacement curve can be made. They use a physical model (Scholten et al., 1998) or embalmed pelvises (Pool-Goudzwaard et al. 2004). In both cases, one bone, the ilium or sacrum, is fully fixed and the other bone could move as a result of moments or forces, this is not possible in vivo. 28 Chapter 3 The range of motion is described as an angular displacement of one bone with respect to the other. It implies the total movement between two extreme physiologic positions. Bussey et al. (2004) describe the range of motion as the motion of one ilium with respect to the other. According to others the range of motion is the relative motion between ilium and sacrum, whereas for Smidt et al. (1997) the sacrum is the fixed body, and for Wang and Dumas (1998) the ilium is the fixed body. It does not matter whether the range of motion is described as the movement of the ilium with respect to the sacrum or vice versa; the amount of displacement will be the same. For accurate determination of the range of motion, it is very important to fix one bone carefully and to move the other from one extreme position to the other. Unfortunately, this will not be possible in daily clinic. Instead of range of motion, the terms mobility and range of movement are also used to describe the relative movement between ilium and sacrum. Range of motion and range of movement indicate, in contrast to the term mobility, more clearly that it concerns the total range between the two physiologic limits. Pool-Goudzwaard et al. (2003) make a loaddeformation curve of embalmed pelvises to determine the mobility of the SI-joint, where the sacrum is regarded as fixed body and the moments are applied to the ilium. The slope of this curve is an indication of the mobility, with a steeper curve indicating greater mobility. Actually, mobility so defined is an inverse stiffness, rather than a range of motion. Jacob and Kissling (1995, Kissling and Jacob 1996) indicate an increased range of motion or a greater mobility as hypermobility. However, a norm-value for the SI-joint is not given, so it is not known when mobility is pathologic or just physiologic. So, for clinicians, even if they are capable of correct registration of mobility, it is still not possible to define pathology or not. Although the term laxity is frequently used, only Richardson et al. (2002) give a description for laxity. According to them, laxity is a feature indicating the SI-joint compression assuming that all other factors are constant. Laxity describes an amount of motion resulting from forces or moments applied to the SI-joint, without describing the applied load or range of movement. Stability, a descriptive parameter of SI-joint function, is the mechanical controllability of the joint within the range of physiological loading. So, it is the ability of the SI-joint to control positions or movements. Instability is regarded as a pathological condition (Vleeming et al. 1992), however, when stability becomes excessively low and thus pathological is not described. Hence, stability is not measurable in daily clinic. How to describe SI-joint function? 29 • Implications of terminology in the clinical situation and biomechanical research Stiffness describes the ratio of the applied load and the resultant translational or rotational displacement; it is the slope of the loaddisplacement curve. To determine the stiffness properly, one bone, the ilium or sacrum, should be fixed carefully and the load and deformation should be measured accurately and expressed in the corresponding unity. Moreover, it is recommended to describe the direction of the applied load and resultant displacement. As mentioned, total fixation of a bone is possible in vitro or in a physical model, but cannot be applied in vivo. So in daily clinic, it is not possible to measure the stiffness of the SI-joint. Also for the determination of the ROM, it is very important to fix one bone carefully. One should indicate the direction of displacement and should be sure that the total range of motion is measured. As in describing range of motion measurements, it does not matter which bone is moved with respect to the other, but, it is recommended to indicate which bone is fixed. A correct determination of the ROM is only possible in vitro or in a biomechanical model, because in vivo it is not possible to fully fix the sacrum or ilium. So, in the clinical situation it is not possible to measure the range of motion with an acceptable accuracy. This could explain the low reliability and validity of the mobility tests (Vincent-Smith and Gibbons, 1999; Wormslev et al., 1994). Laxity, as an indication of joint compression, describes the amount of motion resulting from forces or moments. According to the results of the review, the applied load is not indicated and it does not describe the load range for which the laxity is determined. As a consequence, this term is vague. When researchers do describe the applied forces or moments and the resultant amount of motion, it is possible to calculate the stiffness. Moreover, when the total amount of motion is expressed in millimetres or degrees, this will indicate the range of motion. These terms are more specific in describing SI-joint function and thus preferable to laxity. However, when these measurements are not available, the term laxity can be used to give some qualitative indication of joint function. Next to laxity, also stability is a qualitative description of SI-joint function, with a lack of standardisation. Therefore, it is impossible to measure the stability objectively in daily clinic or biomechanical research; it only gives a descriptive indication of the mechanical controllability of the joint. Conclusion In describing SI-joint function, the parameters are rarely defined and if a description is given, it is often vague or contrary to other descriptions in 30 Chapter 3 the literature. It is recommended to describe carefully the measured parameters. In scientific research, the terms stiffness and range of motion are preferred in describing the SI-joint function, because these terms can in principle describe the function objectively. For correct measurement of these parameters, the ilium or sacrum must be fully fixed. Unfortunately, this will not be possible in vivo and thus it is not possible to describe the function of the SI-joint objectively in daily clinic. The term laxity only gives a vague description of joint function. Stability gives a qualitative description of the joint function, because measurable parameters are lacking. Consequently, it cannot be measured objectively. Chapter 4 Doppler Imaging of Vibrations fails on the knee joint 32 Chapter 4 Abstract Buyruk et al. have developed a technique to measure the laxity of the SI-joint in a non-invasive manner, Doppler Imaging of Vibrations (DIV). The purpose of the present study was to investigate the applicability of DIV to the knee joint. Two different Colour Doppler Imaging instruments (CDI) were used. The results of both were inexplicable when we applied the same considerations and theory as had been applied to DIV of the SIjoint. Although the technique of DIV seemed to be a good tool for quantifying the laxity of the SI-joint, it has never been validated thoroughly, and in practice it functions like a black box. So, before the application of DIV can be expanded to other joints, there is a need for fundamental research, especially into the use of CDI for the pick-up of excitations. Doppler Imaging of Vibrations fails on the knee joint 33 Introduction Buyruk et al. (1995a, 1995b, Buyruk 1999), Damen et al. (2001, 2002a, 2002b, 2002c, Damen 2002) and Richardson et al. (2002) have used a new technique, Doppler Imaging of Vibrations (DIV) to measure the laxity of the sacroiliac joints (SI-joints) in a non-invasive manner. The technique seems also usable to measure the laxity of the first tarsometatarsal joint (Faber et al. 2000, 2001). Although the technique was like a black box, it appeared worthy to investigate the applicability of the technique on other joints. The choice to start with measurements of the laxity of the knee joint was based on the following considerations. The knee is easily accessible: vibrations can be introduced on one side (e.g. lateral) and picked up on the opposite side. The articular surfaces are far from congruent, so small translations in the joint are possible, especially in the unloaded joint. Passive loading can be varied over a large range. The objective was testing the technique rather than finding clinically relevant results for the knee. In a later stage the DIV technique can be compared with existing techniques that are available to measure the varus-valgus laxity of the knee joint objectively (Bryant and Cooke 1988, Dahlkvist and Seedhom 1990, Lowe and Saunders 1977, Markolf et al. 1978, Marshal and Baugher 1980, McQuade et al. 1989, Oliver and Coughlin 1987, Piziali and Rastegar 1977, Rasenberg et al. 1995, Sharma et al. 1999, White et al. 1979, Wright et al. 1969). Materials and Methods • Position and support of subject Like the measurements of the SI-joint, the measurements of the knee joint were performed in an unloaded position. The set-up frame was constructed from metal pipes and couplings. The subject, seated on a chair which was mounted on the frame, kept his legs hanging down freely. At the medial side of the upper leg, a support prevented displacement that could otherwise result from the pressure of the excitator. For a constant level of excitation, the pressure of the excitator against the knee had to be constant. All measurements were performed on healthy subjects, who gave their informed consent to participate in the study. The project was approved by the Medical Ethics Committee of the Erasmus MC. • Excitation The output head of the excitator, with an area of 2 cm2, made contact with the lateral femoral condyle of the subject. Vibrations of 200 Hz were applied in transversal direction (Figure 4.1). The combination of signal generator, amplifier and excitator that had been used for the SI-joints produced too intense vibrations for DIV of the knee joint. Therefore, a smaller excitator (Ling Dynamics System Ltd, Chapter 4 34 England, model V201), attached to a pendulum, was used. The suspension point of the pendulum could be moved sideways, forward and backward, and vertically. This allowed adjusting the position and pressure of the excitator against the knee. The input of the excitator was supplied by a signal generator (HP 3312A) in combination with an amplifier (Quad 405). • Pickup At the medial side of the knee joint, signals for the echography images were picked up (Figure 4.1). The 7.5 MHz transducer of the Colour Doppler Imaging (CDI) was placed across the joint gap. The first measurements were performed with an old CDI (Quantum Angio Dynograph 1, Philips Ultrasound Inc. 1987, Santa Ana, USA), here shorter called “Quantum CDI”. Later we used a more recent one (Toshiba Medical Systems, SSA-340A, no. 2B7-500EE, 1994, Tokyo, Japan), here shorter called “Toshiba CDI”. When the velocity of vibrations exceeded a certain level, it was shown as coloured pixels at the CDI monitor. In the same way as for the SIjoint, the threshold levels of femur and tibia were determined (Buyruk et al 1995b, 1999, Damen et al. 2001, 2002a, 2002b, 2002c, Damen 2002). The threshold level of the femur was subtracted from the level of the tibia. The difference gives the ratio between the amplitude squared of the vibrations of the two bones, expressed in dB. Signal generator Power amplifier Excitator Transducer CDI Figure 4.1 Schematic drawing of Doppler Imaging of Vibrations applied to the knee joint. Results • Quantum CDI The measurements were performed at the right knee of five healthy subjects. In the B-mode, it was very difficult to get a clear image of both sides of the joint, so they could not be measured simultaneously; therefore, the tibia and femur were measured one after another. It was also very difficult to interpret the Colour mode; it was hard to Doppler Imaging of Vibrations fails on the knee joint 35 determine the threshold level at which the pixels disappeared. Additionally, the soft tissues around the bone were vibrating as well, also causing coloured pixels. The results, expressed in threshold units (TU) were definitely not consistent. Repeated measurements on one subject showed a lot of variance in absolute threshold levels of femur and tibia, as well as in TU difference between the two bones (Table 4.1). Subject 1 2 3 4 5 Tibia Fibula ∆ Tibia Fibula ∆ Tibia Fibula ∆ Tibia Fibula ∆ Tibia Fibula ∆ Range 7-16 2-15 1-5 6-8 4-7 0-4 10-15 4-6 6-9 9-12 7-11 0-4 12-14 5-9 4-7 ∆ = Difference in TU between femur and tibia. Threshold Units (TU) Mean (SD) 10.7 (4.7) 8.0 (6.6) 2.7 (2.1) 7.0 (1.0) 5.7 (1.5) 1.3 (2.3) 12.0 (2.6) 4.7 (1.2) 7.3 (1.5) 10.7 (1.5) 8.7 (2.1) 2.0 (2.0) 13.0 (1.0) 7.0 (2.0) 6.0 (1.7) Table 4.1 Characteristics of Doppler Imaging of measurements on healthy knees in threshold units (TU). Vibrations • Toshiba CDI With the Toshiba CDI it was possible to get clearer images of the joint and to get both sides of the joint simultaneously on screen. This Toshiba CDI has a lot of possible settings; one is the detectable velocity range. This range determines what velocities can be detected and given as coloured pixels. It was investigated whether the velocity range settings, the detectable direction of velocity and velocity range, influenced the measured laxity values of the knee joint. At the detectable velocity ranges 0.00-0.06 and 0.00-0.12 m/s, the coloured pixels were projected more on the bone and less on the soft tissue as compared to the Quantum CDI. However, it was hardly possible to do comparative measurements between femur and tibia because again it was very hard to determine the threshold level at which the pixels disappeared. At the detectable velocity range 0.00-0.16 m/s, the coloured pixels were given randomly on the screen. At the range 0.00- 36 Chapter 4 0.19 m/s, even at high excitation levels, it was not possible to get coloured pixels from the vibrating bone on screen. At the ranges detecting velocity toward the transducer as well as away from it, for the ranges up to -0.10 to +0.10 m/s there were randomly some coloured pixels. At the ranges -0.12 to +0.12 m/s and higher, it was not possible to get information about the velocity on screen. Discussion The principle of DIV is measuring the velocity of vibrating bone with CDI. This is definitely another application than CDI is originally designed for. In previous research, the Quantum CDI was used to measure the velocity of vibrating bones of the SI-joints. The ratio of vibration intensities of the sacrum and ilium was a measure for the SI-joint laxity. However, it was not possible to measure laxity of the knee joint with the Quantum CDI. It was difficult to interpret the B-mode and Colour mode images of the joint. This could partially explain the inconsistent results, if we assume that indeed bone velocities were measured. Another reason for inconsistent results in vibration intensity difference between femur and tibia, expressed in TU, was measuring in succession. Changes in contact between excitator, bone and transducer might occur. With the newer CDI, the Toshiba CDI, we could measure femur and tibia simultaneously. Repeated measurements with various detectable velocity ranges, a feature of this CDI, led to inexplicable results. The detectable velocity ranges up to 0.00-0.12 m/s gave the information of the vibrating bone as coloured pixels at the location of the bone. But it was still not possible to make comparative measurements according to the technique of DIV as used for the SI-joint, because it was hard to determine the threshold level at which pixels disappeared. At higher ranges, there were randomly some pixels or no pixels at all. This is strange because the lower velocities were also included in the ranges. The ranges detecting motion toward the transducer as well as away from it, didn’t give any reasonable results. Solutions to the above problems ask for fundamental research into the functioning of CDI in the detection of vibrations. Conclusion Doppler Imaging of Vibration measurements on the knee joint with both CDI’s led to inexplicable results, if we assume that vibrating bone velocities were measured. DIV, so far used as a black box, needs fundamental research, especially into the use of CDI for the pick-up of excitations. Chapter 5 Critical notes on the use of Doppler Imaging of Vibrations Reprinted with permission from the World Federation of Ultrasound in Medicine and Biology, Copyright 2004 Mirthe de Groot, Cornelis W. Spoor, Chris J. Snijders. Ultrasound in Medicine and Biology 2004; 30(3): 363-367 38 Chapter 5 Abstract Buyruk et al. have developed a noninvasive technique, Doppler imaging of vibrations (DIV), to measure objectively the laxity of the sacroiliac joints (SI-joints). The purpose of the present article was to review this technique. Therefore, all the articles about DIV were carefully studied. The reliability of the technique has been determined by the generalisability theory and seems to be good. The technique has also proven its clinical relevance. However, a thorough study into the validity of the technique is still missing. Such study is considered necessary because relevant assumptions in DIV appear generally not to be correct. Conclusions from the measurements with DIV so far should be drawn with great care. Critical notes on the use of Doppler Imaging of Vibrations 39 Introduction In 1995, the first articles were published about Doppler imaging of vibrations (DIV), a technique to measure objectively the laxity of the sacroiliac joint (SI-joint) (Buyruk et al. 1995a, 1995b). SI-joint laxity is believed to be related to certain types of low back pain (Snijders et al. 1993). Until 1995, objective measurement of the laxity of SI-joints was restricted to invasive methods such as X-ray stereophotogrammetry with tantalum markers inserted into the sacrum and ilium. The SI-joint movements measured with this method were very small: rotation of the SI-joint is up to 3.9° and the translation is up to 1.6 mm (Sturesson et al. 1989). Because of these small movements, noninvasive laxity tests, including pain-provocation and mobility tests, are subjective and often unreliable (Dreyfuss et al. 1994). Consequently, a need existed for an instrumented method that is noninvasive and could be routinely applied in the clinic. The technique of DIV applies sinusoidal excitations to the ilium. The laxity of the SI-joint is quantified by the ratio of vibration intensities of the ilium and the sacrum measured with colour Doppler imaging (CDI), as proposed by Buyruk and colleaques. The ratio of vibration intensity or energy is proportional to the squared ratio of vibration amplitude. Measurements were performed on a physical model, embalmed pelvises, healthy subjects and women with pregnancy-related pelvic pain (Buyruk et al. 1995a, 1995b, 1999, Buyruk 1996, Damen et al. 2001, 2002a, 2002b, Damen 2002). Also, a reliability study was performed (Damen et al. 2002c). Richardson et al. (2002) used the technique to demonstrate the effect of abdominal muscle activity patterns on the SI-joint laxity. Faber et al. (2000, 2001) expanded the technique to the first tarsometatarsal joint. The purpose of the present article is to review the technique and to look carefully to its physical basis. Materials and Methods • Position and support of subject During the measurements, the subject was lying in prone position with relaxed muscles on an examination table with a mattress (Buyruk et al. 1995b, 1999, Damen et al. 2001, 2002a, 2002b, 2002c, Damen 2002). In the mattress was a cut-away area at the level of the uterus to avoid pressure for pregnant women. To exclude the influence of muscle tension on the amount of passive laxity, the measurements were performed with the SI-joint in a stationary, neutral and unloaded position. The idea behind it was that, because the amplitude of the vibrations was far below the physiological range of joint motion, the measured amount of laxity focuses on the centre of the normal range of motion, indicated as the neutral zone (Damen et al. 2002a, 2002c). 40 Chapter 5 • Excitation A signal generator (Derritron Electronics, Hastings, UK; frequency range 1.4-20000 Hz and various output possibilities) produced sinusoidal signals. After amplification by a TA 120 power amplifier, the signals were transformed to vertical vibrations by a Derritron VP3 excitator (both Derritron Electronics, Hastings, UK) (Figure 5.1). The excitator was positioned next to the examination table, without contacting it. A vertical metal rod of about 1 m was attached to the excitator. At the top of this rod was a horizontal plate of about 15*8*2 cm which supported the anterior superior iliac spine of the subject. Vibrations with a frequency of 200 Hz, an amplitude not exceeding 0.05 mm and an input power of the excitator of 1.4 W, were applied unilaterally through the support to the anterior superior iliac spine (Buyruk et al. 1995a, 1995b, 1999, Damen et al. 2001, 2002a, 2002b, 2002c, Damen 2002). A pillow supported the contralateral side of the pelvis to keep the pelvis horizontal. • Pick-up The intensity of the vibrations across the ipsilateral SI-joint was measured with a colour Doppler imaging (CDI) apparatus (Quantum Angio Dynograph 1, Philips Ultrasound Inc. 1987, Santa Ana, California, USA) with a transducer of 7.5 MHz (Buyruk et al. 1995a, 1995b, 1999, Damen et al. 2001, 2002a, 2002b, 2002c, Damen 2002). The colour processing of CDI was based on fast Fourier transformation (FFT) (Damen et al. 2002c; Damen 2002). The CDI transducer covered both sides of the SI-joint and B-mode images were made to give an overview of this area (Figure 5.1). With use of the threshold button, the power necessary to get the colour signal on the screen can be adapted and it was possible to make comparable measurements of ilium and sacrum. When the energy of the Doppler signal of the vibrating ilium and sacrum exceeded a certain level, it was displayed in red and blue pixels on the CDI monitor. When the threshold button reading was high, coloured pixels appeared at both sacrum and ilium. By turning back the threshold button, the Doppler colour images of the vibrating sacrum disappeared and changed to grey scale. When the threshold button was further turned back, the coloured pixels due to the moving ilium also disappeared. Both threshold levels were recorded and expressed in threshold units (TU), a measure in dB for power ratio. It was assumed that, since the threshold levels were directly related to the vibration energy of the bone, a large difference in TU between sacrum and ilium indicated a large loss of energy through the SI-joint and was an indication for a lax joint. A small difference or an absence of it was an indication of a stiff joint (Buyruk et al 1995b, 1999, Damen et al. 2001, 2002a, 2002b, 2002c, Damen 2002). Critical notes on the use of Doppler Imaging of Vibrations 41 Figure 5.1 Schematic drawing of Doppler Imaging of Vibrations applied to SI-joint. Results and Discussion • Validity of measurements with DIV Buyruk et al. (1995a) and Buyruk (1996) assessed the validity of DIV on a physical model and on embalmed human pelvises. The aim of the study on the pelvis model was to demonstrate a proportional relationship between joint stiffness and transmission of vibrations through the SIjoint. They believed the physical model was representative for the mechanical properties of SI-joints and pubic symphysis. The size of the model was chosen in proportion to a female human pelvis with a width of the iliac crest of 30 cm. Metal bars simulated the mass of the body and legs. With the geometry and the material of the model, it was possible to simulate different stiffness levels of the SI-joint. The site of excitation was the part of the model that simulated the anterior superior iliac spine. Vibrations were measured with accelerometers at the dorsal side of the structures representing the right ilium and sacrum. From the signals of the accelerometers, the ratios in amplitude between “sacrum” and “ilium” were calculated. For increasing stiffness levels, the ratio of amplitudes approached unity. Repeated measurements were consistent. Buyruk (1996) concluded, from these results, that the transmission of vibrations through the SI-joint of the physical model was proportional to joint stiffness. In fact, such relationship cannot be true for large joint stiffness, because then the transmission is limited to 100%. Buyruk (1996) mentioned that the model displayed no resonance in the frequency interval between 225 and 350 Hz. This does not exclude the possibilities of resonance near the 200 Hz that was used for DIV in vivo. If indeed resonance frequencies are close to the applied 200 Hz 42 Chapter 5 and they are different for different subjects, then phase differences across the joint should not be ignored. DIV on the SI-joint in standing position sometimes showed that the vibration of the sacrum was more intense than the vibration of the externally excited ilium (unpublished observations). This phenomenon could indicate resonance. It contradicts the notion that the vibration intensity must decrease across the joint. The measurements on four female embalmed pelvises were used to show the validity of DIV. Interpretation of the results should be made carefully, because it is known that the formalin fixation of embalmed pelvises strongly influences the mechanical properties of soft tissue (Wilke et al. 1996). The test specimens were resected from L4 to midfemur level. The skin, subcutaneous layers and pelvic organs were removed, carefully keeping the muscles and ligaments intact. Metal blocks and bars mimicked the masses of legs and trunk. Excitations and the pick-up of vibrations were performed according to the technique of DIV. Three different conditions were measured: no intervention, artificially fixed SI-joint by means of screws and an artificially unstabilised joint made by removing screws and cutting the anterior and interosseous ligaments. The SI-joints presented significantly different levels of stiffness between the various artificial stability conditions. From this, it was concluded that the technique of DIV is valid, objective and repeatable (Buyruk et al 1995a). However, this technique was validated on only three different joint stiffnesses of dissected embalmed pelvises; it should also be validated in vivo or, at least, on fresh cadavers. Buyruk et al. (1995b) supposed that the difference in threshold levels between sacrum and ilium represented the loss of vibration energy over the SI-joint. However, this assumption is not yet proven. The relationship between vibration intensity ratio and joint stiffness should be studied by modelling the pelvis as a mass-springdamper system. It has not been proven that measured vibration energy pertains to bony surfaces; they could also be representative for the vibrating soft tissue. Initially, the measurements at ilium and sacrum were performed simultaneously (Buyruk et al. 1995a, 1995b, 1999, Damen et al. 2002b, Damen 2002). Later, the measurements were performed in succession, as Damen et al. (2001, 2002c) described. Measuring in succession might give additional measurement errors because, in the course of time, changes in vibration propagation and, therefore intensity, could occur. According to Buyruk et al. (1999), the position and angulation of the CDI transducer were not critical because only the difference in vibration intensity (in TU) between the left and right SI-joints was of interest. This assumption ignores possible sources of error of measurements at both sides of a joint in succession. Critical notes on the use of Doppler Imaging of Vibrations 43 • Reliability of measurements with DIV The reliability of the laxity measurements of the SI-joint with DIV was investigated using the generalisability theory. Four inexperienced testers and one experienced tester assessed reliability and measurement errors from repeated measurements on 10 healthy subjects on two occasions (Damen et al. 2002c). The SI-joint laxity values ranged from 0.0 to 5.8 TU. The smallest detectable difference (SDD) is the difference in TU sufficient to conclude that the result is a true difference and not a measurement error. The SDD showed that, in hypothetical applications of the measurement on a healthy female SI-joint assessed by the same tester, only changes of 3 TU or larger (three repetitions) can be interpreted as real differences in laxity. For a single measurement, there should be at least a difference of 3.5 TU. To compare the left and right SI-joints, the smallest detectable side difference (SDsD) has been determined. For individual subjects assessed by the same inexperienced tester, only differences between the left and right SI-joints larger than 5 TU can be interpreted as a real difference in laxity (Damen et al. 2002c). Because the testers with little experience showed irregular results, further analysis was focused on the intratester reliability for an experienced tester. For the SDD, a change in SI-joint laxity is significant when changes are larger than 2 TU (three observations). The SDsDs, measured by the experienced tester, showed that, for each subject, only differences of 3 TU or more could be interpreted as real differences in laxity between left and right SI-joint. To obtain reliable SI-joint laxity measurements, the researchers recommended a minimum of three repetitions during one test occasion by an experienced tester. Some variation between occasions might be inevitable, despite strict standardisation of the measurements. The results from this study indicate that an experienced tester is the gold standard. Specific training and experience of a tester are necessary for reliable SI-joint laxity measurements with DIV (Damen et al. 2002c). • Clinical relevance of measurements In several studies, Doppler imaging of vibration has proven its clinical relevance. Buyruk et al. (1999) investigated whether the SI-joint laxity of peripartum pelvic pain patients differed from that of healthy subjects. No statistically significant differences in mean laxity value were seen between patients and controls. However, a highly significant difference was found between the groups with regard to the difference between left and right SI-joints. Also, Damen et al. (2001, 2002a) concluded, in two studies, that there is a clear relation between asymmetric laxity of the SI-joints and pregnancy-related pelvic pain (PLBP). A cross-sectional analysis was performed in a group of 163 women, 73 with moderate or severe PLBP and 90 with no or mild PLBP at 44 Chapter 5 36 weeks of pregnancy. In both groups, a broad range of laxity values was found. However, the mean left-right difference of SI-joint laxity was significantly higher in the group with moderate or severe PLBP compared with the group with no or mild PLBP (Damen et al. 2001). In another study, 123 subjects were measured at 36 weeks of pregnancy and 8 weeks postpartum. This study established that postpartum PLBP is also related to asymmetric laxity of the SI-joints, rather than to absolute SIjoint laxity. It also revealed that subjects with an asymmetric laxity during pregnancy have a threefold higher risk that moderate to severe PLBP will persist into the postpartum period than subjects with symmetric laxity during pregnancy (Damen et al. 2002a). The objective of another study was to evaluate the influence of different positions and tensions of a pelvic belt on SI-joint laxity in 10 healthy young women (Damen et al. 2002b). SI-joint laxity values were, on average, lower with belt than without. The tension of the belt (50 or 100 N) did not have a significant influence on the laxity. A significant effect was found for the position of the belt; with the belt just below the anterior superior iliac spines (high position), the laxity was significantly lower than with the belt at the level of the pubic symphysis (low position) (Damen et al. 2002b). The same mechanical effect of a pelvic belt on the laxity of the SI-joint was found for patients with PLBP. Included were nonpregnant women, within 5 years after pregnancy and with PLBP that started during pregnancy (Damen 2002). The influence of the transversus abdominis muscle on the laxity of the SI-joint was investigated with DIV (Richardson et al. 2002). Thirteen healthy individuals performed two muscle activity test patterns. The first pattern was the drawn-in pattern, which is an isolated contraction of the transversus abdominis. The second pattern was the brace pattern, which is a general contraction of all the abdominal muscles. In all individuals, laxity values decreased significantly during both muscle patterns. The isolated transversus abdominis contraction, however, decreased SI-joint laxity significantly more than did the general abdominal exercise pattern. The technique of DIV was expanded to the first tarsometatarsal joint (TMT-1) (Faber et al. 2000, 2001). The clinical mobility test of 32 TMT-1 joints was compared with DIV measurement of this joint in hallux valgus patients. A significant relationship was found between DIV values and clinical examination. Conclusion Conclusions based on measurements with DIV should be made with great care. The reliability has been shown to be good and the technique has shown its clinical relevance. However, the technique has not been validated thoroughly. Critical notes on the use of Doppler Imaging of Vibrations 45 The following assumptions of DIV are, at least in general, not correct and need further investigation: (i) energy loss in propagation ensures vibration intensity reduction across a joint; (ii) joint stiffness is proportional to the conducted vibration intensity; (iii) vibration intensity changes during one measurement session are negligible; (iv) vibration phase differences across a joint can be ignored; (v) threshold units are a measure for the velocity (squared) of the vibrating bone. Thus, DIV seems to be a promising technique to measure the laxity of the SI-joint, but more fundamental research is needed. Chapter 6 Doppler Imaging of Vibrations test on a physical model Mirthe de Groot, Cornelis W. Spoor, Chris J. Snijders. Submitted to Medical Engineering and Physics 48 Chapter 6 Abstract Doppler Imaging of Vibrations (DIV) is a recently developed technique to measure the laxity, here defined as a non-calibrated indication of joint compression, of the sacroiliac joint (SI-joint) with the use of Colour Doppler Imaging (CDI) and vibrations. After a review of the technique of DIV the conclusion was drawn that diagnosis based on measurements with DIV should be made with great care. Although the technique had proved its clinical relevance and the reliability seemed to be good, there was a lack of validation. DIV, being used as a black box, needed fundamental research especially into the use of CDI for the pick-up of excitations. The purpose of the present study was to investigate the application of CDI to measure the maximum velocity of a vibrating target. Measurements were performed on a physical model in the Colour Doppler mode as well as in the Doppler/M-mode. The measured velocity, in both modes, was a factor of 4 to 44 higher than the applied velocity. In addition, the content and the thickness of the intermediate tissue influenced the measured velocity. We concluded that CDI is not appropriate for quantitative detection of vibrations with frequencies of 40 to 240 Hz. Diagnosis based on measurements with DIV should be made with great care. Doppler Imaging of Vibrations test on a physical model 49 Introduction A new technique, Doppler Imaging of Vibrations (DIV), aims to measure the laxity of the sacroiliac joint (SI-joint) (Buyruk et al 1995a, 1995b, 1999; Damen et al 2001, 2002a, 2002b, 2002c; Damen 2002; Richardson et al 2002). With the subject lying prone, the technique of DIV applies sinusoidal excitations with a frequency of 200 Hz to the spina iliaca anterior superior. Across the heterolateral SI-joint, the intensity of the vibrations is measured with a Colour Doppler Imaging apparatus (CDI). The laxity of the SI-joint is quantified by the ratio of vibration intensities of the ilium and sacrum, and expressed in threshold units (power in ratio dB). The results of these clinical studies are frequently cited, because it seems to be the only technique to measure, in vivo, the laxity of the SIjoint in a non-invasive and objective manner. The technique seemed also a good method to quantify the laxity of the first tarsometatarsal joint (Faber et al 2000, 2001). However, after a literature review it appeared that the technique functioned like a black box and has not been validated thoroughly (de Groot et al 2004). Moreover, measured laxity values of the knee joint disagreed with basic assumptions of DIV if we assume that vibrating bone velocities were measured (unpublished observations). These results strongly suggested more fundamental research, especially into the use of CDI for the pick-up of excitations. Colour Doppler Imaging (CDI) is a technique to detect and measure the velocity of moving structures, in particular blood, within the body. The information about the velocity is obtained from the frequency shift of reflected ultrasound (Evans et al 1989, Kremkau 1992). The technique of DIV uses CDI to acquire information about the velocity of a vibrating bone. Unlike bloodflow, this is an oscillating motion and its velocity is much lower than the velocity of bloodflow. To quantify the vibration of bone, it is necessary to know the relationship between the vibration parameters and the accompanying output of the CDI. The aim of the present study was to assess if it is possible to measure the maximum velocity of a vibrating target with CDI. Material The equipment included a wooden table on which a gel-pad was laid as dummy tissue (Figure 6.1). The excitator (Ling Dynamic Systems Ltd, England, model V201) was fixed to the underside of the table and did not touch the underground on which the table was placed. The tip of the excitator protruded through a hole in the table and pushed against the gel-pad. The tip consisted of two plastic layers with in between an accelerometer (IC Sensors, USA, model 3021-005), with a range of 5g (gravitation) and a sensitivity of 6.0/15.0 mV/g. The frequency response, the range of frequencies over which the device sensitivity is within ± 5% of the DC value, is determined as 0-300 Hz. Chapter 6 50 The excitator was driven by a generator (HP 3312A) via an amplifier (Quad 405) (Figure 6.2). A voltmeter (Fluke 68027) measured the input voltage of excitation. After amplification (1000 times), the signal of the accelerometer was shown on a digital scope (HP 54603B). Transducer Gel-pad Scope Amplifier Table Excitator Figure 6.1 Experimental setup. Colour Doppler Imaging (CDI) (Toshiba Medical Systems, Japan, 1994, SSA-340A, no. 2B7-500EE) was expected to measure the velocity of the vibrating excitator tip with a 7.5 MHz transducer. The transducer was mounted to a stand and placed on the gel-pad above the vibrating target. The measurements were performed through the gel-pad. The tip of the excitator simulated the vibrating bone; the gel-pad simulated the overlying tissue (muscle, fat, skin). Methods Two experiments were performed; in the first experiment measurements of the velocity of the vibrating target were done in Colour Doppler mode, in the second experiment in Doppler/M-mode. The detectable velocity range and the colour gain were adjusted. The chosen detectable velocity range determined the velocity range that could be detected by CDI; the colour gain pertained to a signal amplifier. The frequency of the vibrating tip was set at the signal generator. The excitation voltage determined the acceleration of the tip of the excitator; this acceleration was read from the scope. Because the frequency and the acceleration were known, it was possible to calculate the excitator velocity with the formulas of harmonic vibration (f is frequency, t is time, Uo is amplitude): Position: U = U0sin(2πft) Velocity: vmax = 2πfU0 Acceleration: amax = (2πf)2U0 Following: vmax = amax / 2πf Doppler Imaging of Vibrations test on a physical model Signal generator HP 3312A Power amplifier Quad 405 Excitator Ling dynamics systems Accelerometer IC Sensors 3021-005 Gel-pad 51 Signal amplifier BNT V104 Digital scope HP 54603B Transducer 7.5 MHz PLF-703NT CDI Toshiba SSA-340A Figure 6.2 Block diagram of the experimental setup. • Colour Doppler mode The Colour Doppler mode gave the information about the velocity as coloured pixels. The experiment was performed at vibration frequencies of 100 and 200 Hz. The detectable velocity range varied from –0.01 to +0.01 m/s up to –0.23 to +0.23 m/s, i.e. velocity toward and away from the transducer. The colour gain was set from 1 up to 6. For each measurement, the excitation voltage was decreased to the level at which only just a few coloured pixels appeared on the screen. The acceleration at that level was read from the scope, and the applied velocity of the tip of the excitator was calculated. The applied velocity was compared to the detectable velocity range with which the measurements were done. The measurements were performed through a gel-pad of 1.5 centimetre thickness, both single and folded up. • Doppler/M-mode In the Doppler/M-mode the velocity was given graphically against time. The experiments were carried out at frequencies of 40, 60, 80, 100, 120, 160, 200 and 240 Hz and at 18 different accelerations from 0.1 up to 4.0 g (1 g = 9.81 m/s2). The detectable velocity range was set at –0.12 to +0.12 m/s and the Doppler gain at 1. Three measurements were performed through a gel-pad of 1.5 centimetre thickness (experiment A), two measurements through the same gel-pad but folded (experiment B) and two measurements through a gel-pad of 3.5 centimetre thickness with a different content (experiment C). Per experiment the average applied velocity was calculated. Regression analysis was done to get a model in which the dependent variable, the applied velocity, could be predicted from the independent Chapter 6 52 variable, with CDI measured velocity. The t-test was performed to compare the regression models per frequency. Measured velocity (m/s) Results • Colour Doppler mode The threshold level at which only just a few pixels appeared on the screen was determined for each measurement. At a frequency of 200 Hz, the detectable velocity ranges of -0.01 to +0.01 and -0.07 to +0.07 up to -0.23 to +0.23 m/s gave senseless information. At a detectable velocity range of -0.02 to +0.02 up to -0.06 to +0.06 m/s there was more or less a linear relationship with the applied velocity. In contrast, the applied velocities varied from 1.6*10-4 to 3.5*10-4 m/s, which was much lower than the measured velocities. The colour gain influenced the measured velocity: at a higher colour gain, the acceleration and thus the velocity at which there was just information (coloured pixels) was lower. At a frequency of the vibrating tip of 100 Hz, the excitation at the level of just some visible pixels corresponds, according to the formulas of harmonic vibration, to a velocity of the tip of 3.2*10-4 m/s. This is a lot lower than the velocity range of 0.2 m/s. To test if tissue overlying the bone influenced the measurements, measurements were also performed with a folded gel-pad. At a frequency of 200 Hz and a velocity range of -0.02 to +0.02 m/s, the measured velocities were 25 to 36% higher than the measured velocities with the single gel-pad, for equal applied velocities (Figure 6.3). 0,0045 0,0040 0,0035 0,0030 0,0025 0,0020 0,0015 0,0010 0,0005 0,0000 Single gel-pad Folded gel-pad 0 1 2 3 4 5 6 7 Colour gain Figure 6.3 The measured velocity in the Colour Doppler mode in relation to the colour gain for a single and folded gel-pad. • Doppler/M-mode In this mode, at an increase of the applied velocity there was an increase of the velocity measured with CDI. However, the measured velocity was significantly (4 to 44 times) higher than the applied Doppler Imaging of Vibrations test on a physical model 53 velocity. Figure 6.4 illustrates the relation between the applied and measured velocity for the 3 experiments at a frequency of 80 Hz. Measured velocity (m/s) 80Hz 0,140 0,120 0,100 0,080 0,060 0,040 0,020 0,000 0,000 Experiment A Experiment B Experiment C Applied 0,020 0,040 0,060 0,080 0,100 Applied velocity (m/s) Figure 6.4 The relation between the applied and measured velocity in the Doppler/M-mode for a frequency of 80 Hz. Measured velocity (m/s) 120Hz 0,120 0,100 0,080 0,060 0,040 0,020 0,000 0,000 Experiment A Experiment B Experiment C Applied 0,020 0,040 0,060 Applied velocity (m /s) Figure 6.5 The relation between the applied and measured velocity in the Doppler/M-mode for a frequency of 120 Hz. At frequencies of 100, 120 and 160 Hz, the velocity measured with CDI, as a function of applied velocity was not monotonous anymore: the relationship showed plateaus (Figure 6.5). At frequencies of 200 and 240 Hz, the measured velocity was even independent of the applied velocity (Figure 6.6). In further analysis, frequencies of 100 Hz and above were ignored; analysis was only performed for 40, 60 and 80 Hz. Per frequency and experiment regression models were made. The t-test was performed per frequency to assess if the models were the same, i.e. to test the influence of the gel-pad (overlying tissue) on the measured velocity. Only the models of 80 Hz between experiments A and C were Chapter 6 54 not significantly different. The other models differed significantly from each other at α = 0.05. Measured velocity (m/s) 200Hz 0,060 0,050 0,040 0,030 0,020 0,010 0,000 0,000 Experiment A Experiment B Experiment C Applied 0,010 0,020 0,030 0,040 Applied velocity (m/s) Figure 6.6 The relation between the applied velocity and the measured velocity in the Doppler/M-mode for a frequency of 200 Hz. Discussion The velocity of the vibrating target was measured with CDI. In the Colour Doppler mode the information was not consistent. For some velocity ranges there was clear information and for the next range there was only noise. For the detectable velocity ranges of -0.02 to +0.02 up to -0.06 to +0.06 m/s we observed a relationship between the colour gain and the measured velocity: for a higher colour gain the coloured pixels were still present at lower velocities. This was what one would expect: at a higher gain, the signal was earlier detected, so the excitations had to be decreased to let the pixels disappear. Why this phenomenon did not occur at other detectable velocity ranges was not clear. The excitation at the threshold level with only a few coloured pixels was very small; the amplitude was 0.13 to 0.28 µm. The velocity then was 1.6*10-4 to 3.5*10-4 m/s. The velocity the CDI measured was at the upper side of the ranges of -0.02 to +0.02 up to -0.06 to +0.06 m/s as was shown by the colour of the pixels (yellow and light blue). So, the measured velocity was much higher than the applied velocity. At the frequency of 100 Hz the difference between applied and measured velocity was even greater; accelerations were too small to be read from the scope. The velocity measured by CDI through the folded gel-pad was 25 to 36% higher than the velocity measured through the single gel-pad, while the applied velocity had been kept constant. This means that overlying tissue influences DIV measurements on vibrating bone. Doppler Imaging of Vibrations test on a physical model 55 Data processing within the scanner in Colour Doppler mode took far longer than in Doppler/M-mode. This could be a problem when measuring the velocity of a vibrating target. For the experiment in Doppler/M-mode, three measurements were done in experiment A and two measurements in experiments B and C. Although this was a limited number, it was enough because of the reproducibility of the measurements. The detectable velocity range of the Doppler signal was set at the smallest value, -0.12 to +0.12 m/s. The applied velocities varied from 0.002 to 0.156 m/s. Most of the applied velocities were at the bottom of the range; a few measurements exceeded the detectable range. So, a measured value of 0.12 m/s means 0.12 m/s or higher. The number of data points that fell outside the range differed per experiment. This was no problem for the statistical analysis, because the difference in numbers of data points was very small. The measured velocities were significantly higher than the applied velocities. For frequencies of 100 Hz and above, there was no relation between the applied and the measured velocity. As a consequence, these frequencies are not appropriate for velocity measurements with DIV. At frequencies of 40, 60 and 80 Hz there was a distinct increase in measured velocity when the applied velocity increased. In spite of the difference between measured and applied velocity, there could be a useful relationship. As a check, regression models were made and compared by means of the t-test for an alpha of 5%. The regression coefficient of the models was 0.99 or higher. With such relationship, clinically relevant and reliable results with DIV may be possible. The models of experiments A and C for 80 Hz were not significantly different, the other models were. This means that the composition or thickness of overlying tissue influences the measured velocity of vibrating bone, which is undesirable for reliably measuring vibration ratios at joints. Conclusion Measuring the velocity of a vibrating target with CDI deals with several technical problems, which are only mentioned briefly. The conclusion is that CDI is hardly or not appropriate for quantitative detection of vibrations of solid objects with frequencies of 40 to 240 Hz. Consequently, diagnosis based on joint laxity measurements with DIV is not recommended and as far as done at all, results should be interpreted with great care. Chapter 7 Contact pressures for a flat and a concave surface Based on: Contact pressures for a flat and a concave seat Mirthe de Groot, Cornelis W. Spoor, Ed Heule, Chris J. Snijders. Submitted to Applied Ergonomics 58 Chapter 7 Abstract Contact pressure distribution and seating comfort were compared for a hard flat and a hard slightly concave (r=2.6 m) seat. Pressures of 22 healthy subjects, aged 21 to 32 years, were measured with Force Sensing Array technology. The mean measured peak pressures were 119 kPa (SD=56 kPa) for the flat seat and 90 kPa (SD=51 kPa) for the slightly concave seat, this is about 4 times higher than reported in literature. The concave seat showed significantly lower (mean 11.7%) peak pressures than the flat seat. The subjective Visual Analogue Scale score was significantly higher for the concave seat than for the flat seat, indicating that subjects found the concave seat more comfortable than the flat seat. The above results are considered relevant not only for seat design but also for other applications of load transfer to the human body. Regarding vibration transmission for joint laxity measurements, the results suggest that the excitator tip shape should be more or less complementary to the local body shape. There was no significant correlation between body build and peak pressure, except for the size of the subject and the contact pressure of the concave seat. Contact pressures for a flat and a concave surface 59 Introduction The pick-up of excitations as during laxity measurement of the sacroiliac joint (SI-joint) according to the technique of Doppler Imaging of Vibrations (DIV) has not been validated and still has to be redeveloped. No research has been done on the form of the contact surface between body and excitator. The current study is performed to investigate the best form of the excitator in terms of comfort and contact pressure. The study is applied to sitting, because the exact site of excitation is not known yet. Moreover, measurements of contact pressure and comfort are more common in seating research and equipment is easier to get. In fact, the seat is taken as a model for the much smaller excitator tip. External forces acting on the buttocks of a seated subject are thought to correspond closely to the internal stress and strain that eventually cause the skin and subcutaneous tissue to break down (Brienza et al. 1993, Harstall 1996). So, the lower the contact pressure, the lower the chance on pressure ulcers (Barbenel 1991). The time necessary for laxity measurements of the SI-joint is probably not so long that tissue breakdown is likely. However, the subjectively experienced comfort is very important, because the subject has to lie very quiet during the measurements. The first analysis of contact stress between elastic ellipsoids was published in 1881 by Heinrich Hertz (mathematician, 1857-1954). In his theory, Hertz stated that when two bodies met with point or line contact, the contact areas will result in distortion. Hertz developed formulas to calculate the contact stress in the contact area. Contact stress is influenced by normal force, Poisson ratio, diameters of both objects and the Young’s modulus of both objects (Beitz and Küttner 1986). The formulas of Hertz have also been applied to human bodies. In line with Hertz, it was found that sitting on a soft foam surface resulted in lower contact pressures than sitting on a stiffer foam surface (Sprigle et al. 1990a). Also Kosiak et al. (1958) showed a distinct drop in contact pressure under the ischial tuberosities when foam rubber was applied. The effectiveness of custom contoured foam seat cushions versus flat foam cushions on the contact pressure was investigated. The pressure distribution on contoured cushions showed significantly lower values than distributions on flat cushions (Brienza and Karg 1998, Kosiak et al. 1958, Sprigle et al. 1990a, 1990b). With this study, we want to get insight into the influence of a flat and a slightly curved hard seating surface on the contact pressure during sitting and on the subjectively experienced comfort. Moreover, the relation was studied between contact pressure and body build. The results will be expanded to find the best form of the excitator for laxity measurements of the SI-joint. Chapter 7 60 Material • Instrument The Force Sensing Array (FSA) technology (Vista Medical, Winnipeg, Manitoba, Canada) is used to measure the contact pressure between the subject and the seating surface. It is designed to provide information on local forces perpendicular to the interface. The applied FSA mat (15 by 23 cm) consists of a pressure-sensing array of 16 by 16 pressure sensors (each 6.4 by 7.9 mm), an interface module, connecting cable and computer software. The mat is comprised of thin, flexible fabric piezoresistive sensors, with a cover of Teflon. The mat was calibrated by the FSA Company to a maximum of 207 kPa. The interface module is the electronic communicator between the mat sensors and the computer. The software (version 3.1.39) allows accessing the information gathered by the sensors. For each recorded frame of pressures, the average and maximum pressure as well as a grid reference corresponding to the centre of pressure are calculated. • Participants The subject population for this study included 22 healthy volunteers (8 men, 14 women), recruited from the staff and students of the Erasmus MC. Subjects were excluded if they were not able to sit without support of back, arms and feet. Low back pain was also an exclusion criterion. Subjects, within a range of 20 to 35 years, were chosen to provide a combination of men and women with a reasonable range of weight and height. Their ages, hip width, waist width, weight and height were recorded and their body mass index (BMI) was determined. The statistics of this sample are given in Table 7.1. All participants gave written informed consent before taking part in the study. Mean SD Median Minimum Maximum Age (year) Height (m) Weight (kg) BMI (kg/m2) 26.3 3.6 26 21 32 1.75 0.10 1.73 1.60 1.95 69 12.3 68 49 97 22.5 2.9 21.6 19.1 29.4 Hip width (cm) 100.1 6.8 98 90 119 Waist width (cm) 81.0 11.0 79 65 110 Table 7.1 Characteristics of the study subjects (n=22), healthy individuals. • Seating surface Measurements were performed on two different hard seating surfaces, sufficiently thick to neglect deformability. One of the surfaces was flat and the other was cylindrically concave (Figure 7.1) with a radius of 2.6 m. The radius was arbitrary chosen, and is a bit smaller than the average Contact pressures for a flat and a concave surface 61 of several office seats. The surfaces were made of Necumer651, a polyurethane. Figure 7.1 Slightly concave seat. Methods All subjects wore theatre trousers with their own underclothes during testing to maintain a consistent medium at the buttocks-seat interface and to prevent effects from seams or pockets. Shoes were taken off to exclude the influence of the weight. The subject was seated in an upright position on seat one, without back- or armrest. The hips and knees were positioned to allow 90 degrees flexion, the legs were hanging down, and the feet did not contact the floor. When the subject had taken up the right position, three rods were positioned to touch the back of the subject. Two rods at the shoulder level and one at the sacral level (Figure 7.2). These rods served as marker of the right position and made sure the subject resumed the same position on the second seat. Rods for resuming posture Interface module FSA mat Flat seat Figure 7.2 Experimental set up. Chapter 7 62 After the measurement sessions, the subject was asked to fill in the Visual Analogue Scale (VAS) to the experienced comfort of the seating surface. The VAS ranged from ‘sitting very uncomfortable’ to ‘sitting very comfortable’. Contact pressure maps were recorded on the two seats; the order in which the seats were taken was alternating. For each seat, maps were recorded every 30 seconds during a 5-minute period, so each measurement session resulted in ten frames. From each frame the peak pressure (PP) was calculated as the average of the peak pressures of the left and right ischial tuberosities. Moreover, the average of mean peak pressure of the ten frames was calculated (MPP), which was further analysed with the statistical programmes SPSS and StatXact. Results The peak pressure values, as recorded by the FSA technology, showed significant differences between the two seats (Table 7.2). The results of the Wilcoxon Signed Rank Test on the mean peak pressures indicated that the slightly concave seat significantly reduced the contact pressure as compared to the flat seat (p=0.000). The Hodges-Lehman test showed that the median difference on the log scale is –0.1248, which implies a decrease of 11.7% with a 95% confidence interval of 7.7 to 16.8%. The VAS score, analysed with the Wilcoxon Signed Rank Test, also differed significantly between the flat and concave seat (p=0.004). Flat Concave Peak pressures (kPa) Mean (SD) Median (range) 119(56) 119(27-207) 90(51) 79(25-188) VAS Mean (SD) 6.0(1.4) 7.3(0.8) Median (range) 6.0(3.0-8.0) 7.0(5.0-8.0) Table 7.2 Contact pressure measurements with FSA (n = 22). There were wide variations of the contact pressure measurements among subjects. However, there was no significant correlation between the peak pressure and body build, except for the size and the peak pressure on the concave seat: higher peak pressures for larger subjects. The peak pressures of both seats were highly correlated (Spearman’s rho 0.961). No correlation was found for the subjective VAS score and the contact pressure measurements. Discussion The Wilcoxon Signed Rank Test was used to analyse the difference in contact pressure between the two seat shapes. First, the data was transformed to the log scale because the distribution is not normal but shifted to the right and the standard deviation is rather large with respect to the mean. This study shows a significant difference in contact Contact pressures for a flat and a concave surface 63 pressure between a flat and a slightly concave (r=2.6 m) seat. The contact pressure was decreased by a mean of 11.7% for the concave seat with respect to the flat seat. The FSA mat could only be calibrated up to 207 kPa, so this is the maximal measurable pressure. The inaccuracy as provided by the manufacturer can be up to 10%. For six subjects on the flat seat and for four subjects on the concave seat, one or more sensors over ten frames exceeded 207 kPa. These pressures were entered as 207 kPa in our calculations. As a result, the real difference in contact pressure between the flat and concave seat is likely to be higher than was calculated. For one subject, the mean contact pressure exceeded the measurement limit on both seats. Whenever the limit was exceeded, the influence of the seat shape on the maximum pressure could not be assessed. However, the number of sensors measuring 207 kPa showed a difference. For the flat seat, the total number of sensors over 10 frames measuring 207 kPa was 116 and for the concave seat the number was 79. So, by counting the number of full-scale sensors, we found a positive (i.e. reducing) effect in contact pressure for the concave seat. Besides a custom-contoured seat shape, also a slightly concave seat significantly decreases the peak pressure as compared with a flat seat. Unfortunately, no useful conclusions could be drawn about the average pressure because of the small size (15 by 23 cm) of the FSA mat. Larger mats do exists, but these could only be calibrated up to a maximum of 41 kPa. The concave seat was found to sit more comfortably, as the subjective VAS score was significantly higher than for the flat seat. The peak contact pressures we measured are much higher than those described in literature. Brienza and Karg (1998) found peak pressures on a flat seating surface for spinal cord injured people of 25.0 kPa and for elderly of 23.5 kPa. The mean maximal recorded pressure on a seat with an inclination angle of 6 degrees was 20 kPa (Kosiak 1976). However, these seats were covered with foam. We did not use any pressurerelieving layer between the hard seat and the buttocks, as a consequence getting higher values. We should use a hard surface for good transmission of vibrations in the measurements of the SI-joint, but hard seating surfaces without foam layer are also used in daily life. Owing to the high contact pressures, pressure sores are prone to develop in case of prolonged taking the same position. During the measurements, the subject sat without arm-, back- and foot support. This can be criticized as not being a normal sitting posture. The posture is chosen because of the simplicity. By supporting the back, arms and feet, an increased number of variables to be measured would have been introduced, e.g. height of the back support or of the feetand armrest. This makes it difficult to standardize for subjects of different sizes. As Hostens et al. (2001) describe, by supporting the feet, part of the weight borne by the thighs would have been shifted 64 Chapter 7 anteriorly to the feet and part would have been shifted posteriorly to the buttocks. Consequently, the peak pressure at the buttock would increase. For several subjects in our study, the posture with foot support resulted in more pressures above the maximal measurable pressure of 207 kPa. In literature it is described that a subject’s body mass index (BMI) appears to have a significant correlation with contact pressure for sitting on a flat surface, giving higher pressures for lower BMI values (Brienza and Karg 1998, Kernozak et al. 2002). Thin people (less than 90% of their ideal weight) had higher pressures over bony prominences and greater frequency of the maximum pressure occurring in a bony location than did average weight or obese (more than 110% of their ideal weight) subjects. With increasing body weight, the maximum pressure occurred more frequently in a soft tissue area (Garber and Krouskop 1982). These findings are consistent with the findings of Gyi and Porter (1999) that thinner subjects had higher pressures in the buttocks area and heavier subjects had higher pressures under the thighs. Stinson et al. (2003) did not show a significant correlation between contact pressure and height, weight and BMI. This is in line with our findings. We did not find a significant correlation between the peak pressure and body build, except for the size of the subject and the peak pressure on the concave seat. Conclusion Peak contact pressures on a hard seat are significantly reduced (11.7%) by even a slight concave curvature (r=2.6 m) as compared with a flat seat. The subjective VAS score was significantly higher for the concave seat than for the flat seat, indicating that the subjects experience more comfort on the concave seat. The findings of this study suggest that the support for the vibration transmission should be formed with a slightly complementary form to the body shape. There was no significant correlation between body build and peak pressure, except for the size of the subject and the contact pressure of the concave seat. Chapter 8 Objective measures for the Active Straight Leg Raising test (ASLR) for pregnant women Mirthe de Groot, Annelies L. Pool, Cornelis W. Spoor, Chris J. Snijders. Submitted to Manual Therapy 66 Chapter 8 Abstract Pregnancy related low back and pelvic pain (PLBP) is a frequent complication of pregnancy. Although pathological mechanisms underlying PLBP are obscure, dysfunction of the sacroiliac joints (SIjoints) seems to play an important role. The ASLR is a valid and reliable tool to measure the function of the SI-joints in PLBP during load transfer, but objective measurements are lacking. A cross-sectional study was performed on 24 pregnant women with and without PLBP. The objective was to reach for objective parameters by the assessment of the Active Straight Leg Raising test (ASLR). The following data was collected: a) the effort to raise the leg b) hip flexion force at 0 and 20 cm leg raise height c) muscle activity of the external oblique abdominal (EO), rectus femoris (RF), adductor longus (AL) and psoas major (PM) muscles during the ASLR and at 0 and 20 cm. The measurements resulted in several significant differences between the patients and healthy controls; among others a) patients scored subjectively more effort during the ASLR b) at both 0 and 20 cm leg raise height patients had less hip flexion force c) patients developed more muscle activity during the ASLR. Since pregnant women with PLBP developed a higher muscle activity during the ASLR with a significantly lower output at 0 and 20 cm than healthy pregnant women, we assume that the ASLR demonstrates a disturbed load transfer across the SI-joints in this population. Objective measures for the ASLR for pregnant women 67 Introduction Pain in the lumbar spine and pelvic region is a frequent complication of pregnancy and delivery. The prevalence of pregnancy related low back and pelvic pain (PLBP) varies widely from 14.2% to 56% (Albert et al. 2000, 2001, Berg et al. 1988, Björklund et al.1999, Fast et al. 1987, Heiberg-Endresen 1995, Larsen et al. 1999, Mantle et al. 1977, Orvieto et al. 1994, Östgaard et al. 1991, 1994, 1996, Wergeland and Strand 1998, Wu et al. 2004). The pain is mainly located in the sacral area and the area of the symphysis pubis with or without radiation to the groins, thighs, buttocks and coccygeus region (Fast et al. 1987, Kristiansson et al. 1996, Mens et al. 1996, Östgaard et al. 1996, Perkins et al. 1998, Röst et al. 2004). Several daily activities, like standing, sitting, forward bending, lifting, climbing stairs and walking, tend to increase the pain (Fast et al. 1987, Kristiansson et al. 1996, Mens et al. 1996, Rost et al. 2004). The pain is often quite mild but in 6 to 15% it is considered to be severe, interfering with daily life activities (Berg et al. 1988, Björklund et al. 1999, Heiberg-Endresen 1995, Mantle et al. 1977, Wu et al. 2004). Pathological mechanisms underlying PLBP are a matter of debate. According to several authors, dysfunction of the sacroiliac joints (SIjoints) plays an important role in PLBP (Berg et al. 1988, Sands 1958, Snijders et al. 1995b). The primary function of these joints is to transfer the loads from the upper part of the body to the legs and vice versa (Snijders et al. 1993a). SI-joint dysfunction is ascribed to instability, hyper- or hypolaxity, hyper- or hypomobility or altered stiffness of the joint (Bussey et al. 2004, Harrison et al. 1997, Hungerford et al. 2004, O’Sullivan et al. 2002, Walker 1992). Mechanical stability, the ability of a joint to bear loading without uncontrolled displacements (Pool-Goudzwaard et al. 2003), is very important in the functioning of the SI-joint. The mechanical stability of the SI-joints depends on specific anatomic features (form closure) (Vleeming et al. 1990a, 1990b) and on tension of ligaments and muscles crossing the pelvic joints (force closure) (Snijders et al. 1993a, 1993b). Muscles with a transverse orientation can produce forces that cross the SI-joints in the appropriate direction to produce force closure. These especially include the gluteus maximus, the internal oblique abdominal and the transverse abdominal muscles (Hungerford et al. 2003, Richardson et al. 2002, Snijders et al. 1995a). The role of propriocepsis and motor control in the stability of the lumbar spine and pelvic region has been recognised (Hides et al. 1996, Hodges and Richardson, 1996, Hungerford et al. 2003, O’Sullivan et al. 2002, Wu et al. 2002). Patients with SI-joint problems showed a delayed onset of EMG activity of the internal oblique abdominal, the multifidus and the gluteus maximus muscles during hip flexion in standing in comparison with healthy subjects (Hungerford et al. 2003). During walking the coordination 68 Chapter 8 between the pelvic and thoracic rotations in the transversal plane was affected in patients with PLBP as compared to healthy subjects (Wu et al. 2002). Subjects with SI-joint problems also showed alterations of respiration function as compared to healthy subjects (O’Sullivan et al. 2002). In patients with low back pain (LBP) multifidus muscle activity was inhibited after resolution of acute, first episode of LBP (Hides et al. 1996). Hodges and Richardson (1996) showed that for patients with LBP the onset of contraction of the transverse abdominal muscle during upper limb movements was significantly delayed as compared to healthy subjects. It is important to diagnose the SI-joint (dys)function properly in order to treat the problem in an appropriate way. Diagnosing SI-joint function is very difficult because the joint is complex, as it forms a functional unity with the symphysis pubis and the fifth lumbar vertebra. Traditionally, diagnosis of SI-joint function is based on a quality history and manual examination (Dreyfuss et al. 1994). Numerous mobility tests for the SIjoint are described, however, the value of these measurements is limited because their relation to clinical parameters is questionable or weak (Deyo et al. 1998, Laslett and Williams 1994, Michel et al. 1997, Strender et al. 1997, van Tulder et al. 1997, Wormslev et al. 1994). Pain provocation tests are more reliable than tests where the examiner has to palpate or evaluate topography or movements. However, these tests stress the structures in an attempt to reproduce the patient’s symptoms but do not give an objective indication of joint function (Albert et al. 2000, Kokmeyer et al. 2002, Laslett and Williams 1994). The Active Straight Leg Raising test (ASLR) is a test for the load transfer from legs to trunk and vice versa through the lumbopelvic region. The ASLR is a valid and reliable test to discriminate between patients with PLBP and healthy subjects and to test the severity of PLBP (Mens et al. 2001, 2002). However, objective measurements are lacking. In PLBP, a significant correlation was found between an impaired ASLR and radiographically measured laxity of the pelvic joints by means of the Chamberlain method. Laxity could be defined as the amount of motion that results from forces or moments, giving an indication of joint compression. During the ASLR as well as during the Chamberlain method, the iliac bone was rotated anteriorly about the horizontal axis near the SI-joint (Mens et al. 1999). This is in line with the finding of Hungerford et al. (2004) that during single leg loading, at the side of support, in subjects with SI-joint pain, the iliac bone rotated anteriorly in contrast to the posterior rotation in healthy control subjects (Hungerford et al. 2004). Anterior rotation of the iliac bone could be indicative of failure of the force closure mechanism and load transfer through the pelvis. The aim of the present study was to get objective parameters for the ASLR in pregnant women. It is hypothesised that, firstly, women with Objective measures for the ASLR for pregnant women 69 PLBP as compared to healthy subjects will need more muscle activity to raise the leg during the ASLR, expressed in a percentage of the maximal voluntary contraction. Secondly, women with PLBP can develop less maximal hip flexion force in the positions of 0 and 20 cm raising height as compared to healthy subjects. Material and Methods • Participants The study was performed on 24 pregnant women with an age between 20 and 40 years and a gestational age of 12 to 40 weeks. A classification was made in two groups: the first group comprised 11 patients with PLBP, the second group comprised 13 healthy controls without PLBP. The exclusion criteria for both groups were: a history of low back and pelvic pain before pregnancy; fracture, neoplasm or previous surgery of the lumbar spine, the pelvic girdle, the hip joint or the femur; or a systemic disease of the locomotor system. The Medical Ethical Committee of the Erasmus MC approved the protocol. All subjects gave written informed consent. • Procedure and instrumentation In this cross-sectional study, every woman performed the Active Straight Leg Raising test (ASLR) in supine position with straight legs and feet 20 cm apart. The instruction to the women was: “Try to raise your legs, one after the other, 20 cm above the couch without bending the knees” (Mens et al. 1999). The velocity of raising the leg was not prescribed. Questionnaires All women completed a questionnaire to assess several sociodemographic data and the Dutch version of the Quebec Back Pain Disability Scale (QBPDS) (Kopec et al. 1995, Schoppink et al. 1996). The QBPDS is a 20-item self-administered instrument designed to assess the functional disability. It asks the subject to rate her degree of difficulty in performing each activity from 0 (not difficult at all) to 5 (unable to do). Scores for the 20 items are summed; a higher rating indicates greater functional disability. Effort Effort during the ASLR was scored by all women on a six-point Likert scale: 0 = not difficult at all, 1 = minimally difficult, 2 = somewhat difficult, 3 = fairly difficult, 4 = very difficult, 5 = unable to perform. The scores of both legs were added, so that the summed score ranged from 0-10. External hip flexion force The maximal external force the woman can statically develop for hip flexion with a straight knee was measured just above the ankle joint with the leg still lying on the examination table (0 cm position) and at the end of the ASLR (20 cm position). For the recording of the maximal 70 Chapter 8 external force a digital force gauge was used (model 9200, Aikoh Engineering CO., LTD, Osaka, Japan), which was connected with a Porti data acquisition system (Twente Medical System International BV, The Netherlands). The read-out was done with LabView 7.1 (National Instruments, 2004). Muscle activity Disposable pre-gelled, self-adhesive surface EMG electrodes (Ag/AgCl discs) were placed, as advised by Delagi (1994), at the left and right sides of the body at the following positions: rectus femoris (RF): on the anterior aspect of the thigh, midway between the superior border of the patella and the anterior superior iliac spine; adductor longus (AL): 5 cm distal to the pubic bone; external oblique abdominal (EO): midway between the highest point in the iliac crest and the anterior superior iliac spine; psoas major (PM): 2 cm lateral to the femoral artery and 1 cm below the inguinal ligament. A reference electrode was placed over the right lateral malleolus of the fibula. All electrodes were placed with an interelectrode distance of 20 mm and aligned parallel to the underlying muscle fibres. EMG values at maximal voluntary contraction (MVC) were obtained with manually applied resistance (Kendall and Kendall Mc Creary 1986). EMG recordings were made during the ASLR as well as during the determination of the maximal external force at 0 and 20 cm raising height. The recordings were done with the Porti data acquisition system. All EMG signals were band-pass filtered at 10-500 Hz and sampled at 1000 Hz by using a 22 bit analogue-digital converter. The digitised signals were full wave rectified and low-pass filtered using a linear envelope filter. The data were stored on a computer for later analysis in LabView 7.1. Data analysis Statistical analyses were performed with the SPSS software package (SPSS Inc., 233 S. Wacker Drive, Chicago, Illinois 60606, Version 11.0). Within both groups, the paired-samples t-test was used to measure if there was any difference in results between the left and right sides for the control subjects or between the asymptomatic and symptomatic sides for the women with PLBP. To test differences between the groups, the independent sample t-test was used. For all tests, the alpha level was set at 0.05. Results The study concerned 24 pregnant women, comprising 11 women with PLBP and 13 women without. Sociodemographic data of both groups are given in Table 8.1, with no significant differences between the two groups. Objective measures for the ASLR for pregnant women 71 Women with PLBP scored significantly higher (mean=3.9, SD=2.0) at the subjective score than the healthy controls (mean=0.9, SD=1.1). Women with PLBP scored also significant higher at the QBPDS (mean=50.2, SD=17.7) than the healthy controls (mean=20.2, SD=14.3). Age (years) Length (m) Weight before pregnancy (kg) BMI before pregnancy (kg/m2) Weight at the moment (kg) BMI at the moment (kg/m2) Leg length (cm) Number of previous pregnancies Gestational age (weeks) Non-PLBP (n=13) Mean (SD) 31.7 (4.9) 1.70 (0.08) 70.1 (10.2) 24.4 (4.1) 79.2 (12.8) 27.5 (4.6) 88.8 (5.4) 2.1 (1.3) 26.8 (6.3) PLBP (n=11) Mean (SD) 30.0 (3.8) 1.68 (0.06) 68.1 (10.1) 23.8 (3.1) 72.4 (19.1) 27.2 (3.0) 88.9 (3.1) 1.9 (0.9) 26.6 (7.3) p-value 0.361 0.517 0.642 0.746 0.318 0.821 0.967 0.728 0.949 Table 8.1 Sociodemographic data of the subjects participating in the study. In both groups, no differences were found in muscle activity and hip flexion force between the left and right sides or between the asymptomatic and symptomatic sides, so the results were averaged. Healthy controls delivered significantly more hip flexion force at both 0 cm and 20 cm than the women with PLBP. Both groups delivered less hip flexion force at 20 cm than at 0 cm, however, the subjects with PLBP showed a significantly greater decrease in force than the healthy controls (Table 8.2). Quebec score Subjective score Hip flection force at 0 cm (N) Hip flexion force at 20 cm (N) Decrease in hip flexion force (%) Non-PLBP (n=13) Mean (SD) 20.0 (14.3) 0.9 (1.1) 129.0 (26.3) 84.7 (23.0) 34.7 (9.5) PLBP (n=11) Mean (SD) 50.2 (17.7) 3.9 (2.0) 83.5 (31.8) 42.4 (19.9) 50.6 (7.0) p-value 0.000* 0.000* 0.000* 0.000* 0.000* * Significant difference at α = 0.05. Table 8.2 Clinical findings. During the ASLR and the maximal external force measurements, the activity of the muscles was measured and normalised to the MVC. The muscles are devided in the homolateral and heterolateral side. Homolateral means at the side of the raised leg and heterolateral is at the opposite side. During the ASLR the women with PLBP used more muscle activity compared to the healthy controls. The differences of the homolateral RF (p=0.001), PM (p<0.001) and EO (p=0.023) muscles and Chapter 8 72 the heterolateral PM (p=0.029) and EO (p=0.005) muscles were significant (Figure 8.1A). At 0 cm hip flexion, the women with PLBP used significantly less muscle activity for the heterolateral RF (p=0.022) compared to the women without PLBP (Figure 8.1B). Women with PLBP, at 20 cm hip flexion, used significantly less muscle activity of the homolateral PM (p=0.039) than the healthy controls did (Figure 8.1C). ASLR 1,000 Fraction of MVC 0,900 0,800 0,700 0,600 PLBP (n=11) Non PLBP (n=13) 0,500 0,400 0,300 0,200 0,100 0,000 homolat homolat homolat homolat heterolat heterolat heterolat heterolat RF * AL PM * EO * RF AL PM * EO * Muscles *Significant difference at α = 0.05 Figure 8.1A EMG as a fraction of MVC during the ASLR. Leg raising height 0 cm 1,000 Fraction of MVC 0,900 0,800 0,700 0,600 PLBP (n=11) Non PLBP (n=13) 0,500 0,400 0,300 0,200 0,100 0,000 homolat homolat homolat homolat heterolat heterolat heterolat heterolat RF AL PM EO RF * AL PM EO Muscles *Significant difference at α = 0.05 Figure 8.1B EMG as a fraction of MVC during constrained hip flexion at 0 cm raising height. Discussion Mens et al. (2001) stated that the ASLR measures the function of the SIjoints to transfer loads between the lumbosacral spine and legs. A correlation was found between impairment of the ASLR and the laxity of the SI-joints in women with PLBP (Mens et al. 1999). Besides joint laxity Objective measures for the ASLR for pregnant women 73 it is suggested that problems in PLBP are caused by a disturbed proprioception and decreased function of muscles because of pain and fatigue (Mens et al. 2001). The reported anterior rotation of the iliac bone during the ASLR could be indicative for failure of the force closure mechanism. As a result, women with PLBP need more muscle action to stabilise the pelvis and will indicate more effort to raise the leg. No single significant difference in sociodemographic data between the two groups was found, indicating that the groups were completely comparable. Subjective functional disability was measured with the QBPDS. This scale was developed to measure the grade of disability in non-specific low back pain; however, the scale appeared also suitable in patients with PLBP (Mens et al. 2001). The QBPDS score in women with PLBP ranged from 18 to 78, the mean score was 50.2 (SD=17.7). For the healthy controls, the QBPDS score ranged from 0 to 46, with a mean score of 20.0 (SD=14.3). This is a significant difference between the groups (p<0.001), indicating that women with PLBP experienced more functional impairment than the women without PLBP. Leg raising height 20 cm 1,000 Fraction of MVC 0,900 0,800 0,700 0,600 PLBP (n=11) Non PLBP (n=13) 0,500 0,400 0,300 0,200 0,100 0,000 homolat RF homolat homolat homolat heterolat heterolat heterolat heterolat AL PM * OE RF AL PM OE Muscles *Significant difference at α = 0.05 Figure 8.1C EMG as a fraction of MVC during constrained hip flexion at 20 cm raising height. The women scored their impairment to raise a leg on a 6-point Likert scale. Mens et al. (2001) indicated a score of 1-10 as a positive score for the ASLR and a score zero as negative. In our study population, women without PLBP had a mean score of 0.9 (SD=1.1) compared to 3.9 (SD=2.0) for the women with PLBP. These results indicate that women with PLBP scored positive on the ASLR and experienced significantly more difficulty in raising their legs compared to the pregnant women without PLBP. During raising the leg, women with PLBP used significantly more muscle activity, as a percentage of MVC, than the healthy controls, with a 74 Chapter 8 significant difference for the homolateral RF, PM, EO and the heterolateral PM and EO muscles. The load of raising the leg was equal for both groups, because no differences were found in body weight, BMI and leg length. This could imply that in women with PLBP the load transfer is disturbed, resulting in more muscle action to stabilise the pelvis. Women with PLBP developed significantly less hip flexion force at both 0 cm and 20 cm raising height than the women without PLBP. A possible cause for the lower force could be the disturbed load transfer across the pelvis, but flexion force could also be impaired by pain and/or fear for pain. During delivering maximal external hip flexion force at 0 and 20 cm, women with and without PLBP used the same muscle activity, except for the heterolateral RF muscle at 0 cm and the homolateral PM muscle at 20 cm. So, women without PLBP delivered more hip flexion force with the same muscle activity than women with PLBP. A possible explanation could be that women without PLBP stabilise their spinal column and pelvic joints more effectively, whereas women with PLBP need more muscle force to reach the same goal. Pelvic floor dysfunction can also be a cause of PLBP. Subjects with SIjoint pain or PLBP displayed a decrease in diaphragmatic motion during the ASLR compared to control subjects, which represents a bracing or splinting action of the diaphragm in conjunction with increased production of intra-abdominal pressure (IAP) (O’Sullivan et al. 2002, Pool-Goudzwaard et al. 2005). Subjects with SI-joint pain demonstrated during the ASLR also a significant drop of the pelvic floor as compared with little movement in the control group (O’Sullivan et al. 2002). The drop of the pelvic floor indicates a decrease in tension in the pelvic floor muscles leading to a decrease of SI-joint stiffness (Pool-Goudzwaard et al. 2004). A pelvic belt reduced the impairment of ASLR (Mens et al. 1999), which is in line with the finding that manual pelvic compression through the iliac bones during ASLR resulted in normal diaphragmatic motion and pelvic floor descent (O’Sullivan et al. 2002). Pelvic compression could increase stiffness in the pelvic joints, which unloads sensitized ligamentous structures, allowing normalized motor responses during ASLR. These findings agree with the theoretical model of force closure of the SI-joints (Snijders et al. 1993a). So, propriocepsis and motor control of the entire lumbopelvic region is involved in PLBP. We stated that a disturbed load transfer across the SIjoints is present in PLBP. Further research is necessary to unravel this. Moreover, more research is needed to confirm the observation that women with PLBP have a pelvic shift at the side of the raised leg during the ASLR. Chapter 9 Support contact pressure of the pelvis during the Active Straight Leg Raising test (ASLR) Mirthe de Groot, Annelies L. Pool, Cornelis W. Spoor, Ed Heule, Chris J. Snijders. Submitted to Physical Therapy 76 Chapter 9 Abstract Pregnancy related low back and pelvic pain (PLBP) is a frequent complication of pregnancy. The Active Straight Leg Raising test (ASLR) is a valid and reliable tool to discriminate between patients with PLBP and healthy subjects. A clinical observation during the ASLR is a shift of the pelvis towards the homolateral side of the lifted leg. The aim of this study was to measure this pelvic shift during the ASLR as a possible indication of PLBP. Ten pregnant women with PLBP, 13 pregnant women without PLBP, and 14 healthy non-pregnant women participated in this study. During the ASLR, the contact pressure distribution between the table on which the subject was lying and the subject’s pelvis was measured. At rest, the contact force was equally distributed over the left and right sides of the pelvis. During the ASLR, 63% of the contact force was at the side of the raised leg; no differences between the groups were found. All groups showed the same total displacement of the center of pressure. With this test procedure, a laterocranial shift of the pelvis to the side of the raised leg during ASLR cannot be seen as a pathological finding in diagnosing PLBP. Support contact pressure of the pelvis during the ASLR 77 Introduction Pain in the lumbar spine and pelvic region is a frequent complication during pregnancy and delivery. The prevalence of pregnancy related low back and pelvic pain (PLBP) varies widely from 14.2% to 56% (Albert et al. 2000, 2001, Berg et al. 1988, Björklund et al. 1999, Fast et al. 1987, Heiberg-Endresen 1995, Larsen et al. 1999, Mantle et al. 1977, Orvieto et al. 1994, Östgaard et al. 1991, 1994, 1996, Wergeland and Strand 1998). The pain is often reported in the sacral area and the region of the symphysis pubis with or without radiation to the groins, thighs, buttocks and coccygeus region (Fast et al. 1987, Kristiansson et al. 1996, Mens et al. 1996, Östgaard et al. 1996, Perkins et al. 1998, Röst et al. 2004). Several daily activities, like standing, sitting, forward bending, lifting, climbing stairs and walking, tend to increase the pain (Fast et al. 1987, Kristiansson et al. 1996, Mens et al. 1996). The pain is often quite mild but in 6 to 15% it is considered to be severe, interfering with daily life activities (Berg et al. 1988, Björklund et al. 1999, Heiberg-Endresen 1995, Mantle et al. 1977). Pathological mechanisms underlying PLBP are a matter of debate. According to several authors, the sacroiliac joints (SI-joints) play an important role in PLBP (Berg et al. 1988, Sands 1958, Snijders et al. 1995b). A primary function of the SI-joints is to transfer the loads from the upper part of the body to the legs and vice versa (Snijders et al. 1993). Diagnosis of SI-joint dysfunction is traditionally based on a case history and manual examination (Dreyfuss et al. 1994). The value of radiography and mobility measurements is limited because their relation to clinical parameters is questionable or weak (Deyo et al. 1998, Laslett and Williams 1994, Michel et al. 1997, Strender et al. 1997, van Tulder et al. 1997, Wormslev et al. 1994). Pain provocation tests are more reliable than palpation or evaluation of topography or movements (Albert et al. 2000, Kokmeyer et al. 2002). However, pain provocation tests stress the structures but do not give an objective indication of joint function. The Active Straight Leg Raising test (ASLR) measures the function of the SI-joint to transfer loads from legs to trunk and vice versa. The ASLR is a valid and reliable test to discriminate between patients with PLBP and healthy subjects and to test the severity of PLBP (Mens et al. 2001, 2002). A clinical finding is that during the ASLR subjects with PLBP have a laterocranial shift of the pelvis at the side of the raised leg. The aim of this study was to confirm this clinical observation and to investigate if the pelvic shift differs in pregnant women with PLBP, in pregnant women without PLBP and in healthy non-pregnant controls during the ASLR. 78 Chapter 9 Material and Methods • Participants The study was performed on women aged between 20 and 40 years. A classification was made in three groups. The first group comprised 10 pregnant women with PLBP, the second group 13 healthy pregnant women without PLBP and the third group comprised 14 healthy nonpregnant women. The women were selected at an obstetric and a physiotherapeutic center. The exclusion criteria for all groups were: a history of serious low back and pelvic pain; fracture, neoplasm or previous surgery of the lumbar spine, the pelvic girdle, the hip joint or the femur; or a systemic (inflammatory) disease of the locomotor system. The Medical Ethical Committee of the Erasmus MC approved the protocol. All subjects gave written informed consent. • Procedure and instrumentation In this cross-sectional study, every subject performed the Active Straight Leg Raising test (ASLR) in supine position with straight legs and feet 20 cm apart. The instruction to the subjects was: “Try to raise your legs, one after the other, 20 cm above the couch without bending the knees” (Mens et al. 1999). The velocity of raising the leg was not prescribed. Questionnaires All subjects completed a questionnaire to assess several sociodemographic data and the Dutch version of the Quebec Back Pain Disability Scale (QBPDS) (Kopec et al. 1995, Schoppink et al. 1996). The QBPDS is a 20-item self-administered instrument designed to assess the functional disability by asking the subject to rate the degree of difficulty in performing each activity from 0 (not difficult at all) to 5 (unable to do). Scores for the 20 items are summed; a higher rating indicates greater functional disability. Effort Effort during the ASLR was scored by the subject on a six-point scale: 0 = not difficult at all, 1 = minimally difficult, 2 = somewhat difficult, 3 = fairly difficult, 4 = very difficult, 5 = unable to perform (Mens et al. 2001). Contact pressure The contact pressure between the pelvis of the subject and a standard physiotherapy table she was lying on was measured with FSA technology (Vista Medical, Winnipeg, Monitoba, Canada, R3Y 1G4). The FSA mat consists of a pressure-sensing square of 43*43 cm (16 by 16 pressure sensors, each 2.5 by 2.5 cm). The FSA mat, containing thin, flexible fabric piezoresistive sensors, was calibrated according to the manufacturer’s guidelines to a maximum of 40 kPa (300 mmHg ). At two moments, a measurement frame was made: one frame when the subject was lying supine in rest and one frame when each leg was lifted Support contact pressure of the pelvis during the ASLR 79 to 20 cm. From those frames, the contact force was calculated for the left and right side of the pelvis, whereas, the contact force is the sum of the contact pressures multiplied with the surface area of one sensor. Center of pressure (COP) The COP is the center of the forces on the mat or, more precisely, the mean of the pressure-weighted sensor positions. With the FSA equipment, the COP was determined simultaneously with the contact pressure. The displacement of the COP during the ASLR compared to the rest value was expressed in a cranial and a lateral component. Moreover, the total displacement in craniolateral direction was calculated from those components. Data analysis Statistical analyses were performed with the SPSS software package (SPSS Inc., 233 S. Wacker Drive, Chicago, Illinois 60606, Version 11.0). Within the groups, the paired-samples t-test was used to measure if there was any difference in results between the left and right or between the asymptomatic and symptomatic sides. To test differences between the groups, one-way anova was used. Once it was determined that differences exist among the means, the Bonferroni post hoc pairwise multiple comparisons were used to determine which means differed. For all tests, the alpha level was set at 0.05. Results The study concerned 23 pregnant women, comprising 10 women with PLBP and 13 women without PLBP, and 14 non-pregnant healthy controls. Sociodemographic data of the groups are given in Table 9.1. No significant differences in sociodemographic data were measured between the two groups of pregnant women. The non-pregnant women were significantly younger (p=0.002), lighter (p=0.021) and had less BMI (p=0.021) than the pregnant women without PLBP and were significantly younger (p=0.030) than the pregnant women with PLBP. Subjective functional disability, measured with the Quebec Back Pain Disability Scale (QBPDS) is displayed in Table 9.2 for each group. All groups differed significantly (p<0.001) compared to each other on the QBPDS, with the highest score for the pregnant women with PLBP (mean=47.4, SD=1.9) and the lowest for the non-pregnant women (mean=1.0, SD=2.0). The pregnant women without PLBP had a mean score of 20.0 (SD=14.3). The effort to raise the leg scored 0.5 (SD=0.9) for the non-pregnant women compared to 0.9 (SD=1.1) for the pregnant women without PLBP; the difference is non-significant. The score for women with PLBP was 3.7 (SD=1.9), with a score 1.5 (SD=1.1) for the asymptomatic side and 2.2 (SD=1.1) for the symptomatic side. The differences between the Chapter 9 80 symptomatic and asymptomatic side in women with PLBP were not statistically significant. Both scores differed significantly (p<0.001) from the results of the pregnant women without PLBP and the non-pregnant women (Table 9.2). Pregnant Non-pregnant women (n=14) women without PLBP (n=13) Mean (SD) Mean (SD) Age (years) 25.9 (3.0) 31.7 (4.9) Length (m) 1.70 (0.06) 1.70 (0.08) Weight before pregnancy (kg) 70.1 (10.2) 60.1 (6.2) Weight at the moment (kg) 79.2 (12.8) 2 BMI before pregnancy (kg/m ) 24.4 (4.1) 20.8 (2.2) BMI at the moment (kg/m2) 27.5 (4.6) Leg length (cm) 90.3 (4.4) 88.8 (5.4) Number of pregnancies 2.1 (1.3) Gestational age (weeks) 26.8 (6.3) Pregnant women with PLBP (n=10) Mean (SD) 30.4 (3.7) 1.68 (0.06) 68.2 (10.7) 71.5 (20.0) 24.0 (3.3) 27.1 (3.2) 89.1 (3.2) 2.0 (0.9) 25.4 (6.5) Table 9.1 Sociodemographic data of the subjects participating in the study. Non-pregnant (n=14) Non-PLPB (n=13) PLBP (n=10) Asympt side Sympt. side Subjective score ASLR Mean (SD) 0.5 (0.9) 0.9 (1.1) 1.5 (1.1) 2.2 (1.1) Quebec score Mean (SD) 1.0 (2.0) 20.0 (14.3) 47.4 (1.9) Table 9.2 Subjective findings. For the pregnant women without PLBP and the non-pregnant women, no statistical differences were found between the left and right sides, so the results were averaged. In pregnant women with PLBP there were some pressure differences between the legs, so their results were subdivided into the symptomatic and asymptomatic sides. The nonpregnant women showed significantly lower absolute contact force values than the other two groups. At rest, for all groups, the contact forces were equal for the left and right sides, or symptomatic and asymptomatic sides. During the ASLR, about 63% of the contact force was exerted on the side of the raised leg and 37% on the heterolateral side. No statistically significant differences between the groups were measured (Table 9.3). For all groups, the contact force increased at the side of the raised leg and decreased at the opposite side compared to the rest value (Table 9.4). Also the total contact force increased during the ASLR compared to the rest value; this increase was significantly higher (p=0.034) for the Support contact pressure of the pelvis during the ASLR 81 pregnant women without PLBP compared to the non-pregnant women. The women with PLBP showed a significantly higher increase (p=0.011) of force during ASLR of the symptomatic leg compared to ASLR of the asymptomatic leg. Non-pregnant (n=14) Non-PLPB (n=13) PLBP (n=10) Asympt side Sympt. side Side of raised leg Mean (SD) 64.2 (4.7) 62.2 (9.4) 62.7 (8.6) 62.3 (4.9) Heterolateral side Mean (SD) 35.8 (4.7) 37.8 (9.4) 37.3 (8.6) 37.7 (4.9) Table 9.3 Distribution of contact pressure during ASLR across both sides of the pelvis (in %). Non-pregnant (n=14) Non-PLPB (n=13) PLBP (n=10) Asympt side Sympt. side Side of raised leg Mean (SD) 148.0 (12.7) 153.0 (26.7) 146.5 (12.8) 149.5 (14.5) Heterolateral side Mean (SD) 82.6 (11.4) 93.1 (24.4) 84.3 (13.5) 92.1 (9.4) Total Mean (SD) 115.3 (5.2) 123.1 (11.0) 115.5 (3.4) 120.8 (4.6) Table 9.4 Increase of contact pressure during the ASLR as a percentage of contact pressure at rest. Non-pregnant women had a significantly (p=0.010) greater cranial displacement of their COP compared to the pregnant women with PLBP, both for ASLR with the asymptomatic leg and with the symptomatic leg. There was also a distinct difference in cranial displacement between the non-pregnant women and the pregnant women without PLBP and between the pregnant women without PLBP and the pregnant women with PLBP; however, these differences were not significant (p=0.175) (Table 9.5). The lateral displacement during ASLR was around 18 mm to the side of the raised leg and the total displacement was about 25 mm to laterocranial. No statistical differences between the groups were found. Non-pregnant (n=14) Non-PLBP (n=13) PLBP (n=10) Asympt side Sympt. side Lateral Mean (SD) 17.2 (6.4) 18.3 (4.8) 19.4 (6.8) 16.6 (7.1) Cranial Mean (SD) 20.6 (5.7) 12.8 (9.1) 7.0 (15.9) 7.4 (18.2) Total Mean (SD) 27.4 (7.3) 23.9 (6.1) 25.9 (5.5) 23.9 (10.6) Table 9.5 Displacement of Center of Pressure (in mm) during the ASLR compared to the rest value. 82 Chapter 9 Discussion In practise the ASLR needs more objective substantiation; that is why we started further analysis. The aim of this study was to measure if a pelvic shift during the ASLR is a possible indication of PLBP. The results of this study did not confirm the hypothesis. Questionnaires were used to get an indication of the complaints. The subjective functional disability was measured with the QBPDS. This scale was developed to measure the grade of disability in non-specific low back pain; however, the scale appeared also suitable for patients with PLBP (Mens et al. 2001). The mean QBPDS score for women with PLBP was 47.4 (SD=15.0), for the pregnant women without PLBP 20.0 (SD=14.3) and for the non-pregnant women the mean score was 1.0 (SD=2.0) The differences between the groups are significant (p<0.001), indicating that pregnant women with PLBP experienced the most functional impairment and the non-pregnant women the least. The women scored the effort to raise their legs on a 6-point scale. Mens et al. (2001) indicate a score of 1-10 as a positive score for the ASLR and a score zero as negative. In our study population, women with PLBP had a mean score of 3.7 (SD=1.9) compared to 0.9 (SD=1.1) for the women without PLBP and 0.3 (SD=0.4) for the non-pregnant women. These results indicate that women with PLBP scored positive on the ASLR and experienced significantly more difficulty in raising their legs compared to the pregnant women without PLBP and the non-pregnant women. The non-pregnant women showed significantly lower contact force values than both groups of pregnant women. This finding is inherent to the lower body weight of this group. Further analysis is not based on these absolute values, but on relative values of force expressed as a percentage compared to the rest value. During the ASLR, all groups showed a cranial displacement of the COP, this could be the result of a posterior rotation of the ilium about the mediolateral axis. The cranial displacement of the COP for non-pregnant women (mean=20.6 mm, SD=5.7) was significantly larger than the cranial displacement for the women with PLBP, respectively 7.0 mm (SD=15.9) and 7.4 mm (SD=18.2) for the ASLR with the asymptomatic and symptomatic leg. Women without PLBP had also a smaller cranial displacement (mean=12.8 mm, SD=9.1) than non-pregnant women, but this difference was not significant. In women with PLBP, the cranial displacement of the COP is significantly smaller than in non-pregnant women. A few women showed even a displacement to caudal, which explains the large standard deviation in the craniocaudal displacement of the COP in this group. A caudal displacement could possibly be ascribed to the anterior rotation of the ilium about the mediolateral axis near the SI-joint, as Mens et al. (1999) found in women with PLBP during the ASLR. Future scientific research is needed to investigate the relation Support contact pressure of the pelvis during the ASLR 83 between the displacement of the COP and the rotation of the ilium. The lateral displacement and the total displacement of the COP did not differ between the groups. At rest, the contact force is equally (50%-50%) distributed over both sides of the body. During the ASLR, about 63% of the contact pressure is at the side of the raised leg. Combining this with the laterocranial displacement of the COP, all groups showed a laterocranial shift of the body to the side of the raised leg. At rest as well as during ASLR, no differences in left/right distribution of contact force were found between the groups. This is an important finding, because it implies that women with PLBP have no greater laterocranial shift of the pelvis to the side of the raised leg than the shift in healthy controls. So, the laterocranial shift is not a pathological indication of PLBP. Conclusion Pregnant women with and without PLBP as well as non-pregnant women showed the same laterocranial shift of the pelvis during ASLR. So, this is not a pathological finding in diagnosing PLBP. Chapter 10 General discussion 86 Chapter 10 Pregnancy related low back and pelvic pain (PLBP) is a frequent complication of pregnancy and delivery. Pathological mechanisms underlying PLBP are a matter of debate. In recent literature, dysfunction of the sacroiliac joint (SI-joint) is seen as one possible cause. Traditionally, diagnosis of PLBP is based on the patients’ anamnesis and manual examination. The value of a lot of these tests is limited because their relation to clinical parameters is questionable or weak. The aim of the work described in this thesis was to objectify symptoms in PLBP. In describing joint function, definitions of the measured parameter are not always used unambiguously, often because of a lack of standardisation. As a result it is difficult to communicate and to compare measurements. A debate about the definitions of range of motion (ROM), laxity, stiffness and stability used in the analysis of joint function was held. The ROM is the range of rotation or translation through which a joint can be actively or passively moved between two extreme positions in a certain direction. Hypermobility is an increase in the ROM beyond the normal limits. Laxity is the normal amount of motion that results from the passive application of forces. Laxity can only be determined for movements that cannot be actively controlled. In the same way as hypermobility, hyperlaxity is a wider than normal amount of laxity. Stiffness is a measure of resistance presented by the joint to imposed relative movement between two joint surfaces in any one particular direction. Finally, stability describes the mechanical control of a joint, including muscles, limiting or controlling unwanted movement, and preventing injuries of ligaments and capsules. Instability refers to an abnormal insufficient mechanical controllability, resulting in uncontrolled patterns of displacement. Diagnosing SI-joint (dys)function deals with several problems, one of them is the poor definition of parameters in describing SI-joint function. A literature review demonstrates that the definitions of the parameters are more or less the same as the definitions in describing general joint function. However, to determine properly the ROM or the stiffness of the SI-joint, one bone should be fixed carefully and the other can move freely as a result of forces or moments. Total fixation of the sacrum or ilium is possible in vitro studies or in studies with a physical model, however, in vivo it can’t be applied. Laxity is an indication of SI-joint compression, but does not describe the applied load or range of movement and is therefore a vague description. However, the term laxity can be used to give some qualitative indication of joint function. Stability defines the mechanical controllability of the SI-joint within a physiological range of loading. This is a descriptive parameter with a lack of standardisation. Therefore, it is impossible to measure the stability objectively in daily clinic or biomechanical research. General discussion 87 Unfortunately, the conclusion so far is, that it is not possible to measure these parameters objectively in the daily clinic. In 1995, the departments of Biomedical Physics and Technology and Rehabilitation Medicine of the Erasmus MC developed the technique of Doppler Imaging of Vibration (DIV), and supposed to measure SI-joint laxity objectively in a non-invasive manner. The technique of DIV applied sinusoidal excitations with a frequency of 200 Hz to the spina iliaca anterior superior. Across the ipsilateral SI-joint, the intensity of the vibrations was measured with a Colour Doppler Imaging apparatus (CDI). The laxity of the SI-joint was quantified by the ratio of vibration intensities of the ilium and sacrum, and expressed in threshold units. The technique functioned like a black box. The applicability of DIV on the knee joint was investigated. The choice to start with this joint was based on the consideration that the knee is easily accessible and the articular surfaces are far from congruent, so small translations in the joint are possible. The objective was testing the technique rather than finding clinically relevant results for the knee joint. The measurements were performed at the knee joint of healthy subjects. The measurements were, like the measurements of the SIjoint, performed in an unloaded position: the legs hanging down freely while the subject was seated. Vibrations were applied at the lateral femoral condyle of the subject. At the medial side of the knee joint, the transducer of the Colour Doppler Imaging (CDI) picked up the signals. Measurements were performed with the same CDI as used for the SI-joint measurements (Quantum CDI) and with a newer one (Toshiba CDI). For both CDIs, the results of these measurements were inexplicable when we assume that the velocity of vibrating bone was measured. For the Quantum CDI it was not possible to measure both sides of the joint simultaneously, moreover, it was very difficult to determine the threshold level at which the coloured pixels disappeared. Additionally, the soft tissue around the bone was vibrating as well, also causing coloured pixels. For the Toshiba CDI, it was possible to set the detectable velocity range; this range determines what velocities can be detected and presented as coloured pixels on screen. Repeated measurements with various detectable velocity ranges led to inexplicable results and again it was hard to determine the threshold level at which the pixels disappeared. These factors, for both CDIs, could partly explain the inconsistent results. However, the principle of DIV is measuring the velocity of a vibrating bone with a frequency of 200 Hz and an amplitude of several µm with CDI. This is definitely another application than CDI is originally designed for and this can also be part of the problem. After an extensive review of the technique of DIV, the conclusion was drawn that diagnosis based on measurements with DIV should be made 88 Chapter 10 with great care. Although the technique had proven its clinical relevance and the reliability seemed to be good, there was a lack of validation. It had been assumed that the energy loss in propagation ensures vibration intensity reduction across a joint; however, this was not proved. From results of measurements on a physical model of the pelvis, it had been concluded that the transmission of vibrations through the SI-joint was proportional to joint stiffness. In fact, such relationship cannot be true for large joint stiffness, because unlike the stiffness the transmission is limited to 100%. The assumption that changes in vibration intensity during one measurement session were negligible, was also doubtful, because in course of only seconds, changes in vibration propagation and therefore intensity could occur. While measuring in succession, the possible influence of phase differences across the joint had been ignored. This could result in much too large estimates of joint stiffness. Finally, the assumption that threshold units, the measurement unity, are a measure for the velocity of vibrating bone was not corroborated. DIV, being used as a black box, needed fundamental research, especially into the use of CDI for the pick-up of excitations. The main goal was to investigate the suitability of CDI to measure the velocity of a vibrating target. Measurements were performed on a physical model for three different tissues at several frequencies between 40 and 240 Hz. The velocity of the vibrating target was calculated from measurements by means of an accelerometer. With CDI, in the Colour Doppler mode as well as in the Doppler/M-mode, the velocity of the vibrating tip was measured. It turned out that CDI was not appropriate for quantitative detection of vibrations of solid objects with frequencies of 40 to 240 Hz. Again, the fact that CDI is used for another application than it is designed for, could have caused these results. This conclusion tackled a part of the technique of DIV and led to the necessity to develop a new technique for the pick-up of vibrations. This task is out of the scope of this thesis. Although the new technique for the pick-up is still being developed, we trust that it will be available in the near future and therefore we persist in utilising vibrations. The best form of the excitator in terms of comfort is investigated indirectly by studying the influence of the form of a seating surface. The choice to measure contact pressure during sitting was related to the fact that the exact site of excitation for the measurements on the SI-joint is not known yet. Comfort was defined objectively by the lowest contact pressure and subjectively by means of the Visual Analogue Scale (VAS). According to the formula of Hertz, the contact force, the form and the material of the surfaces determine the contact pressure. First, the aim was to calculate the contact pressure by the formula of Hertz and to compare this with the measured contact pressure for sitting on a hard flat and a hard concave (r = 2.6 m) seating General discussion 89 surface. In the calculations, the soft tissue between bone and seat was ignored. Unfortunately, it was not possible to measure the contact pressure precisely enough because of the relatively large sensor size (6.4 by 7.9 mm). Moreover, for six subjects on the flat seat and for four subjects on the concave seat, one or more sensors reached the maximal measurable pressure of 207 kPa over ten frames. The value of 207 kPa was used for the analysis, for lack of the correct pressure. In accordance with Hertz, the contact pressure proved to be significantly lower for the slightly concave seat compared with the flat seat. The subjective VAS score was significantly higher for the concave seat, indicating that subjects found this seat more comfortable. These findings imply that the support for vibration transmission should be shaped with a slightly complementary form to the body shape. The peak pressures we measured were much higher than the ones described in literature. However, contrary to other studies, we didn’t use any pressure-relieving layer between the hard seat and the buttocks. Probably, for the transmission of vibrations to bone in the SI-joint measurement, also a hard surface has to be used. From this study we concluded that for a hard surface, very high pressures could occur. There is still no test to measure the function of the SI-joints objectively and non-invasively. However, the Active Straight Leg Raising test (ASLR) is used to assess PLBP. The ASLR is supposed to depend on the function of the SI-joint to transfer loads from legs to trunk and vice versa. The ASLR is a valid and reliable test to discriminate between patients with PLBP and healthy subjects and to test the severity of PLBP but objective measurements are lacking. A cross-sectional study was performed on 24 pregnant women 11 with and 13 without PLBP. Women with PLBP developed a higher muscle activity during the ASLR with a significant lower hip flexion force at 0 and 20 cm raising height compared to healthy pregnant women. This could be attributed to a disturbed load transfer across the SI-joints in pregnant women with PLBP. A clinical finding is that during the ASLR, subjects with PLBP have a laterocranial shift of the pelvis at the side of the raised leg. In a clinical study, the contact pressure was measured in rest as well during the ASLR in pregnant women with and without PLBP and in non-pregnant controls. At rest, the contact force was equally distributed across the left and right side of the pelvis, while during the ASLR, 63% of the contact force was at the side of the raised leg. No differences between the groups were found. So, a laterocranial shift of the pelvis to the side of the raised leg during ASLR is not a pathological finding in diagnosing PLBP. The aim of this thesis was to objectify symptoms in PLBP. Several issues about this subject were studied, which gave more insight into the phenomenon of PLBP. Still, there is no golden standard to assess PLBP. Summary 92 Pain in the lumbar spine and pelvic region is a frequent complication of pregnancy and delivery. The prevalence of pregnancy related low back and pelvic pain (PLBP) varies between 14.2 and 56%. In 6 to 15% the pain is so severe that it impedes daily life activities. The symptoms of PLBP vary widely among patients and time, but the pain is often reported in the sacral area and the region of the symphysis pubis. Sometimes the pain radiates to the groins, thighs, buttocks and coccygeal region. The aetiology of PLBP is still not fully understood, but it is suggested that the sacroiliac joints (SI-joints) play an important role. The diagnosis of PLBP is traditionally based on the patients’ anamnesis and manual examination. However, the value of a lot of these tests is limited because their relation to clinical parameters is questionable or weak. The aim of this thesis is to objectify symptoms in PLBP. Chapter 2 presents a literature survey of the terminology in describing joint function. Joint function is described by biomechanical parameters like range of motion (ROM), stiffness, laxity and stability. Clinicians and researchers do not always give a clear description of the joint function they measured or the description is not unambiguous. Due to the lack in standardisation, it is difficult to compare results of examinations. The goal of this chapter was to present clear terminology. It is concluded that ROM is the range of translation and rotation through which a joint may be actively or passively moved in a certain direction. Joint stiffness describes the resistance of the joint to imposed relative movement between two joint surfaces. Laxity is the normal amount of motion that results from passive forces or moments and stability is the ability to control positions or movements of joints. Chapter 3 describes a literature review especially into the terminology of describing SI-joint function. Diagnosing SI-joint function is very complicated. One of the problems concerns the poorly defined parameters used for describing SI-joint function; the same definitions are used for different SI-joint functions. This is worrying because therapies are based on conclusions of these studies in which the terms were not clearly described. The review demonstrates that the terminology in describing SI-joint function is almost the same as the general terminology. However, unfortunately, up to now it is not possible to measure these parameters objectively in the daily clinic. In biomechanical research, the stiffness and the ROM can be measured objectively. In Chapter 4 the applicability of Doppler Imaging of Vibrations (DIV) on the knee joint was investigated in healthy subjects. DIV is a technique, developed in 1995 by Buyruk et al., to measure objectively and noninvasively the laxity of the SI-joint. The principle of this technique was to apply vibrations with a frequency of 200 Hz at the spina iliaca anterior superior. At the posterior side, across the SI-joints, Colour Summary 93 Doppler Imaging (CDI) picked up the vibrations. The laxity of the SI-joint was quantified by the ratio of vibration intensities of the iliac bone and the sacrum, expressed in threshold units (power ratio in dB). The choice to start with the knee joint was based on the consideration that the joint is easily accessible and the articular surfaces are far from congruent, so small translations in the joint are very well possible. The objective was testing the technique rather than finding clinically relevant results for the knee joint. Two different CDIs were used. The results of both were inexplicable when we assume that the velocity of vibrating bone was measured. Although the technique of DIV seemed to be a good tool for quantifying the laxity of the SI-joint, it has never been validated thoroughly, and in practice it functions like a black box. Chapter 5 is a literature review of the technique of DIV. From this, it appeared that the technique had proven its clinical relevance and the reliability seemed to be good. However, there was a lack of validation. Such study is considered necessary because relevant assumptions in DIV appear generally not to be correct. So, conclusions based on measurements with DIV should be made with great care. Chapter 6 describes the research into the suitability of CDI to measure the maximal velocity of a vibrating target; this suitability is an assumption of DIV. Measurements were performed on a physical model in the Colour Doppler mode as well in the Doppler/M-mode at frequencies between 40 and 240 Hz. The measured velocity, in both modes, was a lot higher than the applied velocity. Moreover, the content and the thickness of the intermediate tissue influenced the measured velocity. So, from these measurements, it turned out that CDI was not appropriate for quantitative detection of vibrations of solid objects with frequencies of 40 to 240 Hz. This conclusion, combined with the results of the two previous chapters, led to the necessity to develop a new technique for the pick-up of vibrations. This fell out of the scope of this thesis. Although the new technique is still under development, it can be assumed that vibrations will still be utilised. In Chapter 7, the best form of the excitator was investigated indirectly by studying the influence of a hard flat and a hard slightly concave seating surface on comfort. Comfort was defined objectively by the lowest contact pressure and subjectively by means of the Visual Analogue Scale (VAS). The decision to measure contact pressure in sitting was related to the fact that the exact site of excitation was not known yet. It turned out that for a slightly concave seat (r = 2.6 m) the mean contact pressure of 90 kPa (SD=51kPa) was significantly lower compared to the mean contact pressure of 119 kPa (SD=56kPa) for the flat seating surface. Moreover, the mean VAS score was significantly higher for the concave seat (7.3, SD=0.8) than for the flat seat (6.0, SD=1.4), indicating that subjects 94 found the slightly concave seat more comfortable than the flat seat. Regarding vibration transmission for joint laxity measurements, these results suggest that the excitator tip should be shaped more or less complementary to the local body shape. The Active Straight Leg Raising test (ASLR) is supposed to depend on the function of the SI-joint to transfer loads from legs to trunk and vice versa. The ASLR is a valid and reliable test to discriminate between patients with PLBP and healthy subjects and to test the severity of PLBP, but objective measurements are lacking. In Chapter 8 a cross-sectional study was performed on 24 pregnant women with and without PLBP to get objective parameters by the assessment of the ASLR. The measurements resulted in several significant differences between the women with PLBP with respect to the healthy controls; among others a) women with PLBP scored subjectively more effort during the ASLR b) at both 0 and 20 cm women with PLBP had less hip flexion force c) women with PLBP developed more muscle activity during the ASLR. Since pregnant women with PLBP developed a higher muscle activity during the ASLR with a significantly lower output at 0 and 20 cm than healthy pregnant women, we assume that the ASLR demonstrates a disturbed load transfer across the SI-joints in this population. A clinical finding during the ASLR in subjects with PLBP is a laterocranial shift of the pelvis at the side of the raised leg. The aim of the study described in Chapter 9 was to measure this pelvic shift during the ASLR. The study was performed on 10 pregnant women with PLBP, 13 pregnant women without PLBP, and 14 healthy non-pregnant women. During the ASLR the contact pressure was measured between the table on which the subject was lying and the subject’s pelvis. For all groups, at rest, the contact force was equally distributed over the left and right sides of the pelvis. During the ASLR, 63% of the contact force was at the side of the raised leg, no differences between the groups were measured. So, from these results, a more pronounced laterocranial shift of the pelvis at the side of the raised leg during ASLR in PLBP cannot be confirmed. In Chapter 10 the main issues are brought together and the implications of this thesis are discussed. Samenvatting 96 Pijn in de lage rug en bekkenregio is een complicatie die vaak voorkomt tijdens de zwangerschap en bevalling. De prevalentie van zwangerschapsgerelateerde lage rug- en bekkenklachten (Pregnancy Related Low Back and Pelvic Pain, PLBP) varieert van 14,2 tot 56%. In 6 tot 15% is de pijn zo hevig dat die de vrouwen beperkt tijdens de activiteiten van het dagelijks leven. De symptomen van PLBP variëren over de tijd en van patiënt tot patiënt maar worden meestal aangegeven in de regio van onderrug en het schaambeen. Soms straalt de pijn uit naar de billen, liezen, dijen en het stuitje. Het ontstaansmechanisme van PLBP is nog niet volledig bekend, maar er wordt verondersteld dat de sacroiliacale gewrichten (SI-gewrichten) een belangrijke rol spelen. De diagnose van PLBP wordt gesteld aan de hand van de anamnese en lichamelijk onderzoek. De waarde van veel van deze testen is echter beperkt omdat de relatie met de klinische parameters zwak of onduidelijk is. Het doel van dit proefschrift is het objectiveren van de symptomen van PLBP. Hoofdstuk 2 beschrijft een literatuurstudie naar de terminologie die gebruikt wordt bij het beschrijven van gewrichtsfuncties. De functie van een gewricht wordt beschreven door biomechanische parameters zoals range of motion (ROM), stijfheid, laxiteit en stabiliteit. Artsen en onderzoekers geven niet altijd een duidelijke beschrijving van de gewrichtsfunctie. Als deze beschrijving wel gegeven wordt, is die niet altijd eenduidig. Door een slechte standaardisatie is het moeilijk om resultaten met elkaar te vergelijken. De conclusie van de literatuurstudie is dat ROM gezien kan worden als het bereik van translatie en rotatie waarover een gewricht actief of passief bewogen kan worden. Stijfheid wordt beschreven als de weerstand van een gewricht tegen een opgelegde beweging. De laxiteit is de normale beweging in een gewricht als gevolg van passieve krachten en stabiliteit is de mogelijkheid van het gewricht om posities of houdingen van het gewricht te handhaven. Hoofdstuk 3 bevat een literatuurbespreking over de terminologie voor het beschrijven van de functie van het SI-gewricht. Het meten van de functie van het SI-gewricht is erg gecompliceerd. Eén van de problemen betreft de slecht gedefinieerde parameters bij het beschrijven van deze functie: dezelfde definities worden gebruikt voor verschillende functies. Dit is verontrustend omdat therapieën gebaseerd worden op conclusies van onderzoeken waarin deze termen niet eenduidig beschreven zijn. Uit de literatuurbespreking blijkt dat de terminologie voor het beschrijven van de functie van het SI-gewricht niet veel afwijkt van de algemene terminologie. Helaas is het echter tot nu toe nog niet mogelijk om in de dagelijkse praktijk deze parameters objectief te meten. In Hoofdstuk 4 is onderzocht of Doppler Imaging of Vibrations (DIV) geschikt is voor het meten van de laxiteit van het kniegewricht. DIV is Samenvatting 97 een techniek, ontwikkeld in 1995 door Buyruk en anderen, om de laxiteit van het SI-gewricht objectief en niet-invasief te meten. Bij deze techniek worden trillingen met een frequentie van 200 Hz aangeboden aan de voorzijde van het ilium. Aan de achterzijde, worden aan de beide kanten van het SI-gewricht de trillingen gedetecteerd met Colour Doppler Imaging (CDI). De laxiteit van het SI-gewricht wordt gekwantificeerd door de verhouding van de trillingsintensiteiten van het ilium en het sacrum en uitgedrukt in dB. De keuze om te beginnen met metingen aan het kniegewricht was gebaseerd op het feit dat het gewricht eenvoudig toegankelijk is en dat de gewrichtsoppervlakken niet congruent zijn, waardoor kleine translaties in het gewricht mogelijk zijn. Het doel was het testen van de techniek en niet zozeer het vinden van klinisch relevante resultaten voor het kniegewricht. De metingen zijn uitgevoerd bij gezonde proefpersonen en er is gebruik gemaakt van twee verschillende CDIs. Als we aannemen dat de snelheid van het trillende bot werd gemeten, zijn de resultaten van beide apparaten onverklaarbaar. Hoewel DIV een geschikte methode lijkt om de laxiteit van het SI-gewricht te meten, is de validiteit nog niet grondig bekeken, de techniek functioneert dus als een ‘black box’. Hoofdstuk 5 beschrijft een literatuurbespreking over de techniek van DIV. Hieruit blijkt dat de techniek voor het SI-gewricht klinisch relevante resultaten heeft opgeleverd en de betrouwbaarheid redelijk is. De validiteit van de techniek is echter niet bekend. Een studie naar validiteit is van groot belang omdat relevante aannames die voor DIV gemaakt zijn niet correct blijken. Conclusies die zijn gebaseerd op de metingen met DIV moeten dus met grote zorgvuldigheid worden getrokken. Hoofdstuk 6 beschrijft het onderzoek naar de geschiktheid van CDI voor het meten van de snelheid van een trillend object, een geschiktheid die eerder aangenomen was bij het gebruik van DIV. De metingen werden uitgevoerd op een fysisch model in zowel de Colour Doppler mode als de Doppler/M-mode bij verschillende frequenties tussen de 40 en 240 Hz. De gemeten snelheid was in beide modes een stuk hoger dan de aangeboden snelheid. Bovendien werden de resultaten beïnvloed door de samenstelling en de dikte van het tussenliggende weefsel. Dit betekent dat CDI niet geschikt is voor kwantitatieve metingen van trillende voorwerpen met een frequentie van 40 tot 240 Hz. Deze conclusie, gecombineerd met de resultaten van de twee vorige hoofdstukken, geeft de noodzaak aan voor het ontwikkelen van een nieuwe techniek voor de detectie van trillingen. Dit ligt echter buiten de taakstelling van dit proefschrift. Hoewel de ontwikkeling van de nieuwe techniek nog niet voltooid is, mag toch al worden aangenomen dat er nog steeds gebruik gemaakt gaat 98 worden van trillingen. In Hoofdstuk 7 wordt de beste vorm van de excitator onderzocht door de invloed van een vlakke en een licht gekromde (r = 2,6 m) zitondersteuning op het comfort te beoordelen. Comfort is objectief gedefinieerd als de laagste contactdruk en subjectief door een hoge score op de visueel analoge schaal (Visual Analogue Scale, VAS). De keuze om aan het zitten te meten, hangt samen met het feit dat de exacte locatie van exciteren nog niet bekend is. Het blijkt dat, in overeenstemming met de formule van Herz, de gemiddelde contactdruk voor de gekromde ondersteuning significant lager is dan de gemiddelde contactdruk voor de vlakke ondersteuning. Bovendien is de gemiddelde VAS score significant hoger voor de gekromde ondersteuning dan voor de vlakke ondersteuning. Dit geeft aan dat de proefpersonen een lichte kromming comfortabeler vinden dan een vlakke ondersteuning. Deze bevinding suggereert dat de ondersteuning voor de toediening van trillingen voor laxiteitmetingen aan gewrichten licht gekromd moet zijn, met een vorm die tegengesteld is aan de plaatselijke vorm van het lichaam. De actieve beenheftest (Active Straight Leg Raising test, ASLR) beoordeelt de functie van het SI-gewricht om krachten van de benen naar de romp, en vice versa, door te leiden. De ASLR is een valide en betrouwbare test om een onderscheid te maken tussen mensen met PLBP en gezonde mensen en is geschikt om de ernst van PLBP te beoordelen. Echter, objectieve maten ontbreken bij deze test. Hoofdstuk 8 beschrijft een studie bij 24 zwangere vrouwen met en zonder PLBP. Het doel van deze studie was het verkrijgen van objectieve parameters bij het beoordelen van de ASLR. De metingen resulteerden in diverse significante verschillen tussen de vrouwen met PLBP vergeleken met de vrouwen zonder PLBP, onder andere: a) vrouwen met PLBP gaven aan meer inspanning te leveren tijdens de ASLR b) zowel op 0 als 20 cm hefhoogte konden de vrouwen met PLBP minder heupflexiekracht leveren c) vrouwen met PLBP leverden tijdens de ASLR meer spieractiviteit. Door de hogere spieractiviteit tijdens de ASLR en de lagere output bij 0 en 20 cm hefhoogte bij vrouwen met PLBP nemen we aan dat de ASRL een verstoorde overdracht van krachten over het bekken aantoont. Tijdens de ASLR wordt het wegdraaien van het bekken naar laterocraniaal aan de zijde van het geheven been gezien als een klinische bevinding van PLBP. Het doel van het onderzoek beschreven in Hoofdstuk 9 was deze bekkenverplaatsing te meten. Het onderzoek is uitgevoerd bij 10 zwangere vrouwen met PLBP, 13 zwangere vrouwen zonder PLBP en 14 niet-zwangere vrouwen. Tijdens de ASLR is de contactdruk gemeten tussen het bekken van de proefpersoon en de tafel waarop ze lag. Bij alle groepen was in rust de contactkracht gelijk verdeeld over de linker en rechter bekkenhelft. Tijdens de ASLR werd Samenvatting 99 63% van de contactkracht gemeten aan de zijde van het geheven been, ook hierbij zijn er geen verschillen tussen de groepen gemeten. Dit impliceert dat het wegdraaien van het bekken tijdens de ASLR geen pathologisch gegeven is. In Hoofdstuk 10 zijn de hoofdpunten van dit proefschrift samengevat en bediscussieerd. References 102 Acasuso Diaz M, Collantes Estevez E, Sanchez Guijo P. Joint hyperlaxity and musculoligamentous lesions: study of a population of homogeneous age, sex and physical exertion. Br J Rheumatol 1993; 32(2): 120-122. Adams JC, Hamble DL. Outline of orthopedics. Churchill Livingstone, Edinburgh, 1995. Albert H, Godskesen M, Westergaard JG, Chard T, Gunn L. Circulating levels of relaxin are normal in pregnant women with pelvic pain. Eur J Obstet Gynecol Reprod Biol 1997; 74(1): 19-22. Albert H, Godskesen M, Westergaard JG. Evaluation of clinical tests used in classification procedures in pregnancy-related pelvic joint pain. Eur Spine J 2000; 9(2): 161-166. Albert H, Godskesen M, Westergaard JG. Prognosis in four syndromes of pregnancy-related pelvic pain. Acta Obsted Gynecol Scand 2001; 80(6): 505-510. Barbenel JC. Pressure management. Prosthet Orthot Int 1991; 15(3): 225-231. Baumgart E. Stiffness - an unknown world of mechanical science?. Injury 2000; 31(Suppl 2): S-B14-23. Beitz W, Küttner KH. Taschenbuch für den Maschinenbau. SpringerVerlag, Berlin, 1986. Berg G, Hammar M, Möller-Nielsen J, Lindén U, Thorblad J. Low back pain during pregnancy. Obstet Gynecol 1988; 71(1): 71-75. Björklund K, Nordström ML, Bergström S. Sonographic assesment of symphyseal joint distention during pregnancy and post partum with special reference to pelvic pain. Acta Obstet Gynecol Scand 1999; 78(2): 125-130. Brienza DM, Inigo RM, Chung KC, Brubaker CE. Seat support surface optimization using force feedback. IEEE Trans Biomed Eng 1993; 40(1): 95-104. Brienza DM, Karg PE. Seat cushion optimization: a comparison of interface pressure and tissue stiffness characteristics for spinal cord injured and elderly patients. Arch Phys Med Rehabil 1998; 79(4): 388-394. Brolinson PG, Kozar AJ, Cibor G. Sacroiliac joint dysfunction in athletes. Curr Sports Med Rep 2003; 2(1): 47-56. Brunner C, Kissling R, Jacob HA. The effects of morphology and histopathologic findings on the mobility of the sacroiliac joint. Spine 1991; 16(9): 1111-1117. Bryant JT, Cooke TD. Standarized biomechanical measurement for varusvalgus stiffness and rotation in normal knees. J Orthop Res 1988; 6(6): 863-870. Bussey MD, Yanai T, Milburn P. A non-invasive technique for assessing innominate bone motion. Clin Biomech 2004; 19(1): 85-90. References 103 Buyruk HM, Snijders CJ, Vleeming A, Laméris JS, Holland WP, Stam HJ. The measurement of sacroiliac joint stiffness with colour Doppler imaging: a study on healthy subjects. Eur J Radiol 1995b; 21(2): 117112. Buyruk HM, Stam HJ, Snijders CJ, Laméris JS, Holland WP, Stijnen TH. Measurement of sacroiliac joint stiffness in peripartum pelvic pain patients with Doppler Imaging of Vibrations (DIV). Eur J Obstet Gynecol Reprod Biol 1999; 83(2): 159-163. Buyruk HM, Stam HJ, Snijders CJ, Vleeming A, Laméris JS, Holland WP. The use of color Doppler imaging for the assessment of sacroiliac joint stiffness: a study on embalmed human pelvises. Eur J Radiol 1995a: 21(2) 112-116. Buyruk HM. Colour Doppler imaging: new applications in musculoskeletal system pathology. Thesis, Erasmus University Rotterdam, The Netherlands, 1996. Council for Organizations of Medical Sciences, the Committee on the Spine. American Academy of Orthopaedic Surgeons. Chicago, Document Section 3, Biomechanics Terms, p 39. Dahlkvist NJ, Seedhom BB. Objective measurement of knee laxity and stiffness with reference to knee injury diagnosis. Part 1: Design considerations and apparatus. Proc Inst Mech Eng [H] 1990; 204(2): 75-82. Damen L, Buyruk HM, Guler-Uysal F, Lotgering FK, Snijders CJ. Pelvic pain during pregnancy is associated with asymmetric laxity of the sacroiliac joints. Acta Obstet Gynecol Scand 2001; 80(11): 10191024. Damen L, Buyruk HM, Guler-Uysal F, Lotgering FK, Snijders CJ, Stam HJ. The prognostic value of asymmetric laxity of the sacoiliac joints in pregnancy-related pelvic pain. Spine 2002a; 27(24): 2820-2824. Damen L, Spoor CW, Snijders CJ, Stam HJ. Does a pelvic belt influence sacroiliac joint laxity? Clin Biomech 2002b; 17(7): 495-498. Damen L, Stijnen T, Roebroeck ME, Snijders CJ, Stam HJ. Reliability of sacroiliac joint laxity measurement with Doppler Imaging of Vibrations. Ultrasound Med Biol 2002c; 28(4): 407-414. Damen L. Laxity measurement of sacroiliac joint in women with pregnancy-related pelvic pain. Thesis, Erasmus University Rotterdam, The Netherlands, 2002. Delagi EF, Iazzetti J, Perotto AO. Anatomical guide for the electromyographer – the limbs and trunk. Springfield: Charles Thomas, 1994 . Deyo R, Battie M, Beurskens AJ, Bombardier C, Croft P, Koes B, Malmivaara A, Roland M, von Korff M, Waddel G. Outcome measures for low back pain research: a proposal for standarized use. Spine 1998; 23(18): 2003-2013. 104 Dreyfuss P, Dreyer S, Griffin J, Hoffman J, Walsh N. Positive sacroiliac screening tests in asymptomatic adults. Spine 1994; 19(10): 11381143. Dumas GA, Reid JG, Wolfe LA, Griffin MP, McGrath MJ. Exercise, posture and back pain during pregnancy. Part 2: Exercise and pain. Clin Biomech 1995; 10(2): 104-109 Dye SF. The knee as a biologic transmission with an envelope of function: a theory. Clin Orthop 1996; 325: 10-18. Ebenbichler GR, Oddsson LI, Kollmitzer J, Erim Z. Sensory-motor control of the lower back: implications for rehabilitation. Med Sci Sports Exerc 2001; 33(11): 1889-1898. Egund N, Olsson TH, Schmid H, Selvik G. Movements in the sacroiliac joints demonstrated with Roentgen stereophotogrammetry. Acta Radiol Diagn 1978; 19(5): 833-846. Evans D, McDicken W, Skidmore R, Wooodcock J. Doppler Ultrasound: Physics, Instrumentation and Clinical Application. Chichester-New York: John Wiley & Sons, 1989. Faber FW, Kleinrensink GJ, Buyruk HM, Mulder PG, Stam HJ, Snijders CJ, Stoeckart R. Doppler imaging of vibrations as a tool for quantifying first tarsometatarsal joint stiffness. Clin Biomech 2000; 15(10): 761765. Faber FW, Zollinger PE, Kleinrensink GJ, Damen L, Mulder PG, Snijders CJ, Verhaar JA. Quantification of first tarsometatarsal joint stiffness in hallux valgus patients. Clin Biomech 2001; 16(8): 714-716. Farbrot E. The relationship of the effect and pain of pregnancy to the anatomy of the pelvis. J Am Med Assoc 1952; 38(5): 403-419. Fast A, Shapiro D, Ducommun EJ, Friedmann LW, Bouklas T, Flowman Y. Low-back pain in pregnancy. Spine 1987; 12(4): 368-371. Garber SL, Krouskop TA. Body build and its relationship to pressure distribution in the seated wheelchair patient. Arch Phys Med Rehabil 1982; 63(1): 17-20. Gerber C, Nyffeler RW. Classification of glenohumeral joint instability. Clin Orthop 2002; 400: 65-76. Grahame R. How often, when and how does joint hypermobility lead to osteoarthritis?. Br J Rheumatol 1989; 28(4): 320. Greene WB, Heckman JD. The clinical measurement of joint motion. American Academy of Orthopaedic Surgeons, Rosemont, 1994. Groot de M, Spoor CW, Snijders CJ. Critical notes on the technique of Doppler Imaging of Vibrations (DIV). Ultrasound Med Biol 2004; 30(3): 363-367. Gyi DE, Porter JM. Interface pressure and the prediction of car seat discomfort. Appl Ergon 1999; 30(2): 99-107. Hakim A, Grahame R. Joint hypermobility. Best Pract Res Clin Rheumatol 2003; 17(6): 989-1004. References 105 Haldeman, S. Spinal manipulative therapy. A status report. Clin Orthop 1983; 179: 62-70. Hansen A, Jensen DV, Larsen E, Wilken-Jensen C, Petersen LK. Relaxin is not related to symptom-giving pelvic girdle relaxation in pregnant women. Acta Obster Gynecol Scand 1996; 75: 245-249. Harrison DE, Harrison DD, Troyanovich SJ. The sacroiliac joint: a review of anatomy and biomechanics with clinical implications. J Manipulative Physiol Ther 1997; 20(9): 607-617. Harstall C. Interface pressure measurement systems for management of pressure sores. Alberta Heritage Foundation for Medical Research. Edmonton, 1996. Hayes KW, Petersen C, Falconer J. An examination of Cyriax’s passive motion tests with patients having osteoarthritis of the knee. Phys Ther 1994; 74(8): 697-707. Heiberg-Endresen E. Pelvic pain and low back pain in pregnant women – an epidemiological study. Scand J Rheumatol 1995; 24(3): 135-141. Hides JA, Richardson CA, Jull GA. Multifidus muscle recovery is not automatic after resolution of acute, first-episode low back pain. Spine 1996; 21(23): 2763-2769. Hodges PW, Richardson CA. Inefficient muscular stabilization of the lumbar spine associated with low back pain: a motor control evaluation of transversus abdominis. Spine 1996; 21(22): 2640-2650. Hoppenfeld S, Zeide M. Orthopedic dictionary, J.B. Lippincott Company, Philadelphia, 1994. Hostens I, Papajoannou G, Spaepen A, Ramon H. Buttock and back pressure distribution tests on seats of mobile agricultural machinery. Appl Ergon 2001; 32(4): 347-355. Hungerford B, Gilleard W, Hodges P. Evidence of altered lumbopelvic muscle recruitment in the presence of sacroiliac joint pain. Spine 2003;28(14):1593-1600. Hungerford B, Gilleard W, Lee D. Altered patterns of pelvic bone motion determined in subjects with posterior pelvic pain using skin markers. Clin Biomech 2004; 19(5): 456-464. Jacob HA, Kissling RO. The mobility of the sacroiliac joints in healthy volunteers between 20 and 50 years of age. Clin Biomech 1995; 10(7): 352-361. Johanson CE, Järvinen PA. Factors affecting relaxation of the pelvis during normal pregnancy, delivery and the puerperium. Acta Obstet Gynecol Scand 1957; 36(2): 179-193. Kendall FC, Kendall Mc Creary E. Spieren, tests en functies [Muscles, tests and functions]. Houten: Bohn Stafleu Van Loghum, 1986. Kernozek TH, Wilder PA, Amundson A, Hummer J. The effects of body mass index on peak seat-interface pressure of institutionalized elderly. Arch Phys Med Rehabil 2002; 83(6): 868-871. 106 Kissling RO, Jacob HA. The mobility of the sacroiliac joint in healthy subjects. Bull Hosp Jt Dis 1996; 54(3): 158-164. Kocher MS Foreman ES, Micheli LJ. Laxity and functional outcome after arthroscopic reduction and internal fixation of displaced tibial spine fractures in children. Arthroscopy 2003; 19(10): 1085-1090. Kokmeyer DJ, van der Wurff P, Aufdemkampe G, Fickenscher TC. The reliability of multitest regimens with sacroiliac pain provocation tests. J Manipulative Physiol Ther 2002; 25(1): 42-47. Kopec J, Esdaile JM, Abrahamowicz M, Abenhaim L, Wood-Dauphinee S, Lamping DL, Williams JI. The Quebec Back Pain Disability Scale. Measurement properties. Spine 1995; 20(3): 341-52. Kosiak M, Kubicek WG, Olson M, Danz JN, Kottke FJ. Evaluation of pressure as a factor in the production of ischial ulcers. Arch Phys Med Rehabil 1958; 39(10): 623-629. Kosiak M. A mechanical resting surface: its effect on pressure distribution. Arch Phys Med Rehabil 1976; 57(10): 481-484. Kremkau FW. Doppler color imaging. Principles and instrumentation. Clin Diagn Ultrasound 1992; 27: 7-60. Kristiansson P, Svärdsudd K, von Schoultz B. Back pain during pregnancy: a prospective study. Spine 1996; 21(6): 702-708. Lamoth CJ, Meijer OG, Wuisman PI, van Dieën JH, Levin MF, Beek PJ. Pelvis-thorax coordination in the transverse plane during walking in persons with nonspecific low back pain. Spine 2002; 27(4): E92-E99. Larsen EC, Wilken-Jensen C, Hansen A, Vendelbo Jensen D, Johansen S, Minck H, Wormslev M, Davidsen M, Mork Hansen T. Symptom-giving pelvic girdle relaxation in pregnancy. Acta Obstet Gynecol Scand 1999; 78(2): 105-110. Larsson LG, Baum J, Mudholkar GS, Kolia GD. Benefits and disadvantages of joint hypermobility among musicians. N Engl J Med 1993; 329(15): 1079-1082. Laslett M, Williams M. The reliability of selected pain provocation tests for sacroiliac joint pathology. Spine 1994; 19(11): 1243-1249. Lowe PJ, Saunders GA. Knee analyser: an objective method of evaluating mediolateral stability in the knee. Med Biol Eng Comput 1977; 15(5): 548-552. MacLennan AH, Nicolson R, Green RC, Bath M. Serum relaxin and pelvic pain of pregnancy. Lancet 1986; 2(2): 243-245. Maitland ME, Kawachuk GN. Towards the quantification of end-feel for the assessment of passive joint motion. Phys Ther Rev 1997; 2(4): 217-226. Mangaleshkar SR, Wildin C, Oni OO, Howard L. The effect of knee flexion angle on knee stiffness values obtained using the Leicester arthrometer. Injury 1998; 29(9): 685-687. References 107 Mantle MJ, Greenwood RM, Currey HL. Backache in pregnancy. Rheumatol Rehabil 1977; 16(2): 95-101. Markolf KL, Graff-Radford A, Amstutz HC. In vivo knee stability. A quantitative assessment using an instrumented clinical testing apparatus. J Bone Joint Surg Am 1978; 60(5): 664-674. Markolf KL, Kochan A, Amstutz HC. Measurement of knee stiffness and laxity in patients with documented absence of the anterior cruciate ligament. J Bone Joint Surg Am 1984; 66(2): 242-252. Marshall JL, Baugher WH. Stability examination of the knee: a simple anatomic approach, Clin Orthop 1980; 146: 78-83. Matsumoto H, Toyoda T, Kawakubo M, Otani T, Suda Y, Fujikawa K. Anterior cruciate ligament reconstruction and physiological joint laxity: earliest changes in joint stability and stiffness after reconstruction. J Orthop Sci 1999; 4(3): 191-196. McCormack M, Briggs J, Hakim A, Grahame R. Joint laxity and the benign joint hypermobility syndrome in student and professional ballet dancers. J Rheumatol 2004; 31(1): 173-178. McQuade KJ, Shelley I, Cvitkovic J. Patterns of stiffness during clinical examination of the glenohumeral joint. Clin Biomech 1999; 14(9): 620-627. McQuade KJ, Sidles JA, Larson RV. Reliability of the Genucom Knee Analysis System. A pilot study. Clin Orthop 1989; 245: 216-219. Mens JM, Vleeming A, Snijders CJ, Koes BW, Stam HJ. Reliability and validity of the Active Straight Leg Raise test in Posterior Pelvic Pain since Pregnancy. Spine 2001; 26(10): 1167-1171. Mens JM, Vleeming A, Snijders CJ, Koes BW, Stam HJ. Validity of the Active Straight Leg Raise test for measuring disease severity in patients with Posterior Pelvic Pain after Pregnancy. Spine 2002; 27(2): 196-200. Mens JM, Vleeming A, Snijders CJ, Stam HJ, Ginai AZ. The active straight leg raising test and mobility of the pelvic joints. Eur Spine J 1999; 8(6): 468-474. Mens JM, Vleeming A, Stoeckart R, Stam HJ, Snijders CJ. Understanding peripartum pelvic pain – Implications of a patient survey. Spine 1996; 21(11): 1363-1370. Michel A, Kohlmann T, Raspe H. The association between clinical findings on physical examination and self-reported severity in back pain: results of a population based study. Spine 1997; 22(3): 296303. Muller W, Biedert R, Hefti F, Jakob RP, Munzinger U, Staubli HU. OAK knee evaluation. A new way to assess knee ligament injuries. Clin Orthop 1988; 232: 37-50. 108 Noyes FR, Grood ES, Butler DL, Maled M. Clinical laxity tests and functional stability of the knee: biomechanical concepts. Clin Orthop 1980; 146: 84-89. Noyes FR, Grood ES, Torzilli PA. Current concepts review. The definitions of terms for motion and position of the knee and injuries of the ligaments. J Bone Joint Surg Am 1989; 71(3): 465-472. O’Sullivan PB, Beales DJ, Beetham JA, Cripps J, Graf F, Lin IB, Tucker B, Avery A. Altered motor control strategies in subjects with sacroiliac joint pain during the Active Straight Leg Raise test. Spine 2002; 27(1): E1-E8. O’Sullivan PB, Phyty GD, Twomey LT, Allison GT. Evaluation of specific stabilizing exercise in the treatment of chronic low back pain with radiologic dignosis of spondylolysis or spondylolisthesis. Spine 1997; 22(24): 2959-2967. Oliver JH, Coughlin LP. Objective knee evaluation using the Genucom Knee Analysis System. Clinical implications. Am J Sports Med 1987; 15(6): 571-578. Orvieto R, Achiron A, Ben Rafael Z, Gelernter I, Achiron R. Low-back pain of pregnancy. Acta Obstet Gynecol Scand 1994; 73(3): 209-214. Östgaard HC, Andersson GB, Karlsson K. Prevalence of back pain in pregnancy. Spine 1991; 16(5): 549-552. Östgaard HC, Roos-Hansson E, Zetherström G. Regression of back and posterior pelvic pain after pregnancy. Spine 1996; 21(23): 27772780. Östgaard HC, Zetherström G, Roos-Hansson E, Svanberg B. Reduction of back and posterior pelvic pain in pregnancy. Spine 1994; 19(8): 894900. Perkins J, Hammer RL, Loubert PV. Identification and management of pregnancy-related low back pain. J Nurse Midwifery 1998; 43(5): 331-340. Piziali RL, Rastegar JC. Measurement of the nonlinear, coupled stiffness characteristics of the human knee. J Biomech 1977; 10(1): 45-51. Pollet V, Barrat D, Meirhaeghe E, Vaes P, Handelberg F. The role of the Rolimeter in quantifying knee instability compared to the functional outcome of ACL-reconstructed versus conservatively treated knees. Knee Surg Sports Traumatol Arthrosc 2005; 13(1): 12-18. Pool-Goudzwaard AL, Hoek van Dijke GA, Mulder P, Spoort CW, Snijders CJ, Stoeckart R. The iliolumbar ligament: its influence on stability of the sacroiliac joint. Clin Biomech 2003; 18(2): 99-105. Pool-Goudzwaard AL. Biomechanics of the sacroiliac joints and the pelvic floor. Thesis, Erasmus University Rotterdam, The Netherlands, 2003. References 109 Pool-Goudzwaard A, Hoek van Dijke G, van Gurp M, Mulder P, Snijders C, Stoeckart R. Contribution of pelvic floor muscles to stiffness of the pelvic ring. Clin Biomech 2004; 19(6): 564-571. Pool-Goudzwaard AL, Slieker ten Hoven MC, Vierhout ME, Mulder PH, Pool JJ, Snijders CJ, Stoeckart R. Relations between pregnancyrelated low back pain, pelvic floor activity and pelvic floor dysfunction. Int Urogynecol J Pelvic Floor Dysfunct 2005; April 1. Punzi L, Pozzuoli A, Pianon M, Bertazzolo N, Oliviero F, Scapinelli, R. Pro-inflammatory interleukins in the synovial fluid of rheumatoid arthritis associated with joint hypermobility. Rheumatology 2001; 40(2): 202-204. Rasenberg EI, Lemmens JA, van Kampen A, Schoots F, Bloo HJ, Wagemakers HP, Blankevoort L. Grading medial collateral ligament injury: comparison of MR imaging and instrumented valgus-varus laxity test-device. A prospective double-blind patients study. Eur J Radiol 1995; 21(1): 18-24. Richardson CA, Snijders CJ, Hides JA, Damen L, Pas MS, Storm J. The relation between the transversus abdominis muscles, sacroiliac joint mechanics and low back pain. Spine 2002; 27(4): 399-405. Röst CC, Jaxqueline J, Kaiser A, Verhagen AP, Koes BW. Pelvic pain during pregnancy. A descriptive study of signs and symptoms of 870 patients in primary care. Spine 2004; 29(22): 2567-2572. Sands RX. Backache of pregnancy – a method of treatment. Obstet Gynecol 1958; 12(6): 670-676. Scholten PJ, Schultz AB, Luchies CW, Miller JA. Motions and loads within the human pelvis: a biomechanical model study. J Orthop Res 1988; 6(6): 840-850. Scholten PJ. Idiopathic scoliosis; some fundamental aspects of the mechanical behaviour of the human spine. Thesis, Free University Amsterdam, The Netherlands, 1986. Schoppink LE, van Tulder MW, Koes BW, Beurskens SA, Bie de RA. Reliability and validity of the Dutch adaptation of the Quebec Back Pain Disability Scale. Phys Ther 1996; 76(3): 268-275. Seckin U, Tur BS, Yilmaz O, Yagci I, Bodur H, Arasil T. The prevalence of joint hypermobility among high school students. Rheumatol Int 2005; 25(4):260-263. Sharma L, Lou C, Felson DT, Dunlop DD, Kirwan-Mellis G, Hayes KW, Weinrach D, Buchanan TS. Laxity in healthy and osteoarthritic knees. Arthritis Rheum 1999; 42(5): 861-870. Shultz SJ, Carcia CR, Perrin DH. Knee joint laxity affects muscle activation patterns in the healthy knee. J Electromyogr Kinesiol 2004; 14(4): 475-483. Smidt GL, McQuade K, Wei SH, Barakatt E. Sacroiliac kinematics for reciprocal straddle positions. Spine 1995; 20(9): 1047-1054. 110 Smidt GL, Wei SH, McQuade K, Barakatt E, Sun T, Stanford, W. Sacroiliac motion for extreme hip positions. Spine 1997; 22(18): 2073-2082. Snijders CJ, Vleeming A, Stoeckart R. Transfer of lumbosacral load to iliac bones and legs. Part 1: Biomechanics of self-bracing of the sacroiliac joints and its significance for treatment and exercise. Clin Biomech 1993a; 8(6): 285-294. Snijders CJ, Vleeming A, Stoeckart R. Transfer of lumbosacral load to iliac bones and legs. Part 2: Loading of the sacroiliac joints when lifting in a stooped posture. Clin Biomech 1993b; 8(6): 295-301. Snijders CJ, Bakker MP, Vleeming A, Stoeckart R, Stam HJ. Oblique abdominal muscle activity in standing and in sitting on hard and soft seats. Clin Biomech 1995a; 10(2): 73-78. Snijders CJ, Vleeming A, Stoeckart R, Mens JMA, Kleinrensink GJ. Biomechanical modeling of sacroiliac joint stability in different postures. Spine 1995b; 9(2): 419-432. Solomonow M, Bing-He Z, Harris M, Lu Y, Baratta RV. The ligamentomuscular stabilizing system of the spine. Spine 1998; 23(23): 25522562. Sprigle SH, Chung KC, Brubaker CE. Reduction of sitting pressures with custom contoured cushions. J Rehabil Dev 1990a; 27(2): 135-140. Sprigle SH, Faisant TE, Chung KC. Clinical evaluation of custoncontoured cusions for the spinal cord injured. Arch Phys Med Rehabil 1990b; 71(9): 655-658. Stinson MD, Porter-Armstrong A, Eakin P. Seat-interface pressure: a pilot study of the relationship to gender, body mass index, and seating position. Arch Phys Med Rehabil 2003; 84(3):405-409. Strender LE, Sjöblom A, Sundell K, Ludwig R, Taube A. Interexaminer reliability in physical examination of patients with low back pain. Spine 1997; 22(7): 814-820. Sturesson B, Selvik G, Udén A. Movements of the sacroiliac joints – a roentgen stereophotogrammetric analysis. Spine 1989; 14(2): 162165. Thompson MT, Conditt MA, Ismaily SK, Agarwal A, Noble PC. Brief report: validation of a system for automated measurement of knee laxity. Clin Biomech 2004; 19(3): 308-312. Thoms H. Relaxation of the symphysis pubis in pregnancy. J Am Med Assoc 1936; 106:1364-1366 Trew M, Everett T. Human movement. An introductory text. Churchill Livingstone, Edinburgh, 2001. Van Tulder M, Assendelft WJ, Koes B, Bouter LM. Spinal radiographic findings and nonspecific low back pain: a systematic review of observational studies. Spine 1997; 22(4): 427-434. Vincent-Smith B, Gibbons P. Inter-examiner and intra-examiner reliability of the standing flexion test. Man Ther 1999; 4(2): 87-93. References 111 Vleeming A, Stoeckart R, Volkers AC, Snijders CJ. Relation between form and function in the sacroiliac joint. Part 1: Clinical anatomical aspects. Spine 1990a; 15(2): 130-132. Vleeming A, Volkers AC, Snijders CJ, Stoeckart R. Relation between form and function in the sacroiliac joint. Part 2: Biomechanical aspects. Spine 1990b; 15(2): 133-136. Vleeming A, Buyruk HM, Stoeckart R, Karamursel S, Snijders CJ. An integrated therapy for peripartum pelvic instability: a study of the biomechanical effects of pelvic belts. Am J Obstet Gynecol 1992; 166(4): 1243-1247. Walker JM. The sacroiliac joint: a critical review. Phys Ther 1992; 72(12): 903-916. Wang M, Dumas GA. Mechanical behavior of the female sacroiliac joint and influence of the anterior and posterior sacroiliac ligaments under sagital loads. Clin Biomech 1998; 13(4): 293-299. Wergeland E, Strand K. Work pace control and pregnancy health in a population-based sample of employed women in Norway. Scand J Work Environ Health 1998; 24(3): 206-212. White AA, Panjabi MM. Clinical biomechanics of the spine. J.B. Lippincott Company, Philadelphia, 1978. White BF, Brown DW, Hundal M, Johnson RJ, Pope MH. Knee impedance testing machine. Med Instrum 1979; 13(4): 227-231. Wilke HJ, Krischak S, Claes LE. Formalin fixation stronly influences biomechanical properties of the spine. J Biomech 1996; 29(12): 1629-1631. Woo SL, Debski RE, Withrow JD, Janaushek MA. Biomechanics of knee ligaments. Am J Sports Med 1999; 27(4): 533-543. Wormslev M, Juul AM, Marques B, Minck H, Bentzen L, Hansen TM. Clinical examination of pelvic insufficiency during pregnancy – an evaluation of the interobserver variation, the relation between clinical signs and pain and the relation between clinical signs and physical disability. Scand J Rheumatol 1994; 23(2): 96-102. Wright V, Dowson D, Longfied MD. Joint stiffness—its characterisation and significance. Biomed Eng 1969; 4(1): 8-14. Wu W, Meijer OG, Jutte PC, Uegaki K, Lamoth CJ, de Wolf S, van Dieën JH, Wuisman PI, Kwakkel G, de Vries JI, Beek PJ. Gait in patients with pregnancy-related pain in the pelvis: an emphasis on the coordination of transverse pelvic and thoracic rotations. Clin Biomech 2002; 17(9): 678-686. Wu W, Meijer OG, Uegaki K, Mens JM, van Dieen JH, Wuisman PI, Östgaard HC. Pregnancy-related pelvic girdle pain (PPP), 1: Terminology, clinical presentation and prevalence. Eur Spine J 2004; 13(7): 575-589. Dankwoord 114 Dit proefschrift is het resultaat van een grote hoeveelheid werk dat ik niet had kunnen volbrengen zonder de directe en indirecte hulp van zeer veel mensen. Mijn oprechte dank gaat uit naar iedereen die met zijn inzet, tijd en energie op één of andere wijze een bijdrage aan dit proefschrift heeft geleverd. Allereerst wil ik mijn promotoren prof.dr.ir. C.J. Snijders en prof.dr. H.J. Stam bedanken. Zij hebben mij immers de mogelijkheid gegeven om bij wetenschappelijk onderzoek betrokken te raken en om uiteindelijk te promoveren. Professor Snijders, met uw grote enthousiasme bent u de initiator en stuwende kracht geweest van dit onderzoek. Professor Stam, iets meer op de achtergrond was u aanwezig tijdens mij onderzoek. Maar door uw klinische ervaring heeft u een zeer waardevolle inbreng gehad bij de verschillende discussies. Mijn copromotor Kees Spoor wil ik hartelijk bedanken voor zijn begeleiding, inzet en scherpe blik bij het beoordelen van mijn werk. Kees, je bent van het begin tot het einde als begeleider betrokken bij mijn onderzoek en je hebt een zeer belangrijke rol gespeeld bij de totstandkoming van dit proefschrift. De leden van de commissie, prof.dr.ir. N. de Jong, prof.dr. P. Patka, prof.dr. E.A.P. Steegers, prof.dr. A.B. van Vugt, dr. G.J. Kleinrensink en dr. J.M.A. Mens, wil ik hartelijk bedanken voor hun tijd en inspanning om mijn proefschrift te lezen en te beoordelen. De leden van de STW gebruikerscommissie, de heren Bouakaz, Brands, De Jong, Lancée, Luiten, Rixen, Seelen en Snackers, bedank ik voor hun rol tijdens de bijeenkomsten. Ik wil de heer Boontje bedanken voor het tot stand komen en leiden van deze bijeenkomsten. Belangrijk zijn uiteraard ook de collega’s van de afdeling BNT geweest. Annelies, Cor, Ester, Gilbert, Johan, Joop, Marcel, Marieke, Nadine, Ria, Ruud, en Wim, ik kon altijd op jullie praktische hulp en advies rekenen. Bedankt voor de collegialiteit en de gezelligheid. Annelies, jij hebt in de laatste fase van mijn onderzoek een belangrijke rol gespeeld. Ik ben blij dat je mijn paranimf wilt zijn. Ed Heule wil ik bedanken voor zijn grote interesse in mijn werk en het kritische commentaar op de manuscripten. Jan Weststrate en Rosalie Helfrich wil ik bedanken voor hun enthousiasme en praktische hulp bij het vertrouwd raken met de FSA drukmat. Dankwoord 115 De werknemers van Paramedisch Centrum Impact in Zoetermeer wil ik hartelijk bedanken voor het ter beschikking stellen van hun praktijkruimte voor mijn onderzoek. Het was erg prettig dat ik mijn metingen bij jullie kon uitvoeren en dat mijn opstelling in de praktijk kon blijven staan. Al waren jullie ongetwijfeld erg blij toen alles afgerond was en de opstelling werd verwijderd. Ik wil de verloskundigen van Verloskundig Centrum Partera uit Zoetermeer bedanken voor de rol die ze hebben gespeeld bij het werven van zwangere vrouwen voor mijn onderzoek. Het was erg lastig vrouwen bereid te vinden om mee te doen aan mijn onderzoek maar zonder jullie hulp was het ongetwijfeld nog veel moeilijker geweest. Ik wil álle proefpersonen bedanken die mee hebben gedaan aan mijn onderzoek, zonder hen was het immers niet mogelijk om de verschillende metingen uit te voeren. Hartelijk dank daarvoor. Naast de vele mensen die direct met mijn onderzoek te maken hebben gehad, wil ik ook graag mijn familie en vrienden bedanken. Zij hebben voor de nodige afleiding naast het werk gezorgd. De etentjes, feestjes, dagjes uit, de gezellige avonden, het sporten of ‘gewoon’ het kletsen bij een kopje thee zorgden voor een goede invulling van de vrije tijd. Bedankt allemaal. Amber, Geert, Inge en Jan, jullie zijn van heel dichtbij erg betrokken geweest bij mij en mijn werk. Het is heel waardevol om lieve familie om je heen te hebben en ik wil jullie daarvoor bedanken. Amber, ik vind het heel fijn dat je mijn paranimf wilt zijn. Tenslotte, papa en mama, een speciaal woordje van dank voor jullie. Ik waardeer het enorm dat jullie mij alle mogelijkheden hebben gegeven om mijn eigen weg te volgen. Jullie hebben mij altijd gemotiveerd en gestimuleerd om door te zetten en af te maken waar ik aan begonnen ben. Problemen zijn er immers om te overwinnen… Ik wil jullie bedanken voor jullie onvoorwaardelijke liefde, steun en vertrouwen. Mirthe Curriculum vitae 118 Mirthe de Groot was born on December 4, 1975, in Leidschendam, The Netherlands. After attending the Havo at the Oranje Nassau College in Zoetermeer, she graduated at the Academy of Physical Therapy in Leiden in 1997. In the same year she started the study Health Science at the University of Maastricht and specialised in Movement Science. She graduated in August 1999. During and after this study she worked as a physical therapist. In April 2001, she started with her PhD study at the department of Biomedical Physics and Technology (Prof. dr. ir. C.J. Snijders) in cooperation with the department of Rehabilitation Medicine (Prof. dr. H.J. Stam), Erasmus MC Rotterdam. This thesis describes the research of this period. Currently she is working as a statistical researcher at the Statistics Netherlands (Centraal Bureau voor de Statistiek).


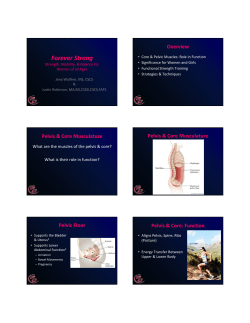


© Copyright 2026