
Determining the Structure and Orientation of the Alamethicin
Determining the Structure and Orientation of the Alamethicin Ion Channel in
Lipid Membranes using ATR and Electrochemical PMIRRAS
by
Muzaffar Shodiev
A Thesis
Presented to
The University of Guelph
In partial fulfillment of requirements
for the degree of
Master of Science
in
Chemistry
Guelph, Ontario, Canada
© Muzaffar Shodiev, May, 2015
ABSTRACT
DETERMINING THE STRUCTURE AND ORIENTATION OF THE ALAMETHICIN ION
CHANNEL IN LIPID MEMBRANES USING ATR AND ELECTROCHEMICAL PMIRRAS
Muzaffar Shodiev
Advisor:
University of Guelph
Professor Jacek Lipkowski
Alamethicin is a short antibiotic peptide produced by the fungus Trichoderma viride. Ion
channels formed by Alamethicin are voltage-gated due to their large molecular dipoles. The
goals of this project were to monitor the incorporation of Alamethicin into 1,2-diphytanoyl-snglycero-3-phosphocholine (DPhPC) model biomimetic membranes and characterize the opening
and closing of these incorporated Alamethicin channels. Attenuated Total Reflection Fourier
Transform Infrared spectroscopy (ATR-FTIR) was employed to elucidate the mechanism of
Alamethicin incorporation by first spreading vesicles onto the ATR prism. The IR signature of
Alamethicin was determined and different peptide ratios were tested. In order to determine the
opening and closing of the Alamethicin pore, a bilayer containing Alamethicin was deposited
onto the surface of a thioglucose modified Au(111) electrode. Polarization Modulation Infrared
Reflection Absorption Spectroscopy (PMIRRAS) was used to examine changes in the structure
and orientation of Alamethicin as a function of the applied potential.
ACKNOWLEDGEMENTS
I would like to thank Professor Jacek Lipkowski for accepting me into the program and
supporting me to its completion. I was very fortunate to have Jacek as a supervisor, his positive
outlook and vast knowledge of chemistry and science in general was a source of inspiration and
motivation in my research. His suggestions and comments during editing contributed enormously
to the completion of this thesis.
I would like to thank my advisory committee members Dr. John Dutcher and Dr. Aziz
Houmam. I would like to thank Dr. Dutcher again for serving on the examination committee. I
would also like to thank Dr. Dan Thomas for serving on the examination committee and Dr.
Wojciech Gabryelski for chairing the defense.
Many thanks to the Lipkowski lab group members both past and present for their help in
various laboratory settings. Specifically, thanks go to Jay Leitch and Zhangfei Su for their help
with PMIRRAS experiments and data analysis, Ryan Seenath for general guidance and advice
throughout the research, and Mike Grossutti for help with ATR-FTIR.
Last but not least I would like to thank my family for the support they gave me during the
research, especially during the writing of this thesis.
iii
Table of Contents
Acknowledgements ............................................................................................................... iii
Table of Contents .................................................................................................................. iv
List of Tables and Figures......................................................................................................ix
List of Symbols and Abbreviations........................................................................................xiii
Chapter 1: Introduction………………………………………………….…………………. 1
1.1 Preamble…………….…………….…………….…………….……………….. 2
1.2 Objectives of Thesis…………….…………….…………….………………….. 3
1.3 Scope of Thesis…………….…………….…………….…………….………… 4
1.4 References…………….…………….…………….…………….……………… 5
Chapter 2: Literature Review…………….…………….…………….…………………….. 6
2.1 Introduction…………….…………….…………….…………….…………….. 7
2.2 Biological Membranes…………….…………….…………….……………….. 7
2.2.1 Properties and structure…………….…………….…………………...7
2.2.2 Membrane phospholipids…………………………………………….. 9
iv
2.2.3 Electrical properties…………….…………….…………….………... 11
2.3 Model membranes…………….…………….…………….…………….……… 13
2.3.1 DPhPC…………….…………….…………….…………….……….. 13
2.3.2 Support systems…………….…………….…………….……………. 14
2.3.3 Deposition Methods…………….…………….…………….………... 15
2.3.4 Characterization of lipids and proteins……….…………….………... 18
2.3 Transmembrane proteins…………….…………….…………….……………... 20
2.3.2 Alamethicin ion channels…………….…………….…………….…...21
2.4 References…………….…………….…………….…………….……………… 28
Chapter 3: Theory…………….…………….…………….…………….………………….. 31
3.1 Electrochemistry…………….…………….…………….……………………... 32
3.1.1 The electrical double layer…………….…………….……………….. 32
3.1.2 The Gibbs Adsorption Isotherm…………….…………….…………. 36
3.2 Langmuir Blodgett Deposition…………….…………….…………….………. 38
3.2.1 Principles…………….…………….…………….……………………39
3.2.2 Compression isotherms…………….…………….…………………... 40
v
3.2.3 Bilayer formation…………….…………….…………….…………... 41
3.3 IR Spectroscopy…………….…………….…………….……………………… 43
3.3.1 FTIR Spectroscopy…………….…………….…………….………… 43
3.3.2 Michelson interferometer…………….………………….…………… 46
3.3.3 ATR-IR Spectroscopy…………….…………….…………….……… 49
3.3.4 PMIRRAS…………….…………….…………….………………….. 57
3.4 References…………….…………….…………….……………………………. 69
Chapter 4: Materials and Experimental Methods…………….…………….……………… 71
4.1 Glassware and solutions…………….…………….…………….……………… 72
4.2 Sample Preparation…………….…………….…………….…………………... 72
4.3 ATR Equipment and measurements…………….…………….……………….. 73
4.4.1 Experimental Setup…………….…………….…………….………… 73
4.4.2 Data Processing…………….…………….…………….……………. 75
4.4 Langmuir Blodgett and Langmuir Schaefer Techniques…………….………… 77
4.5 PMIRRAS Equipment and measurements…………….…………….………… 79
4.5.1 Electrochemical cell…………….…………….…………….……….. 79
vi
4.5.2 Experimental Setup…………….…………….…………….………… 80
4.5.3 Experimental Conditions…………….…………….………………… 81
4.5.4 Gap thickness and angle of incidence setup…………….…………… 83
4.5.5 Data Processing…………….…………….…………….……………. 84
4.6 References…………….…………….…………….…………….……………… 87
Chapter 5: Results and Discussion…………….…………….…………….………………. 88
5.1 Creation of a Solid Supported Bilayer Containing Alamethicin Peptide and
DPhPC Phospholipid…………………….…………….…………………... 89
5.2 PM-IRRAS …………….…………….…………….…………….……………. 89
5.4.1 Optical Constants…………….…………….…………….………….. 90
5.4.2 Amide I region…………….…………….…………….…………….. 94
5.4.3 Acyl chain region of DPhPC sample…………….…………………... 99
5.4.4 Acyl chain region of DPhPC + Alamethicin sample………………… 103
5.3 Creation of a multilayer containing DPhPC phospholipid and Alamethicin
peptide…………….…………….…………….…………….……………… 106
5.4 ATR-FTIR…………….…………….…………….…………….……………... 107
5.5 References…………….…………….…………….…………….……………… 111
vii
Chapter 6: Conclusions…………….…………….…………….…………….…………….. 112
6.1 Conclusions…………….…………….…………….…………….……………. 113
6.2 Future Directions…………….…………….…………….…………….………. 115
6.3 References…………….…………….…………….…………….……………… 117
viii
List of Tables
Table 2.1: Group modes and corresponding vibrational modes for lipids and protein
amides……………………………………………………………………………… 20
Table 5.1: Tilt angles for amide I region and acyl chain regions at different P/L ratios….. 110
List of Figures
Figure 2.1: Schematic of a typical biological cell membrane……………………………...8
Figure 2.2: Schematic of a typical phospholipid with head group on top and tail group
on the bottom……………………………………………………………………..... 10
Figure 2.3: Schematic of the 1,2-diphytanoyl-sn-glycero-3-phosphocholine (DPhPC)
phospholipid………………………………………………………………………... 14
Figure 2.4: Diagram of layer of dried phospholipid on the walls of a glass vessel and
process of phospholipid hydration and formation of vesicle……………………..... 16
Figure 2.5: Diagram for process of vesicle rupture after it is adhered on the desired
Substrate……………………………………………………………………………. 17
Figure 2.6: Proposed structure of alamethicin…………………………………………….. 22
Figure 2.7: Visualization of proposed events during a MD study of alamethicin in a lipid
bilayer……………………………………………………………………………… 25
Figure 2.8: EC-STM images of alamethicin inserted into lipid monolayer……………….. 26
ix
Figure 2.9: Schematic for the angles and orientation of alamethicin at different pHs……. 27
Figure 3.1: A Helmholtz model on the left B Graham model on the right………………... 34
Figure 3.2: Diagram of a compression isotherm…………………………………………...41
Figure 3.3: Diagram of the Michelson Interferometer…………………………………….. 47
Figure 3.4: Diagram of a typical ATR setup. The incident IR beam goes into the prism
which is typically made of ZnSe…………………………………………………… 50
Figure 3.5: Diagram representing Snell’s Law……………………………………………. 51
Figure 3.6: Diagram of three phase setup for ATR experiment…………………………... 54
Figure 3.7: Illustration of the p and s- polarized light electric field vectors at the
interface……………………………………………………………………………..59
Figure 3.8: PMIRRAS setup diagram. CE, counter electrode; TP, Teflon piston; RE, reference
electrode; WE, working electrode; OW, optical window; SP, static polarizer…….. 60
Figure 3.9: Diagram showing the relative orientation of the electric field components
for a half-wave retardation…………………………………………………………. 63
Figure 4.1: Diagram of instrumentation for the ATR-IR setup…………………………… 75
Figure 4.2: Bilayer deposition on gold electrode using Langmuir Blodgett (left) and
Langmuir Schaeffer (right) techniques…………………………………………...... 78
Figure 4.3: Picture of the electrochemical cell in its holder in the TOM box. Photoelastic
modulator is to the right and detector to the left of the picture……………………..80
x
Figure 4.4: Example 3D plot of the influence of gap thickness and angle of incidence on
MSEFS……………………………………………………………………………... 83
Figure 4.5: Example of a baseline correction for PMIRRAS spectra. Corrected spectra on the
right…………………………………………………………………………………………. 85
Figure 5.1: Single beam spectrum for the empty transmission cell showing the fringe
pattern……………………………………………………………………………… 92
Figure 5.2: Optical constants for Top: ν(CH) region; Bottom: Amide I and ν(CO)………93
Figure 5.3: PMIRRAS spectra of the Amide I and head group regions for DPhPC: Alm
bilayer at selected potentials……………………………………………………….. 95
Figure 5.4: Deconvolution of the 1600 region…………………………………………….. 96
Figure 5.5: Tilt angle of Alamethicin helix in the solid supported bilayer lipid
membrane…………………………………………………………………………... 97
Figure 5.6: PMIRRAS spectra of the CH stretching region for DPhPC bilayer at selected
potentials……………………………………………………………………............ 100
Figure 5.7: Deconvolution of the 2900cm-1 region………………………………………...101
Figure 5.8: Tilt angle of acyl chain of DPhPC with respect to the surface normal in a
solid supported bilayer lipid membrane……………………………………………. 102
Figure 5.9: PMIRRAS spectra of the CH stretching region for DPhPC: Alm bilayer at
selected potentials………………………………………………………………….. 104
xi
Figure 5.10: Tilt angle of acyl chain of DPhPC with respect to the surface normal in a
solid supported bilayer lipid membrane in the presence of Alamethicin……...........105
Figure 5.11: ATR-FTIR spectrum of dry DPhPC:Alm after background correction……... 107
Figure 5.12: Deconvolution of the 1600 (top) and 2900 (bottom) regions of ATR
spectra……………………………………………………………………………… 109
xii
List of Symbols and Abbreviations
Chapter 1
IR
Infrared
ATR-FTIR
Attenuated Total Reflection Fourier Transform Infrared Spectroscopy
PMIRRAS
Polarization Modulation Infrared Reflection Absorption Spectroscopy
Alm
Alamethicin
DPhPC
1,2-diphytanoyl-sn-glycero-3-phosphocholine
Chapter 2
DPhPC
1,2-diphytanoyl-sn-glycero-3-phosphocholine
p
Critical packing parameter
V
Volume of a cylinder
r0
Radius of a cylinder
l
Length
BLM
Bilayer lipid membrane
SPB
Supported phospholipid membranes
IR
Infrared
ATR-FTIR
Attenuated Total Reflection Fourier Transform Infrared Spectroscopy
PMIRRAS
Polarization Modulation Infrared Reflection Absorption Spectroscopy
Alm
Alamethicin
AMP
Antimicrobial peptide
Aib
Aminoisobutyric acid
P/L
Peptide to lipid
MD
Molecular dynamics
EC-STM
Electrochemical scanning tunneling microscopy
SFG
Sum frequency generation
xiii
Chapter 3
ε
Dielectric constant of the medium
ε0
Permittivity of free space
d
Distance between the plates
V
Voltage drop between the plates
Cd
Differential capacitance
Cdl
Total capacitance
CH
Inner layer
Potential drop
Electroneutrality of the double layer
Surface excess concentration
Electrochemical potential
LB
Langmuir Blodgett
Surface tension
AL
Area of the water surface decrease
AS
Area of the substrate
PMIRRAS
Polarization Modulation Infrared Reflection Absorption Spectroscopy
IR
Infrared
ATR-FTIR
Attenuated Total Reflection Fourier Transform Infrared Spectroscopy
Evib
Permitted vibrational energy levels
kvib
Force constant
mvib
Reduced mass
vvib
Frequency of the vibrational mode
vradiation
Frequency of the incident radiation
A
Absorption
Transition dipole moment vector
𝑒
Electric field vector
xiv
θ
Angle between the two vectors
( ̅)
Source intensity
IRE
Internal Reflection Element
n1
Refractive index of medium 1
n2
Refractive index of medium 2
θ1
Angle of incidence
θ2
Angle of refraction
θc
Critical angle
Ex
Electric field component
λ
Wavelength of the incident beam
d
Penetration depth
R
Dichroic ratio
Sdipole
Transition dipole order parameter
MSEFS
Mean square electric field strength
Rp
Reflectivity of p-component
Rs
Reflectivity of s-component
PEM
Photo elastic modulator
Ip
Intensity of the p- component
Is
Intensity of the s- component
t
Time
φ
Retardation
SSD
Synchronous sampling demodulator
A(E)
Experimental integrated intensity
A(random)
Simulated integrated intensity
γ
Tilt angle of the helical axis
xv
Chapter 4
DPhPC
1,2-diphytanoyl-sn-glycero-3-phosphocholine
PMIRRAS
Polarization Modulation Infrared Reflection Absorption Spectroscopy
ATR-FTIR
Attenuated Total Reflection Fourier Transform Infrared Spectroscopy
IRE
Internal Reflection Element
Face angle
Set angle
Effective angle
n1
Refractive index of IRE
( ̅)
p-polarized background spectrum
( ̅)
s-polarized background spectrum
( ̅)
p-polarized sample spectrum
( ̅)
s-polarized sample spectrum
( ̅)
Absorbance of p-polarized light
( ̅)
Absorbance of s-polarized light
̅
Wavenumber
( ̅)
Dichroic ratio
PEM
Photo elastic modulator
SSD
Synchronous sampling demodulator
IR
Infrared
MSEFS
Mean square electric field strength
FSD
Fourier self deconvolution
FWHM
Full width at half max
A0
Band maximum
Wavenumber
Wavenumber at band maximum
γ
Half width at half maximum
xvi
Chapter 5
DPhPC
1,2-diphytanoyl-sn-glycero-3-phosphocholine
Alm
Alamethicin
PMIRRAS
Polarization Modulation Infrared Reflection Absorption Spectroscopy
ATR-FTIR
Attenuated Total Reflection Fourier Transform Infrared Spectroscopy
E
Electric field vector
µ
Transition dipole moment vector
θ
Angle
SC=O
Order parameter
α
Angle between helical axis and transition dipole moment
P/L
Peptide to lipid
Chapter 6
ATR-FTIR
Attenuated Total Reflection Fourier Transform Infrared Spectroscopy
PMIRRAS
Polarization Modulation Infrared Reflection Absorption Spectroscopy
Alm
Alamethicin
DPhPC
1,2-diphytanoyl-sn-glycero-3-phosphocholine
DMPC
1,2-dimyristoyl-sn-glycerol-3-phosphocholine
AFM
Atomic Force Microscopy
xvii
Chapter 1: Introduction
1.1 Preamble
1.2 Objectives of Thesis
1.3 Scope of Thesis
1.4 References
1
Chapter 1: Introduction
1.1 Preamble
Increasing amounts of bacteria resistant to common antibiotics has caused a focus of
research into understanding function and mechanism of antimicrobial compounds. Antimicrobial
peptides are examples of antimicrobial compounds that might provide a solution to this problem.
It has been shown that channel forming peptides play a key role in antimicrobial activity through
permeation into cell membranes or membrane thinning. Although the actual biological proteins
are often too complex and difficult to study, short peptides that mimic their channel forming
mechanism have been undergoing intense research for the past few decades (1). However, the
structural changes in membranes occurring during pore formation are still not clearly understood
and require further study. Studying the properties of peptides would provide insight into the
mechanism of their antibiotic activity and would determine the type of cellular damage caused
by the peptides.
Biological membranes are a fundamental component of all living organisms. They are
composed of a complex organization of lipids, proteins and other molecules bound together by
the hydrophilic interactions in the lipid bilayer. The lipid bilayer functions as a barrier regulating
the exchange of proteins, ions and metabolites between the cell and the environment (2). The
protein pores embedded in the membrane allow communication and transport of specific
materials in and out of the cell. There are types of protein pores that provide selective
permeability by a process called gating. There must be conformational and orientational changes
happening to the pores during the gating process. It is the goal of this thesis to study these
changes. However, the complexity of natural biological membranes restricts us to perform a
2
thorough investigation of their properties at the molecular level. Bilayer lipid membranes
(BLMs) can be synthesized to mimic biological membranes and fulfill their purpose of allowing
peptide insertion and interaction and are less complex and more straightforward to study.
There are several possible ways to study the conformational changes that pore forming
peptides and lipid membranes undergo. IR Spectroscopy is among the most commonly used (3).
In this project two types of polarized IR Spectroscopy will be used. Attenuated Total Reflection
Fourier Transform Infrared Spectroscopy (ATR-FTIR) will be used to obtain an initial IR
spectrum of lipid/peptide system and determine an adequate peptide to lipid ratio for further
investigations.
Polarization
Modulation
Infrared
Reflection
Absorption
Spectroscopy
(PMIRRAS) will be used to study the mechanism of pore formation. PMIRRAS for the study of
biomolecules at the metal/solution interface was developed in our laboratory by Dr. Zamlynny in
the course of his Ph.D. (4). PMIRRAS allows the study of model membranes with incorporated
proteins in situ under non-denaturing conditions to observe the structural changes of
transmembrane proteins and membrane phospholipids under the influence of an electric field.
The information gained from this project can be used as a basis to study more
complicated systems and lead to a better understanding of the type of cellular damage caused by
antimicrobial peptides.
1.2 Objectives of Thesis
The general objective of this project has been to study the electric field driven changes of a
model system consisting of 10% molar ratio of Alamethicin (Alm), a voltage gated ion channel
3
forming peptide, and 90% of DPhPC, a zwitterionic phospholipid. To accomplish the main goal,
specific objectives were set, as follows:
i)
The development of a sample preparation of a biomimetic membrane containing
alamethicin using vesicle fusion will be required for ATR-FTIR studies
ii)
The IR signature of inserted state of alamethicin in a DPhPC membrane using
Attenuated Total Reflection Infrared Spectroscopy (ATR-IR) will be determined.
iii)
The sample preparation of a biomimetic membrane containing alamethicin using
Langmuir-Blodgett and Langmuir Schaeffer technique will be required for PMIRRAS
studies
iv)
PMIRRAS will be used to study the potential dependence of the molecular orientation
and conformation of the DPhPC and alamethicin molecules in situ.
1.3 Scope of Thesis
This thesis contains six chapters. Chapter 1 introduces the motivations for this work and
highlights its major goals. Chapter 2 provides a literature review into the biomimetic membranes,
support systems and development, description of alamethicin peptide and its properties, and
surface sensitive IR spectroscopy of such systems. Chapter 3 describes the theory of membrane
electrochemistry,
Langmuir-Blodgett
film
deposition
technique
and
spectroscopic
characterization tools used in this project. Chapter 4 explains the materials and methods used in
this thesis for sample preparation, data collection and treatment. Chapter 5 presents the results
obtained from this research and discussion of their significance. The summary of this work and
the future directions of this project are presented in Chapter 6.
4
1.4 References
1. He, K.; Ludtke, S.; Teller, W.; Huang, H. et al Biophysical J. 1996
2. Alberts, B.; Bray, D.; Lewis, J.; Raff, M.; Roberts, K.; Watson, J.D. Molecular Biology of
the Cell, 2nd Edition, 1989, Garland Publishing Inc., New York.
3. Chen, M.; Li, M.; Brosseau, C.L.; Lipkowski, J. Langmuir 2009, 25, 1028.
4. Zamlynny, V. Ph.D. Dissertation, University of Guelph, 2002
5
Chapter 2: Literature Review
2.1 Introduction
2.2 Biological Membranes
2.2.1 Properties and structure
2.2.2 Membrane phospholipids
2.2.3 Electrical properties
2.3 Model membranes
2.3.1 DPhPC
2.3.2 Support systems
2.3.3 Deposition Methods
2.3.4 Characterization of lipids and proteins
2.4 Transmembrane proteins
2.4.2 Alamethicin ion channels
2.5 References
6
Chapter 2: Literature Review
2.1 Introduction
The objective of this research is to study the conformational changes of transmembrane
protein in a model membrane under the influence of various electric fields. The literature
available for the topics of interest in this research is rich: models of biological membranes,
supports for the membranes, ion channels and their interactions with lipids. To prepare a model
membrane that possesses proper structural features, is able to insert proteins, and has desired
capacitance, it is necessary to study biological membranes. Therefore, the first section of this
chapter will review biological membranes. The second section will review model membranes
and possible support systems for them. In this thesis, the model membrane is composed of
DPhPC phospholipid and its interaction with Alamethicin peptide is studied. Therefore, the final
section will present literature on Alamethicin.
2.2 Biological membranes
2.2.1 Properties and Structure
Biological membranes are an assembly of lipids and proteins that form a fundamental
part of all living organisms. They are bilayer structures that create semi-permeable boundaries of
a biological cell and are bound together by non-covalent bonds (1). This bilayer is composed
mostly of phospholipids that have a polar head group pointing outward and a non-polar tail
group forming the inner core. Cell membranes are described as a fluid mosaic that allows lateral
movement of molecules in the plane of the membrane (3). The bilayer is typically 5nm thick and
7
contains a variety of molecules that have specific functions for the cell (2). One class of
molecules with special importance to this study are proteins (Figure 2.1). There are peripheral
proteins anchored to one of the sides of the bilayer and integral proteins that are embedded into
the bilayer. Peripheral proteins act as receptors for receiving and transducing chemical signals
and integral proteins regulate transport of molecules in and out of the cell. However, there are
many other types of molecules with even more functions in the membrane which results in
making a very complicated system that is difficult to study.
Figure 2.1: Schematic of a typical biological cell membrane (adapted from ref. 1a).
8
2.2.2 Membrane phospholipids
The lipid bilayer is the core of the cell membrane structure. There are three major types
of lipids present in the bilayer: glycolipids, cholesterol, and phospholipids. Phospholipids are the
most abundant lipids due to their favorable structure that readily forms bilayers. These
amphiphilic lipids have a hydrophilic head group and a hydrophobic tail group connected by a
glycerol backbone (see Figure 2.2). The head group is polar and consists of a negatively charged
phosphate group and an additional group attached to it like a choline, serine or glycerol. The tail
group is nonpolar and consists of two hydrocarbon chains that can have many variations. The
variations in tail groups include length of acyl chains (from 14 to 24 carbon atoms), degree of
saturation or types of substituent groups bonded to the main carbon chain. The variations in head
groups could be from head group size, atomic composition, charge, and polarity. Varying these
parameters influences diverse physical properties to the aggregates they form (4).
9
Figure 2.2: Schematic of a typical phospholipid with head group on top and tail group on the
bottom (adapted from ref. 1a).
10
The amphiphilic nature of phospholipids causes them to aggregate in polar and non-polar
solvents. In polar solvents, the hydrophobicity of the tails causes aggregation. The geometry of
the aggregates depends on the critical packing parameter (p) of the phospholipid monomers.
Packing parameter is the ratio of the volume of a cylinder (V) circumscribed by the motion of the
tails to the volume of a cylinder of radius (r0) equal to that of the head group (4):
(2.1)
where l is the length of the hydrocarbon tails. Values of the packing parameters close to unity
provide planar bilayer structures (4). A lamellar lipid bilayer can exist either in the liquid
crystalline phase or gel phase. In the gel phase, the bilayer is rigid, packed closely in an ordered
all trans conformation. At the liquid crystalline phase the bilayer is loosely packed, lipids occupy
more volume and are more mobile (2). The two phases are separated by phase transition
temperature that depends on the specific phospholipid structure.
2.2.3 Electrical properties
The movement of ions in and out of a biological cell is a fundamental mechanism that is
a part of many physiological processes like nerve signaling, muscle contraction and energy
transduction (6). However, the hydrocarbon interior of the membrane that is made up of nonpolar tail groups presents a barrier to the movement of ions and polar substances. This is
resolved by proteins embedded into the lipid bilayer matrix that function as ion channels
allowing flow through the membrane. Moreover, these ion channels must not only allow but also
regulate the flow of ions so that, for example, muscles are not in a continual state of contraction
11
or relaxation (6). To do this, ion channels must open or close in response to external parameters
causing a change in conformation. The conformation of these proteins is dependent on the
electric potential profile across the membrane.
The electric potential profile of a membrane is a complex system that depends on the
transmembrane potential, surface potential and dipole potential. The transmembrane potential is
the overall difference in potential caused by the difference in anion and cation concentrations in
the two bulk phases separated by the membrane. The transmembrane potential is quite easy to
measure experimentally using electrodes and ranges from -10 to -250 mV across a membrane 57nm thick (7). The transmembrane potential imposes an electric field strength of approximately 2x10⁶ to -5x10⁷ Vm-1 on molecules of the cell membrane. The surface potential is due to the
charged lipid headgroups at the surface that control the anion and cation concentration at the
membrane-solution interface. Surface potential of the membrane is approximately 60 mV within
1 nm from the surface and imposes an electric field strength of 2x10⁷ Vm-1 (7). The dipole
potential is due to the alignment of dipolar residues of the lipids or water dipoles in the
hydrocarbon core of the bilayer. It is the only potential that cannot be measured in an experiment
and has to be calculated theoretically. A phosphatidylcholine bilayer yields a dipole potential in
the range of 220-280 mV positive in the interior of the membrane (6). The electric field strength
produced by the dipole potential is especially large, in the range of 108-109 Vm-1, because it
drops across a very small distance. This means the dipole potential has an effect on the
orientation of charged protein segment not only in the core of the bilayer but also in the head
group region of the membrane.
12
2.3 Model Membranes
Due to the complexity inherent in biological cell membranes, it is difficult and sometimes
impossible to study processes that occur on the membrane surface (8). However, an artificial
membrane which is a simplified version of biological membranes would make it possible to
design an experiment to study a specific desired feature. Because natural membranes are exposed
to electric fields in the range of 107-108 Vm-1 as stated above, we can apply similar electric fields
and study their effect on the bilayer structure and incorporation of proteins into it. In this section,
the choice of lipid and support will be discussed as well as methods to investigate the model
membrane and embedded proteins.
2.3.1 DPhPC Phospholipid membranes
In selecting an appropriate phospholipid, we are looking for a bilayer structure to form at
standard conditions. The phospholipid used in this study is 1,2-diphytanoyl-sn-glycero-3phosphocholine (DPhPC). DPhPC is a zwitterionic molecule that has a negatively charged
phosphate group, positively charged choline group, and two 16 carbon saturated acyl chains (see
Figure 2.2). It also has a packing parameter close to one due to methyl side chains attached to
every third carbon in the tails. Therefore, DPhPC bilayers have high stability and low ion
leakage (5). These lipids are naturally found in the cellular membranes of extremophiles such as
archaebacteria that are adapted to harsh environments (4). The temperature at which the phase
transition occurs for DPhPC is 41° (4).
13
Figure
2.3:
Schematic
of
the
1,2-diphytanoyl-sn-glycero-3-phosphocholine
(DPhPC)
phospholipid.
2.3.2 Support systems
Early mimics of biological cell membranes were produced by Mueller et al, where they
created a free standing model membrane inside a circular Teflon ring and termed it black lipid
membrane (9). The membrane appeared black when viewed by reflected light which led to its
naming. BLMs have been widely used as matrices for the incorporation of integral proteins and
other biomolecules involved in biophysical, biochemical and physiological studies (11). BLMs
are most appropriate for detecting minor changes in conductance (10). Even though BLMs have
contributed a lot to the current understanding of membranes and are still being used presently,
they do have limitations. Due to being free standing, BLMs are highly sensitive to vibrations,
high electric fields, and have a very short lifetime of 8 hours (11). Moreover, surface sensitive
analytical techniques cannot be performed on them. The drawbacks of the black lipid membrane
can be solved by forming the film on a solid support.
Solid supported membranes are of practical and scientific interest due to their many
advantages (12-17). Reviewed by Sackman in 1996, solid supported bilayers offer long term
14
stability and easy manipulation which allows for investigations with surface sensitive and other
analytical techniques (12). In addition, depositing the bilayers on a metal or semiconductor
substrate allows electrochemical studies to be applied at the same time. Electrochemical
experiments give insight into the influence of applied electric fields on the structure and function
of membranes (13). A disadvantage of using solid support is the lack of fluidity of the membrane
since it is attached to a solid substrate. Especially on metal substrates such as gold used in this
research, there is no mobility at all (14). Another disadvantage is the lack of a water reservoir on
the substrate side of the membrane which prevents studies of ion transport and complete
insertion of certain pore forming proteins due to their denaturation upon contact with metal
substrate (8). Solid substrates will be used for this research.
2.3.3 Deposition methods
Supported phospholipid membranes (SPMs) are essentially made by two different
methods: vesicle spreading and Langmuir-Blodgett technique (18). Vesicle spreading is typically
done by creating a vesicle suspension and depositing it on a hydrophilic substrate allowing it
fuse and rupture. Many methods of vesicle preparation exist, but most of them first involve
drying a lipid in a desired glass vessel. The variations in the preparation method begin when the
solvent is added to hydrate the lipids to create a suspension (19).
15
Figure 2.4: Diagram of layer of dried phospholipid on the walls of a glass vessel and process of
phospholipid hydration and formation of vesicle (19).
It has been shown that DPhPC phospholipids tend to form vesicles upon hydration (19).
Hydration of the dry lipids in the wall of a test tube cause the formation of a convex lipid
surface, with greater values for lipids closer to the solvent or further from the inner test tube
wall. Convexity of the lipids increase as hydration proceeds, and agitation of the hydrated film
causes formation of defects as lipids attempt to reorient into more stable configurations. The
defects on the lipids make them break off and form oval shaped vesicles (19). The oval shaped
vesicles eventually become spherical as lipid monomers in the outer lamella migrate to those of
the interior in order to decrease the free energy.
16
Figure 2.5: Diagram for process of vesicle rupture after it is adhered on the desired
substrate (adapted from ref. 20)
A drop of this solution would be placed on the desired substrate to let the vesicles settle
and adhere to the surface. Following the adhesion, lipid vesicles would fuse with adjacent
vesicles and eventually rupture to form a layer over the surface. To rupture, the radius of the
vesicles would have to be greater than a threshold radius (20).
While vesicle spreading is suitable for ATR experiments to determine IR signature and
obtain preliminary information about lipid and peptide conformations, it does have disadvantages
that make it unsuitable for PMIRRAS experiments. For example, some vesicles may not fuse or
form multilayers on the substrate (18). Therefore, Langmuir Blodgett technique will also be used
to create a single lipid bilayer directly on the gold substrate when combined with LangmuirSchaeffer technique.
17
2.3.4 Characterization of lipids and proteins
Some popular methods to investigate solid supported bilayers are Surface Plasmon
Resonance, Neutron Reflectivity, Infrared Reflection Adsorption Spectroscopy, Atomic Force
Microscopy and Scanning Tunneling Microscopy among others (15). These techniques have
given insight into the structure organization, phase transitions, and protein adsorption and
interaction with membranes on a solid support (16). IR spectroscopy is a powerful method that
can be used to determine the conformation and orientation of membrane associated proteins and
lipids (21). Polarized infrared spectroscopy allows investigation of chemical groupings and
substructures within membrane molecules which is difficult to obtain by other methods. It is
especially useful to image proteins in physiological conditions to see their true conformation or
they would denature and lose that conformation. Unlike in other techniques, the presence of a
phospholipid bilayer does not limit spectroscopic resolution or sensitivity. Thus, a wealth of
information can be gained by looking at band positions, bandwidths and absorption coefficients
of IR spectra.
ATR-FTIR spectroscopy is a popular IR method that has many advantages: orientation of
membrane molecules can be easily obtained using polarized right, the technique is very sensitive
even for sub-milligram quantities of sample, conformational states can be measured in aqueous
environments, and physiological conditions of a sample can be altered in situ (21). ATR will be
used to determine IR signatures of the peptide and obtain preliminary orientations of lipids and
peptides. Polarized modulation infrared reflection absorption spectroscopy (PMIRRAS) is
another IR method that allows in situ measurements of conformational states while changing
potential. It was recently used in our laboratory to measure orientation of gramicidin peptide in a
tethered lipid membrane (22).
18
IR studies of membranes usually interrogate the tail group or head group of the
phospholipid molecule. Vibrational spectra of those regions can provide structural and dynamic
information about the lipids in the system. Tail group region of the spectra provides information
about the overall order and fluidity of the membrane. Orientation of the tails is generally
accepted as the average tilt of the entire bilayer due to the lipid being the main component of the
membrane and because uniaxial distribution of the chains is assumed (23). Research on the tail
group region has revealed information about the phase transition behavior of phospholipid
bilayers. The gel to liquid crystalline phase transition of phospholipids can be monitored with IR
spectroscopy because the tails become more ordered due to the decrease in tail mobility.
Head groups can give information about the hydration of the membrane and interactions
with the surrounding water. The head group consists of ester glycerols, the phosphate, and the
choline group. The bands for these vibrations are shown below in Table 2.1 below. The peak
position of the phosphate has been shown to increase by 20cm-1 transitioning from a hydrated to
a dehydrated bilayer (24). A wealth of other information can be gained about membranes using
IR spectroscopy including information about protein structure and conformation.
IR studies can also interrogate the secondary structure and composition of peptides in
membranes with virtually no interference from the lipids using appropriate experimental setup.
The band of most importance in peptides is in the amide I region of the mid-IR spectrum (16001700cm-1). This band represents the C=O bond connecting the amino acids and therefore gives
information about the conformation of the entire peptide.
19
Table 2.1: Group modes and corresponding vibrational modes for lipids and protein amides.
2.3 Transmembrane proteins
As discussed in the previous section there are different kinds of proteins that are involved
in the function of cell membranes. Transmembrane proteins function as ion channels and are
present in virtually all cell membranes. Ion channels serve as a means of transport for molecules
in and out of the cell. They maintain a balance of charge in the cell and also provide cell
communication with neighboring cells (25). There is great interest in research into
transmembrane proteins due to their involvement in human physiology (25).
20
Antimicrobial peptides (AMPs) are a subtype of potential antibiotics which are found in
all classes of life. AMPs are part of immune response against fungi, viruses, and both Grampositive and Gram-negative bacteria (26). They are also a good testing ground for experimental
techniques due to their relative structural simplicity (30). AMPs are effective in their role as
antibiotics because they disrupt the cell membrane which causes cell lysis. This method of
function makes it difficult for bacteria to develop resistance to these peptides unlike conventional
antibiotics which bind to a specific sites affecting cellular metabolism (26). There are two main
common membrane disrupting models of AMPs. The carpet model involves the proteins
spreading over the membrane like a carpet and thinning it. The barrel stave and torroidal pore
models involve the proteins penetrating into the membrane, forming pores and weakening the
membrane (26). A subclass of short chain peptides called peptaibols are isolated from fungi and
have gained much interest lately due to their antimicrobial activity (26). The most widely studied
peptaibol is alamethicin and this peptide was investigated in this research. The overview of its
structure and properties are described in the next section.
2.3.2 Alamethicin ion channels
Alamethicin is a 20 amino acid antimicrobial peptaibol isolated from the fungus
Trichoderma Viride in 1967 by Meyer and Reusser (29). It is believed to affect the quality of
pasture land through effects on the bacterial contents of ruminant animal stomachs (33).
Alamethicin’s structure is mostly α-helical due to the high content of helix inducing
aminoisobutyric acid (Aib) residue (26). Aib is also referred to as alpha-methyl alanine and the
prevalence of this unusual amino acid is the reason for the name alamethicin (33). Due to the
21
short and simple structure of the peptide and its voltage dependent conductance it has been an
ideal sample for studying voltage gated conformational changes, transmembrane ion movement,
and helix-lipid interactions as a model for more complex membrane proteins (30, 34). The
sequence of the peptide is:
Ac-Aib-L-Pro-Aib-L-Ala-Aib-L-Ala-L-Gln-Aib-L-Val-Aib-Gly-L-Leu-Aib-L-Pro-LVal-Aib-Aib-L-Glx-L-Gln-L-Phol. (39)
Figure 2.6: Proposed structure of alamethicin (adapted from ref. 42)
22
While it is clear that no technique can give complete molecular structural information
about this multi-component and fluid system of proteins and lipids, various methods have been
investigated. The crystal structure of alamethicin was solved by Fox and Richards using X-ray
crystallography (28). The helical conformation length of the peptide is 33 Å and the Pro14
residue causes a bend in the helix.
The common form of alamethicin is termed Rf50 because of the Gln at position 18 and is
used in most experiments (33). If the position 18 amino acid is Glu then it is termed Rf30. Both
Rf50 and Rf30 are naturally occurring. Despite its small size alamethicin can show quite
complex channel forming behaviour. The voltage gated channel forming properties of the
peptide were recognized in 1968 by Mueller and Rudin (31). It inserts via the N-terminus in
response to external voltage (30). Experimental results indicate that alamethicin remains in the
transmembrane region with the N-terminus partially buried in the hydrophobic core of the
membrane and C-terminus hydrogen bonded to the lipid head groups or water (30). NMR studies
of alamethicin in a DMPC phospholipid bilayer showed that alamethicin has a largely helical
structure spanning the membrane (34). The helix exhibits a tilt angle of 10-20° relative to the
bilayer normal to match the hydrophobic thickness of the bilayer (34).
The conformation of the peptides in lipid also has a large dependence on temperature,
humidity, and peptide to lipid ratio (P/L) (30). He et al. have demonstrated that alamethicin
initially adsorbs to the membrane surface at low peptide concentrations. Concentrations at which
alamethicin begins to inhibit growth is at least two orders of magnitude greater than the
concentrations required to induce voltage dependent activity in bilayers (36). At a P/L ratio of
1/40 which is dependent on the lipid of choice the alamethicin begins inserting into the
membrane. At a critical ratio of 1/15 all of the alamethicin inserts into the membrane and forms
23
well defined pores detected by neutron in-plane scattering (27). It has been shown using X-ray
diffraction that the membrane undergoes thinning during alamethicin adsorption to the surface.
However when the P/L ratio gets larger, starting at 1/23 the membrane thickness begins to
increase again until insertion is at 100%. Circular dichroism studies on alamethicin in DOPC
membranes have shown that at lower temperatures alamethicin forms membrane spanning
channels while at higher temperatures monomeric states are more favoured (37).
Extensive molecular dynamics experiments have been performed on alamethicin and
similar alpha helical peptides (32, 40, 41). Biggin and Sansom used CHARMm program to
simulate voltage dependent interaction of α-helices with a lipid bilayer. First they observed from
simulations that there is a 20° kink between the α-helix and 310 helix, caused by the central
proline even if simulations start with an idealized unkinked helix. This suggests that this
represents a stable conformation of the molecule (40). Due to the difficulty of measuring
conformation with an applied transbilayer voltage there has been a lack of data to the early
events of voltage dependent channel formation. Therefore, possible insertion mechanisms were
studied with the presence of a sample bilayer and transbilayer voltage. In the absence of a
transmembrane voltage the alamethicin molecules spontaneously insert themselves into the
bilayer. Applying a cis positive voltage facilitates the helix insertion causing it to occur earlier in
the simulation (Figure 2.7). The N-terminus inserts while the C-terminus acts as an anchor at the
bilayer surface. During the insertion the molecule also straightens reducing the kink angle, which
has also been observed with MD simulations of other peptides (40).
24
Figure 2.7: Visualization of proposed events during a MD study of alamethicin in a lipid bilayer
(40).
Direct visualization of alamethicin was done in our lab by Piotr Pieta using EC-STM
(Figure 2.8) (35). The EC-STM images showed individual peptide molecules forming channels
composed of six alamethicin molecules. The channels agglomerate forming 2D nanocrystals with
a hexagonal lattice where the average distance between channels is 1.9nm. The images suggest
that alamethicin molecules are shared between two different channels. Also the barrel stave
model of pore formation is validated for alamethicin channels by the obtained images (35).
25
Figure 2.8: EC-STM images of alamethicin inserted into lipid monolayer (35).
Sum frequency generation vibrational spectroscopy along with ATR was used to study
the mechanism of ion channel gating of alamethicin by Ye et al. in 2012 (38). The study was
performed with POPC model membrane in the presence of a small electric potential across the
membrane. The membrane potential difference was altered by controlling the pH of the solution
on top of the bilayer and measured using fluorescence spectroscopy. The orientation of the
alamethicin peptide was determined at different pH values using SFG amide I spectra. At pH 6.7
the alpha helix at the N-terminus and the helix at the C-terminus tilt was about 72° (θ1) and 50°
(θ2) versus surface normal, respectively, assuming a δ distribution (Figure 2.9). When pH is
increased to 11.9, the two angles θ1 and θ2 decrease to 56.5° and 45°, respectively. A schematic
for the θ1 and θ2 changes can be seen in Figure 2.7 (31). It was verified using SFG and ATRFTIR measurements that all molecules adopt a narrow distribution of tilt angles for θ 1 at both
26
pHs (31). The pH change equalled to about -16.2mV which is not significant and was not enough
to open the channel completely.
Figure 2.9: Schematic for the angles and orientation of alamethicin at different pHs (38).
An in situ study of alamethicin’s conformational changes in a membrane under a larger
range of varying potentials is still lacking. PMIRRAS has been used in our lab previously to
study conformational changes in gramicidin molecules under changing applied potential.
Therefore using PMIRRAS to study conformational changes under a broader range of applied
potentials would add to the current knowledge of pore forming mechanism of alamethicin and
antimicrobial peptides in general.
27
2.5 References:
1 Alberts, B.; Johnson, A.; Lewis, J.; Raff, M.; Roberts, K.; Walter, P. Molecular Biology of the
Cell 4th Edition, 2002, Garland Science, New York
1a Vance, D.E.; Vance, J.E. Biochemistry of Lipids, Lipoproteins and Membranes 5th Ed.
Elsevier: Oxford, 2008
2 Yeagle, P.L. The Structure of Biological Membranes 3rd Edition, 2012, CRC Press, Boca Raton
3 Singer, S.J.; Nicolson, G.L. Science, 1972, 175, 23, 720
4 R. Seenath, MSc Thesis, University of Guelph, 2011
5 Hsieh C., Sue S., Lyu P., Wu W. Biophys J. 1997 August; 73(2): 870–877
6 Clarke, R.J., Adv. Colloid Interface Sci. 2001, 89-90, 263
7 Tsong, T.Y. Annual Review Physiol., 1998, 50, 273
8 A. Kycia, Ph.D. Thesis, University of Guelph, 2010
9 Mueller, P.; Rudin, D.O.; Tien, H.T.; Wescott, W.C. Nature 1962, 194, 979
10 Winterhalter, M. Current Opinion in Colloid & Interface Science 2000, 5, 250
11 Guidelli, R.; Aloisi, G.; Becucci, L.; Dolfi, A.; Moncelli, M.R.; Buoninsegni, F.T. Journal of
Electroanalytical Chemistry 2001, 504, 1
12 Sackmann, E. Science 1996, 271, 43
13 Chen, M.; Li, M.; Brosseau, C.L.; Lipkowski, J. Langmuir 2009, 25, 1028
28
14 Groves, J.T.; Ulman, N.; Cremer, P.S.; Boxer, S.G. Langmuir, 1998 14, 3347
15 Lipkowski, J. Physical Chemistry Chemical Physics 2010, 12, 13874
16 Tanaka, M.; Sackmann, E. Nature 2005, 437, 656
17 Brain, A. A.; McConnell, H.M.; Proc Natl Acad Sci USA 1984, 81, 6159
18 Nollert, P.; Kiefer, H.; Jahnig, F. Biophysical Journal. 1995. 69, 1447.
19 Lasic, D. D. Biochemistry. J. (1988) 256, 1
20 Reviakine, I.; Brisson, A. Langmuir. (2000) 16, 1806
21 Tamm, L.; Tatulian, S. Quarterly Reviews of Biophysics. (1997) 30, 365
22 Goodall, B. M.Sc. Thesis. 2014. University of Guelph
23 Laredo, T. Ph.D. Thesis. 2009. University of Guelph
24 Fringeli, U.P.; Günthard, H.H. Infrared membrane spectroscopy, in E. Grell, Ed., Membrane
Spectroscopy, Springer: New York, 1981
25 Hille, B. Ion Channels of Excitable Membranes 3rd Ed. Sinauer Associates Inc:
Massachusetts, 2002
26 Hjorringgaard, C. et al. Journal of Physical Chemistry. 2012. 116, 7652.
27 He, K.; Ludtke, S.; Heller, W.; H. Huang. Biophysical J. 1996. 71, 2669.
28 Fox, R.; Richards, F. Nature 1982, 300, 325-330
29 Meyer, C.E.; Reusser, F. Experientia. 1967. 23(2), 85.
29
30 Salditt, T.; Li, C.; Spaar, A. Biochimia et Biophysica Acta. 2006. 1758, 1483.
31 Mueller, P.; Rudin, D. Nature 1968, 217, 713.
32 Biggin, P.C.; Sansom M.S.P. Biophysical Chemistry. 1996. 60, 99.
33 Woolley, G.A.; Wallace, B.A. Journal of Membrane Biology. 1992. 129(2), 109.
34 Bak, M. et al. Biophysics J. 2001. 81, 1684.
35 Pieta, P.; Mirza, J.; Lipkowski, J. PNAS. 2012. 109 (52), 21223.
36 Jen et al. Journal of Applied Bacteriol.1987. 63, 293.
37 Woolley, G.A.; Wallace, B.A. Biochemistry. 1993. 32, 9819.
38 Ye S. et al. JACS. 2012. 134, 6237.
39 Pandey, R. et al. JACS. 1977. 99, 8467.
40 Biggin, P.C. et al. Biophysical Journal. 1997. 72, 627.
41 Tieleman, D.P.; Berendsen, H.; Sansom, M. Biophysical Journal. 2001. 80, 331.
42 Cafiso, D. Annu. Rev. Biophys. Biomol. Struct. 1994. 23, 141.
30
Chapter 3: Theory
3.1 Electrochemistry
3.1.1 The electrical double layer
3.1.2 The Gibbs Adsorption Isotherm
3.2 Langmuir Blodgett Deposition
3.2.1 Principles
3.2.2 Compression isotherms
3.2.3 Bilayer formation
3.3 IR Spectroscopy
3.3.1 FTIR Spectroscopy
3.3.2 Michelson interferometer
3.3.3 ATR-IR Spectroscopy
3.3.4 PMIRRAS
3.4 References
31
Chapter 3: Theory
3.1 Electrochemistry
Electrochemistry is the branch of chemistry that deals with the interrelation of electrical
and chemical effects that usually take place at the interface of an electronic conductor, the
electrode and an ionic conductor, the electrolyte. Faradaic and non-faradaic processes make up
the two main types of electrochemistry. Faradaic processes involve a net charge transfer between
the metal and the electrolyte and this transfer causes oxidation or reduction to occur. This net
charge transfer is important in batteries and fuel cells.
For certain types of interfaces charge transfer reactions will be thermodynamically or
kinetically unfavorable under a range of potentials. However, other processes will still occur
such as adsorption or desorption and the structure of the electrode-solution interface will change
with potential or type of electrolyte. These processes are called non-faradaic processes, and
although charge does not cross the interface, external currents can flow when potential, electrode
area or types of electrolyte change. Therefore non-faradaic processes are important in
determining phase transition changes of the membrane that are independent of change in
oxidation state. Non-faradaic processes are of main importance to this research since our
membrane is directly adsorbed on the gold electrode and the main approach is to study the
behavior of the membrane as a function of the electric field in a potential range when the
interface between the metal and the solution behaves like an ideal capacitor.
3.1.1 The electrical double layer
32
The electrical double layer exists at the interface between the metal electrode and the
liquid electrolyte solution. It is formed due to the separation of charged particles and oriented
dipoles at the interface. Several models have been proposed to describe the structure of the
double layer. The models assume that there is no charge transfer occurring across the metal and
electrolyte interface. An electrode at which no charge transfer occurs across the metal-solution
interface at a given potential is called an ideal polarizable electrode. No electrodes can act as
IPE’s across all potentials but some can in limited potentials ranges. Gold is a good example of
an ideally polarizable electrode in a broad range of potentials in an oxygen free electrolyte
solution.
One of the initial models of the electrical double layer was proposed by Helmholtz in
1879. Helmholtz proposed that there are two sheets of charge that have opposite polarity at the
interface separated by a very small distance. The first sheet consists of the excess charges from
the metallic phase since the metallic electrode is a good conductor and it does not support
electric fields in its bulk. The second sheet consists of the counter charges from the bulk of the
solution. The Helmholtz model is seen in Figure 3.1.
33
Figure 3.1: A Helmholtz model on the left B Graham model on the right.
We can relate this structure to that of a parallel plate capacitor where the stored charge
density is defined as:
(3.1)
where ε is the dielectric constant of the medium, ε0 is the permittivity of free space, d is the
distance between the plates, and V is the voltage drop between the plates. Therefore,
the differential capacitance (Cd) is:
(3.2)
Thus, the Helmholtz theory shows the potential drop across the double layer is linear.
However, this is not entirely accurate when electrolyte concentration decreases, the double layer
thickness increases and the differential capacitance becomes smaller. Therefore, it does not
34
explain the dependence of capacity on the concentration of the electrolyte and on the electrode
potential. So this model is only valid in cases where concentrated electrolyte exists and large
charges are on the electrode.
Graham model developed later in 1947 improves the Helmholtz model by stating there
are more components to the system that just the two sheets of opposing charges (1). Those
components are:
1. Bulk of the metal phase
2. The layer of excess charge at the metal electrode surface which can be controlled by changing
the electrode potential. Its thickness is on the order of 0.1nm.
3. A layer of adsorbed ions that have been stripped of their solvation shell and therefore are in
direct contact with the metal electrode surface. The inner Helmholtz plane begins at the center of
these adsorbed ions. The outer Helmholtz layer begins at the center of the ions that approach the
electrode retaining their solvation shell. There may also exist a thin layer of neutral molecules
between the metal surface and the outer Helmholtz layer. The thickness of the inner layer is on
the order of 1nm.
4. A diffuse layer that goes from the outer Helmholtz plane to the bulk solution where charges of
both signs exist but one sign dominates. This difference in concentrations of each charge helps
balance charge density on the metal side of the interface. Ionic concentration of the solution
dictates the thickness of the diffuse layer. The thickness of the diffuse layer may range from
nanometers to micrometers depending on the electrolyte concentration.
35
The charge on the electrode side of the interface is balanced by the compensating charge
on the inner layer and diffuse layer. In the absence of specific adsorption, the electroneutrality of
the double layer is expressed by:
(3.3)
The total capacitance (Cdl) is now the sum of the capacitance of the inner (CH) and diffuse
(Cd) layers in series:
(3.4)
(
where
)
(
)
is the potential drop across the diffuse part of the double layer. If this value is large the
last term in the equation is very small and negligible making Cdl independent of the electrolyte
concentration. However, at low values of
the last term dominates the value of Cdl. The
smallest drop in potential across the interface occurs around the potential of zero charge. At this
point, there is no excess charge on the metal side of the interface and
the last term in the equation to be at its maximum. Therefore, when
is at its minimum and
is close to zero, the
capacitance of the double layer is determined by the capacitance of the diffuse layer.
3.1.2 The Gibbs Adsorption Isotherm
A lot of information can be obtained about the double layer by measuring macroscopic
and equilibrium properties such as interfacial capacitance and surface tension. In particular we
are interested in how applying potential will change these properties. A thermodynamic approach
36
will be used to describe the behavior of adsorbed species on the gold electrode.
Gibbs
adsorption isotherm is important here because it describes interfaces and can be used to obtain
the electrocapillary equation which describes the properties of electrochemical interfaces more
particularly.
The properties of the interface are governed by the excesses and deficiencies in the
concentrations of charges stated in the last section. This implies there is a difference in the
quantities of various components in the interfacial region as opposed to the bulk region. The
difference between these quantities is called surface excess quantities. Surface excess quantities
can be defined for any extensive variable such as number of moles of any species. Surface
tension is a measure of the energy required to produce a unit area of added surface. Surface
tension can be visualized by looking at a two-dimensional soap bubble within a wire frame with
a frictionless piston as shown in Fig. 3.2.
As the barrier is moved to create a displacement dx the work can be expressed as
(3.5)
Therefore, surface tension is considered as the energy needed to increase the amount of
interfacial surface by a unit area. It can be shown thermodynamically that surface tension can be
altered by changing the concentration of various species in the interfacial region. At constant
temperature and pressure the change in surface tension can be related to the change in applied
potential by using the Gibbs adsorption isotherm. The Gibbs adsorption isotherm states that
species that have a positive Gibbs excess decrease the surface tension of the interface (2):
∑
(3.6)
37
where
is the surface excess concentration of the adsorbed species j and
is the
electrochemical potential.
Using the Gibbs adsorption isotherm we can derive the electrocapillary equation which
gives more detailed information about the thermodynamics of adsorption at a metal-solution
interface (2):
(
)
(3.7)
Gold Au(111) electrode will be the suitable choice for substrate to use for these
experiments because of several factors. The first is because it is inert meaning it will not oxidize
in an electrolyte. A single crystal of gold will exhibit a planar surface providing us a relatively
flat and defect free bilayer of phospholipids. In addition the single crystal surface will ensure a
uniform charge density on the metal. It can act as an ideal capacitor for a large range of electrode
potentials allowing us to perform our electrochemical experiments in situ. Finally, it allows us to
perform surface sensitive spectroscopic techniques because it is isotropic.
3.2 Langmuir Blodgett Deposition
The Langmuir Blodgett deposition technique was the main method of creating bilayers
for this project. A brief overview of the history and principles of the technique will be outlined in
this section. A series of studies were done on floating monolayers of long acyl chains in the late
1910s by Irwing Langmuir on water (6). He created a trough in which he deposited these fatty
acids on water to study their phases while changing the surface area of the water. In the trough,
he discovered he was creating monolayer films with hydrophobic groups in the air and
38
hydrophilic groups turned to the water. The trough and monolayer films have been named after
Langmuir to be Langmuir troughs and Langmuir films. For his contributions to surface
chemistry, Langmuir was awarded the Nobel Prize in 1932.
3.2.1 Principles
In 1940s, Langmuir and Katherine Blodgett came up with a way to deposit monolayer
films or to make multilayer films on solid supports (7). These films on solid supports were
termed Langmuir-Blodgett (LB) films. This technique is based on the fact that certain molecules
are not soluble in water and are capable of spreading over the surface of the water creating a
monolayer film, phospholipids used in this project are an ideal type of spreading molecule
because they are amphiphilies: they have the hydrophilic head group which will be on the
surface of the water and a hydrophobic tail group which will orient away from the surface
causing all the monomers to have a similar organization. The stability of the monolayer depends
on the geometry of the head group and length of the tail group as well as the surface pressure of
the Langmuir film and the polarity of the amphiphile (7).
To determine the phase behavior of the amphiphilic molecules spread at the air/water
interface, a Wilhelmy plate is used to measure the surface pressure of water. The air/water
interface has different properties than that of either bulk phases. The amphiphilic molecules
experience a net attractive force toward the bulk of water which provides the excess free energy.
This free energy exhibited by surface molecules can be expressed in terms of Gibbs free energy
as (5):
( )
(3.8)
39
where
is the surface tension. Surface pressure therefore, is the difference in surface tension in
the absence and presence of molecules at the air/water interface such that (5):
(3.9)
3.2.2 Compression isotherms
Depending on the surface pressure the behavior of the amphiphilic molecules spread on
the water can vary from gas-like behavior to solid type behavior. In other words, their behavior
depends on how closely packed they are. By varying the surface area in which these molecules
can occupy we can monitor change in their behavior and relate these changes to the surface
pressure change. We can see the surface pressure as a function of surface area isotherm in Figure
3.2. At very low surface pressure, behavior of the molecules is gaseous like due to interactions
between molecules being nearly non-existent and there is a large water surface area available for
each molecule. This phase is called gaseous phase where the molecules behave as a twodimensional gas. When surface pressure is increased, molecules are in the liquid expanded phase
when they begin to exert pressure on each other. Molecules are in the liquid crystalline phase
next when they are closely packed and in their most upright position. The film can now be
treated as a two dimensional liquid crystal. Decreasing surface area further causes collapse of the
film into disorganized multilayers (3). Compression isotherms are important to understand what
surface pressures are needed to achieve liquid crystalline phase of the molecules so they can be
successfully deposited on solid substrates as Langmuir films.
40
Figure 3.2: Diagram of a compression isotherm (adapted from ref. 4).
3.2.3 Bilayer Formation
Langmuir Blodgett deposition was used to transfer the Langmuir film onto the solid
substrate or Au(111) electrode. In this technique, the substrate is moved upwards through the airwater interface by retraction. The monolayer whose hydrophilic head groups are on the water
surface interact with the substrate as it is raised and attach to it gradually forming a monolayer.
41
Another way to transfer the Langmuir film is by immersion of the substrate into the water to
allow the hydrophilic tails to interact and attach to the substrate surface. With these two methods,
many layers can be formed on the substrate.
The transfer ratio τ can be measured to determine the overall success of the transfer.
Transfer ratio is measured by dividing the decrease in area occupied by the monolayer on the
water surface by the area of the solid substrate which is should have coated:
(3.10)
where AL is the area of the water surface decrease and AS is the area of the substrate. The ideal
case is when τ is 1.0 which means perfect transfer of the monolayer to the substrate. However, a
value of 1.0 ± 0.1 for τ is sufficient to indicate a good transfer. A good transfer ratio value can be
achieved by carefully adjusting the compression rate to achieve desired surface pressure and
withdrawal speed of the substrate to allow good coverage.
For this project, the bilayer formed using LB technique will be deposited directly onto the
electrode surface providing a solid support. This kind of support has the advantages of giving
stability to the bilayer to reduce the amount of defects and increases the life of the membrane.
This mechanical stability allows for surface analytical experiments like PMIRRAS to be
performed with ease. Additionally, using an appropriate metal as the support allows
electrochemical techniques to be applied while performing surface analytical experiments. In
particular, this permits us to study membrane and peptide structure under varying electric fields.
A possible disadvantage to the solid support model is the presence of defects on the membrane
42
due to surface roughness of the electrode. However, this can be improved using a smooth
substrate.
The first leaflet of the bilayer was deposited using Langmuir Blodgett deposition. The
Au(111) substrate was vertically retracted from the subphase at a constant speed holding a
constant surface pressure for the Langmuir film. The second leaflet was deposited using
Langmuir Schaeffer technique or horizontal touch. In this method the gold electrode surface was
oriented to be parallel to the Langmuir film on the water surface and the gold electrode was
lowered slowly until it came into contact with the film. Then the electrode was immediately
withdrawn upwards at a slow speed. This allowed the hydrophobic tail groups to be oriented
towards the substrate and the polar headgroups towards the air. This bilayer was then dried and
ready to be characterized using PMIRRAS.
3.3 Infrared Spectroscopy
Since most of the experiments described in this thesis were performed using two infrared
spectroscopy techniques, a theoretical review of fundamentals of IR spectroscopy will begin this
section. Next, the principles of reflection spectroscopy will follow, and the two separate
techniques ATR-FTIR and PMIRRAS will be described at the end.
3.3.1 FTIR Spectroscopy
Infrared spectroscopy is the study of the interaction of infrared radiation with matter (2).
IR radiation takes up a portion of the electromagnetic spectrum and is divided into three regions;
43
near infrared, mid-infrared and far-infrared. The mid-infrared energy is in the region between
4000 cm-1 to 400 cm-1. The mid infrared frequency range overlaps with frequencies of atomic
vibrations, therefore it is the region of our interest. There are different ways a molecule can
vibrate, they are called vibrational modes. Each vibrational mode has its own corresponding
frequency. When the frequency of the radiation matches the natural frequency of the vibration,
and there is a change in the dipole moment of the molecule as a result of a molecular vibration,
the IR photon is absorbed and the amplitude of the vibration increases. Therefore IR
spectroscopy can be used to find information about covalent bonds in molecules. For example
the types of bonds that are present and the orientation and conformation of a molecule could be
determined.
Absorption of the incoming radiation happens when the energy of the radiation matches
the energy difference between the vibrational levels of the vibrational mode (2):
√
(3.11)
where Evib is the permited vibrational energy levels, kvib is the force constant of the vibrational
mode, and mvib is the reduced mass of the vibrational mode, and vvib is the frequency of the
vibrational mode (1). So we can relate the energy of the incident radiation to its frequency:
(3.12)
where vradiation is the frequency of the incident radiation. Therefore the absorption conditions can
be expressed in terms of the frequencies of the vibrational mode and incident radiation. When the
two frequencies are equivalent, absorption occurs (2):
44
√
(3.13)
Since the absorption frequency is dependent on the reduced mass and bond strength
characteristics of the vibrational mode, valuable information can be obtained from an absorption
frequency spectrum. Specifically, composition and structural information of biological molecules
can be obtained by analyzing the absorption frequency of individual vibrational modes. Even
more information can be obtained by applying the fact that absorption not only depends on the
magnitude of the transition dipole moment, but also on its direction. Absorption depends on the
scalar product of the vectors associated with the electric field of the incident radiation and the
transition dipole moment of the vibrational mode (8):
( ̅ 𝑒̅)
| ̅ | |𝑒̅ |
where A is the absorption,
(3.14)
is the transition dipole moment vector, 𝑒 is the electric field vector,
and θ is the angle between the two vectors. The magnitude of the vectors are expressed when
they are put in between two parallel bars. Looking at the cosine term, when the electric field and
transition dipole moment vectors are parallel, the angle is 0, cosine is 1 and absorption is at its
maximum. There is no absorption when the vectors are perpendicular and the cosine term is
equal to 0. When the vectors are at an angle between 0 and 90 the intensity of the absorption
band varies illustrating an inherent sensitivity of absorption to the orientation of the dipole
moment. Therefore, linearly polarized light can be employed to take advantage of this inherent
sensitivity to orientation to determine the orientation of biological molecules (8). Specifically,
the absorption band intensities will provide information about molecular orientation.
45
To actually collect the absorption spectrum early IR instruments were of the dispersive
type, they used prisms and grating monochromators. But they suffered from a slow scanning
process. Modern IR instruments use Fourier transform method to rapidly scan samples by
continuously monitoring all frequencies. Then the signal is Fourier transformed into a frequency
spectrum.
3.3.2 Michelson interferometer
The Michelson interferometer is a vital part of the instrument that allows collection of
multiple frequencies simultaneously and modulates the signal to bring high IR frequencies to a
detectable range (9). A diagram of the Michelson interferometer is shown in Fig. 3.3. The
interferometer uses a beamsplitter and two mirrors to split the infrared radiation into two
components and vary the path length of one component. The beamsplitter splits the beams into
two equal components that are sent to each of the mirror. One of the mirrors is movable and its
function is to introduce a path difference between the two IR beams, which in turn creates a
phase difference between the beams when they recombine at the beamsplitter.
46
Figure 3.3: Diagram of the Michelson Interferometer (adapted from ref. 4)
If the path difference between the beamsplitter and fixed mirror, and beamsplitter and
movable mirror are equal, then constructive interference occurs when the beams come together
in the beamsplitter and head to the detector. As the movable mirror moves, the converging beams
will be out of phase until they are 180° out of phase and path difference is ¼ λ. At this point,
destructive interference occurs and the signal arriving to the detector will equal zero. At other
path differences, a lesser degree of destructive interference will occur which will decrease the
signal. Therefore, as the mirror moves, the signal will oscillate like a cosine wave. Signal
intensity will be plotted with respect to path difference and it will result in an interferogram. We
can relate the intensity to path difference with the following equation (9):
( )
∫
( ̅)
(
̅ )
̅
(3.15)
47
where
( ̅ ) is the source intensity as a function of wavenumber ( ̅ ). This takes into account
distortions from the efficiency of the beamsplitter, as no beamsplitter can perfectly split a beam
50%-50% and the frequency dependence of the detector.
As stated before, the interferogram from one frequency will appear as a cosine function.
However, to obtain a full spectrum multiple frequencies need to be collected. The interferogram
will appear as a more complex function that depends on path difference. The Fourier transform
will convert the variation in signal intensity as a function of path difference to a variation in
signal intensity as a function of frequency (9):
( ̅)
∫
( )
(
̅ )
(3.16)
This will result in a typical IR spectrum. The Fourier transform method allows
simultaneous collection of all frequencies resulting in the acquisition of the complete frequency
spectrum with high throughput (2). The interferometer modulation also reduces the frequency of
the radiation to measurable levels since the ~1013-1014 Hz frequencies of IR radiation are too fast
to be measured by IR detectors. For example a mirror speed of 1.5cm/s will reduce the frequency
of incident ration from ~1013-1014 Hz to ~103-104 Hz.
Lipids and peptides contain bonds that absorb many different frequencies of IR radiation.
The IR spectra of lipids usually provide information about bonds in the tail group or head group
of the lipid molecule. Peaks of interest for this project are obtained from bonds in the acyl chains
of the tail group and are present around the 2900cm-1 region of the spectrum. They provide
information about the overall order and fluidity of the bilayer membrane. Because the chains are
the longest part of the phospholipid and in turn the bilayer membrane, and because uniaxial
48
distribution of the chains is assumed, the orientation of the acyl chains is considered as the
orientation of the bilayer itself. Other peaks that can be found from the phospholipid are from
bonds in the phosphate around 1200 cm-1 and choline group around 1400 cm-1.
For protein studies we can obtain peaks from the amide bonds which link the amino acids
together. The amide I region lies in the range of 1600-1700cm-1 and gives us information about
the conformation of the peptide. The shape, position and intensity of this band all play a role in
providing that information.
3.3.3 ATR-IR
The first method of IR spectroscopy that will be used in this project is attenuated total
reflection. This method allows us to take a spectrum of a sample at the surface of an internal
reflection element (IRE). The IRE is transparent in the mid IR region and has a high refractive
index, it is typically a prism made of zinc selenide or germanium. Total reflection occurs at the
IRE and sample interface. It has been shown that during the reflection process, a stationary
electric field penetrates a small distance into the less dense medium before being reflected. This
penetrated wave is called the evanescent wave (Figure 3.4). The sample couples with the
evanescent wave and absorbs some of the light resulting in attenuation of the wave. An infrared
spectrum can then be obtained by studying this attenuation.
49
Evanescent wave
Incident IR beam
Detector
Prism
Figure 3.4: Diagram of a typical ATR setup. The incident IR beam goes into the prism which is
typically made of ZnSe.
When a beam of radiation passes from a more dense medium to a less dense medium,
depending on incident angle, a part of it transmits and a part of it reflects (10). The fraction of
the reflected beam increases as the angle of incidence becomes larger. The relationship is
described by Snell’s Law:
(3.17)
where n1 and n2 are the refractive indices of medium 1 and 2, θ1 is the angle of incidence and θ2
is the angle of refraction, with respect to the interface normal. A diagram describing Snell’s law
is shown in Figure 3.5.
50
Figure 3.5: Diagram representing Snell’s Law (adapted from ref. 10).
Total reflection occurs when the incident beam is greater than a certain critical angle. The
critical angle can be determined by simply setting the angle of refraction to 90 with respect to the
normal. The following is the derivation for the critical angle θc :
(
)
(3.18)
(3.19)
(3.20)
51
(3.21)
When the incoming radiation is at the critical angle or higher, the evanescent wave
penetrates into the less dense medium, normal to the surface. The electric field amplitudes can be
calculated for three spatial directions in the less dense medium using experimental parameters.
The electric field amplitudes Ex, Ey, and Ez are defined as (10):
(
(
) (
)
(3.22)
)
(3.23)
(
)
(3.24)
(
) (
)
Where θ1 is the incident angle and n21=n2/n1. The x axis is parallel to the interface and incident
plane, y-axis is parallel to the interface but perpendicular to the incident plane, and z-axis lies
along the interface normal.
The evanescent wave decays with distance from the interface. The penetration depth of
the evanescent wave plays a major role in being able to study biological systems. The short
penetration length limits the strong absorption of water which would otherwise cause strong
saturation of absorption in the mid IR region. The penetration depth of the evanescent wave can
be determined by using the following equation (10):
52
(3.25)
√
(
)
where λ is the wavelength of the incident beam.
When the sample couples with the evanescent wave, the incident beam gets attenuated
allowing measurement of the spectrum and analyzing what frequencies were absorbed. Two
experimental conditions exist for ATR spectroscopy. The first is when the sample is thicker than
the penetration depth of the evanescent wave d>>dp, also called a thick film. The second is when
the sample is thinner than the penetration depth of the evanescent wave d<<dp, or thin film.
When dealing with thin films, a three phase approximation must be used to take into account the
prism, sample, and solution. The electric field is assumed to be constant over the thickness of the
sample. New electric field calculations must be performed at the interface to take into account
the third medium:
(
(
) (
)
(3.27)
)
(3.28)
(
)
(3.29)
(
) (
)
53
Where n1, n2 and n3 are the refractive indices of the first second and third media, n31=n3/n1,
n32=n3/n2 and θ1 is the incident angle of the beam. A diagram of this setup is shown in figure
3.6:
Penetration depth dp
Sample thickness d
n3
n2
n1
Incident IR beam
θ1
Figure 3.6: Diagram of three phase setup for ATR experiment.
With the third medium present in the setup, critical angle calculation must be altered
because it depends on the refractive index of the overlying layer n3 instead of thin film n2 (10):
(3.30)
Linearly polarized light must be used to determine the direction of the electric field
vectors at the interface and obtain information about the orientation of the sample at the surface
of the ATR crystal. Linearly polarized light is broken into two types: p-polarized and s-polarized.
P-polarized light has electric field vector parallel to the plane created by the incident and
reflected beams and contributes in the x and z directions as defined previously. S-polarized light
54
has electric field vector perpendicular to the plane of incidence and only contributes in the y
direction (8).
While the penetration depths are equal for p-polarized and s-polarized light, the strength
of the interaction between the sample and the evanescent wave are not. This is called effective
thickness. Effective thickness can be calculated for the two polarizations of light (10):
( )
( )
(
(
)(
(
)
)
)
(3.31)
(3.32)
where d is the thickness of the film.
Since the effective thicknesses can be calculated for both polarizations of light using
experimental parameters, orientation information can now be calculated as well. This can be
done by measuring the dichroic ratio. Dichroic ratio is the ratio of absorption of p-polarised light
to absorption of s-polarized light (11):
(3.33)
Where R is dichroic ratio, Ap and As are the absorptions of p-polarized and s-polarized light
respectively.
Dichroic ratio can also be calculated by taking the ratio of the effective thicknesses for p and spolarized light for randomly oriented isotropic samples:
55
(
)
(
)
(3.34)
The transition dipole order parameter Sdipole is used to identify the direction of the
transition dipole moment of sample’s molecular bonds with respect to surface normal. The
transition dipole order parameter can be calculated from the dichroic ratio and electric field
amplitudes (12):
(3.35)
If the molecule in question has a molecular axis and the angle between the transition
dipole moment and molecular axis is known, then the equation can be modified to directly solve
for the order parameter for the molecular axis as shown (12):
(
)(
)
(3.36)
where α is the angle between the vector of the transition dipole moment and the molecular axis
of interest.
The order parameters for the transition dipole moment and molecular axis can then be
used to determine the average angle of orientation for the transition dipole moment and
molecular axis using the following equations (8):
√
(3.37)
56
√
(3.38)
where θdipole and θaxis are the angles of orientation for the transition dipole moment and molecular
axis respectively. When the sample is randomly oriented, then the angle will be equal to 54.7°.
The dipole transition moments for this study are from the various vibrations made from
the CH bonds in the acyl chain region of phospholipids. The molecular axis is the acyl chain
itself which makes up for the majority of the phospholipid length and largely contributes to the
orientation of the phospholipid as a whole. For this project, ATR is the preliminary method of
gaining insight into the peaks of interest that would later be studied further with PMIRRAS.
3.3.4 PMIRRAS
Polarized modulation infrared reflection absorption spectroscopy is the second IR
characterization method used in this research. IRRAS technique developed by Greenler et al in
the 1960s proved to be a useful technique for analyzing ultrathin films deposited on a metallic
substrate (13). The main drawback caused by strong absorbance of IR radiation from electrolyte
solutions. To overcome this, PMIRRAS was developed in 1990s (14). This was done by
decreasing the thickness of the electrolyte layer to several micrometers by pressing the metal
electrode against the optical window. The incident IR beam has to travel through the optical
window to the electrolyte with the sample and gets reflected from the electrode surface. The
resulting spectrum obtained is comprised of the analyzed film as well as the electrolyte and has
to be separated. However it is difficult to obtain a background spectrum of just the electrolyte
with the same gap thickness. Therefore background correction is made using polarized
57
modulation. In this section, reflection, refraction, and absorption of electromagnetic radiation at a
simple two-phase boundary will be discussed first, followed by a description of polarized
modulation. The section will conclude with a method of determining orientation from PMIRRAS
spectra.
When a beam of IR light hits a surface of another medium, part of it reflected and a part
of it is transmitted into the second medium. The plane of incidence is the plane formed by the
incident and reflected beams. If the incident beam is split into p- and s- polarizations, each
polarization will have an electric field component pointing in different directions. P-polarized
light will have its electric field vectors perpendicular to the incident beam in the plane of
incidence. S-polarized light will have its electric field located perpendicular to the beam but in
the plane that is perpendicular to the plane of incidence.
As described earlier in section 3.3.3, when the value of the angle of the incident beam is
above the critical angle, total reflection takes place at the interface and the beam is no longer
transmitted into the second medium. The electric field at the boundary of the two media is a
vectorial sum of the fields from the incident and reflected beams. This sum either gives
enhancement of attenuation of the electric field depending on the phase shift of the reflected
wave. The phase shift of s-polarized light is -180° which results in the electric fields of the
incident and reflected waves cancelling each other out. This results in negligible mean square
electric field strength (MSEFS) for s-polarized radiation. For p-polarized radiation, the phase
shift is small when the incident angle is less than 80°. However, MSEFS increases with the angle
of incidence due to the increasing magnitude of the electric field components in the z-direction.
Figure 3.7 shows how the electric field components are attenuated for s-polarized waves due to
58
cancellation and enhanced for p-polarized waves due to the addition of the electric field vectors.
These two phenomena are known as surface selection rules for high reflective materials.
Figure 3.7: Illustration of the p and s- polarized light electric field vectors at the interface
(adapted from ref. 15).
In a PMIRRAS experiment, the IR beam must pass through a stratified media consisting
of four layers: the window material, a thin layer of electrolyte, thin film sample and the
electrode. A typical PMIRRAS setup is shown in Figure 3.8. The window material is transparent
to IR radiation but the other layers do absorb the IR radiation. To obtain orientational
information about the sample, the MSEFS must be calculated at every point in the bulk solution.
The MSEFS at a general point in the stratified medium can be derived using matrix algebra, this
derivation is too complex and can be found elsewhere (17). To determine the MSEFS,
measurable quantities such as gap thickness between the optical window and electrode, angle and
wavelength of the incident beam and optical constants of each layer is required. Since,
absorbance of an adsorbed film is proportional to the MSEFS of p-polarized light at the electrode
59
surface some of the parameters must also be modified to obtain the highest MSEFS. Once the
MSEFS is determined, quantitative information is ready to be extracted from the PMIRRAS
experiment.
Figure 3.8: PMIRRAS setup diagram. CE, counter electrode; TP, Teflon piston; RE, reference
electrode; WE, working electrode; OW, optical window; SP, static polarizer (adapted from ref.
15).
60
The vibrations of sample molecules absorb radiation proportional to the square of the
product of the electric field strength and the component parallel to this field of the molecule’s
dipole derivative with respect to the normal coordinate of vibration. The IR beam can strongly
interact with the vibrational modes of molecules containing dipole derivatives perpendicular to
the surface. However, the sensitivity to the parallel modes is much lower. For this reason, surface
section rules for metals play a big role in obtaining a spectrum of the sample without interference
from the electrolyte solution. The reflectivity of the s-polarized light is insensitive to the
adsorbed sample on the electrode because it is in the parallel mode. Therefore it can be used as a
background spectrum. The reflectivity of the p-polarized light is perpendicular to the surface so
it is strongly absorbed by the thin film sample and can be used to obtain the spectrum with the
sample. If the two spectra are collected simultaneously, it eliminates the inherent difficulty in
obtaining a spectrum without background. Taking a difference of the reflectivities also removes
absorptions from atmospheric molecules, such as water and carbon dioxide, because these
absorptions are effectively subtracted (15). The s- and p- polarizations are carried out at a high
frequency and the reflection absorption spectrum is obtained as (15):
|
〈 〉
(
|
)
(3.38)
where Rs and Rp represent the reflectivities of the s- and p-components of the modulated infrared
beam from the thin-layer cell.
Photoelastic modulation
The photoelastic modulation setup consists of the static polarizer and the photoelastic
modulator (PEM). The principle of operation of the PEM is based on the photoelastic effect,
61
where a mechanically stressed crystal such as ZnSe exhibits birefringence proportional to the
resulting strain. This strain originates from a piezoelectric transducer that is glued to the crystal.
The piezoelement converts a periodic applied voltage to a periodic mechanical wave that
compresses or expands the crystal. The PEM vibrates along its long dimension at a frequency
determined by the length of the bar and the speed of a longitudinal sound wave in the optical
crystal. Birefringence experienced by the crystal is proportional to the mechanical stress and can
impede one of the linearly polarized light components (s- or p-) more than the other component
(15). The applied voltage is set such that each oscillation of the PEM changes the polarization of
the incident beam by 90 °. During one cycle of the applied voltage the half-wave retardation
occurs twice. When the crystal is completely expanded the incoming light is linearly polarized at
an angle of +45 ° with respect to the incident beam. When the optical element is at rest, the
polarization of the radiation remains unchanged, and when the crystal is completely compressed
the incoming light is linearly polarized at an angle of -45 ° with respect to the incident beam.
Figure 3.9 depicts the relative orientation of the electric components at half-wave retardation.
62
Figure 3.9: Diagram showing the relative orientation of the electric field components for a halfwave retardation (adapted from ref. 4).
PEM Signal Corrections
Because the beam oscillates between s- and p- polarizations at very high frequencies, the
signal intensity (ID) that reaches the detector has both components arriving from the sample (15):
( )
( )
(3.39)
where Ip and Is represent the intensities of the p- and s- components of the beam, respectively,
and φ is the retardation, as a function of time, t, and of the PEM frequency. This signal must be
decoded or demodulated into two components so the
〈 〉
can be determined and quantitative
analysis can be performed on the spectra. Demodulation is achieved by employing a synchronous
63
sampling demodulator (SSD) in our lab. The method of synchronous demodulation was
developed by Corn et al. using sampling electronics that detect the second and higher order
harmonics of the modulator frequency. For our results we are interested in the second harmonic
response because linear polarization modulation occurs at twice the frequency of vibration. The
SSD samples the detector signal using a separate signal of the PEM controller as a reference. The
real time sampling electronics generate an average and a difference interferograms. The
differential reflectance spectrum can be obtained from the interferograms once they are digitized
with an A/D converter and Fourier transformed:
( )
( )
(〈 〉)
( )
| ( )
( )
( )
( )
( )| (
(
〈 〉
)
(
)
〈 〉
(
)
(
)
)
(
)
(3.40)
(3.41)
(3.42)
Once the spectrum is demodulated and reflectance spectrum is obtained, further
corrections must be done to remove additional artifacts from the PEM. Factors influencing
polarization such as the optical setup may affect the outcome of the PMIRRAS spectra; therefore
an approach proposed by Buffeteau et al. (18) is employed in our lab to correct this. This
approach involves determination of coefficients from an independent experiment.
These
coefficients are referred to as PEM response functions that are obtained by replacing the
electrochemical cell by the dielectric total external reflection mirror and placing a second
polarizer just after the PEM and setting it to admit p-polarized light. The PEM has to be turned
64
off and the reference spectrum is acquired. This spectrum gives the intensity of the p-polarized
light Ip(cal), which passes through the whole optical bench. Then the PEM is turned back on and
polarization modulation spectra are acquired. The calibration signals
(
) and
(
)
are measured independently. Since only p-polarized light is passed through the second static
polarizer, the Is component is equal to zero for the calibration signal. The above equations 3.40
and 3.41 can be simplified to:
( )
( )
( )(
( )(
)
( )(
) (
)
(
)
)
(3.43)
(3.44)
Equation 3.43 and 3.44 can be rearranged to determine the PEM response functions:
(
)
(
)
( )(
)
( )(
)
( )(
)
( )(
)
(3.45)
(3.46)
Since the PEM is set for a single chosen wavelength the PEM response functions must be
calculated for each desired wavelength.
Determining tilt angle from PMIRRAS spectra
Once the spectra are corrected and ready to be analyzed, quantitative information
regarding the orientation of molecules in a membrane can be retrieved. Equation 3.47 states that
when linearly polarized light is absorbed by a sample, the intensity of the absorption is
65
proportional to the square of the absolute value of the dot product of the transition dipole vector
and the electric field vector of the incident radiation (19):
∫
| ⃗ ⃗⃗ |
| | 〈
〉
(3.47)
where A is the intensity of the absorption band, μ is the transition dipole vector, E is the electric
field, and
is the angle between the dipole moment and the electric field. Since electric field
vector direction of the p-polarized radiation is normal to the metal surface at the interface, the
integrated band intensity of adsorbed molecules is proportional to cos2θ, where θ is the angle
between the surface normal and direction of the dipole moment. To determine θ, the following
equation is used:
( )
(
(3.48)
)
where A(E), is the experimental integrated intensity of an IR band of interest and A(random) is the
integrated intensity of an IR band in simulated monolayer of randomly oriented molecules.
A(random) is calculated from the optical constants under the same experimental conditions. Certain
optical constants like the ones for optical window, electrolyte and the metal can be found in
literature. Other optical constants of the membrane film are obtained from a transmission
experiment using a method by Allara et al. (19). This transmission experiment is done in an
aqueous electrolyte with analyte molecules that are randomly oriented. Once A(random) is
determined and θ is solved, it can be related to the angle of the dipole moment with respect to the
coordinates of the molecule to determine orientation the molecule with respect to the surface
normal. The direction of the transition dipole moment with respect to the overall direction of the
66
molecule can be found in literature, and is usually determined through molecular dynamics
simulations.
For this research the primary orientations of concern are the acyl chains of the lipids and
the peptide α-helix. The orientation of lipids acyl chain conformation can be calculated by first
determining the absolute orientation of the transition dipole moment of the asymmetric (θvas) and
symmetric (θvs) methylene stretching bands with respect to the electrode surface using the
background corrected experimental spectra and theoretical spectrum. Then these orientations can
be related to the chain tilt angle (θchain) by the following formula (15):
(3.49)
The average tilt angle of a protein helix can be determined from the calculated based on
the order parameters of the amide I band. The predominate vibration from the amide bond is due
to the C=O stretching resulting in the amide I band (16). The order parameter of the amide I band
(
=𝑂)
can be calculated using the following equation (16):
(
)
(3.50)
Then the order parameter of the helical axis was calculated using SC=O and α, the angle between
the helical axis and the transition dipole moment:
(
)
(3.51)
Solving for the order parameter of the helix will allow us to determine the average tilt angle of
the helical axis (γ) (16):
67
(
)
(3.52)
Determining the average tilt angle of the α-helix of alamethicin under varying applied
potential will give insight into the voltage dependence and mechanism of alamethicin insertion
into lipid bilayers.
68
3.4 References
1. Grahame, D. C. 1941. The electrical double layer and the theory of electrocapillarity.
Chem. Rev. 41, 441-501.
2. Atkins, P. W.,P. Atkins and J. Depaula 2001. Physical Chemistry. W.H. Freeman &
Company.
3. Ulman, A. 1991. An introduction to ultrathin organic films from Langmuir-Blodgett to
self-assembly. Academic Press, United States.
4. Laredo, T. Ph.D. Thesis. 2009. University of Guelph
5. Roberts, G. Langmuir-Blodgett Films. Plenum Press: New York, 1990
6. Langmuir, I. Trans. Faraday Soc., 1920, 15, 62
7. Blodgett, K. B. J. Am. Chem. Soc., 1935, 57, 1007
8. Binder, H. Applied Spectroscopy Reviews. 2003. 38, 15.
9. Skoog, D.A.; Holler, F.J.; Nieman, T.A. Principles of Instrumental Analysis 5th Edition,
1998, Harcourt Brace & Company, Orlando, Florida.
10. Harrick, N.J. Internal Reflection Spectroscopy 1967, John Wiley & Sons Inc. USA.
11. Grossuti, M. Ph.D. Dissertation. 2013. University of Guelph.
12. Goormaghtigh, E.; Raussens, V.; Ruysschaert, J. Biochimica et Biophysica Acta. 1999.
1422, 105.
13. Greenler, R.G. J. Chem. Phys. 1966. 44, 310
14. Blaudez, D.; Buffeteau, T.; Cornut, J-C.; Escafre, N.; Pézolet, M.; Turlet, J-M. Appl.
Spectrosc. 1993. 47, 869
69
15. Alkire, R.C.; Kolb, D.M.; Lipkowski, J.; Ross, P.N. (Editors) Diffraction and
Spectroscopic Methods in Electrochemistry, Volume 9, 2006, Wiley-VCH, Weinheim,
Germany
16. Leitch, J.J. Brosseau, C.L.; Roscoe, S.G.; Bessonov, K.; Dutcher, J.R. Lipkowski, J.
Langmuir. 2013. 29, 965.
17. Hansen, W. N. J. Opt. Soc. Am. 1968. 58, 380.
18. Buffeteau, T., B. Desbat, D. Blaudez and J.M. Turlet. Calibration procedure to derive
IRRAS spectra from PM-IRRAS spectra. Appl. Spectrosc. 2000. 54, 1646.
19. Allara, D. L.; Nuzzo, R. G. Langmuir. 1985. 1, 45
70
Chapter 4: Materials and Experimental Methods
4.1 Glassware and solutions
4.2 Sample Preparation
4.3 ATR Equipment and measurements
4.4.1 Experimental Setup
4.4.2 Data Processing
4.4 Langmuir Blodgett and Langmuir Schaefer Techniques
4.5 PMIRRAS Equipment and measurements
4.5.1 Electrochemical cell
4.5.2 Experimental Setup
4.5.3 Experimental Conditions
4.5.4 Gap thickness and angle of incidence setup
4.5.5 Data Processing
4.6 References
71
Chapter 4: Materials and Experimental Methods
4.1 Glassware and solutions
Glassware for the experiments was prepared by a thorough acid washing process starting
with a soak in a 1: 3 HNO3: H2SO4 hot acid bath for at least one hour. Acid bathed glassware
was rinsed and soaked in ultrapure Milli-Q water and rinsed again before allowing it to dry in a
40 °C oven. The Langmuir tough was rinsed with Milli-Q water and methanol several times and
wiped dry with Kimtech wipes. Teflon materials for the PMIRRAS cell were first soaked in a
cold 1: 3 H2O2: H2SO4 piranha solution then rinsed with Milli-Q water and dried in an oven.
The DPhPC lipid for this research was purchased from Avanti Polar Lipids in Alabaster,
AL. It was in powder form and at 99% purity so no further purification was performed.
Alamethicin was purchased from Sigma Aldrich also in powder form. PM-IRASS measurements
were completed with 0.1M NaF solutions as supporting electrolyte. The NaF (99.99%) was
purchased from Sigma Aldrich. The DPhPC lipid was dissolved in chloroform (CHCl3) to create
a stock solution of 20 mg/mL and stored in a freezer at -18 °C. The alamethicin peptide was
dissolved in methanol to create a stock solution of 4 mg/mL and stored in a fridge at -5 °C.
4.2 Sample Preparation
For preparation of vesicle suspensions for ATR measurements, a stock solution of
DPhPC was added to a test tube and the chloroform was evaporated from the test tube by vortex
mixing while a stream of argon gas flowed over the surface of the solution. This allowed us to
create a dry film on the inner walls of the test tube. The test tube was then placed in a desiccator
for 24 hours to ensure complete evaporation and removal of chloroform and stored there until
72
use. To prepare a sample for imaging, the test tube with DPhPC was removed and sonicated with
deuterated water (D2O) for one hour. The sonication process allowed formation of lipid vesicles
that we used as model membranes. For imaging lipid and peptide solutions, a stock solution of
alamethicin peptide was added to the test tube with dried DPhPC lipid and both were dried using
the same process. The test tube with dried DPhPC and Alamethicin was then sonicated for one
hour in a D2O solution using Barenholz method to prepare for experiment (6).
A single crystal Au(111) electrode was used as the substrate for PM-IRRAS studies. The
electrode was cleaned by flame annealing and rinsing with water. Prior to experiments, the
electrode was placed in a 2 mM 1-thio-β-D-glucose solution for 15 hours in a hanging meniscus
configuration to form a hydrophilic self-assembled monolayer. The lipid bilayer was deposited
on the electrode using Langmuir Blodgett technique described in a later section.
4.3 ATR Equipment and measurements
4.3.1 Experimental Setup
The ATR experiments we performed on a Nicolet Nexus 870 spectrometer with an
attached MST-D* detector, VeeMax II variable angle specular reflectance accessory and a ZnSe
wire-grid polarizer. As discussed earlier in the theory Chapter 3, the IR beam goes from the
source spectrometer into the attached accessory which has a series of mirrors directing the beam
to the zinc selenide internal reflection element, shown in Figure 4.1. As the name suggests the
beam can hit the IRE from the accessory at various angles. To determine the effective angle of
incidence we have to factor in the face angle of the IRE
angle accessory
, and the set angle on the variable
:
73
(
where
(
)
)
Eq. 4.1
is the effective angle of incidence and n1 is the refractive index of the IRE. The face
angle of our zinc selenide IRE was 45° and the set angle could be 30-75°. The knowledge of the
refractive index of each phase in the setup is also necessary to calculate the electric field
components and ultimately the orientation of the model membrane (1). The refractive index of
the zing selenide IRE which was the first phase, n1, was 2.44. The second phase which is the
actual lipid sample is set as n2 and is equal to 1.42. The third phase, n3, is either the water or air
phase and is 1.33 or 1 respectively.
74
Figure 4.1: Diagram of instrumentation for the ATR-FTIR setup. (1)
The sample was placed on the IRE and four scans were necessary for one basic
experiment. The four single beam spectra obtained consisted of p-polarized spectra of the
background, s-polarized spectra of the background, p-polarized spectra of the sample, and spolarized spectra of the sample. The sample was prepared as a vesicle suspension using the
process described above. Lipid or lipid and membrane suspension was used as the sample and
water or air was used for the collection of background spectra. Each spectrum was obtained after
performing 1000 scans at 4 cm-1 resolution.
4.3.2 Data Processing
Using the spectra obtained from the ATR experiments, calculating the dichroic ratio is an
essential part of determining the orientation of the lipids on the ATR crystal. The results from
one experiment provide four spectra: p-polarized background spectrum (
( ̅ )), the s-polarized
75
background spectrum (
( ̅ )), the p-polarized sample spectrum ( ( ̅ )), and the s-polarized
sample spectrum ( ( ̅ )). The first step is obtaining the absorbance spectra for p- and s-polarized
light as follows:
where
( ̅ ) and
( ̅)
(
( ̅)
(
( ̅)
( ̅)
( ̅)
( ̅)
)
)
Eq. 4.2a
Eq. 4.2b
( ̅ ) is the absorbance of p- and s-polarized light at wavenumber ̅ . The
absorbances are used to calculate the dichroic ratio at each wavenumber:
( ̅)
( ̅)
( ̅)
Eq. 4.3
where ( ̅ ) is the dichroic ratio at wavenumber ̅ . So the dichroic ratio for a certain absorption
band can be determined by looking at the ( ̅ ) value for the corresponding peak center (1).
Another way of finding the dichroic ratio is deconvoluting and fitting the spectra then taking the
ratio of the respective areas of the p- and s-polarized absorbance bands. Deconvolution and
baseline correction for the ATR data was done with Peakfit software. Once the dichroic ratio is
calculated it is then used to determine the orientation of the lipid as described in theory chapter 3.
76
4.4 Langmuir Blodgett and Langmuir Schaefer Techniques
Lipid and lipid-peptide bilayers were deposited on a single crystal Au(111) electrode
using a KSV Minitrough. Barriers and dipper arm movements were controlled using KSV
LB5000 software. Ultrapure Milli-Q water was used to fill the trough water subphase and was
heated to 21 °C for every experiment. A Wilhelmy plate made of filter paper was partly
immersed in the water subphase before any measurements were taken.
Langmuir Blodgett technique was applied to deposit the first part of the bilayer onto the
gold electrode. This was done by first setting up the gold electrode in a vertical position and
submerging it into the water carefully and slowly. Then the sample consisting of either pure
DPhPC or 9:1 DPhPC: Alamethicin in a chloroform solution was added dropwise to the water
surface using a microsyringe. After allowing the chloroform solvent to evaporate completely for
15 minutes, the Langmuir trough barriers were moved slowly to obtain a 35 mN/m surface
pressure for DPhPC and 27mN/m surface pressure for DPhPC: Alamethicin. After allowing the
surface pressure to stabilize for 15 minutes, the gold electrode was moved upwards through the
subphase to create a monolayer on the electrode surface. The speed at which the electrode was
moved was 15 mm/s. The monolayer was deposited such that the polar head was attached to the
substrate and the tails are pointing towards the air. The monolayer was allowed to dry for 2 hours
before the second layer was deposited.
77
Figure 4.2: Bilayer deposition on gold electrode using Langmuir Blodgett (left) and Langmuir
Schaeffer (right) techniques.
Langmuir Schaeffer technique was used to deposit the second layer onto the electrode to
create the bilayer. The electrode was positioned over the subphase horizontally with the tail
group pointing down such that it was parallel to the air/water interface. The previous sample on
the trough was removed by suction and another layer was added dropwise using a microsyringe.
The solvent was again allowed to dry for 15 minutes. Once the target pressure was reached and
stabilized for the new layer, the electrode was slowly lowered horizontally until it touched the
hydrophobic ends of the floating monolayer. The substrate was then lifted from the surface with
the monolayer being transferred in the same orientation as it had on the water surface. The
electrode with the bilayer was allowed to dry for at least two hours or overnight.
78
4.5 PMIRRAS Equipment and measurements
4.5.1 Electrochemical cell
The PMIRRAS experiments were performed with a specially designed electrochemical
cell. This cell allowed the spectroscopic investigation of thin films adsorbed on Au(111) single
crystal in solution with changing applied potentials. The cell consists of several openings that
allow the connection to the working electrode, reference electrode, and to tubes for purging the
oxygen from the interior of the cell. The largest opening is a glass bearing inside the body of the
cell that provides a guide for the glass rod that holds the working electrode. Au(111) acts as the
working electrode and was made and polished in our laboratory. The opening at which the glass
rod with WE enters is sealed with Teflon and the other end of the cell is sealed with a CaF 2
prism. The prism is cleaned with water and methanol and put in an ozone chamber (UVOCleaner) for 30 minutes. The last opening is for an Ag/AgCl reference electrode that is connected
through a salt bridge. The counter electrode is a platinum wire sealed into the IR cell. Purging
was done with argon for 45 minutes and the cell was sealed to prevent oxygen from entering the
cell for the remainder of the experiment. A diagram of the cell is depicted in Figure 4.3.
79
Figure 4.3: Picture of the electrochemical cell in its holder in the TOM box. Photoelastic
modulator is to the right and detector to the left of the picture (adapted from ref. 2).
4.5.2 Experimental Setup
The experimental setup consists of a Nicolet Nexus 870 spectrometer, a TOM box that
holds the Hinds Instruments PM-90 photoelastic modulator, holder for the electrochemical cell,
GWC demodulator, and Nicolet High D* MCT-A detector. The initial IR beam from the
spectrometer is guided with a flat mirror and is refocused into a static polarizer by a parabolic
mirror. The linearly polarized light is then directed into the photoelastic modulator (PEM). The
80
alternating p- and s-polarized light generated at the PEM is directed to impinge on the surface of
the gold electrode through the CaF2 prism. The beam is reflected off the gold electrode and
directed through ZnSe lens into the MCT-A detector. The detector is cooled with liquid nitrogen
throughout the experiment. A synchronous sampling demodulator (SSD) collects the signal from
the detector and provides the PMIRRAS spectra. It requires a second signal at the frequency of
the PEM to use as a reference for demodulation. The resulting outputs contain the average and
difference signals of the p- and s-polarized light. The results are sent to a computer and analyzed
with OMNIC.
The potential is changed during the experiment to study how the model membrane
changes. The potential is controlled by the HEKA PG285 potentiostat starting at +400mV vs.
Ag/AgCl counter electrode and decreased by 100mV each step until -1000mV vs. CE. 4000
scans are performed per potential step at a resolution of 4cm-1. 100 scans are done for
background spectra at a resolution of 16cm-1. Retardation from the PEM is optimized by taking
a ratio of the spectrum taken while the PEM is on, and the reflectivity spectrum of p-polarized
radiation while the PEM is turned off. The peak of that ratio is monitored and retardation on the
PEM is adjusted such that the peak center is on the wavenumber for which the PEM is set. The
optimized retardation was 0.530. The FTIR and TOM box was continuously purged with dry air
throughout the experiment.
4.5.3 Experimental conditions
When the IR beam impinges on the sample it passes through several layers consisting of
the window, thin layer of electrolyte and the metal. D2O with NaF was used as electrolyte due to
water being a strong IR absorbent. The intensity of absorption for molecules adsorbed on a gold
81
surface is proportional to the Mean Square Electric Field Strength (MSEFS) of p-polarized
radiation. Therefore optimizing the MSEFS would provide a better signal. MSEFS depends on
wavenumber, angle of incidence of IR beam, the thickness of the gap between the metal and
window, convergence of the beam and the optical constants of each layer in the medium.
However the only parameters that can be changed are the angle of incidence and gap thickness.
Additionally, different parameters have to be used for each spectral region being investigated.
MSEFS can be calculated using Fresnel program developed in our lab designed to determine the
influence of angle of incidence and gap thickness on MSEFS at different regions of the spectrum
(3). This influence can be mapped out on a 3-D plot of MSEFS versus angle of incidence and
gap thickness for each wavelength to easily visualize which values form the global maximum for
the best theoretical MSEFS. An example plot is shown in Figure 4.4. The program takes in the
input for the CaF2 prism, deuterated water and gold and MSEFS was calculated for two spectral
regions: the 1600 cm-1 and 2900 cm-1 regions. For the best MSEFS at 1600 cm-1 region, it was
calculated that the angle of incidence and gap thickness had to be 66° and 3.6µm respectively.
For the 2900 cm-1 it was 57° incidence angle and 2.4µm gap thickness. Using these theoretical
values, experimental conditions were adjusted to be as close as possible to these values.
82
Figure 4.4: Example 3D plot of the influence of gap thickness and angle of incidence on
MSEFS.
4.5.4 Gap thickness and angle of incidence setup
Angle of incidence is easy to setup by simply moving the cell holder angle with respect to
the incoming beam. However, gap thickness must be measured by comparing the experimental
reflectivity spectra to theoretical spectra. Getting a specific gap thickness can be very difficult
but fortunately the MSEFS does not display a sharp maximum for gap dependence so a wider
range is acceptable as long the sample is held in place throughout the experiment (2). The
83
theoretical spectrum can be calculated by using the Fresnel equations for the same three phase
system consisting of the prism, electrolyte and metal. The experimental reflectivity spectrum can
be obtained by taking the ratio of the spectrum with no electrolyte present to the one with
electrolyte. By overlaying the experimental and theoretical spectra on top of each other and
comparing, confidence of the determination was estimated. If they were not close enough, the
electrode was manually adjusted with a new approach and a new experimental spectrum was
obtained until good agreement was achieved. In house software was used to calculate the
approximate gap thickness from the experimental and theoretical spectra comparisons. Gap
thickness was measured to be typically in the 2-8µm thickness range.
4.5.5 Data Processing
Background correction must be done on the spectra obtained from the PMIRRAS
experiment because there are various experimental artifacts that need to be removed before
quantitative interpretation of the data is made. Absorptions by solvent molecules are one of these
artifacts and they interfere because their bands are broad. However, it is very difficult to
reproduce the experimental conditions to obtain an experimental blank spectrum. In order to
remove the baseline an approach similar to that published by Barner et al is used in our lab (4).
This method is based on creating template using spline interpolation from the experimental data
points. In order to create the template, exact peak positions of analyte vibrations must be known
and coordinates must be used from experimental data. This template is then used to correct each
spectrum at various electrode potentials which results in spectra that can now be analyzed. An
example of such baseline correction is shown in Figure 4.5.
84
Figure 4.5: Example of a baseline correction for PMIRRAS spectra. Corrected spectra on the right.
Once baseline correction is complete, band deconvolution must be done to correct broad
IR bands and possible overlap of peaks. Therefore, the next step in data analysis was
deconvoluting the spectra using Fourier self deconvolution (FSD). Self deconvolution is the
sharpening of a band profile to resolve the structure hidden by overlap of neighbouring peaks.
The number of peaks, type of peaks, peak positions and full width at half maximum (FWHM) are
important parameters for further analysis of the spectra. FSD allows us to mathematically
determine these parameters but requires a good understanding of the system under investigation
(2). FSD describes an IR band as a Lorentzian shape described by:
( )
where A0 is the band maximum,
(
is the wavenumber,
)
Eq. 4.4
is the wavenumber at band maximum,
and γ is the half width at half maximum (HWHM). Peakfit software was used for all FSD
85
analysis. Full bandwidth at half maximum was set between 10-12 cm-1 and resolution
enhancement was set between 1-1.5. Bandwidth refers to an estimation of the width of the
overlapped peaks and enhancement refers to the degree to which the spectral features are
resolved. The area under the curve calculation using FSD analysis allowed for quantitative
analysis of tilt angle.
To calculate the orientation of molecules requires isotropic optical constants calculated
using a spectrum of the sample in random distribution as proposed by Allara et al. (5). To do this
a transmission experiment was performed to calculate optical constants for the sample using a
9:1 DPhPC: Alamethicin solution of vesicles using the preparation method above. A special cell
is used to perform this experiment and extra care is needed to not get any air bubbles into the
sample chamber. Two spectra are taken and the first is a single beam spectrum of the blank with
only the 0.1M NaF solution. The second spectrum is of the DPhPC: Alamethicin vesicle
suspension. Both spectra are done at 4000 scans with a resolution of 2cm-1 and their ratio is taken
for the final transmission spectrum. The optical constants are calculated using in house software
developed by Vlad Zammlyny and used to quantitatively determine the tilt angles of lipids and
peptides at changing potentials (3).
86
4.6 References
1. Grossuti, M. Ph.D. Dissertation, University of Guelph, 2013.
2. Laredo, T. Ph.D. Dissertation, University of Guelph, 2009.
3. Zamlynny, V. Ph.D. Dissertation, University of Guelph, 2002.
4. Barner, B.J.; Green, M.J.; Saez, E.I.; Corn, R.M. Anal. Chem. 1991, 63, 55.
5. Allara, D. L., A. Baca and C.A. Pryde 1978. Distortions of band shapes in external reflection
infrared spectra of thin polymer films on metal substrates. Macromolecules. 11, 1215-1220.
6. Barenholz, Y.; Gibbes, D.; Litman, B.J.; Goll, J.; Thompson, T.E.; Carlson, R.D.
Biochemistry. 1977. 16, 2806.
87
Chapter 5: Results and Discussion
5.1 Creation of a Solid Supported Bilayer Containing Alamethicin Peptide and DPhPC
Phospholipid
5.2 PM-IRRAS
5.4.1 Optical Constants
5.4.2 Amide I region
5.4.3 Acyl chain region of DPhPC sample
5.4.4 Acyl chain region of DPhPC + Alamethicin sample
5.3 Creation of a multilayer containing DPhPC phospholipid and Alamethicin peptide
5.4 ATR-FTIR
5.5 References
88
Chapter 5: Results and Discussion
5.1 Creation of a Solid Supported Bilayer Containing Alamethicin Peptide and DPhPC
Phospholipid
Bilayer lipid membranes were created using DPhPC phospholipid and alamethicin
peptide to investigate the conformation of the peptide during potential change, the effect of the
peptide on the membrane and hydration of the membrane. In addition, experiments were
performed with DPhPC bilayer without peptide, as a reference system. A solid support was used
to deposit the lipid bilayer membrane. Langmuir-Blodgett/ Langmuir-Schaefer techniques were
used to deposit DPhPC: Alm mixtures on a thioglucose modified Au(111) surface. This bilayer
lipid membrane was then characterized with PM-IRRAS.
5.2 PM-IRRAS
Electrochemical PMIRRAS was done on samples containing lipid and peptide and lipid
only. The bilayer was deposited onto a thioglucose modified Au(111) electrode and was placed
inside a glass cell. The glass cell was filled with a solution of 0.1 M NaF made with deuterated
water. The effect of the electric field, with a magnitude comparable to the electric field acting on
natural biological membranes, was investigated by collecting spectra at many applied potentials.
Two regions were observed and analyzed. The 1600 cm-1 region was studied to perform
quantitative and qualitative analysis about the Amide I band of the Alamethicin peptide. The
orientation of the lipid chains was investigated with quantitative and qualitative analysis of the
acyl chain vibrations in the ~2900 cm-1 region. To study the orientation of the acyl chains of the
lipid and amide I band of the peptide, optical constants had to be first determined from a
transmission experiment.
89
5.2.1 Optical Constants
PMIRRAS measurements in this work are performed as a function of potential. These
experimental spectra at different potentials are enough to obtain information of the potential
induced changes of the IR spectra. However, to obtain the absolute values of the tilt angle of a
chain or helix with respect to bilayer normal, a spectrum of a sample with known orientation of
the functional group of interest is needed as a reference. Spectra of randomly oriented molecules
can be obtained by performing a transmission experiment. Infrared transmission measurements
are crucial in the spectroelectrochemical studies of adsorbed layers on metal surfaces because in
conjunction with the PMIRRAS spectra, they can provide absolute orientations of particular
functional groups of the molecules present in the sample.
The absorption of linearly polarized light by a sample adsorbed on a reflective metal
surface like gold is proportional to the square of the dot product of two vectors: the electric field
vector, E, of the incoming photon and the transition dipole moment vector, µ, of the vibration of
interest:
∫
|
|
〈
〉| |
(5.1)
where the right hand side of the equation is the rearrangement of the left hand side in terms of
the vector modes and the angle in between the two directions. For highly reflective metals like
gold and p-polarized light, the direction of E is perpendicular to the surface at the vicinity of the
surface. Therefore, the angle θ relates the direction of dipole moment vector, µ, with respect to
the surface normal. When the direction of the transition dipole moment of the vibration is related
90
to the molecular geometry like the main axis of the acyl chain, the orientation of the functional
group under study can be determined from the experimental value of θ. For randomly distributed
molecules, cos2θ = 1/3, and the absolute orientation of the transition dipole moment with respect
to the electrode surface can be calculated by using the following equation:
∫ 𝑒
∫
(5.2)
where the numerator is the integrated intensity of the background-corrected PMIRRAS
experimental spectrum and the denominator is the integrated intensity of a calculated spectrum
determined from the optical constants of a film with randomly distributed molecules. These
optical constants are determined using the optical matrix approach for the reflectance from
stratified media: BaF2/electrolyte/bilayer. Thickness of the cell is measured by averaging the
fringe widths that is observed as a result of constructive interference on the internal walls of the
BaF2 discs. This specrum, shown in Figure 5.1, is used to determine the gap thickness (d)
between the two IR optical windows using the following equation (9):
(̅
where ̅
and
̅ )
̅ is the frequency of the region of interest,
(5.3)
is the number of interference fringes
is the average refractive index of the medium between the windows. Gap thickness was
calculated to be 61.9 µm.
91
Figure 5.1: Single beam spectrum for the empty transmission cell showing the fringe pattern.
The optical constants must be determined from the transmittance spectrum, using the
procedure described in chapter 4. The transmission spectra for a vesicle suspension of known
concentration of DPhPC: Alm in D2O was recorded. The attenuation coefficient, k, of the sample
is determined from the transmission spectra and used to obtain the refractive index, n, by means
of the Kramers-Kronig transformation. The average refractive index at infinite frequency was set
as n∞ = 1.4 (1). Figure 5.2 shows the optical constants for the 1600cm-1 and 2900cm-1 regions of
the transmission spectra.
92
Figure 5.2: Optical constants for Top: ν(CH) region; Bottom: Amide I and ν(CO)
93
5.4.2 Amide I region
The amide I band was analyzed to determine the orientation and conformation of
Alamethicin α-helix in a solid supported bilayer membrane. The IR spectrum of the amide I band
was collected at various applied potentials. As reviewed in Chapter #2, alamethicin has an αhelix and a bend at the 14th residue forming a 310 helix. The two helices present can be
distinguished based on the peak center of the amide I band. The peak center at 1658 cm -1
corresponds to the α-helix and the 1635cm-1 peak corresponds to the 310-helix (2). The band at
1728cm-1 belongs to the stretching vibrations of the lipid’s ester carbonyl groups (8). Figure 5.3
shows the PMIRRAS spectra of the Amide I region for a DPhPC: Alm bilayer transferred onto
the Au(111) electrode at surface pressures of 27 mNm-1 and 19 °C, at the potentials marked on
the figure.
94
Figure 5.3: PMIRRAS spectra of the Amide I and head group regions for DPhPC: Alm bilayer
at selected potentials.
The amide I band is a convolution of overlapping peaks of both the α-helix and the 310
helix and a band at 1623 cm-1(2). The order parameters of the α-helix were calculated based on a
deconvoluted spectrum. Fourier self deconvolution was used for the deconvolution of this
spectral region. Peakfit program was used to baseline and deconvolute the spectra into seven
overlapping peaks with Gaussian band shapes. A sample deconvolution is shown below in Figure
5.4. The position of the peaks used in this analysis was taken from a previous study and
discussed above (2). It is seen from the Figure 5.3 that the peak at 1632 cm-1 becomes more
pronounced as the potential is decreased to more negative values.
95
Figure 5.4: Deconvolution of the 1600 region.
96
Figure 5.5: Tilt angle of Alamethicin helix in the solid supported bilayer lipid membrane
The orientation of Alamethicin α-helix conformation was calculated by first determining
the absolute orientation of the transition dipole moment of the C=O bond with respect to the
electrode surface using the background corrected experimental spectra and theoretical obtained
from the transmission experiment. The order parameter for the C=O bond, SC=O was then
calculated using the following expression:
(
)
(5.4)
97
Then the order parameter of the helical axis was calculated using SC=O and α, the angle between
the helical axis and the transition dipole moment:
(
(5.5)
)
Finally the angle between the helical axis and the surface normal was calculated from the order
parameter using the following formula:
(
)
(5.6)
The angle between the helical axis and the direction of the transition dipole moment of
the amide I vibration, α, was taken from the literature. The literature value of 38° was reported
from a polarized ATR investigation of Alamethicin (2). This investigation also reported a tilt
angle of the alpha helix of 55° (2). Other investigations found similar results: Marsh reported
that the tilt angle of alamethicin is 67° in 1,2-didecanoyl-sn-glycero-3-phosphocholine
membranes and Stella et al. observed that the tilt angle of alamethicin is about 60° in a POPC
bilayer membranes (3, 4). The tilt angles calculated for spectra collected at decreasing applied
potentials are shown in Figure 5.5. It is known that Alamethicin can adopt either a surface state
in which the peptide molecules are oriented parallel to the surface or an inserted state. The tilt
angle of the α-helix higher than 70° at positive potentials, suggest that alamethicin is in the
surface state. The tilt angle decreases to about 60o at E=-0.2 V versus Ag/AgCl suggesting that
the molecules become incorporated into the membrane. The tilt angles increase at more negative
potentials where the membrane becomes detached from the surface. Alamethicin can be inserted
into the membrane if the membrane contains negatively charged lipids. The data in Figure 5.7
show that negative potential applied to the gold supported membrane assists in incorporation of
98
alamethicin molecules into the membrane as well. This is a very interesting result that illustrates
the power of a combined spectroscopy-electrochemistry experiment to unravel properties of
biomolecules in a model membrane.
5.4.3 Acyl chain region of DPhPC sample
Before providing data for the acyl chain region in the presence of alamethicin this section
describes the properties of the acyl chain in a DPhPC bilayer in the absence of the peptide.
Carbon-hydrogen stretching vibrations in the acyl chain region give rise to bands between
~2800-3100 cm-1 (5). Peak positions and peak intensities in this region provide information about
the conformation, orientation, and phase of the lipids in the membrane. This region contains
many overlapping peaks with two prominent peak maxima at the asymmetric and symmetric
stretching vibrations. The CH2 symmetric and asymmetric stretches have vibrations at 2856 cm-1
and 2929 cm-1 respectively. The peaks resulting from these vibrations are important because they
are used to determine the orientation of the lipids in the bilayer. Figure 5.6 shows the PMIRRAS
spectra of the CH stretching region for DPhPC bilayers transferred onto the Au(111) electrode at
surface pressures of 35 mNm-1 and 19 °C, at the potentials marked on the figure.
99
Figure 5.6: PMIRRAS spectra of the CH stretching region for DPhPC bilayer at selected
potentials.
The order parameters of the lipids were calculated based on a deconvoluted spectrum.
Fourier self deconvolution was used for the deconvolution of this spectral region. Then, the
Peakfit program was used to baseline and deconvolute the spectra into seven overlapping peaks
with pure Lorentzian band shapes. The peaks corresponding to the symmetric stretching of the
terminal CH3, νs(CH3-t), symmetric stretching of the CH2, νs(CH2), and symmetric stretching of
the other CH3 bonds, νs(CH3-m), were observed at 2844 cm-1, 2858 cm-1 and 2871 cm-1
respectively. Two peaks observed at 2954 cm-1 and 2967 cm-1 both correspond to the asymmetric
100
stretch of CH3, νas(CH3), and the peak observed at 2927 cm-1 corresponds to the asymmetric
stretching of CH2, νas(CH2). It is observed from Figure 5.6 that the intensities of peaks decrease
as the potential decreases due to the bilayer slowly desorbing from the substrate.
Figure 5.7: Deconvolution of the 2900cm-1 region.
101
Figure 5.8: Tilt angle of acyl chain of DPhPC with respect to the surface normal in a solid
supported bilayer lipid membrane.
The orientation of lipids acyl chain conformation was calculated by first determining the
absolute orientation of the transition dipole moment of the asymmetric (θvas) and symmetric (θvs)
methylene stretching bands with respect to the electrode surface using the background corrected
experimental spectra and theoretical spectrum. Then these orientations were related to the chain
tilt angle (θchain) by the following formula (10):
(5.7)
102
The tilt angle of the acyl chain was calculated for each potential starting at 200mV to -900mV.
The tilt angles calculated for spectra collected at decreasing applied potentials are shown in
Figure 5.8. Figure 5.8 shows that within limits of uncertainties the tilt angle is ~35°, although
average data show that the tilt angle decreases by several degrees by moving from positive
potentials in negative direction.
5.4.4 Acyl chain region of DPhPC + Alamethicin sample
The carbon-hydrogen stretching vibrations in the acyl chain region were measured in the
presence of Alamethicin peptide. Peak positions and peak intensities in this region provide
information about the conformation, orientation, and phase of the lipids in the membrane. They
can also be used to study the influence of the peptide on the lipid bilayer. This region contains
many overlapping peaks with two prominent peak maxima at the asymmetric and symmetric
stretching vibrations. The CH2 symmetric and asymmetric stretches have vibrations at 2858 cm-1
and 2932 cm-1 respectively. Figure 5.9 shows the PMIRRAS spectra of the CH stretching region
for DPhPC: Alm bilayers transferred onto the Au(111) electrode at surface pressures of 27
mNm-1 and 19 °C, at the potentials marked on the figure.
103
Figure 5.9: PMIRRAS spectra of the CH stretching region for DPhPC: Alm bilayer at selected
potentials.
The order parameters of the lipids were calculated based on a deconvoluted spectrum.
Fourier self deconvolution was used for the deconvolution of this spectral region. Then, the
Peakfit program was used to baseline and deconvolute the spectra into seven overlapping peaks
with pure Lorentzian band shapes. The peaks corresponding to the symmetric stretching of the
terminal CH3, νs(CH3-t), symmetric stretching of the CH2, νs(CH2), and symmetric stretching of
the other CH3 bonds, νs(CH3-m), were observed at 2844 cm-1, 2858 cm-1 and 2871 cm-1
104
respectively. Two peaks observed at 2954 cm-1 and 2967 cm-1 both correspond to the asymmetric
stretch of CH3, νas(CH3), and the peak observed at 2927 cm-1 corresponds to the asymmetric
stretching of CH2, νas(CH2). It is also observed from Figure 5.9 that the intensities of peaks
decrease as the potential decreases due to the bilayer slowly desorbing from the substrate.
Figure 5.10: Tilt angle of acyl chain of DPhPC with respect to the surface normal in a solid
supported bilayer lipid membrane in the presence of Alamethicin.
The orientation of lipids acyl chain conformation was calculated by first determining the
absolute orientation of the transition dipole moment of the asymmetric (θvas) and symmetric (θvs)
105
methylene stretching bands with respect to the electrode surface using the background corrected
experimental spectra and theoretical spectrum. Then these orientations were related to the chain
tilt angle (θchain) by the following formula (10):
(5.7)
The tilt angle of the acyl chain was calculated in the presence of Alamethicin for each potential
starting at +300mV to -900mV. The tilt angles calculated for spectra collected at decreasing
applied potentials are shown in Figure 5.10. The trend, seen in Figure 5.10, indicates that the tilt
angles are around 30° with respect to the surface normal initially. At around E=-300 mV versus
Ag/AgCl there is a small decrease to the tilt angle to around ~23° with respect to the surface
normal indicating the bilayer is in a desorbed state. The average tilt angle of the acyl chains in
the presence of Alamethicin is smaller by a few degrees than in the absence which indicates
insertion of Alamethicin into the bilayer causing the lipids to stand more upright.
5.1 Creation of a multilayer containing DPhPC phospholipid and Alamethicin peptide
Bilayer lipid membranes were created using DPhPC phospholipid and Alamethicin to
investigate the IR bands of the Amide I region from the peptide. Vesicle fusion technique was
used to create the vesicles containing DPhPC: Alm mixture. The vesicles in D2O solution were
then deposited onto the ATR-FTIR crystal. This multilayer lipid membrane system was then
characterized with ATR-FTIR.
106
5.2 ATR-FTIR
The primary purpose of ATR-FTIR investigation was to provide the initial IR
characterization of the system since the spectrum is the fingerprint of the sample over the whole
IR range. Secondary purpose was to determine a concentration of peptide that was sufficient to
cause insertion of alamethicin into the lipid bilayer. ATR-FTIR was done on samples containing
DPhPC and Alamethicin. First a background scan was performed in air. Then, vesicles hydrated
with D2O were deposited on the ATR crystal. After the sample dried, another scan was
performed and corrected against the background scan.
Figure 5.11 shows the ATR-FTIR
spectrum of dry DPhPC:Alm after background correction.
107
Figure 5.11: ATR-FTIR spectrum of dry DPhPC:Alm after background correction.
There was a strong intensity resulting from alamethicin in the amide I region during the
dry state. The 2900cm-1 and 1600cm-1 regions were baselined with Peakfit program and Fourier
Self Deconvolution was used to deconvolute the spectra (Figure 5.12). The spectra obtained
using ATR-FTIR agree with previous results (2).
108
Figure 5.12: Deconvolution of the 1600 (top) and 2900 (bottom) regions of ATR spectra
109
Tilt angles for the acyl chain were calculated by first calculating the dichroic ratio of the
IR bands from the ratio of the p- and s- polarized spectra. Then using the dichroic ratio and
electric field components of the incident IR radiation order parameters of the molecular axis and
finally the tilt angles of the acyl chain and amide I band were solved. Calculated tilt angles for
the acyl chain and amide I band are displayed in Table 5.1.
Table 5.1: Tilt angles for amide I region and acyl chain regions at different P/L ratios.
Peptide ratio
Tilt angle of the amide I band
Tilt angle of the acyl chain
10:1 DPhPC: Alm
56±5°
57±5°
16:1 DPhPC: Alm
86±5°
62±5°
Table 5.1 shows that the orientation of DPhPC acyl chains and alamethicin α helix, with respect
to the surface of the ATR element, were similar to each other for 1:10 P/L ratio at ~57±5° and
~56±5°, respectively. These numbers are within experimental error equal to the magic number
suggesting that the vesicles did not properly rupture and fuse resulting in a random orientation of
molecules. For 1:16 P/L ratio, the orientation of DPhPC was ~62±5°, but alamethicin molecule
employed a ~86±5° orientation. Orientation of lipids at 1:16 P/L ratio remained close to random,
however the alamethicin orientation was higher indicating the peptide was in the surface state.
110
5.5 References
1. Laredo, T. Ph.D. Thesis, University of Guelph,
2. Ye, S.; Nguyen, K.; Chen, Z. J. Phys. Chem. B. 2010. 114, 3334.
3. Marsh, D. Biochemistry. 2009. 48, 729
4. Stella, L. et al. B. Chem Biodivers. 2007. 4, 1299
5. Mantsch, H.H.; McElhaney, R.N. Chem. Phys. Lipids. 1991, 57, 213
6. Leitch, J.J.; Brosseau, C.L.; Roscoe, S.G.; Bessonov, K.; Dutcher, J.J.; Lipkowski, J.
Langmuir. 2013, 29, 965
7. Leitch, J. J. et al. Langmuir. 2009. 25, 10354.
8. Lewis, R.; McElhaney, R.N.; Pohle, W.; Mantsch, H.H. Biophys. J. 1994, 67, 2367
9. Li, N.; Zamlynny, V.; Lipkowski, J.; Henglein, F.; Pettinger, B. Journal of Electroanal. Chem.
2002. 43, 524.
10. J. Umemura, T. Kamata, T. Kawai and T. Takenaka, J. Chem. Phys. 1990. 94, 62.
111
Chapter 6: Conclusion
6.1 Conclusions
6.2 Future Direction
6.3 References
112
Chapter 6: Conclusion
6.1 Conclusions
The general objective of this project was to study the electric field driven changes of a
model system containing lipid and transmembrane protein. The model membrane system
consisted of 10% molar ratio of Alamethicin, a voltage gated ion channel forming peptide, and
90% of 1,2-diphytanoyl-sn-glycero-3-phosphocholine, a zwitterionic phospholipid. Attenuated
Total Reflection Fourier Transform Infrared Spectroscopy was first used to obtain an initial IR
spectrum of lipid/peptide system. Vesicle fusion was used to deposit a solution containing
vesicles onto the ATR crystal. Electrochemical Polarization Modulation Infrared Reflection
Absorption Spectroscopy was used to study the mechanism of pore formation of alamethicin in a
lipid bilayer composed of DPhPC. A solid support system was used for the deposition of the
bilayer because of its stability and capability to perform surface sensitive spectroscopic
characterization. The bilayer was deposited on a thioglucose modified Au(111) crystal using
Langmuir-Blodgett and Langmuir-Schaefer techniques. The Au(111) crystal was cut and
polished to be atomically flat in the laboratory and used for its ability to function as an electrode
for electrochemical experiments. Applied potentials in the PMIRRAS experiments were
comparable to those present in a biological cell membrane. Conformational and orientational
information about the lipid matrix and the alamethicin peptide was investigated using
quantitative data from PMIRRAS spectra.
113
The major conclusions of this thesis are as follows:
(i) A solution of vesicles composed of DPhPC and alamethicin was deposited on the ATR crystal
after collecting a background air scan. The resulting scans after background correction gave
strong signal and provided an initial IR characterization of the system. Regions in the 2900cm-1
and 1600cm-1 frequencies were baselined corrected and deconvoluted using Fourier Self
Deconvolution.
(ii) The dichroic ratio of IR bands obtained by taking the ratio of p- and s- polarized light from
ATR spectroscopy was used to calculate for the orientation of phospholipid and alamethicin.
Orientation was calculated for different peptide to lipid ratios. Orientation of DPhPC acyl chains
and alamethicin α-helices with respect to the surface of the ATR element were similar to each
other for 1:10 P/L ratio and ~57±5° and ~56±5°, respectively. These are within experimental
error equal to the magic number and suggest that the vesicles did not properly rupture and fuse
resulting in a random orientation of molecules. For 1:16 P/L ratio, the orientation of acyl chains
of DPhPC was ~62±5°, but alamethicin molecule employed a ~86±5° orientation. Orientation of
lipids at 1:16 P/L ratio remained close to random, however the alamethicin orientation was
higher indicating the peptide was in the surface state. Using this information, the P/L ratio of
1:10 was used for PMIRRAS experiments.
(iii) Langmuir Blodgett and Langmuir Schaeffer techniques were used to deposit mixed DPhPC
phospholipid and alamethicin peptide onto a thioglucose modified Au(111) electrode.
Experiments were performed with DPhPC bilayer without peptide as a reference system as well.
These systems created a solid support for the bilayer that was stable. Potentials were applied to
the system going from positive to the negative values. At negative potentials, the intensity of the
114
acyl chain region decreased by a few degrees causing the bilayer to slightly desorb from the gold
substrate. This caused formation of a small water reservoir that allowed the phospholipid to
reorient and become more vertical. The tilt angle of the lipids in the presence of alamethicin was
smaller by a few degrees. This suggested insertion of Alamethicin into the bilayer causing the
lipids to stand more upright.
The tilt angle of the alamethicin α-helix was higher than 70° at positive potentials,
suggesting that alamethicin was in a surface state. When the applied potential was at about
E=-200mV versus Ag/AgCl, the tilt angle decreased to about 60° suggesting that the molecules
became incorporated into the membrane. The tilt angle increased at more negative potentials
where the membrane became detached from the surface. This is a very interesting result that
illustrates the power of a combined spectroscopy-electrochemistry experiment to unravel
properties of biomolecules in a model membrane.
6.2 Future Directions
There are a lot of directions for future research involving model membranes, support
systems, and the study of antimicrobial peptides. While solid support systems are the most used
system to deposit a lipid matrix, they do not fully represent a biological system due to only one
side being an aqueous environment. This also presents challenges in studies of ion channel
formation due to lack of mobility of the lipids. A ‘floating’ bilayer studied in our laboratory by
Dr. Kycia could improve upon these issues by attaching a group to the gold substrate to hold the
membrane and create a water reservoir in between the metal surface and the bilayer (1).
115
The insertion of alamethicin into bilayers and its conformation during the gating process
has a dependence on the thickness, charge and packing parameters of the bilayer. While DPhPC
phospholipid was used in this research there are many other systems in existence, for example
DMPC bilayers used in recent research (2) or charged bilayers of DMPC. Other characterization
techniques could also provide insight into the mechanism of pore formation or membrane
thinning. For example, AFM imaging could be used to determine the exact thickness of the
bilayer membrane at different points in time or with different peptide to lipid ratios.
116
6.3 References
1. Kycia, A. Ph.D. Dissertation. 2009. University of Guelph.
2. Ye, S.; Nguyen, K.; Chen, Z. J. Phys. Chem. B. 2010. 114, 3334.
117


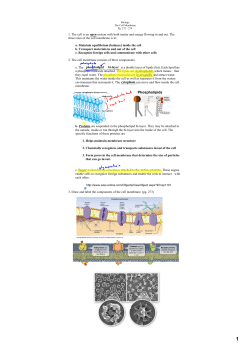


© Copyright 2026