
Let us show you Africa Standard Bank Plc
Standard Bank Plc Consolidated Annual Report 2012 Let us show you Africa 02 Standard Bank Plc Consolidated Annual Report 2012 Contents Directors’ report 04 Remuneration policy statement 12 Statement of directors’ responsibilities 14 Independent auditor’s report 15 Consolidated statement of financial position 16 Consolidated income statement 17 Consolidated statement of comprehensive income 18 Consolidated statement of changes in shareholders’ equity 19 Consolidated statement of cash flows 20 Company statement of financial position 21 Company statement of changes in shareholders’ equity 22 Company statement of cash flows 23 Significant accounting policies 24 Notes to the annual financial statements 37 Acronyms and abbreviations 105 Contact information 106 03 Directors’ report The directors present their report and financial statements for the year ended 31 December 2012 for Standard Bank Plc group. Going concern basis The financial statements are prepared on a going concern basis, as the directors are satisfied that the group and company have the resources to continue in business for the foreseeable future. In making this assessment, the directors have considered a wide range of information relating to present and future conditions. Further information relevant to the assessment is provided in the following sections of the financial statements: principal n activities, strategic direction and challenges and uncertainties are described in the business review; a financial summary, including a review of the income statement n and statement of financial position, is provided in the financial results section; and objectives, policies and processes for managing credit, liquidity n and market risk, and the group’s approach to capital management and allocation, are described in note 30. The current economic environment remains challenging and the group has reported a loss attributable to equity shareholders. Management action over the last three years to simplify the business operating model, align with the Standard Bank Group (SBG) strategy to reduce the scale and complexity of operations and to de-risk the Standard Bank Plc (SB Plc) balance sheet is almost complete. The Investment Banking (IB) asset origination is now booked on the Standard Bank of South Africa’s (SBSA) balance sheet and the remaining loan portfolio has been transferred to SBSA. The group receives revenue under appropriate transfer pricing arrangements as compensation for these activities. In addition, the exit or scaling back of certain business lines and geographies has been carried out and stringent cost reductions, including a staff retrenchment programme, implemented. As a result of these strategic measures, the group is exposed to significantly lower credit risk and benefits from a lower cost base. The group maintains a strong capital and liquidity position and SBG has confirmed its undertaking of support in respect of SB Plc, in terms of which SBG confirms that it will ensure that, except in the case of political risk, SB Plc will be able to meet its contractual liabilities. SBG has additionally committed, with the prior approval of the South African Reserve Bank, to ensure that SB Plc continues to meet its minimum capital adequacy requirement. Having considered the factors set out above, the group continues to adopt the going concern basis in preparing the annual financial statements. 04 Business review Standard Bank Group profile Standard Bank Group Limited listed on the JSE Ltd, the Johannesburg stock exchange, is the ultimate holding company for the global activities of SBG. With total assets in excess of US$182 billion and employing 49 000 people worldwide, SBG is one of Africa’s leading banking and financial services organisations. In 2007, SBG entered into a major strategic partnership with Industrial and Commercial Bank of China Limited (ICBC), the world’s largest bank by market capitalisation, which resulted in ICBC becoming a 20% shareholder in SBG. SBG operates within three key business segments: Personal & Business Banking (PBB), Corporate & Investment Banking (CIB) and Investment Management & Life Insurance. These global business segments operate across South Africa, Africa and selected international locations outside of Africa. SB Plc is the main subsidiary outside Africa and an integral part of SBG’s CIB business segment. Principal activities The company is a bank authorised and regulated by the United Kingdom Financial Services Authority, providing a range of banking and related financial services. It is a member of the London Stock Exchange, the London Bullion Market Association, the London Metal Exchange and the London Platinum and Palladium Market. It acts as Chairman of the London Platinum and Palladium Fixing and has two seats on the New York Mercantile Exchange (Comex division). The franchise of SB Plc and its subsidiaries focuses on African and other emerging markets – primarily debt, interest rate, equity, currency products and commodities. Principal product areas Global Markets division The Global Markets division is the group’s primary revenue generator and transacts customer-driven, market-making and sales activities across the full spectrum of traded financial and commodity risk. The division seeks to originate exposures directly from clients or market-making activities, which are repackaged and traded with market participants, asset managers and other clients through the group’s distribution network. A comprehensive range of foreign exchange, money markets, interest rate, credit, equity and commodity products are provided, ranging from simple risk management tools to structured products. The equity activities are managed as a global CIB business and revenue is attributed to the group to service costs incurred and provide a return Standard Bank Plc Consolidated Annual Report 2012 commensurate with global profitability. The division’s expertise extends to the management and financing of physical commodity inventories across base and precious metals, in addition to the provision of foreign exchange and access to products for all major African, Asian, Central and Eastern European, Middle East, Central Asia (CEEMECA) and Latin American currencies. Investment Banking division The Investment Banking business is now managed as an integrated global business with the group originating assets directly on the SBSA balance sheet and SBSA becoming the primary booking centre and risk warehouse in the SBG. The division provides a full suite of advisory and financing solutions to clients, both cross-border and domestically within its core countries and sectors. Financing solutions range from corporate loans and bond issues to highly structured products across equity and debt capital markets. The division is structured along the major product lines of debt products, capital markets and advisory. These areas are also aligned, where applicable, by execution expertise to the key sectors within client coverage which work together to create bespoke solutions for clients. The client coverage area, contained within IB, is focused on entrenching a client focus into the business operating model of the group. The division focuses on financing solutions, risk management activities and market opportunities across the group’s emerging markets footprint and centres on client interaction and advice. The client coverage team is managed along industry lines with experienced industry professionals in each sector group. These sectors, which also map to the drivers of economic growth for emerging markets, are: oil, gas and renewables; mining and metals; telecommunications and media; and power and infrastructure. Transactional Products and Services division Discontinued Operations A redefined focus on strategic business and revenue streams resulted in the closure of non-core businesses, Principal Investment Management (PIM) and Private Client Services (PCS) in 2010. Consequently, no further investments were made in these business units and the focus has been on realising the carrying value of the assets. These business units are classified as discontinued operations and their results are disclosed as a single line in the income statement. Curtailed Activities The decision was taken in 2011 to close the legacy Middle Eastern Non-Bank Financial Institution (NBFI) lending activity. This distinct lending activity was not regarded as a significant business segment and accordingly is not classified as a discontinued operation under International Financial Reporting Standards but referred to as ‘curtailed activities’ and included within continuing operations. Market conditions The year proved to be one of continued uncertainty and volatility in the global economy and began with a degree of optimism as investors were encouraged by developments within the Eurozone and stronger than expected economic data from the United States of America (US). However this positive momentum was short lived as Spain became the fourth member state to require a bailout and Greece faced the possibility of an exit from the European Monetary Union. The UK temporarily slipped back into a double dip recession and concerns began to build that the Chinese economy was running out of steam as growth slowed. The end of the year was dominated by uncertainty in the US economy as the “fiscal cliff” approached. This backdrop contributed to growth in the global economy slowing to its weakest pace since the 2009 recession. The Transactional Products and Services (TPS) division provides products and services for clients’ short-term working capital needs and is constituted of cash, trade and investor services. The Standard Bank TPS business division facilitates the domestic and cross border flows into and out of Africa and provides vanilla trade finance, payments, collections, short-term liquidity and custody solutions across Africa. From a segmental reporting perspective, this business has previously been included within the Investment Banking division. A notable feature about 2012 has been the apparent divergence between the macroeconomic environment and financial market performance. Despite the various headwinds that have hampered the global economy, the year was a good one for many of the world’s stock markets. The FTSE All World index grew by 14% on the back of improved investor sentiment, particularly as the year progressed. Much of this was attributed to positive action by central bankers in the developed world, with the European Central Bank making it clear it will do whatever it takes to support the Euro and the US Federal Reserve launching a new round of quantitative easing. The TPS business unit engages with both group and regional treasurers in order to promote opportunities within the African franchise utilising the international origination team and similarly the in-country coverage and sales teams promote transactions booked in the group. TPS provides the foundation upon which other business can engage clients to offer Global Markets and Investment Banking products. In the group’s own operating environment, emerging markets saw a similar trend in terms of financial market performance with the MSCI Emerging Market Index up 15% over the year. These economies outperformed the developed world in terms of growth, with the IMF’s latest estimates showing GDP growth of 5.3% in 2012. This compares favourably to the rates predicted for the global and advanced economies. 05 Directors’ report continued The latest estimates suggest that Sub-Saharan Africa, a key region to the group, grew by 5% in 2012, driven in particular by Nigeria, Ghana, Ethiopia, Angola and Tanzania. However, this regions’ trade links with the developed world will result in its outlook being influenced by the strength of the global economic recovery. The South African economy had an uncertain year. Slowing growth resulted in a cut to interest rates in the third quarter, a stark contrast to the start of the year when the market’s implied interest rate expectation was a rate hike by early 2013. The tragic developments that followed labour unrest in the platinum mining sector caused a loss of production and acted as an unwelcome reminder of the volatility that remains across Africa. 2012 was a mixed year for the commodity markets. While the S&P Goldman Sachs Commodity Index finished the year roughly flat, this masked a significant drop in the first half of the year, with an initial strong recovery in the second half before an uneventful close to the year as prices remained limited by sluggish global demand. The initial decline was a consequence of macroeconomic concerns characterised by a strengthening US Dollar and weak global demand, with energy markets hit particularly hard. A recovery in commodity prices subsequently resulted from supply side issues in both energy and precious metal markets and a rally in gold following further quantitative easing in the US. Business developments Strategy and core sector focus The CIB strategy is to be the leading corporate and investment banking business in, for and across Africa, with a deep specialisation in natural resources. Although the CIB business operates as a global business, there remains a regional franchise to ensure that the geographic footprint and the global business units are brought together through a focus on clients and where they are located. The business model for the bank has developed significantly over the last three years necessitating the reduced geographic reach, migrating of risk to optimise resources, implementing an increasingly integrated operating model with SBSA and simplifying the international structure, scaling back products and simplifying the business. The Investment Banking business now originates assets directly on SBSA’s balance sheet, with SBSA becoming the primary booking and risk taking entity in SBG and acting as a risk warehouse for the CIB business. Franchise development A key strength of CIB’s integrated business model is the ability to serve the full range of our clients’ corporate and investment banking needs, and to enable them to undertake significant cross-border transactions using the expertise and balance sheets in London, South Africa and Rest of Africa. The annual Africa Investors Conferences, held in London and New York, demonstrated to clients the extent of Standard Bank 06 Group’s commitment to Africa and the deep relationships we have with the investor community, Africa’s most successful corporations and influential policymakers. SB Plc also hosted the Africa Mining Investor Seminar which attracted a large number of mining companies with projects in Africa, along with high quality and diverse investors. The Trade Tech FX Expo took place in London and provided the group with an opportunity to exhibit and showcase the new foreign exchange trading platform, eMarket Trader, which was well received. Capital management Regulatory capital usage reduced during the year as a result of the transfer of a significant portfolio of loans to SBSA, as well as Global Markets capital usage being successfully managed down ahead of the expected but subsequently delayed implementation of Basel 3 in Europe. The SBSA balance sheet will increasingly be used to centralise the warehousing of risk and capital usage. Optimisation and efficiency SB Plc’s holding company structure is to be simplified with the removal of its two Luxembourg intermediate parent companies. Regulatory approval for this corporate restructure was obtained from the South African Reserve Bank (SARB) in late 2011 and is expected to be completed in 2013. The SBG has undertaken a programme of globalisation of enablement functions, with the objective to utilise centres of excellence and achieve cost efficiencies through synergies. Improved transparency has been introduced to the location of roles and associated costs, allowing improved distribution of costs incurred by the group on behalf of SBG. A Service Unit has been created within the company to house these support and business costs which are recovered from other entities in SBG under appropriate transfer pricing arrangements. In accordance with the refocused strategy on Africa and natural resources and the need to optimise the cost base, management have undertaken specific initiatives to scale back the regional footprint outside London, reduce headcount in London and to cease non-core activities. The Hong Kong presence has been downsized through winding down the Standard Bank Asia banking entity and significantly reducing the Hong Kong branch presence. Performance The challenging market conditions have, along with restructuring activities, constrained the business divisions’ performance. Global Markets division Total revenue of Global Markets, the group’s primary revenue generator, was lower than the previous year. These results reflect a challenging operating environment over the course of the year characterised by increased competition, tight margins and subdued volumes. Standard Bank Plc Consolidated Annual Report 2012 The principal trading desk was loss making for the year and a decision was taken to close this business. Revenues from the credit trading desk were down on prior year and were adversely impacted by the unwinding of positions following the closure of the Hong Kong credit trading business. The commodities business had a mixed year but grew revenues on the prior year. There was a strong start to the year, particularly within base metals, benefiting from increased global demand and rising prices. However, client volumes reduced and margins tightened over the course of the year as both consumers and producers delayed trading while they anticipated movement in prices given the volatility in commodity markets. A number of significant deals involving clients in Africa were closed and a strong performance in Asian base metals activity was achieved. The sale of the ‘A Shares’ shareholding in the London Metals Exchange to the Hong Kong Exchange was also completed in the year. An evaluation of the business model was undertaken in the year in order to reduce costs and to focus on products which will optimise the future business model in light of current market conditions and under evolving regulatory requirements. The division reduced its primary regional footprint and locations to London, New York and Singapore. The principal trading business was closed and the structuring team discontinued. Investment Banking division The ECM team took advantage of the improving equity markets to close a number of deals and mandates. TPS division The revised strategic focus for the business of delivering deal origination in Africa has gained momentum particularly in terms of collaborations between China and Africa. A host of new cash management relationships were established across countries such as Namibia, Angola, Tanzania and Malawi in addition to developing the Letters of Credit and Investor Services businesses. The business remains a significant opportunity to link international corporate to Sub-Saharan Africa who continue to search for a trusted partner to assist them to achieve their aspirations in the region. Discontinued Operations The PIM and PCS businesses, discontinued in 2010, are being wound down and incurred losses in the current year, primarily emanating from Asian distressed debt exposures and the write down of the associated deferred tax asset recognised in previous years. Central and Service Unit The newly established Service Unit has recovered, under transfer pricing arrangements, all costs incurred on behalf of other SBG entities. These recoveries are included within revenues. The remaining IB loan portfolio was transferred to SBSA as part of the management strategy to simplify, reduce scale and de-risk the international operations and further integrate the operating model with SBSA. This transfer has resulted in the bank’s balance sheet now being substantially de-risked with respect to Investment Banking loan exposures. There is consequently a reduction in revenue attributed to assets booked directly on the group’s balance sheet and a migration to revenue received from SBSA determined under appropriate transfer pricing models. The Central Unit primarily reflects costs attributable to the central treasury as well as corporate restructure activity of which the significant components comprise staff redundancy (US$42.2 million), onerous lease provisions (US$6.6 million) and impairment of intangible assets (US$25.1 million). The loss incurred on the transfer of the legacy IB loan portfolio to SBSA of US$51.8 million is partially offset by a release of the performing portfolio provision which is no longer required. The backdrop of volatile market conditions has inevitably impacted deal completion rates in the division. However, the team was still able to complete significant and strategically important deals on SBSA’s balance sheet in line with the core resource and African strategy throughout the year. Equity holdings were realised in the year following increased valuations. The debt capital markets experienced a slow closure rate but focused on strengthening their existing relationships to benefit the business in the future. Given the significant loss for the year, 2012 has been a difficult period for the group. The management strategy commenced in 2010 has resulted in a simpler operating structure, de-risked balance sheet and lower cost base as the group becomes appropriately scaled for the future. These actions are fully supported across the Standard Bank Group and, as they are fully implemented over 2013, will put the group in a strong position for the future. Significant provisions were taken against the legacy Middle Eastern NBFI lending portfolio, an activity that was curtailed by the group in the prior year. The advisory business saw muted revenues as deal volumes in subSaharan Africa, which the majority of our International M&A business has a connection to, remained subdued for much of 2012. Outlook for 2013 The operating environment is expected to remain extremely challenging. The banking industry is facing the combined challenge of ever increasing regulatory capital and liquidity requirements and the simultaneous continued deterioration in the global macroeconomic environment. Investment banking business models that proved successful in the past are being challenged in the face of the structural changes that have, and will continue, to have an impact on the industry. 07 Directors’ report continued Financial results The group’s results for the year are shown in the consolidated income statement on page 17 and key performance indicators are discussed below. 2012 $m Loss attributable to equity shareholders Add back: Loss attributable to discontinued operations (Loss)/profit for the year from continuing operations 2011 $m (332.4) (21.1) 44.0 46.1 (288.4) 25.0 Add back: Loss attributable to curtailed and restructuring activities 234.9 102.3 (Loss)/profit for the year from continuing operations, excluding curtailed and restructuring activities (53.5) 127.3 The loss attributable to equity shareholders was US$332.4 million (2011: US$21.1 million loss) for the year. The negative return on equity of 20.5% (2011: negative return of 1.2%) is attributable to substantial losses incurred from continuing operations as well as losses from discontinued operations. Continuing operations returned a net loss of US$288.4 million for the year (2011: US$25.0 million profit). No tax relief against these losses has been recognised due to the reduced profitability in the near term. A decrease in net interest income and commission revenues was due to the change in operating model, with Investment Banking lending activity now conducted on the SBSA balance sheet. Non-interest revenue remained in line with the prior year. Trading revenue was lower, reflecting a challenging operating environment over the course of the year, characterised by increased competition, tight margins and subdued volumes. Net fees and commissions decreased as a result of the origination of new loans booked directly on other SBG entity balance sheets, partially offset by higher receipts under transfer pricing arrangements with other group entities. Other income generated in the current year follows the sale of equity positions. The cost to income ratio from continuing operations of 116.2% (2011: 80.8%) reflecting the higher operating costs due to increased expenses associated with compliance activities and information technology costs. In 2012, the continued strategic review of the operating model led to a charge of US$73.9 million for restructuring costs (2011: US$28.6 million) following a redundancy programme. Credit impairments increased due primarily to legacy Middle Eastern loan exposures but were partially offset by a lower performing portfolio provision requirement following the significant reduction to the loan portfolio. A loss of US$51.8 million was incurred on the transfer of exposures to 08 SBSA as these were carried at recoverable value but transferred at fair value. This loss is not borne by SBG as the portfolio has not been disposed of by the group and consequently is not reflected in those results. Discontinued operations contributed a loss of US$44.0 million for the year (2011: US$46.1 million loss) primarily due to the write down of the deferred tax asset previously recognised. The group reported a loss of US$53.5 million from continuing operations, excluding curtailed and restructuring activities, compared to a profit of US$127.3 million in the previous year. Revenues were negatively impacted by business model changes within Global Markets and Investment Banking and increased liquidity holdings in addition to challenging market conditions. Increased costs were incurred on compliance activities and information technology. Total assets were reported as US$21 091.0 million compared to US$27 344.2 million in the prior year. The decrease is primarily attributable to roll-off of loan exposures and the transfer of the IB loan portfolio to SBSA, as well as reductions in the remaining discontinued business exposures. Capital resources At the end of the reporting period, the group’s equity capital resources amounted to US$1 374.6 million (2011: US$1 698.9 million) and total capital resources qualifying for prudential purposes amounted to US$2 111.2 million (2011: US$2 435.4 million). The group remains well capitalised with a total capital adequacy ratio of 20.5% (2011: 16.9%), a core tier 1 ratio of 12.6% (2011: 11.0%) and risk weighted assets of US$10 283 million (2011: US$14 375 million). The group expects to maintain the core tier 1 ratio at levels which significantly exceed the minimum requirements of the Financial Services Authority. Liquidity The group maintained a strong liquidity profile through the year and liquidity buffers were comfortably above the minimum requirements at year end. The current and prospective funding requirements for all operations are reviewed on an on-going basis through regular reviews of the liquidity ratios, maturity mismatch, diversification and stability of the deposit base, as well as liquidity stress testing results. Under the required stress testing scenarios, the group maintained survival horizons in excess of the regulatory and internally established limits. Management continues to focus on monitoring of relevant stress scenarios to the group. The structural liquidity mismatch continued to be positive across all short-term buckets and, as at year end, the group maintained a significant surplus of liquid assets over the regulatory requirements. Standard Bank Plc Consolidated Annual Report 2012 Senior management have convened the liquidity contingency management team on a regular basis to monitor the stresses arising from the Eurozone crisis as required by the group’s early warning indicator framework. The group initiated a number of actions that reduced the already low exposure to selected asset classes and counterparties within the Eurozone, especially sovereign debt. Key risk areas and risk management The group faces a number of risks and uncertainties in the normal course of conducting banking business. The key areas of focus for management are described below. economic conditions that could have an impact on the group. During 2012, the group performed stress tests on scenarios defined by the FSA Pillar II in addition to internal group defined scenarios, which included Eurozone break-up and a global double-dip recession. Portfolio-specific stress tests are conducted more frequently within business lines, often monthly, facilitating proactive management at a business line level. The group has also implemented reverse stress testing to complement the overarching stress-testing programme and a Recovery and Resolution plan as required by the FSA. Dividends The directors do not recommend the payment of a dividend. The profitability and the performance of the business have been key areas of focus for management this year, which has seen continued adverse market conditions with reduced volumes and client activity. These economic conditions are likely to prevail, leading management to continue to closely manage costs and review the operating strategy with increased SBG integration and to ensure it is appropriate to the prevailing economic environment. Funding is a core activity and the focus continues to be on the development of diversified funding sources and effective liquidity risk management. The group’s credit rating is important for business operations and is highly integrated with that of the SBG credit rating. Management monitor key ratios, metrics, stress scenarios and relevant management responses as well as engaging in regular dialogue with analysts on the performance and strategic focus of the group and SBG. The regulatory environment, including prudential and conduct of business, is currently undergoing a number of changes. The group has responded to these developments by implementing appropriate actions and maintaining a strong liquidity position and capital ratios, in both cases in excess of minimum regulatory requirements. The group capital and liquidity management includes the impact of emerging legislation on capital and liquidity forecasting and stress testing to ensure the group continues to be adequately capitalised and funded. The management team has continued their focus on managing and reducing single obligor and concentration risk and have made increased use of the SBSA as the primary booking and risk taking entity with the transfer of the IB loan portfolio to SBSA. The effective management of risk is fundamental to activities as the group remains committed to manage the business in a way that is consistent with the agreed risk appetite. The group’s overall stress-testing programme is a key management tool within the organisation and facilitates a forward-looking perspective on risk tendency and business performance. Stress testing involves identifying possible events or future changes in Directors and directors’ interests The directors who currently hold office are as follows: M E Austen (Independent non-executive director) D P H Burgess (Independent non-executive director) J K Knott (Chief Executive) B J Kruger (Chairman) J H Maree C J Sheridan (Independent non-executive director) H E Staunton (Independent non-executive director) G Vogel P Wharton-Hood None of the directors held any direct beneficial interest in the ordinary share capital of the group during the year or at 31 December 2012. Internal control and financial reporting The directors who held office at the date of approval of this report confirm that, as far as they are each aware, there is no relevant audit information of which the group’s auditors are unaware; and that each director has taken all steps that they ought to have taken as directors to make them aware of any relevant audit information, and to establish that the group’s auditors are aware of that information. The directors are responsible for internal control in the group and for reviewing its effectiveness. Procedures have been designed for safeguarding assets against unauthorised use or disposition; for maintaining proper accounting records; and for the reliability of financial information used within the business or for publication. Such procedures are designed to manage rather than eliminate the risk of failure to achieve business objectives and can only provide reasonable and not absolute assurance against material misstatement, errors, losses or fraud. The procedures that the directors have established are designed to provide effective internal control within the group. 09 Directors’ report continued Such procedures for the ongoing identification, evaluation and management of the significant risks faced by the group have been in place throughout the year and up to 27 February 2013, the date of approval of the consolidated annual report for the year ended 31 December 2012. The major sub-committees, supporting the governance committee in fulfilling its responsibilities, are the capital management committee, the risk management committee, regulatory compliance committee and the business infrastructure and projects committee. The directors and senior management of the group have adopted policies which set out the Board’s attitude to risk and internal control. Key risks identified by the directors are formally reviewed and assessed at least once a year by the Board, in addition to which key business risks are identified, evaluated and managed by operating management on an ongoing basis by means of procedures such as physical controls, credit and other authorisation limits and segregation of duties. Board audit committee The Board also receives regular reports on any risk matters that need to be brought to its attention. Significant risks identified in connection with the development of new activities are subject to consideration by the Board. There are well established budgeting procedures in place and reports are presented regularly to the Board detailing the results of each principal business unit, variances against budget and prior year, and other performance data. The effectiveness of the internal control system is reviewed regularly by the Board and the audit committee, which also receives reports of reviews undertaken by the internal audit function as well as reports from the external auditors which include details of internal control matters that they have identified. Certain aspects of the system of internal control are also subject to regulatory supervision, the results of which are monitored closely by the Board. Committees The Board delegates certain functions and responsibilities to the following committees. Governance committee This committee is responsible for the day-to-day management of the group. Subject to the overall authority of the Board, the committee meets regularly to develop business strategy, initiate and review strategic initiatives, review and approve annual business plans, monitor financial performance against budget, monitor risk and all matters related to regulatory responsibilities and review the activities of its sub-committees. Membership: The committee comprises executive directors and certain senior executives, currently, Jenny Knott (Chairperson), Mark Basten, Gert Vogel, Grant Joyce, Nicki Auret, Julia Strain, Chris Potter, Will Dennis, Ian Dalglish, Steven Wallace, Jerry Pearce, Chris Sweeney, Andrew King, Mike Crabb and Albert Maartens. This non-executive board committee monitors the process for identifying, evaluating and managing risks and controls. In particular, this includes the quality, integrity and reliability of compliance, financial and accounting control systems. The committee’s other responsibilities are to review the scope of external and internal audit, to receive regular reports from internal audit and KPMG Audit Plc, and to review the financial statements focusing in particular on accounting policies, areas of management judgement and estimates. The committee meets quarterly. Membership: Henry Staunton (Chairman), Mark Austen, Patrick Burgess and Christopher Sheridan. Board risk management committee The objective of this board committee is to provide an independent review and challenge to the group’s risk policies and the composition of the risk portfolio, its concentrations and the risktaking decisions of the group, covering all aspects of risk - market, credit, country, liquidity and operational. The committee complements the audit committee which also studies, inter alia, risk controls and their operation, but from a different perspective. The committee meets quarterly. Membership: Ben Kruger (Chairman), Mark Austen, Patrick Burgess, Jacko Maree, Christopher Sheridan and Henry Staunton. Board remuneration committee This non-executive committee approves remuneration policy and long term incentive schemes for staff, sets the remuneration of executive directors and other senior executives and approves guidelines for the group’s annual salary and incentive reviews. Membership: Christopher Sheridan (Chairman), Ben Kruger, Ted Woods, Jacko Maree and Henry Staunton. Transactions with directors and related parties There are no loans, arrangements or agreements that require disclosure under the Companies Act 2006 or International Accounting Standard IAS24 regarding transactions with related parties, other than those shown in notes to the financial statements. Directors’ liability insurance The group maintained directors’ and officers’ liability insurance during the twelve months ended 31 December 2012. 10 Standard Bank Plc Consolidated Annual Report 2012 Employees It is the group’s policy to ensure that all employees and job applicants are given equal opportunities and that they do not face discrimination on the grounds of ethnic origin, colour, nationality, marital same sex partnership or family status, religion, sex, age, sexual orientation, gender reassignment or disability. Should an employee become disabled during his or her career with the group all reasonable efforts will be made to ensure continued employment. Employee involvement in the group’s business is encouraged and information disseminated through communication meetings, and an internal staff publication. The group recognises its responsibilities to provide a safe working environment for all its staff and measures are in place to ensure that the Health and Safety at Work regulations are observed. Charitable Donations The group made charitable donations of US$363 984 during the year (2011: US$331 010). Payment of supplier’s policy The group is committed to maintaining a sound commercial relationship with its suppliers. Consequently, it is the group’s policy to negotiate and agree terms and conditions with its suppliers, which includes the giving of an undertaking to pay suppliers within 30 days of receipt of a correctly prepared invoice submitted in accordance with the terms of the contract. Auditors KPMG Audit Plc has indicated their willingness to continue as auditors of the group. Accordingly, a resolution is to be proposed at the next annual general meeting for the reappointment of KPMG Audit Plc as auditors of the group. By order of the Board S.C. Smollett Secretary 27 February 2013 20 Gresham Street London EC2V 7JE Registered in England and Wales No. 2130447 11 Remuneration policy statement This statement is intended to provide stakeholders with an understanding of Standard Bank Plc and its subsidiary’s (the group) remuneration philosophy and practices. The philosophy and practices are consistent with those of SBG. The group’s Remuneration Committee (Remco) continues to work with local regulators to ensure that the group’s remuneration philosophy and practices meet these developing requirements, maintain market competiveness and are consistent with, and promote, effective risk management. Principles that underpin our remuneration strategy SBG is committed to building the leading African financial services organisation, aimed to serve its customers through first class, onthe-ground operations in chosen countries in Africa and to connect other selected emerging markets to Africa and to each other. Consequently, we work to develop a depth and calibre of human resource that is capable of delivering sustainable growth within our agreed risk tolerance. At the heart of our strategy lies the value we place on our people. Therefore, effective management and remuneration of our talent must be a core competency in our group. Detailed below are the key principles against which we determine our reward strategy, design reward structures and determine individual reward: We n reward sustainable, long-term business results. We n do not discriminate between employees based on diversity or physical difference. The n reward focus is on total compensation, being fixed pay benefits and annual bonus. We seek to be competitive on both elements, but bonus is not a function of fixed pay. ensure that key employees are significantly invested in the SBG share price over time. Remuneration n designs optimise corporate tax deductibility and comply with all legal and regulatory requirements. In the wake of the global financial crisis increasing transparency is being demanded of remuneration practices and Remco is firmly committed to appropriate disclosure of reward principles and structures to all relevant stakeholders, including shareholders. Remuneration strategy As an integral part of growing and fortifying the group’s human capital, Remco regularly reviews the group’s remuneration policies, structures and practices, to ensure the principles behind the reward strategy and the elements of the strategy itself, are effective. The group has recently reviewed its remuneration strategy which includes the following: Reward n strategies and, ultimately, remuneration itself down to an individual level must enable the group, in a highly competitive environment, to attract, motivate and retain highcalibre people at all levels of the organisation. Remuneration n designs must motivate strong and sustained performance in teams, but also promote risk management in line with the group’s stated strategy and risk tolerance. The n balance between fixed and variable pay is appropriately structured according to seniority and roles, with particular care being given to risk and control areas. The intention is to provide both total compensation, and its composition, at market-competitive levels, drawing on relevant information from various sources, including external advisers. We determine all elements of pay based on an understanding of n annually approves the group’s primary bonus pools and oversees the principles applied in allocating these pools to business units and individual employees. These pools are shaped by a combination of SBG, group and business unit profitability and multi-year financial metrics, taking account of capital utilised, risks assumed and an evaluation of the business area’s future development and growth prospects. market remuneration levels and internal relative remuneration. Individual performance is measured according to an appropriate n Remuneration structures encourage a focus on achievement of n range of absolute and relative criteria, including the person’s quantitative delivery against specific metrics, qualitative individual behaviour and competitive performance. This measurement is integral to our remuneration practices and underpins strong differentiation in individual pay. We n create an appropriate balance between fixed pay and benefits, short-term and long-term incentives. A bonus deferral policy affects annual bonuses above pre-determined levels. Deferred amounts are linked to the SBG share price and vesting is subject to specific conditions. agreed deliverables and behaviours, rather than hours worked. Individual n performance appraisals identify key talent at all levels in the organisation, enabling fair, competitive remuneration to be paid. Individual n rewards are determined by SBG, group, business unit and individual performances. We reward experience and performance relative to others doing n similar work, as well as performance against the market. Individual reward differentiation is transparent, and is based on n quantitative and behavioural performance and the need for retention. 12 We n Remco n A portion n of annual bonus incentive, typically above a certain threshold, is deferred into a share price-linked programme with multiyear vesting and claw back provisions. A significant n portion of senior management reward is awarded in deferred instruments, the values of which are directly linked to the performance of the SBG share price over time. This harmonises personal interests with those of shareholders. Standard Bank Plc Consolidated Annual Report 2012 No n remuneration schemes are linked by formula to revenue generation. No multi-year guaranteed minimum bonus arrangements are permitted. Transparency n on remuneration designs and processes is maintained with employees and increasingly with shareholders. Wherever n available and relevant, market information is used to inform remuneration decisions. Stakeholders n must be enabled to make a reasonable assessment of reward practices, and members of Remco have unrestricted access to information that informs their independent judgements on the possible effects that remuneration may have on compliance with risk, regulatory and behavioural controls across the group. The n group aims to pay a comparable rate of pay against the local market for both fixed and variable compensation, but we need to ensure positioning against local market is fair across geographies. For employees deemed as ‘Code Staff’, as per the UK FSA regulations, deferral rates are either 40% or 60% depending on the level of the bonus. The deferred portion is delivered in Quanto stock units with a three year pro-rated vesting, plus an additional six months holding period after vesting. Half of the non-deferred portion is paid immediately in cash and the remaining 50% is delivered in Quanto shares with a six month vesting period. For ‘Non Code Staff’ a proportion of the incentive is deferred into Quanto stock units for incentives in excess of US$150,000. The deferral increases from 20% at US$150,000 to 60% deferral for the highest awards. The deferral portion applies to the entire bonus amount and is delivered in Quanto stock units with a three year pro-rated vesting period. Remco will continue to monitor the evolving regulatory landscape as it pertains to remuneration and will respond constructively as appropriate. This strategy forms the basis for reward processes within the group and all reward designs and practices are consistent with this strategy. Bonus deferral The group operates a deferred bonus arrangement in the form of the Quanto stock unit plan (the plan). The plan was developed in 2007 after a review of the remuneration strategy. The purpose of the plan was to strengthen the retention effect of incentive remuneration and to promote an equity ownership culture. Quanto stock units are linked to the SBG share price, but expressed in US dollars. The total annual incentive includes a deferred portion in the form of Quanto stock units. Deferred incentive awards are also designed to allow forfeiture or claw back during the vesting period in circumstances where, at Remco’s discretion, it is considered that an employee’s behaviour results in events that are detrimental, such as a material error by the employee, or misconduct that results in a material failure of risk management, or the relevant business unit suffers a material downturn in its financial performance. Deferred incentive awards are also designed to allow forfeiture or claw back during the vesting period in circumstances where: there n is reasonable evidence of misbehaviour or material error by the Participant; or the n Employer Company or the relevant business unit suffers a material downturn in its financial performance, for which the Participant can be seen to have some liability; or nthe Employer Company or the relevant business unit suffers a material failure of risk management, for which the Participant can be seen to have some liability. 13 Statement of directors’ responsibilities The directors are responsible for preparing the Annual Report and the group and company financial statements in accordance with applicable law and regulations. Company law requires the directors to prepare group and company financial statements for each financial year. Under that law they are required to prepare the group financial statements in accordance with International Financial Reporting Standards as adopted by the EU (IFRSs) and applicable law, and have elected to prepare the company financial statements on the same basis. Under company law the directors must not approve the financial statements unless they are satisfied that they give a true and fair view of the state of affairs of the group and company and of their profit or loss for that period. In preparing each of the group and company financial statements, the directors are required to: select n suitable accounting policies and then apply them consistently; make n judgements and estimates that are reasonable and prudent; state n whether they have been prepared in accordance with IFRSs; and prepare n the financial statements on the going concern basis unless it is inappropriate to presume that the group and the company will continue in business. The directors are responsible for keeping adequate accounting records that are sufficient to show and explain the company’s transactions and disclose with reasonable accuracy at any time the financial position of the company and enable them to ensure that its financial statements comply with the Companies Act 2006. They have general responsibility for taking such steps as are reasonably open to them to safeguard the assets of the group and to prevent and detect fraud and other irregularities. The directors are responsible for the maintenance and integrity of the corporate and financial information included on the company’s website. Legislation in the UK governing the preparation and dissemination of financial statements may differ from legislation in other jurisdictions. 14 Standard Bank Plc Consolidated Annual Report 2012 Independent auditor’s report to the members of Standard Bank Plc We have audited the financial statements of Standard Bank Plc for the year ended 31 December 2012, set out on pages 16 to 104. The financial reporting framework that has been applied in their preparation is applicable law and International Financial Reporting Standards as adopted by the EU and, as regards the parent company financial statements, as applied in accordance with the provisions of the Companies Act 2006. This report is made solely to the company’s members, as a body, in accordance with chapter 3 of part 16 of the Companies Act 2006. Our audit work has been undertaken so that we might state to the company’s members those matters we are required to state to them in an auditor’s report and for no other purpose. To the fullest extent permitted by law, we do not accept or assume responsibility to anyone other than the company and the company’s members, as a body, for our audit work, for this report, or for the opinions we have formed. Respective responsibilities of directors and auditors As explained more fully in the statement of directors’ responsibilities set out on page 14, the directors are responsible for the preparation of the financial statements and for being satisfied that they give a true and fair view. Our responsibility is to audit, and express an opinion on, the financial statements in accordance with applicable law and International Standards on Auditing (UK and Ireland). Those standards require us to comply with the Auditing Practices Board’s Ethical Standards for Auditors. Scope of the audit of the financial statements A description of the scope of an audit of financial statements is provided on the Financial Reporting Council’s website at www.frc.org.uk/auditscopeukprivate. the n parent company financial statements have been properly prepared in accordance with International Financial Reporting Standards as adopted by the EU and as applied in accordance with the provisions of the Companies Act 2006; and the n financial statements have been prepared in accordance with the requirements of the Companies Act 2006. Opinion on other matter prescribed by the Companies Act 2006 In our opinion the information given in the directors’ report for the financial year for which the financial statements are prepared is consistent with the financial statements. Matters on which we are required to report by exception We have nothing to report in respect of the following matters where the Companies Act 2006 requires us to report to you if, in our opinion: adequate n accounting records have not been kept by the parent company, or returns adequate for our audit have not been received from branches not visited by us; or the n parent company financial statements are not in agreement with the accounting records and returns; or certain n disclosures of directors’ remuneration specified by law are not made; or we n have not received all the information and explanations we require for our audit. Under the Listing Rules we are required to review; the n directors’ statement, set out on page 4, in relation to going concern. Opinion on financial statements In our opinion: the n financial statements give a true and fair view of the state of the group’s and of the parent company’s affairs as at 31 December 2012 and of the group’s loss for the year then ended; the n group financial statements have been properly prepared in accordance with International Financial Reporting Standards as adopted by the EU; Michael Peck for and on behalf of KPMG Audit Plc, Statutory Auditor Chartered Accountants 15 Canada Square, London E14 5GL 27 February 2013 15 Consolidated statement of financial position at 31 December 2012 2012 2011 Note $m $m Balances with central banks 3 2 228.2 - Derivative assets 4 4 812.9 6 993.5 Trading assets 5 6 848.1 6 541.0 Financial investments 6 36.8 68.2 Pledged assets 7 503.7 126.8 Loans and advances 8 6 160.8 13 023.8 Loans and advances to banks 8 3 084.5 7 416.1 Loans and advances to customers 8 3 076.3 5 607.7 9 404.8 399.2 - 16.3 Assets Other assets Current tax asset Deferred tax asset 10 20.0 48.2 Intangible assets 12 47.9 91.8 Property and equipment 13 Total assets 27.8 35.4 21 091.0 27 344.2 19 716.4 25 645.3 Liabilities and equity Liabilities Derivative liabilities 4 5 254.5 7 324.3 Trading liabilities 14 2 274.3 2 133.3 Deposit and current accounts 15 10 408.8 14 483.6 Deposits from banks 15 8 032.0 11 532.8 Deposits from customers 15 2 376.8 2 950.8 16 726.4 663.8 5.9 8.1 Other liabilities Current tax liability Deferred tax liability 10 1.2 0.2 Subordinated debt 17 1 045.3 1 032.0 1 374.6 1 698.9 1 083.5 1 083.5 Equity Equity attributable to ordinary shareholders Ordinary share capital 22 Ordinary share premium Reserves Total liabilities and equity 431.0 431.0 (139.9) 184.4 21 091.0 27 344.2 The accounting policies and notes on pages 24 to 104 should be read as part of the financial statements. Approved by the Board of Directors and signed on its behalf on 27 February 2013. B.J. Kruger, Chairman 16 J.K. Knott, Chief Executive Standard Bank Plc Consolidated Annual Report 2012 Consolidated income statement for the year ended 31 December 2012 2012 Note Net interest income $m $m 59.2 148.1 Interest income 24 .1 193.0 355.7 Interest expense 24 .2 (133.8) (207.6) 24 .3 510.8 511.1 178.7 218.0 Fees and commission revenue 46.9 147.0 Fees and commission expenses (13.2) (17.7) Revenue sharing and fee arrangements with group companies 145.0 88.7 253.3 293.1 78.8 - 570.0 659.2 Non-interest revenue Net fees, commission and revenue sharing arrangements Trading revenue Other revenue Total income Credit impairment charge 24 .4 Income after impairments Operating expenses (142.2) (135.0) 427.8 524.2 (662.1) (532.7) Staff costs 24 .5 (354.0) (327.2) Other operating expenses 24 .6 (215.2) (166.6) Indirect taxation 24 .7 (19.0) (10.3) Restructuring costs 24 .8 (73.9) (28.6) (234.3) (8.5) Loss before disposal of loan portfolio (Loss)/profit on disposal of loan portfolio 28 .2 Loss from operations Income tax (charge)/credit Loss attributable to equity shareholders (51.8) (286.1) 25 (Loss)/profit for the year from continuing operations Discontinued operations 1 20111 (2.3) (288.4) 26 6.0 (2.5) 27.5 25.0 (44.0) (46.1) (332.4) (21.1) 2011 figures reclassified in line with current year presentation. Refer to note 31. The accounting policies and notes on pages 24 to 104 should be read as part of the financial statements. 17 Consolidated statement of comprehensive income for the year ended 31 December 2012 2012 Note Loss attributable to equity shareholders $m 2011 $m (332.4) (21.1) (0.3) (1.6) 5.6 (8.3) Effective portion of changes in fair value 21.0 (1.0) Net amount transferred to profit or loss (15.4) (7.3) Items that may be subsequently reclassified to profit or loss1 Foreign currency translation reserve Cash flow hedging reserve Available-for-sale reserve Changes in fair value Net realised amount transferred to profit or loss Total comprehensive loss attributable to equity shareholders 1 18 24.3 2.7 - 46.4 - (43.7) - (324.4) Amounts are presented net after tax. Income tax relating to each component of other comprehensive income is disclosed in note 10. (31.0) Standard Bank Plc Consolidated Annual Report 2012 Consolidated statement of changes in shareholders’ equity for the year ended 31 December 2012 Ordinary share capital and share premium $m Balance at 1 January 2011 1 364.5 Total comprehensive loss for the year Equity-settled share-based payment transactions 1 Issue of share capital and share premium Foreign currency translation reserve $m Retained earnings $m Total equity $m - 6.7 202.4 1 580.1 - (1.6) (21.1) (31.0) (0.2) (0.2) Cash flow hedging reserve $m Availablefor-sale reserve $m 6.5 (8.3) - - - - 150.0 - - - - 150.0 Balance at 31 December 2011 1 514.5 (1.8) - 5.1 181.1 1 698.9 Balance at 1 January 2012 1 514.5 (1.8) - 5.1 181.1 1 698.9 (0.3) (332.4) Total comprehensive income/(loss) for the year Equity-settled share-based payment transactions Issue of share capital and share premium Balance at 31 December 2012 1 1 - 5.6 2.7 - - - - 0.1 - - - - - 2.7 4.8 1 514.5 3.8 (324.4) 0.1 - (151.2) 1 374.6 Represents a capital contribution from the ultimate parent related to long-term equity incentive awards. 19 Consolidated statement of cash flows for the year ended 31 December 2012 Note 2012 2011 $m $m Cash flows from operating activities Loss before direct taxation - Continuing operations - Discontinued operations 26 (286.1) (2.5) (14.0) (72.6) (57.2) (145.3) Adjusted for: Net interest income Amortisation of intangible assets 26.3 28.1 Impairment of intangible assets 25.1 10.4 - 4.0 Depreciation of property and equipment 10.5 13.8 Non-cash flow movements on subordinated debt 13.6 55.4 Cash-settled share-based payments 53.1 51.2 Equity-settled share-based payments (1.3) 2.0 Impairment of property and equipment Net credit impairments raised and released 24.4 Discount element recognised from credit impairments against loans and advances Loss/(profit) on disposal of loan portfolio Provisions for severance 142.6 (0.1) 51.8 (6.0) - (0.4) (35.6) Changes in operating funds 145.1 - 83.1 1 787.8 (1 795.2) Decrease in income-earning assets 27.1 5 583.9 2 633.9 Decrease in deposits and other liabilities 27.2 (3 796.1) (4 429.1) Interest received Interest paid Tax received/(paid) 27.3 Net cash flows from /(used in) operating activities 213.2 437.6 (145.6) (223.8) 9.2 (3.8) 1 829.0 (1 502.1) (7.5) (14.7) (2.9) (7.9) (10.4) (22.6) Cash flows used in investing activities Capital expenditure on - intangible assets - property and equipment Cash flows used in investing activities Net cash flows from financing activities Proceeds from issue of ordinary share capital to shareholders - 150.0 Redemption of subordinated debt 22 - (25.0) Net cash flows generated from financing activities - 125.0 Effects of exchange rate changes on cash and cash equivalents 1.4 (5.6) Net increase/(decrease) in cash and cash equivalents 1 820.0 (1 405.3) Cash and cash equivalents at beginning of the year 1 254.2 2 659.5 3 074.2 1 254.2 Cash and cash equivalents at end of the year 20 27.4 Standard Bank Plc Consolidated Annual Report 2012 Company statement of financial position at 31 December 2012 2012 2011 Note $m $m Balances with central banks 3 2 228.2 - Derivative assets 4 4 780.6 7 019.7 Trading assets 5 6 774.4 6 528.8 Financial investments 6 56.9 85.9 Pledged assets 7 503.7 126.8 Loans and advances 8 6 175.3 13 010.8 Loans and advances to banks 8 3 071.7 7 342.7 Loans and advances to customers 8 3 103.6 5 668.1 9 327.6 314.3 - 16.3 Assets Other assets Current tax asset Deferred tax asset 10 20.0 48.2 Investment in group company 11 16.0 16.0 Intangible assets 12 47.9 91.8 Property and equipment 13 27.2 34.4 20 957.8 27 293.0 19 647.7 25 645.9 4 5 205.7 7 322.4 Trading liabilities 14 2 274.3 2 133.3 Deposit and current accounts 15 10 414.1 14 507.8 Deposits from banks 15 7 999.9 11 534.0 Deposits from customers 15 2 414.2 2 973.8 16 708.2 648.4 0.1 2.0 1 045.3 1 032.0 1 310.1 1 647.1 1 083.5 1 083.5 431.0 431.0 (204.4) 132.6 20 957.8 27 293.0 Total assets Liabilities and equity Liabilities Derivative liabilities Other liabilities Current tax liability Subordinated debt 17 Equity Equity attributable to ordinary shareholders Ordinary share capital 22 Ordinary share premium Reserves Total liabilities and equity The accounting policies and notes on pages 24 to 104 should be read as part of the financial statements. Approved by the Board of Directors and signed on its behalf on 27 February 2013. B.J. Kruger, Chairman J.K. Knott, Chief Executive 21 Company statement of changes in shareholders’ equity for the year ended 31 December 2012 Balance at 1 January 2011 Total comprehensive loss for the year Equity-settled share-based payment transactions Cash flow hedging reserve $m Availablefor-sale reserve $m Retained earnings $m Total equity $m 1 364.5 6.5 - 209.7 1 580.7 (8.3) - (75.1) (83.4) - - (0.2) (0.2) - 1 Issue of share capital and share premium - - - 150.0 Balance at 31 December 2011 1 514.5 150.0 (1.8) - 134.4 1 647.1 Balance at 1 January 2012 1 514.5 (1.8) - 134.4 1 647.1 Total comprehensive profit / (loss) for the year Equity-settled share-based payment transactions Issue of share capital and share premium Balance at 31 December 2012 1 22 Ordinary share capital and share premium $m 1 - 5.6 2.7 - - - - - - 1 514.5 3.8 2.7 Represents a capital contribution from the ultimate parent related to long-term equity incentive awards. (345.4) 0.1 (210.9) (337.1) 0.1 1 310.1 Standard Bank Plc Consolidated Annual Report 2012 Company statement of cash flows for the year ended 31 December 2012 Note 2012 2011 $m $m Net cash flows from/(used in) operating activities Loss before direct taxation - Continuing operations - Discontinued operations (300.8) (21.7) (18.1) (115.7) (57.3) (145.0) Adjusted for: Net interest income Amortisation of intangible assets 26.3 28.1 Impairment of intangible assets 25.1 10.4 - 4.0 Depreciation of property and equipment 10.0 13.3 Non-cash flow movements on subordinated debt 13.6 55.4 Cash-settled share-based payments 53.1 51.2 Equity-settled share-based payments (1.3) 2.0 Impairment of property and equipment Net credit impairments raised and released 142.6 Discount element recognised from credit impairments against loans and advances Loss/(profit) on disposal of loan portfolio Provisions for severance (0.1) 51.8 (6.0) - (55.0) Changes in operating funds 192.2 - (0.4) 67.7 1 819.3 (1 819.2) Decrease in income-earning assets 27.1 5 626.4 2 572.5 Decrease in deposits and other liabilities 27.2 (3 807.1) (4 391.7) Interest received Interest paid Tax received/(paid) 27.3 Net cash flows from/(used in) operating activities 213.4 437.2 (145.6) (223.7) 15.3 (0.5) 1 847.4 (1 538.5) Cash flows used in investing activities Capital expenditure on - intangible assets (7.5) (14.7) (2.8) (7.1) (10.3) (21.8) - property and equipment Cash flows used in investing activities Net cash flows from financing activities Proceeds from issue of ordinary share capital to shareholders - 150.0 Redemption of subordinated debt 22 - (25.0) Net cash flows generated from financing activities - 125.0 Effects of exchange rate changes on cash and cash equivalents Net increase/(decrease) in cash and cash equivalents 1.6 1 838.7 (4.0) (1 439.3) Cash and cash equivalents at beginning of the year 1 198.8 2 638.1 3 037.5 1 198.8 Cash and cash equivalents at end of the year 27.4 23 Significant accounting policies The principal accounting policies applied in the presentation of the annual financial statements are set out below. Adoption of new standards and interpretations effective for the current financial year 1. Basis of preparation The group adopted the following IFRS prospectively as of 1 January 2012: Both the company financial statements and the group consolidated financial statements have been prepared in accordance with International Financial Reporting Standards as adopted by the EU (IFRSs) and the interpretations of the International Financial Reporting Committee (IFRIC). In publishing the company financial statements here together with the group financial statements, the company has taken advantage of the exemption in s408 of the Companies Act 2006 not to present its individual income statement and related notes that form part of these financial statements. The annual financial statements have been prepared on the historical cost basis except for the following material items in the statement of financial position: available-for-sale n financial assets, financial assets and liabilities at fair value through profit or loss, liabilities for cashsettled share-based payment arrangements, that are measured at fair value. The current economic environment remains challenging and the group has reported a loss attributable to equity shareholders. Management continues to develop the business operating model in order to align with the Standard Bank Group (SBG) strategy and respond to prevailing market conditions. The Investment Banking (IB) business is now conducted on the Standard Bank of South Africa’s (SBSA) balance sheet and the legacy loan portfolio has been transferred to SBSA. The group receives revenue under appropriate transfer pricing arrangements as compensation for these activities. In addition, the exit or scaling back of certain business lines and geographies has been carried out and stringent cost reductions, including a staff retrenchment programme, implemented. As a result of these strategic measures, the group is exposed to significantly lower credit risk and benefits from a lower cost base. The group maintains a strong capital and liquidity position and SBG has confirmed its undertaking of support in respect of Standard Bank Plc (SB Plc), in terms of which SBG confirms that it will ensure that, except in the case of political risk, SB Plc will be able to meet its contractual liabilities. SBG has additionally committed, with the prior approval of the South African Reserve Bank, to ensure that SB Plc continues to meet its minimum regulatory capital requirements. Having considered the factors set out above, the group continues to adopt the going concern basis in preparing the annual financial statements. Changes in accounting policies The accounting policies are consistent with those adopted in the previous year, except for the following: 24 IFRS n 7 Financial Instruments: Disclosures – Transfers of Financial Assets (revised 2010). Early adoption of amended standards and interpretations The group has early adopted the following amended IFRS as of 1 January 2012: IAS n 1 Presentation of Financial Statements (2011 Improvements to IFRS); IAS n 16 Property, Plant and Equipment (2011 Improvements to IFRS); and IAS n 32 Financial Instruments: Presentation (2011 Improvements to IFRS). The revised IFRS did not have any effect on the group’s reported earnings or financial statement position but have affected the group’s disclosures with no material impact on the group’s accounting policies. The principal accounting policies applied in the presentation of the annual financial statements are set out below. 2. Basis of consolidation Subsidiaries The annual financial statements of subsidiaries are consolidated from the date on which the group acquires control, up to the date that control ceases. For this purpose, subsidiaries are entities over which the group, directly or indirectly, has the power to govern the financial and operating policies to obtain benefits from its activities. The existence and effect of potential voting rights that are currently exercisable or convertible are considered when assessing whether the group controls another entity. Intragroup transactions, balances and unrealised gains and losses are eliminated on consolidation. Unrealised losses are eliminated in the same manner as unrealised gains, but only to the extent that there is no evidence of impairment. The accounting policies of subsidiaries that are consolidated by the group conform to these policies. Investments in subsidiaries are accounted for at cost less impairment losses in the separate financial statements. The carrying amounts of these investments are reviewed annually and impaired when necessary. Standard Bank Plc Consolidated Annual Report 2012 Special purpose entities Transactions and balances Special purpose entities (SPE) are entities that are created to accomplish a narrow and well-defined objective and may take different legal forms. A special purpose entity is consolidated when the substance of the relationship between the group and the special purpose entity indicates that the group bears the majority of the residual risk or reward. Circumstances that may indicate a relationship in which, in substance, the group controls and consequently consolidates an SPE are when the activities of the SPE are being conducted on behalf of the group according to its specific business needs so that the group obtains benefits from the SPE’s operation. Foreign currency transactions are translated into the respective functional currencies of group entities at exchange rates prevailing at the date of the transactions. Foreign exchange gains and losses resulting from the settlement of such transactions and from the translation of monetary assets and liabilities denominated in foreign currencies at year end exchange rates, are recognised in profit or loss (except when recognised in OCI as a qualifying cash flow hedge). 3. Foreign currency translations Functional and presentation currency Items included in the financial statements of each of the group’s entities are measured using the currency of the primary economic environment in which the entity operates (functional currency). The consolidated and company financial statements are presented in US dollars and all amounts, unless otherwise indicated, are stated in millions of dollars (US$ million). Group companies The results and financial position of all foreign operations that have a functional currency different from the group’s presentation currency are translated into the group’s presentation currency as follows: assets n and liabilities (including goodwill, intangible assets and fair value adjustments arising on acquisition) are translated at the closing rate on the reporting date; income n and expenses are translated at average exchange rates for the month, to the extent that such average rates approximate actual rates; and all n resulting foreign exchange differences are accounted for directly in a separate component of other comprehensive income (OCI), being the foreign currency translation reserve. On the partial disposal of a subsidiary that includes a foreign operation, a proportionate share of the balance of the foreign currency translation reserve is transferred to the non-controlling interests. For all other partial disposals of a foreign operation, the proportionate share of the balance of the foreign currency translation reserve is reclassified to profit or loss. Non-monetary assets and liabilities denominated in foreign currencies that are measured at historical cost are translated using the exchange rate at the transaction date, and those measured at fair value are translated at the exchange rate at the date that the fair value was determined. Exchange rate differences on nonmonetary items are accounted for based on the classification of the underlying items. Foreign exchange gains and losses on equities (debt) classified as available-for-sale financial assets are recognised in the available-for-sale reserve in OCI (profit or loss) whereas the exchange differences on equities and debt that are classified as held at fair value through profit or loss are reported as part of the fair value gain or loss in profit or loss. Foreign currency gains and losses on intra-group loans are recognised in profit or loss except where the settlement of the loan is neither planned nor likely to occur in the foreseeable future. In these cases the foreign currency gains and losses are recognised in the group’s foreign currency translation reserve. These gains and losses are recognised in profit or loss either on disposal (loss of control of a subsidiary, loss of significant influence over an associate or the loss of joint control over a jointly controlled entity that includes a foreign operation) or partial disposal (a reduction in ownership interest in a foreign operation other than a disposal) of an associate or jointly controlled entity that includes a foreign operation. In the case of a partial disposal of a subsidiary that includes a foreign operation, the proportionate share of the cumulative amount of the exchange differences recognised in OCI is reclassified to the noncontrolling interests in that foreign operation. 4. Cash and cash equivalents Cash and cash equivalents disclosed in the statement of cash flows consist of cash balances with central banks together with other highly liquid short-term placements available on demand. These balances are subject to insignificant changes in fair value and are reported at amortised cost. 5. Financial instruments Initial recognition and measurement On disposal (where a change in ownership occurs and control is lost) of a subsidiary that includes a foreign operation, the relevant amount in the foreign currency translation reserve is reclassified to profit or loss at the time at which the profit or loss on disposal of the foreign operation is recognised. Financial instruments include all financial assets and liabilities. These instruments are typically held for liquidity, investment, trading or hedging purposes. All financial instruments are initially recognised at fair value plus directly attributable transaction costs, except those carried at fair value through profit or loss 25 Significant accounting policies continued where transaction costs are recognised immediately in profit or loss. Financial instruments are recognised/(derecognised) on the date the group commits to purchase/(sell) the instruments (trade date accounting). Subsequent measurement Subsequent to initial measurement, financial instruments are measured either at fair value or amortised cost, depending on their classifications as follows: Held-for-trading assets and liabilities Held-for-trading assets and liabilities include those financial assets and liabilities acquired or incurred principally for the purpose of selling or repurchasing in the near term, those forming part of a portfolio of identified financial instruments that are managed together and for which there is evidence of a recent actual pattern of short-term profit-taking, and commodities that are acquired principally by the group for the purpose of selling in the near future and generating a profit from fluctuations in price or broker-traders’ margin. Derivatives are always categorised as held-for-trading. Subsequent to initial recognition, the financial instruments’ fair values are remeasured at each reporting date. All gains and losses, including interest and dividends, arising from changes in fair value are recognised in profit or loss as trading revenue within non-interest revenue with the exception of derivatives that are designated and effective as hedging instruments in cash flow hedge relationships (refer to Derivative financial instruments and hedge accounting). Financial assets and liabilities designated at fair value through profit or loss The group designates certain financial assets and liabilities, other than those classified as held-for-trading, as at fair value through profit or loss when: this n designation eliminates or significantly reduces an accounting mismatch that would otherwise arise. Under this criterion, the main classes of financial instruments designated by the group are loans and advances to banks and customers and financial investments. The designation significantly reduces measurement inconsistencies that would have otherwise arisen, for example where the related derivatives were treated as held-for-trading and the underlying financial instruments were carried at amortised cost; of financial assets, financial liabilities or both are managed, and their performance evaluated, on a fair value basis in accordance with a documented risk management or investment strategy, and reported to the group’s key management personnel on a fair-value basis. Under this criterion, certain private equity investments, acquired NPL portfolios and other investment portfolios have been designated at fair value through profit or loss; or The fair value designation is made on initial recognition and is irrevocable. Subsequent to initial recognition, the fair values are remeasured at each reporting date. Gains and losses arising from changes in fair value are recognised in interest income (expense) for all debt financial assets (financial liabilities) and in other revenue within non-interest revenue for all equity instruments. Available-for-sale Financial assets classified by the group as available-for-sale are generally strategic capital investments held for an indefinite period of time, which may be sold in response to needs for liquidity or changes in interest rates, exchange rates or equity prices, or non-derivative financial assets that are not classified within another category of financial assets. Available-for-sale financial assets are subsequently measured at fair value. Unrealised gains or losses are recognised directly in the available-for-sale reserve until the financial asset is derecognised or impaired. When debt / (equity) available-for-sale financial assets are disposed of, the cumulative fair value adjustments in OCI are reclassified to interest income / (other revenue). Interest income, calculated using the effective interest rate method, is recognised in profit or loss. Dividends received on available-for-sale instruments are recognised in profit or loss when the group’s right to receive payment has been established. Loans and receivables Loans and receivables are non-derivative financial assets with fixed or determinable payments that are not quoted in an active market, other than those classified by the group as at fair value through profit or loss or available-for-sale. Loans and receivables are measured at amortised cost using the effective interest method, less any impairment losses. Origination transaction costs and origination fees received that are integral to the effective rate are capitalised to the value of the loan and amortised through interest income as part of the effective interest rate. The majority of the group’s loans and advances are included in the loans and receivables category. Financial liabilities at amortised cost Financial liabilities that are neither held for trading nor designated at fair value are measured at amortised cost. groups n financial n instruments contain one or more embedded derivatives that significantly modify the instruments’ cash flows. 26 Reclassification of financial assets The group may choose to reclassify non-derivative trading assets out of the held-for-trading category if the financial asset is no longer held for the purpose of selling it in the near term. Financial assets that would not otherwise have met the definition of loans and receivables are permitted to be reclassified out of the heldfor-trading category only in rare circumstances. In addition, the group may choose to reclassify financial assets that would meet the definition of loans and receivables out of the held-for-trading Standard Bank Plc Consolidated Annual Report 2012 or available-for-sale categories if the group, at the date of reclassification, has the intention and ability to hold these financial assets for the foreseeable future or until maturity. arm’s-length transactions, discounted cash flow analyses, pricing models and other valuation techniques commonly used by market participants. Derivatives or any financial instrument designated at fair value through profit or loss shall not be reclassified out of their respective categories. Where discounted cash flow analyses are used, estimated future cash flows are based on management’s best estimates and a market related discount rate at the reporting date for a financial asset or liability with similar terms and conditions. Reclassifications are made at fair value as of the reclassification date. Effective interest rates for financial assets reclassified to loans and receivables, held-to-maturity and available-for-sale categories are determined at the reclassification date. Subsequent increases in estimates of cash flows adjust the financial asset’s effective interest rates prospectively. On reclassification of a trading asset, all embedded derivatives are reassessed and, if necessary, accounted for separately. Where the fair value of investments in unquoted equity instruments and derivatives that are linked to and must be settled by delivery of such unquoted equity instruments are unable to be reliably determined, those instruments are measured at cost less impairment losses. Impairment losses on these financial assets are not reversed. Impairment of financial assets Assets carried at amortised cost Fair value Fair value is the amount for which an asset could be exchanged, or a liability settled, between knowledgeable, willing parties in an arm’s-length transaction. The best evidence of the fair value of a financial instrument on initial recognition is the transaction price, that is, the fair value of the consideration paid or received, unless the fair value is evidenced either by comparison with other observable current market transactions in the same instrument, without modification or repackaging, or based on valuation techniques such as discounted cash flow models and option pricing models whose variables include only data from observable markets. When such valuation models, with only observable market data as inputs, or the comparison with other observable current market transactions in the same instrument indicate that the fair value differs from the transaction price, this initial difference, commonly referred to as day one profit or loss, is recognised in profit or loss immediately. If non-observable market data is used as part of the input to the valuation models or where the fair value of the financial instrument is not able to be evidenced by comparison with other observable current market transactions in the same instrument the resulting difference between the transaction price and the model value is deferred. The timing of the recognition of deferred day one profit or loss is determined individually. It is either amortised over the life of the transaction, deferred until the instrument’s fair value can be determined using market observable inputs, or realised through settlement, depending on the nature of the instrument and availability of market observable inputs. Subsequent to initial recognition, the fair values of financial assets and liabilities are based on quoted market prices or dealer price quotations for financial instruments traded in active markets. If the market for a financial asset is not active or the instrument is unlisted, the fair value is determined using other applicable valuation techniques. These include the use of recent The group assesses at each reporting date whether there is objective evidence that a loan or group of loans is impaired. A loan or group of loans is impaired if objective evidence indicates that a loss event has occurred after initial recognition which has a negative effect on the estimated future cash flows of the loan or group of loans that can be estimated reliably. Criteria that are used by the group in determining whether there is objective evidence of impairment include: nknown cash flow difficulties experienced by the borrower; a breach n of contract, such as default or delinquency in interest and/or principal payments; nbreaches of loan covenants or conditions; it becoming n probable that the borrower will enter bankruptcy or other financial reorganisation; and where n the group, for economic or legal reasons relating to the borrower’s financial difficulty, grants the borrower a concession that the group would not otherwise consider. The group first assesses whether there is objective evidence of impairment individually for loans that are individually significant, and individually or collectively for loans that are not individually significant. Non-performing loans include those loans for which the group has identified objective evidence of default, such as a breach of a material loan covenant or condition as well as those loans for which instalments are due and unpaid for 90 days or more. The impairment of non-performing financial loans takes into account past loss experience adjusted for changes in economic conditions and the nature and level of risk exposure since the recording of the historic losses. When a loan carried at amortised cost has been identified as specifically impaired, the carrying amount of the loan is reduced to an amount equal to the present value of its estimated future cash flows, including the recoverable amount of any collateral, discounted at the financial asset’s original effective interest rate. 27 Significant accounting policies continued The carrying amount of the loan is reduced through the use of a specific credit impairment account and the loss is recognised as a credit impairment charge in profit or loss. The calculation of the present value of the estimated future cash flows of collateralised financial assets recognised on an amortised cost basis includes cash flows that may result from foreclosure less costs of obtaining and selling the collateral, whether or not foreclosure is probable. If the group determines that no objective evidence of impairment exists for an individually assessed loan, whether significant or not, it includes the loan in a group of financial loans with similar credit risk characteristics and collectively assesses for impairment. Loans that are individually assessed for impairment and for which an impairment loss is recognised are not included in a collective assessment for impairment. Impairment of groups of loans that are assessed collectively is recognised where there is objective evidence that a loss event has occurred after the initial recognition of the group of loans but before the reporting date. In order to provide for latent losses in a group of loans that have not yet been identified as specifically impaired, a credit impairment for incurred but not reported losses is recognised based on historic loss patterns and estimated emergence periods, being the time period between the loss trigger events and the date on which the group identifies the losses. Groups of loans are also impaired when adverse economic conditions develop after initial recognition, which may impact future cash flows. The carrying amount of groups of loans is reduced through the use of a portfolio credit impairment account and the loss is recognised as a credit impairment charge in profit or loss. Increases in loan impairments and any subsequent reversals thereof, or recoveries of amounts previously impaired (including loans that have been written off), are reflected within credit impairment charges in profit or loss. Previously impaired loans are written off once all reasonable attempts at collection have been made and there is no realistic prospect of recovering outstanding amounts. Any subsequent reductions in amounts previously impaired are reversed by adjusting the allowance account with the amount of the reversal recognised as a reduction in impairment for credit losses in profit or loss. Available-for-sale financial assets Available-for-sale financial assets are impaired if there is objective evidence of impairment, resulting from one or more loss events that occurred after initial recognition but before the reporting date, that have a negative impact on the future cash flows of the asset. In addition, an available-for-sale equity instrument is considered to be impaired if a significant or prolonged decline in the fair value of the instrument below its cost has occurred. In that instance, the cumulative loss, measured as the difference between the acquisition price and the current fair value, less any previously recognised impairment losses on that financial asset, is reclassified from OCI to profit or loss. If, in a subsequent period, the amount relating to an impairment loss decreases and the decrease can be linked objectively to an event occurring after the impairment loss was recognised in profit or loss, the impairment loss is reversed through profit or loss for available-for-sale debt instruments. Any reversal of an impairment loss in respect of an available-for-sale equity instrument is recognised directly in OCI. Offsetting financial instruments Financial assets and liabilities are offset and the net amount reported in the statement of financial position when there is a legally enforceable right to set-off the recognised amounts and there is an intention to settle the asset and the liability on a net basis, or to realise the asset and settle the liability simultaneously. Income and expenses are presented on a net basis only when permitted by the accounting standards, or for gains and losses arising from a group of similar transactions. Derivative financial instruments and hedge accounting Renegotiated loans A derivative is a financial instrument whose value changes in response to an underlying variable, requires no initial net investment or an initial net investment that is smaller than would be required for other types of contracts that would be expected to have a similar response to changes in market factors and is settled at a future date. Derivatives are initially recognised at fair value on the date on which the derivatives are entered into and subsequently remeasured at fair value as described under the fair value policy above. Loans that would otherwise be past due or impaired and whose terms have been renegotiated and exhibit the characteristics of a performing loan are reset to performing loan status. Loans whose terms have been renegotiated are subject to ongoing review to determine whether they are considered to be impaired or past due. All derivative instruments are carried as assets when the fair value is positive and as liabilities when the fair value is negative, subject to offsetting principles as described under the heading “Offsetting financial instruments”. Subsequent to impairment, the effects of discounting unwind over time as interest income. 28 The effective interest rate of renegotiated loans that have not been derecognised (described under the heading “Derecognition of financial instruments”), is redetermined based on the loan’s renegotiated terms. Standard Bank Plc Consolidated Annual Report 2012 Embedded derivatives included in hybrid instruments are treated and disclosed as separate derivatives when their economic characteristics and risks are not closely related to those of the host contract, the terms of the embedded derivative are the same as those of a stand-alone derivative and the combined contract is not measured at fair value through profit or loss. The financial host contracts are accounted for and measured applying the rules of the relevant financial instrument category. The method of recognising fair value gains and losses depends on whether the derivatives are designated as hedging instruments, and if so, the nature of the hedge relationship, or if they are classified as held-for-trading. Cash flow hedges The effective portion of changes in the fair value of derivatives that are designated and qualify as cash flow hedges is recognised in the cash flow hedging reserve. The ineffective part of any changes in fair value is recognised immediately in profit or loss as trading revenue. Amounts recognised in OCI are transferred to profit or loss in the periods in which the hedged forecast cash flows affect profit or loss. However, when the forecast transaction that is hedged results in the recognition of a non-financial asset or a nonfinancial liability, the cumulative gains or losses recognised previously in OCI are transferred and included in the initial measurement of the cost of the asset or liability. Derivatives that qualify for hedge accounting When derivatives are designated in a hedge relationship, the group designates them as either: hedges n of the fair value of recognised financial assets or liabilities or firm commitments (fair value hedges); or hedges n of highly probable future cash flows attributable to a recognised asset or liability, a forecast transaction, or a highly probable forecast intragroup transaction in the consolidated annual financial statements (cash flow hedges). Hedge accounting is applied to derivatives designated in this way provided certain criteria are met. The group documents, at the inception of the hedge relationship, the relationship between hedged items and hedging instruments, as well as its risk management objective and strategy for undertaking various hedging relationships. The group also documents its assessment, both at the inception of the hedge and on an ongoing basis, of whether the hedging instruments are highly effective in offsetting changes in fair values or cash flows of hedged items. Fair value hedges Where a hedging relationship is designated as a fair value hedge, the hedged item is adjusted for the change in fair value in respect of the risk being hedged. Gains or losses on the remeasurement of both the derivative and the hedged item are recognised in profit or loss. Fair value adjustments relating to the hedging instrument are allocated to the same line item in profit or loss as the related hedged item. Any hedge ineffectiveness is recognised in profit or loss as trading revenue. If the derivative expires, is sold, terminated, exercised, no longer meets the criteria for fair value hedge accounting, or the designation is revoked, then hedge accounting is discontinued. The adjustment to the carrying amount of a hedged item measured at amortised cost, for which the effective interest method is used, is amortised to profit or loss as part of the hedged item’s recalculated effective interest rate over the period to maturity. If the derivative expires, is sold, terminated, exercised, no longer meets the criteria for cash flow hedge accounting, or the designation is revoked, then hedge accounting is discontinued. The cumulative gains or losses recognised in OCI remain in OCI until the forecast transaction is recognised in the case of a nonfinancial asset or a non-financial liability, or until the forecast transaction affects profit or loss in the case of a financial asset or a financial liability. If the forecast transaction is no longer expected to occur, the cumulative gains and losses recognised in OCI are immediately reclassified to profit or loss and classified as trading revenue. Derivatives that do not qualify for hedge accounting All gains and losses from changes in the fair values of derivatives that do not qualify for hedge accounting are recognised immediately in profit or loss as trading revenue. Borrowings Borrowings, including sub-ordinated debt, are recognised initially at fair value, generally being their issue proceeds, net of directly attributable transaction costs incurred. Borrowings are subsequently measured at amortised cost and interest is recognised using the effective interest method. Financial guarantee contracts A financial guarantee contract is a contract that requires the group (issuer) to make specified payments to reimburse the holder for a loss it incurs because a specified debtor fails to make payment when due in accordance with the original or modified terms of a debt instrument. Financial guarantee contracts are initially recognised at fair value, which is generally equal to the premium received, and then amortised over the life of the financial guarantee. Subsequent to initial recognition, the financial guarantee liability is measured at the higher of the present value of any expected payment, when a payment under the guarantee has become probable, and the unamortised premium. 29 Significant accounting policies continued Derecognition of financial instruments Financial assets are derecognised when the contractual rights to receive cash flows from the financial assets have expired, or where the group has transferred its contractual rights to receive cash flows on the financial asset such that it has transferred substantially all the risks and rewards of ownership of the financial asset. Any interest in transferred financial assets that is created or retained by the group is recognised as a separate asset or liability. The group enters into transactions whereby it transfers assets recognised in its statement of financial position, but retains either all or a portion of the risks or rewards of the transferred assets. If all or substantially all risks and rewards are retained, then the transferred assets are not derecognised. Transfers of assets with the retention of all or substantially all risks and rewards include securities lending and repurchase agreements. When assets are sold to a third party with a concurrent total rate of return swap on the transferred assets, the transaction is accounted for as a secured financing transaction, similar to repurchase transactions. In transactions where the group neither retains nor transfers substantially all the risks and rewards of ownership of a financial asset, it derecognises the asset if control over the asset is lost. The rights and obligations retained in the transfer are recognised separately as assets and liabilities as appropriate. In transfers where control over the asset is retained, the group continues to recognise the asset to the extent of its continuing involvement, determined by the extent to which it is exposed to changes in the value of the transferred asset. Financial liabilities are derecognised when they are extinguished, that is, when the obligation is discharged, cancelled or expires. Where an existing financial asset or liability is replaced by another with the same counterparty on substantially different terms, or the terms of an existing financial asset or liability are substantially modified, such an exchange or modification is treated as a derecognition of the original asset or liability and the recognition of a new asset or liability, with the difference in the respective carrying amounts being recognised in profit or loss. In all other instances, the renegotiated asset or liability’s effective interest rate is redetermined taking into account the renegotiated terms. Sale and repurchase agreements and lending of securities (including commodities) Securities sold subject to linked repurchase agreements are reclassified in the statement of financial position as pledged assets when the transferee has the right by contract or custom to sell or repledge the collateral. The liability to the counterparty is included under deposit and current accounts or trading liabilities, as appropriate. 30 Securities purchased under agreements to resell, at either a fixed price or the purchase price plus a lender’s rate of return, are recorded as loans granted under resale agreements and included under trading assets or loans and advances, as appropriate. The difference between the purchase and sales price is treated as interest and amortised over the life of the reverse repurchase agreement using the effective interest method. Securities lent to counterparties are retained in the annual financial statements and are classified and measured in accordance with the measurement policy above. Securities borrowed are not recognised in the annual financial statements unless sold to third parties. In these cases, the obligation to return the securities borrowed is recorded at fair value as a trading liability. Income and expenses arising from the securities borrowing and lending business are recognised over the period of the transactions. Commodities Commodities that are acquired principally by the group for the purpose of selling in the near future and generating a profit from fluctuations in price or broker-traders’ margin are measured at fair value less cost to sell and are reported as trading assets. All changes in fair value less cost to sell are recognised in trading revenue in the period of the change. Forward contracts to purchase or sell commodities, where net settlement occurs or where physical delivery occurs and the commodities are held to settle another derivative contract, are recognised as derivative financial instruments and measured at fair value. All changes in fair value are recognised in trading revenue in the period of the change. 6. Intangible assets Computer software Costs associated with developing or maintaining computer software programmes and the acquisition of software licences are generally recognised as an expense as incurred. However, direct computer software development costs that are clearly associated with an identifiable and unique system, which will be controlled by the group and have a probable future economic benefit beyond one year, are recognised as intangible assets. Capitalisation is further limited to development costs where the group is able to demonstrate its intention and ability to complete and use the software, the technical feasibility of the development, the availability of resources to complete the development, how the development will generate probable future economic benefits and the ability to reliably measure costs relating to the development. Direct costs include software development employee costs and an appropriate portion of relevant overheads. Expenditure subsequently incurred on computer software is capitalised only when it increases the future economic benefits embodied in the specific asset to which it relates. Standard Bank Plc Consolidated Annual Report 2012 Direct computer software development costs recognised as intangible assets are amortised on the straight-line basis at rates appropriate to the expected useful lives of the assets (2 to 10 years) from the date that the assets are available for use, and are carried at cost less accumulated amortisation and accumulated impairment losses. The carrying amount of capitalised computer software is reviewed annually and is written down when impaired. 9. Impairment of non-financial assets Intangible assets that have an indefinite useful life are tested annually for impairment and additionally when an indicator of impairment exists. Intangible assets that are subject to amortisation and other non-financial assets are reviewed for impairment at each reporting date and tested for impairment whenever events or changes in circumstances indicate that the carrying amount Amortisation methods, useful lives and residual values are reviewed at each financial year-end and adjusted, if necessary. There have been no changes in the estimated useful lives from those applied in the previous financial year. may not be recoverable. 7. Property and equipment amount. The recoverable amount is the higher of an asset’s fair Equipment, furniture, vehicles and other tangible assets are measured at cost less accumulated depreciation and accumulated impairment losses. Cost includes expenditure that is directly attributable to the acquisition of the asset. Where significant parts of an item of property or equipment have different useful lives, they are accounted for as separate items (major components) of property and equipment. is determined by ascertaining the current market value of an asset An impairment loss is recognised in profit or loss for the amount by which the asset’s carrying amount exceeds its recoverable value less costs to sell and value in use. Fair value less costs to sell and deducting any costs related to the realisation of the asset. In assessing value in use, the estimated future cash flows are discounted to their present value using a pre-tax discount rate that reflects current market assessments of the time value of money and the risks specific to the asset. For the purposes of assessing impairment, assets that cannot be tested individually Costs that are subsequently incurred are included in the asset’s related carrying amount or are recognised as a separate asset, as appropriate, only when it is probable that future economic benefits will flow to the group and the cost of the item can be measured reliably. Expenditure, which does not meet these criteria, is recognised in profit or loss as incurred. Depreciation, impairment losses and gains and losses on disposal of assets are included in profit or loss. Property and equipment are depreciated on the straight-line basis over the estimated useful lives of the assets to their residual values. The assets’ residual values, useful lives and the depreciation method applied are reviewed, and adjusted if appropriate, at each financial year end. are grouped at the lowest levels for which there are separately identifiable cash inflows from continuing use (cash-generating units). Impairment losses recognised in respect of cash-generating units reduce the carrying amounts of the other assets in the unit on a pro rata basis. In respect of other non-financial assets, impairment losses recognised in prior periods are assessed at each reporting date for any indications that the loss has decreased or no longer exists. An impairment loss is reversed if there has been a change in the estimates used to determine the recoverable amount. An impairment loss is reversed through profit or loss only to the extent that the asset’s carrying amount does not exceed the carrying amount that would have been determined, net of The estimated useful lives of tangible assets are typically as follows: Computer equipment Office equipment Motor vehicles Furniture and fittings 2 to 5 years 5 to 7 years 5 years 5 to 7 years There has been no change to the estimated useful lives and depreciation methods from those applied in the previous financial year. depreciation or amortisation, if no impairment loss had been recognised. 10. Leases Group as lessee Leases, where the group assumes substantially all the risks and rewards of ownership, are classified as finance leases. Finance leases are capitalised at the inception of the lease at the lower of 8. Capitalisation of borrowing costs the fair value of the leased asset and the present value of the Borrowing costs that relate to qualifying assets, that is, assets that necessarily take a substantial period of time to get ready for their intended use or sale and which are not measured at fair value, are capitalised. All other borrowing costs are recognised in profit or loss. minimum lease payments. Lease payments are separated using the interest rate implicit in the lease to identify the finance cost, which is recognised in profit or loss over the lease period, and the capital repayment, which reduces the liability to the lessor. 31 Significant accounting policies continued Leases of assets are classified as operating leases if the lessor retains a significant portion of the risks and rewards of ownership. Payments made under operating leases, net of any incentives received from the lessor, are recognised in profit or loss on a straight-line basis over the term of the lease. Contingent rentals are expensed as they are incurred. When an operating lease is terminated before the lease period has expired, any payment required to be made to the lessor by way of penalty is recognised as an expense in the period in which termination takes place. 11. Provisions, contingent assets and contingent liabilities Provisions are recognised when the group has a present legal or constructive obligation as a result of past events, it is probable that an outflow of resources embodying economic benefits will be required to settle the obligation and a reliable estimate of the amount of the obligation can be made. Provisions are determined by discounting the expected future cash flows using a pre-tax discount rate that reflects current market assessments of the time value of money and the risks specific to the liability. A provision for restructuring is recognised when the group has approved a detailed formal plan, and the restructuring either has commenced or has been announced publicly. Future operating costs or losses are not provided for. A provision for onerous contracts is recognised when the expected benefits to be derived by the group from a contract are lower than the unavoidable cost of meeting its obligations under the contract. The provision is measured at the present value of the lower of the expected cost of terminating the contract and the expected net cost of continuing with the contract. Before a provision is established, the group recognises any impairment loss on the assets associated with that contract. 12. Tax Direct taxation Direct taxation includes current and deferred tax. Current tax and deferred tax are recognised in profit or loss except to the extent that it relates to items recognised directly in equity or in OCI. Current tax represents the expected tax payable on taxable income for the year, using tax rates enacted or substantively enacted at the reporting date, and any adjustments to tax payable in respect of previous years. Deferred tax is recognised in respect of temporary differences arising between the tax bases of assets and liabilities and their carrying values for financial reporting purposes. Deferred tax is measured at the tax rates that are expected to be applied to the temporary differences when they reverse, based on the laws that have been enacted or substantively enacted at the reporting date. Deferred tax is not recognised for the following temporary differences: the n initial recognition of assets and liabilities in a transaction that is not a business combination, which affects neither accounting nor taxable profits or losses; and investments n in subsidiaries and jointly controlled entities (excluding mutual funds) where the group controls the timing of the reversal of temporary differences and it is probable that these differences will not reverse in the foreseeable future. The amount of deferred tax provided is based on the expected manner of realisation or settlement of the carrying amount of the asset or liability and is not discounted. Deferred tax assets are recognised to the extent that it is probable that future taxable income will be available against which the unused tax losses can be utilised. Deferred tax assets are reviewed at each reporting date and are reduced to the extent that it is no longer probable that the related tax benefit will be realised. Contingent assets are not recognised in the annual financial statements but are disclosed when, as a result of past events, it is probable that economic benefits will flow to the group, but this will only be confirmed by the occurrence or non-occurrence of one or more uncertain future events which are not wholly within the group’s control. Current and deferred tax assets and liabilities are offset if there is a legally enforceable right to offset current tax liabilities and assets, and they relate to income taxes levied by the same tax authority on the same taxable entity, or on different tax entities, but they intend to settle current tax liabilities and assets on a net basis or their tax assets and liabilities will be realised simultaneously. Contingent liabilities include certain guarantees, other than financial guarantees, and letters of credit. Contingent liabilities Indirect taxation are not recognised in the annual financial statements but are Indirect taxes, including non-recoverable value added tax (VAT) and other duties for banking activities, are recognised in profit or loss and disclosed separately in the income statement. disclosed in the notes to the annual financial statements unless they are remote. 32 Standard Bank Plc Consolidated Annual Report 2012 13. Employee benefits Post-employment benefits - defined contribution plans The group operates a number of defined contribution plans, based on a percentage of pensionable earnings funded by both employer companies and employees, the assets of which are generally held in separate trustee-administered funds. Contributions to these plans are recognised as an expense in profit or loss in the periods during which services are rendered by employees. Termination benefits Termination benefits are recognised as an expense when the group is committed, without realistic possibility of withdrawal, to a formal detailed plan to terminate employment before the normal retirement date, or to provide termination benefits as a result of an offer made to encourage voluntary redundancy. Termination benefits for voluntary redundancies are recognised as an expense if the group has made an offer encouraging voluntary redundancy, it is probable that the offer will be accepted, and the number of acceptances can be estimated reliably. Short-term benefits Short-term benefits consist of salaries, accumulated leave payments, profit share, bonuses and any non-monetary benefits such as medical aid contributions. Short-term employee benefit obligations are measured on an undiscounted basis and are expensed as the related service is provided. A liability is recognised for the amount expected to be paid under short-term cash bonus plans or accumulated leave if the group has a present legal or constructive obligation to pay this amount as a result of past service provided by the employee and the obligation can be estimated reliably. 14. Long-term incentive schemes The group operates both cash-settled and equity-settled sharebased compensation plans. Quanto stock unit plan The Standard Bank Quanto Stock Unit Plan awards a number of Quanto Stock units denominated in US$ and is a cash-settled, deferred incentive scheme. The value is based on the Standard Bank Group Limited (SBG) share price and moves in parallel to the change in price of the SBG shares listed on the JSE Ltd. The awards, which are granted following remuneration committee approval subsequent to year end, vest over a three year period dependent on the employee being in service for the period and are accrued from the award date over the vesting period. The scheme provides for an incremental amount to be paid, accrued from the award date over the vesting period, if the employee is in service for four years. The amount of the accrued liability is re-measured at the end of each reporting period, taking into account assumptions about leavers. The changes in liability are accounted for through profit or loss over the life of the Quanto Stock units. The changes in the liability arising from share price movements have been hedged, applying cash flow hedging principles. SBG equity scheme The SBG equity-settled share-based compensation plan awards options over the Standard Bank Group Limited shares. Throughout the life of the scheme, the obligation is re-measured at the end of each reporting period based on a valuation of the option. The changes in value are accounted for through profit or loss over the vesting period of the share options with a corresponding increase in the long-term incentive reserve as the obligation to employees is settled by Standard Bank Group. Non-market vesting conditions are not considered in the valuation but are included in the estimate of the number of options expected to vest. At the end of each reporting date the estimate of the number options expected to vest is reassessed and adjusted against profit or loss and equity over the vesting period. 15. Revenue and expenditure Revenue described below represent the most appropriate equivalent of turnover and is derived substantially from the business of banking and related activities. Net interest income Interest income and expense (with the exception of those borrowing costs that are capitalised – refer to accounting policy 8 – Capitalisation of borrowing costs) are recognised in profit or loss on an accrual basis using the effective interest method for all interest-bearing financial instruments, except for those classified at fair value through profit or loss. In terms of the effective interest method, interest is recognised at a rate that exactly discounts estimated future cash payments or receipts through the expected life of the financial instrument or, where appropriate, a shorter period, to the net carrying amount of the financial asset or financial liability. Direct incremental transaction costs incurred and origination fees received, including loan commitment fees, as a result of bringing margin-yielding assets or liabilities into the statement of financial position, are capitalised to the carrying amount of financial instruments that are not at fair value through profit or loss and amortised as interest income or expense over the life of the asset or liability as part of the effective interest rate. Where the estimates of payments or receipts on financial assets (except those that have been reclassified – refer to accounting policy 5 – Financial instruments) or financial liabilities are subsequently revised, the carrying amount of the financial asset or financial liability is adjusted to reflect actual and revised estimated cash flows. The carrying amount is calculated by computing the present value of the estimated cash flows at the financial asset or financial liability’s original effective interest rate. 33 Significant accounting policies continued Any adjustment to the carrying value is recognised in net interest income. Where financial assets have been impaired, interest income continues to be recognised on the impaired value based on the original effective interest rate. Fair value gains and losses on realised debt financial instruments, including amounts removed from OCI in respect of available-forsale debt financial assets, and excluding those classified as heldfor-trading, are included in net interest income. Non-interest revenue Net fees, commission and revenue sharing arrangements Fee and commission revenue, including transactional fees, account servicing fees, investment management fees, sales commissions and placement fees are recognised as the related services are performed. Loan commitment fees for loans that are not expected to be drawn down are recognised on a straight-line basis over the commitment period. Loan syndication fees, where the group does not participate in the syndication or participates at the same effective interest rate for comparable risk as other participants, are recognised as revenue when the syndication has been completed. Syndication fees that do not meet these criteria are capitalised as origination fees and amortised as interest income. The fair value of issued financial guarantee contracts on initial recognition is amortised as income over the term of the contract. Fee and commission expense included in net fee and commission revenue are mainly transaction and service fees relating to financial instruments, which are expensed as the services are received. Expenditure is recognised as fee and commission expenses where the expenditure is linked to the production of fee and commission revenue. Trading revenue Trading revenue comprises all gains and losses from changes in the fair value of trading assets and liabilities, together with related interest income, expense and dividends. Other revenue Other revenue includes gains and losses on equity instruments designated at fair value through profit or loss, dividends relating to those financial instruments and underwriting profit from the group’s short-term insurance operations and related insurance activities. Gains and losses on equity available-for-sale financial assets are reclassified from OCI to profit or loss on derecognition or impairment of the investments. Dividends on these instruments are recognised in profit or loss. 34 Dividend income Dividends are recognised in profit or loss when the right to receipt is established. Scrip dividends are recognised as dividends received where the dividend declaration allows for a cash alternative. 16. Discontinued operations The results of discontinued operations are shown as a single amount in the income statement comprising the post-tax profit or loss. 17. Segment reporting An operating segment is a component of the group engaged in business activities, whose operating results are reviewed regularly by management in order to make decisions about resources to be allocated to segments and assessing segment performance. The group’s identification of segments and the measurement of segment results are based on the group’s internal reporting to management. Transactions between segments are priced at market-related rates. 18. Fiduciary activities (client money) The group commonly engages in trust or other fiduciary activities that result in the holding or placing of assets on behalf of individuals, trusts, post-employment benefit plans and other institutions. These assets and the income arising directly thereon are excluded from these annual financial statements as they are not assets of the group. However, fee income earned and fee expenses incurred by the group relating to the group’s responsibilities from fiduciary activities are recognised in profit or loss. 19. Comparative figures Where necessary, comparative figures within notes have been restated to conform to changes in presentation in the current year. Refer to note 31 – ‘Reclassifications’. Standard Bank Plc Consolidated Annual Report 2012 20. New standards and interpretations not yet adopted The following new or revised standards and amendments are not yet effective for the year ended 31 December 2012 and have not been applied in preparing these annual financial statements. Pronouncement Title Effective date IFRS 7 (amendments) Financial Instruments: Disclosures – Offsetting Financial Assets and Financial Liabilities Annual periods beginning on or after 1 January 2013 The amendment requires additional disclosure to assist in understanding the effect or potential effect of netting arrangements, including rights of set-off associated with an entity’s recognised financial assets and financial liabilities, on an entity’s financial position. The amendment will be applied retrospectively and will result in additional disclosures. IFRS 9 (amended) Financial Instruments IFRS 9 will replace the existing standard on the recognition and measurement of financial instruments and requires all financial assets to be classified and measured on the basis of the entity’s business model for managing the financial assets and the contractual cash flow characteristics of the financial assets. The accounting for financial assets differs in various other areas to existing requirements such as embedded derivatives and the recognition of fair value adjustments in other comprehensive income. Annual periods beginning on or after 1 January 2015 (Standard not yet endorsed by the EU) All changes in the fair value of financial liabilities that are designated at fair value through profit or loss due to changes in own credit risk will be required to be recognised within other comprehensive income. IFRS 9 will be applied retrospectively. The impact on the annual financial statements has not yet been fully determined. IFRS 10 (amended) Consolidated Financial Statements IFRS 10 establishes principles for the presentation and preparation of consolidated financial statements when an entity controls one or more other entities. It introduces a single control model to be applied in determining control. Annual periods beginning on or after 1 January 2014 IFRS 10 will be applied retrospectively and is not expected to have a material impact on the group’s financial statements. IFRS 11 (amended) Joint Arrangements IFRS 11 focuses on the rights and obligations of joint arrangements, rather than the legal form. The standard: n Annual periods beginning on or after 1 January 2014 istinguishes between joint operations and joint ventures depending on the d rights and obligations of the parties to the arrangements; requires n joint operations to be accounted for by recognising own assets, separately incurred liabilities, own revenue and expenses as well as the share of assets, liabilities, revenue and expenses arising from the joint operation; and n requires joint ventures to be accounted for using the equity method. IFRS 11 will be applied retrospectively and is not expected to have a material impact on the group’s financial statements. 35 Significant accounting policies continued Pronouncement Title Effective date IFRS 12 (amended) Disclosure of Interests in Other Entities Annual periods beginning on or after 1 January 2014 IFRS 12 contains disclosure requirements for interests in subsidiaries, joint arrangements, associates and unconsolidated structured entities. The disclosures seek to provide information to enable users to evaluate: n t he nature of, and risks associated with, an entity’s interests in other entities; and n t he effects of those interests on the entity’s financial position, financial performance and cash flows. IFRS 12 will be applied retrospectively and is not expected to have a material impact on the group’s financial statements. IFRS 13 Fair Value Measurement IFRS 13 provides a single source of fair value measurement guidance. It defines fair value, establishes a framework for measuring fair value and sets out disclosure requirements for fair value measurements. IFRS 13 does not introduce any new requirements to measure additional assets or liabilities at fair value. Annual periods beginning on or after 1 January 2013 IFRS 13 will be applied prospectively. The application of IFRS 13 may result in changes to the measurement of certain of the group’s assets and liabilities although initial high level assessments indicate these are unlikely to be significant. IFRS 13 will also result in additional disclosure requirements for the group. IAS 27 (amendments) Separate Financial Statements The amendments to IAS27 include both existing and amended accounting and disclosure requirements for separate financial statements. Annual periods beginning on or after 1 January 2014 The amendments will be applied retrospectively and are not expected to have a material impact on the company’s financial statements. IAS 32 (amendments) Offsetting Financial Assets and Financial Liabilities The amendments to IAS 32 clarify the requirements for offsetting of financial assets and liabilities. The amendments will be applied retrospectively. The impact on the annual financial statements has not yet been fully determined. 36 Annual periods beginning on or after 1 January 2014 Standard Bank Plc Consolidated Annual Report 2012 Notes to the annual financial statements 1 Segment reporting The ultimate parent, SBG, is a leading African banking group focused on Africa and connecting selected emerging markets to Africa, particularly in the natural resources sector. Its operations are organised on the basis of products and services with the banking operations divided into two major segments, Personal & Business Banking (PBB) and Corporate & Investment Banking (CIB). The CIB segment provides banking, finance, trading, investment, risk management and advisory services to larger corporates, financial institutions and international counterparties in selected developing economies around the world. Standard Bank Plc is the major operating entity of the SBG’s CIB business outside of Africa. The business model has developed significantly in the year, with the operating model becoming increasingly integrated with South Africa. The Investment Banking business now originates assets directly on the Standard Bank of South Africa’s (SBSA) balance sheet with SBSA becoming the primary booking and risk taking entity in SBG and acting as a risk warehouse for the CIB business. In addition, a service unit has been established to house business unit and support costs which are recovered from other entities within SBG. Operating segments Global Markets (GM) Includes foreign exchange, commodities, interest rate, credit and equity trading business as well as client financing and money market funding units. Investment Banking (IB) Commercial and investment banking services to corporates and financial institutions include investment and advisory business, structured trade and commodity finance and loan syndications. Transactional Products and Services (TPS) Includes transactional banking and investor services. Service Unit Service Unit is a division that provides an employment function for the wider Standard Bank Group, allowing personnel to be employed in London to provide services to Standard Bank Group entities. Central Includes costs attributable to central treasury, corporate restructuring activities and discontinued operations. 37 Notes to the annual financial statements continued 1 Segment reporting continued Segment results GM $m Net interest income/(expense) Net fees, commission and revenue sharing arrangements Trading revenue/(losses) Other revenue 54.4 (73.4) 250.1 43.7 Total income/(losses) Credit impairment (charges)/release Income/(loss) after impairments 264.3 Operating expenses Profit/(loss) before disposal of loan portfolio Loss on disposal of loan portfolio Profit/(loss) from operations Income tax charge Profit/(loss) for the year from continuing operations Discontinued operations Profit/(loss) attributable to equity shareholders IB $m 2012 Service TPS Unit $m $m Central $m Total $m 58.7 158.8 5.4 35.1 6.7 13.4 - 90.6 - (60.6) (10.7) (2.2) - 274.8 258.0 20.1 90.6 (73.5) 570.0 (10.5) (157.1) - - 25.4 (142.2) 100.9 20.1 90.6 (48.1) 427.8 (88.6) (88.2) (662.1) (136.3) (234.3) (51.8) (51.8) (188.1) (286.1) (327.3) (151.0) (7.0) (63.0) (50.1) 13.1 - - - (63.0) (50.1) 13.1 (1.9) (0.4) - (64.9) (50.5) 13.1 - - - (64.9) (50.5) 13.1 (8.7) (21.7) (1.6) (4.0) (0.2) (0.6) 2.0 2.0 2.0 - 59.2 178.7 253.3 78.8 (2.3) (188.1) (288.4) - (44.0) (44.0) 2.0 (232.1) (332.4) Included in operating expenses: Depreciation Amortisation of intangible assets GM $m Net interest income/(expense) Net fees, commission and revenue sharing arrangements Trading revenue/(losses) Other revenue 81.3 (33.1) 296.1 Total income/(losses) Credit impairment charges Income/(loss) after impairments Operating expenses Profit/(loss) before disposal of loan portfolio Profit on disposal of loan portfolio 20111 Service TPS Unit $m $m Central $m (10.5) (26.3) Total $m 3.6 6.9 116.3 - - - 344.3 212.7 10.5 116.3 (24.6) 659.2 (30.1) (104.4) - - (0.5) (135.0) 314.2 108.3 10.5 116.3 (25.1) 524.2 (315.3) (111.0) (3.6) (116.3) 13.5 (532.7) (1.1) (2.7) - - 111.7 100.6 0.4 - - - (48.5) 27.3 (3.4) - (11.6) 148.1 218.0 293.1 - 6.9 - - - 6.0 (8.5) 6.0 Profit/(loss) from operations (1.1) (2.7) 6.9 - (5.6) (2.5) Income tax credit/(charge) 23.6 2.9 (1.8) - 2.8 27.5 Profit/(loss) for the year from continuing operations 22.5 0.2 5.1 - (2.8) 25.0 - - - (46.1) (46.1) 22.5 0.2 5.1 - (48.9) (21.1) (11.4) (23.2) (2.1) (4.3) (0.3) (0.6) - Discontinued operations Profit/(loss) attributable to equity shareholders Included in operating expenses: Depreciation Amortisation of intangible assets 1 38 IB $m - - - (13.8) (28.1) Comparatives restated to comply with current year presentation. The group relies primarily on net interest income rather than interest income and interest expense to assess the performance of the segments. Centrally incurred expenses, other than certain treasury and restructuring costs, are allocated to operating segments based on appropriate cost drivers. Standard Bank Plc Consolidated Annual Report 2012 1 Segment reporting continued 2012 Service Unit $m Central $m Total $m - - 3 710.0 3 589.2 120.8 21 091.0 20 970.2 120.8 304.2 266.7 - 2 335.4 19 716.4 16 810.1 304.2 266.7 - 2 326.8 19 707.8 - - - - 8.6 8.6 Service Unit $m Central $m Total $m 2 374.4 2 132.3 242.1 27 344.2 27 102.1 242.1 GM $m IB $m TPS $m Total assets - Continuing operations - Discontinued operations 16 810.1 16 810.1 304.2 304.2 266.7 266.7 - - Total liabilities 16 810.1 - Continuing operations Other information - Discontinued operations 2011 GM $m IB $m TPS $m Total assets - Continuing operations - Discontinued operations 22 448.4 22 448.4 2 288.6 2 288.6 232.8 232.8 - - - - Total liabilities 22 448.4 2 288.6 232.8 - 675.5 25 645.3 - Continuing operations 22 448.4 2 288.6 232.8 - 653.4 25 623.2 - - - - 22.1 22.1 - Discontinued operations Geographical analysis The geographical analysis has been compiled on the basis of location of office where the transactions are recorded. Outside the United Kingdom United Kingdom 2012 $m Total income - Continuing operations - Discontinued operations Non-current non-financial assets 2011 $m 489.4 499.3 (9.9) 579.3 633.9 (54.6) 73.4 124.5 2012 Total 2011 2012 $m 2011 $m $m 70.7 70.7 - 25.3 25.3 - 560.1 570.0 (9.9) 604.6 659.2 (54.6) $m 2.3 2.7 75.7 127.2 No countries outside the United Kingdom are deemed to be individually material. There has been no reliance on any major customers and no individual customer makes up a material portion of the revenue streams. 39 Notes to the annual financial statements continued 2 Key management assumptions 2.2 Determining fair value In preparing the group and company financial statements, estimates and judgements are made that could affect the reported amounts of assets and liabilities within the next reporting period. Estimates and judgements are continually evaluated and are based on factors such as historical experience and current best estimates of uncertain future events that are believed to be reasonable under the circumstances. The fair value of financial instruments that are not quoted in active markets is determined using valuation techniques. Wherever possible, models use only observable market data. Where required, these models incorporate assumptions that are not supported by prices from observable current market transactions in the same instrument and are not based on available observable market data. Such assumptions include recoverability, risk premiums, liquidity discount rates, credit risk, volatilities and correlations. Changes in these assumptions could affect the reported fair values of financial instruments. Included within level 3 financial assets is an exposure for which management exercised specific judgement to the recoverability of the carrying amount. A delay in repayment by one year will result in a reduction of the fair value by US$3.8 million. 2.1Credit impairment losses on loans and advances Specific loan impairments Loans are analysed on a case-by-case basis taking into account breaches of key loan conditions. Management’s estimates of future cash flows on individually impaired loans are based on historical loss experience for assets with similar credit risk characteristics. The methodology and assumptions used for estimating both the amount and timing of future cash flows are reviewed regularly to reduce any differences between loss estimates and actual loss experience. The loan exposures have reduced significantly in the period following the roll-off of exposures and transfer of the IB portfolio to SBSA. Specifically impaired loans are 90.7% (2011: 30.3%) covered by specific loan impairments and subsequently a change of one percentage in the value of the estimated recovery will only result in a US$0.2 million (2011: US$4.5 million) change in the value of the impairment. Portfolio loan impairments The group assesses its loan portfolios for impairment at the end of each reporting date. In determining whether an impairment loss should be recorded in profit or loss, the group makes judgements as to whether there is observable data indicating a measurable decrease in the estimated future cash flows from a portfolio of loans before the decrease can be allocated to an individual loan in that portfolio. Estimates are also made of the duration between the occurrence of a loss event and the identification of a loss on an individual basis. The impairment for performing loans is determined on a portfolio basis, based on calculated loss ratios, adjusted for specific economic conditions and other indicators of potential default. These annual loss ratios are applied to loan balances in the portfolio and scaled to the estimated loss emergence period. At the year end, a number of factors including emergence period, recovery rates, recent loss history and probability of default were considered of which the loss emergence period is a key input (2012: 7 months; 2011: 6 months). A change of one month in the emergence period will result in a US$1.4 million (2011: US$3.8 million) change on the value of the impairment, reflecting the reduced loan portfolio. As is the emerging practice amongst market participants, Overnight Index Swap (OIS) discounting was considered in the valuation methodology for certain products. This market divergence from the use of Libor to OIS is to reflect the nature of the cost of financing of the product. The application of OIS discounting can be divided into observable and non-observable markets. The observable OIS markets being mainly G4 Currencies, with the non-observable markets being those in emerging market countries such as South Africa. The group valuation approach was divided and assessed along these lines. The assessment of the G4 currencies’ exposure indicated immaterial valuation differences from the current market standard Libor methodology, and was not applied in determining fair value. An assessment of the OIS market in South Africa confirmed that the OIS methodology is still evolving and is currently non-observable and the interbank offer rate is still the valuation method used for valuing derivatives in South Africa in line with the SBG approach. The remaining IB loan portfolio was transferred to SBSA, at fair value calculated using valuation models, resulting in a loss of US$51.8 million. Additional disclosures on fair value measurements of financial instruments are set out in notes 18 and 19. 2.3 Discontinued operations The PIM and PCS business units, which constituted separate major business lines within the group, were discontinued during the course of 2010 through resolution by the Board. In making this decision, the following were considered: the abandonment was part of a single co-ordinated plan; no significant interest revenue will be generated; and the divisions represented separate major lines of business. No further investment in these businesses will be made and the focus remains on selling down positions, collections and collateral sales. In the presentation of the group’s results, the PIM and PCS business units have been classified as discontinued operations through abandonment in accordance with IFRS 5. Additional disclosures on discontinued operations are set out in note 26. 40 Standard Bank Plc Consolidated Annual Report 2012 2 Key management assumptions continued 2.4 Taxation The group is subject to direct and indirect taxation in a number of jurisdictions. There may be transactions and calculations for which the ultimate tax determination has an element of uncertainty during the ordinary course of business. The group recognises liabilities based on estimates of the quantum of taxes that may be due. Where the final tax determination is different from the amounts that were initially recorded, such differences will impact the income tax and deferred tax expense in the year in which such determination is made. Deferred tax assets The accounting policy for the recognition of deferred tax assets is described in accounting policy 12. A deferred tax asset is recognised to the extent that it is probable that suitable future taxable profits will be available against which deductible temporary differences can be utilised. The recognition of a deferred tax asset relies on management’s judgements surrounding the probability and sufficiency of suitable future taxable profits, future reversals of existing taxable temporary differences and planning strategies. The deferred tax asset recognised is based on the evidence available about conditions at the reporting date, and requires significant judgements to be made by management, especially those based on management’s projections of business revenues, credit losses and the timing of a general economic recovery. Management’s judgement takes into account the impact of both negative and positive evidence, including historical financial results and projections of future taxable income, on which the recognition of the deferred tax asset is mainly dependent. consolidated in full these SPEs, along with global markets trading SPEs, with assets of US$106.5 million (2011: US$242.9 million). SPE Country of incorporation Fundo Multimercado Safari Investimentos no Exterior Brazil Star Two Holdings Inc. Philippines Star Asset Management Ltd. Thailand 2.6 Legal proceedings From time to time the group is involved in litigation or receives claims arising from the conduct of its business which can require the group to engage in legal proceedings in order to enforce contractual rights. Standard Bank Plc (SB Plc) is in receipt of a claim from a former borrower under certain long term non-performing loan facilities for alleged overpayments of fees, interest and default interest. The facilities were repaid in September 2012. The amount of the claim has not been quantified by the Claimant, but would appear to be in the region of US$5 million to US$50 million. The group believes SB Plc has robust defences to the claim asserted against it and intends to defend itself vigorously. Whilst recognising the inherent difficulty of predicting the outcome of legal proceedings, the directors believe, based upon current knowledge and after consulting with legal counsel, that the legal proceedings currently pending against it should not have a material adverse effect on the consolidated financial position. Deferred tax assets of US$96.4 million (2011: US$nil) have not been recognised in respect of unutilised trading losses carried forward and share based payments. Management’s forecasts support the assumption that it is probable that the future results of the group will generate sufficient suitable taxable income to utilise the existing asset of US$18.8 million (2011: US$48.0 million). Management’s projections of future taxable income are based on business plans which include assumptions about enhanced cost effective operations and infrastructure, and reduced credit impairment charges. 3 Balances with central banks Additional disclosure relating to the deferred tax asset is set out in note 10. 1 2.5 Special purpose entities (SPEs) The group consolidates SPEs where it controls related risks and rewards. The group makes judgements about its exposure to the risks and rewards, as well as its ability to make operational decisions for the SPE in question. In arriving at judgements, these factors are considered both jointly and separately. The group consolidates investments in portfolios of distressed debt as it is exposed to the major risks and rewards of the underlying portfolio. The portfolios were acquired by SPEs funded by the group and specifically set up in each jurisdiction to acquire these loans. The group has Group Reserve account with Bank of England1 Company 2012 2011 2012 2011 $m $m $m $m 2 228.2 - 2 228.2 - 2 228.2 - 2 228.2 - his reserve account operates in the same way as a current account with an overnight T contractual tenor. 4 Derivative instruments All derivatives are classified as either derivatives held for trading or derivatives held for hedging. 4.1 Notional amount The gross notional amount is the sum of the absolute value of all bought and sold contracts. The amount cannot be used to assess the market risk associated with the positions held and should be used only as a means of assessing the group’s participation in derivative contracts. 41 Notes to the annual financial statements continued 4 Derivative instruments continued 4.2 Derivative assets and liabilities Group 2012 Maturity analysis of net fair value < 1 year 1 - 5 years > 5 years Net fair value Fair value Fair value of assets of liabilities $m $m $m $m 40.6 35.6 1.8 3.2 19.6 19.4 0.2 (130.7) 34.1 2.1 (166.9) 661.8 645.7 3.3 12.8 $m $m Contract/ notional amount $m Derivatives held for trading Foreign exchange derivatives Forwards Futures Options (792.5) (611.6) (1.2) (179.7) 55 879.7 47 052.0 3 461.3 5 366.4 Interest rate derivatives Caps and floors Forwards Future options Swaps (32.5) 0.4 (0.2) 0.7 (33.4) (9.3) 33.3 (42.6) 52.0 0.3 51.7 10.2 0.4 (0.2) 34.3 (24.3) 2 385.1 0.5 18.9 66.1 2 299.6 (2 374.9) 484 968.5 (0.1) 136.2 (19.1) 10 089.3 (31.8) 364 086.7 (2 323.9) 110 656.3 Commodity derivatives Forwards Futures Options (1.7) 59.0 (31.3) (29.4) (26.3) (12.7) (10.4) (3.2) 3.4 1.7 1.7 (24.6) 48.0 (41.7) (30.9) 1 508.8 290.4 1 111.1 107.3 (1 533.4) 369 480.0 (242.4) 14 316.6 (1 152.8) 347 164.2 (138.2) 7 999.2 Credit derivatives Credit default swaps Total return swaps (119.8) (7.3) (112.5) (32.1) (0.2) (31.9) (369.3) (4.4) (364.9) 153.4 140.3 13.1 (522.7) (144.7) (378.0) 17 069.6 16 612.0 457.6 Equity derivatives Futures & forwards Options Swaps (24.8) (12.4) (12.4) 16.3 16.3 (8.2) (12.4) 0.3 3.9 20.7 0.3 20.4 (28.9) (12.4) (16.5) 68.2 36.9 31.3 (369.7) (10.8) (522.6) 4 729.8 (5 252.4) 927 466.0 Total derivative assets/ (liabilities) held for trading Derivatives held for hedging Derivatives designated as cash flow hedges Foreign exchange forwards Equity options Cross currency interest rate swaps Derivatives designated as fair value hedges Interest rate swaps Total derivative assets/ (liabilities) held for hedging Total derivative assets/ (liabilities) Included above are the following amounts with related parties: Group undertakings fellow subsidiaries 42 (190.9) (20.9) 0.3 (170.3) 4.1 (217.4) 3.1 (220.5) 0.3 0.3 (142.1) 1.7 - 5.8 7.9 (2.1) 240.2 1.7 1.2 1.2 1.7 - - 1.7 2.9 1.2 1.7 5.0 1.2 (2.1) - 105.6 97.1 37.5 - - 75.2 75.2 75.2 75.2 75.2 75.2 4.1 1.7 75.2 81.0 83.1 (9.1) (66.9) (365.6) - 500.0 500.0 (2.1) 740.2 928 206.2 (441.6) 4 812.9 (5 254.5) (501.4) 319.7 (821.1) The company reported derivative assets of US$4 780.6 million (2011: US$7 019.7 million) and derivative liabilities of US$5 205.7 million (2011: US$7 322.4 million). The difference between the group and company amounts are due to foreign exchange and commodity derivatives. Standard Bank Plc Consolidated Annual Report 2012 4 Derivative instruments continued 4.2 Derivative assets and liabilities continued Group 2011 Maturity analysis of net fair value < 1 year 1 - 5 years > 5 years $m $m $m Net fair Fair value of Fair value of value assets liabilities $m $m $m Contract/ notional amount $m Derivatives held for trading Foreign exchange derivatives Forwards Futures Options (81.6) (83.9) (2.0) 4.3 9.9 3.2 (0.1) 6.8 14.7 14.4 0.3 (57.0) (66.3) (2.1) 11.4 1 306.0 1 275.7 6.0 24.3 (1 363.0) (1 342.0) (8.1) (12.9) 75 552.5 70 008.7 3 296.2 2 247.6 Interest rate derivatives Caps and floors Forwards Future options Swaps (75.1) (1.4) 1.9 13.1 (88.7) 74.1 1.4 0.1 43.7 28.9 94.4 (0.8) 95.2 93.4 2.0 56.0 35.4 3 128.2 1.4 7.5 92.8 3 026.5 (3 034.8) (1.4) (5.5) (36.8) (2 991.1) 564 550.4 556.1 14 690.7 405 758.9 143 544.7 Commodity derivatives Forwards Futures Options (14.7) (24.1) 66.5 (57.1) (31.2) 8.7 5.3 (45.2) 6.1 7.6 (1.5) (39.8) (7.8) 71.8 (103.8) 2 112.8 295.9 1 649.8 167.1 (2 152.6) (303.7) (1 578.0) (270.9) 412 619.2 15 365.4 381 600.3 15 653.5 (127.0) (9.9) (117.1) (15.6) 37.3 (52.9) (239.0) (12.7) (226.3) (381.6) 14.7 (396.3) 354.9 339.0 15.9 (736.5) (324.3) (412.2) 30 399.4 29 799.7 599.7 (1.9) 1.4 (3.3) (15.5) (19.0) 2.4 1.1 (17.4) (19.0) 3.8 (2.2) 7.6 5.0 2.6 (25.0) (19.0) (1.2) (4.8) 185.7 72.9 94.4 18.4 (402.4) 6 909.5 Credit derivatives Credit default swaps Total return swaps Equity derivatives Futures & forwards Options Swaps Total derivative assets/ (liabilities) held for trading - (300.3) 21.7 (123.8) (7 311.9) 1 083 307.2 17.2 (7.5) - 9.7 22.1 (12.4) 281.4 (1.7) 13.5 5.4 (7.5) - - (1.7) 6.0 5.4 0.1 16.6 5.4 (1.8) (10.6) - 127.0 108.4 46.0 61.9 61.9 61.9 61.9 61.9 61.9 84.0 Derivatives held for hedging Derivatives designated as cash flow hedges Foreign exchange forwards Equity options Cross currency interest rate swaps Derivatives designated as fair value hedges Interest rate swaps Total derivative assets/ (liabilities) held for hedging Total derivative assets/ (liabilities) Included above are the following amounts with related parties: Group undertakings fellow subsidiaries - - 17.2 (7.5) 61.9 71.6 (283.1) 14.2 (61.9) (330.8) 6 993.5 (540.0) 349.2 (12.4) 500.0 500.0 781.4 (7 324.3) 1 084 088.6 (889.2) 43 Notes to the annual financial statements continued 4 Derivative instruments continued 4.3Use and measurement of derivative instruments In the normal course of business, the group enters into a variety of derivative transactions for both trading and hedging purposes. Derivative financial instruments are entered into for trading purposes and for hedging foreign exchange, interest rate and equity exposures. Derivative instruments used by the group in both trading and hedging activities include swaps, options, forwards, futures and other similar types of instruments based on foreign exchange rates, interest rates, credit risk and the prices of commodities and equities. The risks associated with derivative instruments are monitored in the same manner as for the underlying instruments. Risks are also measured across the product range in order to take into account possible correlations. The fair value of all derivatives is recognised on the statement of financial position and is only netted to the extent that a legal right of set-off exists and there is an intention to settle on a net basis. Swaps are transactions in which two parties exchange cash flows on a specified notional amount for a predetermined period. The major types of swap transactions undertaken by the group are as follows: Interest n rate swap contracts generally entail the contractual exchange of fixed and floating rate interest payments in a single currency, based on a notional amount and an interest reference rate. Cross n currency interest rate swaps involve the exchange of interest payments based on two different currency principal balances and interest reference rates and generally also entail exchange of principal amounts at the start and/or end of the contract. Credit n default swaps are the most common form of credit derivative, under which the party buying protection makes one or more payments to the party selling protection during the life of the swap in exchange for an undertaking by the seller to make a payment to the buyer following a credit event, as defined in the contract, with respect to a third party. Total n return swaps are contracts in which one party (the total return payer) transfers the economic risks and rewards associated with an underlying asset to another counterparty (the total return receiver). The transfer of risk and reward is affected by way of an exchange of cash flows that mirror changes in the value of the underlying asset and any income derived there from. Options are contractual agreements under which the seller (writer) grants the purchaser the right, but not the obligation, either to buy (call option) or to sell (put option) by or at a set date, a specified 44 amount of a financial instrument or commodity at a predetermined price. The seller receives a premium from the purchaser for this right. Options may be traded over-the-counter (OTC) or on a regulated exchange. Forwards and futures are contractual obligations to buy or sell financial instruments or commodities on a future date at a specified price. Forward contracts are tailor-made agreements that are transacted between counterparties in the OTC market, whereas futures are standardised contracts transacted on regulated exchanges. 4.4 Derivatives held for trading The group trades derivative instruments on behalf of customers and for its own positions. The group transacts derivative contracts to address customer demands both as a market maker in the wholesale markets and in structuring tailored derivatives for customers. The group also takes proprietary positions for its own account. Trading derivative products include the following derivative instruments: 4.4.1Foreign exchange derivatives Foreign exchange derivatives are used to hedge foreign currency risks on behalf of customers and for the group’s own positions. Foreign exchange derivatives primarily consist of forward exchange contracts, foreign exchange futures and foreign exchange options. 4.4.2Interest rate derivatives Interest rate derivatives are used to modify the volatility and interest rate characteristics of interest-earning assets and interest-bearing liabilities on behalf of customers and for the group’s own positions. Interest rate derivatives primarily consist of caps and floors, forward rate agreements, future options and swaps. 4.4.3Commodity derivatives Commodity derivatives are used to address customer commodity demands and to take proprietary positions for the group’s own account. Commodity derivatives primarily consist of commodity forwards, commodity futures, and commodity options. 4.4.4Credit derivatives Credit derivatives are used to hedge the credit risk from one counterparty to another and manage the credit exposure to selected counterparties on behalf of customers and for the group’s own positions. Credit derivatives primarily consist of credit default swaps and total return swaps. 4.4.5Equity derivatives Equity derivatives are used to address customer equity demands and to take proprietary positions for the group’s own accounts. Equity derivatives primarily consist of futures, options, index options, swaps and other equity related financial derivative instruments. Standard Bank Plc Consolidated Annual Report 2012 4 Derivative instruments continued 4.5 Derivatives held for hedging 4.5.1Derivatives designated as cash flow hedges The group enters into derivative contracts to hedge future probable cash flows, which are designated as cash flow hedges. The n income statement volatility associated with future highly probable expenses in currencies other than the functional currency, is hedged utilising forward exchange contracts. Equity options are used to mitigate risk of change in cash flows n arising from changes in the long-term incentive liability, underpinned by the SBG share price (note 24.9.1). Cross n currency interest rate swaps are used to mitigate risk of changes in cash flows arising from changes in rates on the foreign currency denominated assets or liabilities. Gains and losses on the effective portion of derivatives designated as cash flow hedges of forecast transactions are initially recognised directly in other comprehensive income, in the cash flow hedging reserve, and are transferred to the income statement when the forecast cash flows impact the income statement. The forecast cash flows that will result in the release of the cash flow hedging reserve into the income statement at 31 December are as follows: Group Company 2012 2011 2012 2011 $m $m $m $m 113.2 138.9 113.2 138.9 More than 3 months but less than 1 year 55.2 70.0 55.2 70.0 More than 1 year but less than 5 years 21.3 39.3 21.3 39.3 189.7 248.2 189.7 248.2 Forecast cash flows 3 months or less Reconciliation of movements in the cash flow hedging reserve Balance at beginning of the year (1.8) 6.5 (1.8) 6.5 Amounts recognised directly in other comprehensive income 27.1 (1.6) 27.1 (1.6) (19.7) (9.7) (19.7) (9.7) Less: amounts released in profit or loss Interest income Operating expenses Less: deferred tax Balance at end of the year 2.1 1.5 2.1 1.5 (21.8) (11.2) (21.8) (11.2) (1.8) 3.0 (1.8) 3.0 3.8 (1.8) 3.8 (1.8) There were no transactions for which cash flow hedge accounting had to be ceased in 2012 or 2011 as a result of highly probable cash flows no longer expected to occur. A loss of US$2.0 million (2011: US$1.3 million gain) on the ineffective portions of such derivatives was recognised in profit or loss. 4.5.2Derivatives designated as fair value hedges The group’s fair value hedges consist of interest rate swaps that are used to mitigate the risk of changes in the fair value of financial instruments as a result of changes in market interest rates. For qualifying fair value hedges, all changes in the fair value of the derivative and in the fair value of the item in relation to the risk being hedged are recognised in profit or loss. Group Gains/(losses) arising from fair value hedges - on hedging instruments - on the hedged item attributable to the hedged risk The hedged item is disclosed in note 17 - ‘Subordinated debt’. Company 2012 2011 2012 2011 $m $m $m $m 13.3 52.9 13.3 52.9 (13.3) (53.6) (13.3) (53.6) 45 Notes to the annual financial statements continued Group Company 2012 2011 2012 2011 $m $m $m $m Government, utility bonds and treasury bills 1 820.9 1 703.8 1 815.6 1 702.6 Corporate bonds and floating rate notes 1 604.3 1 392.2 1 604.3 1 392.2 121.7 109.8 121.7 109.8 - 10.0 - 10.0 Reverse repurchase agreements 1 877.0 2 137.9 1 877.0 2 137.9 Commodities 1 223.8 811.1 1 155.5 800.1 5 Trading assets Listed equities Unlisted equities Other unlisted instruments 200.4 376.2 200.3 376.2 6 848.1 6 541.0 6 774.4 6 528.8 1.7 - 1.7 - Maturity analysis The maturities represent periods to contractual redemption of the trading assets recorded. - Redeemable on demand - Maturing within 1 month 528.0 543.9 528.0 543.8 1 759.8 1 582.3 1 759.8 1 582.3 556.7 408.3 556.7 408.3 - Maturing after 12 months 2 768.4 3 199.2 2 763.1 3 198.0 - Undated 1 233.5 807.3 1 165.1 796.4 6 848.1 6 541.0 6 774.4 6 528.8 1.1 5.5 1.1 5.5 Unlisted equities 31.7 52.9 31.7 52.9 Investment funds - - 24.1 27.5 4.0 9.8 - - 36.8 68.2 56.9 85.9 4.0 9.8 - - 32.8 58.4 56.9 85.9 36.8 68.2 56.9 85.9 - Maturing after 1 month but within 6 months - Maturing after 6 months but within 12 months 6 Financial investments Listed equities Mutual funds Maturity analysis The maturities represent periods to contractual redemption of the financial investments recorded. - Redeemable on demand - Undated 46 Standard Bank Plc Consolidated Annual Report 2012 Group Company 2012 2011 2012 2011 $m $m $m $m - 3 .1 - 3 .1 503 .7 123 .7 503 .7 123 .7 503 .7 126 .8 503 .7 126 .8 - 3 .1 - 3 .1 503 .7 123 .7 503 .7 123 .7 503 .7 126 .8 503 .7 126 .8 7 Pledged assets 7.1Assets transferred not derecognised Corporate bonds Commodities Maturity analysis The maturities represent periods to contractual redemption of the pledged assets recorded. - Maturing after 12 months - Undated The group enters into transactions in the normal course of business by which it transfers recognised financial assets directly to third parties. These transfers may give rise to full or partial derecognition of the financial assets concerned. Where the group has retained substantially all of the risks and rewards associated with the transferred assets, it continues to recognise these assets. To the extent that the counterparty is permitted to sell and / or re-pledge these assets in the absence of default, they are classified on the statement of financial position as pledged assets. Included in pledged assets are commodity lease transactions where the counterparty has the right to use the asset for a predetermined amount of time. Risks that the group remains exposed to include market, credit and interest rate risk. There are no associated liabilities recorded on the balance sheet for these transactions. 7.2 Financial assets pledged as collateral for liabilities The carrying amount of total financial assets that have been pledged as collateral for liabilities at 31 December 2012 was US$1 549.8 million (2011: US$1 017.4 million). These transactions are conducted under standard SIFMA / ICMA commissioned Global Master Repurchase Agreement (GMRA) terms and conditions. 7.3 Collateral accepted as security for assets As part of the reverse repurchase and securities borrowing agreements, the group has received securities that it is allowed to sell or repledge. The fair value of the financial assets accepted as collateral that the group is permitted to sell or re-pledge in the absence of default is US$6 682.2 million (2011: US$11 497.1 million). This includes cash collateral of US$1 204.1 million (US$1 117.3 million). The fair value of financial assets accepted as collateral that have been sold or re-pledged is US$1 465.3 million (2011: US$750.9 million). The group is obliged to return equivalent securities. These transactions are conducted under standard SIFMA / ICMA commissioned GMRA terms and conditions as well as requirements determined by exchanges where the group acts as an intermediary. 47 Notes to the annual financial statements continued Group Company 2012 2011 2012 2011 $m $m $m $m Loans and advances to banks 3 084.5 7 416.1 3 071.7 7 342.7 Gross loans and advances to banks 3 085.1 7 416.2 3 072.3 7 342.8 999.8 1 355.9 1 023.6 1 355.9 1 592.9 5 035.2 1 593.1 5 035.2 492.4 1 025.1 455.6 951.7 8 Loans and advances 8.1Loans and advances net of impairments - Demand and term loans - Loans granted under resale agreements - Balances with banks Credit impairments for loans and advances to banks (0.6) (0.1) (0.6) (0.1) Loans and advances to customers 3 076.3 5 607.7 3 103.6 5 668.1 Gross loans and advances to customers 3 310.0 5 845.1 3 337.3 5 905.5 - Demand loans and advances 1 396.6 1 154.8 1 423.9 1 215.2 549.5 2 191.1 549.5 2 191.1 1 363.9 2 499.2 1 363.9 2 499.2 - Term loans - Loans granted under resale agreements Credit impairments for loans and advances to customers (233.7) (237.4) (233.7) (237.4) - Specific credit impairments (223.7) (195.3) (223.7) (195.3) - Portfolio credit impairments (10.0) (42.1) (10.0) (42.1) 6 160.8 13 023.8 6 175.3 13 010.8 6 395.1 13 261.3 6 409.6 13 248.3 Comprising: Gross loans and advances Less: Specific credit impairments (224.3) (195.4) (224.3) (195.4) Less: Portfolio credit impairments (10.0) (42.1) (10.0) (42.1) 6 160.8 13 023.8 6 175.3 13 010.8 - Redeemable on demand 2 203.6 2 102.7 2 190.8 2 025.8 - Maturing within 1 month 3 160.0 6 966.9 3 160.0 6 966.9 - Maturing after 1 month but within 3 months 584.1 1 381.2 593.0 1 381.2 - Maturing after 3 months but within 6 months 124.2 604.6 124.2 604.6 - Maturing after 6 months but within 12 months 174.1 919.5 174.1 937.6 - Maturing after 12 months but within 5 years 71.8 1 110.6 90.2 1 156.4 - Maturing after 5 years 77.3 175.8 77.3 175.8 6 395.1 13 261.3 6 409.6 13 248.3 Maturity analysis The maturity analysis is based on the remaining periods to contractual maturity from year end. 48 Standard Bank Plc Consolidated Annual Report 2012 Group Company 2012 2011 2012 2011 $m $m $m $m - Redeemable on demand 946.2 944.7 933.4 871.3 - Maturing within 1 month 1 736.7 4 968.6 1 736.7 4 968.6 - Maturing after 1 month but within 3 months 306.7 499.2 306.7 499.2 - Maturing after 3 months but within 6 months 62.9 425.6 62.9 425.6 - Maturing after 6 months but within 12 months 15.3 351.4 15.3 351.4 - 224.5 - 224.5 17.3 2.2 17.3 2.2 3 085.1 7 416.2 3 072.3 7 342.8 - Redeemable on demand 1 257.4 1 158.0 1 257.4 1 154.5 - Maturing within 1 month 8 Loans and advances continued 8.1Loans and advances net of impairments continued Maturity analysis continued Loans and advances to banks - gross - Maturing after 12 months but within 5 years - Maturing after 5 years Loans and advances to customers - gross 1 423.3 1 998.3 1 423.3 1 998.3 - Maturing after 1 month but within 3 months 277.4 882.0 286.3 882.0 - Maturing after 3 months but within 6 months 61.3 179.0 61.3 179.0 - Maturing after 6 months but within 12 months 158.8 568.1 158.8 586.2 - Maturing after 12 months but within 5 years 71.8 886.1 90.2 931.9 - Maturing after 5 years 60.0 173.6 60.0 173.6 3 310.0 5 845.1 3 337.3 5 905.5 36.3 158.7 36.3 158.7 Segmental industry analysis - gross Agriculture Electricity 52.6 140.0 52.6 140.0 Finance - Banks 3 085.1 7 416.2 3 072.3 7 342.8 Finance - Non Bank Financial Institutions 2 335.1 3 548.5 2 389.0 3 674.4 148.1 422.0 121.5 356.5 Individuals Leisure 2.8 20.3 2.8 20.3 Manufacturing 179.0 291.6 179.0 291.6 Mining 171.2 570.9 171.2 570.9 Other services 116.2 233.9 116.2 233.9 7.6 92.7 7.6 92.7 Telecommunications Transport 12.6 77.7 12.6 77.7 Wholesale 248.5 288.8 248.5 288.8 6 395.1 13 261.3 6 409.6 13 248.3 49 Notes to the annual financial statements continued Group Company 2012 2011 2012 2011 $m $m $m $m 153.6 227.6 177.5 227.6 85.7 1.6 85.7 1.6 161.6 79.7 161.6 108.9 400.9 308.9 424.8 338.1 Minimum amount during the year 257.9 277.7 268.0 273.5 Maximum amount during the year 474.0 683.5 502.3 687.4 8 Loans and advances continued 8.1Loans and advances net of impairments continued Included in gross loans and advances are the following amounts due from related parties: Group undertakings fellow subsidiaries - Loans and advances to banks - Loans granted under resale agreements - Loans and advances to customers 8.2Credit impairments for loans and advances Specific impairments Balance at beginning of the year Amounts written off Unwinding of discount element in interest income Net impairments raised 195.4 164.9 195.4 164.9 (147.3) (104.0) (147.3) (151.1) 174.7 Exchange and other movements 1.5 Balance at end of the year (0.1) 142.0 (7.4) 174.7 1.5 (0.1) 189.1 (7.4) 224.3 195.4 224.3 195.4 42.1 39.0 42.1 39.0 (32.1) 3.1 (32.1) 3.1 Portfolio impairments Balance at beginning of the year Net impairments (released)/raised 1 Balance at end of the year Total 10.0 42.1 10.0 42.1 234.3 237.5 234.3 237.5 - 0.8 - 0.8 Segmental analysis of specific impairments - industry Agriculture Electricity Finance Individuals Manufacturing Mining Other services 1 50 Reduction in the impairment is a reflection of the reduced loan portfolio. 3.3 2.8 3.3 2.8 127.8 140.5 127.8 140.5 8.4 8.1 8.4 8.1 29.6 3.9 29.6 3.9 5.2 5.0 5.2 5.0 50.0 34.3 50.0 34.3 224.3 195.4 224.3 195.4 Standard Bank Plc Consolidated Annual Report 2012 Group Company 2012 2011 2012 2011 $m $m $m $m 9 Other assets Unsettled dealing balances 174.6 65.6 174.6 65.6 Other receivables 230.2 333.6 153.0 248.7 404.8 399.2 327.6 314.3 Group undertakings - fellow subsidiaries 44.6 102.7 44.7 102.7 Minimum amount during the year 39.4 76.1 39.4 78.1 Maximum amount during the year 319.5 239.8 317.2 238.9 Included above are the following amounts due from related parties: 10Deferred tax assets and liabilities Deferred tax assets and liabilities are attributable to the following: Timing differences on: - Capital allowances - Impaired loans - Cash flow hedges - Share based payments - Unused tax losses - Other short-term timing differences 11.2 1.2 (1.2) 9.6 (2.0) (0.9) 1.8 0.6 27.1 21.0 (1.6) 11.2 1.2 (1.2) 9.6 (0.8) (0.9) 1.8 0.6 27.1 21.0 (1.4) 18.8 48.0 20.0 48.2 Deferred tax asset 20.0 48.2 20.0 48.2 Deferred tax liability (1.2) (0.2) - - 18.8 48.0 20.0 48.2 Opening balance Recognised in profit or loss Recognised in other comprehensive income Closing balance $m $m $m $m Comprising: The movements in the deferred tax balance were as follows: 2012 - Capital allowances - Impaired loans - Cash flow hedges - Share based payments - Unused tax losses - Other short-term timing differences1 1 (0.9) 1.8 0.6 27.1 21.0 (1.6) 12.1 (0.6) (17.5) (21.0) (0.4) (1.8) - 11.2 1.2 (1.2) 9.6 (2.0) 48.0 (27.4) (1.8) 18.8 US$1.2 million (2011: US$0.2 million) recognised in consolidated group only. A deferred tax asset of US$96.4 million (2011: US$nil) has not been recognised in respect of unutilised tax trading losses and share based payments. Additional information is presented in note 2.4. 51 Notes to the annual financial statements continued 10 Deferred tax assets and liabilities continued 2011 Opening balance - Capital allowances - Impaired loans - Cash flow hedges - Share based payments - Unused tax losses - Other short-term timing differences Recognised in profit or loss Recognised in other comprehensive income Closing balance $m $m $m $m (7.1) 2.4 (2.4) 19.0 (1.4) 6.2 (0.6) 8.1 21.0 (0.2) 3.0 - (0.9) 1.8 0.6 27.1 21.0 (1.6) 10.5 34.5 3.0 48.0 Company 2012 $m 2011 $m 16.0 16.0 11Investment in group company Carrying value at end of the year The subsidiary undertaking is as follows: Entity Standard Resources (China) Limited Activity Country of incorporation % Interest Trading company The People’s Republic of China 100 Cost $m 2012 Accumulated amortisation $m Carrying value $m Cost $m 2011 Accumulated amortisation $m Carrying value $m 12 Intangible assets Computer software 123.8 (75.9) 47.9 165.3 (73.5) 91.8 123.8 (75.9) 47.9 165.3 (73.5) 91.8 Opening Carrying value $m Additions1 Amortisation Impairments $m $m $m Closing Carrying value $m Movement 2012 91.8 7.5 (26.3) (25.1) 47.9 2011 115.6 14.7 (28.1) (10.4) 91.8 1 Additions includes US$3.4 million (2011: US$9.6 million) internal development costs. Capitalised computer software represents computer software and development costs which are of a strategic nature with an expected useful life of 5 years. They are comprised mainly of core front office trading systems and back office settlement or risk systems and represent a combination of internal and external costs. The assets are amortised on the straight-line basis over their expected life. No research and development costs have been incurred during the period. Certain projects were suspended during the year which resulted in an impairment charge of US$25.1 million (2011: US$10.4 million). The full amount (2011: US$2.7 million) is included in restructuring costs disclosed in note 24.8. 52 Standard Bank Plc Consolidated Annual Report 2012 2012 2011 Cost $m Accumulated amortisation $m Carrying value $m Cost $m Accumulated amortisation $m Carrying value $m 28.9 (21.3) 7.6 27.2 (17.2) 10.0 Motor vehicles 0.2 (0.2) - 0.2 (0.1) 0.1 Office equipment 6.5 (2.8) 3.7 6.3 (2.1) 4.2 35.3 (18.8) 16.5 35.5 (14.4) 21.1 70.9 (43.1) 27.8 69.2 (33.8) 35.4 13Property and equipment Group 13.1Summary Computer equipment Furniture and fittings 2011 Carrying value $m Additions $m Disposals $m 10.0 2.0 - (4.4) - 7.6 0.1 - - (0.1) - - Depreciation charge Impairments $m $m 2012 Carrying value $m 13.2Movement Computer equipment Motor vehicles Office equipment Furniture and fittings 4.2 - - (0.5) - 3.7 21.1 0.9 - (5.5) - 16.5 35.4 2.9 - (10.5) - 27.8 Impairments $m 2011 Carrying value $m - 10.0 2010 Carrying value $m Additions $m Disposals $m 10.5 6.3 - Motor vehicles 0.1 - - Office equipment 5.1 - 29.6 1.6 45.3 7.9 Computer equipment Furniture and fittings - Depreciation charge $m (6.8) - 0.1 (0.9) - - 4.2 (6.1) (4.0) 21.1 (13.8) (4.0) 35.4 53 Notes to the annual financial statements continued 13 Property and equipment continued 2012 Accumulated Cost amortisation $m $m Carrying value $m Cost $m 2011 Accumulated amortisation $m Carrying value $m Company 13.3Summary Computer equipment Office equipment Furniture and fittings 28.3 (21.0) 7.3 26.7 (17.0) 9.7 5.2 (1.7) 3.5 5.2 (1.3) 3.9 34.9 (18.5) 16.4 35.1 (14.3) 20.8 68.4 (41.2) 27.2 67.0 (32.6) 34.4 2011 Carrying value $m Impairments $m 2012 Carrying value $m Additions $m Computer equipment 9.7 1.9 - (4.3) - 7.3 Office equipment 3.9 - - (0.4) - 3.5 20.8 0.9 - (5.3) - 16.4 34.4 2.8 - (10.0) - 27.2 Impairments $m 2011 Carrying value $m Depreciation Disposals charge $m $m 13.4Movement Furniture and fittings Computer equipment Office equipment Furniture and fittings 54 2010 Carrying value $m Additions $m Disposals $m 10.4 6.0 - (6.7) - 9.7 4.5 - - (0.6) - 3.9 29.7 1.1 - (6.0) (4.0) 20.8 44.6 7.1 - (13.3) (4.0) 34.4 Depreciation charge $m Standard Bank Plc Consolidated Annual Report 2012 Group Company 2012 2011 2012 2011 $m $m $m $m 105.8 263.1 105.8 263.1 66.9 60.0 66.9 60.0 - 3.0 - 3.0 61.4 41.3 61.4 41.3 1 052.3 736.6 1 052.3 736.6 982.6 1 028.8 982.6 1 028.8 5.3 0.5 5.3 0.5 2 274.3 2 133.3 2 274.3 2 133.3 - Maturing within 1 month 794.0 15.7 794.0 15.7 - Maturing after 1 month but within 6 months 318.0 139.9 318.0 139.9 - Maturing after 6 months but within 12 months 230.1 126.7 230.1 126.7 - Maturing after 12 months 862.8 1 774.3 862.8 1 774.3 69.4 76.7 69.4 76.7 2 274.3 2 133.3 2 274.3 2 133.3 14 Trading liabilities Government and utility bonds Corporate bonds Listed equities Unlisted equities Repurchase agreements Credit linked notes Other unlisted instruments Maturity analysis The maturities represent periods to contractual redemption of the trading liabilities recorded. - Undated liabilities Included above are the following amounts due to related parties: Group undertakings - fellow subsidiaries 1 008.3 736.6 1 008.3 736.6 Minimum amount during the year 720.7 736.6 720.7 736.6 Maximum amount during the year 1 289.6 1 602.6 1 289.6 1 602.6 Deposits from banks 8 032.0 11 532.8 7 999.9 11 534.0 Deposits from banks 7 074.7 11 088.1 7 042.6 11 089.3 Repurchase agreements 624.3 170.3 624.3 170.3 Commercial paper 333.0 274.4 333.0 274.4 Deposits from customers 2 376.8 2 950.8 2 414.2 2 973.8 Call deposits 1 506.4 1 650.1 1 543.8 1 673.1 Term deposits 686.6 1 090.9 686.6 1 090.9 Repurchase agreements 183.8 209.8 183.8 209.8 10 408.8 14 483.6 10 414.1 14 507.8 15Deposit and current accounts 55 Notes to the annual financial statements continued 15 Deposit and current accounts continued Group Company 2012 2011 2012 2011 $m $m $m $m - Repayable on demand 3 782.1 5 918.9 3 819.5 5 941.9 - Maturing within 1 month 2 433.6 3 600.9 2 433.6 3 600.9 - Maturing after 1 month but within 3 months 2 171.3 1 572.2 2 158.4 1 572.3 - Maturing after 3 months but within 6 months 1 193.8 1 233.5 1 174.6 1 233.5 - Maturing after 6 months but within 12 months 368.7 1 279.1 368.7 1 279.1 - Maturing after 12 months but within 5 years 429.2 847.6 429.2 848.7 30.1 31.4 30.1 31.4 10 408.8 14 483.6 10 414.1 14 507.8 Group undertakings - fellow subsidiaries1 3 608.7 6 221.4 3 646.2 6 244.3 Minimum amount during the year 3 608.7 6 221.4 3 646.2 6 244.3 Maximum amount during the year 6 771.0 10 133.3 6 852.8 10 152.6 Maturity analysis The maturity analysis is based on the remaining periods to contractual maturity from year end. - Maturing after 5 years Included above are the following amounts due to related parties: 1 Included in deposits from banks is US$2 511.3 million (2011: US$3 610.0 million) placed by Standard Bank Jersey Limited and Standard Bank Isle of Man Limited. Group Company 2012 2011 2012 2011 $m $m $m $m Unsettled dealing balances 75.8 97.8 62.3 94.9 Long-term share incentives 116.8 110.5 116.8 110.5 Other 533.8 455.5 529.1 443.0 726.4 663.8 708.2 648.4 Due within one year 702.9 616.5 684.7 601.1 Due after one year 23.5 47.3 23.5 47.3 726.4 663.8 708.2 648.4 Group undertakings - fellow subsidiaries 106.1 83.5 106.1 86.6 Minimum amount during the year 106.1 73.2 106.1 83.0 Maximum amount during the year 344.4 293.6 350.3 295.6 16 Other liabilities Comprising: Included above are the following amounts due to related parties: 56 Standard Bank Plc Consolidated Annual Report 2012 Group Company 2012 2011 2012 2011 $m $m $m $m 25.0 25.0 25.0 25.0 570.2 556.7 570.2 556.7 Step-up subordinated floating rate notes 2019 299.0 298.9 299.0 298.9 Step-up perpetual subordinated notes 141.7 141.7 141.7 141.7 9.4 9.7 9.4 9.7 1 045.3 1 032.0 1 045.3 1 032.0 Group undertakings - fellow subsidiaries 301.1 301.2 301.1 301.2 Minimum amount during the year 301.0 301.1 301.0 301.1 Maximum amount during the year 303.4 303.3 303.4 303.3 17 Subordinated debt Carrying value Subordinated step-up rate notes 20191 Subordinated fixed rate notes 2019 2 3 4 Accrued interest Included above are the following amounts due to related parties: 1 onds issued in US Dollars (US$25 million) bearing interest equal to 8% per annum until 3 December 2014, whereafter it will increase to 8.5% until maturity on B 3 December 2019. 2 onds issued in US Dollars (US$500 million) bearing interest equal to 8.125% per annum until maturity on 2 December 2019. To manage interest rate volatility, the group B has entered into a fair value hedge. Refer note 4.5.2 3 onds issued in US Dollars (US$300 million) at a floating rate bearing interest equal to the aggregate of 4% per annum and the London interbank offered rate for threeB month US Dollar deposits. The bonds carry an option to be redeemed in full at their nominal value on or after 2 December 2014. After this option date, the bonds bear interest at the aggregate of 4.5% per annum and the London interbank offered rate for three-month US Dollar deposits, until maturity on 2 December 2019. 4 onds issued in US Dollars (US$141.7 million) at a fixed rate equal to 8.012% per annum. The bonds carry an option to be redeemed in full at their nominal value on or B after 27 July 2016. After this option date, the bonds bear interest at the aggregate of 3.25% per annum and the London interbank offer rate for three-month US Dollar deposits. The principal has no fixed repayment date. Claims in respect of the loan capital are subordinated to the claims of the other creditors. The group has not defaulted on principal, interest or other breaches with respect to its subordinated liabilities during 2012 and 2011. 57 Notes to the annual financial statements continued 18 Classification of assets and liabilities The table below sets out the group’s classification of assets and liabilities, and their fair values. Note Other Held-for- Designated Loans and Available- amortised trading1 at fair value receivables for-sale cost $m $m $m $m $m Other nonfinancial assets/ liabilities $m Total carrying amount $m Fair value $m 31 December 2012 Assets Balances with central banks 3 - - 2 228.2 - - - 2 228.2 2 228.2 Derivative assets 4 4 812.9 - - - - - 4 812.9 4 812.9 Trading assets 5 6 848.1 - - - - - 6 848.1 6 848.1 Financial investments 6 - 33.8 - 3.0 - - 36.8 36.8 Pledged assets 7 503.7 - - - - - 503.7 503.7 Loans and advances to banks 8 - 17.1 3 067.4 - - - 3 084.5 3 086.0 Loans and advances to customers 8 - 30.9 3 045.4 - - - 3 076.3 3 077.6 12 164.7 81.8 8 341.0 3.0 - - 20 590.5 20 593.3 - - - - - 500.5 500.5 12 164.7 81.8 8 341.0 3.0 - 500.5 21 091.0 Financial assets Other non-financial assets Total assets Liabilities Derivative liabilities 4 5 254.5 - - - - - 5 254.5 5 254.5 Trading liabilities 14 2 274.3 - - - - - 2 274.3 2 274.3 Deposits from banks 15 - 2.0 - - 8 030.0 - 8 032.0 8 042.7 Deposits from customers 15 - 50.8 - - 2 326.0 - 2 376.8 2 377.5 Subordinated debt 17 Financial liabilities Other non-financial liabilities Total liabilities 1 58 - - - - 1 045.3 - 1 045.3 1 080.8 7 528.8 52.8 - - 11 401.3 - 18 982.9 19 029.8 - - - - - 733.5 733.5 7 528.8 52.8 - - 11 401.3 733.5 19 716.4 Includes derivative assets and liabilities held for hedging. Refer to note 4.5. Standard Bank Plc Consolidated Annual Report 2012 18 Classification of assets and liabilities continued Other nonfinancial assets/ liabilities $m Total carrying amount $m Fair value $m Note Held-fortrading $m Designated at fair value $m Loans and receivables $m Availablefor-sale $m Other amortised cost $m Derivative assets 4 6 993.5 - - - - - 6 993.5 6 993.5 Trading assets 5 6 541.0 - - - - - 6 541.0 6 541.0 Financial investments 6 - 68.2 - - - - 68.2 68.2 Pledged assets 7 126.8 - - - - - 126.8 126.8 Loans and advances to banks 8 - 12.2 7 403.9 - - - 7 416.1 7 418.9 Loans and advances to customers 8 - 151.1 5 456.6 - - - 5 607.7 5 596.1 13 661.3 231.5 12 860.5 - - - 26 753.3 26 744.5 31 December 2011 Assets Financial assets Other non-financial assets Total assets - - - - - 590.9 590.9 13 661.3 231.5 12 860.5 - - 590.9 27 344.2 Liabilities Derivative liabilities 4 7 324.3 - - - - - 7 324.3 7 324.3 Trading liabilities 14 2 133.3 - - - - - 2 133.3 2 133.3 Deposits from banks 15 - 120.3 - - 11 412.5 - 11 532.8 11 499.1 Deposits from customers 15 - 66.2 - - 2 884.6 - 2 950.8 2 951.5 Subordinated debt 17 Financial liabilities Other non-financial liabilities Total liabilities - - - - 1 032.0 - 1 032.0 1 012.5 9 457.6 186.5 - - 15 329.1 - 24 973.2 24 920.7 - - - - - 672.1 672.1 9 457.6 186.5 - - 15 329.1 672.1 25 645.3 59 Notes to the annual financial statements continued 18 Classification of assets and liabilities continued Estimation of fair values The process of marking to market seeks to value a financial instrument at its fair value. The best indicator of a fair value is an independently published price quoted in an active market. If the instrument is not traded in an active market, its fair value is determined using valuation techniques consistent with other market participants to price similar financial instruments. Where valuation techniques are used to determine fair values, they are validated and periodically independently reviewed by qualified senior personnel. All models are approved before they are used, and models are calibrated and back-tested to ensure that outputs reflect actual data and comparative market prices. To the extent practical, models use only observable data, however, areas such as credit risk (both own and counterparty), volatilities and correlations require management to make estimates. Changes in assumptions about these factors could affect the reported fair value of the financial instruments. Such assumptions include risk premiums, liquidity discount rates, credit risk, volatilities and correlations. The fair value can be a function of many variables. These variables can include factors unique to the position such as liquidity and oversupply, as well as the rationale for holding the instrument. Fair value does not factor in ‘fire-sale’ or ‘distressed sale’ conditions unless immediate sale is the trading objective. Equally, fair value does not factor in ‘trading off the information curve’, i.e. trades between unequally informed counterparties. In order to arrive at fair value, valuation adjustments are made where appropriate, to include liquidity risk, model risk, parameter uncertainty, credit risk, administrative costs and revenue recognition. It is permitted to value a portfolio (whether comprised of OTC or exchange traded instruments) at mid-market if it has assets and liabilities with offsetting market risks. This would include situations where instruments that incorporate a combination of risks (i.e. corporate bonds which trade interest rate risk and credit risk) are hedged against some of the risks, leaving the other risks open. In that case bid/offer adjustment is applied on the net open risk position as appropriate. The valuation methodologies used are objective and deterministic, i.e. given the same market conditions and holding assumptions, the marking process should produce identical results. However, valuing any instrument or portfolio involves a degree of judgement and can never be completely defined in mechanistic terms. There may not be one perfect mark for any position, but rather ranges of possible values. At any point in time, the mark-to-market on a financial instrument must be based on the effective deal tenor or term. 60 For certain commodity trades, where the group purchases spot and sells to the same counterparty at a fixed price on a forward settling basis, transactions are valued as financing transactions and are priced accordingly. Where similar trades occur but the far leg is executed as an option or at a prevailing market price, the individual trades are priced as individual spot and forward trades. Private equity positions are valued according to specific private equity valuation policies which follow international guidelines. These items include private equity investments in individual enterprises and in funds. Derivatives are estimated using either market prices, broker quotes or discounting future flows. Performance risk of the counterparts and correlation between counterpart and underlying performance may also be factored into valuation where applicable. Fair value of financial instruments held at amortised cost The value of financial instruments not carried at fair value incorporates the group’s estimate of the amount at which financial assets could be exchanged, or liabilities settled between knowledgeable, willing counterparts in an arm’s length transaction. It does not reflect the costs / benefits that the group expects to measure on the flows generated over the expected life of the instrument. Other reporting entities may use different valuation methodologies and assumptions in determining fair values for which no observable market prices are available. The fair values stated at a point in time may differ significantly from the amounts which will actually be paid on the maturity date or settlement dates of the instruments. In many cases it will not be possible to realise immediately the estimated fair values. The following methods and significant assumptions have been applied in determining the fair values: The n fair value of demand deposits with no specific maturity is assumed to be the amount payable at the end of the reporting period. The fair value of the variable and fixed rate financial instruments n carried at amortised cost is estimated by comparing interest rates when the loans were granted with current market interest rates and credit spreads on similar loans. For n impaired loans, fair value is estimated by discounting the future cash flows over the time period they are expected to be recovered, which includes consideration of collateral. For n secured loans and deposits arising from sale and repurchase agreements and for bond transactions that are due to settle on a date beyond the market norm (i.e. forward settlement), the group receives collateral in the form of cash or securities. The collateral is valued using established valuation techniques and variation margin is called or paid. Carrying amounts therefore closely reflect fair values. Standard Bank Plc Consolidated Annual Report 2012 18 Classification of assets and liabilities continued Overnight index based swap curves (OIS) A number of market participants have changed inputs in the valuation methodology of certain products from the use of Libor rate to Overnight Index Swap rates (OIS) to reflect the nature of the cost of financing of the product. Most collateral balances on derivative trades are funded at an overnight rate and hence OIS curves are more relevant than traditional Libor curves for such trades. As is the emerging practice amongst market participants, Overnight Index Swap (OIS) discounting was considered in the valuation methodology for certain products. This market divergence from the use of Libor to OIS is to reflect the nature of the cost of financing the product. The application of OIS discounting can be divided into observable and non-observable markets. The observable OIS markets being mainly G4 Currencies, with the non-observable markets being those in emerging market countries such as South Africa. The group valuation approach was divided and assessed along these lines. The assessment of the G4 currencies’ exposure indicated immaterial valuation differences from the current market standard Libor methodology, and was not applied in determining fair value. An assessment of the OIS market in South Africa confirmed that the OIS methodology is still evolving and is currently non-observable and the interbank offer rate is still the valuation method used for valuing derivatives in South Africa in line with the SBG approach. Own credit adjustments (DVA) The group has priced in the market price effect of own credit into issued paper which is currently held in trading books at fair value. The approach for pricing own credit is based on the Standard Bank Group credit curve as this is the most transparent observation of own credit. Market standard models have been used and adjusted accordingly where appropriate. Own credit adjustments (DVA) on a section of derivative instruments are currently based on current present value exposures. Credit valuation adjustments are taken in full on these trades based on future positive exposures. 19Financial instruments measured at fair value The tables on page 62 analyse financial instruments carried at fair value at the end of the reporting period (note 18) by level of fair value hierarchy. The different levels are based on the extent to which quoted prices are used in the calculation of the fair value of financial instruments and the levels have been defined as follows: Level 1 - fair values are based on quoted market prices (unadjusted) in active markets for identical instruments. Level 2 - fair values are calculated using valuation techniques based on observable inputs, either directly (i.e. as prices) or indirectly (i.e. derived from prices). This category includes instruments valued using quoted market prices in active markets for similar instruments, quoted prices for identical or similar instruments in markets that are considered less than active or other valuation techniques where all significant inputs are directly or indirectly observable from market data. Level 3 - fair values are based on valuation techniques using significant unobservable inputs. This category includes all instruments where the valuation inputs for the asset or liability are not based on observable market data (unobservable inputs). All fair valued instruments are subjected to the independent price verification (IPV) process. Level 3 items are identified where the asset or liability contains a significant exposure to a parameter that is not directly observable in the market, e.g. credit spreads, discounts rates etc. Level 3 classification does not infer lack of comfort with the modelled price, but rather that a significant exposure within the pricing can not be directly tested to an observable exit price, or where the observation is indicative and not testable in an active market. Classification is always determined at an instrument and not portfolio level. Credit valuation adjustments (CVA) Credit valuation adjustments are taken against derivative exposures in order to reflect the potential current and future impact of counterpart performance with regards to these contracts. The exposures upon which a provision is calculated is not the current replacement value in the balance sheet but rather an expectation of future exposures that the group will have to such counterparties. The typical calculation of a future exposure on a trade is based on a simulation of expected positive exposures performed to standard market methodologies. 61 Notes to the annual financial statements continued 19Financial instruments measured at fair value continued Group 1 Level 1 Level 2 Level 3 Total $m $m $m $m 998.6 3 547.9 266.4 4 812.9 2 303.5 3 833.7 710.9 6 848.1 2012 Assets Derivative assets Trading assets Financial investments 4.1 3.4 29.3 36.8 503.7 - - 503.7 Loans and advances to banks - 17.1 - 17.1 Loans and advances to customers - 8.4 22.5 30.9 3 809.9 7 410.5 1 029.1 12 249.5 Pledged assets Comprising: Held-for-trading 12 164.7 Designated at fair value 81.8 Available-for-sale 3.0 12 249.5 Liabilities Derivative liabilities Trading liabilities Deposits from banks Deposits from customers 1 039.5 3 968.2 246.8 5 254.5 384.0 1 298.0 592.3 2 274.3 - 2.0 - 2.0 - 50.8 - 50.8 1 423.5 5 319.0 839.1 7 581.6 Comprising: Held-for-trading Designated at fair value 7 528.8 52.8 7 581.6 1 There are no material differences between group and company. There were no significant transfers between level 1 and level 2 in the current year. 62 Standard Bank Plc Consolidated Annual Report 2012 19Financial instruments measured at fair value continued Level 1 Level 2 Level 3 Total $m $m $m $m 1 405.2 5 327.2 261.1 6 993.5 896.8 4 945.2 699.0 6 541.0 2011 Assets Derivative assets Trading assets Financial investments 9.8 5.8 52.6 68.2 123.7 3.1 - 126.8 Loans and advances to banks - 12.2 - 12.2 Loans and advances to customers - 58.9 92.2 151.1 2 435.5 10 352.4 1 104.9 13 892.8 Pledged assets Comprising: Held-for-trading 13 661.3 Designated at fair value 231.5 Available-for-sale - 13 892.8 Liabilities Derivative liabilities Trading liabilities Deposits from banks Deposits from customers 1 308.1 5 896.9 119.3 7 324.3 182.0 1 198.3 753.0 2 133.3 - 120.3 - 120.3 - 66.2 - 66.2 1 490.1 7 281.7 872.3 9 644.1 Comprising: Held-for-trading Designated at fair value 9 457.6 186.5 9 644.1 63 Notes to the annual financial statements continued 19Financial instruments measured at fair value continued 19.1 Reconciliation of level 3 financial assets Group1 Derivative assets $m Trading assets $m Financial investments $m Loans and advances to customers $m Total $m 261.1 699.0 52.6 92.2 1 104.9 2012 Balance at beginning of the year Total gains/(losses) included in trading revenue - Realised - Unrealised Purchases Sales and settlements 2.6 (3.7) (17.3) (2.1) (56.6) 16.3 24.4 (0.2) (21.7) (54.1) 72.9 (21.8) (3.5) 2.6 215.5 (18.4) Transfers into level 32 (506.5) 4.4 52.0 - 218.1 (15.8) (33.1) 300.3 Transfers out of level 3 - - Foreign exchange movements - - - 3.3 3.3 266.4 710.9 29.3 22.5 1 029.1 295.3 569.8 62.3 176.1 1 103.5 42.3 (28.6) 8.7 (24.7) 3 Balance at end of the year (3.8) - (573.8) 4.8 (22.6) 305.1 (26.4) 2011 Balance at beginning of the year Total gains/(losses) included in trading revenue - Realised 2.0 17.2 (2.8) - Unrealised 40.3 (45.8) 11.5 (24.9) (18.9) Purchases 23.7 411.7 0.8 26.7 462.9 (79.1) (662.0) Sales and settlements Transfers into level 3 2 Transfers out of level 33 Foreign exchange movements Balance at end of the year 64 (110.1) 20.4 (10.5) (453.6) 199.9 (0.2) (19.2) 0.2 (2.3) - - 16.6 220.3 - (5.9) (16.6) (0.9) (0.9) - - - 261.1 699.0 52.6 92.2 1 There are no material differences between group and company. 2 The inputs of certain valuation models (e.g. credit curve) became unobservable and consequently the fair values were transferred into level 3. 3 The inputs of certain valuation models became observable and consequently the fair values were transferred out of level 3. 1 104.9 Standard Bank Plc Consolidated Annual Report 2012 19Financial instruments measured at fair value continued 19.2 Reconciliation of level 3 financial liabilities Group1 Derivative liabilities $m Trading liabilities $m Total $m 119.3 753.0 872.3 4.9 17.8 22.7 8.3 (24.5) 37.7 9.5 47.2 0.6 59.7 60.3 2012 Balance at beginning of the year Total gains/(losses) included in trading revenue - Realised (32.8) - Unrealised Purchases and issues Sales and settlements (27.1) Transfers into level 3 149.1 4.8 153.9 Balance at end of the year 246.8 592.3 839.1 2 (243.0) (270.1) 2011 Balance at beginning of the year 2.1 457.1 459.2 Total gains/(losses) included in trading revenue 58.1 (41.0) 17.1 - Realised (2.2) - Unrealised 60.3 Purchases and issues 1.2 2.1 (43.1) (0.1) 17.2 381.5 382.7 Sales and settlements (16.7) (448.7) (465.4) Transfers into level 32 74.6 404.1 478.7 Balance at end of the year 119.3 753.0 872.3 1 There are no material differences between group and company. 2 The inputs of certain valuation models (e.g. correlation used in valuation) became unobservable and consequently the fair values were transferred into level 3. 65 Notes to the annual financial statements continued 19Financial instruments measured at fair value continued 19.3 Sensitivity of level 3 financial assets and liabilities The fair value of level 3 financial instruments is determined using valuation techniques which incorporate assumptions based on unobservable inputs and are subject to management’s judgement. Although the group believes that its estimates of fair values are appropriate, changing one or more of these assumptions to reasonably possible alternative values could impact the fair value of the financial instruments. Summarised below are the valuation techniques and main assumptions used in the determination of the fair value of the level 3 financial instruments. The table indicates the effect that a change of 1 percentage point in one or more of the inputs would have on profit or loss at the reporting date (where the change in the input would change the fair value of the financial instrument significantly). The changes in the inputs that have been used in the analysis below have been determined taking into account several considerations such as the nature of the instrument and the market within which the instrument is transacted. Valuation basis/technique Main assumptions Derivative instruments Discounted cash flow model Discount rates and volatility Trading assets Discounted cash flow model Discount rates Financial investments Discounted cash flow model, earnings multiple, Discount rates and earnings multiple sustainable earnings, and combination thereof Loans and advances to customers Discounted cash flow model Discount rates Trading liabilities Discounted cash flow model Discount rates 2012 2011 Effect recorded in profit or loss Favourable Group 1 $m (Adverse) $m Effect recorded in profit or loss Favourable $m (Adverse) $m Derivative assets 18.0 (18.0) 15.3 (15.3) Trading assets 19.8 (19.8) 15.7 (15.1) Financial investments 0.3 (0.3) 0.7 (0.6) Loans and advances to customers 0.2 (0.1) 1.0 (1.1) Derivative liabilities 14.6 (14.6) 7.7 (7.7) Trading liabilities 16.5 (16.5) 32.6 (32.6) 1 There is not a material difference between group and company. Level 3 instruments contain sensitivities to both observable and non-observable parameters. The table above measures the sensitivity to non-observable parameters only. These positions are risk managed using various instruments of which the associated gains or losses are not reflected in the table above. 66 Standard Bank Plc Consolidated Annual Report 2012 20 Reclassification of financial assets Amount reclassified from held for trading to loans and receivables at amortised cost Following the amendments to IAS 39 and IFRS 7 ‘Reclassification of Financial Assets’, the group reclassified assets from held-for-trading to loans and receivables for which there was a clear change of intent to hold the assets for the foreseeable future rather than to exit or trade in the short-term. The group did not reclassify any such assets during the current year. 2012 2011 $m $m Carrying value of reclassified financial assets at end of the year 47.7 132.1 Fair value of reclassified financial assets at end of the year 38.4 118.0 Net interest income 5.2 11.5 Credit impairment release/(charge) 5.0 (30.2) 10.2 (18.7) If the reclassification had not been made, the profit and loss would have included an unrealised fair value loss of US$2.2 million (2011: loss of US$13.8 million). The table below sets out the amounts actually recognised in profit or loss: Period after reclassification Net income/(loss) 21Financial assets and financial liabilities designated at fair value through profit or loss 21.1Loans and advances The group’s maximum exposure to credit risk for loans and advances designated at fair value through profit or loss is US$48.0 million (2011: US$163.3 million). Fair value changes attributable to changes in credit risk on loans and advances designated at fair value through profit or loss amounted to a loss of US$17.3 million (2011: US$21.9 million loss). The change in fair value of the designated loans and advances attributable to changes in their credit risk is determined as the amount of change in fair value that is not attributable to changes in market conditions. 21.2Deposit and current accounts The change in fair value of the deposit and current accounts designated at fair value through profit or loss is attributable to changes in interest rate risk. The amount the group would contractually be required to pay at maturity of the deposits designated at fair value through profit or loss amounts to US$51.1 million (2011: US$185.0 million). 2012 2011 $m $m 1 083.4 1 083.4 22 Ordinary share capital Issued and fully paid 1 083 408 349 ordinary shares of US$1 each (2011: 1 083 408 349) 50 000 ordinary shares of £1 each (2011: 50 000) 0.1 0.1 1 083.5 1 083.5 67 Notes to the annual financial statements continued 22 Ordinary share capital continued 2012 Number 2011 Number 1 083 458 351 50 000 1 083 408 351 1 083 458 351 50 000 1 083 408 351 1 083 458 350 50 000 1 083 408 350 1 1 083 458 351 50 000 1 083 408 351 Reconciliation of ordinary shares issued Shares in issue at beginning of the year - Shares with par value of £1 each - Shares with par value of US$1 each Shares with par value of US$1 each issued during the year Shares in issue at end of the year - Shares with par value of £1 each - Shares with par value of US$1 each The rights of the ordinary shares and the ‘A’ ordinary shares are identical with regard to voting rights and amounts receivable upon winding up. The ‘A’ ordinary shares carry a preferential right to dividends, the extent of which may be determined by the directors at their complete discretion. During 2011, the company issued 1 ‘A’ ordinary share of US$1 at a premium of US$150 million. In line with the change in the Companies Act 2006, the company’s articles have been amended to cancel the existing authorised share capital. The directors are generally and unconditionally authorised at any time during a period of five years to allot or to grant any rights to subscribe for or to convert any security into shares up to an aggregate nominal amount of £300 million and US$1 000 million. 2012 $m 2011 $m Guarantees 149.2 110.4 Letters of credit 479.6 604.5 628.8 714.9 23 Contingent liabilities and commitments Group and company 23.1Contingent liabilities Loan commitments that are irrevocable over the life of the facility or revocable only in response to material adverse changes are included in the risk management section on page 84. 2012 $m 2011 $m 13.4 47.5 71.1 13.9 41.8 78.4 132.0 134.1 23.2 Operating lease commitments The future minimum payments under non-cancellable operating leases are as follows: Properties Within 1 year After 1 year but within 5 years After 5 years 23.3 Legal proceedings From time to time the group is involved in litigation or receives claims arising from the conduct of its business which can require the group to engage in legal proceedings in order to enforce contractual rights. Standard Bank Plc (SB Plc) is in receipt of a claim from a former borrower under certain long term non-performing loan facilities for alleged overpayments of fees, interest and default interest. The facilities were repaid in September 2012. The amount of the claim has not been quantified by the Claimant, but would appear to be in the region of US$5 million to US$50 million. The group believes SB Plc has robust defences to the claim asserted against it and intends to defend itself vigorously. 68 Whilst recognising the inherent difficulty of predicting the outcome of legal proceedings, the directors believe, based upon current knowledge and after consulting with legal counsel, that the legal proceedings currently pending against it should not have a material adverse effect on the consolidated financial position. Standard Bank Plc Consolidated Annual Report 2012 Group 2012 2011 $m $m 193.0 355.6 - 0.1 193.0 355.7 3.8 5.6 24 Supplementary income statement information 24.1Interest income1 Interest on loans and advances and short-term funds Unwinding of discount element of credit impairments for loans and advances (note 8.2) Included above are the following amounts received from related parties: Group undertakings - fellow subsidiaries All interest income reported above relates to financial assets not carried at fair value through profit or loss. In 2011, US$0.7 million related to financial assets carried at fair value through profit or loss. 1 2011 figures reclassified in line with current year presentation. Refer to note 31. 24.2Interest expense Subordinated debt 54.0 52.7 Other interest-bearing liabilities 79.8 154.9 133.8 207.6 95.1 168.1 Net fees, commission and revenue sharing arrangements1,2 178.7 218.0 Trading revenue 253.3 293.1 - Commodities 165.4 158.5 54.8 107.4 9.2 0.7 - Foreign exchange 23.9 26.5 Other revenue 78.8 - - Gain on disposal of shares in London Metal Exchange 43.7 - - Gains on disposal of other unlisted equity holdings 35.1 - 510.8 511.1 73.3 87.2 2.2 4.0 75.5 91.2 Included above are the following amounts paid to related parties: Group undertakings - fellow subsidiaries All interest expense reported above relates to financial liabilities not carried at fair value through profit or loss. In 2011, US$0.8 million related to financial liabilities carried at fair value through profit or loss. 24.3Non-interest revenue - Debt securities - Equities Interest and dividend income included in trading revenue Net interest income Dividend income Included in net fee and commissions are the following amounts with related parties: Group undertakings - fellow subsidiaries 146.1 1 Includes receipts of US$267.5 million (2011: US$205.2 million) and payments of US$122.5 million (US$116.5 million) to and from SBG companies. 2 2011 figures reclassified in line with current year presentation. Refer to note 31. 88.2 69 Notes to the annual financial statements continued 24 Supplementary income statement information continued 2012 2011 $m $m 24.4Credit impairment charge Net credit impairments raised and released (142.6) (145.1) - Specific impairments (note 8.2) (174.7) (142.0) - Portfolio impairments (note 8.2) 32.1 Adjust for: Credit impairments raised in discontinued operations (note 26) 0.3 Credit impairments raised in continuing operations (142.3) Recoveries on loans and advances previously written off 0.1 Net credit impairment charge in continuing operations (3.1) 6.7 (138.4) 3.4 (142.2) (135.0) Salaries and allowances 266.4 249.5 Other direct staff costs 25.6 20.2 Long-term incentive scheme 49.7 42.9 Retirement benefit costs 12.3 14.6 354.0 327.2 24.5Staff costs1 1 2011 figures reclassified in line with current year presentation. Refer to note 31. The following table indicates the average number of persons employed: Group Key management Other 70 Company 2012 2011 2012 2011 Number Number Number Number 15 12 15 12 1 174 1 140 1 149 1 119 1 189 1 152 1 164 1 131 Standard Bank Plc Consolidated Annual Report 2012 24 Supplementary income statement information continued 2012 2011 $m $m 26.3 28.1 24.6Other operating expenses Amortisation of intangible assets Impairment of intangible assets (refer note 12) Auditors’ remuneration1 Audit-related assurance services Non-audit services - primary auditor 2 Non-audit services - other group auditor - 7.7 10.8 3.6 1.7 1.5 9.0 1.6 0.1 0.5 10.5 13.8 Computer equipment 4.4 6.8 Motor vehicles 0.1 - Office equipment 0.5 0.9 Depreciation (note 13.2) Furniture and fittings 5.5 6.1 Operating lease charges - Properties3 12.0 11.3 Information technology and communication3 39.2 24.7 Premises 11.8 12.5 3 Other expenses 3 104.6 64.9 215.2 166.6 1 Under South African regulations SBG is required to have two group auditors. For the purposes of the Standard Bank Plc consolidated accounts, KPMG Audit Plc is the primary auditor. 2 Non-audit services comprises mainly of regulatory compliance services. 3 2011 figures reclassified in line with current year presentation. Refer to note 31. 2012 2011 $m $m 18.5 10.1 24.7Indirect taxation Value added tax Duties and other indirect taxes 0.5 0.2 19.0 10.3 24.8Restructuring costs The group’s business model developed significantly in the year and included a reduction in geographic reach, migrating risk to optimise resources and implementing an increasingly integrated operating model with South Africa to ensure it is appropriate in the current economic environment. These activities included a redundancy program that resulted in cost reductions across all operations with staff costs being the largest component. The redundancy costs include all salary costs, benefits and severance packages of employees placed at risk. Other cost-saving measures included the suspension of IT projects, which resulted in the impairment of intangible assets, and reductions to floor space usage. The surplus floor space vacated in the prior year was sub leased later than previously estimated and at less favourable terms resulting in additional onerous lease charges in the year. Impairment of intangible assets Onerous lease provision Redundancy costs 2012 2011 $m $m 25.1 2.7 6.6 8.6 42.2 17.3 73.9 28.6 71 Notes to the annual financial statements continued 24 Supplementary income statement information continued 24.9 Long-term incentive schemes 24.9.1 Quanto stock unit plan Since 2007 Standard Bank plc has operated a deferred incentive arrangement in the form of the Quanto stock unit plan. Qualifying employees, with an incentive award above a set threshold are awarded Quanto stock units denominated in US$ for nil consideration, the value of which moves in parallel to the change in price of the SBG shares listed on the Johannesburg Stock Exchange. The cost of the award is accrued over the vesting period (generally three years), normally commencing the year in which these are awarded and communicated to employees. Awards prior to 2011 can be exercised within 10 years, 2011 awards can be exercised within the longest vesting period and current and future awards will be exercised on vesting. Units granted since 1 January 2012 do not allow for incremental payments to employees in service for 4 years. A description of the underlying accounting principles is disclosed in accounting policy 14 ‘Long-term incentive schemes’. The provision in respect of liabilities under the scheme amounts to US$116.8 million as at 31 December 2012 (2011: US$106.0 million), and the charge for the year is US$53.1 million (2011: US$51.2 million). The change in liability due to the change in the SBG share price is hedged through the use of equity options designated as a cash flow hedge. 2012 2011 Units Units Units outstanding at beginning of the year 984 231 898 771 Granted1 439 440 441 355 24 496 21 473 Transferred in Exercised Leavers/lapses Units outstanding at end of the year (399 800) (149 717) (9 601) (227 651) 1 038 766 984 231 198 182 169 188 2012 2011 Units Units 2015 292 088 334 928 2016 380 790 - 2018 30 381 136 074 2019 132 281 260 854 2020 203 226 252 375 1 038 766 984 231 Of which relates to key management The following Quanto stock units granted to employees had not been exercised at 31 December: Expiry year 2 1 The nominal value at time of issue was US$53.9 million (2011: US$58.6 million) of which US$30.6 million was recognised as an expense in the current year (2011: US$26.2 million). 2 The units vest at various intervals between the reporting date and the expiry period. At 31 December 2012, the unrecognised compensation cost related to the unvested Quanto awards amounted to US$62.0 million (2011: US$82.4 million). This represents the accumulated amount deferred on awards issued in 2012 and previous years. The vesting of these awards is expected to occur as follows: 72 2012 2011 US$m US$m Year ending 31 December 2012 - 50.8 Year ending 31 December 2013 40.5 22.4 Year ending 31 December 2014 16.5 8.2 Year ending 31 December 2015 4.5 1.0 Year ending 31 December 2016 0.5 - 62.0 82.4 Quanto stock units of US$40.7 million have been approved for issue in March 2013. These awards will have four vesting periods: 6 months, 12 months, 24 months and 36 months. Standard Bank Plc Consolidated Annual Report 2012 24 Supplementary income statement information continued 24.9 Long-term incentive schemes continued 24.9.2 SBG equity scheme Certain employees are granted share options under the SBG equity-settled share-based scheme. The outstanding award value under the SBG share scheme amounts to US$10.0 million (2011: US$9.0 million), and the amount charged for the year is US$1.3 million (2011: US$2.0 million). 2012 Options outstanding at beginning of the year Granted Exercised Leavers/lapses Options outstanding at end of the year Of which relates to key management 2011 Units Units 2 779 588 3 621 888 - 520 300 (367 175) (590 441) (92 750) (772 159) 2 319 663 2 779 588 684 400 441 900 Share options were exercised regularly throughout the year, other than during closed periods. The average share price for the year was ZAR110.03. The following options granted to employees had not been exercised at 31 December 2012: Options expiry period Option price range per share (ZAR) 2012 2011 Units Units Year to December 2014 17.15 - 50.91 - 35 000 Year to December 2015 60.35 - 65.50 45 000 73 943 Year to December 2016 79.50 - 81.00 313 263 380 201 Year to December 2017 92.05 - 107.91 309 250 379 803 Year to December 2018 89.00 - 92.00 454 350 560 641 Year to December 2019 62.39 - 65.00 525 300 602 500 Year to December 2020 111.94 247 500 272 500 Year to December 2021 98.80 425 000 475 000 2 319 663 2 779 588 24.9.3 SIH shadow share scheme Standard International Holdings S.A. (SIH) had a long-term incentive scheme set up in 1998, whereby certain employees were granted notional ‘shadow’ share options. The scheme provided for eligible employees to be rewarded in cash, the value of which is derived from current and future performance of SIH. In November 2012 the Remuneration Committee agreed to close the scheme with all remaining options exercised at a price of US$2.31. The provision in respect of liabilities under the scheme at 31 December 2011 was US$4.5 million, of which US$2.6 million was released to the income statement during the year (2011: nil). Options outstanding at beginning of the year Exercised Transferred in Leavers/lapses 2012 2011 Units Units 7 461 174 11 406 474 (6 059 056) (1 703 030) (1 402 118) 1 051 631 (3 293 901) Options outstanding at end of the year - 7 461 174 Of which relates to key management - 30 000 Share options were exercised at US$2.24, US$2.28 and US$2.31 (2011: US$2.38 and US$2.36). 73 Notes to the annual financial statements continued 24 Supplementary income statement information continued 2012 2011 $m $m Emoluments 2.5 2.6 Proceeds from exercise of share-based incentives 2.7 4.5 Pension contribution 0.1 0.1 - 6.9 Emoluments 1.0 0.6 Proceeds from exercise of share-based incentives 2.3 3.4 24.10 Directors’ emoluments Executive directors1 Emoluments of directors in respect of services rendered Redundancy costs Highest paid director Redundancy costs - 6.9 2 3 2012 2011 Number of directors for whom pension contribution are paid 1 Compensation relates to services rendered to the Standard Bank Plc group. Long-term benefits under the Quanto stock unit plan Units Units Number of units brought forward 49 310 106 112 Issued during the year 28 215 26 120 - 24 144 New director’s existing units Exercised (28 255) (107 066) As at 31 December 49 270 2012 2011 Long-term benefits under the SBG equity settled share based scheme Number Number Number of options brought forward 49 310 310 650 870 000 Issued during the year - 162 500 Exercised - (557 041) New director’s existing units - 178 150 Lapsed - (342 959) As at 31 December Long-term benefits under the SIH shadow share scheme 310 650 310 650 2012 2011 Units Units (‘000) (‘000) Number of options brought forward - Exercised - 1 282 (568) Lapsed - (714) As at 31 December - - 24.11 Company profits As permitted by section 408 of the Companies Act 2006, the company’s statement of comprehensive income has not been presented. The company loss of US$345.4 million (2011: US$75.1 million loss) has been included in the group income statement. 24.12 Dividends No dividends were declared in 2012 (2011: nil). 74 Standard Bank Plc Consolidated Annual Report 2012 2012 2011 $m $m 25 Direct taxation Current year tax (charge)/credit (32.4) 28.1 - UK corporation tax - UK deferred tax Origination and reversal of temporary differences Impact of change in tax rate - Overseas tax - Overseas deferred tax (26.5) (22.7) (3.8) (5.0) (0.9) 1.7 34.5 36.7 (2.2) (8.1) - Prior years - UK corporation tax - Overseas tax Total tax (charge)/credit 0.1 25.9 1.8 (1.7) 27.2 (1.3) (32.3) 54.0 (2.3) (30.0) (32.3) 27.5 26.5 54.0 Comprising: Continuing operations Discontinued operations (note 26) UK tax rate reconciliation The change in the UK corporation tax rate from 26% to 24% with effect from 1 April 2012 gave rise to a blended tax rate for 2012 of 24.5% (2011: 26.5%). A reduction in the corporation tax rate to 23%, with effect from 1 April 2013, has substantially been enacted and a further reduction in the tax rate to 22%, with effect from 1 April 2014, has been announced. The group applied 23% to all temporary differences expected to reverse after 1 April 2013. The reduction in tax rate to 22% is not expected to have a significant impact on the group’s tax charge. The differences between the blended rate and effective rate are explained below. 2012 2011 $m $m Loss before direct taxation Continuing operations Discontinued operations (note 26) (286.1) (2.5) (14.0) (72.6) (300.1) (75.1) Tax credit at the standard rate of 24.5% (2011: 26.5%) Effects of: Adjustment to tax in respect of prior years Deferred tax temporary differences previously not recognised Different tax rates in other countries Non-deductible expenses Re-measurement of deferred tax (change in tax rate) Recognition of tax losses for which no deferred tax asset previously recognised1 Deferred tax asset written off Tax losses for which no deferred tax asset was recognised 73.5 19.9 0.1 2.3 (0.1) (6.3) (3.8) (26.6) (71.4) 25.9 8.2 0.6 (9.8) (2.2) 11.4 - Tax credit included in the income statement (32.3) 54.0 Effective tax rate (10.8)% 71.9% The effective tax rate of (10.8)% (2011: 71.9%) is largely due to unrecognised deferred tax assets of US$96.4 million. 1 Jurisdictions outside the UK. 75 Notes to the annual financial statements continued 26 Discontinued operations During 2010 a strategic review led to the exit of non-core businesses, Principal Investment Management (PIM) and Private Client Services (PCS). No further investment in the businesses will be made and the group remains focused on collections, selling down positions and collateral sales. The affected business units are classified as discontinued operations and are shown as a single amount on the face of the income statement. The operating result of the discontinued operations, which have been included in the consolidated income statement, is as follows: 2012 2011 $m $m Net interest expense (2.0) (2.8) Non-interest revenue (7.9) (51.8) Credit impairment charges (0.3) (6.7) (10.2) (61.3) (3.8) (11.3) Loss before direct taxation (14.0) (72.6) Income tax (charge)/credit (30.0) 26.5 Loss for the period from discontinued operations (44.0) (46.1) Loss after impairment charges Operating expenses During the year, the PIM and PCS business units contributed US$59.9 million (2011: US$52.6 million) to the group’s net operating cash flows. The business units did not contribute to the group’s investment and financing activities. The effect of discontinued operations on segment results is disclosed in note 1. 76 Standard Bank Plc Consolidated Annual Report 2012 Group Company 2012 2011 2012 2011 $m $m $m $m 27Notes to the cash flow statement 27.1Decrease in income earning assets Trading assets (307.1) 788.1 (245.7) 722.9 Pledged assets (376.9) 608.3 (376.9) 608.3 Financial investments Loans and advances Other assets 34.1 53.2 31.7 53.5 6 239.4 1 036.6 6 230.6 1 023.4 (5.6) 147.7 (13.3) 164.4 5 583.9 2 633.9 5 626.4 2 572.5 (4 065.8) (2 640.7) (4 084.7) (2 592.8) 27.2Decrease in deposits and other liabilities Deposits and current accounts Net derivative instruments 118.2 (768.4) 128.8 (790.0) Trading liabilities 141.0 (1 024.2) 141.0 (1 024.2) Other liabilities 10.5 (3 796.1) 4.2 (4 429.1) 7.8 (3 807.1) 15.3 (4 391.7) 27.3Tax received/(paid) Amounts due/(unpaid) at beginning of the year Income tax (charge)/credit Amounts unpaid/(due) at end of the year 8.2 (15.1) (4.9) 19.5 14.3 0.9 (14.0) 27.8 5.9 (8.2) 0.1 (14.3) 9.2 (3.8) 15.3 (0.5) 27.4Cash and cash equivalent Balances with central banks Other cash equivalents (included in loans and advances) 1 Cash and cash equivalents at end of the year 1 2 228.2 - 2 228.2 - 846.0 1 254.2 809.3 1 198.8 3 074.2 1 254.2 3 037.5 1 198.8 Other cash equivalents include overnight placements that are readily convertible to known amounts of cash and which are subject to an insignificant risk of changes in value. 77 Notes to the annual financial statements continued 28 Related party transactions 2012 Directors Directors and key and key management management 28.1Subsidiaries The subsidiary company listed in note 11 comprises a limited part of the group’s activities and transactions with the entity are not significant. The principal nature of the transactions are payments for business introduced and trading facilitation activities. Intercompany transactions, balances and unrealised surpluses and deficits are eliminated on consolidation. 28.2Fellow subsidiaries The group enters into transactions with other entities forming part of the ultimate parent company, Standard Bank Group Limited. The transactions are entered into in the course of banking operations and are conducted in the ordinary course of business at arm’s length. These transactions include lending, acceptance of interbank deposits and correspondent banking transactions. The transactions are priced at the prevailing market rates at the time of the transactions. A significant portion of this activity reflect amounts received under transfer pricing arrangements as well as the placement of excess liquidity by other entities with the company. The extent of these activities is presented in notes 15 and 24.3. As part of its normal activities the group also advances funds to other group entities, the extent of which is disclosed in note 8. Loss on disposal of loan portfolio The Investment Banking loan portfolio has been transferred to SBSA as part of the change in business model in which Standard Bank of South Africa (SBSA) is used as a central balance sheet. A total net carrying amount of US$913.1 million (2011: US$2 200.7 million) was transferred at fair value, resulting in a US$51.8 million loss on transfer (2011: US$6.0 million profit). The loss arises as the loans were carried at recoverable value (amortised cost less impairments) and not at fair value. Collateralised guarantee transactions In recent years a number of collateralised guarantee transactions have been entered into with SBSA, of which US$34.2 million (2011: US$27.8 million) remains outstanding as at the reporting date. Under the transaction, SBSA provides financial guarantees to the company and places a deposit for the value of the loan exposure which is assigned as collateral for the obligations under the guarantee contract. Under IFRS, the loan exposure is not derecognised, with the deposit recognised on the statement of financial position and guarantee fees being accrued over the life of the deal. 28.3Key management compensation Key management comprises directors and the members of the governance committee of the principal operating entities. 78 2011 $m $m Salaries and other short-term benefits 9.7 8.5 Gains on exercise of long-term incentives and other payments 5.0 6.6 Redundancy cost - 7.7 14.7 22.8 28.4Transactions with key management There were no transactions with key management in 2012 (2011: nil). 29Pensions and other post-retirement benefits The company makes defined contributions to employees’ pension providers. The assets of these providers are held separately from the company. Included in staff costs are contributions paid by group companies which amounted to US$12.3 million (2011: US$11.3 million). There were no outstanding contributions at the end of the reporting period (2011: nil). Standard Bank Plc Consolidated Annual Report 2012 30 Financial risk management 30.1 Overview and executive summary macroeconomic environment. In order to increase risk control and governance the group has established the following new forums during the year: The effective management of risk within the stated risk appetite is fundamental to the banking activities of SB Plc and its subsidiary (the group). The group seeks to achieve a measured balance between risk and reward in the businesses as described below. In this regard, the group continues to build and enhance the risk management capabilities that assist in delivering growth plans in a controlled environment. Risk n Risk management is at the core of the operating and management structures of the group. Managing and controlling risks, and in particular avoiding undue concentrations of exposure, limiting potential losses from stress events, restricting significant positions in less quantifiable risk areas and constraining profit or loss volatility are essential elements of risk management and the control framework which serve to protect the group’s reputation and business franchise. Operational n Overall responsibility for risk management within the group rests with the SB Plc Board of Directors (the Board). Accountability for risk management resides at all levels within the group, from the executive down through the organisation to each business manager and risk specialist the three lines of defence model is embedded in the group’s operating model. In the first line of defence, business unit management is primarily responsible for risk management. The assessment, evaluation and measurement of risk is an ongoing process which is integrated into day-to-day business activities. This includes the continued development of the group’s operational risk management framework, identification of material issues and the implementation of remedial action where required. Business unit management is also accountable for appropriate reporting to the various governance bodies within the group. The second line of defence is represented by the group’s risk management function which is independent of line management within the business areas. The risk function is primarily accountable for establishing and maintaining the group’s risk management framework, standards and supporting policies, as well as for providing risk oversight and independent reporting of risk to executive management, board level committees and to the Board. The third line of defence consists of internal audit which provides an independent assessment of the adequacy and effectiveness of the group’s overall system of internal control and risk governance structures. The audit function reports independently to both the Standard Bank Group (SBG) and SB Plc Board Audit Committees. The year under review The year has again proven to be a volatile year for financial markets, with the ongoing Eurozone sovereign debt crisis being a significant driver behind this. Additionally the impact of new and increased regulation on the banking system has presented challenges for institutions alongside the threats to the global Management Committee (RMC) – The RMC’s primary responsibility is to monitor and control market risk, operational risk, counterparty credit risk and oversee adherence of SB Plc to agreed risk appetite. The committee has a direct reporting line into the SB Plc governance committee and CIB portfolio risk management committee (PRMC), ensuring SB Plc risk issues are additionally highlighted at CIB group level. Risk Committee (OpCo) - OpCo’s primary responsibility is to monitor and control operational risk for SB Plc and oversee adherence to agreed risk appetite. It is responsible for ensuring that a robust operational risk framework is embedded across the organisation and promoting strong risk culture within the three lines of defence model. 30.2 Risk management framework Governance structure Overall responsibility for risk management within the group rests with the Board. Day-to-day responsibility is delegated to the governance committee and its sub-committees which review, inter alia, summaries of market, liquidity, credit, operational, country and regulatory risks. The Board also delegates certain functions and responsibilities to the Board Audit Committee (BAC) and the Board Risk Management Committee (BRMC). Risk governance standards, policies and procedures The group has developed a set of risk governance standards for each major risk type to which it is exposed as well as a standard for capital management. The standards set out minimum control requirements and are designed to ensure alignment and consistency in the manner in which the major risk types and capital management metrics across the group are dealt with, from identification to reporting. All standards are applied consistently across the Standard Bank Group and are approved by the BRMC. It is the responsibility of executive management in each business line to ensure the implementation of risk and capital management standards. Supporting policies and procedures are implemented by the management team and independently monitored by the embedded risk resources. Compliance with risk standards is controlled through annual self-assessments and independent reviews by the second line of defence risk functions. Risk appetite Risk appetite is an expression of the amount, type and tenure of risk the group is willing to take in pursuit of its financial and strategic objectives, reflecting the group’s capacity to sustain losses and continue to meet its obligations as they fall due in a range of different stress conditions. The Board has developed a framework to articulate risk appetite throughout the group and to external stakeholders. 79 Notes to the annual financial statements continued The Board establishes the parameters for risk appetite by: providing n strategic leadership and guidance; reviewing n and approving annual budgets and forecasts, under normal and stressed conditions, for the group and each division; regularly reviewing and monitoring the group’s performance in n relation to risk through quarterly Board reports; and conducting n forward looking analysis of risk tendency against risk appetite in both normal and stressed conditions. The Chief Risk Officer (CRO) recommends to both the BRMC and the Board the level of risk appetite for the group. The group’s risk appetite is defined by the following six metrics: earnings n volatility; liquidity; n regulatory n capital; unacceptable n economic n risk; capital; and debt rating that is consistent with a level of capitalisation n required to cover an unexpected loss to a predetermined level of confidence. These metrics are then converted into limits and triggers across the relevant risk types, at both group and business line level, through an analysis of the risks that impact them. Stress testing The group’s stress testing framework supports the regular execution of stress tests at the business unit and legal entity levels. The group’s overall stress testing programme is a key management tool within the organisation and facilitates a forward looking perspective on risk tendency and business performance. Stress testing involves identifying possible events or future changes in economic conditions that could have an impact on the group. Stress tests are used in proactively managing the group’s risk profile, capital planning and management, strategic business planning and setting of capital buffers. Stress testing is an integral component of the group’s internal capital adequacy assessment process (ICAAP), and is used to assess and manage the adequacy of regulatory and economic capital. Stress tests are regularly discussed with regulators. Stress testing supports a number of business processes across the group, including: strategic n planning and budgeting; capital planning and management, including setting capital n buffers for the group; communication n with internal and external stakeholders; and assessment, n as required, of the impact of changes in shortterm macroeconomic factors on the group’s performance. During 2012 the group performed stress tests on scenarios defined by the Financial Services Authority (FSA) in addition to internal group defined scenarios, which included Eurozone breakup and a global double dip. Portfolio-specific stress tests are conducted more frequently within business lines, often monthly, facilitating proactive management at a business line level. The group also conducts reverse stress testing to complement the overarching stress testing programme. Reverse stress testing identifies those scenarios that could threaten the ongoing stability of the group, and serves to inform what management action should be taken to mitigate this risk. These tests are a risk management tool as they assist in testing assumptions about business strategy, capital planning and contingency planning. Risk profile The group’s trading activities comprise both customer related and principal business. These activities result in the group holding positions in foreign exchange, commodities and marketable securities for its own account and to facilitate client business. The group’s non-trading portfolios of financial instruments include loans, deposits, and debt securities. 30.3 Risk categories The principal risks to which the group is exposed and which it manages are defined as follows: Credit risk Credit risk comprises counterparty risk, settlement risk and concentration risk. These risk types are defined as follows: Counterparty n risk is the risk of credit loss to the group as a result of failure by a counterparty to meet its financial and/or contractual obligations to the group. This risk type has three components: primary n The appropriateness and severity of the relevant stress scenarios are approved by the BRMC based on PRMC recommendations and are reviewed at least annually. Management reviews the results of the stress tests as measured by the risk appetite metrics, and evaluates the need for mitigating actions. Examples of mitigating actions include reviewing and changing risk limits, limiting exposures and putting hedges in place. 80 credit risk, which is the exposure at default (EAD) arising from lending and related banking product activities including underwriting the issue of these products in the primary market; pre-settlement n credit risk, which is the EAD arising from unsettled forward and derivative transactions. This risk arises from the default of the counterparty to the transaction and is measured as the cost of replacing the transaction at current market rates; and Standard Bank Plc Consolidated Annual Report 2012 issuer n risk, which is the EAD arising from traded credit and equity products including underwriting the issue of these products in the primary market. n Settlement n risk is the risk of loss to the group from settling a transaction where value is exchanged, but where the group may not receive all or part of the counter value. Credit n concentration risk is the risk of loss to the group as a result of excessive build-up of exposure to a single counterparty or group, an industry, market, product, financial instrument or type of security, a country or geography, or a maturity. This concentration typically exists where a number of counterparties are engaged in similar activities and have similar characteristics, which could result in their ability to meet contractual obligations being similarly affected by changes in economic or other conditions. Country risk Country risk, also referred to as cross-border transfer risk, is the risk that a client or counterparty, including the relevant sovereign (government entities), may not be able to fulfil its obligations to the group outside the host country due to political or economic conditions in the host country. Tax n risk Taxation risk is the possibility of suffering unexpected loss, financial or otherwise, as a result of the application of tax systems, whether in legislative systems, rulings or practices, applicable to the entire spectrum of taxes and other fiscal imposts to which the group is subject. Compliance n risk The risk of legal or regulatory sanctions, financial loss or loss to reputation that SB Plc may suffer as a result of failure to comply with all laws, regulations, codes of conduct and standards of good practice applicable to its business activities. Model n risk Model risk is described as the risk of loss resulting from the weaknesses in a model used in assessing, managing or pricing a risk. Weaknesses could include incorrect assumptions, incomplete information, inaccurate implementation, inappropriate use, or inappropriate methodologies leading to incorrect conclusions reached by the user. In addition the model use should be accompanied by understanding of the model limitations. Liquidity risk Liquidity risk arises when the group, despite being solvent, cannot maintain or generate sufficient cash resources to meet its payment obligations as they fall due, or can only do so at materially disadvantageous terms. This type of event may arise when counterparties who provide the group with funding withdraw or do not roll over that funding, due to perceived risks around the group’s financial position, concerns around general market conditions or a combination of both. Market risk Market risk is the risk of a change in the actual or effective market value, earnings or future cash flows of a portfolio of financial instruments caused by adverse movements in market variables such as equity, bond and commodity prices, currency exchange and interest rates, credit spreads, recovery rates, correlations and implied volatilities in all of the above. Market risk is categorised as trading book market risk, interest rate risk in the banking book, valuation risk in equity investments and foreign currency translation risk. Operational risk Operational risk is the risk of loss resulting from inadequate or failed internal processes, people and systems or from external events. Operational risk sub-sets includes: n Information risk The risk of accidental or intentional unauthorised use, modification, disclosure or destruction of information resources, which would compromise the confidentiality, integrity or availability of information. Legal risk Legal risk is defined as the exposure to the adverse consequences attendant upon non-compliance with legal or statutory responsibilities and/or inaccurately drafted contracts and their execution, as well as the absence of written agreements or inadequate agreements. This includes the exposure to new laws as well as changes in interpretations of existing law by appropriate authorities and exceeding authority as contained in the contract. This applies to the full scope of group activities and may also include others acting on behalf of the group. n Environmental risk Environmental risk is described as a measure of the potential threats to the environment that SB Plc’s activities may have. It combines the probability that events will cause or lead to the degradation of the environment and the magnitude of the degradation. Financial n crime risk Financial crime risk is defined as the risk of economic loss, reputational impact and regulatory sanction arising from any type of financial crime against the group. Financial crime includes fraud, money laundering, violent crime and misconduct by staff, customers, suppliers, business partners, stakeholders and third parties. Business risk Business risk relates to the potential revenue shortfall compared to the cost base due to strategic and/or reputational reasons. From an economic capital perspective, business risk capital requirements are calculated as the potential loss arising over a one year timeframe within a certain level of confidence as implied by the group’s chosen target rating. The group’s ability to generate revenue is impacted by the external macroeconomic environment, its chosen strategy and reputation in the markets in which it operates. 81 Notes to the annual financial statements continued Reputational risk Reputational risk results from damage to the group’s image which may impair its ability to retain and generate business. Such damage may result from a breakdown of trust, confidence or business relationships. Safeguarding the group’s reputation is of paramount importance to its continued success and is the responsibility of every member of staff. 30.4 Credit risk Credit risk arises mostly from lending, related banking product activities (including underwriting activity), traded products (such as derivative contracts) and securities borrowing and lending products. In lending transactions, credit risk arises through nonperformance by a customer or market counterparty for facilities granted. These facilities are typically loans and advances, including the advancement of securities and contracts to support customer obligations such as letters of credit and guarantees. In trading activities, credit losses arise due to non-performance by a counterparty for payments linked to trading-related financial obligations. As a general rule, the group will seek to mitigate the amount of open credit risk it is prepared to accept through either collateralisation and/or hedging. Trading book exposures are typically documented under International Swaps and Derivatives Association (ISDA) with/without credit support annex (CSA) arrangements (or their equivalent) and structured such that the group has liquid collateral which is marked to market daily against agreed trigger thresholds and ‘hard’ limits. Banking book exposures can be collateralised by a range of assets, but the liquidity, jurisdiction diversification of collateral and ease of valuation of these assets will govern the amount and type of collateral taken. The group also engages in contingent credit hedging which enables it to offset the economic risk to a client or counterparty by taking a position in a trading book instrument. credit governance committee responsibilities include oversight of governance; recommending risk appetite; overseeing model performance; development and validation; establishment of counterparty and portfolio risk limits; setting industry, market, product, customer segment and maturity concentration risk; agreeing and overseeing risk mitigation; as well as reviewing watchlist and non-performing accounts. Forums designed to review credit risk within the portfolio, or detect possible variance in the risk profile to the stated risk appetite include: Pre-credit n Committee (PCC) - global and regional forums, consisting of senior business and risk representatives to screen and review new transactions and proposals prior to a formal credit assessment. Approval by PCC is the first step in the risk sanctioning and approval process as it leads to the commitment of resources to pursue the opportunity both by business and risk; ensures that transactions are aligned to agreed business strategy; and determines upfront distribution, legal entity booking, ancillary business and related issues. CIB n Credit Governance Committee and CIB credit committee - credit decisions within the group are governed by the CIB credit delegated authority policy. CIB Credit Governance Committee is the highest credit approval body within CIB. The group is represented at this committee by senior credit, risk, business and executive membership. The committee also has responsibility for oversight of the credit process and related governance and policy matters. Below the authority of the CIB Credit Governance Committee is the CIB credit committee which is a transaction only committee. On a lower level than CIB Credit Committee, credit decisions are made on a ‘four eyes’ basis by individuals from within the credit and risk teams. Individual authorities are scaled to experience, seniority, sector and product specialisation, and are reviewed regularly. PRMC – meets monthly to review the key performance indicators n Framework and governance Strategy and process to manage risk Credit risk is the group’s most significant risk as measured by absolute amount and quantum of capital consumed. It is managed in accordance with the group’s risk management control framework. The group’s credit standard sets out the principles under which it is prepared to assume credit risk. The group’s head of credit has functional responsibility for credit risk across the group and reports to the CRO. The regional heads of credit report to the head of credit. Structure and organisation of credit risk management function A formal structure exists for the approval of credit limits which are agreed through delegated authority derived from the CIB credit governance committee to regional credit committees encompassing a legal entity focus and, finally, individual delegated authority. The committees have defined mandates, memberships and delegated authorities that are reviewed at least annually. CIB 82 in the portfolio (e.g. probability of default (PD), EAD, loss given default (LGD), unexpected loss (UL), regulatory and economic capital (Ecap) utilisation and concentration limits) and to stress the portfolio with a view to initiating management action where it is necessary to curtail the portfolio risk tendency within the stated risk appetite. Credit n risk review function - reviews the quality of the credit decisions taken within delegated authority based on the information available to make those decisions. Watchlist committee - where customers show signs of financial n stress the facility will be referred to the group’s watchlist committee where senior members of the credit risk, business and business support and recovery (BS&R) team will review the current position and agree a remedial strategy which seeks to allow the customer to rectify the problem and return to normal monitoring. This control framework also considers the legal entity structure n when assigning limits. Standard Bank Plc Consolidated Annual Report 2012 Methodology to assign credit limits The group uses internal models and practices to measure and manage credit risk, deploying considerable resources to ensure that it is properly understood, managed and controlled. n The credit modelling framework includes the use of PD, LGD, EAD, UL, expected loss (EL), economic capital consumption and economic profit (EP). The group’s risk appetite is in part calibrated to these economic risk drivers. PD models are used to assess the probability of a counterparty not making full and timely repayment of credit obligations over a specific time horizon. The models use a combination of forward looking qualitative factors and quantitative inputs. Each customer is assigned an internal credit rating which in turn is mapped to a statistically calibrated PD as is illustrated in the table below. Different models are used for each discrete credit portfolio and counterparty, and each model has its own particular set of risk factors and inputs used for assessing the rating. All models are statistically tested and independently validated to ensure that they have an acceptable level of predictive power, provide an accurate forward looking rating assessment suitable for use in regulatory and economic capital assessment and are stable through an economic cycle. For economic capital management, the group uses forward-looking ratings but also explores point in time (PIT) versus through the cycle (TTC) impacts through stress testing and deploys a credit migration model to assess the impact of risk rating downgrades. Past due but not specifically impaired loans include those exposures where the counterparty has failed to make its contractual payment or has breached a material covenant, but impairment losses have not yet been incurred due to the expected recoverability of future cash flows, including collateral. Ultimate loss is not expected but could occur if the adverse condition persists. These exposures are analysed further between those that are less than 90 days past due and those that are 90 days or more past due. Specifically n impaired loans include those where there is objective evidence that an impairment loss has been incurred and for which there has been a measurable decrease in the estimated future cash flows as a result of its payment status or objective evidence of impairment. Other criteria that are used by the group to determine that there is such objective evidence of impairment include: known n cash flow difficulties experienced by the borrower; breach n of loan covenants or conditions; the n probability that the borrower will enter bankruptcy or other financial realisation; and a n significant downgrading in credit rating by an external credit rating agency, where, owing to the borrower’s financial difficulties, concessions are granted to the counterparty. Specifically impaired advances are further analysed into the following categories: sub-standard n items that show underlying well defined weaknesses and are considered to be specifically impaired; The group’s 25 point master rating scale is shown at the bottom of the page, calibrated against external credit assessment institutions’ alphanumerical rating scales and group grading categories. doubtful n items that are not yet considered final losses because of some pending factors that may strengthen the quality of the items; and Exposure to credit risk loss items that are considered to be uncollectible in whole or n For the tables that follow, the definitions below have been used for the different categories of exposures: past due nor impaired represents exposures that are current and fully compliant with all contractual terms and conditions. Normal and close monitoring exposures within this category are exposures rated 1 to 21 and 22 to 25 respectively using the group’s master rating scale. in part. The group provides fully for its anticipated loss, after taking securities into account. Neither n n Non-performing loans Non-performing loans are those loans for which the group has identified objective evidence of default, such as breach of a material loan covenant or condition or instalments are due and unpaid for 90 days or more. Group master rating scale Moody’s Investor Services Standard & Poor’s Fitch 1-4 Aaa to Aa3 AAA to AA- AAA to AA- 5-7 A1 to A3 A+ to A- A+ to A- 8 - 12 Baa1 to Baa3 BBB+ to BBB- BBB+ to BBB- 13 - 21 Ba1 to B3 BB+ to B- BB+ to B- 22 - 25 Caa1 to Ca CCC+ to CCC- Default C D Grading Investment grade Credit quality Normal monitoring CCC+ to CCC- Sub-investment grade Close monitoring D Default Default 83 Notes to the annual financial statements continued Maximum exposure to credit risk Performing Neither past due nor impaired Non performing Past due but not specifically impaired Specifically impaired $m Gross credit exposure $m - 4 812.9 - 6.3 3 085.1 40.7 241.1 3 310.0 247.4 11 208.0 Normal monitoring $m Close monitoring $m Derivative assets 4 812.9 - - Loans and advances to banks 3 078.8 - - Loans and advances to customers 2 997.9 30.3 - 10 889.6 30.3 - 40.7 < 90 days >= 90 days $m $m 2012 Gross loans and advances & derivative assets Cash collateral on impaired loans Non-performing loans - (34.2) 6.5 247.4 Balances with central banks 2 228.2 Trading assets 5 502.6 Financial investments Pledged assets Total balance sheet exposure to credit risk 4.0 18 942.8 Guarantees 149.2 Letters of credit 479.6 Irrevocable unutilised facilities 168.6 Leases 945.2 Total off-balance sheet exposure to credit risk Total exposure to credit risk 1 742.6 20 685.4 Reconciliation to the statement of financial position Add: Commodity assets 1 727.5 Add: Equity instruments 154.5 Add: Non-financial assets 500.5 Less: Impairments for loans and advances 84 (234.3) Less: Off-balance sheet exposures (1 742.6) Total assets 21 091.0 Standard Bank Plc Consolidated Annual Report 2012 Performing Non performing Neither past due nor impaired Past due but not specifically impaired Specifically impaired Normal monitoring $m Close monitoring $m < 90 days $m >= 90 days $m $m Gross credit exposure $m Derivative assets 6 987.2 5.4 0.9 - - 6 993.5 Loans and advances to banks 7 410.1 - - - 6.1 7 416.2 Loans and advances to customers 4 971.7 111.8 3.3 97.8 660.5 5 845.1 19 369.0 117.2 4.2 97.8 666.6 20 254.8 2011 Gross loans and advances & derivative assets Cash collateral on impaired loans Non-performing loans Balances with central banks Trading assets 97.8 (20.7) 645.9 5 610.1 Financial investments 9.8 Pledged assets 3.1 Total balance sheet exposure to credit risk 25 877.8 Guarantees 110.4 Letters of credit 604.5 Irrevocable unutilised facilities 455.0 Leases Total off-balance sheet exposure to credit risk Total exposure to credit risk 998.6 2 168.5 28 046.3 Reconciliation to the statement of financial position Add: Commodity assets 934.8 Add: Equity instruments 178.2 Add: Non-financial assets Less: Impairments for loans and advances 590.9 (237.5) Less: Off-balance sheet exposures (2 168.5) Total assets 27 344.2 85 Notes to the annual financial statements continued Age analysis of loans and advances past due but not specifically impaired Less than 31 days 31 - 60 days 61 - 90 days 91 - 180 days More than 180 days Past due but not specifically impaired $m $m $m $m $m $m Loans and advances to customers - - - - 40.7 40.7 Cash collateral - - - - (34.2) (34.2) - - - - Less than 31 days 31 - 60 days 61 - 90 days 91 - 180 days $m $m $m $m $m $m Loans and advances to customers - - 3.3 2.7 95.1 101.1 Cash collateral - - - - - - - - 3.3 2.7 95.1 101.1 2012 6.5 6.5 Past due but More than not specifically 180 days impaired 2011 Analysis of specifically impaired loans and advances Substandard Doubtful Specifically Exposure Securities impaired net of and before Cash cash expected Specific Impairment Loss collateral collateral collateral recoveries impairment coverage1 $m $m $m $m $m $m $m $m % Loans and advances to banks - 6.3 - 6.3 - 6.3 (5.8) (0.5) 7.9 Loans and advances to customers 5.5 193.2 42.4 241.1 - 241.1 (17.3) (223.8) 92.8 5.5 199.5 42.4 247.4 - 247.4 (23.1) (224.3) 90.7 Cash collateral Exposure net of cash collateral Securities and expected recoveries Specific impairment 2012 Substandard Doubtful Loss Specifically impaired before collateral $m $m $m $m $m $m $m $m Loans and advances to banks - 6.1 - 6.1 - 6.1 (6.0) (0.1) 1.6 Loans and advances to customers 329.3 322.4 8.8 660.5 (20.7) 639.8 (444.5) (195.3) 30.5 329.3 328.5 8.8 666.6 (20.7) 645.9 (450.5) (195.4) 30.3 Impairment coverage1 % 2011 1 86 Specific impairment as a percentage of exposure net of cash collateral. Standard Bank Plc Consolidated Annual Report 2012 Performing portfolio impairments Credit risk mitigation and hedging Portfolio credit impairments provide for latent losses in a group of loans which have not yet been identified as specifically impaired. The calculation of portfolio credit impairments is based on the EL of the group’s loan portfolio. The EL represents losses over a one year time horizon. EL is calculated by applying a TTC PD for the core portfolio and the higher of a TTC and PIT PD for the watchlist portfolio. A LGD, based on the foundation internal ratings based (FIRB) approach under Basel II, is then also applied to the exposure. An emergence period is used to calibrate the one year EL calculated to incurred losses. The emergence period is the time lapsed from the loan default trigger to the point identifying the loss. The emergence period is currently assessed as 7 months (2011: 6 months), based on analysis of historical loss data, and is updated annually. Collateral, guarantees, credit derivatives and netting are widely used by the group for credit risk mitigation. The amount and type of credit risk mitigation depends on the circumstances of each case. Credit risk mitigation policies and procedures ensure that credit risk mitigation techniques are acceptable, used consistently, valued appropriately and regularly, and meet the risk requirements of operational management for legal, practical and timely enforceability. Detailed processes and procedures are in place to guide each type of mitigation used. Renegotiated loans and advances Renegotiated loans and advances are loans which have been refinanced, rescheduled, rolled over or otherwise modified during the year because of weaknesses in the counterparty’s financial position and where it has been judged that normal repayment is expected to continue after the restructure. Loans and advances are assessed on an individual basis and monitored during the rehabilitation period before being transferred into the performing portfolio. Following rehabilitation, internally generated risk grades are assigned that reflect the revised risk of the exposure. Consequent impairment recognition is evaluated as part of the normal credit process. Renegotiated loans that would otherwise be past due or impaired, totalled US$ nil as at 31 December 2012 (2011: US$12.5 million) as all affected loans were transferred to SBSA prior to 31 December 2012. The primary aim of providing forbearance facilities to customers is to enable the complete recovery of the exposure through the full repayment of arrears. The group does not follow a general forbearance policy but each facility is treated on its own merits. Watchlist review is an early warning mechanism which identifies any deterioration in counterparty performance. These exposures are immediately subject to independent scrutiny and, where necessary, a programme of intensive monitoring and review until such time as the position can be transferred back to line management. In cases where the remedial strategy does not produce the expected corrective action the group may consider an alternative remedial strategy or referral to the BS&R team for active recovery management. An impairment charge is raised if the new terms are less favourable and result in the discounted cash flows to be lower than the carrying value of the exposures. At 31 December 2012, US$0.3 million (2011: US$162.5 million) of performing loans were under BS&R watchlist review. The collective provision on the watchlist portfolio, including forbearance facilities, is mainly dependent on the internal credit grade allocated to it. Additionally the management adjustments to the model also capture the enhanced risks attached to this portfolio. The amount and type of collateral required depends on the nature of the underlying risk, an assessment of the credit risk of the counterparty as well as requirements or intentions with respect to reductions in capital requirements. Guidelines are in place regarding the acceptability of types of collateral, their strength as credit risk mitigation and valuation parameters. The group generally holds collateral against loans and advances to customers in the form of registered securities over assets, guarantees and mortgage interests over property. Other types of collateral required are plant and machinery, inventory and trade receivables and other assets such as physical commodities held to order. Reverse repurchase agreements are underpinned by the assets being financed, which are mostly liquid, tradable financial instruments. Guarantees and related legal contracts are often required, particularly in support of credit extension to groups of companies and weaker counterparties. Guarantor counterparties include banks, parent companies, shareholders and associated counterparties. Creditworthiness is established for the guarantor as for other counterparty credit approvals. For derivative transactions, the group uses internationally recognised and enforceable ISDA agreements with a CSA, where necessary, with most of the group’s largest trading counterparts. Generally, exposures are marked-to-market daily; netting is applied to the full extent contractually agreed to between the parties, and cash and liquid collateral placed where contractually provided for. To manage actual or potential portfolio risk concentrations, areas of higher credit risk and credit portfolio growth, the group from time to time implements hedging and other strategies typically at the individual counterparty, sub-portfolio and portfolio levels. Syndication, distribution and sale of assets, asset and portfolio limit management and credit derivatives, credit insurance and credit protection are examples of the techniques used to manage this type of risk. Wrong way risk exposure Wrong way risk arises where there is a positive correlation between counterparty default and transaction exposure and a negative correlation between transaction exposure and the value of collateral at the point of counterparty default. Transactions where this may arise are, for example, reverse repurchase and 87 Notes to the annual financial statements continued collateralised forward sale transactions. This risk is addressed by taking into consideration the higher than normal correlation between the default event and exposure to a counterparty when calculating the potential exposure on these transactions. Collateral required in respect of a rating downgrade The group enters into derivative contracts with rated and unrated counterparties. To mitigate counterparty credit risk, the group stipulates credit protection terms such as limitations on the amount of unsecured credit exposure it will accept, collateralisation if mark-to-market credit exposure exceeds those amounts and collateralisation and termination of the contract if certain credit events occur, including but not limited to a downgrade of the counterparty’s public credit rating. Certain counterparties require that the group provides similar credit protection terms. From time to time, the group may agree to provide those terms on a restrictive basis. Rating downgrades as a collateralisation or termination event are generally conceded only to highly rated counterparties and, whenever possible, on a bilateral and reciprocal basis. Exceptionally, such rating downgrades may be conceded to unrated counterparties when their size, credit strength and business potential are deemed acceptable. In these cases, the concessions must be approved by the CIB Chief Financial Officer and the Chief Credit Officer. The impact on the group of the amount of collateral it would have to provide given a credit downgrade would be determined by the then negative mark-to-market on derivative contracts where such a collateralisation trigger has been conceded. Where the impact on the group’s liquidity of a collateral call linked to a downgrading is deemed to be material, the potential exposure is taken into account in the capital management committee (CapCom) model stress testing. Financial effect of collateral and other credit enhancements The table on page 89 indicates the estimated financial effect that collateral has on the group’s maximum exposure to credit risk. The collateral disclosed is in relation to the gross credit exposure reported under IFRS and does not represent the collateral qualifying for prudential reporting purposes. The table displays the on balance sheet and off balance sheet credit exposures for the group, further disseminated between netting arrangements, unsecured and secured exposures, and with an additional breakdown of collateral coverage for the secured portion. Netting arrangements represent amounts which are legally enforceable upon default (US$3 067.9 million; 2011: US$4 390.2 million). This is in addition to offsetting principles as described in accounting policy 5. 88 Unsecured exposures of US$11 233.0 million (2011: US$10 339.6 million), largely represents corporate and government bonds, cash collateral placed with recognised exchanges and shortterm placements with strong rated banks and non-banking financial institutions. A significant portion of the secured exposures relates to reverse repo type securitised lending, where the collateral is typically highly rated, liquid and tradeable. For loans and advances the collateral accepted normally includes property, other tangible assets across diverse jurisdictions, personal guarantees, floating charges over assets and credit enhancements such as credit default swaps. However guarantees received based on future revenue streams and assets whose value is highly correlated to the counterparty and floating rate charges over assets have been excluded from the table. Total exposures of US$2 297.9 million (2011: US$3 813.1 million) are covered by more than 100%, primarily relating to the reverse repurchase lending activity. Within the 1-50% coverage bucket, loans and advances to banks make up the bulk of the exposures (US$257.7 million; 2011: US$27.4 million) and these are predominantly with highly rated multinational banks and corporations. Standard Bank Plc Consolidated Annual Report 2012 Financial effect of collateral and other credit enhancements5 Total Netting1 exposure arrangements Exposure after netting Unsecured exposures Secured exposures Extent of collateral and risk mitigation 1 - 50%2 $m $m $m $m $m $m Balances with central banks 2 228.2 - 2 228.2 2 228.2 - - Derivative assets 4 812.9 3 067.9 1 745.0 997.9 747.1 Trading assets 5 502.6 - 5 502.6 3 625.5 1 877.1 4.0 - 4.0 4.0 - 51-100%3 $m > 100%4 $m 2012 Financial investments Pledged assets - - 256.0 366.4 124.7 - 1 877.1 - - - - - - - - - - - - Loans and advances to banks 3 085.1 - 3 085.1 1 340.3 1 744.8 257.7 805.2 681.9 Loans and advances to customers 3 310.0 - 3 310.0 1 510.9 1 799.1 29.6 362.8 1 406.7 Total balance sheet exposure to credit risk 18 942.8 3 067.9 15 874.9 9 706.8 6 168.1 543.3 3 411.5 2 213.3 Guarantees 149.2 - 149.2 141.0 8.2 - 4.3 3.9 Letters of credit 479.6 - 479.6 293.0 186.6 - 126.9 59.7 Irrevocable unutilised facilities 168.6 - 168.6 147.0 21.6 - 0.6 21.0 Leases 945.2 - 945.2 945.2 - - - - Total off-balance sheet exposure to credit risk Total exposure to credit risk 1 742.6 - 1 742.6 1 526.2 216.4 - 131.8 84.6 20 685.4 3 067.9 17 617.5 11 233.0 6 384.5 543.3 3 543.3 2 297.9 2011 Balances with central banks - - - - - - - - Derivative assets 6 993.5 4 390.2 2 603.3 1 512.8 1 090.5 443.8 482.0 164.7 Trading assets 5 610.1 - 5 610.1 3 472.2 2 137.9 - 2 137.9 - 9.8 - 9.8 9.8 - - - - Financial investments Pledged assets 3.1 - 3.1 3.1 - - - - Loans and advances to banks 7 416.2 - 7 416.2 2 109.7 5 306.5 27.4 3 823.7 1 455.4 Loans and advances to customers 5 845.1 - 5 845.1 1 549.3 4 295.8 230.3 1 978.8 2 086.7 Total balance sheet exposure to credit risk 25 877.8 4 390.2 21 487.6 8 656.9 12 830.7 701.5 8 422.4 3 706.8 Guarantees 110.4 - 110.4 106.8 3.6 0.4 2.4 0.8 Letters of credit 604.5 - 604.5 423.5 181.0 1.5 171.4 8.1 Irrevocable unutilised facilities 455.0 - 455.0 153.8 301.2 51.8 152.0 97.4 Leases 998.6 - 998.6 998.6 - - - - Total off-balance sheet exposure to credit risk Total exposure to credit risk 1 2 168.5 - 2 168.5 1 682.7 485.8 53.7 325.8 106.3 28 046.3 4 390.2 23 656.1 10 339.6 13 316.5 755.2 8 748.2 3 813.1 Represents netting arrangements that can be applied in the event of default. This is in addition to offsetting applied in the statement of financial position, as permitted by IAS 32. 2 Represents exposures secured between 1% to 50%. 3 Represents exposures secured between 51% to 100%. 4 Represents exposures secured in excess of 100%. 5 Collateral valuations, based on the nature and price volatility of the underlying collateral, are performed in terms of the credit policy. 89 Notes to the annual financial statements continued Collateral obtained by the group It is the group’s policy to dispose of repossessed assets in an orderly manner. The proceeds are used to reduce or repay the outstanding claim. Generally, the group does not use repossessed assets for business purposes. 30.5 Country risk Country risk is the risk of loss arising when political or economic conditions or events in a particular country reduce the ability of counterparties in that country to meet their financial obligations to the group. Country risk events may include sovereign defaults, banking or currency crises, social instability and changes in governmental policies such as expropriation, nationalisation and confiscation of assets. Country risk also encompasses cross-border risk, which is the risk that actions taken by a government may restrict the transfer and convertibility of funds (of local currency into nonlocal currency), thereby impacting the ability to obtain payment from counterparties on their financial obligations to the group. Examples of restrictions on the transfer of funds are exchange controls and debt moratoria. Cross-border obligations include cross-border claims on third parties as well as investments in and funding of local franchises. Cross-border claims on third parties include cross-border loans and deposits, credit equivalents of over-the-counter derivatives and securities financing, and the market value of the inventory of debt securities. The global country risk committee approves country risk appetite limits for all countries. A country-rating model and a sovereignrating model are used to determine country and sovereign ratings for every country. The internal models are continuously updated to reflect the economic and political changes in individual countries. The results are compared with those of reputable rating agencies to validate the consistency of the model. Country risk limits are set to force diversification and to avoid a build up of concentration risk. In this regard, the country limits are calibrated to a risk appetite which constrains the level of unexpected loss in the portfolio. 90 Country risk is further monitored through reviews of economic and political data by country risk resources based in Johannesburg, London and New York. Use is made of SBG’s network of operations, country visits and external sources of information. Countries designated as higher risk are subject to increased central monitoring. Country concentration risk is managed and monitored by geographic region and country. There was no significant sovereign risk included in loans and advances at the end of the year. The table on page 91 illustrates customer risk by geographical segment. Standard Bank Plc Consolidated Annual Report 2012 Geographic analysis of gross loans & advances (note 8)1 2012 United Kingdom 2011 $m % $m % 1 600.5 25.0 6 216.9 46.9 Eurozone France 158.4 250.8 Netherlands 107.2 18.0 Belgium 52.1 24.1 Germany 46.1 88.2 Portugal 33.3 40.2 Ireland 24.5 27.0 Other 29.8 101.8 451.4 7.1 550.1 4.1 Rest of Europe Russian Federation 687.6 615.9 Turkey 558.4 721.8 Other 112.0 1 358.0 424.0 21.2 1 761.7 13.4 Asia-Pacific China 360.6 542.1 Singapore 196.5 167.2 Hong Kong 147.6 247.3 Other 182.6 490.3 887.3 13.9 1 446.9 10.9 Sub-Saharan Africa South Africa 294.8 162.9 Nigeria 124.2 301.7 Ghana 71.0 174.1 Other 57.5 318.2 547.5 8.5 956.9 7.2 North America United States 320.5 609.3 Cayman Islands 154.0 169.8 Other 172.8 147.3 647.3 10.1 926.4 7.0 Latin America Argentina 338.5 383.0 Brazil 133.3 304.7 Other 62.5 534.3 59.2 8.4 746.9 5.6 Middle East & North Africa United Arab Emirates 266.8 227.2 Kuwait 40.1 147.6 Other 61.9 280.7 1 Based on the borrower’s country of risk 368.8 5.8 655.5 4.9 6 395.1 100.0 13 261.3 100.0 91 Notes to the annual financial statements continued Geographic analysis of trading assets1 2012 Sub-Saharan Africa North America Eurozone2 Latin America Rest of Europe Middle East & North Africa Asia-Pacific $m % $m % 1 679.5 668.9 446.8 344.7 215.0 55.3 15.0 3 425.2 49.0 19.5 13.0 10.1 6.3 1.6 0.5 100.0 1 149.8 675.1 304.8 494.9 184.1 44.4 242.9 3 096.0 37.1 21.8 9.9 16.0 5.9 1.5 7.8 100.0 184.6 115.8 146.4 446.8 41.3 25.9 32.8 100.0 187.4 52.6 64.8 304.8 61.5 17.2 21.3 100.0 Composition of Eurozone Netherlands Finland Other 1 Analysis of ‘Government, utility bonds and treasury bills’ & ‘Corporate bonds and floating rate notes’ disclosed in note 5. 2 Includes US$120 million (2011: US$56.5 million) Eurozone sovereign debt. 30.6 Liquidity risk Framework and governance SB Plc adopts a holistic approach to liquidity risk management which links strategy, policy, management and monitoring with appropriate escalation and feedback mechanisms. SB Plc’s approach seeks to ensure that liquidity risks are identified promptly through the early warning indicator (EWI) and liquidity risk tolerance frameworks. These risks are escalated and mitigating action is taken. SB Plc deems that its risk framework is appropriate for the current nature, scale and complexity of its activities and seeks to be proactive in anticipating the impact of changes in its risk profile upon the risk management framework. The core objectives of the liquidity risk framework are: To n ensure strong governance, business management, risk and control structures; To ensure that SB Plc has adequate liquidity resources for both n regulatory and internal purposes on a forward looking basis, both under normal and stressed financial conditions; To n ensure that heightened liquidity risk is identified promptly in order to enable effective mitigating action to be taken; To maintain an optimal liquidity structure in line with strategy; and n To n promote efficient use of liquidity through the internal allocation of costs, benefits and risks across the entity. SB Plc operates a liquidity governance framework which provides Board level oversight of the liquidity risks to which SB Plc is exposed. The framework ensures active management of liquidity risk through the capital management committee (CapCom) and its sub-committees. The Board and its committees set liquidity risk tolerance and review and approve key liquidity policies. CapCom establishes liquidity risk standards in accordance with prudential 92 2011 and regulatory requirements. Limits and guidelines are set, reviewed and monitored by CapCom and reflect SB Plc’s stated tolerance for liquidity risk. Liquidity and funding management SB Plc manages its liquidity risk exposure to ensure that at all times it is able to meet its liabilities as and when they fall due. SB Plc’s liquidity framework is detailed by four key liquidity risk policies. The liquidity risk tolerance statement (LRTS) is central to this framework as it documents SB Plc’s liquidity risk tolerance, how it is measured and monitored, and details the escalation procedures to be followed in the event of a breach of liquidity risk tolerance. This, together with the other liquidity policies and the early warning indicators (EWIs), establishes a liquidity risk management and governance framework across SB Plc. This framework is intended to be dynamic; triggers and limits are continuously assessed to determine whether they still reflect the Bank’s liquidity risk tolerance. The SB Plc incorporates various elements into its cohesive liquidity management process, including the following: establishing n liquidity risk tolerance, ensuring that there is consistency between this and the group’s strategy, resource availability and business requirements; maintaining n and monitoring against an appropriate limit structure in line with risk appetite; maintaining n a robust model for determining and monitoring liquidity usage and risk exposure; short-term n and long-term cash flow management; maintaining n foreign n a structurally sound balance sheet; currency liquidity management; preserving n a diversified funding base; Standard Bank Plc Consolidated Annual Report 2012 undertaking n regular liquidity stress testing; maintaining n adequate contingency funding plans; and maintaining n recovery and resolution plans. meeting, and is responsible for managing the implementation of the plan upon activation. The LSC is the first committee to convene in instances where any of the amber indicators on the risk tolerance metrics have been triggered or where the overall EWI status is amber. In carrying out all of its duties, the LSC is required to take into account SB Plc’s liquidity risk tolerance. The Board delegates liquidity management responsibility to CapCom. This includes reviewing and making strategic decisions on matters relating to the composition and liquidity of assets and liabilities, reviewing and setting liquidity limits, reviewing and approving funds transfer pricing methodology, reviewing and monitoring the liquidity position and EWIs, reviewing regulatory compliance and reviewing the completeness and effectiveness of stress testing and key liquidity documents. Structural requirements The maturity analysis of financial liabilities represents the basis for the management of exposure to structural liquidity risk. The table below shows the undiscounted cash flows for all financial liabilities on a contractual basis, based on the earliest date on which the group can be required to pay. This basis of disclosure differs from the balance sheet carrying value of financial liabilities since those values are typically disclosed on a discounted basis. The table also includes contractual cash flows with respect to offbalance sheet items which have not yet been recorded on the statement of financial position. Where cash flows are exchanged simultaneously, the net amounts have been reflected. CapCom’s sub-committees are the Liquidity Contingency Management Team (LCMT) which is generally convened in response to heightened liquidity risk and, the Liquidity SubCommittee (LSC) which is responsible for liquidity management during business as usual conditions. The LCMT is required to vote on whether to invoke the Contingency Funding Plan (CFP) at each Redeemable on demand Maturing within 1 month Maturing 1-6 months Maturing 6 - 12 months Maturing after 12 months Undated Total $m $m $m $m $m $m $m Derivative liabilities 432.4 597.8 1 266.7 519.9 2 433.6 - 5 250.4 Trading liabilities 239.4 56.6 784.9 470.6 882.3 - 2 433.8 4 740.4 1 501.2 2 908.3 802.1 455.0 - 10 407.0 - - 4.5 4.9 825.0 141.7 976.1 5 412.2 2 155.6 4 964.4 1 797.5 4 595.9 141.7 19 067.3 0.5 91.2 232.5 42.5 112.9 - 479.6 Guarantees - 34.4 23.3 31.7 59.8 - 149.2 Irrevocable unutilised facilities - 7.9 74.4 20.6 65.7 - 168.6 0.5 133.5 330.2 94.8 238.4 - 797.4 5 412.7 2 289.1 5 294.6 1 892.3 4 834.3 141.7 19 864.7 6.8 1 099.4 1 762.3 955.5 3 503.2 - 7 327.2 - 689.4 287.9 186.7 1 132.6 - 2 296.6 5 192.3 3 154.5 3 969.4 1 256.8 861.0 - 14 434.0 9.5 - - - 824.9 141.7 976.1 2012 Financial liabilities Deposit and current accounts Subordinated debt Total balance sheet financial liabilities Letters of credit Total off-balance sheet financial liabilities Total financial liabilities 2011 Financial liabilities Derivative liabilities Trading liabilities Deposit and current accounts Subordinated debt Total balance sheet financial liabilities 5 208.6 4 943.3 6 019.6 2 399.0 6 321.7 141.7 25 033.9 Letters of credit - 95.4 316.4 50.1 142.6 - 604.5 Guarantees - 22.9 50.2 8.2 29.1 - 110.4 Irrevocable unutilised facilities - 0.3 36.9 3.2 414.6 - 455.0 Total off-balance sheet financial liabilities - 118.6 403.5 61.5 586.3 - 1 169.9 5 208.6 5 061.9 6 423.1 2 460.5 6 908.0 141.7 26 203.8 Total financial liabilities 93 Notes to the annual financial statements continued Contingency liquidity Portfolios of liquid assets are maintained as protection against unexpected disruptions in cash flows to ensure that SB Plc is able to meet liabilities as they fall due. These portfolios are managed within limits and, apart from acting as a buffer under going concern conditions, also form an integral part of the broader liquidity generation strategy in the event of a liquidity crisis. These assets include deposits placed at the Bank of England, debt securities, reverse repos on qualifying assets and stocks of precious and base metals. In addition to the possibility of liquidating asset positions, there are a range of other management actions available to manage liquidity under stressed conditions, which include transfers of assets to other group companies to optimise liquidity and additionally declining to roll-over loans or reverse repos as they fall due from clients. Liquidity contingency plans The CFP sets out SB Plc’s strategies for mitigating severe liquidity stress. The CFP details SB Plc’s response to potential liquidity shortfalls as a result of idiosyncratic, market wide or combined stress events. As the nature of a stress is unknown in advance, the contingency plans are flexible and contain a range of options. The LCMT is responsible for activating the CFP. The crisis response strategy addresses necessary internal and external communications, liquidity generation, operations, as well as heightened and supplementary information requirements. The funding contingency plan is continually reviewed and updated to reflect current market trends and conditions as well as reflecting the experience of recent historical market stress scenarios, rating changes and the range of management actions adopted to protect the SB Plc’s position. A deterioration of EWIs can result in the invocation of the contingency plans (as noted, this would be at the decree of LCMT). The CFP is one of the contingent management components of SB Plc’s recovery and resolution plan. Funding Strategy The funding strategy seeks to assist in optimising funding whilst accommodating anticipated balance sheet changes, ensuring that the structure of the balance sheet remains secure and liabilities can be met as they fall due. The funding strategy is developed into a funding plan as part of the budget process where revenue, cost and capital forecasts are collected from the business units, with finance producing a balance sheet projection. These balance sheet forecasts, driven by expected asset growth, are used as the basis to establish a funding plan for up to three years ahead. Additionally, the use of funds, by business, is reviewed daily by both Treasury and the business to identify any significant changes in business funding requirements. Diversified funding base Funding concentration risk limits are used to monitor funding diversification across products, sectors, geographic regions and counterparties. Primary sources of funding are in the form of 94 deposits across a spectrum of clients, as well as long-term loan and capital market funding. Further funding is sourced from a number of African countries, leveraging SBG’s operational footprint across the continent. SB Plc is currently rationalising deposit taking from the group’s offshore affiliate banks in Jersey and Isle of Man, reducing the amount of short-term funding taken from the operation. Surplus foreign currency liquidity within Standard Bank of South Africa is also utilised by SB Plc, however, limits are set on this funding source to avoid undue dependence on Standard Bank Group. Liquidity stress testing SB Plc seeks to comply with the overall liquidity adequacy rule, maintaining liquidity resources which are adequate, both as to amount and quality, to meet contractual, behavioural and contingent liquidity needs and ensure that there is no significant risk that liabilities cannot be met as they fall due. The liquidity stress testing programme developed by SB Plc has two objectives: 1. It is designed to be compliant with the FSA framework on liquidity. 2. It expresses SB Plc’s liquidity risk tolerance, as set out in the LRTS. SB Plc’s risk tolerance requires both the regulatory stresses and the internal stresses be survived for a three month period using the appropriate coverage ratio. The parameters used within the internal stresses and the calibration of these are assessed by management and the Board as representing stress scenarios which could realistically occur and which would have a severe impact upon SB Plc, given its current business model and activities. SB Plc models its liquidity position daily using these stress tests to check that the results do not breach the liquidity risk tolerance set by the SB Plc Board. Additionally, a risk tolerance limit is set against any primary currencies. This reflects the reliance of SB Plc on USD cashflows and the possibility that foreign exchange markets may be closed during a severe stress scenario, restricting how and when liquidity resources can be swapped between currencies to meet outflows. As noted earlier, SB Plc also references a spectrum of EWIs that monitor both internal and external liquidity conditions. The EWIs are reviewed by senior management on a daily basis. The EWI framework is integrated into SB Plc’s liquidity management escalation system by aggregating liquidity results that drive the decision to call either LSC or LCMT meetings. 30.7 Market risk Definition The object of market risk management is to manage and control market risk exposures within acceptable parameters, while optimising the return on risk. Major exposures to market risk occur in markets served by formal financial exchanges and over-the- Standard Bank Plc Consolidated Annual Report 2012 counter markets. These exposures arise primarily as a result of the execution of customers’ orders. The group’s exposure to market risk can be categorised as follows: aggregate n Trading book market risk These risks arise in trading activities where the group acts as a principal with clients in the market. VaR is the 95th percentile selected from the 250 days of daily n Banking book interest rate risk These risks arise from the structural interest rate risk caused by the differing repricing characteristics of banking assets and liabilities. The group has market risk regulatory model approval for its commodity trading, local markets (rates and foreign exchange), credit trading and equity businesses. Where SB Plc has received internal model approval, a VaR using a confidence level of 99% and a holding period of ten days is used to determine market risk regulatory capital. In addition, a stressed VaR, calibrated to a period of extreme financial stress and an incremental risk charge (IRC) are also used for regulatory capital purposes. Foreign currency risk These risks arise as a result of changes in the fair value or future cash flows of financial exposures as a result of changes in foreign exchange rates other than those changes included in the VaR analysis. Equity investments These risks arise from equity price changes caused by listed and unlisted investments, which are monitored and authorised by the investment committee. Framework and governance The SBG Board approves the market risk appetite for all types of market risk and grants general authority to take on market risk exposure to Group Risk Oversight Committee (GROC) which delegates responsibility for limit setting and exposure monitoring to the Risk Management Committee (RMC) at a legal entity level. The Asset & Liability Committee (ALCO) also sets market risk standards to ensure that the measurement, reporting, monitoring and management of market risk associated with operations across the group follow a common governance framework. Market risk management units, independent of trading operations, monitor market risk exposures from both trading activities and banking activities. Exposures and any limit excesses are monitored daily, and reported monthly to CapCom. Level 1 limit breaches are also reported quarterly to SBG ALCO, GROC and SBG capital and RMC. all hypothetical profit or losses for day one across all positions, giving one total profit or loss. Repeat for all other 249 days; and hypothetical total profit or loss. Daily losses exceeding the VaR are likely to occur, on average, 13 times in every 250 days. The use of historic VaR has limitations as it is based on historical correlations and volatilities in market prices and assumes that future prices will follow the observed historical distribution. Although VaR is a valuable guide to risk, it should always be viewed in the context of its limitations. These limitations include: the n use of historical data as a proxy for estimating future events may not encompass all potential events, particularly those which are extreme in nature; the n use of a one day holding period assumes that all positions can be liquidated or the risk offset in one day. This may not fully reflect the market risk arising at times of severe illiquidity, when a one day holding period may be insufficient to liquidate or hedge all positions fully; the n use of a 95% confidence level, by definition, does not take into account losses that might occur beyond this level of confidence; and VaR n Market risk measurement The techniques used to measure and control market risk include: daily n value at risk (VaR) and SVaR; stress n risk n tests; factor market risk measures; annual net interest income at risk; and n economic n value of equity. Daily VaR The group uses the historical VaR simulation approach to derive quantitative measures, specifically for market risk under normal conditions. Normal VaR is based on 251 days of unweighted historical data, a holding period of one day and a confidence interval of 95%. The historical VaR results are computed in three components: calculate n hypothetical daily profit and loss for each position using observed market price movements based on 251 days of market data; is calculated on the basis of exposures outstanding at the close of business and therefore does not necessarily reflect intra-day exposures. Stress tests In recognition of the limitations of VaR, stress testing provides an indication of the potential losses that could occur under extreme market conditions and where longer holding periods may be required to exit positions. The stress tests carried out by the group include individual market risk factor testing and combinations of market factors per trading desk and combinations of trading desks. Stress tests include a combination of risk factor based, historical, hypothetical and point of weakness simulations and provide senior management with an assessment of the financial impact such events would have on the group’s profit. Other market risk measures Other market risk measures specific to individual business units include permissible instruments, concentration of exposures, gap limits, maximum tenor and stop loss triggers. 95 Notes to the annual financial statements continued The quantitative analytics and risk methods department independently validate and document new pricing models and perform an annual review of existing models to ensure models are still relevant and behaving within expectations. Analysis of trading book market risk exposures to contain losses for individual business units by enforcing management intervention at predetermined loss levels measured against the individual highwater mark year-to-date profit and loss. Other basic risk measures specific to individual business units are also used. These measures include permissible instruments, concentration of exposures, gap limits and maximum tenor. The table below shows the aggregated historical VaR for the group’s trading positions. The maximum (and minimum) VaR amounts show the bands in which the values at risk fluctuated during the periods specified. Stop loss triggers are designed The group’s trading units achieved a positive actual income for over 78% of the trading days in 2012 (2011: 68%). The average daily revenue earned in 2012 was US$1.27 million with a standard deviation of US$1.99million. Maximum $m 1 2012 Commodities Foreign exchange Equities Debt securities Diversification benefit4 3.5 3.2 1.6 4.7 Normal VaR2 Minimum1 $m 1.4 0.4 0.2 2.3 Average $m 2.3 1.3 0.7 3.2 Year end $m 1.9 0.5 0.6 2.4 (2.0) Stress VaR3 Year end $m 2012 Commodities Foreign exchange Equities Debt securities 14.2 3.9 4.2 17.2 Maximum $m 1 2011 Commodities Foreign exchange Equities Debt securities Diversification benefit4 3.9 2.1 1.7 5.6 Normal VaR2 Minimum1 $m 2.4 0.3 0.4 2.7 Average $m 3.0 1.2 0.7 3.5 Year end $m 3.1 1.1 0.4 3.0 (3.3) Stress VaR3 Year end $m 2011 Commodities Foreign exchange Equities Debt securities 1 2 3 4 96 13.7 4.9 1.9 13.6 he maximum (and minimum) VaR figures reported for each market variable did not necessarily occur on the same days. As a result, the aggregate VaR will not equal the sum T of the individual market VaR values, and it is inappropriate to ascribe a diversification effect to VaR when these values may have occurred on different dates. Normal VaR is based on a holding period of one day and a confidence interval of 95%. Stress VaR is based on a holding period of 10 days and a confidence interval of 99.7%. Diversification benefit is the benefit of measuring the VaR of the trading portfolio as a whole, i.e. the difference between the sum of the individual VaRs and measuring the VaR of the whole trading portfolio. Standard Bank Plc Consolidated Annual Report 2012 Commodity exposure Analysis of banking book interest rate risk exposure The group has capabilities in physical precious and base metals, predominantly in London, Dubai, Singapore and Shanghai with access into all major physical markets in Europe, Asia, North and South America. The business consists of a diversified client base including producers, consumers (including jewelers), hedge funds, private banks, recycling and refining companies, financial institutions and central banks. The commodities business is primarily client driven, with price risk hedged on major exchanges offering all standardised products such as forwards, European and Asian options, swaps, leases and lease rate swaps. Banking related market risk exposure principally involves the management of the potential adverse effect of interest rate movements on net interest income and equity. This risk is transferred to and managed within the group’s asset & liability management team under monitoring of the local risk management committee and CapCom. To mitigate trading risk, a number of strategies are employed. Firstly, the group trades on a cleared basis with counterparties posting margins to a central clearer. Alternatively, the group executes credit support annex (CSA) agreements such that margin or collateral is posted on a daily basis to offset any exposure arising from any live trades. The group may also actively manage any embedded credit spread via the contingent credit protection (CCP) process or take a credit calculation adjustment where no credit mitigation is possible. Operational risk is managed through a dedicated commodities management unit and the group’s operations team, using a number of automated systematic confirmations with exchanges, brokers, warehouses and clients. A daily reconciliation is performed for open trades, cash accounts, inventory, collateral and client account balances with any discrepancies being escalated to the appropriate relationship manager for resolution directly with the client. The group’s separate operational risk department monitors key risk indicators (KRIs) around key business processes which are monitored and discussed with the business on a regular basis. The main analytical techniques used to quantify banking book interest rate risk are earnings and valuation-based measures. The results obtained from simulations assist in evaluating the optimal hedging strategies on a risk-return basis. Desired changes to a particular interest rate risk profile are achieved through the restructuring of the statement of financial position and, where possible, the use of derivative instruments, such as interest rate swaps. The shape of the yield curve and the group’s own view of future interest rates are used as inputs in developing hedging strategies. Interest rate risk limits are set in terms of both changes in forecast net interest income and economic value of equity. The repricing gaps for the group’s non-trading portfolios are shown below. This view is for the purpose of illustration only, as positions are managed by currency to take account of the fact that interest rate changes are unlikely to be perfectly correlated. All assets, liabilities and derivative instruments are sited in gap intervals based on their repricing characteristics. Assets and liabilities for which no specific contractual repricing or maturity dates exist are placed in gap intervals based on management’s judgment and statistical analysis, as determined by the most likely repricing behaviour. Repricing gap for non-trading portfolios 0-3 months 3-6 months 6-12 months >12 months $m $m $m $m 2012 Interest rate sensitivity gap 1 579.8 Cumulative interest rate sensitivity gap 1 579.8 1 480.4 1 437.7 1 295.9 36.5% 34.2% 33.2% 29.9% Interest rate sensitivity gap 1 661.9 289.2 112.8 (143.5) Cumulative interest rate sensitivity gap 1 661.9 1 951.1 2 063.9 1 920.4 33.0% 38.7% 41.0% 38.1% Cumulative interest rate sensitivity gap as a percentage of total banking assets (99.4) (42.7) (141.8) 2011 Cumulative interest rate sensitivity gap as a percentage of total banking assets 97 Notes to the annual financial statements continued Sensitivity of net interest income The table below indicates the sensitivity in US Dollar equivalents of the group’s net interest income in response to a change in interest rates, after taking into account all risk mitigating instruments, with all other variables held constant. Increase in basis points 1 Month $m 2 Months $m 3 Months $m 4 - 6 Months $m 2012 1% up (interest-rate increase) 100 (0.7) - 0.1 0.4 1% down (interest-rate decrease) 100 0.7 - (0.1) (0.4) 1% up (interest-rate increase) 100 (0.5) (0.1) (0.3) (1.1) 1% down (interest-rate decrease) 100 0.5 0.1 0.3 2011 It is the group’s policy that banking book assets and liabilities with a duration greater than one week be match funded with the money markets desk, thus removing interest rate risk. However, a few business areas are exempt where their banking book interest rate risk is monitored in the same way as if it was a trading book, i.e. PV01 sensitivities are calculated. This is then aggregated in a similar manner to the other traded risks as detailed earlier. Foreign currency risk The group’s foreign exchange positions arise mainly from foreign exchange trading activities, which are governed by position limits approved by the risk management committee in accordance with SBG’s market risk policy. These position limits are subject to review at least annually and foreign exchange exposures are monitored daily by the market risk function and reviewed monthly to ensure they remain within the approved risk appetite. The group policy is not to hold open exposures in respect of the banking book of any significance. Gains or losses on derivatives that have been designated in terms of either net investment or cash flow hedging relationships are reported directly in equity, with all other gains and losses on derivatives being reported in profit or loss. Net investment in foreign operations 2012 Functional currency Chinese Renmimbi 2011 $m $m 79.7 66.6 Market risk on equity investments The investment committee approves investments in listed and unlisted entities in accordance with delegated authority limits. Market risk on investments is managed in accordance with the purpose and strategic benefits of such investments rather than purely on mark-to-market considerations. Periodic reviews and reassessments are undertaken on the performance of the investments. 30.8 Operational risk* Introduction Operational risk is recognised as a distinct risk category which the group 98 *Indicates risk management section not subject to audit. 1.1 strives to manage within acceptable levels through the promotion of sound operational risk management practices. Operational risk is defined as the risk of loss suffered as a result of inadequacy of, or a failure in, internal processes, people and systems or from external events. This includes information risk and legal risk, but excludes reputational risk and strategic risk. Operational risk exists in the natural course of business activity. The group’s approach to managing operational risk is to adopt fit for purpose operational risk practices that assist business line management to understand their inherent risk and to reduce their risk profile, in line with the group’s risk appetite, while maximising their operational performance and efficiency. The current framework follows a primarily qualitative approach, being focused on ensuring underlying risks are identified and owned and that the residual risk is maintained within an acceptable level in the opinion of the relevant management, as overseen by an independent operational risk function within risk management. Independent assurance on the satisfactory management of operational risk is provided by internal audit. The day-to-day management of operational risk is embedded within the business areas in order for the risks to be managed where they arise. Framework and governance BRMC, as the appropriately delegated risk oversight body on behalf of the Board, has ultimate responsibility for operational risk. BRMC ensures that the operational risk management (ORM) framework for the management and reporting of operational risk is implemented across the group, whilst ensuring regulatory compliance where applicable. The GROC serves as the oversight body in the application of SBG’s operational risk management framework, including business continuity management and information risk. This is achieved through enforcing standards for identification, assessing, controlling, monitoring and reporting. The GROC approves ORM policies and methodologies and oversees risk appetite and tolerance. Operational Risk Committee (OpCo) serves as the main operational risk management committee within SB Plc. The committee’s primary responsibility is to monitor and control operational risk for SB Plc and oversee adherence to agreed risk appetite. It is responsible for ensuring a robust operational risk framework is embedded across the organisation and promoting strong risk culture within the three lines of defence model. Standard Bank Plc Consolidated Annual Report 2012 The roles and responsibilities for managing operational risks are stipulated in the operational risk governance standard and various ORM policies. These policies indicate the responsibilities of operational risk specialists at all levels and of the risk owners. Local heads of ORM may develop their own policies and procedures that better suit their unique environments. These policies and procedures must align to the policies and procedures and must be approved by their respective governance committees. The management and measurement of operational risk The ORM framework serves to ensure that risk owners are clearly accountable for the risk inherent within the business activities of the group. The key elements in the ORM framework include methodologies and tools to identify, assess, monitor and manage operational risks. Management is required to identify risks that could threaten the achievement of business objectives and, together with the required set of controls and actions, to mitigate the risks as appropriate. Risk assessment incorporates a regular review of identified risks to monitor significant changes. The incident data collection process ensures that all relevant operational risk incidents (including loss events, near misses and nonfinancial impacts) are captured into a centralised database. The flow of information into the incident database is a bottom-up approach. The capture process identifies and classifies all incidents in terms of an incident classification list. This information is used to monitor the state of operational risk, address trends, implement corrective action and manage recovery, where possible. command and control process for managing the business through a crisis to full recovery. These processes may also be deployed to manage non-operational crises, including business crises, at the discretion of senior management. Information risk management Information risk is defined as the risk of accidental or intentional unauthorised use, modification, disclosure or destruction of the group’s information resources, which compromises their confidentiality, integrity or availability. From a strategic perspective, information risk management is treated as a particular discipline within the operational risk framework. Essentially, information risk management not only protects the group’s information resources from a wide range of threats, but also enhances business operations, ensures business continuity, maximises return on investments and supports the implementation of various services. Legal risk * The group’s legal obligations arise throughout its global operations and where the group may be faced with risk where legal proceedings are brought against it. Legal risk arises where: incorrect n the n application of regulatory requirements takes place; group may be liable for damages to third parties; or contractual n obligations may be enforced against the group in an adverse way, resulting in legal proceedings being instituted against it. The group uses key risk indicators to monitor the relevant risks and controls highlighted in the risk and control self-assessment process. The implementation of the key risk indicators process is an integral element of ORM and is therefore compulsory throughout the group. Although the group has processes and controls in place to manage its legal risk, failure to manage risks effectively could result in legal proceedings impacting the group adversely, both financially and reputationally. Operational risk reports are produced on both a regular and an eventdriven basis. The reports include a profile of the key risks to the achievement of their business objectives, relevant control issues, and operational risk incidents. Specific reports are prepared on a regular basis for the Group Operational Risk Management (GORM), BRMC and relevant SBG committees. Taxation risk * Framework and governance The group maintains adequate insurance to cover key operational and other risks. The group’s insurance process and requirements are the responsibility of the ORM function. Business resilience (including business continuity management and crisis management) Business resilience is defined as the ability of the group’s business operations to rapidly adapt and respond to internal or external dynamic changes – opportunities, demands, disruptions or threats – and continue operations with limited impact to the business through proactive management and resilient infrastructure. Business resilience is primarily focused on developing and maintaining a pro-active and holistic response. Crisis management is based on a streamlined *Indicates risk management section not subject to audit. Taxation risk is the possibility of suffering unexpected loss, financial or otherwise, as a result of the application of tax systems, whether in legislative systems, rulings or practices, applicable to the entire spectrum of taxes and other fiscal imposts to which the group is subject. In terms of the group tax policy, the group will fulfill its responsibilities under tax law in each of the jurisdictions in which it operates, whether in relation to compliance, planning or client service matters. Tax law includes all responsibilities which the group may have in relation to company taxes, personal taxes, capital gains taxes, indirect taxes and tax administration. Compliance with this policy is aimed at ensuring that the group: pays neither more nor less tax than tax law requires in the context n of the group’s operations; continually n reviews its existing operations and planned operations in this context; and 99 Notes to the annual financial statements continued ensures n that, where clients participate in group products, these clients are either aware of the probable tax consequences, or are advised to consult with independent professionals to assess these consequences, or both. The framework to achieve compliance with the group tax policy comprises four elements: identification n human n and management of tax risk; resources: an optimal mix of staffing and outsourcing; skills n development: methods to maintain and improve managerial and technical competency; and communication: communication of information affecting tax within n the group. Good corporate governance in the context of tax requires that each of these framework elements be in place. The absence of any one of these elements would seriously undermine the others. The identification and management of tax risk is the primary objective of the group tax function and this objective is achieved through the application of a tax risk matrix approach, which measures the fulfillment of tax responsibilities against the specific requirements of each category of tax to which the group is exposed in the context of the various types of activity the group conducts. Compliance risk * Compliance risk refers to the risk of failing to comply with applicable laws, regulations, codes of conduct and standards of good practice which may result in regulatory sanctions, financial or reputational loss. Framework and governance The bank maintains a centralised compliance function led by the Head: Compliance: International, who reports locally into the bank’s Chief Executive Officer and the bank’s Board Audit Committee. As part of the wider Standard Bank Group, the Head: Compliance : International also reports in to the Group Chief Compliance Officer. It is the responsibility of the business units to ensure that their respective areas are acting in compliance with the relevant legislation. Each business unit has a responsibility to ensure that the compliance function receives the necessary support and for reporting compliance matters to compliance where required. To support the bank’s approach to compliance risk management, which includes the adherence to the implementation of SBG compliance policy and standards, a centrally based monitoring discipline undertakes a programme of review of business areas and higher risk compliance exposures using a risk-based approach. This approach is substantially aligned to the methodologies used by the bank’s other risk assurance functions. The group compliance function provides leadership through specialist support units including a global conflicts control room, money laundering and terrorist financing control, sanctions and emerging legislative developments. 100 *Indicates risk management section not subject to audit. Regulation and supervision The bank operates within a highly regulated industry and across multiple jurisdictions. The bank is supervised by various regulatory bodies, with the Financial Services Authority (FSA) its primary regulator. The bank’s ultimate holding company, Standard Bank Group Limited, is incorporated in South Africa and regulated by the Bank Supervision Department of the South African Reserve Bank (SARB), who also regulates the subsidiaries of SBG. Financial crime risk Financial crime risk is defined as the risk of economic loss, reputational impact and regulatory sanction arising from any type of financial crime against the bank. Financial crime includes fraud, money laundering, violent crime and misconduct by staff, customers, suppliers, business partners, stakeholders and third parties. Framework and governance Responsibility for ensuring that the bank has effective systems and controls for compliance with applicable Financial Crime regulatory requirements and standards lies with senior management of the bank. The need for senior management to take an active role in the financial crime prevention regime and the provision of direction to and oversight of that regime is emphasised in the FSA’s Rulebook. Senior management take seriously their obligations in relation to regulatory compliance, including financial crime, and the bank’s governance structures include a number of senior management committees that have specific regulatory compliance responsibilities. Standard Bank Plc is required to appoint, and has appointed, a Money Laundering Reporting Officer (MLRO), who is responsible for oversight of the firm’s compliance with the FSA’s rules on systems and controls against money laundering. The firm’s senior management commissions a report from its MLRO on an annual basis which assesses the operation and effectiveness of the bank’s systems and controls in relation to managing money laundering risk. Standard Bank Plc’s MLRO is also its Head of Financial Crime and this role covers sanctions, fraud, bribery and corruption in addition to money laundering responsibilities. The MLRO owns the relevant policies and procedures and is responsible for putting in place appropriate systems and controls in relation thereto, as well as being the principal point of contact between the bank and law enforcement agencies. Money laundering and Terrorist Financing control The bank is required to establish and maintain appropriate systems and controls to assist it in complying with the statutory and regulatory money laundering and terrorist financing control requirements in each of the jurisdictions in which it operates. The bank allocates sufficient resources, including appropriate staff and technology, to develop, implement and maintain policies and procedures to meet these requirements. Legislation pertaining to money laundering and terrorist financing control imposes several key areas for the bank to address, namely: customer due diligence; monitoring customer activity; reporting suspicious activity to the relevant authorities; training staff in their responsibilities; record keeping and management information. Standard Bank Plc Consolidated Annual Report 2012 The bank adopts a risk-based approach to managing its money laundering and terrorist financing risk, thereby allowing resources to be focussed on areas of higher risk. In implementing a risk-based approach, the Bank will take the actions necessary to identify and assess the Money Laundering and Terrorist Financing risks relevant to it, and will implement systems and controls that are proportionate to these risks and appropriate to the bank’s circumstances (given the nature, scale and complexity of its activities). Sanctions The bank is required to have systems and controls in place to ensure that it adheres to sanctions imposed by HM Treasury and the European Union. These controls include ensuring that business relationships are not formed or continued with individuals; entities or bodies subject to sanctions and ensuring that funds are not made available, either directly or indirectly to individuals; entities or bodies whom are subject to sanctions. Although there is no explicit obligation for the bank to have regard to sanctions imposed by other bodies or authorities in other jurisdictions, in practice there is an expectation that institutions undertaking business outside of the UK will have regard to the relevant sanctions regimes in the jurisdictions in which they operate. This is particularly important given the extra territorial reach of the US authorities. In respect of sanctions requirements, the bank works with Standard Bank Group to share expertise and align approaches to potentially sanctioned entities or transactions. Fraud, Bribery and Corruption risk management The bank is committed to carrying out business fairly, honestly and openly and adopts a zero tolerance approach to fraud, bribery and corruption. The bank requires all staff to act honestly and with integrity at all times, and to report all reasonable suspicions of fraud, bribery or corruption. The bank requires compliance with all anti-bribery and anti-corruption laws in the countries in which it conducts business (whether through a third party or otherwise); and recognises that over and above the commission of any crime, any involvement in bribery or corruption will also reflect adversely on its image and reputation. The responsibility for identifying instances of suspected or actual fraud, bribery or corruption lies with each business unit. It is the responsibility of all staff to be vigilant of the risk of fraud, bribery or corruption and report any suspicion of incidents of these. The bank is committed to investigating all fraud, bribery or corruption whether suspected or discovered. Where an initial report has been made as above, the MLRO, consulting as appropriate with Group Financial Crime Control (GFCC), will determine whether a detailed investigation is required and take appropriate steps to oversee the investigation. The compliance department is responsible for the risk strategy in relation to fraud, bribery or corruption, which includes the continuous assessment of risk and the control framework, overseen by the MLRO. *Indicates risk management section not subject to audit. Client money The Bank has established policies and procedures to comply with specific FSA guidelines regarding client money. Where the Bank places client money with a third party bank, the account is designated as a client account and maintained separate from any account used to hold the Bank’s own money. 30.9 Reputational risk * Reputational risk is the risk caused by damage to an organisation’s reputation, name or brand. Such damage may result from a breakdown of trust, confidence or business relationships. Safeguarding the group’s reputation is of paramount importance to its continued success and is the responsibility of every member of staff. As a banking group, Standard Bank’s good reputation depends upon the way in which it conducts its business, but it can also be affected by the way in which clients, to whom it provides financial services, conduct themselves. 30.10 Capital management The group manages its capital resource and requirements to: achieve n a prudent balance between maintaining capital ratios to support business growth and depositor confidence, and providing competitive returns to shareholders; ensure that each group entity maintains sufficient capital levels for n legal and regulatory compliance purposes; and ensure n that its actions do not compromise sound governance and appropriate business practices and it eliminates any negative effect on payment capacity, liquidity or profitability. The group is subject to regulation and supervision by the Financial Services Authority (FSA) and forms part of SBG which is supervised by the SARB. The group is subject to the Basel II and CRD III regulatory frameworks for calculating minimum capital requirements published by the Basel Committee on Banking Supervision (the basel committee) as implemented by the FSA with effect from 1 January 2008 and 31 December 2011 respectively. Basel II is structured around three pillars: minimum n capital requirements; supervisory n market n review process; and discipline. The group calculates credit and counterparty risk capital requirements using the FSA standard rules as well as on the FIRB basis for internal use and for reporting to the SARB. Market risk is calculated as a combination of approved models and standardised methods. Operational risk is calculated on the standardised approach. As part of the pillar II process, the group has adopted the ICAAP which is the firm’s self assessment of capital requirements including for those risks not captured by pillar I. As part of the governance process, and incorporated into the ICAAP, the group has implemented 101 Notes to the annual financial statements continued a macro economic stress testing model to assess the additional capital requirements and the impact on capital resource as a result of adverse economic conditions. The impact of Basel III has been reviewed by the group and has been factored into capital projections. In addition to managing against the regulatory capital requirements, management also increasingly utilise more risk sensitive internal economic capital models to monitor and control the risk profile of the organisation. of regulators in those countries in which it operates. Banking regulations are generally based on the guidelines developed by the basel committee under the auspices of the Bank for International Settlements. In addition to the requirements of host country regulators, all banking operations are also expected to comply with the capital adequacy requirements in terms of the FSA banking regulations on a consolidated basis. The group maintained surplus capital over the minimum requirements prescribed by the FSA through the year. The capital adequacy ratio, which reflects the capital strength of an entity compared to the minimum regulatory requirement, is calculated by dividing the capital held by that entity by its risk-weighted assets. Economic capital The group also calculates economic capital, the management of which forms part of the overall risk management framework, including: adequacy as measured by the ratio of available financial resources to economic capital consumption and forms part of the risk appetite; Capital is split into three tiers: Core tier I (primary capital) represents permanent forms of capital n capital n such as share capital, share premium and retained earnings less regulatory deductions; Tier n II (secondary capital) includes medium to long-term subordinated debt, revaluation reserves and performing portfolio credit impairments; and concentrations in terms of economic capital are reviewed against limits n and managed by the portfolio risk management committee; and economic n capital utilisation and various related performance metrics are reviewed by the capital management committee and form part of the capital allocation process. There n Regulatory capital Risk-weighted assets are determined by applying prescribed risk weightings to on and off balance sheet exposures according to the relative credit risk of the counterparty. Included in overall risk-weighted assets is a notional risk weighting for market risks, counterparty risks and large exposure risks relating to trading activities. In addition to compliance with the requirements prescribed by the FSA, the group is required to meet minimum capital requirements is no issued tier III (tertiary capital) at year-end. Capital Resources The table below sets out the qualifying capital of the regulated entity. 2012 2011 $m $m Regulatory capital Core Tier I Share capital Share premium Qualifying reserves1 Less regulatory deductions Total Core Tier I 1 083.5 431.0 (147.2) (71.6) 1 295.7 1 083.5 431.0 183.2 (111.5) 1 586.2 Tier II Subordinated debt instruments Credit impairment against performing loans Tier II Excess Total Tier II Less deductions from Tier I and Tier II Total qualifying Tier I and Tier II capital 966.7 10.0 (177.2) 799.5 (161.2) 1 934.0 966.7 42.1 (31.9) 976.9 (159.6) 2 403.5 177.2 177.2 2 111.2 31.9 31.9 2 435.4 Tier III 102 Tier II excess Total Tier III Total eligible capital 1 Reserve balances of special purpose entities are not included in capital resources as they fall outside the regulated entity’s solo-consolidation waiver from the FSA. Standard Bank Plc Consolidated Annual Report 2012 31 Reclassifications As previously reported 2011 $m Net interest income Reclassification1 2011 $m Reclassified 2011 $m 154.1 (6.0) 148.1 Interest income 361.7 (6.0) 355.7 Interest expense (207.6) Non-interest revenue - (207.6) 394.1 117.0 511.1 101.0 117.0 218.0 Fees and commission revenue 145.4 1.6 147.0 Fees and commission expenses (44.4) 26.7 (17.7) Net fees, commission and revenue sharing arrangements Revenue sharing and fee arrangements with group companies Trading revenue Total income Credit impairment charge Income after impairments - 88.7 88.7 293.1 - 293.1 548.2 111.0 659.2 (135.0) - (135.0) 413.2 111.0 524.2 (415.7) (117.0) (532.7) Staff costs (250.9) (76.3) (327.2) Other operating expenses (125.9) (40.7) (166.6) Operating expenses Indirect taxation (10.3) - (10.3) Restructuring costs (28.6) - (28.6) Loss before disposal of loan portfolio Profit on disposal of loan portfolio (2.5) - (6.0) (8.5) 6.0 6.0 Loss from operations (2.5) - (2.5) Income tax credit 27.5 - 27.5 Profit for the year from continuing operations 25.0 - 25.0 Discontinued operations (46.1) - (46.1) Loss attributable to equity shareholders (21.1) - (21.1) 1 In line with the business model developments, revenues are attributed to Standard Bank Group entities in accordance with revised transfer pricing arrangements. In previous years, costs recovered from SBG entities were recorded as reimbursements of expenses. Accordingly, comparative balances have been reclassified to comply with the current year presentation. In addition, the loss on disposal of the IB portfolio has been separately reflected and the gain arising on the loan portfolio disposal in the prior year has been similarly classified. 103 Notes to the annual financial statements continued 32Ultimate holding company The largest group in which the results of the company are consolidated is that headed by Standard Bank Group Limited, a company incorporated in the Republic of South Africa. The smallest group in which they are consolidated is that headed by Standard International Holdings S.A., a company incorporated in Luxembourg. The consolidated financial statements of these groups are available to the public for inspection at: Standard Bank Group Limited Standard International Holdings S.A. 9th Floor 42, rue de la Vallée Standard Bank Centre Luxembourg L-2661 5 Simmonds Street Luxembourg Johannesburg 2001 Republic of South Africa 104 Standard Bank Plc Consolidated Annual Report 2012 Acronyms and abbreviations ALCO Asset and liability committee ILG Individual liquidity guidance ALM Asset and liability management IMF International Monetary Fund APB Auditing Practices Board ISDA International Swap Dealers Association BAC Board audit committee KRI Key risk indicators BIC Business infrastructure committee LGD Loss given default BRICS Brazil, Russia, India, China and South Africa LCMT Liquidity contingency management team BRMC Board risk management committee LME London Metal Exchange BS&R Business support and recovery LRTS Liquidity risk tolerance statement CAM Global markets core account management LSC Liquidity sub-committee Capcom Capital and liquidity management committee M&A Merger and acquisition CCP Contingent credit protection MENA Middle East and North Africa MTF Metal trading facilities NBFI Non-bank financial institution OCI Other comprehensive income OIS Overnight index based swap curves OpCo Operational risk committee OTC Over-the-counter PBB Personal and Business Banking PCC Pre-credit committee PCMU Physical commodities management unit PCS Private Client Services PD Probability of default PFE Potential future exposure PIM Principal Investment Management PIT Point in time Plan Quanto stock unit plan PRMC Portfolio risk management committee QARM Quantitative analytics and risk methods Remco Remuneration committee of the group Repos Repurchase agreements RMC Risk management committee SARB South African Reserve Bank SB Plc Standard Bank Plc SBG Standard Bank Group Limited and subsidiaries SBLH Standard Bank London Holdings Limited SBSA The Standard Bank of South Africa Limited CEEMECACentral and Eastern Europe / Middle East / Central Asia CEO Chief Executive Officer CFP Contingency funding plan CIB Corporate and Investment Banking division CGC Credit governance committee COMEX Commodity exchange company Standard Bank Plc CRD Capital requirement directive CRO Chief Risk Officer CSA Credit Support Annex CSSS Credit Suisse Standard Securities CVA Credit valuation adjustment DVA Own credit valuation adjustments EAD Exposure at default Ecap Economic capital ECB European Central Bank EL Expected loss EP Economic profit ERC Equity risk committee EU European Union EWI Early warning indicator FIRB Foundation internal ratings based FSA Financial Services Authority GAC Group audit committee GORM Group operational risk management GROC Group risk oversight committee group Standard Bank Plc, its subsidiary and SPEs IAS International Accounting Standards ICAAP Internal Capital Adequacy Assessment Process ICBC Industrial and Commercial Bank of China Limited ICMA International Capital Market Association IFRIC International Financial Reporting Interpretations Committee IFRS International Financial Reporting Standards as adopted by the EU SIFMASecurities Industry and Financial Markets Association SIH Standard International Holdings S.A. SPE Special purpose entity STC Structured transactions committee TTC Through the cycle UL Unexpected loss VaR Value-at-risk VAT Value added tax ZAR South African Rand 105 Contact information BRAZIL Banco Standard de Investimentos S.A. Av. Presidente Juscelino Kubitschek, 1327 22nd Andar Vila Nova Conceição 04543-011 São Paulo Brazil A. Menezesi Chief Executive CHINA Standard Advisory (China) Limited C507-508, 5/F, Chemsunny World Trade Centre 28 Fu Xing Men Nei Avenue Xichens District, Beijing, The People’s Republic of China C Tasker Chief Executive Standard Resources (China) Limited Unit 1209-1213, 12F, HSBC Building, Shanghai IFC No.8 Century Avenue Shanghai 200120 The People’s Republic of China V Yu General Manager Standard Bank Plc – Representative Office Unit 1207-1208, 12F, HSBC Building, Shanghai IFC No.8 Century Avenue Shanghai 200120 The People’s Republic of China B Yao Representative 106 HONG KONG Standard Bank Plc Hong Kong Branch 36th Floor Two Pacific Place 88 Queensway Hong Kong J T Chenoweth Chief executive Standard Securities Asia Limited 36th Floor Two Pacific Place 88 Queensway Hong Kong J T Chenoweth Director JAPAN Standard Bank Plc – Tokyo branch 11th Floor, Ark Mori Building, Akasaka, 1-12-32, Minato-ku, Tokyo 107-6011 Japan Y Ikemizu Branch manager SINGAPORE Standard Merchant Bank (Asia) Limited One George Street No. 16-04/05/06 Singapore 049145 P Hurley Chief executive Standard Bank Plc – Singapore branch One George Street No. 16-04/05/06 Singapore 049145 P Hurley Chief executive UNITED ARAB EMIRATES Standard Bank Plc – Dubai Branch Al Fattan Currency Tower 15th floor Office 1501, Dubai International Financial Centre (DIFC) PO BOX 482049 Dubai, UAE R Zok Chief Executive UNITED KINGDOM Standard Bank Plc 20 Gresham Street London EC2V 7JE England United Kingdom J Knott Chief Executive, Corporate and Investment Banking, International UNITED STATES OF AMERICA Standard New York, Inc. Standard Americas, Inc. Standard New York Securities, Inc. 19th Floor 320 Park Avenue New York N.Y. 10022 USA A Maartens Director The Standard Bank of South Africa Limited – New York Representative Office 19th Floor 320 Park Avenue New York N.Y. 10022 USA M Chiaviello Representative Standard Bank Plc Consolidated Annual Report 2012 Notes 107 www.standardbank.com


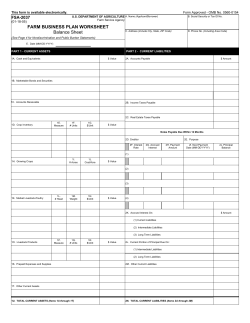


© Copyright 2026