
Microfiltration of cutting-oil emulsions enhanced by electrocoagulation
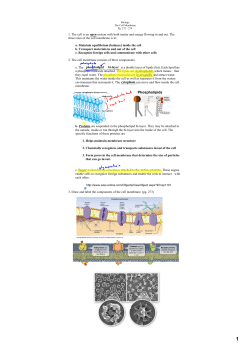
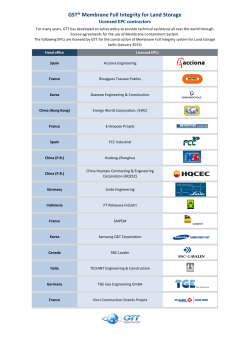
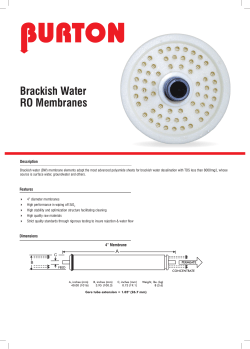
This article was downloaded by: [Faculty of Chemical Eng & Tech], [Krešimir Košutić]
On: 30 April 2015, At: 03:13
Publisher: Taylor & Francis
Informa Ltd Registered in England and Wales Registered Number: 1072954 Registered office: Mortimer House,
37-41 Mortimer Street, London W1T 3JH, UK
Desalination and Water Treatment
Publication details, including instructions for authors and subscription information:
http://www.tandfonline.com/loi/tdwt20
Microfiltration of cutting-oil emulsions enhanced by
electrocoagulation
b
a
a
Janja Križan Milić , Emil Dražević , Krešimir Košutić & Marjana Simonič
b
a
Faculty of Chemical Engineering and Technology, Department of Physical Chemistry,
University of Zagreb, Marulićev trg 19, HR-10000 Zagreb, Croatia, Tel. +385 1 459 7240
b
Faculty of Chemistry and Chemical Engineering, Laboratory for Water Treatment,
University of Maribor, Smetanova 17, SI-2000 Maribor, Slovenia
Published online: 30 Apr 2015.
Click for updates
To cite this article: Janja Križan Milić, Emil Dražević, Krešimir Košutić & Marjana Simonič (2015): Microfiltration of cutting-oil
emulsions enhanced by electrocoagulation, Desalination and Water Treatment, DOI: 10.1080/19443994.2015.1042067
To link to this article: http://dx.doi.org/10.1080/19443994.2015.1042067
PLEASE SCROLL DOWN FOR ARTICLE
Taylor & Francis makes every effort to ensure the accuracy of all the information (the “Content”) contained
in the publications on our platform. However, Taylor & Francis, our agents, and our licensors make no
representations or warranties whatsoever as to the accuracy, completeness, or suitability for any purpose of the
Content. Any opinions and views expressed in this publication are the opinions and views of the authors, and
are not the views of or endorsed by Taylor & Francis. The accuracy of the Content should not be relied upon and
should be independently verified with primary sources of information. Taylor and Francis shall not be liable for
any losses, actions, claims, proceedings, demands, costs, expenses, damages, and other liabilities whatsoever
or howsoever caused arising directly or indirectly in connection with, in relation to or arising out of the use of
the Content.
This article may be used for research, teaching, and private study purposes. Any substantial or systematic
reproduction, redistribution, reselling, loan, sub-licensing, systematic supply, or distribution in any
form to anyone is expressly forbidden. Terms & Conditions of access and use can be found at http://
www.tandfonline.com/page/terms-and-conditions
Desalination and Water Treatment
(2015) 1–10
www.deswater.com
doi: 10.1080/19443994.2015.1042067
Microfiltration of cutting-oil emulsions enhanced by electrocoagulation
Downloaded by [Faculty of Chemical Eng & Tech], [Krešimir Košuti] at 03:13 30 April 2015
Janja Krizˇan Milic´b, Emil Drazˇevic´a,*, Kresˇimir Kosˇutic´a, Marjana Simonicˇb
a
Faculty of Chemical Engineering and Technology, Department of Physical Chemistry, University of Zagreb, Marulic´ev trg 19,
HR-10000 Zagreb, Croatia, Tel. +385 1 459 7240; emails: [email protected] (E. Drazˇevic´), [email protected] (K. Kosˇutic´)
b
Faculty of Chemistry and Chemical Engineering, Laboratory for Water Treatment, University of Maribor, Smetanova 17, SI-2000
Maribor, Slovenia, emails: [email protected] (J.K. Milic´), [email protected] (M. Simonicˇ)
Received 17 November 2014; Accepted 10 April 2015
ABSTRACT
Electrocoagulation (EC) was examined as a pre-treatment to the microfiltration (MF) of oily
emulsions within the metalworking industry. The aim of this pre-treatment was to improve
the MF performance in terms of flux decline and removal of oil by applying the minimum
time of EC pre-treatment. Aluminium electrodes were used in EC, and flat sheetregenerated cellulose membrane in MF. The experiments were carried out using cutting-oil
emulsions at different concentrations (0.1, 0.5 and 1.0% (v/v)) and conductivity of about
700 μS cm−1. Drop size and zeta potential distributions were carried out to evaluate the
impacts of EC time on zeta potential and average particle size. We found that in all emulsions, 10 min of EC made the average size of oil particles bigger than the average size of
the pores in MF and substantially reduced pore clogging and irreversible fouling. Reduced
flux decline was related to the continuous formation of Al(OH)3 in EC that interconnected
the colloidal oil particles into porous and irregularly shaped flocs which formed highly
porous cake layer on the membrane surface.
Keywords: Microfiltration; Electrocoagulation (EC); Cutting-oil emulsion; Cake layer; Flux
decline; Zeta potential
1. Introduction
Cutting-oil emulsions are used as lubricants and
coolants specifically designed for metalworking processes. Used cutting-oils may cause high levels of contamination and rancid odours due to the presence of
emulsifiers, corrosion inhibitors, extreme pressure
agents, biocides or antifoam compounds. Their treatment and final disposal should be handled carefully [1].
Micro- and ultra-filtration (MF/UF) have arisen
over time as an effective technology in the treatment of
oily wastewaters as it offers high removal of oil,
*Corresponding author.
low-energy consumption and a compact design compared to robust space-consuming traditional processes
[2–4]. The efficiency of MF/UF, however, may vary
when considering fouling (e.g. pore-clogging) [5–9],
flux decline and consequently change in rejection [6].
High water flux in MF/UF, along with high separation
of oil and considerably low mass transfer of very big
and slow diffusing oil molecules, causes 10-fold higher
concentration of oil at the membrane surface [10,11].
Enhanced concentration of oil near the membrane surface may facilitate oil adsorption, and oil droplets may
enter the membrane pores, i.e. clog them. In this way,
irreversible fouling occurs [8,9,12]. Periodical hydraulic
cleaning, such as backwashing, back-pulsing and
1944-3994/1944-3986 Ó 2015 Balaban Desalination Publications. All rights reserved.
Downloaded by [Faculty of Chemical Eng & Tech], [Krešimir Košuti] at 03:13 30 April 2015
2
J.K. Milic´ et al. / Desalination and Water Treatment
pulsing by filtration, can reduce irreversible fouling i.e.
concentration polarisation or cake layer formation,
while irreversible fouling caused by oil adsorption and
pore plugging cannot be completely avoided without
further chemical cleaning [4]. Chemical cleaning of a
membrane to reduce or eliminate irreversible fouling
should be limited to a minimum frequency because
repeated chemical cleaning increase the cost of the MF
process.
In practice, MF is always paired with a pre-treatment process [13,14], usually coagulation [15], which
increases the size of the colloidal particles and prevents the irreversible fouling/flux decline [4]. The
benefits of conventional coagulation coupled with
membrane processes have been reported by many
authors. For instance, several authors have reported
that coagulation enabled the formation of a porous
cake layer of flocs and reduced membrane fouling [5].
The porosity of a cake layer depends on the flocs’
characteristics, such as irregularity and size, and the
flocs’ stabilities within a rectangular channel with a
feed spacer that are affected by cross-flow-induced
shear stress [5]. Conventional mineral coagulants such
as Fe3+ may in some cases decrease fouling resistance
of the membrane [16,17]. In addition, Al3+ and Fe3+
form less stable flocs that can be easily broken at the
membrane’s surface [5]. The polyelectrolytes used as
coagulants form shear stress-resistant flocs; however,
polyelectrolytes could potentially adsorb on the polymeric membrane surface and induce severe fouling
[5]. Al3+ was found to be a fair coagulant [15],
especially if the same amount was in two steps [13].
During the second step, Al(OH)3(s) precipitate was
formed which enabled the formation of irregular flocs
which later on formed porous cake layer on the membrane surface.
Electrocoagulation would appear as fairly good
pre-treatment to filtration of cutting-oils [18–20], as
compared to the conventional dosing of Al3+, under
the influence of an electric current, electrocoagulation
produces metallic ions (Al3+) in situ, by the electrochemical dissolution of electrode (anode). Dissolution
of aluminium is always paired with the instant formation of OH− and an increase in pH, resulting with the
continuous formation of Al(OH)3(s). It has been suggested by some authors that EC should be used as a
pre-treatment to MF, as it generates coagulants in situ,
and thus reduces the chemical coagulant requirements
[18,21] as well as it offers shorter coagulation times
(faster particle growth) of irregularly formed flocs
[22,23]. In other words, there is no need for two stage
—conventional coagulation as Al(OH)3(s) precipitate is
continuously formed in situ [24]. In addition, electrocoagulation may act beneficially in other ways and
reduce the concentration of heavy metals and the
chemical oxygen demand of the feed [25].
The main drawback of MF of cutting-oils is the flux
reduction which is usually caused by the cake layer
resistance. One of the ways to decrease the cake layer
resistance is to increase the water permeability of the
cake layer. Water permeability of the cake layer
increases when the cake layer is formed of irregularly
shaped flocs. The novelty of this study is in investigation of electrocoagulation as a pre-treatment to the MF
of the cutting-oil emulsions. More detailed, the impacts
of EC time on zeta potential and average particle size of
cutting-oil emulsions on the efficiency of microfiltration
were evaluated. Model cutting-oil emulsions and membrane were characterised using experimentally obtained
drop size distribution and zeta potential (ζ) of a model
emulsion and scanning electron microscope (SEM).
2. Materials and methods
2.1. Cutting-oil emulsion
The model cutting-oil emulsion was prepared by
mixing commercial cutting-oil (Die-Lubric 7050) and
deionised water. Commercial cutting-oil concentrate
is, as its major part, made of polysiloxane. Its physical
properties are; white colour, pH 9.5, density of
0.994 g mL−1 and dynamic viscosity of 0.0018 Pa s. The
volume percentages of model cutting-oil emulsions in
water were 0.1, 0.5 and 1% (v/v). The pH values of
the model cutting-oil emulsions were between 6 and
7.5, depending on concentration. The conductivity of
the emulsions was around 700 μS/cm.
2.2. Membrane characterisation: swelling, SEM and zeta
potential measurements
A flat sheet polymeric (regenerated cellulose (RC)
—UC030) membrane was kindly supplied by MICRODYN-NADIR GmbH (Wiesbaden, Germany). UC030
was selected due to its high water flux and good fouling resistance to organics [4].
Membrane swelling, i.e. water content of the RC
membrane was determined in two ways;
(1) three-dimensional (3D) measurements of heights
(dz), widths (dy) and lengths (dx) of dry and wet
samples, using precise digital calliper (Neiko
01407A) with an accuracy of ±0.01 mm, and
(2) from the difference in mass (m) of the dry and
wet membrane samples. The readability of used
digital analytical balance (KERN ALS 220-4,
Balingen, Germany) was 0.0001 g with accuracy
of ±0.0001 g.
J.K. Milic´ et al. / Desalination and Water Treatment
3
Briefly, the measurements were performed as follows;
Downloaded by [Faculty of Chemical Eng & Tech], [Krešimir Košuti] at 03:13 30 April 2015
(1) measuring of height, weight, length and the
mass of dry membrane samples (5 × 5 mm2),
(2) wetting the dry membrane samples in deionised water for two hours, and
(3) removal of the excess deionised water with a
dry paper towel and the repetition of step (1)
for wet membrane samples.
U¼
mwet mdry
mwet
(1)
The average swelling, Φ, is calculated using Eq.
(5). The swelling in each of the three dimensions was
estimated using the expression found below.
Ux;y or z ¼
dx;y or z wet dx;y or z dry
100
dx;y or z wet
(2)
A SEM (VEGA 3 SEM, TESCAN, a.s., Czech
Republic) was used to estimate the pore size of the RC
membrane. SEM images were recorded at 10 random
50 × 50 μm2-sized surfaces of five different samples of
RC membrane. Each of the five samples was taped to a
stainless steel stub by carbon tape and placed into an ion
sputter within an atmosphere of argon, where a thin
layer of gold was deposited on each membrane’s surface
at 18 mA for 60 s. The samples were imaged at 5 kV at a
working distance of about 5 mm and beam intensity of
10, thus achieving magnifications of up to 18,000 times.
The above-described conditions allowed the measuring
of pore sizes up to 5,000 nm, which was of practical use
for the examined RC MF membrane. The pores’ sizes
were measured using VEGA built-in software.
The streaming current measurements were done using
an electrokinetic analyser (SurPASS, Anton Paar
GmbH, Austria) equipped with a cylindrical cell,
where pieces of membrane (2r > 25 μm) were mounted
into the measuring cell. The standard 0.001 mol L−1
solution of KCl was used as electrolyte in our experiments. Before each measurement, sample was rinsed
with 0.001 mol L−1 solution of KCl. The zeta potential
dependence on pH was studied within the range pH
3–10. pH was changed by adding drops of mol L−1
HCl or 0.1 mol L−1 NaOH. The zeta potential (ζ) was
calculated from the measured streaming potential
using the Fairbrother–Mastin equation, which takes
into account any surface conductivity [2].
2.3. Electrocoagulation
Electrocoagulation was performed within a cylindrical batch reactor with 1 L of model emulsion using
Fig. 1. Schematic representation of electrocoagulation [34].
aluminium electrodes. The active surfaces of two electrodes were 4 × 5 cm2 whilst the distance between the
electrodes was fixed at 1 cm. The electrical current
was maintained at a constant value I = 200 mA, which
was found optimal current regarding the conductivity
of the emulsions. The model emulsion was stirred
during the experiment using a mechanical stirrer with
a constant rotational speed of 200 rpm. The model
emulsion’s thermostat was at 25.0 ± 0.1˚C during all
30 min of the EC (Fig. 1). The electrodes were cleaned
after every EC experiment using wet “Si–C” paper
until the surface appeared smooth, in order to reduce
passivation and remove oil deposition [26]. The oil
layer induced by flotation remained non-skimmed and
the whole model cutting-oil emulsion was moved to
MF and filtered after 5, 10, 15 and 30 min of EC.
2.4. Microfiltration
Microfiltration experiments were performed within
a cross-flow Sepa CF II cell (Sterlitech Corporation,
USA) of a membrane area of 0.0138 m2 and channel
dimensions of 14.5 × 9.5 × 0.17 cm3 (length × width ×
height). A feed spacer was used to improve the
hydrodynamics in the channel. The feed from a 5 L
tank was circulated through the cell at a flow rate of
3 L/min (cross-flow velocity 0.32 m/s) by means of a
Hydracell DO3SASGSSSCA pump driven by a
variable-speed motor (Wanner Engineering Inc.,
Minneapolis, USA). This cross-flow velocity was found
optimal as it gives minimal concentration polarisation
at minimum pressure drop. All microfiltration experiments were carried out at a constant temperature of
25.0 ± 0.1˚C, using a thermostat and a Danfoss XG10
heat exchanger.
At the beginning of each experiment, the flux was
stabilised at 2 bar for 3 h with DI water until a steady
J.K. Milic´ et al. / Desalination and Water Treatment
Downloaded by [Faculty of Chemical Eng & Tech], [Krešimir Košuti] at 03:13 30 April 2015
4
state was reached. The pressure during all the experiments was set at 1 bar. Firstly, the initial DI water flux
Jwi, L/(m2 h−1) was measured by collecting and measuring the permeate volume over a certain time and
dividing it by a nominal membrane surface. Then the
tank was emptied, refilled with cutting-oil emulsion
and the permeate flux Js, L m−2 h−1 was measured.
After 2 h of microfiltration, the membranes were
flushed with DI water for 20 min, and then the water
flux, Jwc, L m−2 h−1was measured. Virgin RC
membrane was used during each experiment.
The concentrations of oil in both the permeate and
retentate streams of MF were analysed using a carbon
analyser (TOC-VWS Shimadzu, Japan) in three replicates. Removal of oil from the wastewater, R, %, was
calculated on the basis of total carbon concentration,
as described below.
Cp
R¼ 1
100
Cf
(3)
In Eq. (3), Cf is the concentration of oil in the retentate
stream, mg L−1, and Cp the concentration of the oil in
the permeated stream, mg L−1.
Flux decline occurred as a result of two different
phenomena; concentration polarisation, i.e. resistance
of the cake layer, and oil adsorption/pore plugging
[8]. Therefore, it was quantified by correlating it to
specific phenomena, as described below [8,27]:
FR ¼
Jwi Js
100
Jwi
(4)
In Eq. (4), the FR %, is the total flux decline caused by
concentration polarisation, cake layer resistance and
membrane fouling, Jwi is the initial virgin membrane
flux measured with pure deionised water and Js is the
permeate flux measured with model cutting-oil
emulsion.
FRADS ¼
Jwi Jwc
100
Jwi
2.5 Particle size measurements
The particle size/oil droplets size distributions and
zeta potentials (in liquid emulsion) measurements
were performed using the Zetasizer Nano ZS instrument (Malvern Instruments, UK) equipped with
dynamic light scattering and laser Doppler micro-electrophoresis. Zeta potential measurements of the model
cutting-oil emulsions, 0.1, 0.5 and 1% (v/v), were carried out after 5, 10, 15 and 30 min of EC in order to
obtain zeta potential vs. time of EC curves.
3. Results and discussion
3.1. Membrane characterisation
Fig. 2(A) and (B) show that the UC030 membrane
has bimodal pore size distribution with two average
pore size radii, the smaller located roughly around
100 nm and bigger at about 1.5 μm. It was reported
earlier by Persson et al. that even some UF membranes had bimodal pore size distributions [28]. Both
of the average pore radii can thus play a substantial
role in transport of oil droplets over the UC030 MF
membrane. For instance, even if the sizes of the oil
particles/droplets largely exceeded the smaller pores
sizes, one could still expect a significant oil flux
through the membrane. Fig. 2(B) shows that UC030
membrane had very high porosity which, along with
bigger pores (voids), explained the extremely high
water fluxes achieved by this membrane. It should be
emphasized, however, that SEM provided information
only on surface porosity and this membrane had
asymmetric structure. For this reason, we estimated
the average pore radii from water permeability and
water content measurements, as explained below.
The water content of regenerated cellulose is presented in Table 1. It significantly swelled in water and
(5)
In Eq. (5), the FRADS % is the flux decline caused by
oil adsorption and pore plugging, and Jwc is the water
flux measured with DI after membrane was being
flushed with DI.
FRCP ¼ FR FRADS
(6)
In Eq. (6), the FRCP % is the flux decline caused by
concentration polarisation and cake layer formation.
Fig. 2. SEM image of MF membrane; (A) An example of
50 × 50 μm2 surface of MF UC030 membrane, working distance 8.48 mm, 5 kV. (B) 10 × 10 μm2, closer look at smaller
pores, working distance 8.87 mm, 5 kV.
J.K. Milic´ et al. / Desalination and Water Treatment
5
Downloaded by [Faculty of Chemical Eng & Tech], [Krešimir Košuti] at 03:13 30 April 2015
Table 1
Three-dimensional (3D), Φx, Φy and Φz, and the average swelling of the RC membrane
3D swelling
Φxyz (%)
errΦxyz (%)
Φx (%)
errΦx (%)
Φy (%)
errΦy (%)
Φz (%)
errΦz (%)
24.93
10.35
3.67
1.43
1.42
0.51
19.84
8.40
Swelling measured by mass
Φ
errΦ
0.3459
0.0065
it three dimensionally shrank (Table 1) 20% in height,
1% in width and 4% in length. During the production
and phase inversion of RC [31], a fast evaporation of
the solvent might have occurred expanding the membrane structure in the x, y and z directions that after
being equilibrated in water collapsed and shrank.
Average pore radius in the wet state was estimated
from pure water permeability using the relationship
proposed below [29].
Lp dzwet ¼
br2p U
ga
(7)
In Eq. (7), Lp, m Pa−1 s−1 is the pure water permeability,
rp, m is the pore radius, η, Pa s dynamic viscosity of the
water, dz wet, m is the measured swollen thickness of the
membrane, Φ is the water content assumed to be equal
to porosity and α tortuosity. Tortuosity may be estimated using its dependence on porosity (water content)
given by Torquato [30]. Parameter b is a geometric
parameter that depends on the pore geometry, and
Torquato [30] suggests b = 1/8 for random porous
media. An average hydraulic pore radius calculated
using Eq. (7) was 82 nm, and is in fairly close agreement
with Fig. 2, along with some other studies which examined membranes made of regenerated cellulose [31,32].
Fig. 3 shows the variation of the MF membrane
zeta potential with the pH. It is noticed that UC030
membrane is negatively charged even at very low pH,
which is unlikely to be the property of the pure
regenerated cellulose. Even though manufacturer
declared that UC030 membrane tested was made of
regenerated cellulose (cellulose II), it is likely that they
used the chemical post-treatment of RC that added
acidic functional groups which now act as proton
donor groups. The negative charge of MF membrane,
i.e. dissociation of the acidic groups, was increased
with the pH and showed a constant negative value at
higher pH. Nevertheless, the amount of fixed charge
on the RC membrane could be very small, as
measured by Ramos et al. [33].
Fig. 3. Membrane zeta potential vs. pH.
3.2. The effect of electrocoagulation time on zeta potential
and particle size in emulsions
In order to facilitate the following discussion, the
reactions occurring at the electrodes are just briefly
presented and discussed [23,34].
ðÞ : 2H2 O þ 2e ! H2ðgÞ þ 2OH
ðaqÞ
(8)
ðþÞ : 2H2 O ! O2ðgÞ þ 4Hþ
ðaqÞ þ 4e
(9)
ðþÞ : AlðsÞ ! Al3þ
ðaqÞ þ 3e
(10)
The cathode produces hydrogen gas and hydroxyl
ions (Eq. (8)) and the anode produces oxygen gas and
aluminium ions (Eqs. (9) and (10)). Both hydrogen
and oxygen gases are causing flotation and are able to
partially remove some volatile pollutants from emulsions, if they exist [34,35]. During the time of EC,
Al3þ
ðaqÞ hydrolyse forming di-charged, single charged
and neutral aluminium hydroxide species, Al(OH)2þ
ðaqÞ ,
Al(OH)2+(aq) and Al(OH)3(s), respectively. Other complexes also occur, but we assume our emulsion was in
Downloaded by [Faculty of Chemical Eng & Tech], [Krešimir Košuti] at 03:13 30 April 2015
6
J.K. Milic´ et al. / Desalination and Water Treatment
its major proportion dominated by the aluminium species mentioned above [34]. The initial pH of the model
emulsions was within the range 6.0–7.5 (Fig. 4), suggesting that the dominant species under our experimental conditions was Al(OH)3(s). At this pH range of
model emulsions, other charged aluminium species
also exist, yet in 10–100 times smaller concentrations,
as explained by Holt et al. [34] and Harif et al. [23].
Al(OH)3(s) bridges the negative oil particles inducing coagulation and formation of irregular and porous
flocs [22,23]. It stabilised the pH at 8, (Fig. 4) preventing the creation of AlðOHÞ
4 species that would restabilise emulsion [34]. The initial values of zeta potential
(see Fig. 5(A)) of our emulsions corresponded to the
measured initial pH, i.e. to the concentrations of the
cutting-oils, −20 and −25 mV for the 0.1% for the 1%,
respectively. The major part of emulsions represents
Fig. 4. Change in pH over the time of EC, for three different concentrations of model emulsions.
polysiloxanes, which are known proton donors and
are negatively charged in water solutions.
Fig. 5(A) shows the change of the zeta potential
with the time of EC of three different cutting-oil emulsions. Current in our measurements was 0.2 A (100 A
m−2), therefore the concentration of Al which dissolved
during the electrolysis, assuming 100% yield of current, may be calculated from Faraday’s law and written as C (Al3+)/mg L−1 = 1.86 × 10⁻²/mg L−1 s−1 × t/s.
One can easily calculate that 33 mg of Al was necessary to completely destabilise 1 mg of cutting-oil in the
0.1% emulsion (destabilisation of 0.1% emulsion
occurred after 30 min = 1,800 s). The zeta potential of
the 0.1% model emulsion was significantly affected by
the time of EC, i.e. the dissolved aluminium concentration. For instance, for a 0.1% emulsion only small concentration of the dissolved positively charged Al
species was enough to neutralise the negative charge
with substantial destabilisation occurring after only
15 min of EC. In the same manner, one may see that
330 mg of Al would have been necessary for the complete destabilisation of 1% emulsion (10 mg of oil)
which would have been occurred after 285 min, which
would have been obviously impractical and expensive.
Because of long EC time of 1% emulsion, we focused
to find the minimum time of EC that would
significantly improve the MF performance.
Fig. 5(B) shows an increase in oil droplet/particle
sizes with the EC time for all three concentrations of
model cutting-oil emulsions. The particle growth
trends of the cutting-oil suspensions were similar to
recently reported kaolin suspensions’ growth profiles,
at a similar initial pHs [23]. Fortuitously, all emulsions
showed a significant difference in charge neutralisation and particle growth trends with the time of EC.
The charge was neutralised slowly, showing slow and
Fig. 5. The zeta potential and particle size measurements in dependence of the time of EC: (A) Change in the average
zeta potential obtained from three independent measurements of model emulsions; (B) Increase in oil droplet/particle
size as an average of three independent measurements.
Downloaded by [Faculty of Chemical Eng & Tech], [Krešimir Košuti] at 03:13 30 April 2015
J.K. Milic´ et al. / Desalination and Water Treatment
monotonic growth and the particle growth was faster.
This suggests that the particle growth is less dependent on the concentration of charged species and zeta
potential of the emulsions and more dependent on the
concentration of the precipitated Al(OH)3(s), which
was the dominant species. It is likely that Al(OH)3(s)
bridged the oil particles [18,23]; however, it had only
slightly affected the overall zeta potential (charge) of
the emulsions. Zeta potential was affected by positively charged aluminium species, particularly Al3+,
+
Al(OH)2þ
ðaqÞ and Al(OH)2 (aq), that exist in lower concentrations [34]. These lower concentrations of charged
aluminium species were large enough to affect the
charge of the 0.1% emulsions, nevertheless they just
slightly affected the charge of 0.5 and 1.0% emulsions,
as indicated in Fig. 5(A).
The most important observation from Fig. 4(B) is
that larger particles started to form after only 10 min
of EC, even for higher concentrations of the cutting-oil
emulsions. Apparently, 10 min of EC (11 mg of Al)
was sufficient enough to increase the average particle
radii above the average pore radii of the MF membrane considered here. A slight increase in the average
particle radii was sufficient to significantly improve
MF performance, as will be shown below. The above
presented data on the average particle and pore radii
are used in the following sections to facilitate the
interpretation of MF results.
3.3. Microfiltration of cutting-oil emulsions without and
with EC pre-treatment
Fig. 6 summarises the flux decline data that had
been measured and calculated using Eqs. (4)–(6). The
concentration of cutting-oil in the emulsion had a significant effect on the permeate flux. Flux decline at
t = 0 min represented MF without EC as a pre-treatment and it is briefly discussed before addressing the
EC enhanced MF. At t = 0, the highest 1.0% model
emulsion caused the highest total flux decline (FR),
whereas the lowest 0.1% emulsion caused smaller, yet
substantial flux decline FR ≈ 65%. The total flux
decline in cross-flow MF is caused by two independent phenomena; concentration’s polarisation, i.e. cake
layer formation, and adsorption, i.e. pore clogging. In
Fig. 6, the upper parts of the three columns designated
for the time of EC present the flux decline caused by
clogging, FRADS, and the lower parts of the columns
represent flux decline caused by the concentration’s
polarisation, FRCP.
FRCP correlated with the concentration of oil. At
the low concentrations of the oil (0.1%), FRCP was
about 13% and rose up to a maximum and constant of
35% for both higher concentrations of oil (0.5 and
7
100
1 % ADS
1 % CP
80
0.5 % ADS
0.5 % CP
0.1 % ADS
60
0.1 % CP
FR [%]
40
20
0
0
5
10
15
30
t (EC) [ min]
Fig. 6. MF flux decline, without EC pre-treatment (t = 0),
and versus the time of EC pre-treatment.
1.0%). Fig. 6 apparently suggests that at higher concentrations of oil [10], 0.5 and 1.0% emulsions, respectively, a cake layer formed at the membrane’s surface
that increased the specific resistance to its maximum
value and caused a constant maximum of FRCP ≈ 35%.
Flux decline caused by pore clogging, FRADS, was
independent of the concentration of oil in the model
emulsions and fairly constant at about 45%. The highest number of membrane pores (Fig. 2(B)) were larger
or of similar size to the average colloidal particles
(Fig. 5(B)) allowing the oil particles to enter the pores
causing pore clogging [3,9]. This implies that a small
concentration of the colloidal particles in water was
sufficient enough to clog the membrane pores and
cause irreversible fouling. FRADS obviously dominated
the total flux decline in the MF of the cutting-oils and
its contribution to FR was much larger than FRCP, at
any concentration of the model oil emulsions. When
EC was used as a pre-treatment for MF feed, after
only 10 min, a sharp decrease in FRADS may be
noticed. Improved MF performance in terms of
reduced FRADS was in fairly close agreement with the
average pore and particle radii correlations with the
time of EC, as presented in previous section.
For the 0.1% model, emulsion FRADS completely
disappeared after only 5 min of EC whilst the remaining flux decline was caused solely by the concentration’s polarisation i.e. cake layer. The reason for the
complete disappearance of FRADS was obviously
related to the rapid growth of the oil droplets during
EC (Fig. 5(B)). Fig. 6 implies that FRADS could be completely eliminated even at higher concentrations of
model cutting-oil emulsions by using 30 min of EC,
Downloaded by [Faculty of Chemical Eng & Tech], [Krešimir Košuti] at 03:13 30 April 2015
8
J.K. Milic´ et al. / Desalination and Water Treatment
which is large improvement compared to 285 min that
was expected to completely destabilise the emulsion.
Interestingly, 30 min of EC completely eliminated
FRCP for the lowest concentrations of oils whilst the
FRCP of 0.5 and 1.0% model emulsions was reduced
significantly, almost by four times. Recently, Harif
et al. [17,23] reported that flocs generated during the
process of electrocoagulation are irregular in shape
and porous. The EC constantly provided freshly
formed aluminium hydroxides (see Section 3.2.) which
generated highly porous and irregularly formed flocs,
as measured by Harif et al. [23]. The oil particles
aggregate with Al(OH)3(s) forming irregular floccules
that form truly porous cake layers of high water
permeability [5,13,23]. This explains the big decrease
in total FR noticed in Fig. 6. EC enhanced MF—improved removal of oil.
Fig. 7 summarises the measured rejections at three
different concentrations of model cutting-oil emulsions
vs. the pre-treatment time. At t = 0, EC was not used
as a pre-treatment and it could be noticed that the
rejection of oil by the RC membranes increased with
the concentration of cutting-oils, by up to 70% for the
highest concentration used. Given that the membrane
zeta potential was negative and constant at the corresponding working pH (Fig. 3) and the initial model
emulsion zeta potentials were fairly similar (Fig. 5(A)),
it may be deduced that the dominant mechanism during rejection was sieving, i.e. steric exclusion.
Previous sections showed that the average particle
radii are similar to the average pore radii yet the measured rejection was lower than expected, especially at
low concentrations of cutting-oils. Poor removal of oil
could be as a major proportion attributed to the
relatively large number of bigger pores (voids,
Fig. 2(B)) which significantly contributed to the overall
oil transport through the membrane.
Using EC as a pre-treatment, the particles aggregated forming larger particles that enabled higher
removal of oil and better permeate quality. At 0.1% of
cutting-oil, the removal of oil increased by about 10%
after only 10 min of EC, and then it dropped down to
almost initial removal with further EC. It is well established that the stabilities of the floccules are highly
affected by the shear stress which is herein imposed by
the cross-flow velocity in the rectangular channel and
spacer which covered MF membrane [5]. The stabilities
of the floccules, formed by the mineral coagulants (aluminium or ferric ions) are, in general, lower than those
bridged over polymeric coagulant [5]. This study did
not check the stabilities and the sizes of the flocs under
the shear stress within membrane unit. Nevertheless,
some reasonable assumptions may explain the trends
in Fig. 7. These assumptions are based on our experimental data and some previously reported work [5].
The UC030 membrane is bimodal, and whilst average
particle radii are bigger than majority of pores, they
are not bigger than the defects. The trend of the measured rejection in Fig. 7 suggests that only a small fraction of the oil particles become really large flocs, bigger
than the membrane defects and thus retained this way
increasing the overall removal of oil. Further increase
in the floc size, related to the time of EC, probably
resulted with the less stable flocs that destabilised
under shear stress and broke into smaller flocs. Harif
et. al. [23] indeed reported that Al(OH)3(s) forms very
fragile flocs which could explain the sudden drop of
rejection after 15 min of EC.
Increase in the sizes of the flocs was obviously
beneficial for the reduction of clogging in smaller
pores. In general, it may be deduced that the smaller
pores poorly contributed to the transport of oil. This
assumption was particularly valid for 0.1% model
emulsions where 5 min of EC was enough to completely stop the pore clogging. The above-proposed
explanation could realistically hold, as it explains the
trends presented in Fig. 7 and it is in close agreement
with previous studies [5,23].
4. Conclusions
Fig. 7. MF removal of oil, R, depending on the time of EC
used as a pre-treatment.
The total flux decline in MF of cutting-oils was in
major part dominated by the pore clogging that was
independent on the cutting-oil concentration and significantly high. The shorter time of EC pre-treatment,
10 min, or only 11 mg of dissolved Al, was sufficient
to significantly reduce pore clogging, even for higher
concentrations of cutting-oil emulsions.
J.K. Milic´ et al. / Desalination and Water Treatment
Downloaded by [Faculty of Chemical Eng & Tech], [Krešimir Košuti] at 03:13 30 April 2015
The EC pre-treatment induced the formation of
highly permeable and porous cake layer on membrane
surface. In the case of higher concentration model cutting-oils’ emulsions, EC pre-treatment improved the
cake layer water permeability by four times. The substantial improvement in the overall MF flux was in
major part attributed to the continuous formation of
Al(OH)3(s) as it formed cake layer made of porous and
irregularly shaped flocs.
Acknowledgement
This work was supported by the Slovenian
Research Agency (P2-0032), Ceepus Network program
(CIII-SI-0708-01-1213-M-60450), and the Croatian Ministry of Science, Education and Sports through Project
125-1253008-3009 “Membrane and adsorption processes for removal of organic compounds in water
treatment”. The authors are grateful to Mr Werner
Ruppricht representing MICRODYN-NADIR GmbH
(Wiesbaden, Germany) for kindly supplying the
microfiltration membrane used in this study.
List of symbols
ζ
R
Cp
Cf
FR
FRADS
FRCP
Jwi
Js
Jwc
Ф
Фx,y or
mwet
mdry
dwet
ddry
I
t
z
— zeta potential
— rejection of oil by a microfiltration
membrane
—
total carbon concentration in the
permeate (mg dm−3)
—
total carbon concentration in the
feed (mg dm−3)
— the total flux decline
— flux decline caused by adsorption and
pore clogging
— flux decline caused by concentration
polarisation and cake layer formation
— initial virgin membrane flux measured
with deionised water (m s−1)
— flux measured with model cutting-oil
emulsion (m s−1)
— flux that was measured with deionised
water after the membrane had been
flushed with deionised water (m s−1)
— average swelling
— swelling in x, y or z direction
— mass of wet membrane sample (g)
— mass of dry membrane sample (g)
— height of wet membrane sample (mm)
— height of dry membrane sample (mm)
— the current used in electrocoagulation (A)
— time of the electrocoagulation (min)
9
References
[1] M. Gra¨fen, K. Hesse, D. Pollkla¨sner, W. Baumann,
Generic scenario for the impact of cooling lubricants
into the hydrosphere, Environ. Sci. Pollut. Res. 10
(2003) 301–307.
[2] P. Can˜izares, F. Martı´nez, J. Lobato, M.A. Rodrigo,
Break-up of oil-in-water emulsions by electrochemical
techniques, J. Hazard. Mater. 145 (2007) 233–240.
[3] N. Hilal, G. Busca, F. Talens-Alesson, B.P. Atkin,
Treatment of waste coolants by coagulation and membrane filtration, Chem. Eng. Process. 43 (2004)
811–821.
[4] J. Krizˇan, A. Muric´, I. Petrinic, M. Simonic, Recent
developments in membrane treatment of spent cutting-oils: A review, Ind. Eng. Chem. Res. 52 (2013)
7603–7616.
[5] E. Barbot, S. Moustier, J.-Y. Bottero, P. Moulin, Coagulation and ultrafiltration: Understanding of the key
parameters of the hybrid process, J. Membr. Sci. 325
(2008) 520–527.
[6] B. Chakrabarty, A.K. Ghoshal, M.K. Purkait, Ultrafiltration of stable oil-in-water emulsion by polysulfone
membrane, J. Membr. Sci. 325 (2008) 427–437.
[7] N. Hilal, G. Busca, N. Hankins, A.W. Mohammad, The
use of ultrafiltration and nanofiltration membranes in
the treatment of metal-working fluids, Desalination
167 (2004) 227–238.
[8] H.J. Li, Y.M. Cao, J.J. Qin, X.M. Jie, T.H. Wang, J.H.
Liu, Q. Yuan, Development and characterization of
anti-fouling cellulose hollow fiber UF membranes for
oil–water separation, J. Membr. Sci. 279 (2006)
328–335.
[9] A. Salahi, M. Abbasi, T. Mohammadi, Permeate flux
decline during UF of oily wastewater: Experimental
and modeling, Desalination 251 (2010) 153–160.
[10] G. van den Berg, I. Ra´cz, C. Smolders, Mass transfer
coefficients in cross-flow ultrafiltration, J. Membr. Sci.
47 (1989) 25–51.
[11] V. Gekas, B. Hallstro¨m, Mass transfer in the membrane concentration polarization layer under turbulent
cross flow: I. Critical literature review and adaptation
of existing sherwood correlations to membrane operations, J. Membr. Sci. 30 (1987) 153–170.
[12] R.S. Faibish, Y. Cohen, Fouling and rejection behavior
of ceramic and polymer-modified ceramic membranes
for ultrafiltration of oil-in-water emulsions and
microemulsions, Colloid. Surf. A 191 (2001) 27–40.
[13] T. Liu, Z.-L. Chen, W.-Z. Yu, J.-M. Shen, J. Gregory,
Effect of two-stage coagulant addition on coagulationultrafiltration process for treatment of humic-rich
water, Water Res. 45 (2011) 4260–4268.
[14] J. Zhong, X. Sun, C. Wang, Treatment of oily
wastewater produced from refinery processes using
flocculation and ceramic membrane filtration, Sep.
Purif. Technol. 32 (2003) 93–98.
[15] G. Sharma, H.K. Shon, R. Aryal, S. Phuntsho, Performance evaluation of microfiltration with electrocoagulation and chemical coagulation pretreatment,
Desalin. Water Treat. 34 (2011) 141–149.
[16] C. Guigui, J.C. Rouch, L. Durand-Bourlier, V.
Bonnelye, P. Aptel, Impact of coagulation conditions
10
[17]
[18]
[19]
Downloaded by [Faculty of Chemical Eng & Tech], [Krešimir Košuti] at 03:13 30 April 2015
[20]
[21]
[22]
[23]
[24]
[25]
[26]
J.K. Milic´ et al. / Desalination and Water Treatment
on the in-line coagulation/UF process for drinking
water production, Desalination 147 (2002) 95–100.
V. Lahoussine-Turcaud, M.R. Wiesner, J.-Y. Bottero,
Fouling in tangential-flow ultrafiltration: The effect of
colloid size and coagulation pretreatment, J. Membr.
Sci. 52 (1990) 173–190.
T. Harif, A. Adin, Characteristics of aggregates formed
by electroflocculation of a colloidal suspension, Water
Res. 41 (2007) 2951–2961.
C.-L. Yang, Electrochemical coagulation for oily water
demulsification, Sep. Purif. Technol. 54 (2007) 388–395.
V.V. Keerthi, N. Balasubramanian, Electrocoagulationintegrated hybrid membrane processes for the treatment of tannery wastewater, Environ. Sci. Pollut. Res.
20 (2013) 7441–7449.
D. Kumarasinghe, L. Pettigrew, L.D. Nghiem,
Removal of heavy metals from mining impacted water
by an electrocoagulation-ultrafiltration hybrid process,
Desalin. Water Treat. 11 (2009) 66–72.
O. Sahu, B. Mazumdar, P.K. Chaudhari, Treatment of
wastewater by electrocoagulation: A review, Environ.
Sci. Pollut. Res. 21 (2014) 2397–2413.
T. Harif, M. Khai, A. Adin, Electrocoagulation versus
chemical
coagulation:
Coagulation/flocculation
mechanisms and resulting floc characteristics, Water
Res. 46 (2012) 3177–3188.
P. Can˜izares, F. Martı´nez, C. Jime´nez, C. Sa´ez, M.A.
Rodrigo, Coagulation and electrocoagulation of oil-inwater emulsions, J. Hazard. Mater. 151 (2008) 44–51.
A.K. Yadav, L. Singh, A. Mohanty, S. Satya, T.R.
Sreekrishnan, Removal of various pollutants from
wastewater by electrocoagulation using iron and
aluminium electrode, Desalin. Water Treat. 46 (2012)
352–358.
P.K. Holt, Electrocoagulation: Unravelling and synthesising the mechanisms behind a water treatment
[27]
[28]
[29]
[30]
[31]
[32]
[33]
[34]
[35]
process, Doctoral thesis, Faculty of Engineering, The
University of Sydney, 2006.
Y.-Q. Wang, T. Wang, Y.-L. Su, F.-B. Peng, H. Wu,
Z.-Y. Jiang, Remarkable reduction of irreversible fouling and improvement of the permeation properties of
poly(ether sulfone) ultrafiltration membranes by
blending with pluronic F127, Langmuir 21 (2005)
11856–11862.
K.M. Persson, V. Gekas, G. Tra¨ga˚rdh, On the presence
of double log-normal permeability distributions in
ultrafiltration membranes, J. Membr. Sci. 93 (1994)
105–113.
S. Bason, Y. Kaufman, V. Freger, Analysis of ion transport in nanofiltration using phenomenological coefficients and structural characteristics, J. Phys. Chem. B
114 (2010) 3510–3517.
S. Torquato, Random Heterogeneous Materials:
Microstructure and Macroscopic Properties, Springer,
New York, NY, 2002.
M. Al Manasrah, M. Kallioinen, H. Ilvesniemi, M.
Ma¨ntta¨ri, Recovery of galactoglucomannan from wood
hydrolysate using regenerated cellulose ultrafiltration
membranes, Bioresour. Technol. 114 (2012) 375–381.
J. Wagner, Membrane Filtration Handbook: Practical
Tips and Hints, Osmonics, Cambrige, 2001.
J. Ramos, C. Milano, V. Romero, S. Escalera, M. Alba,
M. Va´zquez, J. Benavente, Water effect on physical–
chemical and elastic parameters for a dense cellulose
regenerated membrane: Transport of different aqueous
electrolyte solutions, J. Membr. Sci. 352 (2010) 153–159.
P.K. Holt, G.W. Barton, C.A. Mitchell, The future for
electrocoagulation as a localised water treatment technology, Chemosphere 59 (2005) 355–367.
E. Ofin, Y. Oren, A. Adin, Electroflocculation: The
effect of zeta-potential on particle size, Desalination
204 (2007) 33–38.


© Copyright 2026