
Agenda - Board of Trustees - Florida International University
FLORIDA INTERNATIONAL UNIVERSITY BOARD OF TRUSTEES FINANCE AND AUDIT COMMITTEE Thursday March 26, 2015 10:00 am * approximate start time Florida International University Modesto A. Maidique Campus Graham Center Ballrooms Committee Membership: Sukrit Agrawal, Chair; Cesar L. Alvarez; Gerald C. Grant, Jr.; Natasha Lowell; Justo L. Pozo; Kathleen L. Wilson Liaison: Richard Brilliant, Foundation Board of Directors AGENDA 1. Call to Order and Chair’s Remarks Sukrit Agrawal 2. Approval of Minutes Sukrit Agrawal 3. Discussion Items (No Action Required) 3.1 Update on Florida Board of Governors Audit and Compliance Committee Workshop 3.2 Review of FIU Financial Statement Audit for Fiscal Year Ended June 30, 2014 3.3 Office of Internal Audit Status Report 3.4 Financial Performance Review – Second Quarter 2015 3.5 University Compliance Report 3.6 Miss Universe Final Report Gerald C. Grant, Jr. Kenneth A. Jessell Allen Vann Kenneth A. Jessell Karyn Boston Kenneth A. Jessell 4. Reports (For Information Only) 4.1 Treasury Report 4.2 Business Services Report Phong Vu Aime Martinez The Florida International University Board of Trustees Finance and Audit Committee Agenda March 26, 2015 Page 2 4. Reports (Continued…) Pete Garcia 4.3 Athletics Update 4.4 Emergency Management Status Report Ruben D. Almaguer 4.5 Safety and Environmental Compliance Report Ruben D. Almaguer John Cal 4.6 Facilities and Construction Update 4.7 Foundation Report Richard Brilliant 5. New Business 5.1 Office of Internal Audit Discussion of Audit Processes 6. Concluding Remarks and Adjournment Sukrit Agrawal Sukrit Agrawal The next Finance and Audit Committee Meeting is scheduled for Wednesday, June 3, 2015 Agenda Number: 2.0 Title: Approval of Minutes Date: March 26, 2015 Proposed Committee Action: Approval of Minutes of the Finance and Audit Committee meeting held on Wednesday, January 14, 2015 at the FIU, Modesto A. Maidique Campus, Graham Center Ballrooms. Background Information: Committee members will review and approve the Minutes of the Finance and Audit meeting held on Wednesday, January 14, 2015 at the FIU, Modesto A. Maidique Campus, Graham Center Ballrooms. DRAFT FLORIDA INTERNATIONAL UNIVERSITY BOARD OF TRUSTEES FINANCE AND AUDIT COMMITTEE MINUTES JANUARY 14, 2015 1. Call to Order and Chair’s Remarks The Florida International University Board of Trustees’ Finance and Audit Committee meeting was called to order by Committee Chair Sukrit Agrawal at 9:36 am on Wednesday, January 14, 2015, at the Modesto A. Maidique Campus, Graham Center Ballrooms. The following attendance was recorded: Present Sukrit Agrawal, Chair Robert T. Barlick, Jr., Vice Chair Gerald C. Grant, Jr. Kathleen L. Wilson Excused Cesar L. Alvarez Trustees Jorge L. Arrizurieta and Alexis Calatayud and University President Mark B. Rosenberg were also in attendance. Committee Chair Agrawal welcomed all Trustees, faculty and staff to the meeting. 2. Approval of Minutes Committee Chair Agrawal asked that the Committee approve the Minutes of the meetings held on September 10, 2014 and November 17, 2014. A motion was made and passed to approve the Minutes of the Finance and Audit Committee Meetings held on Wednesday, September 10, 2014 and Monday, November 17, 2014. 3. Action Items FA1. FIU Direct Support Organizations Financial Audits, FY2013-14 Senior Vice President of Administration and Chief Financial Officer Kenneth A. Jessell presented the FIU Direct Support Organizations FY 2013-14 Financial Audits for Committee review. He reported that Marcum, LLP performed the financial audits for: the FIU Foundation, Inc.; the FIU Research Foundation, Inc.; the FIU Athletics Finance Corp; and the FIU Academic Health Center Health Care Network Faculty Group Practice, Inc. He noted that the audits were conducted in accordance with auditing standards generally accepted in the United States of America and the standards applicable to financial audits contained in the Government Auditing Standards. He further reported that the results of the respective audits did not identify any deficiencies in internal control 1 Florida International University Board of Trustees Finance and Audit Committee Minutes January 14, 2015 Page | 2 DRAFT over financial reporting that were considered to be material weaknesses. He added that the results of the audits disclosed no instances of noncompliance or other matters that are required to be reported under Government Auditing Standards. FA1-A. FIU Foundation, Inc. Sr. VP and CFO Jessell noted that the FIU Foundation, Inc. Board of Directors approved the 201314 financial audit at its October 25, 2014 meeting and was submitting the audit to the Board of Trustees for approval. A motion was made and passed that the FIU Board of Trustees Finance and Audit Committee recommend for Board of Trustees’ approval the FIU Foundation, Inc., Financial Audit for the 201314 fiscal year and authorize the CEO of the FIU Foundation, Inc. to take all actions necessary pertaining to this Financial Audit, including filing the report with the Auditor General. FA1-B. FIU Research Foundation, Inc. Sr. VP and CFO Jessell noted that the FIU Research Foundation, Inc. Board of Directors approved the 2013-14 financial audit at its November 13, 2014 meeting and was submitting the audit to the Board of Trustees for approval. He stated that Marcum LLP did not audit the financial statements of the FIU Research iWASH Initiative Limited, a component unit of the Research Foundation, noting that those financial statements were audited by KPMG Certified Public Accountants, in accordance with International Standards on Auditing. A motion was made and passed that the FIU Board of Trustees Finance and Audit Committee recommend for Board of Trustees’ approval the FIU Research Foundation, Inc. Financial Audit for the 2013-14 fiscal year and authorize the Executive Director of the FIU Research Foundation, Inc. to take all actions necessary pertaining to this Financial Audit, including filing the report with the Auditor General. FA1-C. FIU Athletics Finance Corporation Sr. VP and CFO Jessell noted that the FIU Athletics Finance Corporation Board of Directors approved the 2013-14 financial audit at its October 21, 2014 meeting and was submitting the audit to the Board of Trustees for approval. A motion was made and passed that the FIU Board of Trustees Finance and Audit Committee recommend for Board of Trustees’ approval the FIU Athletics Finance Corporation Financial Audit for the 2013-14 Fiscal Year and authorize the Executive Director of the FIU Athletics Finance Corp. to take all actions necessary pertaining to this Financial Audit, including filing the report with the Auditor General. FA1-D. FIU Academic Health Center Health Care Network Faculty Group Practice, Inc. Sr. VP and CFO Jessell noted that the FIU Academic Health Center Health Care Network Faculty Group Practice, Inc. Board of Directors approved the 2013-14 financial audit at its October 15, 2014 meeting and was submitting the audit to the Board of Trustees for approval. 2 Florida International University Board of Trustees Finance and Audit Committee Minutes January 14, 2015 Page | 3 DRAFT A motion was made and passed that the FIU Board of Trustees Finance and Audit Committee recommend for Board of Trustees’ approval the FIU Academic Health Center Health Care Network Faculty Group Practice, Inc. Financial Audit for the 2013-14 fiscal year and authorize the CEO of the FIU Academic Health Center Health Care Network Faculty Group Practice, Inc. to take all actions necessary pertaining to this Financial Audit, including filing the report with the Auditor General. FA2. Investment Policy Amendment Sr. VP and CFO Jessell presented the Investment Policy Amendment for Committee review, providing an overview of the proposed changes. He noted that the proposed changes would provide additional diversification and enable the University to focus on corporate fixed income investments, would provide additional income, growth potential, portfolio diversification and a hedge against inflation and create consistency with and between the proposed Credit Fixed Income guidelines. Trustees inquired as to the specific allocations and asset class pertaining to Master Limited Partnerships (MLPs). University Treasurer Phong Vu noted that the MLPs are considered real assets as opposed to equity. Sr. VP and CFO Jessell referred Trustees to the allocation percentages in the Investment Policy, reflecting an MLP target of 7.10 percent on the Strategic Capital and Reserve Pools and a 5.00 percent in the Total Combined Pool. A motion was made and passed that the FIU Board of Trustees Finance and Audit Committee recommend for Board of Trustees’ approval the adoption of revisions to the University’s Investment Policy. FA3. Performance Based Funding Metrics A. Performance Base Funding – Data Integrity Certification B. Audit of Performance Based Funding Metrics: Good Process Controls Contribute to their Reliability Internal Audit Director Allen Vann presented the Data Integrity Certification and Audit of Performance Based Funding Metrics for Committee review, noting that the State University System of Florida Board of Governors (BOG) established additional requirements for the BOG’s performance based funding model program. He added that the new procedure requires the Board Chair and University President to jointly execute a Data Integrity Certification affirmatively certifying that the University maintains reliable systems as they relate to BOG data and reporting requirements. Additionally, he indicated that the BOG requested that the Board of Trustees direct the Audit Director to perform an audit of the University’s processes completeness, accuracy and timeliness. He presented the audit findings and recommendations, stating that the University has good process controls for maintaining and reporting performance metrics data and noted that the University is in the process of implementing the four recommendations in order to further reduce risk. He further noted that both the data certifications and results of the audit need to be approved by the Board of Trustees prior to the BOG submission deadline of March 1, 2015. A motion was made and passed that the FIU Board of Trustees Finance and Audit Committee recommend that the Florida International University Board of Trustees: 3 Florida International University Board of Trustees Finance and Audit Committee Minutes January 14, 2015 Page | 4 DRAFT 1. Approve the Performance Base Funding – Data Integrity Certification to be signed by the Chairman of the Board of Trustees; and 2. Approve the Audit Report - Audit of Performance Based Funding Metrics: Good Process Controls Contribute to their Reliability FA4. Quality Assessment of FIU Office of Internal Audit Internal Audit Director Vann presented the Quality Assessment of FIU Office of Internal Audit for Committee review, noting that the University’s Office of Internal Audit (OIA) Policy and Charter requires an external assessment of the internal audit department’s adherence with the Standards for the Professional Practice of Internal Auditing at least every five years. He added that Mr. Drummond Kahn, Director of Audit Services for the City of Portland, was engaged to conduct an independent validation of FIU’s internal audit function. He stated that Mr. Kahn’s external validation fully concurred with OIA’s conclusion in its self-assessment report that OIA generally complies with the Standards. A motion was made and passed that the FIU Board of Trustees Finance and Audit Committee recommend that the Florida International University Board of Trustees approve the report on the Independent Validation Quality Assessment of Florida International University Office of Internal Audit. 4. Discussion Items 4.1 Financial Performance Review – First Quarter 2015 Sr. VP and CFO Jessell presented the Financial Performance Review for the first quarter of 2014-15 and provided a summary of University revenues and expenditures. He reported that the University and direct support organizations’ operating revenues were above estimates by $1M, which can be primarily attributed to higher than projected federal and other grants and higher Florida Student Assistance Grant awards and departmental scholarships offset by timing of receipt of Pell awards. He noted that expenses were below estimates by $23M (or 9 percent), primarily due to lower expenditures, vacant positions and delays in spending on the capital campaign program. 4.2 Office of Internal Audit Status Report Internal Audit Director Vann presented the Internal Audit Report, providing updates on five recently completed audits, work in progress, investigations and a follow-up status report on past audit recommendations. He noted that 62 of the 85 recommendations due for implementation this quarter were completed and that the remaining 23 recommendations are in progress. 4.3 University Compliance Report Assistant Vice President, University Compliance and Privacy Officer Karyn Boston presented the University Compliance Report, providing an overview of the highlights and achievements of the Office of Compliance for 2014. She reported that in 2015, the Compliance Office will focus on identifying high-risk compliance areas and develop targeted communication and training plans for those areas that are most vulnerable. She also identified additional key initiatives for implementation in 2015 that will serve as the foundation for the Compliance Plan. 4 Florida International University Board of Trustees Finance and Audit Committee Minutes January 14, 2015 Page | 5 DRAFT 5. Reports (For Information Only) Committee Chair Agrawal requested that the Treasury Report, Business Services Report, Athletics Update, Emergency Management Status Report, Safety and Environmental Compliance Report, Facilities and Construction Update, and Foundation Report be accepted as written. There were no objections. 6. New Business 6.1 Senior Management Discussion of Audit Processes Committee Chair Agrawal noted that as is stipulated in the Finance and Audit Committee Charter, the Committee must meet with Senior Management without the presence of the Office of Internal Audit. He further noted that as a meeting conducted in the Sunshine, no one present was required to leave during the discussion with Senior Management, adding that this was strictly voluntary. Members of Senior Management discussed the auditor’s performance, noting that the independent external validation confirmed that FIU has a strong internal audit function which they attributed to Mr. Vann’s high level of skills, experience and professionalism. 7. Concluding Remarks and Adjournment With no other business, Committee Chair Sukrit Agrawal adjourned the meeting of the Florida International University Board of Trustees Finance and Audit Committee on Wednesday, January 14, 2015 at 10:28 am. There were no Trustee requests. 1.27.15 MB 5 REPORT NO. 2015-123 MARCH 2015 FLORIDA INTERNATIONAL UNIVERSITY Financial Audit For the Fiscal Year Ended June 30, 2014 6 BOARD OF TRUSTEES AND PRESIDENT Members of the Board of Trustees and President who served during the 2013-14 fiscal year are listed below: Albert Maury, Chair Michael M. Adler, Vice Chair Sukrit Agrawal Cesar L. Alvarez Dr. Jose J. Armas Jorge L. Arrizurieta Robert T. Barlick, Jr. Alexis Calatayud from 5-12-14 (1) Marcelo Claure Mayi de la Vega Gerald C. Grant, Jr C. Delano Gray (2) Claudia Puig Liane M. Sippin to 5-11-14 (1) Dr. Mark B. Rosenberg, President Notes: (1) Student body president. (2) Faculty Senate Chair. The Auditor General conducts audits of governmental entities to provide the Legislature, Florida’s citizens, public entity management, and other stakeholders unbiased, timely, and relevant information for use in promoting government accountability and stewardship and improving government operations. The audit team leader was Allen Jova, and the audit was supervised by Hector J. Quevedo, CPA. Please address inquiries regarding this report to James R. Stultz, CPA, Audit Manager, by e-mail at [email protected] or by telephone at (850) 412-2869. This report and other reports prepared by the Auditor General can be obtained on our Web site at www.myflorida.com/audgen; by telephone at (850) 412-2722; or by mail at G74 Claude Pepper Building, 111 West Madison Street, Tallahassee, Florida 32399-1450. 7 MARCH 2015 REPORT NO. 2015-123 FLORIDA INTERNATIONAL UNIVERSITY TABLE OF CONTENTS PAGE NO. EXECUTIVE SUMMARY .................................................................................................................... i INDEPENDENT AUDITOR’S REPORT ......................................................................................... 1 Report on the Financial Statements ............................................................................................... 1 Other Reporting Required by Government Auditing Standards ................................................... 2 MANAGEMENT’S DISCUSSION AND ANALYSIS .......................................................................... 3 BASIC FINANCIAL STATEMENTS Statement of Net Position .............................................................................................................. 13 Statement of Revenues, Expenses, and Changes in Net Position ................................................. 15 Statement of Cash Flows ................................................................................................................ 16 Notes to Financial Statements ....................................................................................................... 18 OTHER REQUIRED SUPPLEMENTARY INFORMATION Schedule of Funding Progress – Other Postemployment Benefits Plan ....................................... 49 INDEPENDENT AUDITOR’S REPORT ON INTERNAL CONTROL OVER FINANCIAL REPORTING AND ON COMPLIANCE AND OTHER MATTERS BASED ON AN AUDIT OF THE FINANCIAL STATEMENTS PERFORMED IN ACCORDANCE WITH GOVERNMENT AUDITING STANDARDS ...................................... 50 Report on the Financial Statements ............................................................................................... 50 Internal Control Over Financial Reporting .................................................................................... 50 Compliance and Other Matters ...................................................................................................... 51 Purpose of this Report .................................................................................................................... 51 8 MARCH 2015 REPORT NO. 2015-123 EXECUTIVE SUMMARY Summary of Report on Financial Statements Our audit disclosed that the University’s basic financial statements were presented fairly, in all material respects, in accordance with prescribed financial reporting standards. Summary of Report on Internal Control and Compliance Our audit did not identify any deficiencies in internal control over financial reporting that we consider to be material weaknesses. The results of our tests disclosed no instances of noncompliance or other matters that are required to be reported under Government Auditing Standards issued by the Comptroller General of the United States. Audit Objectives and Scope Our audit objectives were to determine whether Florida International University and its officers with administrative and stewardship responsibilities for University operations had: Presented the University’s basic financial statements in accordance with generally accepted accounting principles; Established and implemented internal control over financial reporting and compliance with requirements that could have a direct and material effect on the financial statements; and Complied with the various provisions of laws, rules, regulations, contracts, and grant agreements that are material to the financial statements. The scope of this audit included an examination of the University’s basic financial statements as of and for the fiscal year ended June 30, 2014. We obtained an understanding of the University’s environment, including its internal control, and assessed the risk of material misstatement necessary to plan the audit of the basic financial statements. We also examined various transactions to determine whether they were executed, in both manner and substance, in accordance with governing provisions of laws, rules, regulations, contracts, and grant agreements. An examination of Federal awards administered by the University is included within the scope of our Statewide audit of Federal awards administered by the State of Florida. Audit Methodology The methodology used to develop the findings in this report included the examination of pertinent University records in connection with the application of procedures required by auditing standards generally accepted in the United States of America and applicable standards contained in Government Auditing Standards issued by the Comptroller General of the United States. i 9 MARCH 2015 REPORT NO. 2015-123 AUDITOR GENERAL STATE OF FLORIDA G74 Claude Pepper Building 111 West Madison Street Tallahassee, Florida 32399-1450 DAVID W. MARTIN, CPA AUDITOR GENERAL PHONE: 850-412-2722 FAX: 850-488-6975 The President of the Senate, the Speaker of the House of Representatives, and the Legislative Auditing Committee INDEPENDENT AUDITOR’S REPORT Report on the Financial Statements We have audited the accompanying financial statements of Florida International University, a component unit of the State of Florida, and its aggregate discretely presented component units as of and for the fiscal year ended June 30, 2014, and the related notes to the financial statements, which collectively comprise the University’s basic financial statements as listed in the table of contents. Management’s Responsibility for the Financial Statements Management is responsible for the preparation and fair presentation of these financial statements in accordance with accounting principles generally accepted in the United States of America; this includes the design, implementation, and maintenance of internal control relevant to the preparation and fair presentation of financial statements that are free from material misstatement, whether due to fraud or error. Auditor’s Responsibility Our responsibility is to express opinions on these financial statements based on our audit. We did not audit the financial statements of the aggregate discretely presented component units, which represent 100 percent of the transactions and account balances of the aggregate discretely presented component units’ columns. Those financial statements were audited by other auditors whose reports have been furnished to us, and our opinion, insofar as it relates to the amounts included for the aggregate discretely presented component units, is based on the reports of the other auditors. We conducted our audit in accordance with auditing standards generally accepted in the United States of America and the standards applicable to financial audits contained in Government Auditing Standards issued by the Comptroller General of the United States. Those standards require that we plan and perform the audit to obtain reasonable assurance about whether the financial statements are free from material misstatement. An audit involves performing procedures to obtain audit evidence about the amounts and disclosures in the financial statements. The procedures selected depend on the auditor’s judgment, including the assessment of the risks of material misstatement of the financial statements, whether due to fraud or error. In making those risk assessments, the auditor considers internal control relevant to the entity’s preparation and fair presentation of the financial statements in order to design audit procedures that are appropriate in the circumstances, but not for the purpose of expressing an opinion on the effectiveness of the entity’s internal control. Accordingly, we express no such opinion. An audit also includes evaluating the appropriateness of accounting policies used and the reasonableness of significant accounting estimates made by management, as well as evaluating the overall presentation of the financial statements. We believe that the audit evidence we have obtained is sufficient and appropriate to provide a basis for our audit opinions. 1 10 MARCH 2015 REPORT NO. 2015-123 Opinions In our opinion, based on our audit and the reports of the other auditors, the financial statements referred to above present fairly, in all material respects, the respective financial position of Florida International University and of its aggregate discretely presented component units as of June 30, 2014, and the respective changes in financial position and, where applicable, cash flows thereof for the fiscal year then ended, in accordance with accounting principles generally accepted in the United States of America. Other Matter Required Supplementary Information Accounting principles generally accepted in the United States of America require that MANAGEMENT’S DISCUSSION AND ANALYSIS and SCHEDULE OF FUNDING PROGRESS – OTHER POSTEMPLOYMENT BENEFITS PLAN, as listed in the table of contents, be presented to supplement the basic financial statements. Such information, although not a required part of the basic financial statements, is required by the Governmental Accounting Standards Board who considers it to be an essential part of financial reporting for placing the basic financial statements in an appropriate operational, economic, or historical context. We have applied certain limited procedures to the required supplementary information in accordance with auditing standards generally accepted in the United States of America, which consisted of inquiries of management about the methods of preparing the information and comparing the information for consistency with management’s responses to our inquiries, the basic financial statements, and other knowledge we obtained during our audit of the basic financial statements. We do not express an opinion or provide any assurance on the information because the limited procedures do not provide us with sufficient evidence to express an opinion or provide any assurance. Other Reporting Required by Government Auditing Standards In accordance with Government Auditing Standards, we have also issued a report on our consideration of Florida International University’s internal control over financial reporting and on our tests of its compliance with certain provisions of laws, rules, regulations, contracts, and grant agreements and other matters included under the heading INDEPENDENT AUDITOR’S REPORT ON INTERNAL CONTROL OVER FINANCIAL REPORTING AND ON COMPLIANCE AND OTHER MATTERS BASED ON AN AUDIT OF THE FINANCIAL STATEMENTS PERFORMED IN ACCORDANCE WITH GOVERNMENT AUDITING STANDARDS. The purpose of that report is to describe the scope of our testing of internal control over financial reporting and compliance and results of that testing, and not to provide an opinion on the internal control over financial reporting or on compliance. That report is an integral part of an audit performed in accordance with Government Auditing Standards in considering Florida International University’s internal control over financial reporting and compliance. Respectfully submitted, David W. Martin, CPA Tallahassee, Florida March 4, 2015 2 11 MARCH 2015 REPORT NO. 2015-123 MANAGEMENT’S DISCUSSION AND ANALYSIS The management’s discussion and analysis (MD&A) provides an overview of the financial position and activities of the University for the fiscal year ended June 30, 2014, and should be read in conjunction with the financial statements and notes thereto. The MD&A, and financial statements and notes thereto, are the responsibility of University management. The MD&A contains financial activity of the University for the fiscal years ended June 30, 2014, and June 30, 2013. FINANCIAL HIGHLIGHTS The University’s assets totaled $1.3 billion at June 30, 2014. This balance reflects a $71.9 million, or 5.7 percent, increase as compared to the 2012-13 fiscal year. Contributing to the increase during the 2013-14 fiscal year was the $69.9 million increase in capital assets, net of depreciation, primarily due to increases in construction in progress, buildings, and furniture and equipment, offset by current year depreciation. Liabilities increased by $16.4 million, or 5.1 percent, totaling $335.4 million at June 30, 2014, as compared to $319 million at June 30, 2013. Contributing to this increase was an increase in capital improvement debt payable of $23.8 million for the new parking bonds issued during the year. Additionally, there were increases of $11.1 million in projected costs for postemployment benefits based on the actuarial study provided by the State and of $3.5 million in compensated absence liability to employees mainly resulting from increased salaries. These increases were offset by a decrease in unearned revenue of $21.2 million primarily due to recognition of revenue from State capital appropriations during the fiscal year. As a result, the University's net position increased by $55.5 million, resulting in a year-end balance of $994.6 million. The University’s operating revenues totaled $490.4 million for the 2013-14 fiscal year, representing a $27.9 million, or 6 percent increase over the 2012-13 fiscal year. Major components of operating revenues are student tuition and fees, auxiliary enterprise revenues, and grants and contracts. Net tuition and fees revenue increased $23.9 million. Grants and contract revenue increased $8.2 million. Operating expenses totaled $848.1 million for the 2013-14 fiscal year, representing an increase of $75.1 million, or 9.7 percent, over the 2012-13 fiscal year due mainly to increases in compensation and employee benefits of $54.6 million and services and supplies expenses of $12.7 million. Net position represents the residual interest in the University’s assets after deducting liabilities. The University’s comparative total net position by category for the fiscal years ended June 30, 2014, and June 30, 2013, is shown in the following graph: Net Position (In Millions) 2014 2013 $1,000 $772.2 $696.4 $500 $182.5 $182.3 $39.9 $60.4 $0 Net Investment in Capital Assets Restricted 3 12 Unrestricted MARCH 2015 REPORT NO. 2015-123 The following chart provides a graphical presentation of University revenues by category for the 2013-14 fiscal year: Total Revenues Nonoperating Revenues 41% Other Revenues 5% Operating Revenues 54% OVERVIEW OF FINANCIAL STATEMENTS Pursuant to GASB Statement No. 35, the University’s financial report includes three basic financial statements: the statement of net position; the statement of revenues, expenses, and changes in net position; and the statement of cash flows. The financial statements, and notes thereto, encompass the University and the following discretely presented component units: Florida International University Foundation, Inc. (Foundation). FIU Athletics Finance Corporation (Finance Corporation). Florida International University Academic Health Center Health Care Network Faculty Group Practice, Inc. (Health Care Network). Based upon the application of the criteria for determining component units, the Foundation, Finance Corporation, and Health Care Network are included within the University reporting entity as discretely presented component units. Information regarding the discretely presented component units, including summaries of their separately issued financial statements, is presented in the notes to financial statements. This MD&A focuses on the University, excluding the discretely presented component units. For those discretely presented component units reporting under GASB standards, MD&A information is included in their separately issued audit reports. THE STATEMENT OF NET POSITION The statement of net position reflects the assets and liabilities of the University, using the accrual basis of accounting, and presents the financial position of the University at a specified time. Assets, less liabilities, equal net position, which is one indicator of the University’s current financial condition. The changes in net position that occur over time indicate improvement or deterioration in the University’s financial condition. 4 13 MARCH 2015 REPORT NO. 2015-123 The following summarizes the University’s assets, liabilities, and net position at June 30: Condensed Statement of Net Position at June 30 (In Millions) 2014 Assets Current Assets Capital Assets, Net Other Noncurrent Assets $ 2013 366.4 922.8 40.8 $ 365.4 852.9 39.8 1,330.0 1,258.1 Liabilities Current Liabilities Noncurrent Liabilities 60.0 275.4 75.8 243.2 Total Liabilities 335.4 319.0 Net Position Net Investment in Capital Assets Restricted Unrestricted 772.2 39.9 182.5 696.4 60.4 182.3 Total Assets $ Total Net Position 994.6 $ 939.1 THE STATEMENT OF REVENUES, EXPENSES, AND CHANGES IN NET POSITION The statement of revenues, expenses, and changes in net position presents the University’s revenue and expense activity, categorized as operating and nonoperating. Revenues and expenses are recognized when earned or incurred, regardless of when cash is received or paid. The following summarizes the University’s activity for the 2013-14 and 2012-13 fiscal years: Condensed Statement of Revenues, Expenses, and Changes in Net Position For the Fiscal Years (In Millions) 2013-14 Operating Revenues Less, Operating Expenses $ 490.4 848.1 2012-13 $ (357.7) 368.5 Operating Loss Net Nonoperating Revenues Income (Loss) Before Other Revenues, Expenses, Gains, or Losses Other Revenues, Expenses, Gains, or Losses Net Increase In Net Position Net Position, Beginning of Year $ Net Position, End of Year 462.5 773.0 (310.5) 298.4 10.8 44.7 (12.1) 63.5 55.5 939.1 51.4 887.7 994.6 $ 939.1 Operating Revenues GASB Statement No. 35 categorizes revenues as either operating or nonoperating. Operating revenues generally result from exchange transactions where each of the parties to the transaction either give up or receive something of equal or similar value. 5 14 MARCH 2015 REPORT NO. 2015-123 The following summarizes the operating revenues by source that were used to fund operating activities for the 2013-14 and 2012-13 fiscal years: Operating Revenues (In Millions) 2013-14 2012-13 Student Tuition and Fees, Net Grants and Contracts Sales and Services of Educational Departments Sales and Services of Auxiliary Enterprises Other $ 275.1 99.5 0.8 101.5 13.5 $ 251.2 91.3 0.4 101.8 17.8 Total Operating Revenues $ 490.4 $ 462.5 The following chart presents the University’s operating revenues for the 2013-14 and 2012-13 fiscal years: Operating Revenues (In Millions) 2013-14 $275.1 $251.2 Student Tuition and Fees, Net 2012-13 $99.5 $91.3 Grants and Contracts $0.8 $0.4 Sales and Services of Educational Departments $101.5 $101.8 Sales and Services of Auxiliary Enterprises $13.5 Other $17.8 $0 $175 $350 University operating revenue changes were the result of the following factors: Net student tuition and fees revenue increased $23.9 million, or 9.5 percent. This increase was primarily due to an increase in tuition rates, 1.7 percent for undergraduate and 5 percent for graduate programs, along with an increase in student enrollment of 4.4 percent. Additionally, revenues from various market rate programs, such as nursing and online masters business programs contributed $6 million to the overall increase in tuition and fees revenue. Grants and contracts revenue increased $8.2 million, or 9 percent. This increase was due in part to increased revenue earned from Federal grants of $6.6 million for research projects in areas such as global water access and sanitation, expansion of worldwide network connections, and retinal functional imaging. Additionally, there was an increase of $1.6 million in revenue from State and local grants. Other operating revenue decreased $4.3 million, or 24.2 percent. This decrease was due in part to a reduction in revenue generated from College of Medicine (COM) affiliation agreements with local healthcare providers. 6 15 MARCH 2015 REPORT NO. 2015-123 Operating Expenses Expenses are categorized as operating or nonoperating. The majority of the University’s expenses are operating expenses as defined by GASB Statement No. 35. GASB gives financial reporting entities the choice of reporting operating expenses in the functional or natural classifications. The University has chosen to report the expenses in their natural classification on the statement of revenues, expenses, and changes in net position and has displayed the functional classification in the notes to financial statements. The following summarizes the operating expenses by natural classifications for the 2013-14 and 2012-13 fiscal years: Operating Expenses For the Fiscal Years (In Millions) 2013-14 2012-13 Compensation and Employee Benefits Services and Supplies Utilities and Communications Scholarships, Fellowships, and Waivers Depreciation $ 525.0 171.8 16.2 93.7 41.4 $ 470.4 159.1 16.0 87.9 39.6 Total Operating Expenses $ 848.1 $ 773.0 The following chart presents the University’s operating expenses for the 2013-14 and 2012-13 fiscal years: Operating Expenses (In Millions) $525.0 $470.4 Compensation and Employee Benefits 2013-14 2012-13 $171.8 $159.1 Services and Supplies $16.2 $16.0 Utilities and Communications $93.7 $87.9 Scholarships, Fellowships, and Waviers $41.4 Depreciation $39.6 $0 $300 $600 Changes in operating expenses were primarily the result of the following factors: Compensation and employee benefits expenses increased $54.6 million, or 11.6 percent. This increase was primarily due to an increase in the number of employees combined with a 1 percent across the board salary increase and an additional State authorized increase in salary for eligible employees. Additionally, there were increases in healthcare insurance matching costs borne by the University, as well as employer retirement contributions due to increased Florida Retirement System contribution rates. 7 16 MARCH 2015 REPORT NO. 2015-123 Services and supplies expenses increased $12.7 million, or 8 percent. The increase was primarily related to increases in materials and supplies of $2 million for increased purchases of library books, higher costs of $2.7 million in repairs and maintenance mainly for software licenses and maintenance of new equipment, and increased contractual services expenses of approximately $6 million associated with research projects and advertising and marketing initiatives for promotion of market rate graduate online programs. Nonoperating Revenues and Expenses Certain revenue sources that the University relies on to provide funding for operations, including State noncapital appropriations, Federal and State student financial aid, and investment income, are defined by GASB as nonoperating. Nonoperating expenses include capital financing costs and other costs related to capital assets. The following summarizes the University’s nonoperating revenues and expenses for the 2013-14 and 2012-13 fiscal years: Nonoperating Revenues (Expenses) (In Millions) 2013-14 2012-13 State Noncapital Appropriations Federal and State Student Financial Aid Investment Income Other Nonoperating Revenues Gain (Loss) on Disposal of Capital Assets Interest on Capital Asset-Related Debt Other Nonoperating Expenses $ 225.9 110.8 23.6 19.6 (0.2) (7.8) (3.4) $ 173.8 107.9 13.3 10.5 0.2 (7.1) (0.2) Net Nonoperating Revenues $ 368.5 $ 298.4 Net nonoperating revenues increased by $70.1 million, or 23.5 percent, from the prior fiscal year due mainly to the following factors: State noncapital appropriations increased $52.1 million, or 30 percent, due to the restoration of prior year non-recurring reduction of revenues from the State's funding shortfall, additional State noncapital appropriations received for health and retirement benefits and legislated salary increases, and new performance funding revenue awarded. Federal and State student financial aid increased $2.9 million, or 2.7 percent, due to an increase of student financial aid awarded. Investment income increased $10.3 million, or 77.4 percent, due to gains on investments reported as investment income. Other nonoperating revenues increased by $9.1 million, or 86.7 percent, primarily due to a new TEAM grant awarded this year and increased contributions from component units in support of University activities. Other nonoperating expenses increased $3.2 million primarily due to the write-off of deferred bond costs for existing and new bond issues. 8 17 MARCH 2015 REPORT NO. 2015-123 Other Revenues, Expenses, Gains, or Losses This category is composed of State capital appropriations and capital grants, contracts, donations, and fees. The following summarizes the University’s other revenues, expenses, gains, or losses for the 2013-14 and 2012-13 fiscal years: Other Revenues, Expenses, Gains, or Losses (In Millions) 2013-14 2012-13 State Capital Appropriations Capital Grants, Contracts, Donations, and Fees $ 39.3 5.4 $ 59.4 4.1 Total $ 44.7 $ 63.5 Other revenues decreased by $18.8 million, or 29.6 percent, as compared to the 2012-13 fiscal year due to a $20.1 million reduction in State capital appropriations for new construction projects. This decrease was partially offset by a $1.3 million increase in capital grants and donations. THE STATEMENT OF CASH FLOWS The statement of cash flows provides information about the University’s financial results by reporting the major sources and uses of cash and cash equivalents. This statement will assist in evaluating the University’s ability to generate net cash flows, its ability to meet its financial obligations as they come due, and its need for external financing. Cash flows from operating activities show the net cash used by the operating activities of the University. Cash flows from capital financing activities include all plant funds and related long-term debt activities. Cash flows from investing activities show the net source and use of cash related to purchasing or selling investments, and earning income on those investments. Cash flows from noncapital financing activities include those activities not covered in other sections. The following summarizes cash flows for the 2013-14 and 2012-13 fiscal years: Condensed Statement of Cash Flows (In Millions) 2013-14 Cash Provided (Used) by: Operating Activities Noncapital Financing Activities Capital and Related Financing Activities Investing Activities $ $ 3.8 11.9 Net Increase in Cash and Cash Equivalents Cash and Cash Equivalents, Beginning of Year $ Cash and Cash Equivalents, End of Year (292.9) 358.1 (67.8) 6.4 2012-13 15.7 (249.9) 276.2 (82.7) 65.1 8.7 3.2 $ 11.9 Major sources of cash inflows came from State noncapital appropriations ($225.9 million), Federal Direct Student Loan program receipts ($273.9 million), net student tuition and fees ($273.3 million), grants and contracts ($101.3 million), sales and services of auxiliary enterprises ($100.5 million), proceeds from sales and maturities of investments ($789.7 million), proceeds from the issuance of capital debt ($48.8 million), State capital appropriations ($29.3 million), and Federal and State student financial aid ($110.2 million). Major uses of cash were for payments made to and on behalf of employees totaling ($508.8 million), payments to suppliers ($183.8 million), disbursements 9 18 MARCH 2015 REPORT NO. 2015-123 to students for Federal Direct Student Loan program ($275.3 million), purchases or construction of capital assets ($115.7 million), purchases of investments ($792 million), and payments to and on behalf of students for scholarships and fellowships ($93.7 million). CAPITAL ASSETS, CAPITAL EXPENSES AND COMMITMENTS, AND DEBT ADMINISTRATION CAPITAL ASSETS At June 30, 2014, the University had $1.4 billion in capital assets, less accumulated depreciation of $437.7 million, for net capital assets of $922.8 million. Depreciation charges for the current fiscal year totaled $41.4 million. The following table summarizes the University’s capital assets, net of accumulated depreciation, at June 30: Capital Assets, Net at June 30 (In Millions) 2014 Land Construction in Progress Buildings Infrastructure and Other Improvements Furniture and Equipment Library Resources Property Under Capital Leases and Leasehold Improvements Works of Art and Historical Treasures Computer Software $ Capital Assets, Net $ 28.7 172.5 636.6 4.1 35.9 38.3 2013 $ 1.6 4.2 0.9 922.8 28.4 146.2 591.7 4.5 34.2 42.6 0.6 4.0 0.7 $ 852.9 Additional information about the University’s capital assets is presented in the notes to financial statements. CAPITAL EXPENSES AND COMMITMENTS Major capital expenses through June 30, 2014, were incurred on the following projects: $25.4 million for the Robert Stempel College of Public Health and Social Science Building, $25.2 million for the Mixed-Use Auxiliary Building, and $20.6 million for Parking Garage Six projects. The University’s construction commitments at June 30, 2014, are as follows: Amount (In Millions) Total Committed Completed to Date $ 274.9 (172.5) Balance Committed $ 102.4 Additional information about the University’s construction commitments is presented in the notes to financial statements. DEBT ADMINISTRATION As of June 30, 2014, the University had $183.5 million in outstanding capital improvement debt payable and capital lease payable representing an increase of $24.8 million, or 15.6 percent, over the prior fiscal year as a result of debt principal payments totaling $25.9 million, offset by an increase of $50.7 million for new capital improvement debt 10 19 MARCH 2015 REPORT NO. 2015-123 ($49.7 million) and a new capital lease payable ($1million). The following table summarizes the outstanding long-term debt by type for the fiscal years ended June 30, 2014, and June 30, 2013: Long-Term Debt, at June 30 (In Millions) 2014 2013 Capital Improvement Debt Capital Leases $ 182.5 1.0 $ 158.7 Total $ 183.5 $ 158.7 Additional information about the University’s long-term debt is presented in the notes to financial statements. ECONOMIC FACTORS THAT WILL AFFECT THE FUTURE Florida continues to regain its stable economic base as the factors which impeded economic growth slowly recede. This was evidenced by a 3.5 percent growth in the State’s general revenues in the 2013-14 fiscal year over the prior fiscal year and made possible an allocation of $100 million in new funds by the Legislature for Performance Based Funding for the State University System (SUS). Under the new Board of Governors (BOG) performance based funding model, each institution is evaluated annually on the basis of 10 metrics which are aligned with SUS Strategic Plan goals and recognize the unique mission of each institution. Institutions are scored on the basis of excellence or improvement; the institutions with higher scores are rewarded with an allocation of new performance funds and restoration of base funds while the lower scoring institutions do not participate in new funds and base funds are withheld unless they can show improvement according to an approved plan. Florida International University (FIU) received the third highest score of 34 and received $25.3 million of the $200 million ($100 million new and $100 million redistribution of base funds) allocated for performance based funding in the 2014-15 fiscal year by the Legislature, representing a net increase of $18 million after redistribution of prior performance funding included in the base funds. The amount of performance based funding allocated each year to each institution will be determined by the amount of funds allocated by the Legislature and the relative performance of each institution. These new metric measures and methodology of allocating new funds have resulted in a strengthened alignment of FIU goals with the SUS Strategic Plan. Other key legislative actions include the removal of statutory language that provided for an increase of undergraduate base tuition by the consumer price index in the absence of any legislated increase. Additionally, undergraduate tuition differential rates may now only be increased by the Legislature. With the absence of legislated undergraduate base and differential tuition increases, undergraduate tuition rates at FIU were unchanged for the 2014-15 academic year. The FIU Herbert Wertheim College of Medicine (HWCOM) gained full accreditation from the Liaison Committee on Medical Education (LCME) in February 2013, an important accomplishment which gives the college even more presence in South Florida and within the SUS. There were over 4,000 applicants to the Program for this school year which sets a very competitive environment, and gives FIU a great opportunity to select some of the very best students. There are only 120 students accepted each year and HWCOM is at full capacity at this time. The HWCOM General Revenue State appropriations for the 2014-15 fiscal year increased by $0.4 million to reach $30.9 million; of which, $0.2 million was the final allocation under the medical school implementation plan, $0.8 million were Legislative Budget Requests (LBRs) for specific projects and programs, and $0.3 million were for health and retirement benefits. 11 20 MARCH 2015 REPORT NO. 2015-123 FIU is expanding physically and academically to better serve the needs of the local community and the State as a whole. As FIU celebrates its 50th anniversary in 2015, it is poised to be a significant contributor to educational progress and economic development in South Florida and the State of Florida. REQUESTS FOR INFORMATION Questions concerning information provided in the MD&A or other required supplementary information, the financial statements and notes thereto, or requests for additional financial information should be addressed to the Chief Financial Officer and Senior Vice President for Finance and Administration, Dr. Kenneth Jessell, at Florida International University, 11200 Southwest 8th Street, Miami, Florida 33199. 12 21 MARCH 2015 REPORT NO. 2015-123 BASIC FINANCIAL STATEMENTS FLORIDA INTERNATIONAL UNIVERSITY A COMPONENT UNIT OF THE STATE OF FLORIDA STATEMENT OF NET POSITION June 30, 2014 University ASSETS Current Assets: Cash and Cash Equivalents Investments Accounts Receivable, Net Loans and Notes Receivable, Net Due from State Due from Component Units/University Inventories Other Current Assets $ Total Current Assets Noncurrent Assets: Restricted Cash and Cash Equivalents Restricted Investments Loans and Notes Receivable, Net Depreciable Capital Assets, Net Nondepreciable Capital Assets Due from Component Units/University Other Noncurrent Assets Component Units 15,293,310 277,389,593 25,919,365 838,586 44,653,288 1,941,867 355,615 43,939 $ 6,921,145 234,033,785 66,413,599 511,513 3,568,062 366,435,563 311,448,104 417,189 31,035,796 2,357,051 717,504,324 205,330,468 6,912,211 1,518,191 2,648,876 17,131,623 656,719 23,862,473 Total Noncurrent Assets Total Assets 963,557,039 45,817,882 1,329,992,602 357,265,986 DEFERRED OUTFLOWS OF RESOURCES Accumulated Decrease in Fair Value of Hedging Derivatives Deferred Amount on Debt Refundings 2,242,930 312,381 Total Deferred Outflows of Resources LIABILITIES Current Liabilities: Accounts Payable Construction Contracts Payable Salaries and Wages Payable Deposits Payable Due to State Due to Component Units/University Unearned Revenue Other Current Liabilities Long-Term Liabilities - Current Portion: Bonds Payable Capital Improvement Debt Payable Notes Payable Capital Lease Payable Compensated Absences Payable Liability for Self-Insured Claims - 2,555,311 17,967,849 14,642,648 6,498,759 1,691,495 219,057 293,513 6,365,376 446,515 1,194,613 1,867,899 2,144,898 203,254 676,567 8,830,085 755,000 181,770 2,806,276 40,713 59,984,056 Total Current Liabilities 13 22 6,842,231 MARCH 2015 REPORT NO. 2015-123 FLORIDA INTERNATIONAL UNIVERSITY A COMPONENT UNIT OF THE STATE OF FLORIDA STATEMENT OF NET POSITION (CONTINUED) June 30, 2014 University LIABILITIES (Continued) Noncurrent Liabilities: Bonds Capital Improvement Debt Payable Notes Payable Capital Lease Payable Compensated Absences Payable Due to Component Units/University Other Postemployment Benefits Payable Unearned Revenue Liability for Self-Insured Claims Other Long-Term Liabilities $ Component Units $ 31,415,877 173,650,168 6,165,000 855,230 34,882,094 7,024,577 37,348,000 26,392,393 39,117 2,228,562 4,998,971 Total Noncurrent Liabilities 275,395,564 50,004,425 Total Liabilities 335,379,620 56,846,656 772,170,918 8,522,189 NET POSITION Net Investment in Capital Assets Restricted for Nonexpendable: Endowment Restricted for Expendable: Debt Service Loans Capital Projects Other Unrestricted 400,000 199,384,169 TOTAL NET POSITION 2,867,056 546,516 3,617,203 32,900,099 182,511,190 75,751,823 19,316,460 $ 994,612,982 $ 302,974,641 The accompanying notes to financial statements are an integral part of this statement. 14 23 MARCH 2015 REPORT NO. 2015-123 FLORIDA INTERNATIONAL UNIVERSITY A COMPONENT UNIT OF THE STATE OF FLORIDA STATEMENT OF REVENUES, EXPENSES, AND CHANGES IN NET POSITION For the Fiscal Year Ended June 30, 2014 University REVENUES Operating Revenues: Student Tuition and Fees, Net of Scholarship Allowances of $108,504,693 ($10,103,245 Pledged for Parking Facility Capital Improvement Debt) Federal Grants and Contracts State and Local Grants and Contracts Nongovernmental Grants and Contracts Sales and Services of Educational Departments Sales and Services of Auxiliary Enterprises ($30,458,678 Pledged for Housing Facility Capital Improvement Debt and $5,433,093 Pledged for Parking Facility Capital Improvement Debt) Sales and Services of Component Units Gifts and Donations Interest on Loans and Notes Receivable Other Operating Revenues Total Operating Revenues EXPENSES Operating Expenses: Compensation and Employee Benefits Services and Supplies Utilities and Communications Scholarships, Fellowships, and Waivers Depreciation Other Operating Expenses $ 275,079,438 Operating Loss $ 80,338,840 7,172,334 12,030,211 795,130 101,503,247 5,774,257 18,682,543 7,966 13,530,271 6,816,812 490,457,437 31,273,612 525,054,519 171,763,583 16,214,646 93,660,910 41,449,494 Total Operating Expenses Component Units 24,456,754 170,576 721,785 11,424,573 848,143,152 36,773,688 (357,685,715) (5,500,076) NONOPERATING REVENUES (EXPENSES) State Noncapital Appropriations Federal and State Student Financial Aid Investment Income Other Nonoperating Revenues Loss on Disposal of Capital Assets Interest on Capital Asset-Related Debt Other Nonoperating Expenses 225,862,112 110,808,582 23,567,642 19,630,063 (187,111) (7,803,740) (3,416,798) Net Nonoperating Revenues 368,460,750 35,794,160 Income Before Other Revenues, Expenses, Gains, or Losses State Capital Appropriations Capital Grants, Contracts, Donations, and Fees Other Revenues 10,775,035 39,287,370 5,456,401 30,294,084 Increase in Net Position 55,518,806 31,674,085 Net Position, Beginning of Year Adjustment to Beginning Net Position 939,094,176 271,527,291 (226,735) Net Position, Beginning of Year, as Restated 939,094,176 271,300,556 $ 994,612,982 $ 302,974,641 37,473,495 (1,679,335) 1,380,001 Net Position, End of Year The accompanying notes to financial statements are an integral part of this statement. 15 24 MARCH 2015 REPORT NO. 2015-123 FLORIDA INTERNATIONAL UNIVERSITY A COMPONENT UNIT OF THE STATE OF FLORIDA STATEMENT OF CASH FLOWS For the Fiscal Year Ended June 30, 2014 University CASH FLOWS FROM OPERATING ACTIVITIES Student Tuition and Fees, Net Grants and Contracts Sales and Services of Educational Departments Sales and Services of Auxiliary Enterprises Interest on Loans and Notes Receivable Payments to Employees Payments to Suppliers for Goods and Services Payments to Students for Scholarships and Fellowships Loans Issued to Students Collection on Loans to Students Other Operating Receipts $ 273,296,609 101,283,097 795,130 100,530,803 4,882 (508,813,605) (183,830,770) (93,660,910) (5,906,510) 5,793,329 17,602,508 Net Cash Used by Operating Activities (292,905,437) CASH FLOWS FROM NONCAPITAL FINANCING ACTIVITIES State Noncapital Appropriations Federal and State Student Financial Aid Federal Direct Loan Program Receipts Federal Direct Loan Program Disbursements Operating Subsidies and Transfers Net Change in Funds Held for Others Other Nonoperating Receipts Other Nonoperating Disbursements 225,862,112 110,158,418 273,918,138 (275,276,459) 3,596 5,569,000 18,312,928 (358,332) Net Cash Provided by Noncapital Financing Activities CASH FLOWS FROM CAPITAL AND RELATED FINANCING ACTIVITIES Proceeds from Capital Debt State Capital Appropriations Capital Grants, Contracts, Donations, and Fees Other Disbursements for Capital Projects Capital Subsidies and Transfers Purchase or Construction of Capital Assets Principal Paid on Capital Debt and Leases Interest Paid on Capital Debt and Leases Net Cash Used by Capital and Related Financing Activities CASH FLOWS FROM INVESTING ACTIVITIES Proceeds from Sales and Maturities of Investments Purchase of Investments Investment Income 358,189,401 48,758,380 29,300,080 5,065,475 (1,045,590) (307,486) (115,735,974) (25,500,000) (8,341,281) (67,806,396) 789,679,379 (792,030,932) 8,702,523 6,350,970 Net Cash Provided by Investing Activities Net Increase in Cash and Cash Equivalents Cash and Cash Equivalents, Beginning of Year 3,828,538 11,881,961 $ 15,710,499 Cash and Cash Equivalents, End of Year 16 25 MARCH 2015 REPORT NO. 2015-123 FLORIDA INTERNATIONAL UNIVERSITY A COMPONENT UNIT OF THE STATE OF FLORIDA STATEMENT OF CASH FLOWS (CONTINUED) For the Fiscal Year Ended June 30, 2014 University RECONCILIATION OF OPERATING LOSS TO NET CASH USED BY OPERATING ACTIVITIES Operating Loss Adjustments to Reconcile Operating Loss to Net Cash Used by Operating Activities: Depreciation Expense Change in Assets and Liabilities: Receivables, Net Inventories Other Assets Accounts Payable Salaries and Wages Payable Deposits Payable Compensated Absences Payable Unearned Revenue Liability for Self-Insured Claims Other Postemployment Benefits Payable NET CASH USED BY OPERATING ACTIVITIES $ (357,685,715) 41,449,494 3,546,024 (105,517) 1,132,562 3,054,045 1,575,056 (991,491) 3,514,858 450,147 4,100 11,151,000 $ (292,905,437) SUPPLEMENTAL DISCLOSURE OF NONCASH INVESTING AND CAPITAL AND RELATED FINANCING ACTIVITIES Unrealized gains on investments were recognized as an increase to investment income on the statement of revenues, expenses, and changes in net position, $ but are not cash transactions for the statement of cash flows. Losses from the disposal of capital assets were recognized on the statement of revenues, expenses, and changes in net position, but are not cash $ transactions for the statement of cash flows. Acquisition of land and building under a capital lease agreement were recognized on the statement of net position, but are not cash transactions for the statement of cash flows. $ The accompanying notes to financial statements are an integral part of this statement. 17 26 14,794,604 (187,111) 1,037,000 MARCH 2015 REPORT NO. 2015-123 FLORIDA INTERNATIONAL UNIVERSITY A COMPONENT UNIT OF THE STATE OF FLORIDA NOTES TO FINANCIAL STATEMENTS JUNE 30, 2014 1. SUMMARY OF SIGNIFICANT ACCOUNTING POLICIES Reporting Entity. The University is a separate public instrumentality that is part of the State university system of public universities, which is under the general direction and control of the Florida Board of Governors. The University is directly governed by a Board of Trustees (Trustees) consisting of thirteen members. The Governor appoints six citizen members and the Board of Governors appoints five citizen members. These members are confirmed by the Florida Senate and serve staggered terms of five years. The chair of the faculty senate and the president of the student body of the University are also members. The Board of Governors establishes the powers and duties of the Trustees. The Trustees are responsible for setting policies for the University, which provide governance in accordance with State law and Board of Governors’ Regulations. The Trustees select the University President. The University President serves as the executive officer and the corporate secretary of the Trustees, and is responsible for administering the policies prescribed by the Trustees. Criteria for defining the reporting entity are identified and described in the Governmental Accounting Standards Board’s (GASB) Codification of Governmental Accounting and Financial Reporting Standards, Sections 2100 and 2600. These criteria were used to evaluate potential component units for which the primary government is financially accountable and other organizations for which the nature and significance of their relationship with the primary government are such that exclusion would cause the primary government’s financial statements to be misleading. Based on the application of these criteria, the University is a component unit of the State of Florida, and its financial balances and activities are reported in the State’s Comprehensive Annual Financial Report by discrete presentation. Discretely Presented Component Units. Based on the application of the criteria for determining component units, the following direct-support organizations (as provided for in Section 1004.28, Florida Statutes, and Board of Governors Regulation 9.011) are included within the University reporting entity as discretely presented component units. These legally separate, not-for-profit, corporations are organized and operated to assist the University to achieve excellence by providing supplemental resources from private gifts and bequests, and valuable education support services and are governed by separate boards. The Statute authorizes these organizations to receive, hold, invest, and administer property and to make expenditures to or for the benefit of the University. These organizations and their purposes are explained as follows: Florida International University Foundation, Inc. (Foundation), – The purpose of the Foundation is to encourage, solicit, receive, and administer gifts and bequests of property and funds for the advancement of the University and its objectives. Florida International University Research Foundation, Inc. (Research Foundation), – The purpose of the Research Foundation includes the promotion and encouragement of, and assistance to, the research and training activities of faculty, staff, and students of the University through income from contracts, grants, and other sources, including, but not limited to, income derived from or related to the development and commercialization of University work products. FIU Athletics Finance Corporation (Finance Corporation), – The purpose of the Finance Corporation includes the support to the University in matters pertaining to the financing of the University's football stadium and, subsequently, the management and operation of the facility. 18 27 MARCH 2015 REPORT NO. 2015-123 FLORIDA INTERNATIONAL UNIVERSITY A COMPONENT UNIT OF THE STATE OF FLORIDA NOTES TO FINANCIAL STATEMENTS (CONTINUED) JUNE 30, 2014 The Florida International University Academic Health Center Health Care Network Faculty Group Practice, Inc. (Health Care Network), – The purpose of the Health Care Network is to improve and support health education at the University. Financial activities of the Research Foundation are not included in the University’s financial statements. The total assets and operating revenues related to the Research Foundation are $306,955 and $0, respectively. These amounts represent one percent or less of the total aggregate component unit assets and operating revenues. The resulting changes in net position are presented in note 2. An annual audit of each organization’s financial statements is conducted by independent certified public accountants. The annual report is submitted to the Auditor General and the University Board of Trustees. Additional information on the University’s component units, including copies of audit reports, is available by contacting the University Controller. Condensed financial statements for the University’s discretely presented component units are shown in a subsequent note. Basis of Presentation. The University’s accounting policies conform with accounting principles generally accepted in the United States of America applicable to public colleges and universities as prescribed by GASB. The National Association of College and University Business Officers (NACUBO) also provides the University with recommendations prescribed in accordance with generally accepted accounting principles promulgated by GASB and the Financial Accounting Standards Board (FASB). GASB allows public universities various reporting options. The University has elected to report as an entity engaged in only business-type activities. This election requires the adoption of the accrual basis of accounting and entitywide reporting including the following components: Management’s Discussion and Analysis Basic Financial Statements: Statement of Net Position Statement of Revenues, Expenses, and Changes in Net Position Statement of Cash Flows Notes to Financial Statements Other Required Supplementary Information Basis of Accounting. Basis of accounting refers to when revenues, expenses, and related assets, deferred outflows of resources, and liabilities are recognized in the accounts and reported in the financial statements. Specifically, it relates to the timing of the measurements made, regardless of the measurement focus applied. The University’s financial statements are presented using the economic resources measurement focus and the accrual basis of accounting. Revenues, expenses, gains, losses, assets, deferred outflows of resources, and liabilities resulting from exchange and exchange-like transactions are recognized when the exchange takes place. Revenues, expenses, gains, losses, assets, deferred outflows of resources, and liabilities resulting from nonexchange activities are generally recognized when all applicable eligibility requirements, including time requirements, are met. The University follows GASB standards of accounting and financial reporting. 19 28 MARCH 2015 REPORT NO. 2015-123 FLORIDA INTERNATIONAL UNIVERSITY A COMPONENT UNIT OF THE STATE OF FLORIDA NOTES TO FINANCIAL STATEMENTS (CONTINUED) JUNE 30, 2014 The University’s discretely presented component units use the economic resources measurement focus and accrual basis of accounting whereby revenues are recognized when earned and expenses are recognized when incurred, and follow GASB standards of accounting and financial reporting except for the Foundation, which follows FASB standards of accounting and financial reporting for not-for-profit organizations. Significant interdepartmental sales between auxiliary service departments and other institutional departments have been accounted for as reductions of expenses and not revenues of those departments. The University’s principal operating activities consist of instruction, research, and public service. Operating revenues and expenses generally include all fiscal transactions directly related to these activities as well as administration, operation and maintenance of capital assets, and depreciation on capital assets. Nonoperating revenues include State noncapital appropriations, Federal and State student financial aid, and investment income (net of unrealized gains or losses on investments). Interest on capital asset-related debt is a nonoperating expense. The statement of net position is presented in a classified format to distinguish between current and noncurrent assets and liabilities. When both restricted and unrestricted resources are available to fund certain programs, it is the University’s policy to first apply the restricted resources to such programs, followed by the use of the unrestricted resources. The statement of revenues, expenses, and changes in net position is presented by major sources and is reported net of tuition scholarship allowances. Tuition scholarship allowances are the difference between the stated charge for goods and services provided by the University and the amount that is actually paid by a student or a third party making payment on behalf of the student. The University applied “The Alternate Method” as prescribed in NACUBO Advisory Report 2000-05 to determine the reported net tuition scholarship allowances. Under this method, the University computes these amounts by allocating the cash payments to students, excluding payments for services, on a ratio of total aid to the aid not considered third-party aid. The statement of cash flows is presented using the direct method in compliance with GASB Statement No. 9, Reporting Cash Flows of Proprietary and Nonexpendable Trust Funds and Governmental Entities That Use Proprietary Fund Accounting. Cash and Cash Equivalents. Cash and cash equivalents consist of cash on hand and cash in demand accounts. University cash deposits are held in banks qualified as public depositories under Florida law. All such deposits are insured by Federal depository insurance, up to specified limits, or collateralized with securities held in Florida’s multiple financial institution collateral pool required by Chapter 280, Florida Statutes. Cash and cash equivalents that are externally restricted to make debt service payments, maintain sinking or reserve funds, or to purchase or construct capital or other restricted assets, are classified as restricted. Concentration of Credit Risk – Component Units Financial instruments that potentially subject the Foundation to concentrations of credit risk consist principally of cash and cash equivalents in banks, investments, and promises to give. 20 29 MARCH 2015 REPORT NO. 2015-123 FLORIDA INTERNATIONAL UNIVERSITY A COMPONENT UNIT OF THE STATE OF FLORIDA NOTES TO FINANCIAL STATEMENTS (CONTINUED) JUNE 30, 2014 In addition to insurance provided by the Federal Depository Insurance Corporation (FDIC), the Foundation, the Finance Corporation and the Health Care Network deposits are held in banking institutions approved by the State Treasurer of the State of Florida to hold public funds. Under Florida Statutes Chapter 280, Florida Security for Public Deposits Act, the State Treasurer requires all Florida qualified public depositories to deposit with the Treasurer or another banking institution, eligible collateral. In the event of a failure of a qualified public depository, the remaining public depositories would be responsible for covering any resulting losses. Accordingly, all amounts reported as deposits are insured or collateralized with securities held by the entity or its agent in the entity’s name. Financial instruments that potentially subject the Finance Corporation to concentration of credit risk consist principally of cash in banks and investments. Capital Assets. University capital assets consist of land; works of art and historical treasures; construction in progress; buildings, infrastructure and other improvements; furniture and equipment; library resources; property under capital leases and leasehold improvements; and computer software. These assets are capitalized and recorded at cost at the date of acquisition or at estimated fair value at the date received in the case of gifts and purchases of State surplus property. Additions, improvements, and other outlays that significantly extend the useful life of an asset are capitalized. Other costs incurred for repairs and maintenance are expensed as incurred. The University has a capitalization threshold of $250 for library resources, $5,000 for tangible personal property, and $250,000 for leasehold improvements and other improvements. There are no capitalization thresholds for new buildings or renovation projects that add new square footage. Depreciation is computed on the straight-line basis over the following estimated useful lives: Buildings – 20 to 50 years Infrastructure and Other Improvements – 15 years Furniture and Equipment – 3 to 20 years Library Resources – 10 years Property Under Capital Leases – 5 years Leasehold Improvements – Various based on lease terms Computer Software – 5 years Depreciable assets of the Foundation are stated at cost and are net of accumulated depreciation of $4,318,279. Depreciation is provided using the straight-line method over the estimated useful lives of the assets, ranging from 5 to 40 years. Depreciable assets of the Health Care Network are stated at cost and are net of accumulated depreciation of $536,874. Depreciation is provided using the straight-line method over the estimated useful lives from 5 to 15 years for the assets. Noncurrent Liabilities. Noncurrent liabilities include capital improvement debt payable, capital lease payable, compensated absences payable, other postemployment benefits payable, unearned revenue, liability for 21 30 MARCH 2015 REPORT NO. 2015-123 FLORIDA INTERNATIONAL UNIVERSITY A COMPONENT UNIT OF THE STATE OF FLORIDA NOTES TO FINANCIAL STATEMENTS (CONTINUED) JUNE 30, 2014 self-insured claims, and other long-term liabilities that are not scheduled to be paid within the next fiscal year. Capital improvement debt is reported net of unamortized premium on refunding. The University amortizes debt premiums over the life of the debt using the straight-line method. Deferred losses on refunding are amortized over the life of the old debt or new debt (whichever is shorter) using the straight-line method. 2. ADJUSTMENT TO BEGINNING NET POSITION – COMPONENT UNITS The beginning net position of the aggregate component unit column was decreased by $226,735 due to the exclusion of the Research Foundation, a discretely presented component unit that is no longer reported in the University’s financial statements as disclosed in note 1. 3. INVESTMENTS Section 1011.42(5), Florida Statutes, authorizes universities to invest funds with the State Treasury and State Board of Administration (SBA), and requires that universities comply with the statutory requirements governing investment of public funds by local governments. Accordingly, universities are subject to the requirements of Chapter 218, Part IV, Florida Statutes. The University’s Board of Trustees has adopted a written investment policy providing that surplus funds of the University shall be invested in those institutions and instruments permitted under the provisions of Florida Statutes. Pursuant to Section 218.415(16), Florida Statutes, the University is authorized to invest in the Florida PRIME investment pool administered by the SBA; interest-bearing time deposits and savings accounts in qualified public depositories, as defined in Section 280.02, Florida Statutes; direct obligations of the United States Treasury; obligations of Federal agencies and instrumentalities; securities of, or interests in, certain open-end or closed-end management type investment companies; Securities and Exchange Commission registered money market funds with the highest credit quality rating from a nationally recognized rating agency; and other investments approved by the University’s Board of Trustees as authorized by law. Investments set aside to make debt service payments, maintain sinking or reserve funds, or to purchase or construct capital assets are classified as restricted. The University’s investments at June 30, 2014, are reported at fair value, as follows: Investment Type Amount External Investment Pools: State Treasury Special Purpose Investment Account SBA Florida PRIME SBA Fund B Surplus Funds Trust Fund SBA Debt Service Accounts Mutual Funds: Limited Partnerships Equities Fixed Income and Bond Mutual Funds Commodities Money Market Funds $ 63,881,559 1,828 985 2,844,444 26,033,628 74,865,323 100,592,177 24,057,547 16,147,898 $ 308,425,389 Total University Investments 22 31 MARCH 2015 REPORT NO. 2015-123 FLORIDA INTERNATIONAL UNIVERSITY A COMPONENT UNIT OF THE STATE OF FLORIDA NOTES TO FINANCIAL STATEMENTS (CONTINUED) JUNE 30, 2014 External Investment Pools State Treasury Special Purpose Investment Account. The University reported investments at fair value totaling $63,881,559 at June 30, 2014, in the State Treasury Special Purpose Investment Account (SPIA) investment pool, representing ownership of a share of the pool, not the underlying securities. The SPIA carried a credit rating of A+f by Standard & Poor’s, had an effective duration of 2.57 years and fair value factor of 1.0074 at June 30, 2014. The University relies on policies developed by the State Treasury for managing interest rate risk or credit risk for this investment pool. Disclosures for the State Treasury investment pool are included in the notes to financial statements of the State’s Comprehensive Annual Financial Report. State Board of Administration Florida PRIME. At June 30, 2014, the University reported investments totaling $1,828 in the Florida PRIME investment pool administered by the SBA pursuant to Section 218.405, Florida Statutes. The University’s investments in the Florida PRIME investment pool, which the SBA indicates is a Securities and Exchange Commission Rule 2a7-like external investment pool, at June 30, 2014, are similar to money market funds in which shares are owned in the fund rather than the underlying investments. The Florida PRIME investment pool carried a credit rating of AAAm by Standard & Poor’s and had a weighted-average days to maturity (WAM) of 40 days as of June 30, 2014. A portfolio’s WAM reflects the average maturity in days, based on final maturity or reset date, in the case of floating rate instruments. WAM measures the sensitivity of the Florida PRIME investment pool to interest rate changes. The investments in the Florida PRIME investment pool are reported at fair value, which is amortized cost. State Board of Administration Fund B Surplus Funds Trust Fund. The Fund B Surplus Funds Trust Fund (Fund B) is administered by the SBA pursuant to Sections 218.405 and 218.417, Florida Statutes, and is not subject to participant withdrawal requests. Distributions from Fund B, as determined by the SBA, are effected by transferring eligible cash or securities to the Florida PRIME investment pool, consistent with the pro rata allocation of pool shareholders of record at the creation date of Fund B on December 4, 2007. One hundred percent of such distributions from Fund B are available as liquid balance within the Florida PRIME investment pool. At June 30, 2014, the University reported investments at fair value of $985 in Fund B. The University’s investments in Fund B are accounted for as a fluctuating net asset value pool, with a fair value factor of 1.84438408 at June 30, 2014. The weighted-average life (WAL) of Fund B at June 30, 2014, was 2.86 years. A portfolio’s WAL is the dollar-weighted average length of time until securities held reach maturity and is based on legal final maturity dates for Fund B as of June 30, 2014. WAL measures the sensitivity of Fund B to interest rate changes. The University’s investment in Fund B is unrated. State Board of Administration Debt Service Accounts The University reported investments totaling $2,844,444 at June 30, 2014, in the SBA Debt Service Accounts. These investments are used to make debt service payments on bonds issued by the State Board of Education for the benefit of the University. The University’s investments consist of United States Treasury securities, with maturity dates of six months or less, and are reported at fair value. The University relies on policies developed by 23 32 MARCH 2015 REPORT NO. 2015-123 FLORIDA INTERNATIONAL UNIVERSITY A COMPONENT UNIT OF THE STATE OF FLORIDA NOTES TO FINANCIAL STATEMENTS (CONTINUED) JUNE 30, 2014 the SBA for managing interest rate risk or credit risk for these accounts. Disclosures for the Debt Service Accounts are included in the notes to financial statements of the State’s Comprehensive Annual Financial Report. Fixed Income and Bond Mutual Funds The University invested in various mutual funds in accordance with the University’s investment policy. The following risks apply to the University's fixed income and bond mutual fund investments: Interest Rate Risk: Interest rate risk is the risk that changes in interest rates will adversely affect the fair value of an investment. Pursuant to Section 218.415(6), Florida Statutes, the University's investments in securities must provide sufficient liquidity to pay obligations as they come due. The future maturities of the securities held in the fixed income and bond mutual funds at June 30, 2014, are as follows: University Debt Investment Maturities Investment Maturities (In Years) Less 1-5 6-10 Than 1 Type of Investment Fair Market Value Fixed Income Mutual Fund TIPS Index Fund High Yield Bond Mutual Fund Total $ 57,482,237 20,760,391 $ 22,349,549 $ 100,592,177 $ More Than 10 2,523,471 7,251 $ 28,758,363 7,100,359 $ 19,308,283 8,239,821 $ 6,892,120 5,412,960 3,930,799 10,373,676 6,912,059 1,133,015 6,461,521 $ 46,232,398 $ 34,460,163 $ 13,438,095 Credit Risk: Credit risk is the risk that an issuer or other counterparty to an investment will not fulfill its obligations. At June 30, 2014, the securities held in the fixed income and bond mutual funds had credit quality ratings by a nationally-recognized agency (i.e., Standard & Poor's or Moody's), as follows: University Debt Investment Credit Quality Ratings Type of Investment Fixed Income Mutual Fund TIPS Index Fund High Yield Bond Mutual Fund Total Fair Value AAA / Aaa AA / Aa A BBB / Baa to Not Rated 57,482,237 20,760,391 $ 32,178,557 20,760,391 $ 2,063,612 $ 9,685,757 $ 13,554,311 22,349,549 2,122 $ 100,592,177 $ 52,941,070 $ 22,347,427 $ 2,063,612 $ 9,685,757 $ 35,901,738 Concentration of Credit Risk: Concentration of credit risk is the risk of loss attributed to the magnitude of the University's investment in a single issuer. The University's investment policy addresses the issue of concentration of credit risk by establishing the following restrictions: Maximum position in an individual security (excluding government securities) must not exceed 5 percent of the account market value. 24 33 MARCH 2015 REPORT NO. 2015-123 FLORIDA INTERNATIONAL UNIVERSITY A COMPONENT UNIT OF THE STATE OF FLORIDA NOTES TO FINANCIAL STATEMENTS (CONTINUED) JUNE 30, 2014 Maximum position in any one issuer (excluding government securities) must not exceed 5 percent of the account market value. Component Units Investments The Foundation’s investments at June 30, 2014, are reported at fair value as follows: Investment Type Amount Domestic Equities Global Equities Real Assets Fixed Income Hedge Funds Private Investments Subtotal Plus Accrued Income $ 39,592,756 66,656,683 19,864,453 31,101,247 58,638,683 17,018,260 232,872,082 12,543 Total $ 232,884,625 The Finance Corporation investments are made in accordance with the trust indenture. The investments at June 30, 2014, are reported at fair value, as follows: Investment Type Amount External Investment Pools: SBA Fund B Surplus Funds Trust Fund Money Market Mutual Funds $ Total $ 3,798,036 110,267 3,687,769 Credit Risk: At June 30, 2014, the Finance Corporation money market mutual fund investments were rated AAAm by Standard & Poor's. Fund B is not rated by any nationally-recognized agency. 4. RECEIVABLES Accounts Receivable. Accounts receivable represent amounts for student tuition and fees, contract and grant reimbursements due from third parties, various sales and services provided to students and third parties, and interest accrued on investments and loans receivable. As of June 30, 2014, the University reported the following amounts as accounts receivable: Description Amount Student Tuition and Fees Contracts and Grants Other $ 18,971,343 6,807,908 140,114 Total Accounts Receivable $ 25,919,365 Loans and Notes Receivable. Loans and notes receivable represent all amounts owed on promissory notes from debtors, including student loans made under the Federal Perkins Loan Program and other loan programs. 25 34 MARCH 2015 REPORT NO. 2015-123 FLORIDA INTERNATIONAL UNIVERSITY A COMPONENT UNIT OF THE STATE OF FLORIDA NOTES TO FINANCIAL STATEMENTS (CONTINUED) JUNE 30, 2014 Allowance for Doubtful Receivables. Allowances for doubtful accounts, and loans and notes receivable, are reported based on management’s best estimate as of fiscal year-end considering type, age, collection history, and other factors considered appropriate. Accounts receivable, and loans and notes receivable, are reported net of allowances of $19,234,009 and $1,429,925, respectively, at June 30, 2014. 5. DUE FROM STATE This amount consists of $36,000,931 of Public Education Capital Outlay and $8,652,357 of Capital Improvement Fees Trust due from the State for the construction of University facilities. 6. DUE FROM AND TO COMPONENT UNITS/UNIVERSITY The University’s financial statements are reported for the fiscal year ended June 30, 2014. One component unit is not presented (see Note 1). Additionally, component units' due from and due to amounts include receivables and payables between the various component units. Accordingly, amounts reported by the University as due from and to component units on the Statement of Net Position may not agree with amounts reported by the component units as due from and to the University. 7. CAPITAL ASSETS Capital assets activity for the fiscal year ended June 30, 2014, is shown below: Description Nondepreciable Capital Assets: Land Works of Art and Historical Treasures Construction in Progress Total Nondepreciable Capital Assets Depreciable Capital Assets: Buildings Infrastructure and Other Improvements Furniture and Equipment Library Resources Property Under Capital Leases and Leasehold Improvements Computer Software Beginning Balance $ 28,389,550 3,962,039 146,214,362 $ $ 178,565,951 $ 97,138,952 $ 844,561,590 17,919,421 113,470,243 105,211,440 $ 68,095,948 78,700 10,838,822 4,281,037 752,569 2,038,585 Total Depreciable Capital Assets Less, Accumulated Depreciation: Buildings Infrastructure and Other Improvements Furniture and Equipment Library Resources Property Under Capital Leases and Leasehold Improvements Computer Software Total Accumulated Depreciation Total Depreciable Capital Assets, Net Additions $ 28,671,778 4,204,249 172,454,441 $ 70,374,435 $ 205,330,468 $ $ 8,269,352 5,086,540 912,657,538 17,998,121 116,039,713 104,405,937 1,036,998 502,322 180,459 1,789,567 2,360,448 1,083,953,848 84,833,827 13,536,351 1,155,251,324 252,818,407 13,454,093 79,298,825 62,633,940 23,232,543 437,802 8,910,156 8,474,301 8,077,762 5,086,540 276,050,950 13,891,895 80,131,219 66,021,701 123,409 1,313,592 91,022 303,670 180,458 214,431 1,436,804 409,642,266 41,449,494 13,344,760 437,747,000 674,311,582 $ 43,384,333 26 $ Ending Balance $ 35 282,228 242,210 96,614,514 Reductions 70,374,435 $ 191,591 $ 717,504,324 MARCH 2015 REPORT NO. 2015-123 FLORIDA INTERNATIONAL UNIVERSITY A COMPONENT UNIT OF THE STATE OF FLORIDA NOTES TO FINANCIAL STATEMENTS (CONTINUED) JUNE 30, 2014 8. UNEARNED REVENUE Unearned revenue includes contract and grants payments received in advance, nonrefundable admission fees, prepaid stadium rental income received from the Finance Corporation, conference center fees, land use fees and athletic revenues received prior to fiscal year-end related to subsequent accounting periods. As of June 30, 2014, the University reported the following amounts as unearned revenue: Description Amount Contracts and Grants Admission Fees Stadium Rental Income Conference Center Fees Land Use Fees Athletic Revenues $ 3,605,383 1,323,695 1,304,083 70,334 52,381 9,500 Total Unearned Revenue $ 6,365,376 9. LONG-TERM LIABILITIES Long-term liabilities of the University at June 30, 2014, include capital improvement debt payable, capital lease payable, compensated absences payable, other postemployment benefits payable, the long-term portion of unearned revenue, liability for self-insured claims, and other long-term liabilities. Long-term liabilities activity for the fiscal year ended June 30, 2014, is shown below: Description Beginning Balance Additions Reductions Ending Balance Current Portion Capital Improvement Debt Payable Capital Lease Payable Compensated Absences Payable Other Postemployment Benefits Payable Unearned Revenue Liability for Self-Insured Claims Other Long-Term Liabilities $ 158,683,324 $ 49,663,919 1,037,000 6,141,915 $ 25,866,990 2,627,057 $ 182,480,253 1,037,000 37,688,370 $ 8,830,085 181,770 2,806,276 26,197,000 32,592,946 75,730 2,431,463 12,314,000 2,172,086 26,536 1,163,000 8,372,639 22,436 202,901 37,348,000 26,392,393 79,830 2,228,562 Total Long-Term Liabilities $ 254,153,975 $ 71,355,456 $ 38,255,023 $ 287,254,408 34,173,512 27 36 40,713 $ 11,858,844 MARCH 2015 REPORT NO. 2015-123 FLORIDA INTERNATIONAL UNIVERSITY A COMPONENT UNIT OF THE STATE OF FLORIDA NOTES TO FINANCIAL STATEMENTS (CONTINUED) JUNE 30, 2014 Capital Improvement Debt Payable. The University had the following capital improvement debt payable outstanding at June 30, 2014: Capital Improvement Debt Type and Series Student Housing Debt: 2004A Student Apartments 2011 Student Apartments Refunding 2012 Student Apartments Total Student Housing Debt Parking Garage Debt: 2009 Parking Garage A&B 2013A Parking Garage Total Parking Garage Debt Total Capital Improvement Debt Amount of Original Debt Amount Outstanding (1) Interest Rates (Percent) Maturity Date To $ 53,915,000 22,210,000 53,655,000 $ 32,661,690 20,227,483 53,115,636 4.00 - 5.00 3.00 - 5.00 3.00 - 4.25 2034 2025 2041 129,780,000 106,004,809 32,000,000 48,365,000 28,915,000 47,560,444 4.00 - 6.875 3.00 - 5.25 2039 2043 80,365,000 76,475,444 $ 210,145,000 $ 182,480,253 Note: (1) Amount outstanding includes unamortized discounts and premiums, and deferred losses on refunding issues. The University has pledged a portion of future housing rental revenues, traffic and parking fees, and an assessed transportation fee per student to repay $210,145,000 of capital improvement (housing and parking) revenue bonds issued by the Florida Board of Governors on behalf of the University. Proceeds from the bonds provided financing to construct parking garages and student housing facilities. The bonds are payable solely from housing rental income, parking fees, and assessed transportation fees per student and are payable through 2043. The University has committed to appropriate each year from the housing rental income, parking fees, and assessed transportation fees per student amounts sufficient to cover the principal and interest requirements on the debt. Total principal and interest remaining on the debt is $294,951,678, and principal and interest paid for the current year totaled $17,936,281. During the 2013-14 fiscal year, housing rental income, traffic and parking fees, and assessed transportation fees totaled $30,458,678, $5,433,093, and $10,103,245, respectively. On September 26, 2013, the Florida Board of Governors issued $48,365,000 of Capital Improvement Parking Garage Revenue Bonds, Series 2013A. A portion of the capital improvement debt proceeds was used to defease $14,865,000 of outstanding Capital Improvement Parking Garage Revenue Bonds, Series 1999 and 2002, with the remaining portion used to finance the construction of a parking garage facility on the main campus of the University. A portion of the proceeds were placed in an irrevocable trust with an escrow agent to provide for all future debt service payments on the defeased bonds. The trust assets and the liability for the defeased bonds are not included in the University's statement of net position. As a result of the refunding, the University reduced its capital improvement debt service requirement by $1,142,450 over the next 9 years and obtained an economic gain of $1,001,780. At June 30, 2014, there was no outstanding balance of the defeased debt. 28 37 MARCH 2015 REPORT NO. 2015-123 FLORIDA INTERNATIONAL UNIVERSITY A COMPONENT UNIT OF THE STATE OF FLORIDA NOTES TO FINANCIAL STATEMENTS (CONTINUED) JUNE 30, 2014 Annual requirements to amortize all capital improvement debt outstanding as of June 30, 2014, are as follows: Fiscal Year Ending June 30 2015 2016 2017 2018 2019 2020-2024 2025-2029 2030-2034 2035-2039 2040-2043 Principal $ Subtotal Plus: Net Bond Discounts and Premiums on Bond Refunding 8,265,000 8,615,000 6,920,000 7,220,000 7,545,000 36,070,000 32,770,000 32,060,000 27,700,000 12,990,000 180,155,000 $ Total 8,364,765 7,995,015 7,605,390 7,293,610 6,954,130 29,967,870 22,615,223 15,159,888 7,520,975 1,319,812 $ 16,629,765 16,610,015 14,525,390 14,513,610 14,499,130 66,037,870 55,385,223 47,219,888 35,220,975 14,309,812 114,796,678 294,951,678 2,325,253 $ 182,480,253 Total Interest 2,325,253 $ 114,796,678 $ 297,276,931 Capital Lease Payable – Related Party Transaction. Land and a building in the amount of $1,037,000 are being acquired under a capital lease agreement with the Foundation. The stated interest rate is 6.6 percent. Future minimum payments under the capital lease agreement and the present value of the minimum payments as of June 30, 2014, are as follows: Fiscal Year Ending June 30 Amount 2015 2016 2017 2018 2019 $ Total Minimum Payments Less, Amount Representing Interest Present Value of Minimum Payments 250,212 250,212 250,212 250,212 250,212 1,251,060 (214,060) $ 1,037,000 Compensated Absences Payable. Employees earn the right to be compensated during absences for annual leave (vacation) and sick leave earned pursuant to Board of Governors regulations, University regulations, and bargaining agreements. Leave earned is accrued to the credit of the employee and records are kept on each employee’s unpaid (unused) leave balance. The University reports a liability for the accrued leave; however, State noncapital appropriations fund only the portion of accrued leave that is used or paid in the current fiscal year. Although the University expects the liability to be funded primarily from future appropriations, generally accepted accounting principles do not permit the recording of a receivable in anticipation of future appropriations. At June 30, 2014, the estimated liability for compensated absences, which includes the University’s share of the Florida Retirement System and FICA contributions, totaled $37,688,370. The current portion of the 29 38 MARCH 2015 REPORT NO. 2015-123 FLORIDA INTERNATIONAL UNIVERSITY A COMPONENT UNIT OF THE STATE OF FLORIDA NOTES TO FINANCIAL STATEMENTS (CONTINUED) JUNE 30, 2014 compensated absences liability, $2,806,276, is the amount expected to be paid in the coming fiscal year, and represents a historical percentage of leave used applied to the total accrued leave liability. Other Postemployment Benefits Payable. The University follows GASB Statement No. 45, Accounting and Financial Reporting by Employers for Postemployment Benefits Other Than Pensions, for certain postemployment healthcare benefits administered by the State Group Health Insurance Program. Plan Description. Pursuant to the provisions of Section 112.0801, Florida Statutes, all employees who retire from the University are eligible to participate in the State Group Health Insurance Program, an agent multiple-employer, defined-benefit plan (Plan). The University subsidizes the premium rates paid by retirees by allowing them to participate in the Plan at reduced or blended group (implicitly subsidized) premium rates for both active and retired employees. These rates provide an implicit subsidy for retirees because, on an actuarial basis, their current and future claims are expected to result in higher costs to the Plan on average than those of active employees. Retirees are required to enroll in the Federal Medicare program for their primary coverage as soon as they are eligible. A stand-alone report is not issued and the Plan information is not included in the report of a public employee retirement system or another entity. Funding Policy. Plan benefits are pursuant to the provisions of Section 112.0801, Florida Statutes, and benefits and contributions can be amended by the Florida Legislature. The University has not advance-funded or established a funding methodology for the annual other postemployment benefit (OPEB) costs or the net OPEB obligation, and the Plan is financed on a pay-as-you-go basis. For the 2013-14 fiscal year, 348 retirees received postemployment healthcare benefits. The University provided required contributions of $1,163,000 toward the annual OPEB cost, comprised of benefit payments made on behalf of retirees for claims expenses (net of reinsurance), administrative expenses, and reinsurance premiums. Retiree contributions totaled $2,123,000, which represents 0.6 percent of covered payroll. Annual OPEB Cost and Net OPEB Obligation. The University’s annual OPEB cost (expense) is calculated based on the annual required contribution (ARC), an amount actuarially determined in accordance with the parameters of GASB Statement No. 45. The ARC represents a level of funding that if paid on an ongoing basis, is projected to cover normal cost each year and amortize any unfunded actuarial liabilities over a period not to exceed 30 years. The following table shows the University’s annual OPEB cost for the fiscal year, the amount actually contributed to the Plan, and changes in the University’s net OPEB obligation: 30 39 MARCH 2015 REPORT NO. 2015-123 FLORIDA INTERNATIONAL UNIVERSITY A COMPONENT UNIT OF THE STATE OF FLORIDA NOTES TO FINANCIAL STATEMENTS (CONTINUED) JUNE 30, 2014 Description Amount Normal Cost (Service Cost for One Year) Amortization of Unfunded Actuarial Accrued Liability Interest on Normal Cost and Amortization $ 7,702,000 4,004,000 468,000 Annual Required Contribution Interest on Net OPEB Obligation Adjustment to Annual Required Contribution 12,174,000 1,048,000 (908,000) Annual OPEB Cost (Expense) Contribution Toward the OPEB Cost 12,314,000 (1,163,000) Increase in Net OPEB Obligation Net OPEB Obligation, Beginning of Year 11,151,000 26,197,000 $ 37,348,000 Net OPEB Obligation, End of Year The University’s annual OPEB cost, the percentage of annual OPEB cost contributed to the Plan, and the net OPEB obligation as of June 30, 2014, and for the two preceding fiscal years, were as follows: Fiscal Year 2011-12 2012-13 2013-14 Annual OPEB Cost $ 8,561,000 8,614,000 12,314,000 Percentage of Annual OPEB Cost Contributed 17.0% 18.6% 9.4% Net OPEB Obligation $ 19,185,000 26,197,000 37,348,000 Funded Status and Funding Progress. As of July 1, 2013, the most recent actuarial valuation date, the actuarial accrued liability for benefits was $120,121,000, and the actuarial value of assets was $0, resulting in an unfunded actuarial accrued liability of $120,121,000, and a funded ratio of 0 percent. The covered payroll (annual payroll of active participating employees) was $332,597,433 for the 2013-14 fiscal year, and the ratio of the unfunded actuarial accrued liability to the covered payroll was 36.1 percent. Actuarial valuations of an ongoing plan involve estimates of the value of reported amounts and assumptions about the probability of occurrence of events far into the future. Examples include assumptions about future employment and termination, mortality, and healthcare cost trends. Amounts determined regarding the funded status of the plan and the annual required contributions of the employer are subject to continual revision as actual results are compared with past expectations and new estimates are made about the future. The Schedule of Funding Progress, presented as required supplementary information following the notes to financial statements, presents multiyear trend information that shows whether the actuarial value of plan assets is increasing or decreasing over time relative to the actuarial accrued liabilities for benefits. Actuarial Methods and Assumptions. Projections of benefits for financial reporting purposes are based on the substantive plan provisions, as understood by the employer and participating members, and include the types of 31 40 MARCH 2015 REPORT NO. 2015-123 FLORIDA INTERNATIONAL UNIVERSITY A COMPONENT UNIT OF THE STATE OF FLORIDA NOTES TO FINANCIAL STATEMENTS (CONTINUED) JUNE 30, 2014 benefits provided at the time of each valuation and the historical pattern of sharing of benefit costs between the employer and participating members. The actuarial methods and assumptions used include techniques that are designed to reduce the effects of short-term volatility in actuarial accrued liabilities and the actuarial value of assets, consistent with the long-term perspective of the calculations. The University’s OPEB actuarial valuation as of July 1, 2013, used the entry-age cost actuarial method to estimate the actuarial accrued liability as of June 30, 2014, and the University’s 2013-14 fiscal year ARC. This method was selected because it is the same method used for the valuation of the Florida Retirement System. Because the OPEB liability is currently unfunded, the actuarial assumptions included a 4 percent rate of return on invested assets. The actuarial assumptions also included a payroll growth rate of 4 percent per year and an inflation rate of 3 percent. Initial healthcare cost trend rates were 7.4, 7.0, and 8.2 percent for the first three years, respectively, for all retirees in the Preferred Provider Option (PPO) Plan, and 3.9, 7.8, and 8.3 percent for the first three years for all retirees in the Health Maintenance Organization (HMO) Plan. The PPO and HMO healthcare trend rates both grade down to an ultimate rate of 5 percent over 70 years. The unfunded actuarial accrued liability is being amortized over 30 years using the level percentage of projected payroll on an open basis. The remaining amortization period at June 30, 2014, was 23 years. Other Long-Term Liabilities. Primarily represents the University's liability for the Federal Capital Contribution (advance) provided to fund the University's Federal Perkins Loan program. This amount will ultimately be returned to the Federal Government should the University cease making Federal Perkins Loans or have excess cash in the loan program. 10. COMPONENT UNITS DEBT ISSUES Notes Payable – Florida International University Foundation, Inc. On January 20, 2000, the Miami-Dade County Educational Facilities Authority (the Authority) issued $13 million tax-exempt revenue bonds (Florida International University Foundation Project – Series 1999). These bonds are payable from and secured by a pledge of payments to be made to the Authority under a loan agreement dated December 1, 1999, between the Foundation and the Authority. The bonds are secured by an irrevocable letter of credit issued by a commercial bank as described below. The Foundation will finance the payments to the Authority under the loan agreement with lease payments received from the University under an operating lease (see note 15). The $13 million original principal amount was issued under a variable rate structure with a final maturity date of May 1, 2022. The variable rate on fifty percent of the original issue, $6.5 million, has been synthetically fixed at 4.63 percent through February 1, 2015, by way of an interest rate swap agreement with a commercial bank (see note 11). The bond proceeds were used to acquire, construct, and equip a multi-function support complex located on the Modesto A. Maidique campus and to pay issuance costs. As of June 30, 2014, the outstanding principal balance due under this note payable was $6.9 million. For the year ended June 30, 2014, total interest incurred and paid was $297,143. On December 1, 1999, the Foundation entered into a letter of credit agreement with a commercial bank that permitted the Foundation to borrow up to $13 million through December 15, 2004, bearing interest at the prime 32 41 MARCH 2015 REPORT NO. 2015-123 FLORIDA INTERNATIONAL UNIVERSITY A COMPONENT UNIT OF THE STATE OF FLORIDA NOTES TO FINANCIAL STATEMENTS (CONTINUED) JUNE 30, 2014 rate plus 2 percent. On November 29, 2004, this agreement was extended, with the same terms and conditions, through December 15, 2009. There were two additional extensions subsequent to that date through July 30, 2010. The Foundation must pay an annual commitment fee of 0.45 percent on the unused portion of the commitment. Borrowings under the financing agreement mature 90 days after the date of the borrowing. Under the letter of credit agreement and loan agreement noted above, the Foundation is obligated under certain debt covenants with which they are in compliance. The bonds were repurchased by the Trustee under a commercial bank letter of credit due to the diminishing ability to remarket the variable rate demand bonds in the public marketplace. On July 30, 2010, the bank converted the variable rate demand bonds into a five year tax exempt qualified loan. After the initial five year period, the bank would have the right to require the Foundation to refinance the bank qualified loan or could agree to extend the maturity date for an additional five year period. The Foundation agrees to pay interest at a rate of 67 percent of the one-month London Interbank Offered Rate (LIBOR) plus 1.68 percent. The bond maturity date of May 1, 2022, remains unchanged as does the swap agreement. On July 30, 2010, the Foundation paid $52,213 in refinancing fees to complete this transaction. Since the terms remained substantially the same and the present value of the cash outflows is not substantially different, this is not considered an exchange of debt instruments. The aggregate maturities of the notes payable, as of June 30, 2014, are shown in the following table: Fiscal Year Ending June 30 Amount 2015 2016 2017 2018 2019 Thereafter $ 755,000 745,000 785,000 825,000 865,000 2,945,000 Total $ 6,920,000 Notes Payable – The Florida International University Academic Health Center Health Care Network Faculty Group Practice, Inc. – Related Party Transaction On August 27, 2010, the Health Care Network entered into a loan agreement totaling $5,321,198 with the University in order to provide working capital and build out capital to fund the expansion of the faculty practice plan and the establishment of the ambulatory care center and other University clinical activities. Interest on the loan accrues at 2 percent simple interest and the loan is scheduled to mature on June 1, 2030. Drawdowns on the loan for the fiscal year ended June 30, 2014, totaled $5,321,198 and relate principally to expenses paid directly by the University on behalf of Health Care Network. The loan also includes approximately $203,000 of accrued interest as of June 30, 2014. Payments on the loan are scheduled to begin on June 1, 2015. Estimated principal and interest payments for the life of the amounts due to the University based on the balances as of June 30, 2014, are as follows: 33 42 MARCH 2015 REPORT NO. 2015-123 FLORIDA INTERNATIONAL UNIVERSITY A COMPONENT UNIT OF THE STATE OF FLORIDA NOTES TO FINANCIAL STATEMENTS (CONTINUED) JUNE 30, 2014 Fiscal Year Ending June 30 Principal 2015 2016 2017 2018 2019 2020-2024 2025-2029 2030 $ Total $ Interest $ 108,250 108,250 108,250 110,492 102,701 391,091 171,594 6,009 $ 108,250 108,250 108,250 500,000 500,000 2,500,000 2,500,000 306,464 $ 1,106,637 $ 6,631,214 389,508 397,299 2,108,909 2,328,406 300,455 5,524,577 Total Bonds Payable – FIU Athletics Finance Corporation On December 1, 2009, the Finance Corporation issued $30,000,000 of Miami-Dade County Industrial Development Authority Revenue Bonds Series 2009A and $5,310,000 of Miami-Dade County Industrial Development Authority Taxable Revenue Bonds Series 2009B. These bonds were issued and secured under and pursuant to the Trust Indenture. Repayments of the bonds will be payable from pledged revenues, which are all operating and nonoperating revenues. Principal payments for the bonds began March 1, 2010. Interest payments are made on a quarterly basis. The interest rate on the Series 2009A bonds is equal to the sum of 63.7 percent of the three-month LIBOR plus 1.90 percent. The interest rate on the Series 2009B bonds shall be at a rate equal to the three-month LIBOR plus 2.65 percent. The total proceeds from the new bond issues were used solely to retire and refund the outstanding Series 2007A and Series 2007B bonds and pay costs of issuance of the bonds and other refinancing costs. The bonds are secured by operating and nonoperating revenues as well as University athletic fees, not to exceed 5 percent of the total athletic fees collected. Total principal due at June 30, 2014, was $32,092,444. The Finance Corporation has funded a debt service reserve fund in accordance with the bond indenture requirement of maintaining an amount equal to the maximum allowable debt service on the bond in the current and any future fiscal year. This debt service reserve fund currently totals $2,648,876 and is included in restricted investments. The Finance Corporation is required to maintain minimum deposits of $1,500,000 with a bank. The deposit is to be held in an interest-bearing additional reserve fund and is included in restricted cash. The interest rate on these bonds is both fixed and variable and is subject to a swap agreement (see Note 11) that was entered into to reduce the exposure to market risks from changing interest rates. Interest is computed on the basis of the actual number of days elapsed over a year of 365 or 366 days. 34 43 MARCH 2015 REPORT NO. 2015-123 FLORIDA INTERNATIONAL UNIVERSITY A COMPONENT UNIT OF THE STATE OF FLORIDA NOTES TO FINANCIAL STATEMENTS (CONTINUED) JUNE 30, 2014 The aggregate maturities of these bonds as of June 30, 2014, are as follows: Fiscal Year Ending June 30 Principal Interest Total 2015 2016 2017 2018 2019 2020-2024 2025-2029 2030-2033 $ 676,567 697,270 1,090,035 1,300,000 1,357,143 7,778,571 9,714,286 9,478,572 $ 1,719,051 1,684,647 1,649,191 1,592,684 1,522,802 6,449,448 4,159,869 1,302,408 $ 2,395,618 2,381,917 2,739,226 2,892,684 2,879,945 14,228,019 13,874,155 10,780,980 Total $ 32,092,444 $ 20,080,100 $ 52,172,544 11. DERIVATIVE FINANCIAL INSTRUMENTS – COMPONENT UNITS The Foundation and the Finance Corporation entered into derivative instruments (i.e., interest rate swap agreements) to reduce their exposure to market risks from changing interest rates. For interest rate swap agreements, the differential to be paid or received is accrued and recognized as interest expense and may change as market interest rates change. These interest rate swap agreements, and a related Letter of Credit agreement entered into by the Finance Corporation, are discussed below. Florida International University Foundation, Inc. On February 1, 2000, the Foundation entered into an interest rate swap agreement with a commercial bank on a notional amount of $6,500,000 which represents 50 percent of the principal amount of the bond issue, as described in note 10. Under the original interest rate swap agreement, the Foundation agreed to pay a fixed rate of 5.03 percent per annum and receive variable rates based on 67 percent of the one-month U.S. Dollar London Interbank Offered Rate (LIBOR). Effective October 1, 2005, the Foundation renegotiated the interest rate swap agreement reducing the interest rate swap to 4.63 percent per annum. The renegotiated interest rate swap agreement expires on February 1, 2015. The derivative liability, included with reported other long-term liabilities at June 30, 2014, was $103,307. FIU Athletics Finance Corporation Objectives. As a means to lower its borrowing costs and increase its savings, the Finance Corporation entered into an interest rate swap agreement in connection with its $30,000,000 2009A Miami-Dade County Industrial Development Authority Revenue Bond issuance. The intention of the interest rate swap agreement was to effectively change the Finance Corporation's variable interest rate on the bonds to a synthetic fixed rate of 5.50 percent, which is the fixed rate payable by the Finance Corporation under the interest rate swap agreement of 3.60 percent plus 1.90 percent. Terms. On December 22, 2009, the Finance Corporation entered into an interest rate swap agreement to hedge the floating rate on $21,000,000 of the principal amount of the 2009A bonds. This represents the fixed portion of the tax exempt bonds payable mentioned above. Under the interest rate swap agreement, the Finance 35 44 MARCH 2015 REPORT NO. 2015-123 FLORIDA INTERNATIONAL UNIVERSITY A COMPONENT UNIT OF THE STATE OF FLORIDA NOTES TO FINANCIAL STATEMENTS (CONTINUED) JUNE 30, 2014 Corporation agrees to pay a fixed rate of 3.60 percent and receive a variable rate equal to 63.7 percent of the three-month LIBOR. The interest rate swap agreement has a maturity date of March 1, 2033. Fair Value. As of June 30, 2014, the Finance Corporation interest rate swap agreement has a derivative liability of $4,058,774 as included with reported other long-term liabilities in the statement of net position. The negative fair value was determined using Mark-to-Market Value and represents the closing mid-market values. As of June 30, 2014, the fair value of the Series 2007A ineffective interest rate swap agreement was $1,815,844, which is included with reported other long-term liabilities. This interest rate swap agreement was not terminated when the bonds were refunded in December 2009. The interest rate on the refunding Series 2009 bonds reflects a higher rate due to not terminating this interest rate swap agreement. Accordingly, the fair value of $1,815,844 of the ineffective Series 2007A interest rate swap agreement is being amortized over the remaining life of the refunding Series 2009A bonds. The synthetic instrument method evaluates the effectiveness of a potential hedging derivative instrument by quantitative approach. The synthetic instrument method evaluates effectiveness by combining the hedgeable item and the potential hedging derivative instrument to simulate a third synthetic instrument. A potential hedging derivative instrument is effective if its total variable cash flows substantially offset the variable cash flows of the hedgeable item. The Finance Corporation determined that it met the criteria of the synthetic instrument method. Therefore, the change in the fair value of the effective interest rate swap agreement is presented in the component units column of the statement of net position as a deferred outflow of resources in the amount of $2,242,930. Credit Risk. As of June 30, 2014, the Finance Corporation was not exposed to credit risk because the interest rate swap agreement had a negative fair value. However, should interest rates change and the fair value of the interest rate swap agreement become positive, the Finance Corporation would be exposed to credit risk in the amount of the derivative’s fair value. The interest rate swap agreement counterparty was rated Baa3 by Moody’s Investors Service, BBB by Standard and Poor’s and BBB- by Fitch. Basis Risk. Basis risk arises when different indexes are used in connection with a derivative. Given that both the bond and the interest rate swap agreement are based on 63.7 percent of the three-month LIBOR rate, there is limited basis risk. Termination Risk. The derivative contract uses the International Swap Dealers Association (ISDA) Master Agreement, which includes standard termination events, such as failure to pay and bankruptcy. The schedule to the Master Agreement includes an “additional termination event”. That is, the interest rate swap agreement may be terminated if: (i) the loan or other indebtedness in connection with which a transaction entered into by the Finance Corporation for the purpose or with the effect of altering the net combined payment from a floating to fixed or a fixed to floating rate basis is repaid, whether upon acceleration of principal, at maturity, or otherwise, or for any other reason ceases to be an obligation of the Finance Corporation, with or without the consent of the counterparty; or (ii) any credit support document expires, terminates, or ceases to be of full force and effect. Also, the interest rate swap agreement may be terminated or assigned by the Finance Corporation if the counterparty’s long-term, senior, unsecured, unenhanced debt rating is withdrawn, suspended, or falls below at 36 45 MARCH 2015 REPORT NO. 2015-123 FLORIDA INTERNATIONAL UNIVERSITY A COMPONENT UNIT OF THE STATE OF FLORIDA NOTES TO FINANCIAL STATEMENTS (CONTINUED) JUNE 30, 2014 least two of the following: a) “Baa3” as determined by Moody’s; or b) “BBB” as determined by Standard and Poor’s; or c) “BBB-” as determined by Fitch. Swap Payments and Associated Debt. Using rates as of June 30, 2014, debt service requirements of the variable-rate portion of the debt and net swap payments, assuming current interest rates remain the same for their term, are as follows: Fiscal Year Ending June 30 Variable-Rate Bond Principal Interest 2015 2016 2017 2018 2019 2020-2024 2025-2029 2030-2033 $ Total $ $ Interest Rate Swap, Net Total $ 755,686 755,686 755,686 746,330 713,584 3,022,205 1,949,310 610,307 $ 260,000 910,000 950,000 5,445,000 6,800,000 6,635,000 399,314 399,314 399,314 394,370 377,066 1,596,971 1,030,040 322,492 1,155,000 1,155,000 1,415,000 2,050,700 2,040,650 10,064,176 9,779,350 7,567,799 21,000,000 $ 4,918,881 $ 9,308,794 $ 35,227,675 Note: As rates vary, variable-rate bond interest payments and net swap payments will vary. 12. RETIREMENT PROGRAMS Florida Retirement System. Essentially all regular employees of the University are eligible to enroll as members of the State-administered Florida Retirement System (FRS). Provisions relating to the FRS are established by Chapters 121 and 122, Florida Statutes; Chapter 112, Part IV, Florida Statutes; Chapter 238, Florida Statutes; and Florida Retirement System Rules, Chapter 60S, Florida Administrative Code; wherein eligibility, contributions, and benefits are defined and described in detail. The FRS is a single retirement system administered by the Department of Management Services, Division of Retirement, and consists of two cost-sharing, multiple-employer retirement plans and other nonintegrated programs. These include a defined-benefit pension plan (Plan), with a Deferred Retirement Option Program (DROP), and a defined-contribution plan, referred to as the FRS Investment Plan (Investment Plan). Employees enrolled in the Plan prior to July 1, 2011, vest at six years of creditable service and employees enrolled in the Plan on or after July 1, 2011, vest at eight years of creditable service. All vested members, enrolled prior to July 1, 2011, are eligible for normal retirement benefits at age 62 or at any age after 30 years of service, except for members classified as special risk who are eligible for normal retirement benefits at age 55 or at any age after 25 years of service. All members enrolled in the Plan on or after July 1, 2011, once vested, are eligible for normal retirement benefits at age 65 or any time after 33 years of creditable service, except for members classified as special risk who are eligible for normal retirement benefits at age 60 or at any age after 30 years of service. Members of both Plans may include up to 4 years of credit for military service toward creditable service. The Plan also includes an early retirement provision; however, there is a benefit reduction for each year a member 37 46 MARCH 2015 REPORT NO. 2015-123 FLORIDA INTERNATIONAL UNIVERSITY A COMPONENT UNIT OF THE STATE OF FLORIDA NOTES TO FINANCIAL STATEMENTS (CONTINUED) JUNE 30, 2014 retires before his or her normal retirement date. The Plan provides retirement, disability, death benefits, and annual cost-of-living adjustments. DROP, subject to provisions of Section 121.091, Florida Statutes, permits employees eligible for normal retirement under the Plan to defer receipt of monthly benefit payments while continuing employment with an FRS employer. An employee may participate in DROP for a period not to exceed 60 months after electing to participate. During the period of DROP participation, deferred monthly benefits are held in the FRS Trust Fund and accrue interest. As provided in Section 121.4501, Florida Statutes, eligible FRS members may elect to participate in the Investment Plan in lieu of the FRS defined-benefit plan. University employees already participating in the State University System Optional Retirement Program or DROP are not eligible to participate in this program. Employer and employee contributions are defined by law, but the ultimate benefit depends in part on the performance of investment funds. The Investment Plan is funded by employer and employee contributions that are based on salary and membership class (Regular Class, Senior Management Service Class, etc.). Contributions are directed to individual member accounts, and the individual members allocate contributions and account balances among various approved investment choices. Employees in the Investment Plan vest at one year of service. The State of Florida establishes contribution rates for participating employers and employees. Contribution rates during the 2013-14 fiscal year were as follows: Percent of Gross Salary Class Employee Florida Retirement System, Regular Florida Retirement System, Senior Management Service Florida Retirement System, Special Risk Deferred Retirement Option Program - Applicable to Members from All of the Above Classes Florida Retirement System, Reemployed Retiree Employer (A) 3.00 3.00 3.00 6.95 18.31 19.06 0.00 (B) 12.84 (B) Notes: (A) Employer rates include 1.20 percent for the postemployment health insurance subsidy. Also, employer rates, other than for DROP participants, include .03 percent for administrative costs of the Investment Plan. (B) Contribution rates are dependent upon retirement class in which reemployed. The University’s liability for participation is limited to the payment of the required contribution at the rates and frequencies established by law on future payrolls of the University. The University’s contributions including employee contributions for the fiscal years ended June 30, 2012, June 30, 2013, and June 30, 2014, totaled 38 47 MARCH 2015 REPORT NO. 2015-123 FLORIDA INTERNATIONAL UNIVERSITY A COMPONENT UNIT OF THE STATE OF FLORIDA NOTES TO FINANCIAL STATEMENTS (CONTINUED) JUNE 30, 2014 $7,113,640, $7,771,995, and $10,934,906, respectively, which were equal to the required contributions for each fiscal year. There were 647 University participants in the Investment Plan during the 2013-14 fiscal year. The University’s contributions including employee contributions to the Investment Plan totaled $2,579,281, which was equal to the required contribution for the 2013-14 fiscal year. Financial statements and other supplementary information of the FRS are included in the State’s Comprehensive Annual Financial Report, which is available from the Florida Department of Financial Services’ Web site (www.myfloridacfo.com). An annual report on the FRS, which includes its financial statements, required supplementary information, actuarial report, and other relevant information, is available from the Florida Division of Retirement’s Web site (www.frs.myflorida.com). State University System Optional Retirement Program. Section 121.35, Florida Statutes, provides for an Optional Retirement Program (Program) for eligible university instructors and administrators. The Program is designed to aid State universities in recruiting employees by offering more portability to employees not expected to remain in FRS for eight or more years. The Program is a defined-contribution plan, which provides full and immediate vesting of all contributions submitted to the participating companies on behalf of the participant. Employees in eligible positions can make an irrevocable election to participate in the Program, rather than the FRS, and purchase retirement and death benefits through contracts provided by certain insurance carriers. The employing university contributes, on behalf of the participant, 7.34 percent of the participant’s salary, less a small amount used to cover administrative costs, and employees contribute 3 percent of the employee’s salary. Additionally, the employee may contribute, by payroll deduction, an amount not to exceed the percentage contributed by the University to the participant’s annuity account. The contributions are invested in the company or companies selected by the participant to create a fund for the purchase of annuities at retirement. There were 2,686 University participants during the 2013-14 fiscal year. The University’s contributions to the Program totaled $14,610,110 and employee contributions totaled $9,829,813 for the 2013-14 fiscal year. 39 48 MARCH 2015 REPORT NO. 2015-123 FLORIDA INTERNATIONAL UNIVERSITY A COMPONENT UNIT OF THE STATE OF FLORIDA NOTES TO FINANCIAL STATEMENTS (CONTINUED) JUNE 30, 2014 13. CONSTRUCTION COMMITMENTS The University’s construction commitments at June 30, 2014, are as follows: Project Description Total Committed Student Academic Support Center Parking Garage Six Mixed-Use Auxiliary Building Recreation Center Expansion User Paid Construction Projects FIU Ambulatory Care Center Robert Stempel College of Public Health and Social Science Building Utilities/Infrastructure/Capital Renewal Completed to Date $ 24,138,383 42,593,953 35,703,112 8,595,233 24,748,577 8,527,054 1,193,628 20,572,154 25,161,462 345 17,243,799 2,556,388 $ 22,944,755 22,021,799 10,541,650 8,594,888 7,504,778 5,970,666 31,026,142 3,603,832 25,442,704 392,130 5,583,438 3,211,702 178,936,286 95,927,328 92,562,610 79,891,831 86,373,676 16,035,497 $ 274,863,614 $ 172,454,441 $ 102,409,173 Subtotal Projects with Balance Committed Under $3 Million Total $ Balance Committed 14. OPERATING LEASE COMMITMENTS The University leased building space under operating leases, which expire in 2034. These leased assets and the related commitments are not reported on the University's statement of net position. Operating lease payments are recorded as expenses when paid or incurred. Outstanding commitments resulting from these lease agreements are contingent upon future appropriations. Included in the annual payments below are the minimum payments required for the operating lease due to the Foundation as described in note 15. Future minimum lease commitments for noncancelable operating leases are as follows: Fiscal Year Ending June 30 Amount 2015 2016 2017 2018 2019 2020-2024 2025-2029 2030-2034 $ 4,270,969 4,442,954 4,573,752 4,731,897 4,825,396 16,838,177 6,184,664 6,053,937 Total Minimum Payments Required $ 51,921,746 15. OPERATING LEASE COMMITMENTS – RELATED PARTY TRANSACTIONS Florida International University Foundation, Inc. On December 1, 1999, the former Board of Regents of the State University System of the State of Florida for and on behalf of the University entered into a ground lease agreement with the Foundation. Under this agreement, the Foundation leases from the University the grounds on which a multi-function support complex facility was 40 49 MARCH 2015 REPORT NO. 2015-123 FLORIDA INTERNATIONAL UNIVERSITY A COMPONENT UNIT OF THE STATE OF FLORIDA NOTES TO FINANCIAL STATEMENTS (CONTINUED) JUNE 30, 2014 built on the Modesto A. Maidique campus. The consideration required to be paid by the Foundation is $10 annually. The ground lease will expire on December 31, 2024, or on the date the Foundation makes its final payment under a letter of credit agreement related to the financing of the facility. Total amounts paid to the Foundation under this agreement were $1,375,281 and $1,405,552 for the years ended June 30, 2014, and June 30, 2013, respectively. On December 1, 1999, the former Board of Regents on behalf of the University also entered into a 20-year operating lease agreement with the Foundation for the facility. Under the terms of the operating lease, the University will pay the Foundation rent in the amount equal to all amounts due and payable by the Foundation under the letter of credit agreement, if any, and loan agreement related to the financing of the facility. The payments also include any costs of operating and maintaining the facility, in addition to amounts necessary to pay any unanticipated and extraordinary costs. The lease commenced during August 2002 when the facility became operational. The lease will terminate on May 1, 2022, which is the date of maturity of the loan agreement. The facility under the above operating lease is not recorded as an asset on the statement of net position; however, the operational lease payments are recorded as expenses in the statement of revenues, expenses, and changes in net position when paid or incurred. The following schedule by years presents management’s best estimate of future minimum rental payments for this noncancelable operating lease as of June 30, 2014: Fiscal Year Ending June 30 Amount 2015 2016 2017 2018 2019 Thereafter $ 1,363,000 1,363,000 1,363,000 1,418,000 1,418,000 4,253,000 Total Minimum Payments Required $ 11,178,000 FIU Athletics Finance Corporation The University and the Finance Corporation entered into two 25-year ground sublease agreements dated April 1, 2007, rendering the rights to the Finance Corporation to issue a series of capital improvement bonds of which a portion of the proceeds, along with contributions from the University, was used to finance a stadium improvement project located on University premises. Under this agreement, the Finance Corporation prepaid to the University, for rental of the premises, the sum of $31,937,211. The following schedule by years represents management's best estimate of future minimum rental expense that will be recognized for these sublease agreements: 41 50 MARCH 2015 REPORT NO. 2015-123 FLORIDA INTERNATIONAL UNIVERSITY A COMPONENT UNIT OF THE STATE OF FLORIDA NOTES TO FINANCIAL STATEMENTS (CONTINUED) JUNE 30, 2014 Fiscal Year Ending June 30 Amount 2015 2016 2017 2018 2019 2020-2024 2025-2029 2030-2033 $ 1,304,083 1,304,083 1,304,083 1,304,083 1,304,083 6,520,416 6,520,416 5,107,659 Total Minimum Payments Required $ 24,668,906 16. GIFT AGREEMENT – FLORIDA INTERNATIONAL UNIVERSITY FOUNDATION, INC. The Wolfsonian, Inc. (Wolfsonian), was established in 1986 to create and operate a museum and research center in Miami Beach, Florida, and to support a comprehensive program focused on the collection, exhibition, interpretation, preservation, research and publication of the decorative, or design and architectural arts. The Wolfsonian has been loaned the Mitchell Wolfson, Jr. collection of nearly 27,000 objects of art and rare books dating from the late nineteenth to the mid-twentieth century. It encompasses furniture, sculpture, paintings, books, graphics and other works of art on paper, as well as archives relating to the period. Through a series of academic study and fellowship programs, national and international traveling exhibitions, and scholarly initiatives, the Wolfsonian promotes public education and awareness of the social, historical, technological, political, economic, and artistic material culture of Europe and America in the 1885-1945 period. On July 1, 1997, the Foundation entered into a gift agreement (Agreement) with Mitchell Wolfson, Jr., the Wolfsonian, and the University, whereby Mitchell Wolfson, Jr. agreed to donate all rights, title, and interest in and to all objects constituting the Mitchell Wolfson, Jr. Collection of Decorative and Propaganda Arts to the Foundation, subject to a loan agreement made and entered into by the Wolfsonian and Mr. Wolfson, Jr., dated July 29, 1991. The loan agreement was extended through to July 2021. The Foundation has elected to exercise the option of not capitalizing the items that meet the definition of “collection” as prescribed by accounting principles generally accepted in the United States. Therefore, the fair value of the donated Collection of Decorative and Propaganda Arts is not reflected in the University's financial statements. Purchases of collection items are recorded as decreases in unrestricted net position in the year in which the items are acquired, or as temporarily or permanently restricted net position if the assets used to purchase the items are restricted by donors. Proceeds from deaccessions or insurance recoveries are reflected as increases in the appropriate net position classes. As a result of the Agreement, the Wolfsonian amended its articles of incorporation and bylaws to provide that all its directors be appointed and removed at any time with or without cause by the Foundation, to effect a transfer of complete control of all of the assets, interest, and obligations of the Wolfsonian to the Foundation. On May 26, 1999, the Foundation passed a revision to the bylaws of the Wolfsonian to make the Foundation the sole voting member of the Wolfsonian. 42 51 MARCH 2015 REPORT NO. 2015-123 FLORIDA INTERNATIONAL UNIVERSITY A COMPONENT UNIT OF THE STATE OF FLORIDA NOTES TO FINANCIAL STATEMENTS (CONTINUED) JUNE 30, 2014 The gifts are conditional upon the provisions outlined in the Agreement including, but not limited to, the Foundation continuing the museum and educational activities and operations that were conducted by the Wolfsonian. As a result of the Agreement, the University and Foundation have assumed all administrative functions and operating costs of the Wolfsonian. The most significant of the obligations under the Agreement is for the University to provide the Wolfsonian with the same financial support from its general budget, as provided to other departments, and to continue the museum and educational activities and operations of the Wolfsonian. The University provided support of approximately $2.3 million during the 2013-14 fiscal year for Wolfsonian expenses which included salaries, equipment, administrative expenses, insurance premiums for the art collection, and building security. In addition, the University provided support of approximately $512,000 during the 2013-14 fiscal year for utilities, repairs, and maintenance expenses for buildings used by the Wolfsonian. 17. RISK MANAGEMENT PROGRAMS The University is exposed to various risks of loss related to torts; theft of, damage to, and destruction of assets; errors and omissions; injuries to employees; and natural disasters. Pursuant to Section 1001.72(2), Florida Statutes, the University participates in State self-insurance programs providing insurance for property and casualty, workers’ compensation, general liability, fleet automotive liability, Federal Civil Rights, and employment discrimination liability. During the 2013-14 fiscal year, for property losses, the State retained the first $2 million per occurrence for all perils except named windstorm and flood. The State retained the first $2 million per occurrence with an annual aggregate retention of $40 million for named windstorm and flood losses. After the annual aggregate retention, losses in excess of $2 million per occurrence were commercially insured up to $50 million for named windstorm and flood losses through February 15, 2014, and increased to $54 million starting February 16, 2014. For perils other than named windstorm and flood, losses in excess of $2 million per occurrence were commercially insured up to $200 million; and losses exceeding those amounts were retained by the State. No excess insurance coverage is provided for workers’ compensation, general and automotive liability, Federal Civil Rights, and employment action coverage; all losses in these categories are completely self-insured by the State through the State Risk Management Trust Fund established pursuant to Chapter 284, Florida Statutes. Payments on tort claims are limited to $200,000 per person, and $300,000 per occurrence as set by Section 768.28(5), Florida Statutes. Calculation of premiums considers the cash needs of the program and the amount of risk exposure for each participant. Settlements have not exceeded insurance coverage during the past three fiscal years. Pursuant to Section 110.123, Florida Statutes, University employees may obtain healthcare services through participation in the State group health insurance plan or through membership in a health maintenance organization plan under contract with the State. The State’s risk financing activities associated with State group health insurance, such as risk of loss related to medical and prescription drug claims, are administered through the State Employees Group Health Insurance Trust Fund. It is the practice of the State not to purchase commercial coverage for the risk of loss covered by this Fund. Additional information on the State’s group health insurance 43 52 MARCH 2015 REPORT NO. 2015-123 FLORIDA INTERNATIONAL UNIVERSITY A COMPONENT UNIT OF THE STATE OF FLORIDA NOTES TO FINANCIAL STATEMENTS (CONTINUED) JUNE 30, 2014 plan, including the actuarial report, is available from the Florida Department of Management Services, Division of State Group Insurance. University Self-Insurance Program. The Florida International University College of Medicine Self-Insurance Program was established pursuant to Section 1004.24, Florida Statutes, on June 18, 2009. The Self-Insurance Program provides professional and general liability protection for the Florida International University Board of Trustees for claims and actions arising from the clinical activities of the College of Medicine faculty, staff, and resident physicians. Liability protection is afforded to the students of the College. The Self-Insurance Program provides legislative claims bill protection. The University is protected for losses that are subject to Section 768.28, Florida Statutes, to the extent of the waiver of sovereign immunity as described in Section 768.28(5), Florida Statutes. The Self-Insurance Program also provides: $1,000,000 per legislative claims bills inclusive of payments made pursuant to Section 768.28, Florida Statutes; $300,000 per occurrence of protection for the participants that are not subject to the provisions of Section 768.28, Florida Statutes; $300,000 per claim protection for participants who engage in approved community service and act as Good Samaritans; and student protections of $100,000 for a claim arising from an occurrence for any one person, $300,000 for all claims arising from an occurrence and professional liability required by a hospital or other health care facility for educational purposes not to exceed the per occurrence limit of $1,000,000. The Self-Insurance Program’s estimated liability for unpaid claims at fiscal year-end is the result of management and actuarial analysis and includes an amount for claims that have been incurred but not reported. Changes in the balances of claims liability for the Self-Insurance Program during the 2012-13 and 2013-14 fiscal years are presented in the following table: Fiscal Year Ended June 30, 2013 June 30, 2014 Claims Liabilities Beginning of Year $ 212,798 75,730 Current Claims and Changes in Estimates $ (137,068) 26,536 Claim Payments $ Claims Liabilities End of Year $ (22,436) 75,730 79,830 18. FUNCTIONAL DISTRIBUTION OF OPERATING EXPENSES The functional classification of an operating expense (instruction, research, etc.) is assigned to a department based on the nature of the activity, which represents the material portion of the activity attributable to the department. For example, activities of academic departments for which the primary departmental function is instruction may include some activities other than direct instruction such as research and public service. However, when the primary mission of the department consists of instructional program elements, all expenses of the department are reported under the instruction classification. The operating expenses on the statement of revenues, expenses, and changes in net position are presented by natural classifications. The following are those same expenses presented in functional classifications as recommended by NACUBO: 44 53 MARCH 2015 REPORT NO. 2015-123 FLORIDA INTERNATIONAL UNIVERSITY A COMPONENT UNIT OF THE STATE OF FLORIDA NOTES TO FINANCIAL STATEMENTS (CONTINUED) JUNE 30, 2014 Functional Classification Amount Instruction Research Public Services Academic Support Student Services Institutional Support Operation and Maintenance of Plant Scholarships, Fellowships, and Waivers Depreciation Auxiliary Enterprises $ 265,190,190 93,812,661 9,821,691 103,729,416 57,738,023 72,308,438 48,145,546 93,660,910 41,449,494 62,286,783 Total Operating Expenses $ 848,143,152 19. SEGMENT INFORMATION A segment is defined as an identifiable activity (or grouping of activities) that has one or more bonds or other debt instruments outstanding with a revenue stream pledged in support of that debt. In addition, the activity’s related revenues, expenses, gains, losses, assets, and liabilities are required to be accounted for separately. The following financial information for the University’s Housing and Parking facilities represents identifiable activities for which one or more bonds are outstanding: Condensed Statement of Net Position Housing Facility Capital Improvement Debt Parking Facility Capital Improvement Debt $ 19,648,932 128,255,995 759,323 $ 11,125,002 86,797,139 23,848,903 Total Assets 148,664,250 121,771,044 Liabilities Current Liabilities Noncurrent Liabilities 6,855,297 100,421,364 8,947,214 73,589,984 Total Liabilities 107,276,661 82,537,198 21,344,563 5,579 20,037,447 25,193,175 3,247,613 10,793,058 $ 41,387,589 $ 39,233,846 Assets Current Assets Capital Assets, Net Other Noncurrent Assets Net Position Net Investment in Capital Assets Restricted - Expendable Unrestricted Total Net Position 45 54 MARCH 2015 REPORT NO. 2015-123 FLORIDA INTERNATIONAL UNIVERSITY A COMPONENT UNIT OF THE STATE OF FLORIDA NOTES TO FINANCIAL STATEMENTS (CONTINUED) JUNE 30, 2014 Condensed Statement of Revenues, Expenses, and Changes in Net Position Operating Revenues Depreciation Expense Other Operating Expenses Housing Facility Capital Improvement Debt Parking Facility Capital Improvement Debt $ $ 30,458,678 (3,757,137) (17,706,486) 15,536,338 (2,058,449) (7,805,563) 8,995,055 5,672,326 Nonoperating Revenues (Expenses): Nonoperating Revenue Interest Expense Other Nonoperating Expense 579,942 (4,120,826) (1,560,518) 1,190,974 (3,682,916) (1,670,296) Net Nonoperating Expenses (5,101,402) (4,162,238) Income Before Transfers Net Transfers Capital Grants 3,893,653 (2,240,378) 1,510,088 (679) 596,064 Increase in Net Position Net Position, Beginning of Year 1,653,275 39,734,314 Operating Income $ Net Position, End of Year 41,387,589 2,105,473 37,128,373 $ 39,233,846 Condensed Statement of Cash Flows Housing Facility Capital Improvement Debt Net Cash Provided (Used) by: Operating Activities Noncapital Financing Activities Capital and Related Financing Activities Investing Activities $ $ $ 616,917 7,608,466 13,006,071 (20,947,488) (1,301,163) 1,918,080 Net Decrease in Cash and Cash Equivalents Cash and Cash Equivalents, Beginning of Year Cash and Cash Equivalents, End of Year 11,268,677 626,932 (18,998,566) 5,801,794 Parking Facility Capital Improvement Debt (332,951) 485,777 $ 152,826 20. DISCRETELY PRESENTED COMPONENT UNITS The University has four component units. As discussed in note 1, the financial activities of the Research Foundation are not included in the discretely presented component units’ columns of the financial statements. The remaining three discretely presented component units comprise 100 percent of the transactions and account balances of the aggregate discretely presented component units’ columns of the financial statements. The following financial information is from the most recently available audited financial statements for the component units: 46 55 MARCH 2015 REPORT NO. 2015-123 FLORIDA INTERNATIONAL UNIVERSITY A COMPONENT UNIT OF THE STATE OF FLORIDA NOTES TO FINANCIAL STATEMENTS (CONTINUED) JUNE 30, 2014 Condensed Statement of Net Position Florida International University Foundation, Inc. Direct-Support Organizations Florida FIU Athletics International Finance University Corporation Research Foundation, Inc. (Note 1) Assets: Current Assets Capital Assets, Net Other Noncurrent Assets Total Assets $ 306,812,066 16,290,009 97,652 $ Total Liabilities Net Position: Net Investment in Capital Assets Restricted Nonexpendable Restricted Expendable Unrestricted Total Net Position $ 1,163,917 1,498,333 $ 311,448,104 17,788,342 28,029,540 2,662,250 357,265,986 27,931,888 323,199,727 31,404,009 2,555,311 Deferred Outflows of Resources Liabilities: Current Liabilities Noncurrent Liabilities $ 3,472,121 Total Florida International University Academic Health Center Health Care Network Faculty Group Practice, Inc. 2,555,311 4,484,776 7,105,197 1,158,742 37,374,651 1,198,713 5,524,577 6,842,231 50,004,425 11,589,973 38,533,393 6,723,290 56,846,656 (4,061,040) 8,522,189 199,384,169 75,751,823 19,316,460 (4,061,040) $ 302,974,641 8,522,189 199,384,169 75,751,823 27,951,573 $ 311,609,754 (4,574,073) $ Note: (1) As discussed in Note 1 this component unit is no longer reported. 47 56 $ (4,574,073) $ MARCH 2015 REPORT NO. 2015-123 FLORIDA INTERNATIONAL UNIVERSITY A COMPONENT UNIT OF THE STATE OF FLORIDA NOTES TO FINANCIAL STATEMENTS (CONTINUED) JUNE 30, 2014 Condensed Statement of Revenues, Expenses, and Changes in Net Position Florida International University Foundation, Inc. Direct-Support Organizations Florida FIU Athletics International Finance University Corporation Research Foundation, Inc. (Note 1) Operating Revenues Depreciation Expense Other Operating Expenses $ 23,189,089 (535,272) (26,643,415) Operating Income (Loss) (3,989,598) 1,315,776 Net Nonoperating Revenues (Expenses) Investment Income Interest Expense 37,479,244 Net Nonoperating Revenues (Expenses) $ $ 3,602,778 $ 4,481,745 (186,513) (7,121,486) $ 31,273,612 (721,785) (36,051,903) (2,826,254) (5,500,076) (5,749) (1,579,690) (99,645) 37,473,495 (1,679,335) (1,585,439) (99,645) 35,794,160 (2,287,002) 37,479,244 Other Revenues, Expenses, Gains, or Losses Increase (Decrease) in Net Position 1,380,001 33,489,646 Net Position, Beginning of Year Adjustment to Beginning Net Position (1) 278,120,108 Net Position, Beginning of Year, As Restated 278,120,108 Net Position, End of Year Total Florida International University Academic Health Center Health Care Network Faculty Group Practice, Inc. $ 311,609,754 226,735 (226,735) $ Note: (1) As discussed in Note 1 this component unit is no longer reported. 48 57 1,380,001 (269,663) (1,545,898) 31,674,085 (4,304,410) (2,515,142) 271,527,291 (226,735) (4,304,410) (2,515,142) 271,300,556 $ (4,574,073) $ (4,061,040) $ 302,974,641 MARCH 2015 REPORT NO. 2015-123 FLORIDA INTERNATIONAL UNIVERSITY OTHER REQUIRED SUPPLEMENTARY INFORMATION SCHEDULE OF FUNDING PROGRESS – OTHER POSTEMPLOYMENT BENEFITS PLAN Actuarial Value of Assets (a) Actuarial Valuation Date 7/1/2009 7/1/2011 7/1/2013 $ - Actuarial Accrued Liability (AAL) (1) (b) Unfunded AAL (UAAL) (b-a) $ 72,099,000 101,015,000 120,121,000 $ 72,099,000 101,015,000 120,121,000 Funded Ratio (a/b) 0% 0% 0% Covered Payroll (c) $ 239,559,653 280,051,835 332,597,433 UAAL as a Percentage of Covered Payroll [(b-a)/c] 30.1% 36.1% 36.1% Note: (1) The entry-age cost actuarial method was used to calculate the actuarial accrued liability. (2) The July, 1, 2013, unfunded actuarial accrued liability of $120,121,000 was higher than the July 1, 2011, liability of $101,015,000 primarily as a result of lower than expected increases in retiree contributions rates, an implicit subsidy resulting from less than the full cost of coverage now being paid by participants in four HMO plans, changes in demographic data and assumptions, and certain trend assumptions. 49 58 MARCH 2015 REPORT NO. 2015-123 AUDITOR GENERAL STATE OF FLORIDA DAVID W. MARTIN, CPA AUDITOR GENERAL G74 Claude Pepper Building 111 West Madison Street Tallahassee, Florida 32399-1450 PHONE: 850-412-2722 FAX: 850-488-6975 The President of the Senate, the Speaker of the House of Representatives, and the Legislative Auditing Committee INDEPENDENT AUDITOR’S REPORT ON INTERNAL CONTROL OVER FINANCIAL REPORTING AND ON COMPLIANCE AND OTHER MATTERS BASED ON AN AUDIT OF THE FINANCIAL STATEMENTS PERFORMED IN ACCORDANCE WITH GOVERNMENT AUDITING STANDARDS Report on the Financial Statements We have audited, in accordance with the auditing standards generally accepted in the United States of America and the standards applicable to financial audits contained in Government Auditing Standards issued by the Comptroller General of the United States, the financial statements of Florida International University, a component unit of the State of Florida, and its aggregate discretely presented component units as of and for the fiscal year ended June 30, 2014, and the related notes to the financial statements, which collectively comprise the University’s basic financial statements, and have issued our report thereon dated March 4, 2015, included under the heading INDEPENDENT AUDITOR’S REPORT. Our report includes a reference to other auditors who audited the financial statements of the aggregate discretely presented component units, as described in our report on the University’s financial statements. This report does not include the results of the other auditors’ testing of internal control over financial reporting or compliance and other matters that are reported on separately by those auditors. Internal Control Over Financial Reporting In planning and performing our audit of the financial statements, we considered the University’s internal control over financial reporting (internal control) to determine audit procedures that are appropriate in the circumstances for the purpose of expressing our opinions on the financial statements, but not for the purpose of expressing an opinion on the effectiveness of the University’s internal control. Accordingly, we do not express an opinion on the effectiveness of the University’s internal control. A deficiency in internal control exists when the design or operation of a control does not allow management or employees, in the normal course of performing their assigned functions, to prevent, or detect and correct, misstatements on a timely basis. A material weakness is a deficiency, or a combination of deficiencies, in internal control such that there is a reasonable possibility that a material misstatement of the University’s financial statements will not be prevented, or detected and corrected on a timely basis. A significant deficiency is a deficiency, or a combination of deficiencies, in internal control that is less severe than a material weakness, yet important enough to merit attention by those charged with governance. Our consideration of internal control was for the limited purpose described in the first paragraph of this section and was not designed to identify all deficiencies in internal control that might be material weaknesses or significant deficiencies. Given these limitations, during our audit we did not identify any deficiencies in internal control that we consider to be material weaknesses. However, material weaknesses may exist that have not been identified. 50 59 MARCH 2015 REPORT NO. 2015-123 Compliance and Other Matters As part of obtaining reasonable assurance about whether the University’s financial statements are free of material misstatement, we performed tests of its compliance with certain provisions of laws, rules, regulations, contracts, and grant agreements, noncompliance with which could have a direct and material effect on the determination of financial statement amounts. However, providing an opinion on compliance with those provisions was not an objective of our audit and, accordingly, we do not express such an opinion. The results of our tests disclosed no instances of noncompliance or other matters that are required to be reported under Government Auditing Standards. Purpose of this Report The purpose of the INDEPENDENT AUDITOR’S REPORT ON INTERNAL CONTROL OVER FINANCIAL REPORTING AND ON COMPLIANCE AND OTHER MATTERS BASED ON AN AUDIT OF THE FINANCIAL STATEMENTS PERFORMED IN ACCORDANCE WITH GOVERNMENT AUDITING STANDARDS is solely to describe the scope of our testing of internal control and compliance and the result of that testing, and not to provide an opinion on the effectiveness of the University’s internal control or on compliance. This report is an integral part of an audit performed in accordance with Government Auditing Standards in considering the University’s internal control and compliance. Accordingly, this report is not suitable for any other purpose. Respectfully submitted, David W. Martin, CPA Tallahassee, Florida March 4, 2015 51 60 Office of Internal Audit Status Report BOARD OF TRUSTEES March 26, 2015 61 OFFICE OF INTERNAL AUDIT Date: March 26, 2015 To: Board of Trustees and Finance and Audit Committee From: Allen Vann, Audit Director Subject: OFFICE OF INTERNAL AUDIT STATUS REPORT I am pleased to provide you with the quarterly update on the status of our office’s work activities. Since our last update to you on January 14, 2015, we completed the following audits: 1. Audit of the College of Architecture + The Arts With an enrollment of 1,698 undergraduate and 331 graduate students, the College generated tuition revenues totaling $26.5 million and auxiliary revenues totaling $3.2 million in 2014. Also, approximately $2.1 million in philanthropy contributions and almost $1 million in research funds were established. The College incurred expenses of approximately $13.8 million in Education & General (E&G) funds and approximately 1.7 million in Auxiliary funds. Overall, our audit disclosed that while the financial controls and procedures were in place, there were many opportunities to improve internal controls, particularly in the areas of: revenue and accounting controls, payroll and personnel administration, expenditure controls and asset management. Also, the use of equipment use fees and material and supply fees collected can be more closely monitored. Management agreed to implement our twenty recommendations. 2. University-Wide Audit of Camps and Programs Offered to Minors Our audit identified a total of 63 University sponsored and non-sponsored programs offered to minors. The University has not designated a department or personnel to oversee and centrally manage these activities for adherence to compliance with laws, rules, and regulations pertaining to camps and programs involving minors on campus. The limited scope of current guiding policies also contributed to controls, which if not strengthened expose the University to avoidable risks. Management agreed to enhance policies and procedures particularly in the area of background screenings of personnel and also agreed to make improvements relating to operational control issues. 62 Office of Internal Audit Status Report March 26, 2015 Page 2 of 3 3. FIU Football Attendance for the 2014 Season in Accordance with the National Collegiate Athletic Association (NCAA) We performed an audit to certify the accuracy of attendance at FIU home football games reported to the NCAA for the 2014 season. Based on the methodology adopted by the Athletics Department, we found that the football attendance data reported to the NCAA were supported by sufficient, relevant and competent records. Although the current year’s average attendance of 12,176 did not meet the minimum required average, the University is in compliance as the required minimum average was met in the prior year (15,642). If the requirement is not satisfied next year, NCAA rules ¶20.9.9.5.1 states that the University will receive a notice of noncompliance. WORK IN PROGRESS We issued a draft report on our audit of Parking and Transportation - The primary objectives of the audit were to determine whether: a) recommendations from our prior audit of the Department’s revenue collections have been effectively implemented; and b) financial controls and procedures relating to payroll administration, procurement of good and services, credit card use, and travel and property accounting were adequate and effective; being adhered to; and in accordance with University policies and procedures, applicable laws, rules and regulations. Fieldwork continues on the following audits: 1. 2. 3. 4. 5. Restricted Gift Agreements (University Advancement/FIU Foundation) University’s IT Network Security Controls (Division of Information Technology) Nicole Wertheim College of Nursing and Health Sciences International Hurricane Research Center (Division of Research) University Building Access Security Control (Facilities) PROFESSIONAL DEVELOPMENT Audit staff continues to take advantage of professional development opportunities. Three staff members attended The Institute of Internal Auditors-Miami Chapter Internal Audit Transformation Center Conference at FIU’s Kovens Conference Center. Our Information Systems Audit Manager attended the 8th Annual ISACA South Florida Training Conference at FIU’s Kovens Conference Center. All of the auditors attended a two-day training course from NAVEX Global, Inc. 7 Steps to Investigate Alleged Misconduct and Writing Comprehensive Investigative Reports Training at the Modesto A. Maidique Campus. 63 Florida International University Financial Summary Overview 1 FY 2014‐15 Year To Date December 2014 ($ in millions) Revenue / Receipts University Educational and General (net) 2 University College of Medicine FIU Self‐Insurance Program Auxiliary Enterprises Intercollegiate Athletics Activities and Service Technology Fee Board Approved Fees Contracts and Grants Student Financial Aid Concessions Budget Current Year Actual Variance $ % 302.5 303.1 0.6 0% 270.3 271.0 0.7 0% 32.2 32.1 (0.1) 0% 0.4 128.5 17.8 13.0 7.8 0.2 53.3 88.6 0.2 0.3 129.9 17.4 12.3 7.5 0.2 53.0 90.9 0.2 (0.1) 1.4 (0.4) (0.7) (0.3) ‐ (0.3) 2.3 ‐ ‐25% 1% ‐2% ‐5% ‐4% 0% ‐1% 3% 0% 2.6 24.0 5.6 0.1 2.3 12.6 3.3 0.1 (0.3) (11.4) (2.3) 0.0 ‐12% ‐48% ‐41% 33% Interfund Adjustments 3 Total Operating Revenues (1.3) (1.3) ‐ 643.3 631.8 (11.4) 0% ‐2% University Treasury (net) FIU Foundation Inc Total Investment Revenues 3.6 (3.7) (7.3) 7.3 (3.8) (11.1) 10.9 (7.5) (18.4) ‐203% ‐152% ‐169% Total Revenues / Receipts 654.2 624.3 (29.8) ‐5% 215.2 196.3 18.9 9% Direct Support Organizations FIU Athletic Finance Corp FIU Foundation Inc. FIU Health Care Network FIU Research Foundation Expenses University Educational and General (net) University College of Medicine FIU Self‐Insurance Program Auxiliary Enterprises Intercollegiate Athletics Activities and Service Technology Fee Board Approved Fees Contracts and Grants Student Financial Aid Concessions Direct Support Organizations FIU Athletic Finance Corp FIU Foundation Inc. FIU Health Care Network FIU Research Foundation Interfund Adjustments 3 Total Expenses Principal Payment of Debt 4 193.4 177.1 16.3 8% 21.8 19.2 2.6 12% 0.4 85.4 13.3 8.4 8.0 0.2 55.1 74.8 0.4 0.2 83.3 13.2 6.9 5.0 0.1 60.3 77.3 0.2 0.2 2.1 0.1 1.5 3.0 0.1 (5.2) (2.5) 0.2 50% 2% 1% 18% 38% 50% ‐9% ‐3% 50% 1.4 13.2 5.7 0.0 1.7 10.2 5.1 0.0 (0.3) 3.0 0.6 (0.0) ‐21% 23% 11% ‐15% (1.3) (1.3) ‐ 480.2 458.5 21.7 0% 5% ‐ ‐ ‐ 0% Change in Net Assets (incl. Investments) 173.9 165.8 Change in Net Assets (excl. Investments) 163.0 173.3 10.3 64 (8.1) ‐5% 6% Notes: 1 The financials presented above reflects the state budgeting methodology which differs from full accrual Financial Statements. The following have the most significant impact: ▪ Depreciation of Assets: For budgeting purposes equipment purchases are fully expensed in their acquisition year, therefore depreciation is not included in the budget. ▪ Payables: At fiscal year‐end, E&G expenses will include year end commitments (encumbrances) which have not yet been invoiced. ▪ Unrealized gains and losses: The investment results are recognized as revenues in the budget however GASB accounting principles require that it be recorded as a non‐operating revenue / expense. 2 E&G revenues include State Funding and Tuition and are net of waivers, uncollectible amounts and 30% Financial Aid need‐based amounts per BOG regulation. The difference between E&G Revenues and Expenses will be funded from prior years carry forward. 3 Interfund transfers have been included resulting in higher revenue and expenses by fund allowing for an individual fund performance analysis. The interfund adjustments above eliminate this double counting. However, interfund transactions such as tuition funded by scholarships and auxiliary services provided to other units have not been eliminated. Since revenues and expenses are equal, the interfund adjustments are the same for both. 4 Principal payment of debt reflected above per BOG requirement that debt service payments be shown on a cash basis. 65 THE FLORIDA INTERNATIONAL UNIVERSITY BOARD OF TRUSTEES Finance and Audit Committee March 26, 2015 TREASURY REPORT (For quarter ending December 31, 2014) Report (For Information Only – no action required) OVERVIEW The University’s total liquidity position of $269.4 million was 1.5 times the University’s debt position of $180.1 million at the quarter end. Including direct support organization (“DSO”) debt, the liquidity to debt ratio was 1.2 times. These results were relatively lower versus the same period last year with the liquidity to university debt ratio (1.9x) and the liquidity to total debt ratio (1.6x). LIQUIDITY Real Days Payable At quarter end, $120.8 million, or 45 percent, of the liquidity position was accessible within 5 business days (See Liquidity Allocation chart for detail. FYTD 2015 the university had 30 real days payable1 (“RDP”) versus 55 RDP in FYTD 2014. The variance in RDP was due mainly to lower inflows from operations mostly due to the timing of financial aid transfers (see details in Uses section) and higher payroll outflows in FYTD 2015. LIQUIDITY ALLOCATION 5% 15% Same Day 1-5 Days 6-120 Days 50% 30% 120+ Days Sources The University started the fiscal year with $66.0 million in cash balances2. Total FYTD inflows (state and operational) were $511.0 million as compared to $587.9 million for the same period in the prior fiscal year. The variance was mostly due to the timing of the Spring financial aid transfers. On average, $3.9 million flowed into the university each business day this FYTD versus $4.5 million/day in FY2014. Uses FYTD, the university expended $529.6 million as compared to $510.7 million for the same period in the prior fiscal year. The FYTD velocity cash outflows increased to $4.0 million/day from $3.9 million/day in 2014 Q2. Real Days Payable represents the available balance of liquid funds divided by the average cash outflows of the university. The calculation uses the available balance in the university’s bank accounts plus the market value of investments that are accessible within 5 business days as its balance of liquid funds. 2 Cash includes Working Capital Pool assets and cash balances in the concentration bank account. 1 66 The increase in outflow was primarily due to $16.3 million in higher payroll disbursements and a $5.7 million increase in accounts payable disbursements. The University ended the period with $47.4 million in cash balances. This compares to $139.8 million in cash balances at the end of the same period in the prior fiscal year. Stress Tests/Perf or mance Simulations The Office of the Treasurer (“Treasury”) analyzes the effect of negative market performance on its liquidity position through both Monte Carlo and value-at-risk simulations. At the end of the quarter, the Monte Carlo model generated by a bottom decile performance for fixed income investments that translated into 2.5 percent, or $6.6 million, in unrealized losses. Liquidity, as measured by 5day accessibility, would drop to 44 percent, or $117.7 million, of the total current available cash and investment balances. RDP would fall to 29 days based on FYTD outflows. The scenario with the bottom decile equity performance generates a projected 4.6 percent, or $12.3 million, in unrealized losses. Liquidity, as measured by 5-days accessibility, would drop to $114.6 million or 43 percent of the total current available cash and investment balances. RDP is also 29 days based on FYTD outflows in this stress scenario. Bottom decile of overall portfolio performance represents a 5.9 percent loss, or $15.9 million, and a projected drop in liquidity to $97.3 million or 36 percent of the total current available balances. Furthermore, RDP drops to 24 days. VAR analysis, completed quarterly, estimates the maximum potential loss during a specific time period at a given level of confidence. VAR uses the historical behavior of each asset class over various time horizons (five years, ten years, full history). The VAR analysis predicts that there is a 1 in 20 probability that the portfolio (as of FY 2015 Q2 ending balance) could have unrealized losses of $14.3 million for a 12 month period. Furthermore, there is a 1 in 100 probability that the portfolio could have $24.7 million of unrealized losses in a single year. Forecast and Budget Combined Cash and Investment Balances continue to follow historical seasonality. Actual balances at the end of FY 2015 Q2 were 33.4 percent lower than the rolling forecast, 32.1 percent lower than the budget and 24.0 percent lower than Q2 of prior year. The variance was mostly due to the timing of the Spring financial aid transfers. For the next quarter, the university should experience a steady drawdown in the balances lasting through the third quarter and most of the fourth quarter of FY 2015. INVESTMENTS ASSET ALLOCATION Absolute W/C Return Pool 10% 14% Composition Asset allocations at the end of FY 2015 Q2 remained within policy guidelines (See Asset Allocation chart for detail of asset allocation at quarter end). Equity 25% Cash 3% The quarter-end market value of the University’s operating funds portfolio and cash is $269.4 million. This balance reflects a decrease of $75.3 million or 18.2 Fixed percent, from the previous quarter and was not in line Real Income Assets with the quarter-to-quarter seasonality of cash flows 30% 18% due to the timing of the Spring financial aid transfers and weak year-over-year performance in the portfolio. The total portfolio market value was $84.8 million less than the market value the end of FY 2014 Q2. 67 Performance FYTD Performance vs Benchmarks FIU’s operating portfolio continues 5.0% 1.8% to outperform the 0.8% 0.7% 0.6% 0.1% 0.7% 0.0% 0.72% State Treasury 0.0% investment pool -1.2% -1.1% (“SPIA”), returning -5.0% 4.5 percent since Benchmark FYTD Performance inception versus the -7.9% -10.0% -9.6% SPIA’s 2.8 percent Working Fixed Income Real Assets Equity Absolute Total for the same time. Capital Return FYTD 2015, the portfolio is down 1.1 percent. This compares unfavorably to 3.7 percent gain for the same period last year. The Strategic Capital and Reserve Pools lost 1.8 percent while the Working Capital Pool gained 0.7 percent. Returns from the SPIA totaled 1.0 percent during the same period (See FYTD Performance vs. Benchmarks chart for additional performance detail by asset class). This compares favorably to 0.4 percent for the Working Capital Pool and unfavorably to 5.2 percent for the Strategic and Reserve Capital Pools for the same period last year. Three asset classes underperformed their benchmarks for the period: Real Assets (-9.6 percent versus -7.9 percent benchmark), Fixed Income (0.6 percent versus 0.7 percent benchmark), and Equity (0.8 percent versus 1.8 percent benchmark). DEBT Total The University and DSOs ended FY 2015 Q2 with $218.8 million in outstanding debt versus $227.9 million for the same period end in FY 2014. The weighted average interest rate for the University and DSO issuances was 4.4 percent. At the end of FY 2015 Q2, 93.4 percent, or $204.3 million, of the University and DSOs’ outstanding debt was fixed rate and 6.6 percent, or $14.5 million, was variable rate debt. All of the variable rate exposures are obligations of the Direct Support Organizations (Athletics Finance Corporation, FIU Foundation). Housing The University’s Housing debt consists of revenue bonds for the Housing System. The outstanding housing debt was $104.8 million at the end of FY 2015 Q2. This compares to $110.0 million at the end of FY 2014 Q2. The year over year decrease was due to the scheduled principal payments as included in the debt service. The weighted average interest rate for the housing bonds, at the end of FY 2015 Q2, was 4.1 percent. The housing bonds are rated A+/A/Aa3 (Fitch/S&P/Moody’s). Parking The University’s Parking debt consists of revenue bonds for the Parking System. The outstanding parking debt was $75.3 million at the end of FY 2015 Q2. This compares to $78.0 million at the end of FY 2014 Q2. The year over year decrease was due to the scheduled principal payments as included in the debt service. The weighted average interest rate for the parking bonds, at the end of FY 2015 Q2, was 4.6 percent. The parking bonds are rated A+/AA-/Aa3 (Fitch/S&P/Moody’s). Direct Support Organizations Currently, DSOs’ outstanding debt of $38.6 million includes stadium bonds with $32.1 million outstanding and a Foundation loan with $6.5 million outstanding. In FY 2014 Q2, DSOs had outstanding debt of $40.0 million including $32.7 million of stadium bonds and $7.2 million outstanding for the Foundation loan. The year over year decrease was due to the scheduled principal payments as included in the debt service. The average interest rate for the stadium bonds was 4.4 percent and 4.3 percent for the Foundation Loan. Neither of the DSOs’ debt are rated. 68 Rating Agencies The University met with Moody’s in October for the annual rating surveillance. Moody’s affirmed its Aa3 long-term rating on the University’s parking facility revenue bonds and its Aa3 long-term rating on FIU’s dormitory revenue bonds currently outstanding. The outlook on all ratings is stable. Moody’s November 5, 2014 issue of Weekly Credit Outlook indicated that the land use referendum approved by Miami-Dade Voters was credit positive. 69 70 71 THE FLORIDA INTERNATIONAL UNIVERSITY BOARD OF TRUSTEES Finance and Audit Committee March 26, 2015 BUSINESS SERVICES REPORT AS OF FEBRUARY 25, 2014 Report (For Information Only – no action required) New Vendors New Vendor in PG-5 Market Station, JuiceBlendz Cafe, opened this spring semester replacing Freshens. JuiceBlendz offers freshly made sandwiches, salads and wraps, smoothies, fresh squeezed juices and YoBlendz self-service frozen yogurt and sorbets. The MANGO building, opened November 3rd, featuring Starbucks, Taco Bell and Panda Express, with over 6,000 sq. ft. of indoor/outdoor seating designed to foster collaboration and engagement. PG-6 Tech Station, opened this spring with 2,000 new parking spaces and a College Optical Express store which provides eye exams, Rx eyewear and sunwear, sunglasses, repairs, on-site lab for same-day single vision eyewear on most Rx’s and free next day shipping on most contact lens orders. The classrooms, Computing and Information Sciences Lab and remaining 20,000 sq. ft. of retail will open later this year. Retailers identified to date include, EXN Nutrition, CSI Pediatric Care Providers, Gabor Financial and Reebok Cross Fit. Updates Food delivery service was recently launched by ShopFIU for 3 of its top brands: Tropical Smoothie Café, Salad Creations and Sushi Maki. They will deliver to all academic and administrative buildings on MMC with a small fee and minimum order. The program is slated to grow and introduce more brands by the Fall of 2015. For more information, visit shop.fiu.edu. Fall Dining Styles Tracker revealed that FIU students rated campus dining service higher than students in the Southern Region: 73% of FIU students reported being satisfied/very satisfied, whereas 62% of students in the southern region reported similar levels of satisfaction. Further, FIU students (38%) were more likely to recommend campus dining service to a friend when compared to their southern region (27%) counterparts. 72 Quick Facts Services under Management – Fall 2014 50 Food and Retail Venues, Beverage & Snack Vending, FIU One Card Program, Office Supplies, Printing and Copying, Multi-use Facilities, Property Management and Advertising. Investments For fiscal year 2014-15, Business Services will invest nearly $3M to build out new facilities, expand services and increase indoor and outdoor seating to help foster affinity and retention at FIU. Business Services will also contribute $1.7M to fund university initiatives, provide scholarships, underwrite student services and support FIU facilities. Barnes & Noble at FIU For the period ended December 31, 2014, sales are down by 4% over the prior year. Convenience and school supplies remain strong with sales increases of 10% and 11%, respectively. The bookstore also saw gains in the café and computer peripherals, however; these gains have been overshadowed by declines in textbook sales. Vending For the period ended December 31, 2014, snack vending sales increased 33%, compared to the same period in 2013 primarily due to an increase in credit card sales, the addition of new products and daily audits that ensure machines are always stocked and fully functional. Revenues For the period ended December 31, 2014, Business Services managed sales of nearly $23.7M from operations. Total operating revenues for the period ended December 31, 2014 are $3.7M; a 9% increase over budget. 73 THE FLORIDA INTERNATIONAL UNIVERSITY BOARD OF TRUSTEES Finance and Audit Committee March 26, 2015 ATHLETICS UPDATE AS OF FEBRUARY 27, 2015 Report (For Information Only – no action required) Pete Garcia, Executive Director of Sports and Entertainment Fundraising Report FIU Foundation, Inc. Unaudited Preliminary Recap Through the Period Ended December 31, 2014 (in thousands) Revenues Budget $583 Actual $431 Variance ($152) Unfavorable Revenues variance driven by Arena naming rights. Athletics Finance Corporation FIU Athletics Finance Corporation Unaudited Preliminary Recap Through the Period Ended December 31, 2014 (in thousands) Revenues Expenses Budget $2,578 $702 Page 1 of 2 74 Actual $2,850 $941 Variance $272 ($239) Year-to-date Net Income excluding debt service was $1,909 thousand, favorable to budgeted $1,876 thousand o Primary drivers include: Favorable Operating Revenues of $272 thousand- contribution revenue transferred from the Foundation, as well as additional external event rentals Unfavorable Operating Expenses of $216 thousand- video board repairs of $95k, A/C repairs of $14k, and timing of invoice payments for Game Day expenses $66k unfavorable to budget for Q1 as more home games earlier in the season The debt coverage covenant requirement is forecasted to be met for the period ending June 30, 2015. Sponsorship Highlights JuiceBlendz: 10 year, $345,000 agreement Adidas: 5 year, $2,600,000 agreement (more than doubles prior agreement) Page 2 of 2 75 THE FLORIDA INTERNATIONAL UNIVERSITY BOARD OF TRUSTEES Finance and Audit Committee March 26, 2015 EMERGENCY MANAGEMENT STATUS REPORT AS OF FEBRUARY 25, 2015 Report (For Information Only – no action required) FIU Alert Emergency Notification System Attached is the report from the FIU Alert emergency notification system test conducted on February 11, 2015. Page 1 of 1 76 TM Emergency Notification System February 11, 2015 University‐Wide Emergency Notification Test Department of Emergency Management Incident Summary On February 11, 2015 at 1:00 pm, the FIU Police Department initiated a University‐wide FIU Alert emergency notification test that attempted to utilize text messages to cellphones, automated voice calls, email, outdoor speakers, callboxes, voice over IP telephones and electronic messaging boards. That FIU Alert read as follows: FIU ALERT! This is a test of the FIU emergency notification system. This is only a test. An email containing a survey was sent immediately following the test to the FIU community to gauge the effectiveness of the FIU Alert emergency notification system. FIU Alert Performance Evaluation Data FIU Alert System Performance Attempted Voice Calls 49,589 Cell phone text messages 49,589 FIU VOIP & Speakers Email Facebook Twitter Electronic message boards Page 1 of 4 77 Delivered 45,395 47,423 Unsuccessful Successful Successful Unsuccessful Partially Successful Issues and Solutions The FIU Alert component that controls VOIP telephones, indoor and outdoor speakers and callboxes (Singlewire) failed to activate. o The integration of Singlewire to Blackboard Connect failed because server clocks had drifted out of synchronization, preventing Blackboard Connect access to the Singlewire system that controls VOIP telephones, indoor and outdoor speakers and callboxes. The Singlewire server has since been set to synchronize automatically to official United States time. This has resolved the issue. The official FIU Twitter feed failed to tweet the FIU Alert test message. o The cause of the failure is unknown. At Blackboard’s recommendation, the integration was deleted from the system and reset. This resolved the issue. The electronic messaging board (EMB) system only partially activated. o Since this was a scheduled test, Graham University Center (GC) staff actively monitored all the EMBs. A significant portion of them did not display the alert. Technicians hypothesized that long uptimes caused the individual systems to have saturated memory which may have caused the individual failures. Resetting the systems on a daily basis seems to have resolved the issue. This however causes a daily short outage of the system. The outage is scheduled to occur when GC is closed and unoccupied. The large outdoor electronic message board on 16th Street does not necessitate a reset as it runs on a more robust system; therefore it is not affected by a daily outage. o It is important to note that this was a newly integrated system and therefore was still in the testing phase. This was the first instance in which it had been activated in full scale. Two subsequent full scale activations have been successful. Summary Most of the systems used for initiating FIU Alerts functioned correctly and provided timely notification. The systems that failed further emphasized the importance of operating multiple forms of emergency alert notification. The failures also highlight the importance of testing the system at full scale on a regular basis. The subsequent successful tests of the electronic message boards in GC and the 16th Street entrance have paved the way for the project to be expanded to other areas of the University such as the FIU Libraries, Student Housing, the Wolfe University Center and colleges that own electronic message boards. Page 2 of 4 78 Survey Results 1. What best describes your affiliation to Florida International University? # Answer 1 Student 2 Faculty 3 Staff Total 2. How did you receive the test message? (Mark all that apply) # Answer 1 University email University telephone 2 system 3 Cell phone text message 4 Outdoor speaker 5 FIU Website 6 Facebook or Twitter 7 Friend / co‐worker 8 Emergency call box 9 I did not receive it 10 Automatic telephone call Indoor/outdoor digital 11 display Response 612 144 336 1,092 % 56% 13% 31% 100% Response 863 % 79% 173 16% 812 1 10 36 27 1 25 625 74% 0% 1% 3% 2% 0% 2% 57% 3 0% 3. On February 11th, 2015 at 1:00 p.m., the University conducted a University‐wide test of the FIU Alert emergency notification system. Where were you located when the test alert was sent out? # Answer Response % 1 On campus outdoors 86 8% 2 On campus indoors 519 47% 3 Off campus 470 43% 4 Did not receive the alert 20 2% Total 1,095 100% 4. If you did receive the cellphone text message, how long after 1:00 pm did you receive the message? # Answer 1 Within 5 minutes 2 Between 5 to 10 minutes 10 minutes to 15 3 minutes 15 minutes to 30 4 minutes 5 More than 30 minutes 6 Did not receive alert Total Page 3 of 4 79 Response 642 173 % 61% 17% 41 4% 17 2% 16 159 1,048 2% 15% 100% 5. If you had difficulties receiving the alert, which best describes why? (Mark all that apply) # Answer 1 I do not have a cellphone I am not able to receive 2 text messages I am faculty/staff and are 3 not signed up to receive cellphone text alerts I have not liked FIU on 4 Facebook/ I am not following FIU on Twitter Could not hear the alert 5 clearly, (Please specify your location) Other (Please briefly 6 describe problem) Page 4 of 4 80 Response 10 % 5% 13 6% 53 25% 48 22% 32 15% 91 43% THE FLORIDA INTERNATIONAL UNIVERSITY BOARD OF TRUSTEES Finance and Audit Committee February 23, 2015 SAFETY AND ENVIRONMENTAL COMPLIANCE REPORT AS OF FEBRUARY 23, 2015 Report (For Information Only – no action required) Issue: Industrial Waste Inspection – FIU Modesto A. Maidique Campus (MMC) in the Academic Health Center I building (Dade County). Inspection on February 19th, 2015 at 2:00 p.m. Agency: DRER (DERM) Industrial Waste Inspection / Miami-Dade Regulatory and Economic Resources Department Status: An Industrial Waste inspection of the FIU MMC Academic Health Center I building was successfully completed with “Zero Notices of Violations”. A field note was issued for unsealed floor drains in the Photography dark room AHC1 Room 203. (Response due February 26, 2015). Chemical inventories, training records, satellite hazardous waste accumulation areas, and general knowledge of working in a laboratory setting were reviewed. FIU Environmental Health and Safety contacted the University’s Work Management unit and a work order #836144 was placed to have the floor drain sealed. Upon completion of the floor drain seal, a photo as proof of closure will be sent to DERM via email. 81 THE FLORIDA INTERNATIONAL UNIVERSITY BOARD OF TRUSTEES Finance and Audit Committee March 26, 2015 FACILITIES AND CONSTRUCTION UPDATE AS OF FEBRUARY 25, 2015 Report (For Information Only – no action required) Projects Completed Academic Health Center 5 (BT-877/895) - $46.2 M (multiple sources: $38.3M PECO, $7.9 auxiliary) project budget. A/E – Perkins + Will; CM – Skanska. (121,465 gsf). The Robert Stempel College of Public Health and Social Work (RSCPHSW) project ($23.3M) and the International Hurricane Center (IHRC) project ($15.0 M) were combined into one project; the Department of Research (DoR) contributed an additional $7.9M for research facilities. The project achieved substantial completion on July 3rd, 2014, missing the April 25th delivery date. A/E and CM were advised that Liquidated Damages (LD’s) will be applied. Audio-visual (AV) system installation was completed in December 2014. Site work was completed November 2014 and the remaining punch-list items for minor interior work should be complete by the end of February 2015. The CM demobilized from the site in January 2015. The RSCPHSW move triggered renovations for the Herbert Wertheim College of Medicine (HWCOM) in AHC-1 and AHC-2, which were completed December 2014. Current Owner Direct Purchase (ODP) tax savings are $382,938.11 -- slightly shy of the 1% objective of $385,000. Project Closeout is anticipated to begin March 2015. (Since this project has been completed, this entry will be removed from future Board of Trustees reports). Management and New Growth Opportunities (MANGO) Mixed-Use College of Business Building- (BT-886) - $36.1M (multiple sources) project budget. A/E – HOK; CM-Arellano. (107,912 gsf). Ground floor food venues (Starbucks, Panda Express, and Taco Bell) successfully opened the first week of November followed by occupancy of the remainder of the building in mid-November. A/E and CM were advised Liquidated Damages (LD’s) will be applied. Classes scheduled for the Spring 2015 semester began with full audio-visual (A/V) capability. The final finishes on the 1st floor monumental stairs were completed in January 2015. Building punch-list remediation work continues and is scheduled to be complete in March 2015. Current ODP savings of $378,894 exceed the 1% objective of $370,524. (Since this project has been completed, this entry will be removed from future Board of Trustees reports). Page 1 of 3 82 Projects under Construction Parking Garage 6 (BT-868) – $49.4M (multiple sources) project budget. A/E – PGAL; CM – Facchina. This facility reuses the PG5/Market Station design. Dimensions: 779,815 gsf total with 50,771 gsf shelled for retail and academic use; and approximately 2,000 parking spaces. The project incorporates site specific modifications such as improved traffic lanes at the SW 112th Avenue entry, a traffic circle at the intersection of Palm Avenue and Loop Road, and a pedestrian bridge across Loop Road. The parking garage component of the project was delivered on time in January 2015 prior to the start of the semester. All site work, finishes, irrigation, and landscaping were also complete. The combination of garage completion, refinements in traffic light signalization, and the widening of the loop road have significantly improved traffic flow on the north side of campus. The opening of the pedestrian bridge also reduces pedestrian – vehicular conflict. Classrooms were redesigned to meet recent changes in classroom teaching standards. This redesign pushes back the scheduling of the four classrooms to the Fall of 2015. Classroom construction is underway. “College Optical”, offering full optometry services is the first retail store to open in PG6. “Half-Moon Empanada”, “Cross-Fit”, “Care Giver Services”, “The Gabor Agency”, and “EXN Nutrition” are all under construction for custom build-outs. Planning with Miami-Dade Transit (MDT) and Florida Department of Transportation (FDOT) continues regarding the use of PG6 as a multi-modal transit station. ODP savings total $168,144.67, which is half of the 1% objective of $342,727. Target delivery date for parking garage element of January 2015 was met. Delivery for each retail store varies by contract. Ambulatory Care Center (BT-870) - $8.8M (County bond) project budget. A/E – AECOM; CM – Klewin. (32,023 gsf). Building foundations and shell were completed in October 2014. Interior work continues and is approximately 95% complete. Sitework is approximately 85% complete. The delivery date has slipped from December 22, 2014 to March 30, 2015 according to the CM, however, the credibility of that projection is questionable given the scheduling of remaining tasks. Late April 2015 is a realistic date. A/E and CM have been advised that Liquidated Damages (LD’s) will be applied. Connection to PG5 is in process and scheduled for completion by end of February 2015. All utility connections are being finalized. Current ODP savings tally $99,382 and exceed the 1% target of $78,975. Both the project budget and the schedule continue to be extremely tight. Revised delivery date: April 2015. Student Academic Support Center (SASC) (BT-882) - $30.9M (PECO) project budget. A/E – Gould Evans; CM – Balfour Beatty. (81,045 gsf with an additional 7,350 gsf for an elevated exterior amphitheater terrace and stair system). The University received $6.8M in additional funding as part of the FY2014-15 Page 2 of 3 83 appropriation. GMP negotiations with the CM were completed in September 2014 and ground breaking took place on November 21, 2014. Delivery is scheduled for March 2016. The construction budget is being analyzed to determine how to include additional scope: wood acoustical paneling in the 750 seat auditorium, and the promenade to the traffic circle as the top priorities. The decision has already been made to install terrazo flooring on the ground floor. Parking lot modifications and bus re-routing have been completed. Discussions on a permanent bus stop (currently not in scope) will occur to establish scope, cost, and funding source. Site work including utilities, foundations and ground floor columns is in process. ODP savings objective is $208K. Target delivery date: March 2016. Projects in Design Recreation Center Expansion (BT-903) - $13.6M Capital Improvement Trust Fund (CITF) project budget. A/E – HKS; CM –Moss Construction. (50,000 gsf). The project will expand the existing facility into Parking Lot #8 and will include a basketball/volleyball gym, a weight training room, and locker room addition. Based on the addition of $7,328,254 in additional CITF appropriations, $5,028,254 has been allocated to increase the scope of the Rec Center project. Programming was completed in October 2014. Advanced Schematic Design is currently on hold as cost estimates for a desired running track and additional fitness area on mezzanine level, new building entrance, outdoor plaza and outdoor recreational areas are being developed as additional scope items. These items will push back the previous date of May 2015 for construction start and the delivery date of September 2016 for substantial completion. The schedule and budget impacts are still under review. Projects in Planning Stage Frost Museum of Science Batchelor Environmental Center at FIU (BT-913) - $5.0M privately funded project budget. (To date, $250k has been received, a request for $457k has also been submitted). Programming was completed December 2014 and the final program has been formally approved. Schematic Design started with anticipated completion February 2015. Leo A Daly (a continuing service contract architect) has been retained for this phase of work. The project includes a new research wildlife center to be developed in conjunction with the Frost/Miami Science Museum. Phase 1 will be programming, infrastructure, first half of the animal holding area and support facilities. The Frost Museum has provided an initial projection of $1.3M for equipment, pending confirmation during programming. Phase 1 completion is targeted for September 2015. Phase 2 will be a classroom & lab building approximately 3,000 sf in size and the balance of the animal holding area. Phase 2 completion is targeted for September 2016. Page 3 of 3 84 FIU FOUNDATION, INC. FINANCIAL STATEMENTS RECAP & INVESTMENT SUMMARIES January 31, 2015 85 FIU FOUNDATION, INC. Recap of Statement of Activities For the Period Ended January 31, 2015 (In Thousands of Dollars) 2014‐15 7‐Month Budget 2014‐15 7‐Month Actuals REVENUES: Cash Contributions MARC Building Foundation Subsidiaries Estimated Investment Returns $ 28,006 $ 1,264 $ 274 $ 7,674 $ 13,374 $ 978 $ 355 $ (2,892) TOTAL REVENUES $ 37,218 $ 11,815 $ (25,403) EXPENSES: University Programs: Scholarships & Programs Building Funds Unrestricted Annual Expenses TOTAL UNIVERSITY PROGRAMS EXPENSES Operational: MARC Building Foundation Subsidiaries Administrative & Fund‐Raising TOTAL OPERATIONAL EXPENSES Budget to Actual 7‐Month Variance 2014‐15 Annual Budget $ (14,632) [1] $ (286) [2] $ 81 $ (10,566) [3] $ 46,947 $ 1,694 $ 502 $ 14,406 $ 63,549 Current Year to Previous Year Variance 2013-14 7-Month Actuals $ 14,138 $ 1,408 $ 1,544 $ 17,774 $ (764) $ (430) $ (1,189) $ (20,666) 34864594.56 $ (23,049) $ 8,185 $ 1,541 $ 698 $ 10,424 $ 5,593 $ 1,093 $ 498 $ 7,183 $ 2,593 $ 448 $ 200 $ 3,241 [4] [5] [6] $ 14,591 $ 1,643 $ 975 $ 17,210 $ 5,243 $ 644 $ 575 $ 6,462 $ (349) $ (448) $ 77 $ (721) $ 395 $ 303 $ 4,328 $ 5,027 $ 201 $ 250 $ 3,534 $ 3,985 $ 194 $ 54 $ 794 $ 1,042 [7] $ 692 $ 474 $ 8,003 $ 9,169 $ 494 $ 264 $ 3,449 $ 4,207 $ 293 $ 14 $ (85) $ 222 [8] TOTAL EXPENSES $ 15,450 $ 11,168 $ 4,283 $ 26,379 10669257.44 $ (499) EXCESS REVENUES OVER EXPENSES $ 21,767 $ 647 $ (21,120) $ 37,170 24195337.12 $ (23,548) *These financial statements recaps reflect expenses on an accrual basis and receipts on a cash basis, with the exception of investment returns. **Please refer to Appendix A for detailed variance notes. 86 Page 1 Florida International University Foundation Preliminary Performance Summary As of January 31st, 2015 Asset Class/Manager Market Value ($0% of Total Mana Interim Policy TaInterim Policy RaLong-Term Polic Current Month GMO Global Equity Asset Allocation Indus Markor Master Fund Kiltearn Global Equity Fund Maverick Long Fund, Ltd Vanguard Total World Stock Index Global Public Equity 9,403 4,188 9,367 10,942 887 34,788 4.1% 1.8% 4.1% 4.8% 0.4% 15.2% D.E. Shaw Core Alpha Extension First Eagle U.S. Equity Fund Sirios Focus Fund HHR Titan Offshore U.S. Public Equity 9,453 10,606 7,994 4,773 32,827 4.1% 4.6% 3.5% 2.1% 14.3% AKO European Master Fund Vanguard FTSE Dev. Markets Cevian Capital II Buena Vista Asian Opp. Fund Kabouter International Opps. Fund II Non‐U.S. Developed Public Equity 9,092 1,802 4,422 5,227 4,976 25,518 4.0% 0.8% 1.9% 2.3% 2.2% 11.1% DFA Emerging Markets Value Somerset Emerging Markets Polunin Developing Countries Fund Emerging Markets Public Equity 6,346 3,495 4,147 13,988 2.8% 1.5% 1.8% 6.1% 16.5% 16.5% 11.5% 5.0% Trailing 3-MonthsCalendar Year toFiscal Year to DaTrailing 1-Year Trailing 3-Years Trailing 5-Years Trailing 10-YearsSince Inception 12.5% ‐0.8 0.9 ‐1.7 ‐0.5 ‐1.5 ‐0.8 ‐2.8 6.8 ‐0.7 2.2 ‐2.4 0.4 ‐0.8 0.9 ‐1.7 ‐0.5 ‐1.5 ‐0.8 ‐8.1 4.9 ‐9.4 6.2 ‐3.9 ‐2.8 2.1 4.7 ‐‐‐ ‐‐‐ ‐‐‐ 4.3 ‐‐‐ ‐‐‐ ‐‐‐ ‐‐‐ ‐‐‐ ‐‐‐ ‐‐‐ ‐‐‐ ‐‐‐ ‐‐‐ ‐‐‐ ‐‐‐ ‐‐‐ ‐‐‐ ‐‐‐ ‐‐‐ ‐‐‐ ‐‐‐ 2.0 4.3 ‐6.2 9.4 0.3 4.9 15.0% ‐1.5 ‐3.0 ‐0.7 ‐5.7 ‐2.4 0.9 ‐0.2 2.1 ‐5.6 ‐0.2 ‐1.5 ‐3.0 ‐0.7 ‐5.7 ‐2.4 1.1 0.4 5.8 ‐‐‐ ‐0.1 11.7 ‐‐‐ ‐‐‐ ‐‐‐ 9.8 ‐‐‐ ‐‐‐ ‐‐‐ ‐‐‐ 14.8 ‐‐‐ ‐‐‐ ‐‐‐ ‐‐‐ 12.6 ‐‐‐ ‐‐‐ ‐‐‐ ‐‐‐ ‐‐‐ 7.4 6.3 6.6 ‐4.5 4.3 10.0% 4.0 0.8 5.7 0.5 ‐0.6 2.4 10.3 ‐3.1 7.1 ‐1.2 ‐0.5 4.1 4.0 0.8 5.7 0.5 ‐0.6 2.4 10.5 ‐9.3 0.5 ‐1.9 ‐‐‐ 1.0 18.3 ‐0.1 11.1 ‐‐‐ ‐‐‐ 11.5 ‐‐‐ ‐‐‐ ‐‐‐ ‐‐‐ ‐‐‐ 10.2 ‐‐‐ ‐‐‐ ‐‐‐ ‐‐‐ ‐‐‐ ‐‐‐ ‐‐‐ ‐‐‐ ‐‐‐ ‐‐‐ ‐‐‐ ‐‐‐ 12.5 ‐2.1 9.7 4.5 ‐0.5 2.2 0.0%‐10.0% 5.0% ‐0.8 1.3 ‐0.0 ‐0.1 ‐7.0 ‐5.0 ‐1.8 ‐5.0 ‐0.8 1.3 ‐0.0 ‐0.1 ‐11.2 ‐5.9 ‐‐‐ ‐8.0 1.9 ‐‐‐ ‐‐‐ 6.3 ‐‐‐ ‐‐‐ ‐‐‐ ‐‐‐ ‐‐‐ ‐‐‐ ‐‐‐ ‐‐‐ ‐‐‐ ‐‐‐ ‐‐‐ ‐‐‐ ‐3.1 ‐0.1 ‐6.5 1.8 10.0%‐25.0% 10.0%‐25.0% 5.0%‐20.0% Total Global Private Equity 19,635 8.6% 8.0% 0.0%‐15.0% 15.0% ‐‐‐ ‐‐‐ ‐‐‐ 3.1 13.4 16.0 ‐‐‐ ‐‐‐ 6.8 Total Long Public and Private Equity 126,754 55.4% 57.5% 45.0%‐65.0% 57.5% ‐0.4 0.3 ‐0.4 ‐1.2 8.8 13.8 11.1 ‐‐‐ 4.0 Blue Harbour Strategic Value Valinor Capital Partners Roystone Master Fund Fir Tree International Value Hedge Funds (Growth Objective) 3,855 4,509 3,949 3,610 15,924 1.7% 2.0% 1.7% 1.6% 7.0% ‐‐‐ ‐3.7 ‐0.4 ‐1.1 ‐3.4 ‐2.1 ‐2.1 5.8 2.1 ‐1.6 1.2 ‐3.7 ‐0.4 ‐‐‐ ‐3.4 ‐2.1 ‐3.4 10.1 ‐1.3 ‐5.3 0.1 4.0 22.5 5.3 ‐‐‐ 7.7 ‐‐‐ ‐‐‐ ‐‐‐ ‐‐‐ ‐‐‐ ‐‐‐ ‐‐‐ ‐‐‐ ‐‐‐ ‐‐‐ ‐‐‐ ‐‐‐ ‐‐‐ ‐‐‐ ‐‐‐ 2.6 18.5 5.3 ‐3.7 5.6 Ironwood International Ltd ‐ Holdback Indus Asia Pacific Fund Brahman Capital Partners Naya Offshore Fund Hedge Funds (Blended Objective) 42 4,118 3,598 3,522 11,280 0.0% 1.8% 1.6% 1.5% 4.9% ‐‐‐ 0.0 2.1 2.1 1.2 1.8 0.0 9.7 3.0 1.2 4.6 0.0 2.1 2.1 1.2 1.8 0.3 9.5 ‐3.2 ‐‐‐ 2.0 ‐‐‐ ‐‐‐ ‐‐‐ ‐‐‐ 3.2 ‐‐‐ ‐‐‐ ‐‐‐ ‐‐‐ 7.5 ‐‐‐ ‐‐‐ ‐‐‐ ‐‐‐ 6.0 ‐‐‐ ‐‐‐ ‐‐‐ ‐‐‐ ‐‐‐ 0.3 9.8 ‐4.0 0.6 5.0 Davidson Kempner BlueCrest All Blue Fund Kynikos Opportunity Fund Luxor Capital Partners 4,190 4,030 3,629 3,125 1.8% 1.8% 1.6% 1.4% ‐0.1 1.1 0.9 ‐5.7 0.4 2.4 1.2 ‐10.8 ‐0.1 1.1 0.9 ‐5.7 ‐1.4 3.3 ‐1.5 ‐15.0 4.3 7.7 ‐‐‐ ‐‐‐ ‐‐‐ ‐‐‐ ‐‐‐ ‐‐‐ ‐‐‐ ‐‐‐ ‐‐‐ ‐‐‐ ‐‐‐ ‐‐‐ ‐‐‐ ‐‐‐ 4.4 6.9 ‐3.2 ‐16.7 Scopia PX Funds 3871750.019 ‐‐‐ ‐‐‐ 0.0%‐15.0% 0.0%‐15.0% 0.016915105 1.7 87 Page 2 5.034437352 1.7 --- --- --- --- --- 10.62142914 Florida International University Foundation Preliminary Performance Summary As of January 31st, 2015 Asset Class/Manager Hedge Funds (Diversifying Objective) Market Value ($0% of Total Mana Interim Policy TaInterim Policy RaLong-Term Polic Current Month Trailing 3-MonthsCalendar Year toFiscal Year to DaTrailing 1-Year Trailing 3-Years Trailing 5-Years Trailing 10-YearsSince Inception 18,845 8.2% ‐‐‐ 0.0%‐15.0% ‐‐‐ ‐0.3 ‐0.2 ‐0.3 ‐1.0 1.5 ‐‐‐ ‐‐‐ ‐‐‐ 1.4 Total Hedge Funds 46,049 20.1% 17.5% 10.0%‐30.0% 17.5% ‐0.4 1.5 ‐0.4 0.1 3.6 7.6 6.0 ‐‐‐ 5.0 Franklin Templeton Global Bond Fund Clifton Defensive Equity Strategy Other Diversifying Investments 3,622 4,294 7,916 1.6% 1.9% 3.5% ‐‐‐ 0.0%‐20.0% ‐‐‐ ‐0.4 ‐1.0 ‐0.7 ‐2.5 0.3 ‐1.0 ‐0.4 ‐1.0 ‐0.7 ‐1.9 2.0 0.2 4.4 ‐‐‐ 5.3 ‐‐‐ ‐‐‐ 7.2 ‐‐‐ ‐‐‐ ‐‐‐ ‐‐‐ ‐‐‐ ‐‐‐ 2.1 6.1 8.0 Total Diversified Growth 53,965 23.6% 17.5% 10.0%‐30.0% 17.5% ‐0.5 1.1 ‐0.5 0.2 3.9 7.2 5.9 ‐‐‐ 5.0 Van Eck Global Hard Assets SPDR Gold ETF Harvest MLP Income Fund Public Inflation Sensitive 4,638 4,843 3,606 13,087 2.0% 2.1% 1.6% 5.7% 9.0% 0.0%‐15.0% 4.0% ‐3.7 8.7 ‐3.3 0.7 ‐15.8 9.6 ‐6.4 ‐4.8 ‐3.7 8.7 ‐3.3 0.7 ‐31.4 ‐3.6 ‐6.4 ‐15.1 ‐18.2 2.8 12.4 ‐1.6 ‐‐‐ ‐‐‐ ‐‐‐ 1.0 ‐‐‐ ‐‐‐ ‐‐‐ 7.0 ‐‐‐ ‐‐‐ ‐‐‐ ‐‐‐ ‐17.6 6.9 12.4 ‐1.5 Carmel Investment Fund V Easterly Gov't Prop. Income & Growth II Tailwater Energy Fund II Private Inflation Sensitive 113 4,520 177 4,810 0.0% 2.0% 0.1% 2.1% 1.0% 0.0%‐10.0% 6.0% ‐‐‐ ‐‐‐ ‐‐‐ ‐‐‐ ‐‐‐ ‐‐‐ ‐‐‐ ‐‐‐ 20.8 Total Inflation Sensitive 17,897 7.8% 10.0% 0.0%‐15.0% 10.0% 0.5 ‐3.9 0.5 ‐11.7 2.3 2.3 7.8 ‐‐‐ ‐0.9 Colchester Global Bonds ($‐Hdg) Vanguard Short‐Term Bond Index Fund Dodge and Cox Income Fund State of Florida Treasury Fund State of Florida Treasury Fund (MARC) SunTrust Cash Cash Pending PE Cash Distributions Total Deflation Sensitive 9,176 4,030 10,445 2,511 1,500 2,614 0 0 30,277 4.0% 1.8% 4.6% 1.1% 0.7% 1.1% 0.0% 0.0% 13.2% 15.0% 9.0%‐30.0% 15.0% 1.9 1.1 1.3 0.1 0.1 0.0 ‐‐‐ ‐‐‐ 1.2 2.8 ‐‐‐ 1.5 0.4 0.4 ‐‐‐ ‐‐‐ ‐‐‐ 1.6 1.9 1.1 1.3 0.1 0.1 0.0 ‐‐‐ ‐‐‐ 1.2 3.7 ‐‐‐ 2.2 0.9 ‐‐‐ ‐‐‐ ‐‐‐ ‐‐‐ 2.1 7.9 ‐‐‐ ‐‐‐ 1.6 ‐‐‐ ‐‐‐ ‐‐‐ ‐‐‐ 5.3 ‐‐‐ ‐‐‐ ‐‐‐ 2.0 ‐‐‐ ‐‐‐ ‐‐‐ ‐‐‐ 3.7 ‐‐‐ ‐‐‐ ‐‐‐ ‐‐‐ ‐‐‐ ‐‐‐ ‐‐‐ ‐‐‐ 5.9 ‐‐‐ ‐‐‐ ‐‐‐ ‐‐‐ ‐‐‐ ‐‐‐ ‐‐‐ ‐‐‐ ‐‐‐ 7.3 1.1 4.9 2.1 0.5 ‐‐‐ ‐‐‐ ‐‐‐ 6.2 Total Managed Assets Net of CA Fees 228,893 100.0% 100.0% ‐‐‐ 100.0% ‐0.2 0.3 ‐0.2 ‐1.4 6.5 10.1 9.0 5.6 4.3 Foundation Enterprise Holdings I JMOF ‐ Raymond James CEF Student Managed Investment Fund SunTrust Balanced Annuity Account Islamorada Investment StoneCastle FICA Program IR&M Short Fund Archstone Offshore Other Alternatives 574 1,009 275 292 1,306 2,002 3,026 1,975 10,459 ‐‐‐ ‐‐‐ ‐‐‐ ‐‐‐ ‐‐‐ ‐‐‐ ‐‐‐ ‐‐‐ ‐‐‐ ‐‐‐ 0.4 ‐2.7 0.1 0.5 0.0 0.5 ‐1.7 ‐0.1 ‐‐‐ 0.9 ‐5.6 ‐3.1 1.6 0.1 0.4 0.4 ‐0.2 ‐‐‐ 0.4 ‐2.7 0.1 0.5 0.0 0.5 ‐1.7 ‐0.1 ‐‐‐ 1.3 ‐5.7 ‐6.6 3.8 ‐‐‐ ‐‐‐ ‐1.1 0.2 ‐‐‐ 3.6 2.7 ‐7.0 ‐‐‐ ‐‐‐ ‐‐‐ 1.9 2.8 ‐‐‐ ‐‐‐ 9.1 0.9 ‐‐‐ ‐‐‐ ‐‐‐ 7.4 3.3 ‐‐‐ ‐‐‐ 5.9 4.6 ‐‐‐ ‐‐‐ ‐‐‐ ‐‐‐ 5.4 ‐‐‐ ‐‐‐ ‐‐‐ 4.0 ‐‐‐ ‐‐‐ ‐‐‐ ‐‐‐ ‐‐‐ 2.0 1.2 5.5 4.5 6.1 0.1 0.8 4.9 4.4 Total Assets Net of CA Fees 239,352 ‐‐‐ -0.151237501 0.23913779 -0.151237501 -1.415858811 Notes: 1. Funds available for investment in the Wells Fargo operating account have been deployed to the investment portfolio as of December 31, 2013. 2. Private Investments' trailing performance represents time-weighted quarterly returns. Data represents NAVs and performance through September 30, 2014, updated with cashflows through the most recent period. 88 Page 3 6.500928468 10.0271373 8.970695704 5.567157319 4.326063653 Florida International University Foundation Preliminary Performance Summary As of January 31st, 2015 Asset Class/Composite Market Value ($0% of Total Mana Interim Policy TaInterim Policy RaLong-Term Polic Current Month Trailing 3-Month Fiscal Year to DaTrailing 1-Year Trailing 3-Years Trailing 5-Years Trailing 10-YearsSince Inception Global Public Equity 34,788 15.2% 16.5% 10.0%‐25.0% 12.5% ‐0.8 0.4 ‐2.8 4.3 ‐‐‐ ‐‐‐ ‐‐‐ 4.9 U.S. Public Equity 32,827 14.3% 16.5% 10.0%‐25.0% 15.0% ‐2.4 ‐0.2 ‐0.1 9.8 14.8 12.6 ‐‐‐ 4.3 Non-U.S. Developed Public Equity 25,518 11.1% 11.5% 5.0%‐20.0% 10.0% 2.4 4.1 1.0 11.5 10.2 6.0 ‐‐‐ 2.2 Emerging Markets Public Equity 13,988 6.1% 5.0% 0.0%‐10.0% 5.0% ‐0.1 ‐5.0 ‐8.0 6.3 ‐‐‐ ‐‐‐ ‐‐‐ 1.8 Global Private Long Equity 19,635 8.6% 8.0% 0.0%‐15.0% 15.0% ‐‐‐ ‐‐‐ 3.1 13.4 16.0 16.6 ‐‐‐ 6.8 126,754 55.4% 57.5% 45.0%‐65.0% 57.5% ‐0.4 0.3 ‐1.2 8.8 13.8 11.1 ‐‐‐ 4.0 Total Hedge Funds 46,049 20.1% 17.5% 10.0%‐30.0% 17.5% ‐0.4 1.5 0.1 3.6 7.6 6.0 ‐‐‐ 5.0 Other Diversifying Investments 7,916 3.5% ‐0.7 ‐1.0 0.2 5.3 7.2 ‐‐‐ ‐‐‐ 8.0 Total Diversified Growth 53,965 23.6% 17.5% 10.0%‐30.0% 17.5% ‐0.5 1.1 0.2 3.9 7.2 5.9 ‐‐‐ 5.0 Total Inflation Sensitive 17,897 7.8% 10.0% 0.0%‐15.0% 10.0% 0.5 ‐3.9 ‐11.7 2.3 2.3 7.8 ‐‐‐ ‐0.9 Total Deflation Sensitive 30,277 13.2% 15.0% 9.0%‐30.0% 15.0% 1.2 1.6 2.1 5.3 3.7 5.9 ‐‐‐ 6.2 Total Managed Assets Net of CA Fees 228,893 100.0% 100.0% ‐‐‐ 100.0% ‐0.2 0.3 ‐1.4 6.5 10.1 9.0 5.6 4.3 Total Assets Net of CA Fees 239352443.9 --- Total Long Public Equity and Private Investments 0 --- 0.0%‐20.0% --- 0 --- -0.151237501 89 Page 4 0.23913779 -1.415858811 6.500928468 10.0271373 8.970695704 5.567157319 4.326063653 Appendix A Variance Notes: [1] The negative variance of $14.6 million in cash contributions as of January 31, 2015 is a result of anticipated new gifts that have not yet closed. The Development team is actively working the Campaign plan to meet the budgeted cash goal for the year. Campaign Counsel, Marts and Lundy, is currently evaluating the Campaign plan. [2] The negative $286,000 variance for MARC Building revenues is due to timing. Quarterly rent payments due January 1st totaling $427,756 were received from the university on February 2nd. Offsetting the negative variance was are unrealized gains totaling $77,164 related to the derivative liability on the swap portion of the building loan as well as the fact that the budgeted 5% allowance for vacancies totaling $89,175 did not materialize (occupancy remains at 100%). [3] Investment returns for fiscal year 2014‐15 were projected at 6.0% or $14.4 million, based on a beginning balance of $225 million. The monthly returns were forecasted based on our asset allocation and the historical performance of indexes for each asset class. Fiscal year‐to‐date investment losses on the portfolio through January 31, 2015 totaled approximately 1.4%, or $2.9 million. [4] The positive $2.6 million variance in scholarships and program expenses is in part due to timing of the processing of several scholarships, salary reimbursements, and event‐related invoices mainly in College of Medicine, Wolfsonian, and College of Business will occur in the second half of the year. [5] To‐date, the $850,000 budgeted for the Hospitality Management Dining Facility and the $250,000 budgeted to cover design costs for the International Center for Tropical Botany at the Kampong Building have not been requested. In addition, approximately $111,000 in budgeted expenses for the College of Business Complex has not yet been incurred. The positive $1.1 million variance was offset by unbudgeted expenses totaling $733,031 in support of the Stocker Astrophysics Center. The expenses related to the Stocker Astrophysics Center were forecasted to be expended late last fiscal year. [6] The positive $200,000 variance in Unrestricted Annual expenses is a result of timing in hiring a call center management company, for which $170,000 was budgeted through January 31, 2015. Wilson‐Bennett Technology has been retained and related expenses will be incurred through the remaining half of the fiscal year. The remaining positive variance is also related to timing of budgeted expenses related to Fundraising and Stewardship. [7] The positive $194,000 variance in MARC Building expenses is a result of a $134,000 credit for the reversal of a prior year building renovation expense that should have been capitalized. There have been additional savings in repairs and maintenance as well as in interest expense due to the low interest rate environment. [8] The positive variance of $794,000 in Administrative and Fundraising Expenses is mainly driven by capital campaign expenses related to salaries. 90


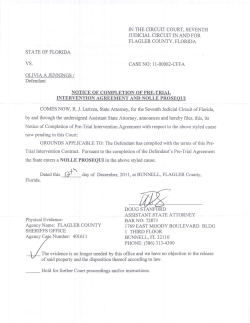
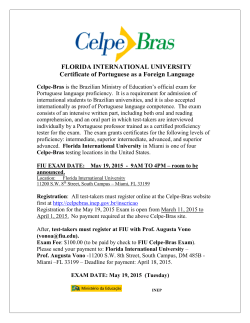


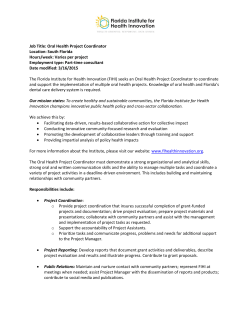
© Copyright 2026