
Front Matter Template - SciDok
Enhancing cognition across the lifespan
Transfer effects of task-switching training in young and old adults
Dissertation
zur Erlangung des akademischen Grades eines
Doktors der Philosophie
der Philosophischen Fakultät III
der Universität des Saarlandes
vorgelegt von
Balázs Fehér
aus Kazincbarcika
Saarbrücken, 2015
Der Dekan:
Prof. Dr. Roland Brünken
Berichterstatterinnen:
Prof. Dr. Jutta Kray
Prof. Dr. Hubert Zimmer
Tag der Disputation: 2015.02.12.
Acknowledgements
I would like to express my gratitude to Tamás Fehér, Shweta Wandana and
Cheng-Hua Bai for reading parts of the dissertation and giving useful feedback. I would
also like to thank those who have helped during my dissertation work in data collection
and other practical issues: Sandra Dörrenbächer, Anna Schramek, Jenny Sinzig, Melanie
Winter, Marie Beck, Isabella Hart, and especially, Caroline Fisher. Most importantly I
would like to thank my supervisor Jutta Kray for all her care and support. Finally, I
would like to thank all members of the International Research Training Group for being a
source of inspiration and encouragement.
iii
“Theories are nets cast to catch what we call 'the world': to rationalize, to explain,
and to master it. We endeavor to make the mesh ever finer and finer.”
KARL POPPER
iv
Enhancing cognition across the lifespan
Transfer effects of task-switching training in young and old adults
Balázs Fehér
Saarland University, 2014
Supervisor: Jutta Kray
Aging is characterized by a decline of performance in many measures of cognitive
functioning such as working-memory, inhibition, and reasoning. A previous training
study (Karbach & Kray, 2009) indicated that task-switching training might improve
crucial cognitive processes which are affected by aging, leading to broad transfer effects
in both old and young adults. The present study aimed to identify exactly which
processes to train in order to facilitate transfer across task domains with cognitive control
training. To this end we manipulated memory-load and inhibition-load in a taskswitching paradigm, as we expected these processes to be the important variables
affecting training scope. We compared performance improvements in four task-switching
groups and an active control group in a pretest-training-posttest design with young and
old adults. High inhibition-load seems to be crucial during training, as near-transfer in old
adults was evident only in this condition. However, we did not find far-transfer effects,
which we attribute to the sparse training material and relatively low cognitive control
demands during training. In summary, our near-transfer results, together with the latest
developments in the literature, suggest that transfer scope might be maximized through
high inhibition training conditions in old adults.
v
Table of Contents
ACKNOWLEDGEMENTS .......................................................................................................... III
TABLE OF CONTENTS ............................................................................................................. VI
LIST OF TABLES ..................................................................................................................... X
LIST OF FIGURES ................................................................................................................. XIII
INTRODUCTION .................................................................................................................... 1
REVIEW OF THE LITERATURE ................................................................................................... 5
Definitions, Models, and Measurement of Executive Control .................................... 5
Definitions of Executive Control ............................................................................. 5
Models of Executive Control ................................................................................... 6
Cognitive development and its relation to executive control ................................ 8
Causes of Age-Related Changes in Cognition ......................................................... 9
Measurement and Development of Executive Control Components .................. 12
Summary ............................................................................................................... 22
Cognitive plasticity and training interventions ......................................................... 23
Learning and Transfer ........................................................................................... 23
Principles to enhance training and transfer effects ............................................. 25
How to quantify transfer?..................................................................................... 25
Cognitive training in older age .................................................................................. 27
Training with task-switching ................................................................................. 30
Are training gains generalizable? .......................................................................... 31
Transfer effects with task-switching training ....................................................... 34
General summary ...................................................................................................... 39
STATEMENT OF PROBLEM AND RESEARCH PREDICTIONS .............................................................. 42
Overview of study design .......................................................................................... 43
Research predictions ................................................................................................. 45
vi
Task-Switching Training Sessions .......................................................................... 45
Near Transfer Effects ............................................................................................ 47
Far Transfer Effects ............................................................................................... 48
Predictions to long-term maintenance of task-switching training ....................... 49
METHOD .......................................................................................................................... 50
Participants ............................................................................................................... 50
Materials and Procedure........................................................................................... 50
Measures at Pretest, posttest and Follow-Up .......................................................... 51
Demographic Questionnaire ..................................................................................... 53
Self-Efficacy Questionnaire ....................................................................................... 53
Cognitive Battery....................................................................................................... 53
Digit Symbol .......................................................................................................... 53
Digit Backward ...................................................................................................... 54
BOMAT .................................................................................................................. 54
2-back .................................................................................................................... 55
Reading Span......................................................................................................... 56
Color Stroop .......................................................................................................... 57
AX-CPT ................................................................................................................... 57
3-back .................................................................................................................... 58
Counting Span ....................................................................................................... 58
Number Stroop ..................................................................................................... 59
Raven’s Standard Progressive Matrices (Raven) .................................................. 60
Measurement of Task Switching........................................................................... 61
Follow-up session ...................................................................................................... 68
Procedure .................................................................................................................. 68
Matching the participants ........................................................................................ 69
Data analysis ............................................................................................................. 70
vii
Task switching and Stroop tasks ........................................................................... 70
Matching ............................................................................................................... 71
RESULTS ........................................................................................................................... 74
Age-related differences in Task-switching Training as a Function of Inhibition and
Updating Demands ................................................................................................... 74
RTs and ERs Group 1 ............................................................................................. 74
RTs and ERs Groups 2-5 ........................................................................................ 75
Contrasts ............................................................................................................... 79
General Summary ................................................................................................. 80
Near transfer of Task-Switching Training ................................................................. 82
Analyzing near-transfer effects separately for younger and older adults............ 88
Far transfer ............................................................................................................... 93
AX-CPT ................................................................................................................... 98
Inhibitory Control (Color Stroop, Number Stroop) ............................................. 101
2-back .................................................................................................................. 103
3-back .................................................................................................................. 104
Working-memory ................................................................................................ 105
Fluid intelligence ................................................................................................. 106
Digit Symbol ........................................................................................................ 108
Follow-up analyses .................................................................................................. 110
Effect Sizes of Training and Transfer....................................................................... 111
DISCUSSION .................................................................................................................... 116
Summary of Main Results ....................................................................................... 116
Effects of Age, Cuing Type and Stimulus Ambivalence on Task-Switching Training
............................................................................................................................. 117
Transfer gains ...................................................................................................... 118
Explanations for the smaller transfer gains ............................................................ 119
viii
Near transfer ....................................................................................................... 120
Far-transfer ......................................................................................................... 123
Explanations for the transfer gains in older adults ................................................. 127
Impairments in dual-task contexts ..................................................................... 127
Improved interference resolution in older adults .............................................. 127
Plasticity of cognitive control components ........................................................ 129
Context, cuing, preparation ................................................................................ 130
Comparing different paradigms.............................................................................. 133
Stimulus complexity ............................................................................................ 133
Training duration ................................................................................................ 134
Training difficulty ................................................................................................ 135
Control groups .................................................................................................... 135
Maintenance of training gains ................................................................................ 136
Individual and group level training gains................................................................ 136
Future directions - Mechanism of change with training in older adults ................. 137
Limitations of the Study .......................................................................................... 139
Conclusion ............................................................................................................... 140
APPENDICES .................................................................................................................... 141
REFERENCES .................................................................................................................... 149
ix
List of Tables
TABLE 1 DESCRIPTIVE STATISTICS OF THE EFFECTIVE SAMPLE FOR AGE, GENDER DISTRIBUTION ............. 50
TABLE 2 MEASURED CONSTRUCTS, ITEMS, TYPE OF TESTS, ESTIMATED TIME NEEDED FOR COMPLETION OF
TESTS AND SOURCES. ....................................................................................................... 52
TABLE 3 STUDY DESIGN SHOWING THE TESTS ASSESSED DURING SPECIFIC PHASES OF THE STUDY AS WELL AS
DIFFERENT TASK CONDITIONS OF THE TASK-SWITCHING TEST AND THE FIVE DIFFERENT TRAINING
GROUPS........................................................................................................................ 68
TABLE 4 MEAN (M) REACTION TIMES AND STANDARD DEVIATIONS (SD) FOR EACH TRIAL TYPE (SINGLE,
STAY, SWITCH) AS WELL AS MIXING AND SWITCH COSTS SEPARATELY FOR EACH TRAINING GROUP AT
PRETEST........................................................................................................................ 71
TABLE 5 MEAN (M) PERCENTAGE CORRECT TRIALS AND STANDARD DEVIATIONS (SD) FOR EACH TRIAL TYPE
(SINGLE, STAY, SWITCH) SEPARATELY FOR EACH TRAINING GROUP AT PRETEST. ............................ 73
TABLE 6 OVERALL ANOVA RESULTS FOR TASK-SWITCHING GROUPS (GROUPS 2-5) BASED ON LOGTRANSFORMED REACTION TIMES (LOG-RT) AND ERROR RATES. (ER) ........................................ 76
TABLE 7 MEAN (M) REACTION TIMES AND STANDARD DEVIATIONS (SD) FOR EACH TRIAL TYPE (SINGLE,
STAY, SWITCH) AS WELL AS MIXING AND SWITCH COSTS FOR YOUNGER AND OLDER ADULTS SEPARATELY
FOR EACH TRAINING GROUP AT PRETEST AND POSTTEST. ......................................................... 83
TABLE 8 MEAN (M) PERCENTAGE CORRECT TRIALS AND STANDARD DEVIATIONS (SD) FOR EACH TRIAL TYPE
(SINGLE, STAY, SWITCH) FOR YOUNGER AND OLDER ADULTS SEPARATELY FOR EACH TRAINING GROUP
AT PRETEST AND POSTTEST. .............................................................................................. 84
TABLE 9. PRINCIPAL COMPONENT ANALYSIS, ROTATED COMPONENT MATRIX. .................................. 94
TABLE 10. CORRELATIONS BETWEEN THE PSYCHOMETRIC TESTS IN THE COGNITIVE BATTERY FOR BOTH AGE
GROUPS. CORRELATIONS MARKED IN RED REFER TO INDICATORS FOR ONE FACTOR. ..................... 95
TABLE 11. CORRELATIONS BETWEEN THE PSYCHOMETRIC TESTS IN THE COGNITIVE BATTERY FOR YOUNGER
ADULTS. CORRELATIONS MARKED IN RED REFER TO INDICATORS FOR ONE FACTOR. ...................... 96
TABLE 12. CORRELATIONS BETWEEN THE PSYCHOMETRIC TESTS IN THE COGNITIVE BATTERY FOR OLDER
ADULTS. CORRELATIONS MARKED IN RED REFER TO INDICATORS FOR ONE FACTOR. ...................... 97
x
TABLE 13 DIGIT SYMBOL MEAN (M) SCORES AND STANDARD DEVIATIONS (SD) FOR YOUNGER AND OLDER
ADULTS SEPARATELY FOR EACH TRAINING GROUP AT PRETEST AND POSSTEST.
........................... 109
TABLE 14. MEAN (M) REACTION TIMES AND STANDARD DEVIATIONS (SD) FOR MIXING COSTS FOR YOUNGER
AND OLDER ADULTS SEPARATELY FOR EACH TRAINING GROUP AT PRETEST, POSTTEST AND FOLLOW-UP.
................................................................................................................................. 111
TABLE 15 MEAN REACTION TIMES (MS) AS A FUNCTION OF SESSION (1, 2, 3, 4), AGE (YOUNGER ADULTS,
OLDER ADULTS), GROUP (GROUP 2, GROUP 3, GROUP 4, GROUP 5) AND TRIAL (STAY, SWITCH)
141
TABLE 16 PERCENTAGE OF CORRECT TRIALS (%) AS A FUNCTION OF SESSION (1, 2, 3, 4), AGE (YOUNGER
ADULTS, OLDER ADULTS), GROUP (GROUP 2, GROUP 3, GROUP 4, GROUP 5) AND TRIAL (STAY,
SWITCH) ..................................................................................................................... 141
TABLE 17 MEAN REACTION TIMES (M) AND STANDARD DEVIATIONS (SD) OF THE COLOR STROOP TEST FOR
EACH TRIAL TYPE (NEUTRAL, INCONGRUENT) FOR EACH TRAINING GROUP AT PRETEST AND POSTTEST.
................................................................................................................................. 142
TABLE 18 MEAN REACTION TIMES (M) AND STANDARD DEVIATIONS (SD) OF THE NUMBER STROOP TEST
FOR EACH TRIAL TYPE (NEUTRAL, INCONGRUENT) FOR EACH TRAINING GROUP AT PRETEST AND
POSTTEST. ................................................................................................................... 142
TABLE 19 MEAN PERCENTAGE CORRECT TRIALS (M) AND STANDARD DEVIATIONS (SD) OF THE COLOR
STROOP TEST FOR EACH TRIAL TYPE (NEUTRAL, INCONGRUENT) FOR EACH TRAINING GROUP AT
PRETEST AND POSTTEST. ................................................................................................ 143
TABLE 20 MEAN PERCENTAGE CORRECT TRIALS (M) AND STANDARD DEVIATIONS (SD) OF THE NUMBER
STROOP TEST FOR EACH TRIAL TYPE (NEUTRAL, INCONGRUENT) FOR EACH TRAINING GROUP AT
PRETEST AND POSTTEST. ................................................................................................ 143
TABLE 21 2-BACK MEAN (M) SCORES AND STANDARD DEVIATIONS (SD) FOR YOUNGER AND OLDER ADULTS
SEPARATELY FOR EACH TRAINING GROUP AT PRETEST AND POSSTEST. ...................................... 144
TABLE 22 3-BACK MEAN (M) SCORES AND STANDARD DEVIATIONS (SD) FOR YOUNGER ADULTS SEPARATELY
FOR EACH TRAINING GROUP AT PRETEST AND POSSTEST. ....................................................... 144
xi
TABLE 23 WORKING MEMORY AGGREGATED SCORES (M) AND STANDARD DEVIATIONS (SD) FOR YOUNGER
AND OLDER ADULTS SEPARATELY FOR EACH TRAINING GROUP AT PRETEST AND POSTTEST.
........... 144
TABLE 24 RAVEN MEAN (M) SCORES AND STANDARD DEVIATIONS (SD) FOR YOUNGER AND OLDER ADULTS
SEPARATELY FOR EACH TRAINING GROUP AT PRETEST AND POSSTEST. ...................................... 145
TABLE 25 BOMAT MEAN (M) SCORES AND STANDARD DEVIATIONS (SD) FOR OLDER ADULTS SEPARATELY
FOR EACH TRAINING GROUP AT PRETEST AND POSSTEST. ....................................................... 145
TABLE 26 COUNTING SPAN MEAN PERCENTAGE OF CORRECT TRIALS (M) AND STANDARD DEVIATIONS (SD)
FOR YOUNGER AND OLDER ADULTS SEPARATELY FOR EACH TRAINING GROUP AT PRETEST AND
POSTTEST. ................................................................................................................... 146
TABLE 27 READING SPAN MEAN PERCENTAGE OF CORRECT TRIALS (M) AND STANDARD DEVIATIONS (SD)
FOR YOUNGER AND OLDER ADULTS SEPARATELY FOR EACH TRAINING GROUP AT PRETEST AND
POSTTEST. ................................................................................................................... 147
TABLE 28 DIGIT BACKWARDS MEAN (M) SCORES AND STANDARD DEVIATIONS (SD) FOR YOUNGER AND
OLDER ADULTS SEPARATELY FOR EACH TRAINING GROUP AT PRETEST AND POSSTEST. .................. 148
xii
List of Figures
FIGURE 1 CROSS-SECTIONAL DATA FROM THE SEATTLE LONGITUDINAL STUDY (IMAGE FROM HEDDEN &
GABRIELI, 2004) ............................................................................................................. 9
FIGURE 2 KARBACH & KRAY (2009): EFFECT SIZE D’ FOR NEAR AND FAR TRANSFER AS A FUNCTION OF
TRAINING (SINGLE-TASK, TASK-SWITCHING), TRANSFER MEASURE (MC = MIXING COSTS; SC = SWITCH
COSTS; IC = INTERFERENCE CONTROL; VWM = VERBAL WORKING-MEMORY; SWM = SPATIAL
WORKING-MEMORY; FI = FLUID INTELLIGENCE), AND AGE (YOUNGER ADULTS, OLDER ADULTS). ..... 38
FIGURE 3 EXAMPLE SHEET FROM THE BOMAT TEST ..................................................................... 55
FIGURE 4 EXAMPLE SHEET FROM THE RAVEN TEST ........................................................................ 61
FIGURE 5 SCHEMATIC DEPICTION OF THE TASK-SWITCHING PARADIGM USED IN THE STUDY .................... 62
FIGURE 6 ILLUSTRATION OF THE FOUR TASK-SWITCHING CONDITIONS................................................ 64
FIGURE 7 SCHEMATIC DEPICTION OF THE TASK-SWITCHING PARADIGM SHOWING RESPONSE ASSIGNMENTS
PRESENTED IN THE PROGRAM. ........................................................................................... 65
FIGURE 8 SCHEMATIC DEPICTION OF THE TRIAL PROCEDURE IN THE TASK-SWITCHING TASKS................... 66
FIGURE 9. MEAN RT (MS) AND PERCENTAGE OF CORRECT TRIALS (%) AS A FUNCTION OF TRAINING SESSION
(1, 2, 3, 4) AND AGE GROUP (YOUNGER ADULTS, OLDER ADULTS) FOR GROUP 1 (SINGLE TASK –
BIVALENT STIMULI). ERROR BARS INDICATE THE STANDARD ERROR OF THE MEAN. ........................ 74
FIGURE 10. MEAN REACTION TIMES (MS) AS A FUNCTION OF SESSION (1, 2, 3, 4), AGE GROUP (YOUNGER
ADULTS, OLDER ADULTS), GROUP (GROUP 2, GROUP 3, GROUP 4, GROUP 5) AND TRIAL TYPE (STAY,
SWITCH). ERROR BARS REFER TO STANDARD ERROR OF THE MEAN. ........................................... 77
FIGURE 11. PERCENTAGE OF CORRECT TRIALS (%) AS A FUNCTION OF SESSION (1, 2, 3, 4), AGE GROUP
(YOUNGER ADULTS, OLDER ADULTS), GROUP (GROUP 2, GROUP 3, GROUP 4, GROUP 5) AND TRIAL
TYPE (STAY, SWITCH). ERROR BARS REFER TO THE STANDARD ERROR OF THE MEAN. ..................... 78
FIGURE 12. MIXING COSTS AND SWITCH COSTS, BASED ON MEAN REACTION TIMES, IN BOTH AGE GROUPS
(YOUNGER ADULTS, OLDER ADULTS) SEPARATELY FOR EACH GROUP (GROUP 1-5). ERROR BARS REFER
TO THE STANDARD ERROR OF THE MEAN. ............................................................................. 87
xiii
FIGURE 13. AX-CPT INTERFERENCE COSTS (RT) AS A FUNCTION OF TRAINING GROUP (SINGLE, SWITCH),
AGE GROUP (YOUNGER ADULTS, OLDER ADULTS) AND SESSION (PRETEST, POSTTEST). ERROR BARS
REFER TO THE STANDARD ERRORS OF THE MEAN.
................................................................ 100
FIGURE 14. AX-CPT INTERFERENCE COSTS (ER) AS A FUNCTION OF TRAINING GROUP (SINGLE, SWITCH),
AGE GROUP (YOUNGER ADULTS, OLDER ADULTS) AND SESSION (PRETEST, POSTTEST). ERROR BARS
REFER TO THE STANDARD ERRORS OF THE MEAN.
................................................................ 100
FIGURE 15 COLOR STROOP MEAN INTERFERENCE COSTS (MS) AS A FUNCTION OF AGE GROUP (YOUNGER
ADULTS, OLDER ADULTS), TRAINING GROUP (SINGLE, SWITCH) AND SESSION (PRETEST, POSTTEST).
ERROR BARS REFER TO THE STANDARD ERRORS OF THE MEAN. ............................................... 101
FIGURE 16 NUMBER STROOP MEAN INTERFERENCE COSTS (MS) AS A FUNCTION OF AGE GROUP (YOUNGER
ADULTS, OLDER ADULTS), TRAINING GROUP (SINGLE, SWITCH) AND SESSION (PRETEST, POSTTEST).
ERROR BARS REFER TO THE STANDARD ERRORS OF THE MEAN. ............................................... 103
FIGURE 17 2-BACK MEAN PERFORMANCE (HITS – FALSE ALARMS) AS A FUNCTION OF TRAINING GROUP
(SINGLE, SWITCH), AGE GROUP (YOUNGER ADULTS, OLDER ADULTS) AND SESSION (PRETEST,
POSTTEST). ERROR BARS REFER TO THE STANDARD ERRORS OF THE MEAN. ............................... 104
FIGURE 18 3-BACK MEAN PERFORMANCE (HITS – FALSE ALARMS) AS A FUNCTION OF TRAINING GROUP
(SINGLE, SWITCH) AND SESSION (PRETEST, POSTTEST) FOR YOUNG ADULTS. ERROR BARS REFER TO THE
STANDARD ERRORS OF THE MEAN. ................................................................................... 105
FIGURE 19. WM SPAN AS A FUNCTION OF AGE GROUP (YOUNGER ADULTS, OLDER ADULTS), TRAINING
GROUP (SINGLE, SWITCH) AND SESSION (PRETEST, POSTTEST). ERROR BARS REFER TO THE STANDARD
ERRORS OF THE MEAN. .................................................................................................. 106
FIGURE 20 RAVEN MEAN PERFORMANCE (CORRECT TRIALS) AS A FUNCTION OF AGE GROUP (YOUNGER
ADULTS, OLDER ADULTS), TRAINING GROUP (SINGLE, SWITCH) AND SESSION (PRETEST, POSTTEST).
ERROR BARS REFER TO THE STANDARD ERRORS OF THE MEAN. ............................................... 107
FIGURE 21 BOMAT MEAN PERFORMANCE (CORRECT TRIALS) AS A FUNCTION OF TRAINING GROUP (SINGLE,
SWITCH) AND SESSION (PRETEST, POSTTEST). ERROR BARS REFER TO THE STANDARD ERRORS OF THE
MEAN. ....................................................................................................................... 108
xiv
FIGURE 22. EFFECT SIZES (D’) FOR SWITCH COST REDUCTIONS DURING TRAINING FOR YOUNGER AND OLDER
ADULTS IN THE FOUR TASK SWITCHING GROUPS. ................................................................. 112
FIGURE 23. EFFECT SIZES (D’) FOR SWITCH COST REDUCTIONS FROM PRETEST TO POSTTEST FOR YOUNGER
AND OLDER ADULTS IN THE FIVE TRAINING GROUPS. ............................................................. 113
FIGURE 24. EFFECT SIZES (D’) FOR MIXING COST REDUCTIONS FROM PRETEST TO POSTTEST FOR YOUNGER
AND OLDER ADULTS IN THE FIVE TRAINING GROUPS. ............................................................. 114
FIGURE 25. FAR-TRANSFER EFFECT SIZES (D') FOR YOUNGER ADULTS AS A FUNCTION OF MEASURE (WM:
WORKING MEMORY; AXCPT: RT INTERFERENCE; NUMBER STROOP: RT INTERFERENCE, COLOR
STROOP: RT INTERFERENCE; RAVEN; 2-BACK, 3-BACK). ...................................................... 115
FIGURE 26. FAR-TRANSFER EFFECT SIZES (D') FOR OLDER ADULTS AS A FUNCTION OF MEASURE (WM:
WORKING MEMORY; AXCPT: RT INTERFERENCE; NUMBER STROOP: RT INTERFERENCE, COLOR
STROOP: RT INTERFERENCE; RAVEN; 2-BACK, 3-BACK). ...................................................... 115
FIGURE 27 COUNTING SPAN MEAN PERFORMANCE (% CORRECT) AS A FUNCTION OF AGE GROUP (YOUNGER
ADULTS, OLDER ADULTS), TRAINING GROUP (SINGLE, SWITCH) AND SESSION (PRETEST, POSTTEST).
ERROR BARS REFER TO THE STANDARD ERRORS OF THE MEAN. ............................................... 146
FIGURE 28 READING SPAN MEAN PERFORMANCE (% CORRECT) AS A FUNCTION OF AGE GROUP (YOUNGER
ADULTS, OLDER ADULTS), TRAINING GROUP (SINGLE, SWITCH) AND SESSION (PRETEST, POSTTEST).
ERROR BARS REFER TO THE STANDARD ERRORS OF THE MEAN. ............................................... 147
FIGURE 29 DIGIT BACKWARD MEAN PERFORMANCE (CORRECT TRIALS) AS A FUNCTION OF AGE GROUP
(YOUNGER ADULTS, OLDER ADULTS), TRAINING GROUP (SINGLE, SWITCH) AND SESSION (PRETEST,
POSTTEST). ERROR BARS REFER TO THE STANDARD ERRORS OF THE MEAN. ............................... 148
xv
Introduction
What is going to be investigated in the present work in short is how people’s
cognitive abilities can be improved in younger and older age. Our life expectancy during
the last century has increased significantly and this trend is expected to continue in the
future (Vaupel, 2010). As a result, we are now facing the problem that our societies are
rapidly ageing, especially in the developed countries. Unfortunately, we also know that
aging is associated with a decline in many areas of cognitive functioning (for reviews, see
Bishop, Lu, & Yankner, 2010; Craik & Salthouse, 2000; Hedden & Gabrieli, 2004;
Lindenberger & Mayr, 2013; Nyberg, Lövdén, Riklund, Lindenberger, & Bäckman,
2012; Reuter-Lorenz, 2002).
The human mind is an evolving entity that undergoes continuous transformation
during development. This transformation is reflected in the functional and structural
changes that take place in the nervous system during an individual’s lifespan. On the one
hand, these changes are the consequences of unfolding biological processes that underlie
the maturation and decline of the human brain. On the other hand, the human brain is
capable of undergoing substantial experience dependent changes, a phenomenon which is
referred to as cognitive plasticity.
Cognitive plasticity refers to the ability of the brain to reorganize, change, and
improve cognitive processes in order to deal more effectively with problems or to achieve
aims more efficaciously. These cognitive changes are also reflected in the structural and
functional changes of the nervous system. Traditionally, cognitive plasticity has been
studied through examining the neural changes that take place in the brain of laboratory
animals, for example, as result of enriched environment. With the development of noninvasive neuroimaging methods it became possible to study, how different types of
1
training such as motor skill acquisition, lead to neural changes in human subjects as well.
In the clinical context, cognitive training has been successfully used even before these
developments. There is evidence that training interventions can be effective to counteract
adverse conditions that arise after brain lesions. These findings point to substantial and
often surprising plasticity of the human brain.
From a developmental perspective there is evidence showing cognitive plasticity
throughout the adult lifespan (for reviews see Burke & Barnes, 2006; Greenwood, 2007).
The reserved cognitive plasticity in older adults can be measured as changes in the
structure and function of the human brain. For example, a magnetic resonance imaging
(MRI) study has shown that three months of training in juggling leads to an expansion of
grey matter in specific areas of the brain in younger adults (Draganski et al., 2004). A
similar study has shown that older adults could also learn juggling, although with
somewhat less proficiency, and that similar areas undergo change as a result of the
training (Boyke, Driemeyer, Gaser, Büchel, & May, 2008). Moreover, it has been shown
that changes can be observed as a result of training in white matter structure (Scholz,
Klein, Behrens, & Johansen-Berg, 2009), but this malleability might be limited with
increasing age (Bengtsson et al., 2005). Hence, improvements in cognitive functioning
might be expected even at old age.
Apart from the questions regarding the range of plastic capacity of the brain
throughout the lifespan, another important issue in cognitive aging research is the
question of whether cognitive decline can be reversed through training (Baltes &
Lindenberger, 1988; Mayr, 2008). To be more precise the question revolves around
finding out what processes should be trained and how, so that cognitive decline is
reversed effectively. This requires that the training does not remain specific to the trained
2
task, but that it generalizes to a wide range of other tasks. This transferability of training
gains should be an essential consideration in any cognitive training program.
However, it has been difficult to find transfer of training to tasks that are not very
similar to the trained task itself (for reviews see Green & Bavelier, 2008; and Noack,
Lövdén, Schmiedek, & Lindenberger, 2009). One explanation for the limited scope of
transfer effects is that only task-specific processes were trained, limiting the transfer to
tasks relying on the same processes. Recent findings, however, point to the feasibility of
cognitive interventions with a wider range of transfer (Anguera et al., 2013; Schmiedek,
Lövdén, & Lindenberger, 2010).
In the field of cognitive aging, past research investigating the reserve capacity of
older adults focused on improving episodic memory through mnemonic techniques and
improving reasoning (Baltes & Kliegl, 1992; Baltes, Sowarka, & Kliegl, 1989; Singer,
Lindenberger, & Baltes, 2003; Verhaeghen, Marcoen, & Goossens, 1992; Zehnder,
Altgassen, Martin, & Clare, 2009). Recently, however, a different approach has been
studied that might prove to be more effective: instead of training explicit strategies, a
number of studies investigated the training of more general processes, such as executive
functions (Bherer et al., 2005; Dahlin, Neely, Larsson, Bäckman, & Nyberg, 2008;
Dahlin, Nyberg, Bäckman, & Neely, 2008; Karbach & Kray, 2009; Karbach, Mang, &
Kray, 2010; Kramer, Larish, & Strayer, 1995; Kray, Karbach, Haenig, & Freitag, 2012;
Li et al., 2008). Executive functions cover a range of cognitive processes that are
necessary for higher-level cognitive functions, such as problem solving (Miller, 2000),
and can be differentiated into several components, such as updating, inhibition and
shifting (Miyake et al., 2000).
Previous research by Karbach and Kray (2009) has demonstrated the efficacy of
training executive functions by means of a task-switching paradigm. In four sessions,
3
children, younger adults, and older adults were trained in task-switching that heavily
relies on executive functions, such as updating, inhibition and shifting. The training has
demonstrated broad transfer effects beyond the trained tasks as measured by pretest to
posttest performance improvements in inhibition, working-memory, and even in fluid
intelligence in all age groups. These findings seem promising, nevertheless, the question
remains regarding what processes are actually trained and facilitate transfer across task
domains when participants take part in a task-switching training. The primary focus of
the present dissertation is to determine the relative importance of executive components
to the transfer effects in younger and older adults. Therefore, different training conditions
were created that differed in cuing-type and inhibition-load. Performance improvements
were compared in a pretest-training-posttest design to an active control group in younger
and older adults. With this setup we intended to uncover whether during task-switching
training improvements in interference control, updating, or merely more efficient shifting
are responsible for improvements as evidenced by far-transfer effects.
The dissertation is divided into three parts. Firstly, I will present a review of the
relevant literature, giving an overview about the concepts of executive functions,
cognitive training, and transfer. I will also present the main findings regarding aging and
training effects in the task switching paradigm. Based on this overview I will point out
the specific question which this study is intended to answer. Secondly, in the empirical
part, I will present the methods and results of my study. And thirdly, the last part
comprises a critical discussion of the results and provides an outlook for future directions
in research on this topic.
4
Review of the literature
The review of the literature is separated into three parts. In the first part,
theoretical models and empirical findings will be reviewed regarding executive control,
the relation of executive functions to higher intellectual abilities, and age differences in
executive functions. In the second part, theoretical concepts and empirical findings
regarding cognitive plasticity and training interventions will be reviewed. In the third
part, the focus will be on cognitive plasticity in older age primarily in relation with taskswitching training. In addition, the transferability of training gains in cognitive
interventions will be considered in this last part, along with an overview of measuring
and evaluating transfer effects.
DEFINITIONS, MODELS, AND MEASUREMENT OF EXECUTIVE CONTROL
Definitions of Executive Control
In everyday life we often face situations, in which we cannot depend on automatic
behavioral patterns but have to regulate our behavior according to unexpected changes in
the environment. Imagine walking down the street listening to music while crossing the
road at the sign of the green light. Suddenly a car wants to cross your way seemingly
unaware of you. In such cases you have to exert control over what features of the
environment you attend to (approaching car rather than music), how to respond to
different stimuli from the environment (does it blink?), and to select what behaviors are
most relevant in the given situation (stop, walk back, or walk faster). The execution of
such actions requires many separate mechanisms. With the term “executive functions”,
we are referring to several sub-processes that are important in regulating goal-directed
behavior when circumstances change and control is required. In the present dissertation, I
will use the terms executive control and cognitive control interchangeably. Cognitive
5
control can also be defined as “the ability to regulate, coordinate, and sequence thoughts
and actions in accordance with internally maintained behavioral goals” (cf. Braver,
2012).
Although there is lack of consensus about a taxonomy of executive processes,
there is general agreement that they include at least the following three components:
working-memory operations including updating and maintenance of relevant information
(‘updating’), inhibition of irrelevant information (‘inhibition’), and shifting between
multiple tasks or mental sets (‘shifting’). In addition, it is also postulated that some forms
of ‘supervising’ or ‘monitoring’ processes are also crucial in ensuring that goal oriented
behaviors succeed. There are different hypotheses of how this monitoring process might
take place. Some imagine a system in which errors during task execution are reported,
which subsequently leads to adjustments in cognitive control (Gehring, Goss, Coles,
Meyer, & Donchin, 1993). Some suggest a mechanism which reports whenever there is a
higher level of conflict during task execution, which again leads to subsequent
adjustment of cognitive control (Cohen, Botvinick, & Carter, 2000). Although there are
more detailed classifications of executive functions (e.g. Jurado & Rosselli, 2007), for the
present considerations the above description will suffice (for a recent review, see
Hofmann, Schmeichel, & Baddeley, 2012).
Models of Executive Control
Early cognitive models of executive control postulated a unified central executive
system, such as the central executive in Baddeley’s working-memory model (for a review
see Baddeley, 2003) and the supervisory attention system in Shallice’s Supervisory
Attention System model (Norman & Shallice, 1980). In Baddeley’s original model, the
central executive was not well specified. In Shallice’s model, attentional control is dived
6
into two processes, one of which controls behavior according to habitual patterns or
schemas, guided by cues from the environment, and one attentionally limited control
system, the supervisory attentional system (SAS), which intervenes whenever habitual
response is insufficient. In both models, the executive system has been related to frontal
lobe functioning (Miller & Cohen, 2001; on the relationship between frontal lobe and
cognitive control see Miller, 2000).
Presently, although the exact specification and the interrelation of the processes
underlying cognitive control are still debated, the idea of a strictly unified cognitive
control system has been abandoned on the basis of a number of empirical findings
coming from different fields in cognitive psychology. The first argument against a
unified executive system stemmed from clinical observations, suggesting that executive
functions are selectively impaired (e.g. Godefroy, Cabaret, Petit-Chenal, Pruvo, &
Rousseaux, 1999). For instance, patients with posterior lobe damage exhibit impaired
short-term memory, while some patients with frontal damage exhibit impaired inhibitory
function. Neuroimaging studies also support the idea of separable processes in cognitive
control (e.g., Collette et al., 2005; Dreher & Berman, 2002; MacDonald, Cohen, Stenger,
& Carter, 2000; Ridderinkhof, Ullsperger, Crone, & Nieuwenhuis, 2004; E. E. Smith &
Jonides, 1999).
A second line of argument came from psychometric studies examining
correlations between performances on different executive control tests. One study by
Miyake and colleagues (Miyake et al., 2000) assessed in a large sample of younger
participants several tests related with the three broad areas of executive control
(inhibition, shifting, and updating) and found in a latent variable analysis that these
processes are in fact separable. Fisk and Sharp (Fisk & Sharp, 2004), investigating
individuals aged between 20 and 81 years, have also found three separate factors of
7
executive control, and showed that all of them exhibit significant decline with ageing. A
general consensus emerged among the researchers in this field that these processes –
inhibition, shifting, and updating - are indeed core components of executive functions
(Bialystok & Craik, 2006 p. 70-95; Hofmann et al., 2012).
Thirdly, there is evidence for differential age-related changes in executive control.
There are studies indicating that executive functions show differential developmental
trajectories (Cepeda, Kramer, & Gonzalez de Sather, 2001; Garon, Bryson, & Smith,
2008; Hughes, 2011; Williams, Ponesse, Schachar, Logan, & Tannock, 1999), but the
general structure of executive control is the same for childhood and adulthood. A study
for instance (Huizinga, Dolan, & van der Molen, 2006) investigated participants 7 to 21
years old, and showed that ‘working-memory’ and ‘shifting’ developed at different rates,
with ‘shifting’ performance attaining adult levels during adolescence and ‘workingmemory’ continuing to develop during young adulthood.
Cognitive development and its relation to executive control
One influential theoretical model describing intellectual development is the ‘two
component model’ initially proposed by Baltes (for a review, see Baltes, Lindenberger, &
Staudinger, 2006; Baltes, 1987). It suggests that lifespan intellectual development can be
characterized by the development of two components of intellectual functioning. The first
is the so called ‘mechanics’ component, that refers to basic processes that are biologically
based, such as speed, accuracy, and coordination of elementary processes. It rapidly
develops during childhood through young adulthood, but then already starts to show
decline in middle adulthood. It can be said that it is strictly based on the biological
development of the nervous system. The other component is called 'pragmatics'
component not strictly related with the architecture of the nervous system, but it is the
8
abstract knowledge base that the individual is endowed with, and which can grow by the
influence of culture. This component does not show decline until very old age.
The ‘mechanics’ component is the means to gain knowledge, while ‘pragmatics’
component is the abstract knowledge gained, or that is being 'crystallized'. Evidence for
this two-component model comes from multiple sources (see Baltes et al., 2006; p. 598600.), including longitudinal studies (e.g. Seattle Longitudinal Study) indicating that
cognitive abilities related with the ‘mechanic’ component (i.e. reasoning, memory,
perceptual speed, spatial orientation) follow a nearly linear decline throughout adulthood,
while cognitive abilities related with the ‘pragmatics’ component (i.e. verbal ability,
numeric ability) does not show decline until very old age (see Figure 1).
Figure 1 Cross-sectional data from the Seattle Longitudinal Study (image from Hedden &
Gabrieli, 2004)
Causes of Age-Related Changes in Cognition
In this section different approaches to explain age-related changes in cognition
will be outlined, along with empirical findings. The first of these is the 'general slowing'
hypothesis, which mainly explains age-related changes in intellectual fluid abilities as a
9
function of a general slowing of processes (T. Salthouse, 1996). According to this theory,
the slowing down of executing processes leads to impaired cognitive performance in
most cognitive tasks. While the general slowing hypothesis is still an integral theory for
explaining age-related decline in many areas, it is not adequate to explain age-differences
in conditions with high cognitive control demands (Mayr & Kliegl, 1993; Verhaeghen,
Steitz, Sliwinski, & Cerella, 2003).
Age-related changes in intellectual abilities can also be explained as a function of
changes in inhibitory processes. An early study (Kramer, Humphrey, Larish, & Logan,
1994) for instance, found little evidence for age-related deficits in inhibitory processes,
however older adults had more difficulty than younger adults to abort an action (in a stop
signal paradigm where participants are asked to respond to a visual stimuli unless they
hear an auditory signal), and it also proved more difficult for older adults to learn new
rules in a categorization task. Also, comparing younger and older adults, inhibition
related processes were found to be delayed in the elderly as evidenced by delayed
inhibition-related ERPs (event related potentials, recorded with electroencephalogram)
(Falkenstein, Hoormann, & Hohnsbein, 2002).
It is also possible to attribute age-related differences in intellectual abilities to
changes in working-memory performance. Recent studies have demonstrated that older
adults show deficits in suppressing task-irrelevant information during working-memory
performance whereas their ability to enhance task-relevant information is intact
(Gazzaley, Cooney, Rissman, & D’Esposito, 2005). Furthermore, it has been shown that
an interruption during task maintenance distracts both younger and older adults, however
while younger adults quickly disengage from the task-irrelevant disruptor and reestablish
task-relevant functional networks, older adults are impaired in dynamic shifting between
competing representations (Clapp, Rubens, Sabharwal, & Gazzaley, 2011). Similar
10
findings came also from a study employing an inhibition of return paradigm (Wascher,
Falkenstein, & Wild-Wall, 2011) and another study using a dual task paradigm (Hahn,
Wild-Wall, & Falkenstein, 2011) suggesting that older adults process irrelevant
information similarly as relevant information, and this leads to impairments in workingmemory performance.
We can also approach to explain age-related differences in intellectual abilities in
terms of biological changes in the nervous system. Some decades ago large scale general
neuron loss was suggested to be the main reason for age-related cognitive decline (Ball,
1977; Coleman & Flood, 1987). However, recently it became evident that general neuron
loss in most areas does not contribute significantly to age-related cognitive decline
(Burke & Barnes, 2006) but rather there are specific areas such as the prefrontal cortex
(PFC) in which neuron loss is related to cognitive decline. A study, for example, with
aged monkeys have found an approximately 30 percent reduction of neurons compared to
younger animals in the dorsolateral PFC area 8A, and this reduction correlated with
impaired performance in a working-memory task, but at the same time other areas related
to working-memory (such as area 46) were well preserved (Smith, Rapp, McKay,
Roberts, & Tuszynski, 2004). Less age-related change has been reported for many
electrophysiological properties of neurons in the hippocampus and the PFC, such as
resting membrane potential, membrane time constant, threshold to elicit an action
potential, and rise time and duration of an action potential (Burke & Barnes, 2006).
However, reduced synapse number in older animals might be related with cognitive
decline. It has been found in rats, that synapse number per neuron diminishes during
aging in the dentate gyrus, which is a hippocampal sub-region that is important in spatial
memory (Geinisman, Toledo-Morrell, & Morrell, 1986).
11
Previously, I have mentioned that there is a close connection between executive
control and functioning of the prefrontal cortex (Miller, 2000).The frontal lobes develop
more slowly than other brain areas, and many attribute the development of executive
functioning during childhood and adolescents to the maturation of the frontal lobes
(Casey, Tottenham, Liston, & Durston, 2005). We also know that the frontal lobes are
also among the first areas that show deterioration during aging (Hedden & Gabrieli,
2004). A cross-sectional neuroimaging study for instance, estimating volumetric changes
of different areas of the brain across the lifespan, has revealed a steady linear decline of
the lateral prefrontal cortex from age 20, while other areas like primary visual cortex
showed only slight age-related decline in volume (Raz et al., 2004). For a review on the
relationship between prefrontal cortex function and cognitive aging, see West (1996).
Measurement and Development of Executive Control Components
We were interested in training related improvements in executive functions which
were measured with a wide array of tests in the present study. An overview of the
operationalization of these constructs will be given below. The specific tests within each
domain will be described in the method section.
Task Switching
Shifting is measured by paradigms in which participants have to switch regularly
between multiple task sets (for a recent review, see Kiesel et al., 2010; Grange &
Houghton, in press). Each event from the environment affords a range of possible set of
responses, and the appropriate response varies as a function of the task. In an
experimental setting, task sets can be specified by instruction (e.g., categorizing colors, or
shape).
12
The first description and use of the task-switching paradigm can be traced back to
Jersild’s early paper from 1927 (Jersild, 1927). He conducted a series of experiments
with students who had to work through a list of items, either repeating one task or
alternating between two (Monsell, 2003). Comparing the time needed to finish the singletask list with the time needed to finish the alternating-task list was used as an indicator of
the time needed to switch between task sets. Later Jersild’s paradigm was reinvented by
Biedermann and Spector (1976) using discrete reaction time measures. Nowadays
researchers mostly use computerized tests to measure task-switching performance.
Participants are usually instructed first to perform a simple categorization task by
pressing one of two response buttons for a set of stimuli according to a simple rule, for
example, deciding whether a picture is colored or black and white (task A). Then with the
same set of stimuli or another set of stimuli they are instructed to perform another
categorization task often by using the same response buttons, for example, deciding
whether a picture depicts animals or flowers (task B). We call these blocks in which
participants perform only one categorization task single-task blocks. The blocks in which
tasks need to be shifted are called mixed-task blocks. Moreover, in alternating-runs
paradigm, participants are instructed to alternate between two tasks within a block,
according to a predefined sequence, such as to switch the task on every second trial.
Finally, in task cuing paradigms, participants are instructed to switch tasks according to a
cue that is presented before the stimulus appears. If we use the same stimulus set for both
tasks, we say that the stimuli is bivalent (or ambiguous on the stimulus level). Bivalent
stimulus affords responses for both tasks in which case cognitive control demands are
higher and costs are more substantial (Jersild, 1927; Rogers & Monsell, 1995). A
univalent stimulus on the other hand affords only one task set. Ambiguity can also arise
on the response level, when the same stimulus in different task sets requires different
13
responses. In the mixed-task blocks two trial types can be separated. On so called nonswitch trials the same task has to be performed as in the previous trial (AA or BB) and on
so-called switch trials one has to switch from one task to the other task (AB or BA).
By registering performance on both single blocks and mixed blocks, two kinds of
task-switching costs can be calculated (cf. Kray & Lindenberger, 2000). We can either
calculate the performance difference between performing single-task blocks and mixedtask blocks (termed mixing cost in the following), or we can calculate the performance
difference between switch and non-switch trials within mixed-task blocks (termed switch
cost in the following). In the early studies with the task-switching paradigm, performance
costs were calculated only as the difference between single and mixed blocks (e.g.
Allport, Styles, & Hsieh, 1994; Jersild, 1927). However, it is assumed that this
comparison reflects not purely the additional demand to perform a task switch in mixed
task blocks compared to single task blocks, but also the additional demand to keep
multiple task sets in an active state (cf. Rogers & Monsell, 1995). To have a more precise
estimation of the performance cost resulting from switching between the task sets per se,
Rogers and Monsell (1995) proposed to compare the performance on switch and nonswitch trials within mixed-task blocks. Mixing costs are thought to reflect an additional
memory demand, while switch costs are thought to reflect the switching process per se.
The terminology regarding these performance costs is not unitary among researchers. For
instance, switch costs have been also termed specific or local switch cost and mixing cost
as general or global switch cost.
Both switch and mixing costs are robust, they can be found with different types of
tasks even after extensive practice (Kray & Lindenberger, 2000), and they have been
found repeatedly in task-switching studies (for a review, see Kiesel et al., 2010). Given
their interrelatedness one might ask whether mixing and switch costs are separable. Is it
14
true that mixing cost reflects mainly working-memory demands, while switch costs
reflect mainly shifting demands? By applying confirmatory factor analysis, Kray and
Lindenberger (2000) have demonstrated that the two types of costs are indeed separable
and that they are domain general latent factors of cognitive control. This is in line with
the previously presented models of cognitive control by Miyake and colleagues (2000;
see page 69-72.), showing that the executive functions, ‘updating’ and ‘shifting’ are
distinguishable constructs. Neuroimaging findings by Crone and colleagues (2006), also
support that task-rule representation (i.e. retrieving, maintaining and implementing
relevant rules) and task-set reconfiguration are separable, showing different activation
patterns in the lateral and medial prefrontal cortex respectively.
There are also alternative task-switching paradigms (see Grange & Houghton,
2014), such as (a) task-cuing paradigm where unpredictable cues dictate which task to
perform, (b) intermittent instructions paradigm where repeated performance on a single
task is occasionally changed by a cue to continue with another single task, and (c)
voluntary task-selection paradigm where participants decide themselves which task to
perform.
Task switching costs and their explanation
The task-switching paradigm has become an extensively used paradigm in the last
decade in order to understand executive control functions. The primary goal of most taskswitching studies was to elucidate the underlying causes of the switch costs. It has been
attempted to explain the phenomena of the switch costs from different angles with
multiple methods including computational, neuroscientific, and behavioral methods. In
the following, I will mainly discuss empirical evidence from behavioral studies.
15
Switch costs has been proved to be a robust phenomenon found across different
task-switching paradigms (alternating runs paradigm, task-cuing paradigm, intermittent
instructions paradigm, voluntary task selection paradigm). Here, I shall briefly introduce
two competing models that initially tried to explain the source of the observed taskswitching costs in task-switching paradigms. The first model was originally proposed by
Rogers and Monsell (1995), while the second by Allport (1994). According to the first
model, there are two components that contribute to the existence of switch costs. The first
is an endogenous component related with top-down reconfiguration of task-sets prior to
stimulus presentation. It has been observed that if the cue-stimulus interval in the taskcuing paradigm (Meiran, 1996) or the response-stimulus interval in alternating runs
paradigm (Rogers & Monsell, 1995) is increased, then this prolonged period to prepare
for the next trial results in reduced switch costs. However, even with very long
preparation time switch costs do not disappear entirely. These observations led to the
proposal that there is a further task-set reconfiguration process, dependent on the actual
presentation of the stimuli, termed as the exogenous component of task-set
reconfiguration. According to the second model proposed by Allport (1994), switch costs
are explained as a result of interference between the competing task sets (for a review of
findings, see Kiesel et al., 2010; p. 861-868.). This interference can arise either as a result
of persisting activation of currently irrelevant task-sets, or as a result of persisting
inhibition of the currently relevant task-set.
Age-related changes in task-switching abilities
While most of the studies on task-switching focused on younger adults, there have
been a number of studies investigating age differences in task-switching performance as
16
well (for a review, see Grange & Houghton, 2014, pp. 350–371). In this section, I will
provide an overview of the extant empirical findings on age differences in task-switching.
It is now well documented that cognitive aging is associated with a decline in
dual-task performance and also with an increase in mixing costs in the task-switching
paradigm, but there are no such age-related changes with regard to switch costs (Kray,
Eber, & Lindenberger, 2004; Wasylyshyn, Verhaeghen, & Sliwinski, 2011). In one study,
a large sample of 5271 participants from age 10 to 66 took part in an internet based taskswitching study (Reimers & Maylor, 2005). The results of this study indicated that while
mixing costs decreased from 10 to 18 years old, and then showed an almost linear
decline, switch costs remained relatively stable. Similarly, comparing younger and older
adults Kray and Lindenberger (2000) found a more pronounced difference in mixing
costs than in switch costs. They suggested that this means that advancing age negatively
influences the ability to maintain and coordinate multiple task sets in working-memory
but not shifting itself.
There has been some concern whether the theory of general slowing can account
for the age differences in both mixing costs and switch costs. In a meta-analysis
Wasylyshyn and colleagues (2011) concluded that with regard to the explanation of
mixing costs there is a genuine age difference not accounted for by general slowing,
whereas switch costs can be accounted for by it.
In summary, only processes related with the maintenance and coordination of
multiple task-sets seems impaired in the elderly, but not shifting itself. The magnitude of
these age differences, however, depends on a number of factors, such as cuing type, task
ambiguity, and preparation time. As the factors of cuing type and task ambiguity were
manipulated in the present study, empirical findings regarding these effects will be
presented next.
17
The effects of cuing in task-switching
As previously mentioned, in a task-switching study with younger and older adults,
Kramer and colleagues (Kramer, Hahn, & Gopher, 1999) demonstrated that older adults
achieved age equivalence with regard to switch costs after a small amount of practice.
However their study also showed that older adults were unable to improve their switch
performance through training under high memory-load conditions.
Furthermore, according to a meta-analytic study, cuing and task predictability do
not affect age differences with regard to task-switching costs such that there is a reliable
difference between younger and older adults with respect to mixing costs, and there is no
difference with regard to switch costs, independent of whether cues are provided or not or
whether task sequences are predictable or not (Wasylyshyn et al., 2011).
The effects of task ambiguity in task-switching
I have argued previously that there is little age-related change with respect to
‘shifting’ as evidenced by task-switching studies, whereas the ‘updating’ and ‘inhibition’
components (presumably related with mixing costs) seem to be impaired with progressive
aging. Mayr (2001) suggested that increased mixing costs might reflect a decreased
ability to maintain reliable representations of currently relevant task sets in the face of
ambiguous stimulus information. One might argue that this could stem from a decreased
ability to inhibit currently task-irrelevant information, which might then interfere with
currently task-relevant information. However, this explanation has been ruled out (Mayr,
2001; Experiment 1.), as the inhibition of recently activated task-sets is even larger in
older adults then younger adults. Importantly, in a further study Mayr (2001; Experiment
2) found that mixing costs are only different between younger and older adults if stimuli
are ambiguous (affording multiple task-sets) and response sets are overlapping (responses
are mapped onto the same response options, i.e. same buttons). Thus, Mayr suggested
18
that, as a result of less reliable task-set representations, older adults might need to rely
more extensively on set-updating processes, which results in larger mixing costs in older
adults. According to this, while younger adults update only on switch trials, older adults
update on both switch and non-switch trials. This is in line with theoretical models
suggesting a larger reliance on external information in older adults than in younger adults
to guide action, which is probably due to difficulties in selecting and maintaining
cognitive representations in older age (for a review, see Lindenberger & Mayr, 2013).
Inhibition
Inhibition is measured most frequently by the Stroop task (Stroop, 1935) which
has several versions (e.g. color, number) but what is common is that a prepotent response
has to be inhibited in favor of another response. We choose this type of inhibition task for
the reason that it has similar executive control demands as the task-switching training
applied in our study, namely, inhibition of currently irrelevant information and
maintenance of currently relevant information. In a typical Stroop task, participants are
presented with words (‘red’, ‘green’, ‘house’, ‘shoe’ etc.) in different colors. The task of
the participants is to name the color of the ink the words are printed with. In this way, we
get three different conditions: color words printed in the same color (congruent condition)
to which response is fastest; non-color words (neutral condition) which serves as a
baseline; color words printed in a different color (incongruent condition) to which
response is slowest. The reason for these latency effects is that there are activations on
different levels for color representations (color of stimulus; color concept associated with
word), and these can facilitate each other (congruent condition) or get into conflict
(incongruent condition) (for a review on the Stroop paradigm, see MacLeod, 1991).
19
Working-memory
With the term working-memory we refer to the process of continuously
maintaining a trace of information in a temporary active state, updating it when
necessary, and to use it according to specific goals (Baddeley, 2003). Working-memory
allows us to keep relevant information in an active, retrievable state when the information
is no longer directly accessible from the environment. It is important not only in shortterm buffering of information, that is no longer directly accessible, but also in shielding
that information from disruptions by irrelevant information.
Cognitive control is involved in the regulation of the contents stored in workingmemory (Smith & Jonides, 1999) for which updating, maintenance, inhibition and
shifting are essential ingredients. Maintenance also requires inhibition, which makes it
possible to suppress task-irrelevant information and automatic impulsive responses.
Inhibitory processes contribute to working-memory performance in the suppression of
task-irrelevant information.
There are different types of working-memory tests that can be divided according
to what type of information participants have to maintain throughout the task. This way
we can speak of visual working-memory tests and verbal working-memory tasks. Verbal
working-memory measures include operation span tasks, such as reading or counting
span, in which relevant information have to be maintained in an active state while
executing a secondary task. In the present study, we used operation span tasks. According
to a model by Miyake and colleagues (Miyake et al., 2000), operation span tasks
primarily require updating ability but not shifting or inhibition.
Updating can also be measured by n-back tasks in which participants are
presented with a train of stimuli and the task is to indicate if the stimulus is the same as
the one presented n previously. For example, in a 2-back task participants have to press a
20
response button if the present stimulus is the same as the one before the last stimulus.
Performing this task requires the continuous updating of information stored in workingmemory.
Intelligence
The terms intelligence, general cognitive ability, intelligence quotient (i.e. IQ) are
used interchangeably (cf. Deary, Penke, & Johnson, 2010). A broad definition of
intelligence can be given as the following (cf. Gottfredson, 1997, p. 13): “Intelligence is a
very general capability that, among other things, involves the ability to reason, plan,
solve problems, think abstractly, comprehend complex ideas, learn quickly and learn
from experience. It is not merely book learning, a narrow academic skill, or test‑taking
smarts. Rather, it reflects a broader and deeper capability for comprehending our
surroundings—‘catching on’, ‘making sense’ of things, or ‘figuring out’ what to do.
Intelligence, so defined, can be measured, and intelligence tests measure it well.”
It has been found that the performance on fluid intelligence tests predict well how
participants perform on other cognitive tasks. One of the models of intelligence by Cattell
and Horn (see Linn, 1989, pp. 29–73) distinguishes fluid intelligence (intelligence as
‘process’) and crystallized intelligence (intelligence as ‘product’). Fluid intelligence is
typically assessed by tests that require new knowledge creation. Crystallized intelligence
on the other hand is typically assessed by tests that require already stored knowledge
(about facts, etc.).
As mentioned in the introduction, our ability to organize complex actions is
intimately related to intelligent behavior and crucially dependent on executive functions.
We know that there is a high correlation between fluid intelligence and working-memory
but they are not identical (Conway, Kane, & Engle, 2003). It has been shown that a
21
child’s working-memory capacity at 5 years old is a better predictor of academic
achievement than IQ (Alloway & Alloway, 2010). However it is not clear what links
together working-memory and fluid intelligence. One study (Friedman et al., 2006),
examining the relationship between the three main executive control components –
inhibition, shifting, and updating – and fluid intelligence, has shown that updating is
highly correlated with intelligence but shifting and inhibition are not. Another study has
indicated that cognitive flexibility as indexed by the efficiency to update task-sets is
correlated with fluid intelligence as measured by the Raven test (Colzato, Wouwe,
Lavender, & Hommel, 2006). Others have linked the ability to suppress task-irrelevant
information in working-memory to fluid intelligence (Burgess, Gray, A, & Braver, 2011).
Although there is no agreement between different studies regarding the specific
contribution of different executive functions to fluid intelligence, they indicate that
executive functions are closely related with fluid intelligence.
Summary
Executive functions show decline during aging and this decline is associated with
impaired cognitive functioning. I have presented that executive functioning is not a
unitary construct, but can be separated into at least three different components (inhibition,
shifting, and updating). The task-switching paradigm allows the calculation of switch
costs and mixing costs, which are psychometrically distinguishable and presumably
related with the components of shifting and inhibition/updating respectively. Taskswitching studies suggest that age-related decline in executive functioning does not
primarily affect the ability of shifting. According to one theory, in the face of ambiguous
situations older adults might rely on excessive set-updating processes in order to solve
tasks more efficiently.
22
COGNITIVE PLASTICITY AND TRAINING INTERVENTIONS
Learning and Transfer
In this section, I will present theoretical concepts and empirical findings in
connection with learning or skill acquisition that will be important in understanding how
general and enduring training benefits might be achieved.
Skill learning can be defined as a change (i.e. improvement) in perceptual,
cognitive, or motor performance that is elicited by training and lasts for an extended time
period (weeks or months), thereby differing from mere adaptation or other short-term
effects (Green & Bavelier, 2008). Thus, in the context of cognitive training, we can
differentiate between an early stage of learning that takes place within minutes related to
the familiarization with the task, and a later stage of learning that requires training for a
longer period of time (Green & Bavelier, 2008). Here, we are interested in the latter type
of learning. More specifically, we are interested in training with generalizable transfer
effects.
Broadly speaking, by transfer we refer to situations in which training in one task
leads to performance improvement on another non-trained task (for a taxonomy of
transfer distance see Noack et al., 2009 p. 446-448.). Researchers often differentiate
between near transfer and far transfer. By near transfer we mean that the transfer is
restricted to structurally similar tasks which share similar stimuli characteristics, response
rules and requirements, etc. By far transfer we mean that the transfer is not restricted to
similar tasks but leads to performance improvement on structurally dissimilar tasks as
well (for a critical review on the concept of far transfer, see: Barnett & Ceci, 2002).
The first hurdle for cognitive interventions came from observations indicating that
despite the plasticity of perceptual and motor skills, effects of training are mostly task
specific. A lack of transfer effects would be problematic for cognitive interventions, as
23
the aim of these interventions should be to reach beyond the trained context and mitigate
age-related cognitive decline that hinders individuals in their daily lives.
Thus, the question arises whether anything can be trained beyond task-specific
processes which are related to a given paradigm. As suggested by Klingberg (2010), a
distinction can be made between explicit and implicit learning. Explicit learning is the
process when performance improvement (for example in working-memory tasks) is
initiated by learning new strategies for encoding and handling information by rehearsing
techniques, chunking or meta-cognitive strategies. An example for explicit learning is
when participants learn a strategy to chunk long series of digits into smaller meaningful
units, thereby extending effective recall length (e.g., although short-term storage of
information is restricted to 7 ± 2 items (Miller, 1956), by chunking participants has been
shown to be able to recall up to 79 digits (Ericcson, Chase, & Faloon, 1980)). Given that
explicit learning usually only work with trained material (i.e. it does not transfer to other
tasks; for example learning how to memorize digits does not help memorizing letters) the
question remains as to what extent can implicit learning be exploited to facilitate broad
general improvement.
It has been suggested that in order to show transfer effects from one task to
another the two tasks should share some common underlying processes. As a general
principle, it can be assumed that by training one task, certain processes and functions are
strengthened, which, if relevant to another task, will enhance performance on that other
task as well. As an example, there is evidence that updating training shows transfer only
if underlying brain structures and functioning is shared with the target test (Dahlin,
Neely, et al., 2008).
24
Principles to enhance training and transfer effects
What are the optimal conditions for training-related improvements (e.g. time,
frequency, motivation, intensity), and what are limiting factors (upper boundaries on
plastic changes, process specific limits, and so forth)? Factors that modify training
outcomes include task difficulty and motivation. According to Vygotsky's ‘zone of
proximal development’ model (Vygotsky, 1980), learning is most efficient when tasks to
be solved are close to the upper limits of the participants’ current abilities. The reason for
this is that in cases where task difficulty is too high or too low, it leads to a decrease in
motivation and thereby reduced learning. Hence many cognitive interventions apply
adaptive training procedures in which task difficulty is changing according to the
improving performance of the individual (i.e. if participants get better during training the
task becomes more demanding, if participants get worse during training the task becomes
less demanding).
How to quantify transfer?
There are some essential requirements that should be followed at the design of
training studies, therefore these criteria will be reviewed here briefly.
Usually, assessing the effectiveness of a training one has to measure baseline
performance on the tests of interest before the training and then after the training. As in
most cases we expect improvements on tests at posttest, we shall make sure that the
effects that we see are not merely retest effects (i.e. performance improves by repeated
encounter with the same test). One thing that we can do is to use modified tests at the
posttest, so that they are not exactly the same as at the pretest. The tests should ideally be
counterbalanced, so that half the participants use the original and half the modified
version at pretest, and at posttest the other way around.
25
Another important aspect for evaluating training related improvements is that we
should make sure that participants improved as a result of gaining skills specifically
related to the training and not some other trivial factors. For example, repeated visit to the
lab can make participants more comfortable, so that they might perform better because of
that circumstance in comparison to a no contact control group which does not visit the lab
in between pretest and posttest sessions. In order to avoid this problem one can use active
control groups. These groups also spend the same time in the lab, performing a test which
is similar to the training task, but which differs in some crucial aspect. For instance, we
used an active control group that practiced no switching between trials, but only singletask blocks. In this way the task-switching training groups and the active control group
conditions were almost similar, except for one crucial difference: the task-switching
training groups alternated between tasks while single-task groups did not.
In general, participants can be assigned to training groups based on their pretest
performance on the tests of interest, so that baseline differences do not make it
problematic to interpret changes at posttest. One scenario could be where one group has
already high performance at pretest while another group does not, and after training at the
posttest assessment the high performance groups do not show any further improvement
while the initially lower performing group reaches the level of the high performing. In
this case one might interpret wrongly that only one of the groups improved. Whereas, it
might be equally valid to interpret that there was no more room for improvement in the
initially high performing group which is commonly referred to as a ceiling effect. The
details of the matching procedure of the present study will be described in the method
section.
When evaluating training interventions, apart from statistical testing for
significance (i.e. between pre- and posttest measures), it is recommended to also report
26
effect sizes (Wilkinson, 1999). Effect sizes quantify the magnitude of the training effects,
that is, the pretest-posttest improvement. It also makes possible to compare studies with
different designs, samples and analyses (Wilkinson, 1999). It has been suggested that to
qualify for successful training effect size should be at least 0.30 (Klauer, 2001), or
alternatively the proportion of participants showing improvement after training should be
higher than 50 percent (Derwinger, Neely, Persson, Hill, & Bäckman, 2003). According
to Cohen (1988) effect sizes using Cohen’s d between 0.2 – 0.3 should count as “small”,
around 0.5 as “medium”, and above 0.8 as “large”. Also, ideally, long-term maintenance
of training benefits should be assessed. Thus, inspection of effect sizes, proportion of
participants showing transfer, long-term stability of improvements, and individual
differences in relative improvements should ideally be investigated for the evaluation of
cognitive interventions.
One further difficulty in evaluating cognitive interventions is, however, how to
quantify transfer scope. Noack and colleagues (Noack et al., 2009) suggests that mere
improvement on individual tests in itself might not reflect improvement on the level of
general cognitive abilities, instead, one should look for improvements on the latent
variable level by measuring multiple tests in a given domain. Thus, effect range should be
assessed by a wide range of cognitive tests. Showing transfer of training on the latent
variable level might provide stronger evidence for the effectiveness of a given cognitive
intervention.
COGNITIVE TRAINING IN OLDER AGE
Investigating the possibility of cognitive plasticity through cognitive interventions
in older age is a relatively new research area. There has been substantial progress in
cognitive aging research for several decades, but the focus shifted only recently (see
27
Kramer & Willis, 2002; Mayr, 2008) to what can be actually done in order to slow down
or even to reverse cognitive decline observed in the many cognitive abilities affected by
aging, which has been well documented through longitudinal and cross sectional studies.
Most early studies on cognitive training focused on memory training with explicit
strategies, such as the method of loci (Baltes & Kliegl, 1992; Verhaeghen et al., 1992),
and training on fluid intelligence (Baltes, Kliegl, & Dittmann-Kohli, 1988; Baltes et al.,
1989; Blieszner, Willis, & Baltes, 1981). The interventions using the method of loci, a
mnemonic technique to improve memory performance, in younger and older adults
generally indicated that younger as well as older adults were able to improve their
memory performance, although younger adults were better able to do so. In addition it
was also found that training gains were maintained for months or even years (Brehmer et
al., 2008).
There is also evidence for plasticity with regard to executive functions, even in
older age. A study for example by Dahlin and colleagues (Dahlin, Nyberg, et al., 2008)
investigated the plasticity of executive functions in younger and older adults. They
trained participants for 5 weeks in updating information in working-memory, and found
that compared to a control group, both younger and older adults improved their
performance on updating. Moreover, the training-induced improvements were maintained
for a period of 18 months after training. In younger adults, the training also led to
improvements on an untrained task that also required updating. However, even after five
weeks of training older adults remained below the level of performance reached by
younger adults after two weeks, and they did not show transfer to a 3-back task. This
suggests that there might be limits on how much older adults can gain through training
with regard to updating processes.
28
A recent study by Anguera and colleagues (Anguera et al., 2013) measured
multitasking with participants aged 20 to 79 years in a three dimensional video game and
showed a linear decline in performance with aging. However, training older adults (60 to
85 years) in an adaptive version of the video game for a period of one month showed
marked improvements (compared to an active and a no-contact control group) in
multitasking, reaching better performance than untrained 20-year-olds. Furthermore, this
improvement in multitasking was still observable after six months. The training also led
to improvements on untrained cognitive abilities, such as enhanced sustained attention
and enhanced working-memory. Furthermore, both the single-task-training and the
multitask-training led to similar improvements in single task components, but only the
multitask-training led to enhanced multitasking, sustained attention and working memory
performance. This indicates that the mechanism that drives the training effects is the
improved interference resolution resulting from overlapping cognitive control processes
during task execution in the multitask-setting.
These findings point to the preserved plasticity of executive functions, such as
updating and multitasking even in older age, although there might be limitations
regarding the possible level of performance that can be achieved by older adults (i.e. in
certain facets of executive functions older adults might not reach performance levels of
younger adults, as suggests the updating training by Dahlin (2008); not so for
multitasking (Anguera et al., 2013)). Also, there has been a number of recent reviews on
working-memory training (Melby-Lervag & Hulme, 2013; Morrison & Chein, 2011; e.g.
Shipstead, Redick, & Engle, 2012). These reviews indicated that although there have
been a number of studies showing reliable short-term improvements of working-memory,
the improvements were rather task-specific, and there is little evidence for generalization
of working-memory training to other skills (Melby-Lervaag & Hulme, 2013). Also, many
29
studies used only single tasks to assess whether there was change in executive functions
following training, whereby improvements can be explained as task-specific learning
(Shipstead et al., 2012). Finally, it has been suggested that working-memory training
regimens can be differentiated as strategy training (training specific strategies to improve
memory performance) and core training (training of core cognitive processes needed for
successful memory performance), and that a greater generalizability might be expected
from core working-memory trainings (Morrison & Chein, 2011). This is a similar idea to
what has been said above regarding explicit and implicit learning. The next section will
provide an overview about the training with task-switching in older age, the cognitive
intervention that is being applied in this study.
Training with task-switching
In this section, empirical findings regarding the plasticity of task-switching
abilities will be overviewed. As mentioned earlier, there are two performance costs that
can be differentiated in relation to task-switching: mixing and switch costs. Mixing costs
reflect the ability to maintain and coordinate multiple task sets in mind. Switch costs
reflect more directly the ability to switch task sets. By examining the results of extensive
practice on these two performance costs in task-switching, inferences regarding the
degree of plasticity in maintenance/coordination and shifting can be drawn. As
mentioned previously in the presentation of the task-switching paradigm, many studies
have shown that by training it is possible to reduce switch costs (e.g. Cepeda et al., 2001;
Rogers & Monsell, 1995) as well as mixing costs (e.g. Gajewski & Falkenstein, 2012;
Minear & Shah, 2008; Salminen, Strobach, & Schubert, 2012). With regard to age
differences in task-switching costs and training, in a task-switching study with younger
and older adults Kramer and colleagues (Kramer et al., 1999) demonstrated that after a
30
small amount of practice, older adults achieved equivalent switch costs to younger adults.
Another study by Kray and Lindenberger (2000) investigated switch and mixing costs in
participants aged 20 to 80 years. After participants underwent four sessions of training in
a set of task-switching tasks, pretest to posttest changes were examined in switch and
mixing costs across age groups. The results indicated significant practice effects, with
both switch and mixing costs being reduced through practice. Also, older adults showed
more reduction in mixing costs than younger adults. However, both switch and mixing
costs were still reliable at posttest, and older adults still showed larger mixing costs than
younger adults. These findings point to the plasticity of executive functioning as reflected
in the training-related reductions of both types of task-switching costs even in older age,
but they also suggest that even after extensive practice both switch and mixing costs are
still observable.
Are training gains generalizable?
Although, as we have seen, there is ample evidence for plastic capacity even in
older age, an important question concerning cognitive interventions is not merely whether
a specific task can be trained but whether generalizable skills can be obtained by
completing the intervention. The limitations of training studies became apparent in early
studies in that they usually did not show substantial transfer to other untrained tasks (for a
review on the training literature, see e.g., Green & Bavelier, 2008). There are plenty of
commercial products that claim to improve cognitive functioning. However, their
generalizability to other tasks above the tasks that are actually trained is still ambiguous.
One influential large scale online experiment testing 11,430 participants for six weeks
(for an average 26 hours) has shown that there were no differences in improvement
between two experimental groups (experimental group 1 practicing tasks emphasizing
31
reasoning, planning, and problem solving; experimental group 2 practicing tasks of shortterm memory, attention, visuospatial processing and mathematics) and an active control
group (answering general knowledge questions through the internet) on benchmark tests
(reasoning, verbal short-term memory, spatial working-memory and paired-associates
learning) that were assessed at pretest and posttest (Owen et al., 2010). Recent reviews of
cognitive intervention studies also suggest that effect sizes are usually small and that
training usually does not generalize to untrained tasks (Noack et al., 2009). Nevertheless,
one should keep in mind that much depends on the kind of training applied in training
studies. For example, there have been a number of studies showing the beneficial effects
playing video games on a variety of cognitive abilities (e.g., Boot et al., 2010; Castel,
Pratt, & Drummond, 2005; Green & Bavelier, 2008). It has been shown that playing
action video games can enhance visual selective attention in younger adults, improving
attentional capacity, the spatial distribution of attention, and also that it reduces
attentional bottlenecks in sequential processing (Green & Bavelier, 2003). Moreover,
some studies found that video games improve not only selective attention but executive
functions as well, such as shifting (e.g., Green, Sugarman, Medford, Klobusicky, &
Bavelier, 2012; Strobach, Frensch, & Schubert, 2012).
Furthermore, studies also found that reversing age-related decline in executive
functions through video game training might be possible even in older age (Basak, Boot,
Voss, & Kramer, 2008). In a study of Basak and colleagues (2008), older adults were
training in a real-time strategy video game to improve executive functions. Relative to a
control group, trainees improved in executive functions, such as shifting, workingmemory, and visual short-term memory. In another online game-training experiment, van
Muijden, Band, and Hommel (2012) also investigated whether cognitive control can be
trained in older adults. One group practiced with alternating between five different
32
videogames, which presumably taxed cognitive control, as participants were required to
select and integrate information, manipulate working-memory representations, and switch
between task sets (cf. van Muijden et al., 2012). This group practiced for seven weeks
while an active control group answered quiz questions for the same period of time.
Transfer effects included improvement of inhibition (stop-signal task) for the training
group and improvement of selective attention for the control group. However, as several
other tests (e.g., Stroop task, counting span, task-switching) did not show transfer effects,
this study indicated only limited plasticity of cognitive control in older adults.
An elusive goal of cognitive training studies is to achieve improvements in
general intelligence. After a long history of failure to achieve improvements in reasoning
through training (Sternberg, 2008), there has been some empirical support that after all it
might be possible (Jaeggi, Buschkuehl, Jonides, & Perrig, 2008; Klingberg et al., 2005;
Schmiedek et al., 2010). In a seminal study, Jaeggi and colleagues (2008) trained
participants on an adaptive dual n-back task, and showed for the first time that far transfer
to fluid intelligence might be possible. Moreover, they also showed that improvements on
fluid intelligence were dependent on training dosage. However, the results should be
viewed critically (see, Sternberg, 2008). One of the criticisms of the study was that to
measure fluid intelligence they used a shorter, speeded version of the BOMAT (a
commonly used test measuring fluid intelligence) (Moody, 2009). The problem was that
whereas this test contains 29 items and is supposed to be solved within 45 minutes,
participants were allowed only 10 minutes to solve the task in the study by Jaeggi and
colleagues (2008), and therefore, given that task sequence follows increasing difficulty,
only the easiest items could be tested. Thus, it is conceivable that dual n-back tasks do
not train executive functions per se, but attention (see for example: Oelhafen et al., 2013),
which might lead to better performance in speeded measures of fluid intelligence.
33
Since then, many studies tried to replicate the findings of improving fluid
intelligence by n-back training, some with success (e.g. Jaeggi et al., 2010; Jaeggi,
Buschkuehl, Jonides, & Shah, 2011; Jaeggi, Buschkuehl, Shah, & Jonides, 2014) some
without success (e.g., Colom et al., 2013; Heinzel et al., 2014; Oelhafen et al., 2013;
Redick et al., 2013; Salminen et al., 2012; Thompson et al., 2013). Although the
empirical findings with n-back training are still controversial, the results indicate that
generalizable skills might indeed be possible to achieve through cognitive training. In the
next section the transfer effects of task-switching training will be considered.
Transfer effects with task-switching training
There has been a number of studies investigating training and transfer effects in
task-switching and dual-task performance in both younger and older age, suggesting that
there are significant age-related deficits (Hahn et al., 2011; Verhaeghen et al., 2003), but
also that cognitive plasticity is preserved in older adults and that they can improve by
training (e.g., Bherer et al., 2005; Kramer et al., 1995; Lussier, Gagnon, & Bherer, 2012).
It has been presented above that we can differentiate between two types of task-switching
costs, switch and mixing costs. If task-switching costs are reduced during training as a
result of enhanced efficiency in the ability to coordinate and reconfigure competing task
sets, then transfer to other similar task-switching situations and to other tasks relying on
shared control processes should show improvements as well.
One of the first studies examining transfer effects with a task-switching paradigm
was a study done by Minear and Shah (2008). They investigated the extent to which taskswitching training transfers to non-trained switching tasks (i.e. near transfer). Participants
were trained in either an unpredictable cued paradigm or a predictable alternating runs
paradigm with run length two in a pretest-training-posttest design. Near transfer effects at
34
posttest were assessed on both a predictable and an unpredictable task-switching
paradigm. In a first experiment, transfer was only evident for mixing costs in the
unpredictable training groups. However, this transfer was constrained to a similar
unpredictable task-switching paradigm at posttest and not to a predictable task-switching
paradigm. There were no difference between the transfer effects of a control group and a
predictable switching group. Reaction times got significantly faster for the unpredictable
switching group after training for both switch and nonswitch trials compared to the
control group which resulted in differences in the mixing costs but not in the switch costs,
as both switch and nonswitch trials became faster. If we assume that predictable and
unpredictable switching requires the same control processes, then if shifting related
control processes in general were really improved in the unpredictable task-switching
group it should have actually been easier for them to perform a predictable switching
paradigm - which was not the case. In a second modified experiment (by inserting a 200
ms cue stimulus interval) the findings were replicated. Nevertheless, all groups improved
performance from pretest to posttest on the predictable task-switching. In a third
experiment (with varying cues), comparing control group to the unpredictable taskswitching group similar transfer effects were found for mixing costs in the unpredictable
paradigm. Most importantly, a further analysis showed that the source of transfer was the
improvement in the ability for recovery from an unexpected switch.
In summary, this study has shown that with an unpredictable task-switching
training the ability to recover from an unexpected switch can be improved, but this
improvement does not show up in a predictable task-switching paradigm because
unexpected switches are not present there. On the other hand, control groups and taskswitching groups (either predictable or unpredictable) did not show difference in transfer
to a predictable task-switching paradigm.
35
As for today, only a few studies investigated the trainability of cognitive control
processes from a lifespan perspective. Even less used the task-switching paradigm to
investigate whether training generalizes to other tasks. The most important of those
studies for the present study is a training study of Karbach and Kray (2009), therefore, it
will be presented next.
In comparison to the study by Minear and Shah (2008), in the study of Karbach
and Kray (2009) a different paradigm was used, and participants trained for a longer
duration. The main goal of the study was to investigate lifespan differences in near and
far transfer effects in three age groups (children 8-10, younger adults 18-26, older adults
62-76) and the modulation of the transfer effects by the employment of verbal selfinstructions (i.e. naming the upcoming task goal in the preparation interval, supposedly
facilitating task maintenance and selection) and also by the introduction of variability in
the training (i.e. training with different tasks and stimuli in each training sessions,
supposedly supporting transfer effects). They used a pretest-training-posttest design, with
three task-switching training groups and an active control group. The task-switching
paradigm used was an alternate runs paradigm, with a run-length of two (i.e. tasks
switched every second trial). At pretest there were two tasks (Task A and Task B), with
responses assigned to the same response button in both task sets. Stimuli comprised of 16
fruit and 16 vegetable pictures, either in small or large size. In Task A participants had to
decide whether the picture was fruit or vegetable; in Task B participants had to decide
whether the picture was small or large. There were four training sessions. The taskswitching training groups practiced mixed blocks, with new tasks (Task C: transportation
task, decide whether picture shows planes or cars; Task D: number task, decide whether
one or two planes/cars are presented). The task-switching training group with variable
training had in addition six other tasks (Tasks E-J). The active control group practiced the
36
single tasks, C or D, in separate blocks. Each session started with two practice blocks
followed by 24 experimental blocks (17 trials each), resulting in a total of 1768 trials
throughout the four sessions. At pretest and posttest a cognitive test battery assessed
participants task-switching ability (single task and mixed task performance), inhibitory
control (color stroop and number stroop), verbal working-memory (reading span and
counting span) spatial working-memory, and fluid intelligence (figural reasoning/letter
series, Raven’s Standard Progressive Matrices). The task-switching task at pretest and
posttest consisted of 2 practice blocks, followed by 20 experimental blocks (8 single and
12 mixed blocks).
The main findings of the study were the following: (a) near transfer was found for
both mixing and switch costs; (b) near transfer for mixing costs was most pronounced for
older adults and children; (c) verbal self-instructions alone not but (d) verbal selfinstructions with variable training modulated near transfer effects; (e) far transfer effects
were found in several areas, like interference control, spatial and verbal working-memory
as well as fluid intelligence; and (f) far transfer effects were not modulated by either age
or type of task-switching training.
Effect sizes were larger for near transfer than for far transfer. With regard to
mixing costs, effect sizes were larger in all age groups for task-switching groups (d’ =
0.98 – 2.15) than for single-task groups (d’ = 0.11 - 0.55). The results were similar
regarding switch costs: effect sizes were larger in all age groups for task-switching
groups (d’ = 0.88 – 1.14) than single-task groups (d’ = 0.22 - 0.60). For task-switching
groups, effect sizes were relatively large even for far transfer (younger adults d’ > .60,
older adults d’ > .40 in most cases).Compared to the task-switching training groups the
single-task groups showed only small effect sizes in far transfer, most values of d’ were
smaller than 0.30 for both younger and older adults.
37
Figure 2 Karbach & Kray (2009): Effect size d’ for near and far transfer as a function of
training (single-task, task-switching), transfer measure (MC = mixing costs; SC = switch
costs; IC = interference control; VWM = verbal working-memory; SWM = spatial
working-memory; FI = fluid intelligence), and age (younger adults, older adults).
Since then, far transfer effects of task-switching training to interference control
and working-memory have been replicated with ADHD children as well (Kray et al.,
2012). However, it should be noted that effect sizes have been on medium levels for
single-task groups as well. This has been attributed to improved ability of focusing
attention to the task in general.
Another study (Zinke, Einert, Pfennig, & Kliegel, 2012), investigating near and
far transfer effects of task-switching training in adolescents (aged 10-14 years) have
found near transfer effects for mixing costs but far transfer effects were restricted to
improvements in a choice reaction time task and faster reaction times on a 2-back task.
However, this study involved only three sessions of training which might have been not
sufficient to show broader effects of the training.
38
Given the broad transfer effects of the study by Karbach and Kray (2009), it
seems to be important to further investigate the paradigm, as if it indeed turns out to be
effective, it could guide the development of cognitive interventions to ameliorate agerelated cognitive decline. However, in order to better optimize task-switching training
programs, the question remains as to exactly what the transfer effects can be attributed to.
There are multiple factors that could have contributed to the observed transfer effects but
the most prominent among those might probably be inhibition demands, memory
demands, and shifting demands.
In the present study we will use similar dependent variables at pretest and posttest
as in the study done by Karbach and Kray (2009), but during the training we will use a
different task-switching paradigm in which we will manipulate the level of interference
and memory load. Furthermore, we will only focus on younger and older adults.
GENERAL SUMMARY
Cognitive control is necessary to set up, manage, and coordinate goal-directed
behavior. There are several components of cognitive control that can be separated as
indicated by psychometric studies (Miyake & Friedman, 2012; Miyake et al., 2000) and
neuroimaging studies (Collette et al., 2005; E. E. Smith & Jonides, 1999). A frequently
adopted taxonomy takes inhibition, shifting, and updating as key components of
cognitive control (Hofmann et al., 2012; Miyake & Friedman, 2012). Cognitive control is
assumed to be closely related to higher-level cognitive abilities, such as fluid intelligence,
which is also evidenced by similar developmental trajectories across the lifespan (Craik
& Bialystok, 2006).
One of the commonly used paradigms to measure executive functions is the taskswitching paradigm (Monsell, 2003). It requires participants to switch regularly between
39
two or more task sets related with simple categorization tasks. By registering
performance on single blocks, in which only one task is repeated continuously, and
mixed blocks, which involve task-switching and task repetition trials, two comparisons
are usually made to measure different aspects of executive functions. Switch costs
measure the shifting ability, which is assumed to require the inhibition of irrelevant task
sets and activation of relevant task sets. Mixing costs give a measure related to the
efficiency of keeping and coordinating multiple task sets in mind. Studies investigating
age differences in these two components of task-switching generally indicated that while
mixing costs are increased in older age, switch costs stay on the same level in older age
(if general slowing is taken into account), indicating intact abilities to switch between
task sets (Wasylyshyn et al., 2011).
One of the main questions of the present work is whether cognitive decline can be
remedied by cognitive intervention, and related with that, the question of how to do this
effectively. There is a growing body of empirical evidence suggesting that even in older
age there is hope for plastic changes to be brought forth by cognitive interventions.
However, mere reserved plasticity to improve through training is not sufficient in itself. If
training effects are strictly task specific then there is little point in training. This has been
a problem, as many studies indicated that the transfer scope of cognitive trainings might
be limited to tasks very similar in structure to the trained task (Green & Bavelier, 2008;
Owen et al., 2010).
In recent years, however, a number of training studies demonstrated generalizable
transfer effects with different training regimens. For example, intensive practice of
working-memory is suggested to improve fluid intelligence (Jaeggi et al., 2008). Another
example is multitask training, which demonstrated transfer to untrained cognitive control
40
abilities in older adults, improving sustained attention and working-memory (Anguera et
al., 2013).
The present work focuses on the beneficial effects of a task-switching training
paradigm and the mechanisms mediating transfer effects to untrained cognitive abilities
in younger and older adults. A study conducted by Karbach and Kray (2009) showed
evidence for far transfer effects of task-switching training. After four sessions of training
in task-switching, older and younger adults showed broad transfer to measures of
inhibition, working-memory and fluid intelligence (compared to an active control group).
However, it remained unclear as to what processes were actually trained during taskswitching.
41
Statement of problem and research predictions
In the previous parts age-related changes in cognitive control have been outlined,
as well as age-related differences in task-switching costs. Although, as we could see
above, considerable research is trying to elucidate the necessary conditions and kinds of
trainings for successful transfer, there are still many open questions. One approach to
facilitate the effectiveness and transfer of cognitive training has been based on the idea
that there is a possibility for plastic change in basic cognitive control processes, and
given that higher level cognitive abilities are based on these basic processes (such as
inhibition, shifting, and updating) the training of them should lead to broad transfer.
However, one problem is that we do not know the precise kind of training to bring forth
substantial and long lasting changes in basic cognitive control processes. The present
study examined the applicability of a task-switching approach to elicit such changes
following a previous task-switching training study.
In addition, by creating training conditions with different levels of demands in
inhibition and updating, the aim of the present study was also to disentangle what
processes are actually trained during task-switching. The knowledge gained through this
study regarding the transfer effects in different training conditions might have practical
relevance for designing optimal training programs for the elderly. The core question that
the study is intended to answer is the following: what components of cognitive control
trained by the task-switching paradigm are the most important in eliciting transfer
effects? And a further sub-question stemming from the main question can be stated as
follows: are there age-differences with that regard (i.e., are the same components of
cognitive control important in eliciting transfer effects in both younger and older adults)?
42
OVERVIEW OF STUDY DESIGN
The specific design of the present training study was based largely on a previous
task-switching training study by Karbach and Kray (2009). Most importantly we used the
same amount of training (i.e. same amount of practice trials). The differences between the
two studies were the specific tasks used, and related to that, the change in the nature of
the stimuli (pictures in the previous study; characters in the present study).
Solving task-switching tasks requires cognitive control that can be separated into
three main components, as mentioned in the theoretical introduction: ‘updating’,
‘inhibition’ and ‘shifting. To disentangle the relative involvement of these different
cognitive control components in task-switching we had to use a design in which we could
separately manipulate demands on these three components.
‘Updating’, demands were manipulated by the presence or absence of a task cue.
The reason for this is that without a task cue participants had to continually update which
task to perform during the task-switching paradigm. Therefore, in the absence of a cue,
demands on ‘updating’ were high, whereas if task cues were present throughout the task,
demands on ‘updating’ could be kept low.
With regard to ‘inhibition’, demands were manipulated by combining stimuli
which were either task specific or neutral. During task execution, if participants were
presented with a bivalent stimuli (i.e. containing two different task specific stimuli), then
response to the currently irrelevant stimuli had to be suppressed; therefore demands for
‘inhibition’ were high. Whereas, if participants were presented with a univalent stimuli
(i.e. containing a task specific stimuli and a neutral stimuli), then demands for ‘inhibition’
were low, as no competing responses had to be suppressed.
By the combination of these manipulations, four different task-switching training
groups were created in which participants had to switch between two tasks on every
43
second trial within each block. In addition, we had a single-task training group, which
practiced the same two tasks, but in isolation. Therefore, they did not have to switch tasks
within blocks. It was assumed that if the ‘updating’ and ‘inhibition’ manipulations would
not yield any difference in transfer effects between the task-switching training groups,
but at the same time all task-switching training groups would show transfer effects
relative to the single task training group, then the ‘shifting’ component is mostly
responsible for the observed transfer effects.
As it will be described in the method section, near transfer was measured at
pretest, posttest, and at the follow-up sessions with a task-switching paradigm different
from the ones used during training. Far transfer was also assessed in these three
occasions. Measures for far transfer consisted of a battery of cognitive tests assessing
verbal working memory (reading span, counting span), interference control (color stroop,
number stroop), updating (digit backwards; 2-back, 3-back), and reasoning (Raven
Standard Progressive Matrices, BOMAT). As mentioned previously, we used multiple
indicators for each construct to assess whether improvements are present on the latent
variable level. This decreases the likelihood that transfer effects are task specific. The
specific details of the training groups and the tasks at pretest and posttest are presented in
the method section.
44
RESEARCH PREDICTIONS
This part is divided into four parts. The specific research predictions are outlined
(1) with regard to the task-switching training sessions, (2) with regard to near transfer
effects to a similar untrained switching task, and (3) with regard to far transfer effects to
other executive control tasks, and (4) long-term maintenance of the task-switching
training. Each section begins with a brief summary of the relevant theoretical
considerations, followed by the predictions.
Task-Switching Training Sessions
The main interests of this study are the near and far transfer effects of the training.
Nevertheless, examining the training effects during the four training sessions will help us
to better understand the near and far transfer effects. This will be done by examining age
differences in the training benefits of the groups that practiced task-switching. The four
different task-switching conditions are: 1) with task cues (low updating) and univalent
stimuli (low inhibition); 2) with task cues and bivalent stimuli (high inhibition); 3)
without task cues (high updating) and univalent stimuli; and 4) without task cues and
bivalent stimuli.
Age differences in the reduction of switching costs
As previously presented, switch costs can be reduced through practice in both
younger and older adults, but there are no differences in the rate of reduction between
younger and older adults (Bherer et al., 2005; Karbach & Kray, 2009; Kramer et al.,
1999; Kray & Lindenberger, 2000). Therefore, we expect that: switch costs will be
reduced throughout the four training sessions (prediction 1); there will be no differences
in reduction between younger and older adults (prediction 2); switch costs will still be
found at the fourth training session (prediction 3).
45
The impact of inhibition demands
Performance costs in task-switching and especially switch costs are sensitive to
whether the stimuli are bivalent or univalent (affording multiple or single task sets
respectively). Switch costs are greater in bivalent conditions (e.g., Allport et al., 1994;
Jersild, 1927; Rogers & Monsell, 1995; Spector & Biederman, 1976). Therefore, we
expect that switch costs will be greater in bivalent groups (prediction 4).
Previous studies indicated that older adults have more difficulties than younger
adults when there is an ambiguity in the stimuli to respond to (i.e. when stimuli are
bivalent) (Mayr, 2001). Therefore, we expect that switch costs will be larger for older
adults than for younger adults in the task-switching groups with bivalent stimuli
(prediction 5).
The impact of updating demands
Previous studies indicated that older adults have more difficulties than younger
adults when there is a higher demand on updating internal representations of upcoming
task goals (i.e. when task cues are not provided) (Lindenberger & Mayr, 2013).
Furthermore, previous studies have indicated that older adults can use task cues to
prepare for an upcoming task in a similar way as younger adults, leading to a similar
amount of reduction of mixing and switch costs (Cepeda et al., 2001; Kramer et al., 1999;
Kray, 2006). Therefore, we expect that switch costs will be larger in older adults than in
younger adults in the uncued task-switching groups (prediction 6).
There is evidence suggesting that older adults have difficulties when task
uncertainty increases. In a study by Kray and colleagues (2002), using an externally cued
task-switching paradigm, age-related differences in mixing costs disappeared when task
cues were provided. Also, Kramer and colleagues (Kramer et al., 1999) demonstrated that
in an alternate runs task-switching paradigm if memory demands are increased then older
46
adults are less able to reduce switch costs through training. Therefore, we expect that
older adults will show less reduction through training in uncued task-switching groups
(prediction 7).
Near Transfer Effects
In general, we expect larger reduction in switch costs for task-switching groups
relative to the control group from pretest to posttest (prediction 8), as well as larger
reduction in mixing costs for task-switching groups relative to the control (prediction 9).
The impact of inhibition demands
We expect larger transfer (i.e. larger reduction in switch and mixing costs) from
the more demanding conditions to the less demanding conditions, therefore larger transfer
from high inhibition demand training to low inhibition demand conditions (prediction
10).
The impact of updating demands
Similar to our expectation regarding inhibition demands, we expect larger transfer
from the more demanding conditions to the less demanding conditions, therefore larger
transfer from high memory demand training to low memory demand conditions
(prediction 11).
Age differences in the reduction of switching costs
There is evidence that older adults show a greater impairment with regard to
mixing costs, whereas on the level of switch costs there is not much difference between
younger and older adults (Karbach & Kray, 2009; Kray & Lindenberger, 2000; Reimers
& Maylor, 2005; Wasylyshyn et al., 2011). Therefore, we expect: larger mixing costs in
older adults than in younger adults at pretest (prediction 12); and no difference in switch
47
costs between younger adults and older adults at pretest (prediction 13). We also expect
more substantial reduction in mixing costs for older adults from pretest to posttest than
for younger adults (prediction 14).
Far Transfer Effects
The main interest of this study is to investigate the mechanisms mediating transfer
effects of a task-switching training paradigm to untrained cognitive abilities in younger
and older adults. As mentioned above, evidence for far transfer effects of task-switching
training comes from a study conducted by Karbach and Kray (2009), which showed
broad transfer effects to measures of inhibition, working-memory and fluid intelligence.
However, this previous study did not give an answer regarding which processes were
actually trained during task-switching. We are interested in how manipulating demands
on inhibition and updating affects transfer effects, and whether there are age-related
differences in the transfer effects.
With respect to Interference Control we have the following predictions:
Prediction 15: larger reduction with respect to interference costs in those groups
that trained with bivalent task-switching condition as compared to those groups that
trained with univalent task-switching.
With respect to Verbal Working-memory we have the following predictions:
Prediction 16: larger improvements in verbal working-memory in those groups
that trained with uncued task-switching condition as compared to those groups that
trained with cued task-switching.
Prediction 17: larger improvements in verbal working-memory in those groups
that trained with bivalent task-switching condition as compared to those groups that
trained with univalent task-switching.
48
With respect to Updating we have the following predictions:
Prediction 18: larger improvements in those groups that trained with uncued taskswitching condition as compared to those groups that trained with cued task-switching; as
well as larger improvements in those groups that trained with bivalent task-switching
condition as compared to those groups that trained with univalent task-switching
(prediction 19).
With respect to Fluid Intelligence we have the following predictions:
Prediction 20: larger improvements in task switching groups than single-task
groups.
Predictions to long-term maintenance of task-switching training
There are previous results indicating long term maintenance of training in the
domain of working memory (Dahlin, Nyberg, et al., 2008). Similarly, we also expect that
training effects will be maintained after six months in task switching. Furthermore,
previous training studies with younger and older adults indicated a larger drop in
performance for older adults at follow up sessions (Brehmer et al., 2008; Li et al., 2008).
Similarly, we expect that relative to younger adults, older adults will show a larger drop
in performance from posttest to follow up.
49
Method
PARTICIPANTS
Overall 176 participants were recruited for the study. Thirteen participants had to
be excluded from the analysis either because they did not want to finish the study (n = 9),
because of health problems (n = 3) or because of mixing up training groups during
training sessions (n = 1). The final sample consisted of 81 young adults (mean age = 21.9
years; age range = 19-25 years) and 82 older adults (mean age = 70.8 years; age range
65-85 years). They were recruited from a subject pool at Saarland University, and were
paid 56 and 64 Euros, for younger and older adults respectively, to participate in the six
sessions of the study, plus 20 Euros for a follow up assessment. Table 1 provides some of
the descriptive statistics of the study sample.
Table 1 Descriptive Statistics of the Effective Sample for Age, Gender Distribution
N
Mean age
Age range
Female
Years of education
MATERIALS AND PROCEDURE
Younger Adults
81
21.9
19-25
40
15
Older Adults
82
70.8
65-85
43
14
Paper pencil tests as well as computerized tests were registered during the study.
The computerized tests were presented with E-Prime software package. Manual
responses were registered with a standard desktop keyboard.
The effectiveness of different types of task-switching training conditions was
assessed by a pretest-training-posttest-follow-up design. To examine near- and fartransfer as well as the maintenance of transfer effects, the pretest session included
baseline measurements of a single-task and different task-switching conditions as well as
50
a battery of comprehensive cognitive tasks. After the pretest session participants were
assigned to one of five training groups and worked through four training sessions. The
posttest and follow-up sessions were similar to the pretest session with parallel versions
of the tests used at pretest. Participants were expected to participate in the six sessions
with at least two intervening days between the sessions. Testing took approximately three
weeks per person. Mean duration between last training session and posttest was 5 days.
Follow up measurements took place 6 months after the pretest sessions.
MEASURES AT PRETEST, POSTTEST AND FOLLOW-UP
Table 2 gives an overview of the different psychometric tests and cognitive tasks
at pretest, posttest and follow-up. The cognitive battery included tests that were used in
previous dissertation study (Karbach, 2008), with slight modifications to some of the tests
which will be indicated below.
51
Table 2 Measured constructs, items, type of tests, estimated time needed for completion
of tests and sources.
Construct
Items
Type
Estimated
Source
Time (min)
3
Demographic
Questionnaire
paper
pencil
Self Efficacy
Questionnaire
paper
pencil
3
Perceptual
Speed
Digit Symbol
paper
pencil
1,5 – 3
Shifting
Task Switching
computer
20
Verbal
Workingmemory
Digit Backward
paper
pencil
3
(Wechsler, 1981)
Verbal
Workingmemory
Reading Span
computer
5-7
(Kane et al., 2004)
Verbal
Workingmemory
Counting Span
computer
6
(Kane et al., 2004)
Updating
AX-CPT
computer
5
Updating
2-back
computer
5
(Servan-Schreiber,
Cohen, & Steingard,
1996)
Updating
3-back
computer
5
Inhibition
Color Stroop
computer
8-11
Inhibition
Number Stroop
computer
3-5
Fluid
Intelligence
BOMAT
paper
pencil
15-18
Fluid
Intelligence
Raven
paper
pencil
10-13
(Wechsler, 1982)
(McElree, 2001)
(McElree, 2001)
(T A Salthouse & Meinz,
1995)
(T A Salthouse & Meinz,
1995)
(Hossiep & Hasella,
2010)
(Raven, 1988)
Similar to the previous Karbach study (2008) two to three different tests were
used to measure each ability at a latent level to reduce measurement errors.
52
Verbal working-memory was assessed by Digit Backward, Reading Span, and
Counting Span tests; fluid intelligence by the BOMAT and Raven’s Progressive Matrices
tests; updating by the 2-back, 3-back and AX-CPT tests; and inhibition by the Color
Stroop and Number Stroop tests. For near transfer a task-switching task was developed
which provided baseline measurements of four different kinds of task-switching
conditions. In addition, a Demographic Questionnaire, a Self-Efficacy Questionnaire, and
the Digit Symbol tests were also administered.
DEMOGRAPHIC QUESTIONNAIRE
The demographic questionnaire assessed basic information about the participants
such as gender, handedness, highest school achievement, years of education, physical and
mental health, hearing and vision. These measures were later analyzed to control for
differences between training groups.
SELF-EFFICACY QUESTIONNAIRE 1
The Self-Efficacy Questionnaire contained 20 statements (e.g.: “I believe that I
can solve brainteasers easily.” [“Ich bin der Meinung, dass ich Denksportaufgaben gut
lösen kann.”]) and participants had to indicate their agreement with a given sentence on a
7 point likert scale from -3 to 3.
COGNITIVE BATTERY
Digit Symbol
The same paper pencil version of the Digit Symbol Substitution Test was applied
as in the Karbach study (2008) adapted from Wechsler’s Adult Intelligence Scale (1982).
The test is supposed to indicate basic processing speed. On the upper part of the test sheet
1
this questionnaire was included in the study as part of a separate project, and is not analyzed in the present
dissertation
53
nine symbols were paired with nine digits. Below that 100 of the digits were presented
without the symbols. The task of the participants was to fill in as many of the empty cells
with the corresponding symbols in 90 seconds as they could. The test score was the sum
of correctly paired symbols.
Digit Backward
In the Digit Backward test the experimenter read aloud series of numbers and the
participants had to repeat the series in reverse order (cf. Wechsler, 1981). The task started
with two practice trials containing two items. The next three trials contained three items,
then four items, and so on. The test ended if the participant could not repeat correctly any
of the three trials with a given length or continued for up to 24 trials at maximum. The
test score was the number of the items in the longest correctly recalled trial, as well as the
number of totally correct items.
BOMAT
The BOMAT (Bochumen Matrizentest Standard) is a non-verbal paper-pencil
reasoning test (Hossiep & Hasella, 2010). On a page participants saw a matrix of 5 x 3
with figures of basic geometrical shapes in grayscale, and one of the figures was missing
(see Figure 3Error! Reference source not found.). Below the matrix there were six
figures, and the task was to find out which figure fits the matrix above. After three
practice examples participants had 15 minutes to work through 28 examples. For the
pretest and posttest parallel versions with different examples were available. For the
follow-up test examples were taken from the pretest (even numbered) and posttest (odd
numbered). The test score was the sum of correctly solved examples.
54
Figure 3 Example sheet from the BOMAT test
2-back
A shorter and modified version of the 2-back task was applied in the present study
compared to the one used in the Karbach study (2008) (adapted from McElree, 2001). In
this 2-back task participants saw in the middle of the screen a succession of numbers
(from 1 to 9) presented for 1000 ms with 0 ms in between the numbers. The task was to
monitor the numbers and press a button on the keyboard (P) if the given number was the
same as two before, or another button (Q) in every other case. The task started with a
practice block of 20 trials followed by the experimental block of 108 trials. Target
probability was 25 percent. For the older participants an extra practice block (20 trials)
with longer stimulus presentation time (2000 ms) was included as they had difficulties to
perform this test. Then they had the normal practice block (20 trials) that the younger
participants had. A further difference between the test of the younger and older adults
55
was that the older adults only had to press a button (P) if the given number was the same
as the number before the last. Due to visual problems font sizes were also enlarged for
older adults (72 points instead of the 24 points used for younger adults; Courier New).
The test score was hits minus false alarms.
Reading Span
The same Reading Span test with a slight modification was applied as in the
Karbach study (2008), which was a shortened form of the test used by Kane and
colleagues (2004) (with 8 trials instead of 12 trials). As in other operation span tasks
participants had to engage in a primary task, and in the meanwhile they had to perform a
secondary interfering task. In this reading span task, participants were presented with
displays showing grammatically correct sentences which were either sensible or
nonsense, followed by a question mark and a letter in uppercase (B, F, H, J, L, M, Q, R,
X) separated by space. In the secondary task participants were to decide whether the
given sentence made sense or not by saying aloud “yes” or “no” (e.g. Beim Einkaufen
muss man immer darauf achten, dass das Wasser nicht zu hoch steht. ? H). The
sentences consisted of 7 to 14 words, with a mean of 10.5 words. After a decision they
had to read aloud a letter (in the above example H) and memorize that letter, which was
the primary task. The set of letters were repeated across trials with approximately equal
proportion, but they were not repeated within a given trial. Then the experimenter pressed
a button and a new display was shown immediately. After that either a new display
followed where the task was the same or the participant was prompted to recall the
memorized items, which they had to write down on an answer sheet in the correct order
starting with the first item they had to memorize. Font sizes were 28 points, white color,
and Arial type on a blue background. Set sizes (i.e. the number of recalled items) of trials
56
were between two to five. Participants received three practice trials that were followed by
eight experimental trials ranging from two to five items. Each length of set size occurred
twice in a random order. The test score was the number of correctly recalled trials, and
the number of correctly recalled items.
Color Stroop
A computerized version of the Color Stroop task was applied (cf. Karbach, 2008).
Participants were presented words (red, blue, green, yellow, hat, book, tree, flea [actually
they were written in German: rot, blau, grün, gelb, Hut, Buch, Baum, Floh]) in different
colors (red, blue, green, yellow). The task of the participants was to indicate the color in
which the word was written with one of four buttons of the keyboard (S - red, K – blue, N
-green, C - yellow) that were marked with the respective colors. The stimuli were written
in 18 points, presented on a white background. The stimulus presentation time was until
response but maximum 2000 ms. The inter-stimulus interval was 700 ms. The task started
with two practice blocks, each containing 12 trials. That was followed by four
experimental blocks, each containing 24 trials. In each block three different types of trials
were intermixed: in congruent trials words “red”, “blue”, “green”, “yellow” are written
with the same color that the word refers; in incongruent trials the words “red”, “blue”,
“green”, “yellow” are written with different colors than to which the words refer; and in
neutral trials the words “hat”, “book”, “tree”, “flea” are presented with any of the four
colors. By subtracting from the mean reaction times of incongruent trials the mean
reaction times of neutral trials we obtain a measure indicating the interference effects.
AX-CPT
In a modified AX version of the Continuous Performance Test (i.e. AX-CPT,
adapted from Servan-Schreiber et al., 1996) participants first saw a cue (A, F, G, S) for
57
500 ms that was followed by a probe (X, C, M, U) for 500 ms. The probe was present
until response (but 1300 ms maximum). Cue probe interval was 2000 ms. The task was to
press a button on the keyboard (P) for an AX cue-target combination, or another button
(Q) in every other cue-target combinations (that could either be an AY [that is A
followed by a C, M or U], a BX [that is an F, G or S followed by an X] or a BY [that is a
F, G or S followed by a C, M or U]). If participants did not answer within 1300 ms after
the presentation of the probe, they were shown a display urging them to answer faster.
The probability of AX trials were 70 percent, all other combinations (AY, BY, BX) were
10 percent. The task started with two practice blocks of 12 trials followed by two
experimental blocks of 50 trials. Fonts were 48 points Calibri type. Dependent variables
were latencies and error rates.
3-back
Only the younger adults performed the 3-back task (adapted from McElree, 2001)
as it proved to be too hard to perform for the older adults. The 3-back task was similar to
the 2-back task. As in the 2-back task participants saw a series of numbers (from 1 to 9)
successively. The presentation time for each number was 1000 ms. The task was to
monitor the numbers and press a button on the keyboard (P) if the given number was the
same as the number two before the last, or another button (Q) in every other case. The
task started with a practice block of 20 trials followed by an experimental block of 108
trials. Target probability was 25 percent. Font sizes were 24 points Courier New. The test
score was again the percentage of the correctly answered target trials.
Counting Span
This task was adapted from Kane (2004; see also, Karbach, 2008). Participants
were presented displays showing shapes of 3 to 9 dark blue circles, 1 to 5 green circles
58
and 1, 3, 5, 7 or 9 dark blue squares on a grey background. Across displays the number of
these three shapes was approximately balanced. The secondary task of the participants
was to count loudly the number of dark blue circles (i.e. in the case of 3 dark blue circles
for example saying aloud “one”, “two”, “three” - “three”, repeating the final number) and
then to memorize that number, which was the primary task. Then the experimenter
pressed a button and a new display was shown immediately, and the participants had to
count again the number of dark blue circles and memorize that number as well. After a
prompt they had to write down the correct numbers in order of presentation. Set sizes (i.e.
the number of recalled items) of trials were between two to five. After three practice trials
participants performed eight experimental trials followed (with set sizes 2*2, 2*3, 2*4
and 2*5, in a mixed order). Test score was the number of correctly recalled trials, and the
number of correctly recalled items.
Number Stroop
The Number Stroop task was adapted from Salthouse and Meinz (1995). In this
task participants were presented with the following characters (1, 2, 3, 4, X, M, A, H) and
in a trial any of these characters could be presented 1, 2, 3 or 4 times next to each other.
The task of the participants was to indicate how many characters were displayed on the
screen (with the keyboard buttons S - 1, K - 2, C - 3, N - 4). Other details (stimulus size,
presentation time, number of trials and blocks) were similar to that of the Color Stroop
task. Similarly to the Color Stroop task, in each block three different types of trials were
intermixed: in congruent trials the characters “1”, “2”, “3”, “4” were displayed the same
number of times that the character indicated; in incongruent trials the characters “1”, “2”,
“3”, “4” were displayed with a different number of times than to which the character
referred to; and in neutral trials the characters “X”, “M”, “A”, “H” were presented 1, 2, 3
59
or 4 times next to each other. Dependent variable was again the interference effect, which
was obtained by subtracting from the mean reaction times of incongruent trials the mean
reaction times of neutral trials
Raven’s Standard Progressive Matrices (Raven)
The Raven’s Standard Progressive Matrices (Raven, 1988) is a non-verbal
reasoning task. It has black and white figures which are combinations of basic
geometrical shapes in matrixes of 3 x 3 with one of the figures missing (see Figure 4).
The task of the participants was to find out which figure would fit best from a given array
of eight figures which were displayed below the matrix. The test started with three
examples, after which participants had to solve as many items as they could in 10
minutes. Parallel versions for pretest and posttest were made by separating the complete
test containing 36 items into two sets, by having the odd numbered items (item 1, item 3
etc.) at pretest and the even numbered items (item 2, item 4 etc.) at posttest. For the
follow-up, items from the pretest as well as the posttest version were selected, choosing
every second item from them starting with the first (i.e.: item 1 from pretest, item 2 from
posttest, item 5 from pretest, item 6 from posttest etc.). All in all at the pretest, at the
posttest as well as at the follow-up there were 18 items in order of increasing difficulty.
The test score was the sum of correctly solved items.
60
Figure 4 Example sheet from the Raven test
Measurement of Task Switching
For the purposes of the present study new task-switching programs had been
developed. They were written in E-prime programming environment, and were run on lab
computers with E-prime software. For studying near transfer effects different switching
tasks were designed for the pretest-posttest sessions and the training sessions.
Below the specific details of the tasks at pretest and posttest and the training
groups will be presented.
Pretest and Posttest
At pretest, baseline performance on five types of switch conditions were assessed.
Stimuli consisted of a pair of characters presented next to each other in the middle of the
61
screen, similar to a design be Rogers and Monsell (Rogers & Monsell, 1995) (see Figure
5).
Figure 5 Schematic depiction of the task-switching paradigm used in the study
In the “digit” task (Task A) one of the characters was a number, which could be
either smaller (1, 2, 3, 4) or larger (6, 7, 8, 9) than five. Task A required participants to
decide whether a number is smaller or bigger than 5. In the “letter” task (Task B) one of
the characters was a letter, which could be written either in lowercase (f, t, d, j) or in
uppercase (F, T, D, J). In Task B participants had to decide whether a letter was
uppercase or lowercase.
The relevant characters appeared randomly (balanced) at either side. In the singletask blocks the other element of the stimuli pair was always selected from the currently
irrelevant set. A small diagram situated between the keyboard and the computer monitor
62
indicated the response assignments of the two tasks. The combination of the above
characters resulted in 128 stimuli combination in both Task A and Task B. The same two
response keys (Q and P) were used for both tasks as well as in all other switching tasks.
In single-task blocks participants had to perform either Task A or Task B
separately. In mixed-task blocks participants had to switch tasks on every second trial.
There were four types of mixed-task blocks (see Figure 6):
•
With cues / univalent stimuli. In this condition requirements for updating were
kept low as a cue (“digit”, “letter” [“BUCH”, “ZAHL”]) always indicated which
task to perform. Inhibition was also low as task-relevant stimuli were always
paired with a task-irrelevant stimuli, selected from a neutral set [*,?,#,%].
•
Without cues / univalent stimuli. It was similar to the first type except that the cue
(“+”) did not indicate which task to perform, so that participants had to maintain
the relevant task-set.
•
With cues / bivalent stimuli. It was similar to the first type except that task relevant
stimuli were always paired with interfering stimuli selected from the other taskset (example stimuli pair: 1F).
•
Without cues / bivalent stimuli. It was similar to the third type, except that the cue
(“+”) did not indicate which task to perform, so that participants had to maintain
the relevant task-set.
63
Figure 6 Illustration of the four task-switching conditions
Pretest and Posttest procedure
At pretest and posttest the single-task blocks were presented first, starting with a
short practice block (9 trials) of either Task A or Task B (counterbalanced), followed by
3 experimental blocks (17 trials / block). This was followed by the second single-task
practice block (9 trials) (Task B or Task A), 3 experimental blocks (17 trials), and then
the mixed-task blocks, 3 block / type, 17 trials / block, in the following order: with cues /
univalent stimuli, with cues / bivalent stimuli , without cues / univalent stimuli, and
without cues / bivalent stimuli.
During data analysis the practice blocks as well as the first trial of each block was
dropped, resulting in 48 trials for each condition. Response types (left/right), stimulus
types (smaller/lowercase – smaller/uppercase – larger/lowercase – larger/uppercase) as
well as task types (digit/letter) were counterbalanced in each condition and block, and the
sequence of stimuli was randomized for each block.
Before the participants started with the computer test the experimenter explained
the tasks both visually with the help of a diagram and verbally. Instructions were also
provided in the program before each type of task explaining the given task as well as a
64
diagram (see Figure 7) with the response assignments before the ninth and fifteenth
blocks.
Figure 7 Schematic depiction of the task-switching paradigm showing response
assignments presented in the program.
Trials started with a cue for 1000 ms, which was followed by the target until the
subject responded and then 25 ms blank screen until the next cue (see Figure 8). Subjects
were instructed to respond as fast and as accurate as possible. Feedback about their
performance (error rate, RT) was given at the end of each block. To finish the task took
approximately 20-30 minutes.
65
Figure 8 Schematic depiction of the trial procedure in the task-switching tasks.
Training
For the four training sessions participants were assigned to one of the following
five training groups based on their pretest performance (Digit Symbol, Raven, single task
mean RT, mixing costs, Color Stroop, Number Stroop, 2-back, 3-back, AX-CPT). The
method for matching the participants based on these tests will be presented later.
Single-task group:
In the Single-task group participants trained with alternating single-task blocks
including Task C and Task D. In Task C (’letter’ task) participants had to decide whether
a letter was consonant (G, K, M, R) or vowel (A, E, U, I). In Task D (’digit’ task)
participants had to decide whether a number was odd (1, 3, 5, 7) or even (2, 4, 6, 8). The
presentation of the stimuli was similar to the pretest and posttest single-task blocks,
which resulted in 64 stimuli combination in Task A and 64 in Task B. With regard to
response assignments participants had to press (Q) for odd (‘digit’ task) and vowel
(‘letter’ task) and (P) for even (‘digit’ task) and consonant (‘letter’ task). This stimulus
response assignment was constant across the five groups. Before each of the sessions the
experimenter reiterated the task rules. A small diagram situated between the keyboard
66
and the computer monitor also indicated the response assignments of the two tasks for all
five groups.
Task-switching groups
These mixed-task conditions were similar to their corresponding pairs at pretest
and posttest, except that instead of Task A and B they practiced Task C and D. These
have been described above at the Single-task group. In all conditions there were 128
stimuli combinations. As for the Single-task group the experimenter reiterated the task
rules before each of the sessions. A small diagram situated between the keyboard and the
computer monitor also indicated the response assignments of the two tasks, as well as the
program also showed a diagram before participants started with the first block.
Training sessions for all groups consisted of 24 experimental blocks (17 trials per
block) and took approximately 20-30 minutes to finish. In this way all participants had
performed 1632 trials after the four sessions. After each block participants were
presented with a feedback display showing the average reaction times and error rates of
the previous block. Participants of the Single-task group with odd ID numbers started
their first and third sessions with 12 blocks of digit tasks followed by 12 blocks of letter
tasks. Their second and fourth sessions started with 12 blocks of letter tasks followed by
12 blocks of digit tasks. Participants with even ID numbers had the other way around.
Participants of the four mixed task groups had only mixed blocks (alternating between
Tack C and Task D as described above). Each block started with two digit tasks followed
by two letter tasks, etc., with the last trial being a digit task. Testing took place in two
labs with the same equipment. Each lab had three workstations so that during the training
sessions (but not during pretest, posttest or follow up sessions) participants could be
instructed and tested in parallel for up to three persons per lab.
67
FOLLOW-UP SESSION
As mentioned earlier all participants were contacted after approximately six
months after their first session date and were offered 20 Euros to participate in a follow
up assessment. The procedure for the follow up was identical to that of the posttest with
parallel versions of the tests as indicated above.
PROCEDURE
At the beginning of the experiment all participants gave their informed consent.
After a Demographic Questionnaire, at pretest, posttest, and follow-up, and a SelfEfficacy Questionnaire and the cognitive battery were assessed. An overview of the study
design is provided in Table 3.
Table 3 Study design showing the tests assessed during specific phases of the study as
well as different task conditions of the task-switching test and the five different training
groups
Pretest
Session 1
Task switching:
Single task
Low inhibition Low
updating
Low inhibition High
updating
High inhibition Low
updating
High inhibition High
updating
Workingmemory
(reading span,
counting span)
Interference
(color stroop,
number stroop)
Updating
(2-back, 3-back,
AX-CPT)
Reasoning
(Raven, BOMAT)
Training
Sessions 2-5
Active control group
(single task training)
Low inhibition Low
updating group
Low inhibition High
updating group
High inhibition Low
updating group
High inhibition High
updating group
68
Posttest
Session 6
Task switching:
Single task
Low inhibition Low
updating
Low inhibition High
updating
High inhibition Low
updating
High inhibition High
updating
Workingmemory
(reading span,
counting span)
Interference
(color stroop,
number stroop)
Updating
(2-back, 3-back,
AX-CPT)
Reasoning
(Raven, BOMAT)
Follow Up
Session 7
Task switching:
Single task
Low inhibition Low
updating
Low inhibition High
updating
High inhibition Low
updating
High inhibition High
updating
Workingmemory
(reading span,
counting span)
Interference
(color stroop,
number stroop)
Updating
(2-back, 3-back,
AX-CPT)
Reasoning
(Raven, BOMAT)
MATCHING THE PARTICIPANTS
To make comparisons unbiased baseline differences between the five training
groups on the critical measures had to be considered. Therefore after pretest we
calculated the following scores for each participant. From the task-switching part we
calculated Speed of Task Execution (single-task median RT) and Mixing Cost (median
RT). For Interference Score we calculated interference costs by subtracting congruent
trials (median RT) from incongruent trials (median RT) separately for the Color and
Number Stroop, then averaged them. For Updating Score we calculated PR scores (hits false alarms) separately for 2-back, 3-back and AX-CPT, than averaged them. For
Working-memory Score we calculated correct answers on Reading Span, Counting Span
and the span of the Digit Backwards task, than we averaged them. For Fluid Intelligence
Score we used the Raven task scores. At last we also used the score on Digit Symbol for
the matching.
The basic idea behind the matching was the following. For each age group, the
first five participants were assigned randomly to the five different training groups. Then
we calculated standard deviations separately for the critical test scores (Speed of Task
Execution, Mixing Cost, Interference Score, Updating Score, Working-memory Score,
Fluid Intelligence Score, Digit Symbol Score) of these five participants. By adding the
standard deviations of these seven scores together we got an indicator of how far these
five groups are from each other. Then from the sixth participant we did the following. As
we wanted to get minimal difference between the groups we had to assign the participant
in a group so that this indicator (defined as the sum of the SDs of the seven measures)
changes always to a lowest value. Therefore we tested how the indicator would change in
the five possible cases, and then we assigned the participant to the group in which, as a
69
result of changing the average scores of the seven critical measures in the respective
group, the indicator assumed the lowest value.
DATA ANALYSIS
Task switching and Stroop tasks
During data analysis practice blocks were discarded as well as the first trials of
each block. Mean reaction times for correct responses were calculated for specific trial
(switch, non-switch; congruent, incongruent, neutral) and block (single, mixed) types.
For the analysis of training and transfer effects general and specific switch costs were
defined by two orthogonal contrasts. In the first contrast performance of single task trials
were compared with switch and non-switch trials in mixed blocks (i.e.: -2 1 1, general
switch cost). In the second contrast performance within mixed blocks were compared
between switch and non-switch trials (i.e.: 0 -1 1, specific switch cost).
Similar to other studies we also used log transformed reaction times during data
analyses (e.g. Karbach, 2008; Kray & Lindenberger, 2000). The reason for using log
transformed reaction times is the following. If we assume that there is a constant value
with which older adults are slower than younger adults (for instance, if they are 2 times
slower), than difference-scores in log transformed scores between younger and older
adults will be the same. For example, if younger adults perform stay trials in 300 ms and
switch trials in 350 ms, and assuming older adults are twice as slow, and they perform
stay trials in 600 ms and switch trials in 700 ms, then after log transformation the
difference of log(350)-log(300)=log(700)-log(600). Thus log transformation takes
general slowing into account. Additional age-differences in task-switching costs should
reflect genuine age-related differences in cognitive processing.
70
Matching
Before analyzing the training and transfer data, it was controlled whether there
were baseline differences between the five training groups in the two age groups with
regard to the dependent variables of interest (single trials, stay trials, switch trials, mixing
costs, switch costs) (Table 4 and Table 5).
Table 4 Mean (M) reaction times and standard deviations (SD) for each trial type (single,
stay, switch) as well as mixing and switch costs separately for each training group at
pretest.
Group 1
Group 2
Training Group
Group 3
single (n=16)
cued/univalent
n=(16)
cued/bivalent
n=(16)
Trial Type
M (SD)
M (SD)
Single
Stay
Switch
Mixing cost
Switch cost
511 (49)
597 (100)
676 (139)
86 (76)
79 (53)
519 (47)
599 (106)
676 (150)
79 (77)
77 (63)
Single
Stay
Switch
Mixing cost
Switch cost
680 (68)
913 (155)
1010 (199)
234 (110)
96 (106)
721 (138)
940 (231)
1047 (292)
219 (134)
106 (108)
M (SD)
Younger
521 (71)
590 (115)
677 (135)
69 (69)
87 (53)
Older
659 (102)
883 (179)
978 (203)
224 (128)
95 (59)
Group 4
Group 5
uncued/univalent
n=(17)
uncued/bivalent
n=(16)
M (SD)
M (SD)
513 (78)
602 (182)
695 (231)
89 (116)
93 (61)
525 (58)
599 (99)
696 (134)
73 (69)
97 (57)
701 (79)
925 (176)
1033 (204)
224 (143)
108 (65)
689 (64)
907 (141)
1007 (151)
218 (121)
100 (84)
Reaction Time Analysis
To assess baseline differences in mean reaction times a three-way ANOVA was
conducted with the within-subjects factor Trial Type (single, stay, switch) and betweensubjects factors Age Group (younger adults, older adults) and Training Group (Group 15). Results showed a main effect of Age Group for single trials, F (1, 153) = 188.65, p <
.001, stay trials, F (1, 153) = 169.36, p < .001, as well as for switch trials, F (1, 153) =
121.60, p < .001. There were no significant main effects of Training Group in any of the
71
trial types, (all ps > .60), and neither were interactions between Age Group and Training
Group, (all ps > .56).
To assess baseline differences in mixing costs and switch costs a three-way
ANOVA was conducted with the within-subjects factor Trial Type (single, stay, switch)
and between-subjects factors Age Group (younger adults, older adults) and Training
Group (Group 1-5). We set up two orthogonal contrasts for the factor Trial Type to
determine mixing and switch costs. The first contrast tested single trials against stay and
switch trials (mixing cost) the second contrast tested stay trials against switch trials
(switch cost). Results showed a main effect of Age Group for mixing costs, F (1, 153) =
72.53, p < .001, but not for switch costs (p = .22). There were no significant main effects
of Training Group in either mixing or switch costs, (all ps > .95), nor significant
interactions between Age Group and Training Group, (all ps > .96).
72
Error Rates
Table 5 Mean (M) percentage correct trials and standard deviations (SD) for each trial
type (single, stay, switch) separately for each training group at pretest.
Trial Type
Single
Stay
Switch
Single
Stay
Switch
Group 1
Group 2
Training Group
Group 3
Group 4
Group 5
single (n=33)
cued/univalent
n=(33)
cued/bivalent
n=(32)
uncued/univalent
n=(33)
uncued/bivalent
n=(32)
M (SD)
M (SD)
M (SD)
Younger
96.68
(2.50)
96.09
(2.42)
92.45
(5.56)
Older
97.20
(1.81)
96.09
(4.57)
93.62
(4.87)
95.83
(3.42)
95.96
(3.11)
93.95
(5.48)
95.18
(2.77)
95.12
(3.18)
94.14
(3.57)
98.35
(1.43)
96.69
(2.66)
95.10
(3.66)
96.94
(2.19)
95.71
(3.31)
93.50
(4.98)
M (SD)
M (SD)
94.91
(3.86)
95.59
(2.57)
91.12
(3.26)
96.74
(2.84)
96.61
(2.68)
94.47
(3.70)
98.18
(1.55)
96.16
(2.51)
94.34
(3.76)
97.79
(1.61)
96.35
(3.36)
93.95
(4.81)
To assess baseline differences in error rates a three-way ANOVA was conducted
with the within-subjects factor Trial Type (single, stay, switch) and between-subjects
factors Age Group (younger adults, older adults) and Training Group (single, LMLI,
LMHI, HMLI, HMHI). Results showed a main effect of Age Group for single trials, F (1,
153) = 21.07, p < .001, but not for stay trials (p = .50) or switch trials (p = .21). There
were no significant main effects of Training Group for any trial types (all ps > .32),
neither any interactions between Age Group and Training Group, (all ps > .19).
73
Results
AGE-RELATED DIFFERENCES IN TASK-SWITCHING TRAINING AS A FUNCTION OF
INHIBITION AND UPDATING DEMANDS
To examine practice-induced training gains the training data were analyzed
separately for the single-task group and the four task-switching groups. The single-task
group data were submitted to a two-way ANOVA including the within-subjects factor
Session (1, 2, 3, 4) and between-subjects factor Age group (younger adults, older adults).
With regard to the task-switching groups data were submitted to a four-way ANOVA
including the within-subjects factors Session (1, 2, 3, 4) and Trial type (stay, switch) and
the between-subjects factors Age group (younger adults, older adults) and Group (Group
2, Group 3, Group 4, Group 5). Mean reaction times and percentage of correct trials for
all training groups and sessions can be found below (Figure 9 - Figure 11).
RTs and ERs Group 1
700
100
Correct Trials (%)
RT (ms)
650
600
550
500
95
90
85
Younger adults
Older adults
80
450
1
2
3
1
4
2
3
4
Training Session
Training Session
Figure 9. Mean RT (ms) and percentage of correct trials (%) as a function of Training
Session (1, 2, 3, 4) and Age Group (younger adults, older adults) for Group 1 (single task
– bivalent stimuli). Error bars indicate the standard error of the mean.
74
Latencies. Analysis of the data from Group 1 (single task – bivalent stimuli)
revealed a main effect of Age group, F(1, 31) = 55.07, p < .001, ŋ2 = .64, indicating that
older adults were generally slower than younger adults. Furthermore there was a
significant main effect of Session, F(1.85, 57.42) = 28.98, p < .001, ŋ2 = .48, indicating a
reduction in latencies from the first training session to the last training session. There was
no interaction between Session and Age Group (p = .79)
Error rates. Analysis of error rates revealed a main of Age group, F(1, 31) =
19.77, p < .001, ŋ2 = .39, indicating that older adults were more accurate than younger
adults.
RTs and ERs Groups 2-5
With regard to the reaction time and accuracy analysis for task-switching groups
(Groups 2-5) the overall ANOVA results can be found below (Table 6). Means and error
rates for all training groups and trial types can be found in the Appendices (Table 15 and
Table 16).
75
Table 6 Overall ANOVA results for task-switching groups (Groups 2-5) based on logtransformed reaction times (Log-RT) and error rates. (ER)
Effect
Age group
Group
Age group * Group
Session
Session * Age group 2
Session * Group
Session * Age group * Group
Trial type
Trial type * Age group 3
Trial type * Group
Trial type * Age group * Group
Session * Trial type
Session * Trial type * Age group 4
Session * Trial type * Group
Session * Trial type * Age group
* Group
df
1, 122
3, 122
3, 122
2.07, 252.74
2.07, 252.74
6.22, 252.74
6.22, 252.74
1, 122
1, 122
3, 122
3, 122
2.38, 290.34
2.38, 290.34
7.14, 290.34
7.14, 290.34
Log-RT
F
p
128.21
15.82
1.12
484.97
2.32
1.32
1.95
418.02
.02
6.49
.93
120.06
5.65
1.09
.90
<.001
<.001
.35
<.001
.10
.25
.07
<.001
.88
<.001
.43
<.001
< .05
.37
.51
ŋ2
.51
.28
.03
.80
.02
.03
.05
.77
<.01
.14
.02
.50
.04
.03
.02
df
1, 122
3, 122
3, 122
1.63, 198.88
1.63, 198.88
4.89, 198.88
4.89, 198.88
1, 122
1, 122
3, 122
3, 122
2.80, 341.67
2.80, 341.67
8.41, 341.67
8.41, 341.67
ER
F
30.86
.52
2.05
26.89
6.53
2.08
1.12
164.28
2.20
.25
.21
29.97
8.90
1.50
.78
p
ŋ2
<.001
.67
.11
<.001
<.05
.07
.35
<.001
.14
.86
.89
<.001
<.001
.15
.63
.20
.01
.05
.18
.05
.05
.03
.57
.02
.01
.01
.20
.07
.04
.02
Latencies. With regard to latencies all main effects reached significance, as well
as two of the two-way interactions (Trial Type * Group; Session * Trial Type) and one of
the three-way interactions (Session * Trial Type * Age Group).
Error rates. With regard to error rates, with the exception of Group, all main
effects reached significance, as well as two of the two-way interactions (Session * Age
Group; Session * Trial Type) and one of the three-way interactions (Session * Trial Type
* Age Group).
2
Based on mean reaction times there was an interaction between Session and Age group, F(1.86, 227.17) =
18.37, p < .001, ŋ2 = .13
3 Based on mean reaction times there was an interaction between Trial type and Age group, F(1, 122) =
9.51, p < .05, ŋ2 = .07
4 Based on mean reaction times this interaction was not significant (p = .60).
76
1600
Group 2
cued switching
univalent stimuli (n = 33)
Reaction time (ms)
1400
Group 3
cued switching
bivalent stimuli (n = 32)
1400
1200
1200
1000
1000
800
800
600
600
400
400
1
1600
2
3
4
Group 4
uncued switching
univalent stimuli (n = 33)
1400
Reaction time (ms)
1600
1
1600
1200
1000
1000
800
800
600
600
3
4
Group 5
uncued switching
bivalent stimuli (n = 32)
1400
1200
400
2
400
1
2
3
4
1
2
Stay younger adults
Stay older adults
Switch younger adults
Switch older adults
3
4
Figure 10. Mean reaction times (ms) as a function of Session (1, 2, 3, 4), Age group
(younger adults, older adults), Group (Group 2, Group 3, Group 4, Group 5) and Trial
type (stay, switch). Error bars refer to standard error of the mean.
77
Correct Trials (%)
Group 2
cued switching
univalent stimuli (n = 33)
Group 3
cued switching
bivalent stimuli (n = 32)
100
98
96
94
92
90
88
86
84
82
80
100
98
96
94
92
90
88
86
84
82
80
1
2
3
4
1
Correct Trials (%)
Group 4
uncued switching
univalent stimuli (n = 33)
2
3
4
Group 5
uncued switching
bivalent stimuli (n = 32)
100
98
96
94
92
90
88
86
84
82
80
100
98
96
94
92
90
88
86
84
82
80
1
2
3
4
1
Stay younger adults
Switch younger adults
2
3
4
Stay older adults
Switch older adults
Figure 11. Percentage of correct trials (%) as a function of Session (1, 2, 3, 4), Age group
(younger adults, older adults), Group (Group 2, Group 3, Group 4, Group 5) and Trial
type (stay, switch). Error bars refer to the standard error of the mean.
78
Contrasts
In the next phase follow up analyses were performed with a-priori contrasts in
line with our predictions to disentangle the interactions with the factor Group. Given that
no specific hypotheses were put forth with regard to the training related changes across
the four training sessions analyses will concentrate on comparisons between the first and
fourth training sessions. Thus, data were subjected to a four way ANOVA including the
within-subjects factors Session (1, 4) and Trial Type (stay, switch) and the betweensubjects factors Age Group (younger adults, older adults) and Group (Group 2, Group 3,
Group 4, Group 5). As none of the comparisons yielded significant differences with
regard to accuracy, only the significant results from latencies will be reported.
Contrast 1: univalent stimuli groups (Group 2 and Group 4) – bivalent stimuli groups
(Group 3 and Group 5)
There was a main effect of Group, F(1, 124) = 22.22, p < .001, ŋ2 = .15,
indicating that latencies were longer in bivalent stimuli groups than in univalent stimuli
groups. Furthermore there was a significant interaction between Trial type and Group,
F(1, 124) = 8.45, p = .004, ŋ2 = .06, indicating that the bivalent stimuli groups had larger
switch costs than the univalent stimuli groups. There was also a tendency for an
interaction between Session and Group, F(1, 124) = 3.76, p = .055, ŋ2 = .03, indicating
that reaction times improved more in bivalent groups from the first session to the last.
However there was no interaction between Session, Trial Type and Group (p > .12),
indicating that switch costs reduced equally in both univalent and bivalent groups from
the first session to the last session. There was also an interaction between Session, Age
Group and Group, F(1, 124) = 4.20, p = .042, ŋ2 = .03, indicating that reaction times
improved more in bivalent groups from the first session to the last session for younger
79
adults compared to older adults. Other interactions with Age Group did not reach
significance (all ps > .10).
Contrast 2: cued switching groups (Group 2 and Group 3) – uncued switching groups
(Group 4 and Group 5)
There was a significant interaction between Trial type and Group, F(1, 124) =
9.70, p = .002, ŋ2 = .07, indicating that the uncued switching groups had larger switch
costs than the cued switching groups. However, neither the main effect for Group nor any
of the interactions reached significance (all ps > .10).
Contrast 3: univalent stimuli groups: cued switching group (Group 2) – uncued
switching group (Group 4)
There was a tendency for an interaction between Trial type and Group, F(1, 124)
= 3.75, p = .055, ŋ2 = .03, indicating that the uncued univalent switching groups had
larger switch costs than the cued univalent switching groups. However neither the main
effect for Group, nor any other interactions reached significance (all ps > .42).
Contrast 4: bivalent stimuli groups: cued switching group (Group 3) – uncued
switching group (Group 5)
There was a significant interaction between Trial type and Group, F(1, 124) =
5.95, p = .016, ŋ2 = .05, indicating that the uncued bivalent switching groups had larger
switch costs than the cued bivalent switching groups. However neither the main effect for
Group, nor any other interactions reached significance (all ps > .10).
General Summary
From the above results the following conclusions can be drawn. Reaction times
reduced in all training groups and older adults were generally slower than younger adults.
Switching costs also reduced in all task-switching training groups. Although the amount
of switch costs or its reduction from the first to the last session did not differ between
80
younger and older adults, there was a difference in the amount of RT reduction from the
first to the last session within bivalent groups, indicating a larger reduction in younger
adults in those groups. Furthermore, task-switching groups with bivalent stimuli had
longer latencies and larger switch costs than task-switching groups with univalent stimuli.
Also, uncued switching groups had longer latencies and larger switch costs than the cued
switching groups. Furthermore, uncued-univalent switching groups had larger switch
costs than the cued-univalent switching groups and uncued-bivalent switching groups had
larger switch costs than the cued-bivalent switching groups. Finally, the amount of
reduction in switch costs did not differ between any of the groups and there were no
interactions with age. With regard to error rates, we can conclude that older adults were
generally more accurate than younger adults, and that in overall, accuracy improved from
the first session to the fourth.
81
NEAR TRANSFER OF TASK-SWITCHING TRAINING
To assess near transfer to a similar switching task, data were submitted to a fourway ANOVA including the within-subjects factors Session (pretest, posttest) and Trial
type (single, stay, switch) and the between-subjects factors Age group (younger adults,
older adults) and Training group (Group 1, Group 2, Group 3, Group 4, Group 5). Mean
reaction times and percentage of correct trials for all training groups and sessions are
displayed in Table 7and Table 8. As age differences with regard to mixing and switch
costs as well as speed of responding was entirely similar at posttest to that of the results
at pretest, we will not report those effects again, but will focus on interactions with the
factors Training group and Session.
82
Table 7 Mean (M) reaction times and standard deviations (SD) for each trial type (single,
stay, switch) as well as mixing and switch costs for younger and older adults separately
for each training group at pretest and posttest.
Training group
Group 3
Group 1
Group 2
Group 4
Group 5
single (n=33)
cued/univalent
n=(33)
cued/bivalent
n=(32)
uncued/univalent
n=(33)
uncued/bivalent
n=(32)
M (SD)
M (SD)
M (SD)
M (SD)
Single
Stay
Switch
Mixing cost
Switching cost
511 (49)
597 (100)
676 (139)
125 (96)
79 (53)
519 (47)
599 (106)
676 (150)
118 (98)
77 (63)
513 (78)
602 (182)
695 (231)
135 (137)
93 (61)
525 (58)
599 (99)
696 (134)
122 (76)
97 (57)
Single
Stay
Switch
Mixing cost
Switching cost
469 (45)
523 (55)
582 (87)
84 (50)
59 (46)
472 (44)
509 (68)
561 (107)
64 (53)
52 (44)
481 (68)
526 (124)
598 (181)
81 (94)
72 (64)
480 (48)
514 (61)
574 (98)
64 (49)
60 (42)
Single
Stay
Switch
Mixing cost
Switching cost
680 (68)
913 (155)
1010 (199)
282 (128)
96 (106)
721 (138)
940 (231)
1047 (292)
272 (144)
106 (108)
701 (79)
925 (176)
1033 (204)
278 (149)
108 (65)
689 (64)
907 (141)
1007 (151)
268 (119)
100 (84)
Single
Stay
Switch
Mixing cost
Switching cost
613 (70)
787 (128)
902 (157)
231 (101)
115 (66)
678 (108)
829 (204)
926 (236)
199 (137)
97 (72)
M (SD)
Younger
Pretest
521 (71)
590 (115)
677 (135)
113 (80)
87 (53)
Posttest
474 (66)
501 (77)
566 (101)
59 (50)
65 (35)
Older
Pretest
659 (102)
883 (179)
978 (203)
271 (140)
95 (59)
Posttest
671 (110)
744 (159)
835 (202)
118 (117)
91 (71)
669 (84)
832 (151)
934 (194)
214 (98)
102 (71)
660 (79)
782 (132)
897 (146)
180 (83)
115 (84)
Trial type
83
Table 8 Mean (M) percentage correct trials and standard deviations (SD) for each trial
type (single, stay, switch) for younger and older adults separately for each training group
at pretest and posttest.
Training group
Group 3
Group 1
Group 2
Group 4
Group 5
single (n=33)
cued/univalent
n=(33)
cued/bivalent
n=(32)
uncued/univalent
n=(33)
uncued/bivalent
n=(32)
M (SD)
M (SD)
M (SD)
M (SD)
Single
Stay
Switch
96 (3.42)
96 (3.11)
94 (5.48)
95 (2.77)
95 (3.18)
94 (3.57)
95 (3.86)
96 (2.57)
91 (3.26)
97 (2.84)
97 (2.68)
94 (3.70)
Single
Stay
Switch
95 (2.87)
95 (3.12)
92 (4.88)
95 (3.76)
93 (4.14)
93 (4.53)
94 (5.12)
94 (3.63)
90 (5.87)
94 (4.18)
95 (3.41)
95 (3.54)
Single
Stay
Switch
98 (1.43)
97 (2.66)
95 (3.66)
97 (2.19)
96 (3.31)
94 (4.98)
98 (1.55)
96 (2.51)
94 (3.76)
98 (1.61)
96 (3.36)
94 (4.81)
Single
Stay
Switch
99 (1.37)
98 (2.07)
96 (4.22)
99 (1.20)
96 (2.93)
95 (3.51)
M (SD)
Younger
Pretest
97 (2.50)
96 (2.42)
92 (5.56)
Posttest
95 (3.77)
95 (3.32)
95 (2.90)
Older
Pretest
97 (1.81)
96 (4.57)
94 (4.87)
Posttest
97 (4.25)
98 (1.73)
97 (2.98)
98 (2.66)
97 (2.59)
96 (3.09)
99 (1.32)
98 (1.61)
98 (1.75)
Trial type
Latencies. There was a significant main effect of Session, F(1, 153) = 322.29, p <
.001, ŋp2 = .68. There was also an interaction between Session and Age group, F(1, 153)
= 4.72, p < .05, ŋp2 = .03, indicating that the reduction in latencies from pretest to posttest
was larger for younger adults than for older adults 5 (see Figure 12). Furthermore, there
was also an interaction between Session and Trial type, indicating that mixing costs
reduced from pretest to posttest, F(1, 153) = 75.45, p < .001, ŋp2 = .33, but switch costs
did not reduce from pretest to posttest (p = .62).
5
However this interaction was not significant based on mean reaction times (p = .29)
84
More importantly we were interested in the interactions with Training group.
There was neither a main effect of Training group (p = .88), nor an interaction between
Session and Training group (p = .69). However there was a significant interaction
between Session, Training group and Trial type, F(8, 306) = 2.61, p < .05, ŋp2 = .06, as
well as a tendency for an interaction between Session, Training group, Trial type and Age
group, F(8, 306) = 1.79, p = .08, ŋp2 = .05. Therefore, in the next step specific contrasts
were set up to disentangle the above interactions.
Contrast 1: single-task group (Group 1) – task-switching groups (Group 2-5)
The first contrast revealed that there was a larger reduction in mixing costs from
pretest to posttest in the task-switching groups than in the single-task group , F(1, 154) =
6.33, p < .05, ŋp2 = .04. However, age did not modulate this reduction (p = .27).
Furthermore, there were no differences in the reduction of switch costs from pretest to
posttest between the task-switching groups and the single-task group (p = .26).
Contrast 2: univalent stimuli groups (Group 2 and Group 4) – bivalent stimuli groups
(Group 3 and Group 5)
The second contrast revealed that there was a larger reduction in mixing costs
from pretest to posttest in the bivalent stimuli groups than in the univalent stimuli groups,
F(1, 154) = 5.10, p < .05, ŋp2 = .03. Furthermore, this reduction was larger for older
adults than for younger adults, F(1, 154) = 4.02, p < .05, ŋp2 = .003. However, there were
no differences in the reduction of switch costs (p = .80) from pretest to posttest between
the bivalent stimuli groups and the univalent stimuli groups.
85
Contrast 3: univalent stimuli groups: cued switching group (Group 2) – uncued
switching group (Group 4)
The third contrast revealed that there was no difference in the reduction of mixing
costs from pretest to posttest between the univalent cued switching group and the
univalent uncued switching groups (p = .83). Furthermore, there was also no difference in
the reduction of switch costs (p = .90) from pretest to posttest between the univalent cued
switching group and the univalent uncued switching groups.
Contrast 4: bivalent stimuli groups: cued switching group (Group 3) – uncued
switching group (Group 5)
The fourth contrast revealed that there was a tendency for a difference in the
reduction of mixing costs from pretest to posttest between Group 3 and Group 5 , F(1,
154) = 3.17, p = .08, ŋp2 = .02, indicating a larger reduction of mixing costs in the
bivalent-cued switching group (Group 3) than in the bivalent-uncued switching group
(Group 5). Furthermore, this was modulated by age, F(1, 154) = 4.03, p < .05, ŋp2 = .03,
indicating a larger reduction of mixing costs in older adults than in younger adults.
However, there was no difference in the reduction of switch costs (p = .99) from pretest
to posttest between the bivalent-cued switching group and the bivalent-uncued switching
groups.
86
Figure 12. Mixing costs and switch costs, based on mean reaction times, in both age
groups (younger adults, older adults) separately for each group (Group 1-5). Error bars
refer to the standard error of the mean.
Error rates. There was a significant main effect of Age group, F(1, 153) = 33.89, p
< .001, ŋp2 = .18, indicating that older adults were more accurate than younger adults.
87
There was also an interaction between Session and Age group, F(1, 153) = 36.75, p <
.001, ŋp2 = .19, indicating that while older adults got more accurate from pretest to
posttest, younger adults got less accurate. Furthermore, there was a significant main
effect of Trial type, F(2, 153) = 66.78, p < .001, ŋp2 = .31, indicating that stay trials were
less accurate than single trials, F(1, 153) = 14.16, p < .001, ŋp2 = .09, and switch trials
were less accurate than stay trials, F(1, 153) = 65.74, p < .001, ŋp2 = .30. There was also
an interaction between Session and Trial type, F(2, 306) = 9.52, p < .001, ŋp2 = .06,
indicating that switch costs reduced from pretest to posttest, F(1, 153) = 17.30, p < .001,
ŋp2 = .10, but mixing costs did not reduce from pretest to posttest (p = .88). Moreover,
there was an interaction between Trial type and Age group as well, F(2, 306) = 3.21, p <
.05, ŋp2 = .02. Finally, there was an interaction between Trial type, Session and Training
group, indicating a larger reduction of mixing costs in bivalent groups than in univalent
groups from pretest to posttest, F(1, 156) = 8.94, p < .05, ŋp2 = .05.
Summary. The results thus showed that when task-switching groups are pooled
together, there was a larger reduction in mixing costs from pretest to posttest in the taskswitching groups than in the single-task group. However, there were no differences in the
reduction of switch costs from pretest to posttest between the task-switching groups and
the single-task group.
Analyzing near-transfer effects separately for younger and older adults
In the next step the above analyses were carried out separately for younger adults
and older adults. Thus data were submitted to three-way ANOVAs including the withinsubjects factors Session (pretest, posttest) and Trial type (single, stay, switch) and the
between-subjects factor Training group (Group 1, Group 2, Group 3, Group 4, Group 5).
88
Younger adults
Latencies. There was a significant main effect of Session, F(1, 76) = 216.39, p <
.001, ŋp2 = .74. There were also reliable mixing costs, F(1, 76) = 115.29, p < .001, ŋp2 =
.60, and switch costs, F(1, 76) = 350.32, p < .001, ŋp2 = .82. Furthermore, there was also
an interaction between both contrasts, indicating that mixing costs reduced from pretest
to posttest, F(1, 76) = 25.99, p < .001, ŋp2 = .26, and that switch costs also reduced from
pretest to posttest F(1, 76) = 10.98, p < .001, ŋp2 = .13. There was no main effect of
Training group (p = .996). As previously we were more interested in the interactions with
Training group. However, there was neither an interaction between Session and Training
group (p = .64), nor an interaction between Session, Training group and Trial type (p =
.95).
Error rates. There was a significant main effect of Session, F(1, 76) = 10.10, p <
.05, ŋp2 = .12. There was also a significant main effect of Trial type, F(2, 152) = 28.24, p
< .001, ŋp2 = .27, indicating reliable switch costs, F(1, 76) = 31.61, p < .001, ŋp2 = .29.
Furthermore, there was also an interaction between Session and Trial type, indicating a
reduction in accuracy for stay trials relative to switch trials from pretest to posttest F(1,
76) = 3.47, p < .05, ŋp2 = .15. There was no main effect of Training group (p = .33). With
regard to the interactions with Training group, there was an interaction between Trial
type and Training group, F(8, 152) = 2.33, p < .05, ŋp2 = .11, and an interaction between
Session, Training group and Trial type, F(8, 152) = 2.26, p < .05, ŋp2 = .11.
To disentangle the interactions with Training group we set up contrasts as before.
There was a tendency for a larger switch cost reductions in task-switching groups than
single-task groups F(1, 76) = 3.48, p = .07, ŋp2 = .11. There was also a tendency for
univalent groups to be more accurate than bivalent groups, F(1, 76) = 3.22, p = .08, ŋp2 =
.04. Also, there was larger reduction of switch costs, F(1, 76) =5.78, p < .05, ŋp2 = .07 as
89
well as mixing costs, F(1, 76) = 4.50, p < .05, ŋp2 = .05, in bivalent groups compared to
univalent groups. Furthermore, there was a tendency for larger specific switch costs in
uncued groups compared to cued groups, F(1, 76) = 3.66, p = .06, ŋp2 = .04. Finally, there
was also a tendency for bivalent-cued groups to be more accurate than bivalent-uncued
groups, F(1, 76) = 3.93, p = .05, ŋp2 = .04, and bivalent-cued groups had lower switch
costs, F(1, 76) = 8.81, p < .005, ŋp2 = .10, than bivalent-uncued groups.
Older adults
Latencies. There was a significant main effect of Session, F(1, 77) = 117.19, p <
.001, ŋp2 = .60, indicating a reduction in latencies from pretest to posttest. There was also
a significant main effect of Trial type, F(2, 154) = 467.95, p < .001, ŋp2 = .86, indicating
reliable mixing costs, F(1, 77) = 365.19, p < .001, ŋp2 = .83, as well as switch costs, F(1,
77) = 243.87, p < .001, ŋp2 = .76. Furthermore, there was also an interaction between
Session and Trial type, F(2, 154) = 30.96, p < .001, ŋp2 = .29, indicating that mixing costs
reduced from pretest to posttest, F(1, 77) = 50.01, p < .001, ŋp2 = .39. There was no main
effect of Training group (p = .76). However, there was an interaction between Session,
Training group and Trial type, F(8, 154) = 3.44, p = .001, ŋp2 = .15. In order to break
down the interaction with Training group for the latency data, in the next step specific
contrasts were set up, similar to that of the pooled analysis.
Contrast 1: single-task group (Group 1) – task-switching groups (Group 2-5)
The first contrast revealed that there was a larger reduction in mixing costs from
pretest to posttest in the task-switching groups than in the single-task group , F(1, 77) =
5.87, p < .05, ŋp2 = .07. There were no differences in the reduction of switch costs from
pretest to posttest between the task-switching groups and the single-task group (p = .32).
90
Contrast 2: univalent stimuli groups (Group 2 and Group 4) – bivalent stimuli groups
(Group 3 and Group 5)
The second contrast revealed that there was a larger reduction in mixing costs
from pretest to posttest in the bivalent stimuli groups than in the univalent stimuli groups,
F(1, 77) = 7.89, p < .05, ŋp2 = .09. There were no differences in the reduction of switch
costs (p = .53) from pretest to posttest between the bivalent stimuli groups and the
univalent stimuli groups.
Contrast 3: univalent stimuli groups: cued switching group (Group 2) – uncued
switching group (Group 4)
The third contrast revealed that there was no difference in the reduction of mixing
costs from pretest to posttest between the univalent cued switching group and the
univalent uncued switching groups (p = .81). There was also no difference in the
reduction of switch costs (p = .81) from pretest to posttest between the univalent cued
switching group and the univalent uncued switching groups.
Contrast 4: bivalent stimuli groups: cued switching group (Group 3) – uncued
switching group (Group 5)
The fourth contrast revealed that there was a difference in the reduction of mixing
costs from pretest to posttest between Group 3 and Group 5 , F(1, 77) = 6.19, p < .05, ŋp2
= .07, indicating a larger reduction of mixing costs in the bivalent cued switching group
(Group 3) than in the bivalent uncued switching group (Group 5). There was no
difference in the reduction of switch costs (p = .46) from pretest to posttest between the
bivalent cued switching group and the bivalent uncued switching groups.
Error rates. There was a significant main effect of Session, F(1, 77) = 32.59, p <
.001, ŋp2 = .30, indicating an increase in accuracy from pretest to posttest. There was also
a significant main effect of Trial type, F(2, 154) = 43.38, p < .001, ŋp2 = .36, indicating
reliable switch costs, F(1, 77) = 36.30, p < .001, ŋp2 = .32, as well as mixing costs, F(1,
91
77) = 22.32, p < .001, ŋp2 = .23. Furthermore, there was also an interaction between
Session and Trial type, F(1.55, 154) = 6.10, p < .005, ŋp2 = .07, indicating an increase in
accuracy for switch trials relative to stay trials from pretest to posttest F(1, 77) = 11.06, p
= .001, ŋp2 = .13. There was no main effect of Training group (p = .49).
Summary. The results from the separate analyses thus showed that there was a
larger reduction in mixing costs from pretest to posttest in the task-switching groups
relative to the single-task group only in older adults. With regard to the reduction of
switch costs from pretest to posttest, there were no differences between the taskswitching groups and the single-task group or between the task-switching groups in either
the younger adults or in the older adults.
Furthermore, with regard to the older adults, comparing the task-switching groups
to each other, the results indicated that there was a larger reduction in mixing costs from
pretest to posttest in the bivalent stimuli groups than in the univalent stimuli groups. The
results also indicated a larger reduction of mixing costs in the bivalent cued switching
group (Group 3) than in the bivalent uncued switching group (Group 5).
92
FAR TRANSFER
As mentioned previously in the method section each theoretical construct was
measured on multiple tests. As a more reliable assessment of far transfer effects can be
achieved by using composite measures combining several tests, firstly, data from the
different tests was examined whether they can be collapsed together for each construct.
We performed exploratory factor analysis with the variables digit backward span,
counting span, reading span, Raven, 2-back (hits-false alarms), AX-CPT updating (ER;
AY vs. BXR), AX-CPT interference (ER; AX+BY vs. AY+BX), Color Stroop
interference (RT and ER; incongruent - neutral), Number Stroop interference (RT and
ER; incongruent - neutral). The BOMAT was not included, as due to printing error data
from younger adults couldn’t be evaluated. The 3-back was also not included, as we
assessed it only in younger adults. However, apart from a factor for working memory
(including the variables: digit backward span, counting span, reading span), other factors
couldn’t be meaningfully interpreted (Table 9 - Table 12). Therefore only these three
tests were aggregated, the other tests were analyzed separately. The total variance
explained by the model was 66.85%.
93
Table 9. Principal Component Analysis, Rotated Component Matrix.
Component
1
2
3
4
5
Digit Backward
.67
.30
-.04
-.04
.12
Counting Span
.70
-.05
.28
.18
-.23
Reading Span
.85
-.02
.03
-.02
.08
Raven
.23
.70
.19
.19
.00
2-back
.11
.29
.60
.34
-.02
Color Stroop RT
.06
-.84
.01
.14
.01
Number Stroop RT
.06
.00
.04
-.03
.92
Number Stroop ER
.06
-.01
-.08
.85
-.04
Color Stroop ER
.14
.45
-.32
-.35
-.34
-.08
-.22
-.62
.36
.31
.08
-.16
.76
-.10
.22
AX-CPT Interference
AX-CPT Updating
94
Table 10. Correlations Between the Psychometric Tests in the Cognitive Battery for both Age Groups. Correlations marked in
red refer to indicators for one factor.
1.
1. Digit Backward Span
2. Counting Span
3. Reading Span
4. Raven
5. 2-back
6. AX-CPT Updating
2.
3.
4.
5.
.24
**
.37
**
.27
**
.17
*
.03
.45
**
.24
**
.20*
.17
**
.14
9.
10.
11.
12.
13.
1
.07
.21
**
.09
-.11
-.14
-.09
8. Color Stroop RT
-.13
-.01
.00
9. Number Stroop RT
.05
-.08
.11
-.41
**
-.06
10. Color Stroop ER
.16
*
.01
-.04
.06
.12
.12
.06
-.22
**
-.05
-.21
**
-.03
-.13
13. Switching Cost
8.
1
7. AX-CPT Interference
12. Mixing Cost
7.
1
.18
*
-.15
11. Number Stroop ER
6.
1
-.01
1
.21
**
-.25
**
-.11
1
-.26
**
.12
.02
1
.20
*
.12
-.06
.16
*
-.20*
-.14
.05
.12
-.05
-.52
**
-.08
-.20
**
-.12
.04
-.04
** p < .01 (two-tailed), * p < .05 (two-tailed)
95
1
.04
1
.14
-.30
**
.12
-.18
*
.03
.16
*
.02
.25
**
.08
.09
.14
1
-.10
1
-.21
**
-.12
-.16
*
-.08
1
.43
**
1
Table 11. Correlations Between the Psychometric Tests in the Cognitive Battery for Younger Adults. Correlations marked in
red refer to indicators for one factor.
1.
1. Digit Backward Span
2.
3.
4.
5.
2. Counting Span
.20
1
3. Reading Span
4. Raven
.34
**
.01
.44
**
.15
.20
1
5. 2-back
.15
.22
.13
6. AX-CPT Updating
.09
.19
.10
.33
**
.25
-.10
-.13
-.13
-.03
7. AX-CPT Interference
6.
7.
8.
9.
10.
11.
12.
13.
1
1
1
.17
1
-.17
-.28
*
-.10
-.49
**
.05
-.08
1
8. Color Stroop RT
.09
-.25
*
-.03
9. Number Stroop RT
.02
-.10
.15
-.05
-.11
.08
-.14
-.01
1
10. Color Stroop ER
.19
.03
-.10
.01
-.10
-.08
-.07
.11
1
11. Number Stroop ER
-.06
-.01
.24
*
.14
-.05
.22
-.03
-.08
.21
-.12
-.17
1
12. Mixing Cost
-.03
-.14
-.04
-.01
-.04
.04
1
.07
.07
.26
*
.17
-.13
-.07
.23
*
.16
.04
.05
-.29
**
-.11
-.19
.08
.66
**
13. Switching Cost
-.01
** p < .01 (two-tailed), * p < .05 (two-tailed)
96
1
.00
1
Table 12. Correlations Between the Psychometric Tests in the Cognitive Battery for Older Adults. Correlations marked in red
refer to indicators for one factor.
1. Digit Backward Span
1.
1.00
2.
3.
2. Counting Span
.19
1.00
3. Reading Span
4. Raven
.41
**
.15
.46
**
.14
5. 2-back
.19
.17
.23
*
.16
6. AX-CPT Updating
.01
.21
7. AX-CPT Interference
-.08
8. Color Stroop RT
4.
5.
6.
7.
8.
9.
10.
11.
12.
13.
1.00
1.00
1.00
.05
.28
*
.15
.25*
1.00
-.10
-.10
-.21
-.17
1.00
-.04
.17
.06
-.04
-.26
*
-.13
.14
1.00
9. Number Stroop RT
.09
-.06
.10
-.03
.10
.20
.28
*
.19
.03
1.00
10. Color Stroop ER
.06
-.16
-.07
-.04
-.13
-.15
-.29**
-.28*
1.00
11. Number Stroop ER
.03
.20
-.02
.01
.04
-.24
*
-.05
.17
.11
-.09
1.00
12. Mixing Cost
-.11
-.11
-.20
-.17
.06
-.03
-.01
-.11
13. Switching Cost
-.07
.03
-.05
-.31
**
-.06
.25
*
.13
-.13
-.06
-.03
.05
.12
-.07
-.26
*
-.15
** p < .01 (two-tailed), * p < .05 (two-tailed)
97
1.00
.36
**
1.00
For analyzing far-transfer measures both reaction times and error rates were
submitted to ANOVAs with the between-subjects factors Age group (younger adults,
older adults) and Training group (Group 1, Group 2, Group 3, Group 4, Group 5) and the
within-subject factor Session (pretest, posttest). Group contrasts were similar to that of
the near transfer analyses. In the case of the Stroop and AXCPT data an additional
within-subject factor for Trial Type (Stroop: neutral/congruent/incongruent; AXCPT:
AX, AY, BX, BY) was added, with specified contrasts for interference costs (Stroop: -1 0
1; AXCPT: 1 -1 -1 1) and updating (AXCPT: 0 -1 1 0). Error rates and reaction times
data for trial types and costs can be found in the Appendices (Table 17 - Table 28).
AX-CPT
With regard to reaction times, there was a main effect of Session, F(1, 162) =
18.90, p < .001, ŋp2 = .10, indicating better performance at posttest. Furthermore, there
were significant interference costs, F(1, 154) = 346.86, p < .001, ŋp2 = .68, reflected by
better performance on non-interference trials than interference trials, but it did not
interact with Session, (p > .81). There was also a significant effect for the Updating
contrast, F(1, 154) = 370.81, p < .001, ŋp2 = .70, indicating better performance on BX
trials as compared to AY trials, but it also did not interact with Session, (p > .10). Group
contrasts did not reveal differences between single and task-switching groups in any of
the above comparisons, (all ps > .33), nor did the contrasts between bivalent and
univalent groups, (all ps > .25), or the contrasts between cued and uncued groups, (all ps
> .33). With regard to age differences, there was a tendency for larger interference effects
in older adults compared to younger adults, F(1, 161) = 2.93, p = .09, ŋp2 = .02, but there
were no age differences in Updating, (p > .24). There was no interaction of Session and
98
Age Group, (p > .67). Finally, there were no interactions of Age Group and Session in
any of the group contrasts. (all ps > .19).
With regard to error rates, there was no main effect of Session (p = .62). There
were significant interference costs, F(1, 162) = 123.75, p < .001, ŋp2 = .43, indicating
higher error rates in interference trials compared to non-interference trials. There was
also a significant effect for the Updating contrast, F(1, 162) = 33.50, p < .001, ŋp2 = .17,
indicating higher error rates in AY trials compared to BX trials. With regard to age
differences, there was an interaction of Session and Age Group, F(1, 161) = 13.43, p <
.001, ŋp2 = .08, indicating that error rates decreased in older adults from pretest to
posttest. Age Group also interacted with the Updating contrast, F(1, 161) = 8.47, p <
.005, ŋp2 = .05, indicating higher error rates in younger adults on AY trials, and there was
a tendency for an interaction of Age Group, Updating and Session, F(1, 154) = 2.88, p =
.09, ŋp2 = .02, indicating that while younger adults had a decrease in AY performance,
t(80) = 4.29, p < .001, older adults performance increased on AY trials from pretest to
posttest, t(81) = 2.55, p < .05. Finally, there was a tendency for an interaction of Age
Group, Updating and Session in the group contrast for single and task-switching group,
F(1, 154) = 2.88, p = .09, ŋp2 = .02, indicating that in older adults there was a tendency
for an increase in accuracy for BX trials in task-switching groups, t(63) = 1.78, p = .08.
99
80.0
Interference Cost RT (ms)
70.0
60.0
50.0
40.0
Pretest
30.0
Posttest
20.0
10.0
0.0
Single
Switch
Single
Younger adults
Switch
Older adults
Figure 13. AX-CPT Interference costs (RT) as a function of Training group (single,
switch), Age group (younger adults, older adults) and Session (pretest, posttest). Error
bars refer to the standard errors of the mean.
25%
Interference Cost ER
20%
15%
Pretest
10%
Posttest
5%
0%
Single
Switch
Single
Younger adults
Switch
Older adults
Figure 14. AX-CPT Interference costs (ER) as a function of Training group (single,
switch), Age group (younger adults, older adults) and Session (pretest, posttest). Error
bars refer to the standard errors of the mean.
100
Inhibitory Control (Color Stroop, Number Stroop)
Color Stroop
With regard to reaction times, there was a significant interference effect, F(1,
162) = 200.87, p < .001, ŋ2 = .55, however it did not interact with Session (p = .81).
Group contrasts did not modulate the interactions of Trial Type and Session (all ps > .12).
With regard to age differences, there was an interaction between Age group and Trial
type, F(1, 161) = 50.06, p < .001, ŋ2 = .24, indicating that older adults had larger
interference costs than younger adults. There was no interactions of Session, Age Group
and Trial Type (p = .63). Group contrasts did not modulate any of the above interactions
with Age Group (all ps > .50).
160.0
Interference cost (ms)
140.0
120.0
100.0
80.0
Pretest
60.0
Posttest
40.0
20.0
0.0
Single
Switch
Single
Younger adults
Switch
Older adults
Figure 15 Color stroop mean interference costs (ms) as a function of Age group (younger
adults, older adults), Training group (single, switch) and Session (pretest, posttest). Error
bars refer to the standard errors of the mean.
With regard to error rates, there was a significant interference effect, F(1, 162) =
31.55, p < .001, ŋ2 = .16, which decreased from pretest to posttest, F(1, 162) = 9.08, p <
.005, ŋ2 < .05. The group contrasts did not modulate the interactions of Trial Type and
101
Session (all ps > .42). With regard to age differences, there was an interaction between
Age group and Trial type, F(1, 161) = 5.95, p < .05, ŋ2 = .04, indicating that older adults
had larger interference costs than younger adults. There was no interaction of Session,
Age Group and Trial Type (p = .10). Group contrasts did not modulate any of the above
interactions with Age Group (all ps > .46).
Number Stroop
With regard to reaction times, there was a significant interference effect, F(1,
162) = 60.52, p < .001, ŋ2 = .27, however it did not interact with Session (p = .31). The
group contrast comparing single-task and task-switching groups modulated the
interaction of Trial Type and Session, F(1, 158) = 3.89, p = .05, ŋ2 = .02, indicating a
tendency for a decrease in interference cost in task-switching groups from pretest to
posttest, t(130)=1.908, p = .06. With regard to age differences, there was no interaction
between Age group and Trial type (p < .79). There was no interactions of Session, Age
Group and Trial Type (p = .42). Group contrasts did not modulate any of the above
interactions with Age Group (all ps > .49).
102
60.0
Interference cost (ms)
50.0
40.0
30.0
Pretest
Posttest
20.0
10.0
0.0
Single
Switch
Single
Younger adults
Switch
Older adults
Figure 16 Number stroop mean interference costs (ms) as a function of Age group
(younger adults, older adults), Training group (single, switch) and Session (pretest,
posttest). Error bars refer to the standard errors of the mean.
With regard to error rates, there was a significant interference effect, F(1, 162) =
102.91, p < .001, ŋ2 = .39, which decreased from pretest to posttest, F(1, 162) = 7.61, p <
.05, ŋ2 < .04. The group contrasts did not modulate the interactions of Trial Type and
Session (all p’s > .60). With regard to age differences, there was no interaction between
Age group and Trial type (p = .46). There was no interaction of Session, Age Group and
Trial Type (p = .50). Group contrasts did not modulate any of the above interactions with
Age Group (all ps > .14).
2-back
There was a main effect of Session, F(1, 160) = 6.07, p < .05, ŋp2 = .04, indicating
that the groups improved from pretest to posttest, however group contrasts did not reveal
differences between groups in the improvements from pretest to posttest (all ps > .17).
With regard to age differences, there was no interaction between Age Group and Session
103
(p = .70). Group contrasts did not modulate the interaction of Age Group and Session (all
ps > .60).
18.0
16.0
hits - false alarms
14.0
12.0
10.0
8.0
Pretest
6.0
Posttest
4.0
2.0
0.0
Single
Switch
Younger adults
Single
Switch
Older adults
Figure 17 2-back mean performance (hits – false alarms) as a function of Training group
(single, switch), Age group (younger adults, older adults) and Session (pretest, posttest).
Error bars refer to the standard errors of the mean.
3-back
There was a main effect of Session, F(1, 71) = 7.69, p < .05, ŋp2 = .10, indicating
that the groups improved from pretest to posttest, however group contrasts did not reveal
differences between groups in the improvements from pretest to posttest (all ps > .26).
104
7.0
hits-false alarms
6.0
5.0
4.0
Pretest
3.0
Posttest
2.0
1.0
0.0
Single
Switch
Figure 18 3-back mean performance (hits – false alarms) as a function of Training group
(single, switch) and Session (pretest, posttest) for young adults. Error bars refer to the
standard errors of the mean.
Working-memory
Working-memory capacity was measured by the counting span, reading span and
digit backward tests. Individual test scores were standardized and averaged. There was no
main effect of Session (p = .46). The group contrast comparing single-task and taskswitching groups showed a tendency for an interaction with Session, F(1, 158) = 3.31, p
= .07, ŋ2 = .02, indicating a non-significant decrease in performance in single-task
groups, t(33) = 1.31, p = .19, and non-significant increase in task-switching groups,
t(128) = 1.54, p = .14. With regard to age differences, there was an interaction between
Age Group and Session, F(1, 161) = 4.33, p < .05, ŋ2 = .03, indicating a non-significant
decrease in performance in older adults, t(81) = 0.93, p = .36, and significant increase in
younger adults, t(80) = 2.01, p < .05. Group contrasts did not modulate the interaction of
Age Group and Session (all ps > .73).
105
6.0
5.0
WM Span
4.0
3.0
Pretest
Posttest
2.0
1.0
0.0
Single
Switch
Single
Younger adults
Switch
Older adults
Figure 19. WM span as a function of age group (younger adults, older adults), Training
group (single, switch) and Session (pretest, posttest). Error bars refer to the standard
errors of the mean.
Fluid intelligence
Raven
There was a main effect of Session, F(1, 161) = 7.54, p < .05, ŋ2 = .04, indicating
a decrease in performance from pretest to posttest. The group contrast comparing singletask and task-switching groups showed a tendency for interaction with Session, F(1, 157)
= 3.14, p = .08, ŋ2 = .02, indicating a non-significant increase in performance in singletask groups, t(33) = .33, p = .74, and significant decrease in task-switching groups, t(127)
= 3.26, p < .001. With regard to age differences, there was a tendency for an interaction
between Age Group and Session, F(1, 160) = 3.49, p = .06, ŋ2 = .02, indicating a nonsignificant decrease in performance in older adults, t(80) = .68, p = .50, and significant
decrease in younger adults, t(80) = 3.07, p < .05. Group contrasts did not modulate the
interaction of Age Group and Session (all ps > .13).
106
14.0
12.0
Correct trials
10.0
8.0
Pretest
6.0
Posttest
4.0
2.0
0.0
Single
Switch
Younger adults
Single
Switch
Older adults
Figure 20 Raven mean performance (correct trials) as a function of age group (younger
adults, older adults), Training group (single, switch) and Session (pretest, posttest). Error
bars refer to the standard errors of the mean.
BOMAT
Due to printing errors in the test material the BOMAT data from younger adults
couldn’t be analyzed. Therefore the analysis was restricted to the older adult’s data.
There was a main effect of Session, F(1, 81) = 11.05, p = .001, ŋ2 = .12, indicating an
increase in performance from pretest to posttest. However the group contrast comparing
single-task and task-switching groups showed no interaction with Session (p = .29).
107
8.0
7.0
Correct trials
6.0
5.0
Pretest
4.0
Posttest
3.0
2.0
1.0
0.0
Single
Switch
Figure 21 BOMAT mean performance (correct trials) as a function of Training group
(single, switch) and Session (pretest, posttest). Error bars refer to the standard errors of
the mean.
Digit Symbol
In addition to the near and far transfer tasks, we also measured participants on a
control test, the Digit Symbol test, which is not closely related to cognitive control but a
measure of perceptual speed. The expectation was that cognitive control training does not
lead to performance improvement on this test. There was a main effect of Session, F(1,
162) = 26.62, p < .001, ŋ2 = .14, indicating an increase in performance from pretest to
posttest. The group contrast comparing single-task and task-switching groups showed no
interaction with Session (p = .76). With regard to age differences, there was an
interaction between Age Group and Session, F(1, 161) = 25.35, p < .001, ŋ2 = .13,
indicating a non-significant increase in performance in older adults, t(81) = .37, p = .72,
and significant increase in younger adults, t(80) = 7.69, p < .001. Group contrasts did not
modulate the interaction of Age Group and Session (all ps > .39).
108
Table 13 Digit symbol mean (M) scores and standard deviations (SD) for younger and
older adults separately for each training group at pretest and posstest.
Group 1
Group 2
single task –
bivalent stimuli
n=(34)
Age group
M (SD)
cued switching –
univalent stimuli
n=(32)
Younger adults
Older adults
69 (11)
47 (8)
69 (12)
47 (8)
Younger adults
Older adults
75 (9)
48 (14)
77 (13)
47 (10)
M (SD)
109
Training group
Group 3
cued switching –
bivalent stimuli
n=(29)
M (SD)
Pretest
67 (5)
46 (8)
Posttest
72 (8)
48 (7)
Group 4
Group 5
uncued switching
– univalent stimuli
n=(32)
uncued switching
– bivalent stimuli
n=(33)
64 (11)
47 (9)
68 (9)
44 (7)
68 (9)
46 (11)
71 (10)
43 (8)
M (SD)
M (SD)
FOLLOW-UP ANALYSES
We also checked the follow-up data for the near transfer effects in task switching.
We were interested whether the training gains in the high-inhibition task-switching
training groups in older adults still remains after six months. Data were submitted to a
three-way ANOVA including the within-subjects factors Session (pretest, follow-up) and
Trial type (single, stay, switch) and the between-subjects factor Training group (Group 1,
Group 2, Group 3, Group 4, Group 5). We used to same contrasts as in the near-transfer
analysis to compare training groups, and trial types. Mean mixing costs for all training
groups and sessions are displayed in Table 14.
Analyses revealed that there was no larger reduction in mixing costs from pretest
to follow-up in the task-switching groups than in the single-task group (p = .21), but
there was still a larger reduction in mixing costs from pretest to follow-up in the bivalent
stimuli groups than in the univalent stimuli groups, F(1, 69) = 6.61, p < .05, ŋp2 = .08.
There was no difference in the reduction of mixing costs from pretest to follow-up
between the bivalent cued switching group and the bivalent uncued switching group (p =
.10).
110
Table 14. Mean (M) reaction times and standard deviations (SD) for mixing costs for
younger and older adults separately for each training group at pretest, posttest and followup.
Group 1
Training group
Group 3
Group 2
cued/univalent
Session
Pretest
Posttest
Follow Up
Pretest
Posttest
Follow Up
M (SD)
M (SD)
125 (96)
84 (50)
77 (63)
282 (128)
231 (101)
244 (97)
cued/bivalent
Group 4
Group 5
uncued/univalent
uncued/bivalent
M (SD)
M (SD)
118 (98)
64 (53)
73 (58)
M (SD)
Younger
113 (80)
59 (50)
64 (46)
135 (137)
81 (94)
61 (43)
122 (76)
64 (49)
71 (57)
272 (144)
199 (137)
230 (163)
Older
271 (140)
118 (117)
198 (142)
278 (149)
214 (98)
244 (104)
268 (119)
180 (83)
180 (93)
EFFECT SIZES OF TRAINING AND TRANSFER
In this last section the effect sizes of training and transfer measures will be
presented. Values of Cohens’ d were calculated, which is a measure of the standardized
mean difference between the performances of the first and last sessions in the case of the
training results, and standardized mean differences between pretest and posttest with
regard to transfer effects. All d-values were corrected for small sample bias using the
formula (d’ 6) suggested by Hedges and Olkin (1985 p. 79-81.)
First, effect sizes were calculated for the reduction of switch costs from the first
training session to the fourth training session in the task-switching training groups (see
Figure 22). Effect sizes were relatively large for both age groups in all training groups (d’
= 0.62 - 1.59). In both age groups effect sizes were largest in the cued–univalent group
(d’ = 1.42 - 1.59). In cued–bivalent group effect sizes dropped somewhat for younger
adults (d’ = 1.26), but dropped noticeably in older adults (d’ = 0.62). In the uncued
6
dunbiased = =(1-3/(4×(N-2)-1))×d; where N represents the total sample size on which d is based
111
groups effect sizes were on similar levels for younger adults (d’ = 1.21), for older adults
it increased compared to the cued-bivalent group (d’ = 0.96 - 0.99).
1.80
Training Effect Size (d')
1.60
1.40
1.20
1.00
0.80
Younger Adults
0.60
Older Adults
0.40
0.20
0.00
Cued Univalent
Cued Bivalent
Uncued Univalent
Uncued Bivalent
Training Group
Figure 22. Effect sizes (d’) for switch cost reductions during training for younger and
older adults in the four task switching groups.
Next, effect sizes were calculated for the reduction of switch costs and mixing
costs from pretest to posttest in all five groups (see Figure 23 and Figure 24). With regard
to switch costs in younger adults effect sizes were on a comparable moderate level in
three of the task-switching groups (d’s = .34 - .47) and also in the single-task group (d’ =
.40). However, the uncued-bivalent group showed relatively large effect size (d’ = .75).
In comparison, older adults, showed small or even negative effect sizes (d’s = -.21 - .10).
112
Pretest - Posttest Effect Size (d')
1.40
1.20
1.00
0.80
0.60
0.40
Younger adults
0.20
Older adults
0.00
-0.20
-0.40
Single
Cued Univalent
Cued Bivalent
Uncued - Uncued Univalent Bivalent
Switch Cost
Figure 23. Effect sizes (d’) for switch cost reductions from pretest to posttest for younger
and older adults in the five training groups.
With regard to mixing costs effect sizes were moderate to large in both age groups
(d’s = 0.46 - 1.35). For younger adults effect sizes were on similar levels for the uncuedunivalent and the single-task group (d’s = 0.46 - 0.51), and larger for the other three taskswitching groups (d’s = 0.69 - 0.76). For older adults effect sizes were comparable in the
two univalent groups (d’s = 0.53) and the single-task group (d = 0.60), and they were
larger in the bivalent groups (d’s = 0.97 - 1.35), especially in the cued-bivalent group.
113
Pretest - Posttest Effect Size (d')
1.40
1.20
1.00
0.80
0.60
Younger Adults
0.40
Older Adults
0.20
0.00
Single
Cued Univalent
Cued Bivalent
Uncued - Uncued Univalent Bivalent
Mixing Cost
Figure 24. Effect sizes (d’) for mixing cost reductions from pretest to posttest for younger
and older adults in the five training groups.
Next, effect sizes were calculated for the far transfer measures from pretest to
posttest for task-switching and single-task groups (see Figure 25 and Figure 26). In
general effect sizes for far-transfer measures were smaller than for near-transfer (largest
d’s = 0.47 - 0.54). For younger adults there were small effect sizes for the task-switching
group for Working Memory, AXCPT and Number Stroop (d’s = 0.21 - 0.28) as well as
for the 2-back task (d = 0.16). Effect sizes for the single-task group were on a moderate
levels for Color Stroop, 2-back, and 3-back (d’s = 0.29 - 0.47). For older adults except for
the Bomat (d’s = 0.31 - 0.54) effect sizes were low in both task-switching and single-task
groups (all d’s < 0.23).
114
0.60
Effect Size d'
0.40
0.20
0.00
-0.20
Single-task training
-0.40
Task-switching
-0.60
Younger Adults
Figure 25. Far-transfer effect sizes (d') for younger adults as a function of measure (WM:
Working Memory; AXCPT: RT Interference; Number Stroop: RT Interference, Color
Stroop: RT Interference; Raven; 2-back, 3-back).
0.60
Effect Size d'
0.40
0.20
0.00
-0.20
Single-task training
-0.40
Task-switching
-0.60
Older Adults
Figure 26. Far-transfer effect sizes (d') for older adults as a function of measure (WM:
Working Memory; AXCPT: RT Interference; Number Stroop: RT Interference, Color
Stroop: RT Interference; Raven; 2-back, 3-back).
115
Discussion
SUMMARY OF MAIN RESULTS
The present study aimed to identify what processes are trained during taskswitching training and which of these processes facilitate transfer across task domains.
To this end we manipulated updating and inhibition demands in four task-switching
groups and compared performance improvements in a pretest-training-posttest design to
an active control group in younger and older adults. Task-switching groups had higher
cognitive control demands than the active control group that practiced only with a single
task, as task-switching groups were required to switch between two different task-sets
regularly during training. Updating demands were manipulated by the presence or
absence of task cues. In task switching groups without task-cues updating demands were
higher than in task-switching groups with task-cues, as in the former task-sets had to be
continually updated internally without external help from the cue. Inhibition demands
were manipulated by using bivalent or univalent stimuli. In the groups with bivalent
stimuli, a task-relevant character was always paired with another character that would be
relevant in the other task-set, which resulted in interference between task sets. In the
groups with univalent stimuli, a task-relevant character was always paired with a neutral
character that was not associated with any task-set in the context of the task-switching
task; therefore it did not induce interference between task sets. We measured both neartransfer to a switching task which was structurally similar to the one used during training,
and far-transfer to other cognitive tasks which were structurally different than the task
switching paradigm used during training.
During the four sessions of training we could track changes in switch costs, and
group differences therein. Analyses revealed that switch costs decreased as a function of
sessions in both age groups. There were no age differences with regard to switch costs.
116
With regard to group differences, groups with higher updating demands (i.e. without
cues) had larger switch costs, than groups with low updating demands (i.e. with cues).
Also, groups with high inhibition demands (bivalent stimuli) had larger switch costs than
groups with low inhibition demands (univalent stimuli).
With regard to near-transfer, we assessed performance cost reductions from
pretest to posttest in both mixing and switch costs. Interestingly, only older adults
showed transfer effects, and they did so only with regard to mixing costs. With regard to
group differences, older adults trained with high inhibition demands (bivalent stimuli)
showed larger reduction in mixing costs. Furthermore, within bivalent groups, the group
with low updating demands (with cue) had larger reductions in mixing costs than the
group with high updating demand (without cue). Finally, far-transfer measures did not
indicate more improvement in task-switching groups from pretest to posttest as compared
to single-task groups. In the following I will take these results into context and discuss
them in more detail.
Effects of Age, Cuing Type and Stimulus Ambivalence on Task-Switching Training
Reaction times reduced in all training groups throughout the four training sessions
and older adults were generally slower than younger adults. Slower reaction times were
expected from older adults in line with general observations and theory from the
literature (e.g., T. Salthouse, 1996). With regard to error rates we can conclude that older
adults were generally more accurate than younger adults, and that overall, accuracy
improved from the first session to the fourth. The more accurate performance in older
adults might reflect a more conscientious stance of older adults towards finishing the
task, while younger adults might have wanted to finish the task fast and therefore were
117
more careless. This idea is in line with findings showing that older adults put more effort
into task performance than younger adults (Ennis, Hess, & Smith, 2013).
Previous findings showed that switch costs are larger in bivalent than in univalent
conditions (e.g., Allport et al., 1994; Jersild, 1927; Rogers & Monsell, 1995; Spector &
Biederman, 1976). Our task-switching data from the four training sessions are in line
with these prior findings. It shows that reconfiguring task-sets is more difficult in the face
of ambivalence.
Consistent with previous findings, switching costs reduced in all task-switching
training groups in both younger and older adults (Bherer et al., 2005; Karbach & Kray,
2009; Kramer et al., 1999; Kray & Lindenberger, 2000), indicating that plasticity of this
cognitive control process is spared with aging. Furthermore, the amount of reduction in
switch costs did not differ between groups. This means that no matter the differing levels
of inhibition or updating demands imposed by the different task-switching training
groups in the present paradigm, switch costs reduced from the first to the fourth session at
a similar rate. Previous findings also suggested that there are no differences in the rate of
reduction between younger and older adults in switch costs (Bherer et al., 2005; Karbach
& Kray, 2009; Kramer et al., 1999; Kray & Lindenberger, 2000). Together these findings
indicate that older adults do not have more difficulty to reduce their switch costs in
conditions that involve bivalent stimuli, as compared to univalent conditions. So, despite
larger bottom up interference, older adults are capable to implement relevant task sets,
and to improve in this ability on par with younger adults.
Transfer gains
The first set of analyses investigated whether the observed effects in the present
study are in line with those observed in the literature with regard to age differences in
118
task switching. Our results are consistent with previous findings showing both reliable
mixing and switch costs in the task-switching paradigm, as well as larger mixing costs in
older adults (Cepeda et al., 2001; Karbach & Kray, 2009; Kray et al., 2004; Kray &
Lindenberger, 2000; Kray, 2006; Mayr, 2001; Reimers & Maylor, 2005; Verhaeghen &
Cerella, 2002). However, the near transfer results showed that there was a larger
reduction in mixing costs from pretest to posttest in the task-switching groups relative to
the single-task group only in older adults. This is inconsistent with the findings of
Karbach and Kray (2009), which showed large mixing cost reductions in younger age as
well.
Furthermore our results indicated that there was no far transfer, i.e. groups that
took part in task-switching training showed no better performance after training than did
the group that took part in the single task training. This result is inconsistent with
previous findings (e.g. Karbach & Kray, 2009). This result is unfortunate, as we were
interested in how manipulations of updating and inhibition demands modulate far-transfer
effects in younger and older adults during task-switching training. However we cannot
answer these questions based on the present results. In the following I will discuss in
detail the possible reasons for the smaller transfer effects.
EXPLANATIONS FOR THE SMALLER TRANSFER GAINS
In recent years there have been a number of studies that similarly had difficulties
in replicating transfer effects resulting from task-switching training (Pereg, Shahar, &
Meiran, 2013a; von Bastian & Oberauer, 2013; Zinke et al., 2012). In the following I will
present the differences between these studies, explain how our study contribute to this
landscape of findings, and explain which factors are important to elicit transfer from taskswitching training. I will do this separately for near- and far-transfer.
119
Near transfer
Comparing effect sizes with previous study
In general the magnitude of mixing costs in our study was smaller for both age
groups, (at pretest: 79 ms for younger adults, 224 ms for older adults) than in the study by
Karbach and Kray (2009) (172 ms and 371 ms for younger and older adults respectively).
Furthermore, with regard to the reduction of switch costs from pretest to posttest, there
were no differences, in either the younger or older adults, between the task-switching
groups and the single-task group, or between the task-switching groups with different
stimuli. This is also inconsistent with the findings of Karbach and Kray (2009), which
showed large switch cost reductions in both age groups in the task-switching groups
compared to the single-task group. Again, the magnitude of switch costs in our study was
smaller for both age groups, (at pretest: 87 ms for younger adults, 101 ms for older
adults) than in the study by Karbach and Kray (2009) (204 ms and 337 ms for younger
and older adults respectively). The smaller mixing and switch costs already at pretest
indicate that the task was not that challenging in our paradigm as in the previous study by
Karbach and Kray (2009). Given the relatively good performance already at pretest it is
reasonable to assume that there was no room to improve, which can explain the lack of
transfer effects with respect to mixing and switch costs.
With regard to the older adults, comparing the task-switching groups to each
other, the results indicated that there was a larger reduction in mixing costs from pretest
to posttest in the bivalent stimuli groups than in the univalent stimuli groups. The results
also indicated a larger reduction of mixing costs in the bivalent cued switching group
than in the bivalent uncued switching group. This means that older adults are not that able
to benefit from training in uncued switching, but also that training with bivalent condition
transfers better within the task switching domain.
120
However there are some additional factors that need to be addressed. At both
pretest and posttest participants performed task switching blocks from all types of
conditions, thus the performance in each of these tasks conditions contributed to the
measured mixing cost. It is reasonable to assume that the hardest condition will not be
that easy for those trained in the easiest condition. So those trained in the hardest
condition should show the largest reduction in mixing costs, since they got better in the
most demanding task. In other words, there was more transfer to similar conditions and
given that bivalent conditions produce the highest mixing costs, the greatest transfer
occurred in bivalent groups. However, the transfer is still not so narrow as this benefit
remained even though we changed task-set from training to posttest, indicating that older
adults got better at resolving bivalent task-switching in general. They improved in
decreasing their response time difference between resolving single-tasks trials and mixedtask trials. The source of this improvement is primarily better interference resolution,
rather than better updating processes as we have found differences between univalent and
bivalent groups, but there were no differences between cued and uncued groups. Thus, a
more substantial part of the mixing cost likely reflects some form of inhibition related
process rather than updating processes.
Other studies
A study by Pereg, Shahar and Meiran (2013b) using the same paradigm as
Karbach and Kray (2009) could replicate previous findings with respect to switch cost
reduction in alternating-runs task-switching paradigm; however, in a cued task-switching
paradigm they have found only a marginally significant effect, and no effect when run
length changed from 2 to 3. With respect to mixing costs there were no transfer effects.
Furthermore, the switch cost reductions were smaller than those found in Karbach and
121
Kray’s (2009) study (d’=0.93 vs. d’≈ 1.6 respectively). There is another study by von
Bastian (von Bastian & Oberauer, 2013), which used the same stimuli as Karbach and
Kray (2009). Near-transfer was assessed on a similar alternating-runs task-switching
paradigm, with bivalent stimuli. Results showed transfer to switch costs, the size of
which also correlated with improvements during training. Another study by Zinke and
colleagues (Zinke et al., 2012) also attempted to replicate the transfer effects of the study
by Karbach and Kray (2009) in adolescents. The reduction in switch costs during the
training sessions were comparable to the switch cost reductions seen in the study by
Karbach and Kray. In a similar task-switching paradigm they were able to replicate
transfer effects with regard to mixing costs, but not with regard to switch costs, which is
similar to our results. In summary, in all these studies near transfer effects from Karbach
and Kray were partly replicated, but not completely, so it is not unique that some of our
results are negative.
Which processes improved?
The study by Pereg, Shahar and Meiran (2013b) tried to disentangle whether
switching or working memory updating is improved during task-switching training, and
found support for the notion that updating is improved during task-switching training.
From these findings Pereg (2013) concluded that updating processes are involved in
alternating-runs task-switching training, yet they are not too demanding, leading to
limited transfer to similar contexts. Furthermore, Pereg et al. noted that it seems like
some very specific updating skills were trained in the alternating-runs task-switching
paradigms: those related to changing tasks every 2nd trial, but broader working memory
updating skills were not (cf. Pereg et al., 2013b). According to our study interference
control is a more likely candidate of improvement, at least in older adults. But the pattern
122
of findings was similar in younger adults if we compare mixing cost reductions in the
five groups with older adults. As mentioned previously, it is a reasonable explanation that
there was not much room to improve given the already small mixing costs at pretest in
the younger groups which resulted in non-significant results. It would be interesting to
see whether a similar paradigm as in the original study by Karbach and Kray (pictorial),
with the present idea (of manipulating inhibition and updating demands) could show
these results in younger adults as well.
Far-transfer
Inhibition
As mentioned in the introduction, the Stroop tasks that were used in our study
required similar executive control demands as the task-switching training. In both task
domains, inhibition of currently irrelevant information and maintenance of currently
relevant information was necessary. Therefore we expected to find larger improvements
in Stroop tasks after task-switching training compared to single-task training, especially
in bivalent task-switching conditions, that are most similar to the Stroop setting (i.e.
stimulus triggers both task-sets). However our results did not show larger improvements
in the Stroop task after task-switching training, and there were no differences in
performance improvement between bivalent and univalent task-switching groups.
At first inspection, our result regarding the Stroop task is inconsistent with
previous findings. Therefore, it is important to consider details about the experiments. In
the study by Karbach and Kray (2009) task-switching groups showed more
improvements than the single-task group, and effect sizes were relatively large, at least
for younger adults (younger adults: d’ ~ 0.8; older adults: d’ ~ 0.2). However, Karbach
and Kray (2009) mention that there was an unexpected deterioration in the Stroop
123
performance for younger adults in the single-task group. This might be explained due to
the fact that for younger adults at pretest the task-switching group had almost twice as
much interference-cost as the single-task group (57 ms and 30 ms respectively). Thus
matching of the groups was not ideal which might have influenced the results. At posttest
interference costs changed to 27 ms and 48 ms for task-switching and single-task groups
respectively. Thus, what happened is that the task-switching group reached the pretest
level of the single-task group after training, while the single-task group got worse from
pretest-to posttest. Apparently, the same was the case for the older group. For the singletask group pretest-posttest interference costs change from 57 ms to 72 ms, while for the
task-switching group it changed from 77 ms to 56 ms.
These problems could have been avoided in our study, however, unfortunately we
also encountered problems during matching the groups. We assumed that the color and
number versions of the Stroop task measure the same underlying construct, and therefore
we used an aggregate score of the two tasks during matching. However, later analysis
showed that there was no significant correlation between the two tests (r = .04 for RT
interference cost). Therefore, analysis was performed separately for these two tests, but
on the separate tests there were large baseline differences between the groups (see Table
17 and Table 18). Thus, from the present Stroop results we cannot make inferences
regarding transfer effects. With regard to AX-CPT interference costs we didn’t find
transfer effects.
With regard to other studies, the study by Pereg et al. (2013b) found a marginally
significant training-related improvement for a manual Stroop task, but not for a vocal
Stroop task. In the study by Zinke (2012) with adolescents there was no transfer to
inhibition as measured by a color stroop and a flanker task. In the study by von Bastian
and Oberauer (2013) there was also no transfer to inhibition as measured by a number
124
Stroop and a Flanker task. Thus, there is weak support for the idea that task-switching
training in the present format is demanding enough to cause generalized improvements in
inhibitory processes per se.
Working memory
The measure for working memory was an aggregate of two operation span tests,
the reading span and counting span, and the digit backward test. We found no transfer
effects for working memory. Although there was a tendency for a larger improvement in
task-switching groups this might be partly due to the fact that there was an unexpected
decrease in the performance of the single-task group. Our result is somewhat inconsistent
with results from Karbach and Kray (2009). With regard to n-back tests or AX-CPT
updating we also couldn’t find transfer effects.
A previous study, which investigated multitask video game training on cognitive
control processes in older adults, indicated that whereas improvements were observed for
tasks where one has to frequently switch items in working memory (n-back), there were
no improvements in working memory span per se (as measured by operation span tasks)
(Basak et al., 2008). Our results are in line with the finding that working-memory span
does not change with task-switching training, however, we did not find transfer to n-back
tasks.
Transfer effects to working-memory measures were also absent in other taskswitching training studies (e.g. Pereg et al., 2013; Bastian & Oberauer, 2013). Only in
one study was there a tendency for transfer effect with respect to faster responses in a 2back task, but not to improved accuracy (Zinke et al., 2012). Thus there is weak support
for the idea that task-switching training causes generalized improvements in workingmemory span or working-memory updating.
125
Fluid Intelligence
With regard to the fluid intelligence tests we also faced some problems. For
younger adults we couldn’t analyze data of the BOMAT due to printing errors of the test
sheets for a large number of participants, and with regard to the Raven test, we found that
performance decreased from pretest to posttest. The performance decrease in the Raven
test can be explained due to the fact that test items followed increasing difficulty, and at
pretest participants only did odd numbered items while they did the even numbered items
at posttest. There was a tendency for differences in pre-post changes between groups, but
not in the expected direction, showing a non-significant increase in single-task and a
significant decrease in task-switching groups. The BOMAT did not show differences in
pre-post improvements between task-switching and single-task groups.
Our result regarding fluid intelligence is inconsistent with previous findings. In
the study by Karbach and Kray (2009), task-switching groups showed more
improvements than the single-task group. This might be explained by the more reliable
measure there, as they measured fluid intelligence on the latent level by combining
several test scores. However, there were similar problems with matching the groups as
mentioned previously. There were ceiling effects for both younger and older adults in the
single-task groups that might weaken the results regarding transfer effects to fluid
intelligence. However, in the study by von Bastian and Oberauer (2013) there was also
transfer to fluid intelligence after task-switching training. As both of these studies used
mostly similar stimuli during training, the differences in transfer effects between our
study and theirs might be related to that factor (i.e. stimulus complexity during training).
I will explore this possibility later.
126
EXPLANATIONS FOR THE TRANSFER GAINS IN OLDER ADULTS
Impairments in dual-task contexts
Meta-analyses in the aging literature suggest that age-related deficits occur
prominently in divided attention and dual-task contexts (Verhaeghen, 2011; Wasylyshyn
et al., 2011). However, it has also been shown that dual-task performance can be
improved, even in older age, and that training leads to transfer effects involving new
stimuli (Bherer et al., 2005). Our findings are in line with these observations in that we
have seen age-related deficits mainly in mixing costs. We have also demonstrated that
mixing costs can be decreased with training, and have found evidence for transfer effects
in high-interference task-switching conditions in older adults.
We can postulate that task-switching facilitate performance in dual-task settings
compared to a single task setting (i.e. reduce mixing costs). In a single task setting there
is no interference between competing task sets, however in dual-task setting there is
interference. Task-switching training under high interference conditions might help
cognitive processes related with facilitation and suppression of relevant and irrelevant
task-sets respectively. Older adults have more difficulties in this respect; however, a
proper task-switching setting might provide a way of training these processes. Thus, our
results extend previous findings by highlighting a specific source (interference) for the
dual-task costs in older adults and indicating the possibility of improving cognitive
processes that are affected by age in dual-task settings.
Improved interference resolution in older adults
There are theories postulating age-related inhibitory deficit as the underlying
cause of impaired cognitive performance (Hasher & Zacks, 1988; Lustig, Hasher, &
Zacks, 2007). There is supporting evidence that problems with inhibitory processes
127
underlie impaired performance in different cognitive domains, such as working memory
(Gazzaley et al., 2005) and processing speed (Lustig, Hasher, & Tonev, 2006). However,
it is important to specify exactly which aspects of inhibitory processes might show agerelated deficits. It has been suggested that a unitary view of age-related decline in
inhibition is not appropriate as there is age equivalence in many aspects of inhibitory
processing (Kramer et al., 1994). Also, there are studies that indicate that there is no taskinhibition deficit per se in older adults, as there are no age-differences in the size of n-2
task repetition costs (Lawo, Philipp, Schuch, & Koch, 2012; Li & Dupuis, 2008; Mayr,
2001). With regard to training effects, it has been shown that older adults are able to
improve their ability to inhibit task-irrelevant information (Wilkinson & Yang, 2011).
On the other hand, it has been suggested that cognitive control relies on the
flexible adaptability of fronto-parietal brain networks and that this flexibility is
instantiated by hubs of brain regions that can rapidly update connectivity patterns
according to task demands (Cole et al., 2013). It has also been suggested that
multitasking leads to more substantial performance costs in older adults because of a
diminished ability in older adults to switch between task-relevant and task-irrelevant
brain networks (Clapp et al., 2011). In light of these studies, our results might indicate
that older adults improved in flexible switching between task-relevant and task-irrelevant
representations. Transferable improvements in our study were only observed in taskswitching groups with high-interference load. In these conditions interruptions might
potentially occur from the irrelevant task-set. Therefore, older adults might have
improved in their ability to switch between the currently irrelevant task-set and the
relevant task-set more efficiently, which led to transferable gains. This mechanism for the
transfer effects is also consistent with the idea that novel task performance is dependent
128
upon the reuse of flexible connectivity patterns used during a practiced task (Cole et al.,
2013).
Our results showing near transfer effects of the training groups only with high
inhibition demands are in line with recent results from Anguera and colleagues (Anguera
et al., 2013). In that study, older adults showed improvements in multitasking (i.e. a task
involving interference), and this improvement lead to better performance on untrained
cognitive abilities, such as enhanced sustained attention, divided attention, and enhanced
working-memory after training multitasking with a three dimensional video game. Given
that in their study both the single-task-training and the multitask-training led to similar
improvements on single task components, but only the multitask-training led to enhanced
multitasking, sustained attention and working memory performance, the mechanism that
must have driven the training effects was most likely the interference resulting from
overlapping cognitive control processes during task execution in the multitask-setting. It
is likely that task-switching training as well might produce transfer effects based on
similar principles as multi-task training. The results presented in this thesis also support
the idea that older adults are able to improve processes related with better interference
control, although the transfer scope of the present study was limited.
Plasticity of cognitive control components
Apart from the general slowing hypothesis, some theories postulate that a limited
number of executive control processes might be responsible for age-related decline in
cognitive performance (Braver & Barch, 2002). Previous studies have indicated that even
in older age cognitive control might be improved with training (Basak et al., 2008;
Karbach & Kray, 2009). Our training results support the notion that switching costs can
be reduced through training. However, we found no transfer effects for switching cost,
129
which questions whether the switching component of cognitive control is subject to
training-induced improvements in general. Furthermore, our results suggest a difference
in the plasticity of different components of cognitive control as we have found no
correlations between training gains in switching costs and pre-post gains in mixing costs.
Our results are in line with previous studies suggesting that there are separable
components of cognitive control (Miyake et al., 2000), and specifically with studies
suggesting that switching and mixing costs are separable constructs (Kray &
Lindenberger, 2000). Furthermore, similar to previous studies we also found that while
switching processes are spared with aging, processes underlying mixing costs are more
affected by aging (Kray & Lindenberger, 2000; Reimers & Maylor, 2005). It is an
interesting problem, that in theory switching and mixing costs are not independent of
each other. While in switching cost calculations we compare trials that have the same
level of maintenance demands (resulting from keeping two task-sets in mind), when we
compare mixed and single trials there is a difference between maintenance demands.
Furthermore, when we compare mixed trials and single trials for the mixing cost
calculations, the mixed trials are affected by both the higher maintenance and the
additional switching demands. These processes can be separated by a variant of the taskswitching paradigm, the fade-out paradigm. Studies with the fade-out paradigm show that
age-related differences in mixing costs are evident even when switching processes are
potentially no longer necessary (Mayr & Liebscher, 2001). The question regarding the
relative contribution of different cognitive control processes remains open.
Context, cuing, preparation
The difference between providing cues and not providing cues in the present taskswitching paradigm is that in the latter case the need for internal cognitive control is
130
increased. There are theories suggesting that older adults have difficulties when task
uncertainty increases due to lack of contextual cues from the environment (Lindenberger
& Mayr, 2013). In agreement with previous studies (e.g., Kray et al., 2002) our results
from the four training sessions showed larger switch costs in uncued groups than in cued
groups, but no age differences therein. While some studies indicated that older adults can
use task cues to prepare for an upcoming task in a similar way as younger adults as
evidenced by a similar amount of reduction of switch costs with changing cue stimulus
interval (Cepeda et al., 2001; Kray, 2006), there is also a study showing age-related
impairments in mixing costs when time for task preparation is decreased (Lawo et al.,
2012). Our results showed a similar amount of reduction in switch costs in younger and
older adults throughout the four training sessions in both cued and uncued groups, which
implies that switching ability might be independent of contextual demands. Furthermore,
it has been demonstrated that in an alternate runs task-switching paradigm if updating
demands are increased then older adults are less able to reduce switch costs through
training (Kramer et al., 1999). Consistent with this finding we found larger mixing cost
reductions in older adults in cued-bivalent task-switching groups than in uncued-bivalent
task-switching training groups.
With regard to other studies, as reported by Pereg and colleagues (2013a), there
are two studies which showed only limited transfer of cued task-switching training. The
first of these studies is a Ph.D. work of Armony-Shimoni (2001). “In Armony-Shimoni's
Ph.D. study, participants were trained on the randomized-runs paradigm (Altmann and
Gray, 2002, Altmann and Gray, 2008 and Gopher et al., 2000) in which task-cues
appeared at the beginning of runs of trials varying in length between 4 and 12 trials. The
results indicated some transfer of training effects across different kinds of stimuli (e.g.,
from letters to digits) or across different computational operations as long as they
131
belonged to the same modality, such as spatial processing (e.g., from comparing which
one of two groups has more items to evaluating whether a group has more or less than
five items). However, when the processing mode changed (e.g., from spatial to semantic)
or when the judgment goals changed (e.g., from judging high-vs.-low to judging odd-vs.even) no transfer of training was found” (cf. Pereg et al., 2013a, p. 468.).
The second study showing limited transfer of task-switching is a master thesis
from Sosna (2001). “Sosna's Master's Thesis included 2 experiments in which
participants were trained in a cued-TS paradigm involving two spatial location tasks (updown and right-left). In Experiment 1, there were three training sessions and switch
probability varied between training groups. In Experiment 2 (6 training sessions),
different versions of the training paradigm were used. In both experiments the switch
costs were subjected to training effects but not to transfer effects” (cf. Pereg et al., 2013a,
p. 468).
The differences between ours and Karbach and Kray’s study and the above two
are that we and Karbach and Kray used an alternating-runs task-switching paradigm,
while they used cued task-switching paradigms. The previously mentioned study by von
Bastian and colleagues also used cues to indicate upcoming task sets, whereas in Karbach
and Kray’s study it was uncued. In our study, we had both cued and uncued conditions.
However, this was not decisive from the perspective of far-transfer effects. On the other
hand we also changed stimuli from pictorial to characters, as I mentioned previously. It
might imply that it is important to have stimuli inducing high inhibition, but it is also
important for the task-switching to go uncued, so that there is higher demand for
updating. One can argue that when task switching goes uncued it resembles more of a
multitask setting because participants are engaged in two processes simultaneously.
132
Further studies could investigate this issue to provide more insight into the role of
updating processes.
COMPARING DIFFERENT PARADIGMS
Stimulus complexity
We should consider the similarities and differences between studies in the stimuli
and task-sets used. In our experiment stimuli consisted of characters, such as digits and
letters, and task-sets were based on decisions regarding these characters, such as parity
decision, magnitude decisions, etc. In Karbach and Kray’s study, ambiguous stimuli were
used, and these were pictorial, and both task-sets were bound to a simple picture. It is
reasonable to assume that there is a much higher level of interference in that case than in
the present study, where interference is a bit lighter, coming from two characters standing
next to each other. By focusing selective spatial attention to the relevant character on the
left or the right the interference from the irrelevant character could have been arguably
smaller in the present study than it was in the study of Karbach and Kray. Nevertheless,
in our study there was still a significant difference between bivalent groups and univalent
groups with regard to switch and mixing costs, as we could see during the training and
also in the transfer of older adults’ mixing costs. What would have been better in our
study is to use during training not digit-digit-letter-letter task, but only digit tasks, for
instance, using a sequence like parity-parity-magnitude-magnitude, such that one
stimulus, a number, would be bound with both task sets. That would have been
equivalent with regard to interference with Karbach and Kray’s study.
In the study by Zinke and colleagues (2012), there were two different versions of
task-switching tasks at pretest and posttest. One of them was very similar to that used
during training, an alternating-runs task-switching paradigm, using similar stimuli
133
(pictorial). The other was a random-cued task-switching paradigm, with different stimuli
(numerical). In the similar task-switching paradigm they were able to replicate transfer
effects with regard to mixing costs, but not with regard to switch costs, which is similar
to our results from the older participants. However, in the random-cued task-switching
paradigm with numerical stimuli no transfer effects were found.
The lack of near-transfer effects in younger adults in our study is in line with the
results of the study by Minear and Shah (2008) in which they showed no transfer (either
switch or mixing costs reduction) from a predictable task-switching training to a similar
predictable task-switching paradigm. In one of their experiment, there was no difference
between a predictable switching, a random switching and a control group with regard to
transfer in a predictable switching paradigm. More importantly, task-sets and stimulus
complexity was similar to ours (such as: odd-even, consonant-vowel, uppercaselowercase, greater than-less than, etc. decisions). The only transferable gain in their
experiments was mixing cost reductions from unpredictable task-switching paradigms to
similar unpredictable task-switching paradigms, but not from a predictable to an
unpredictable paradigm.
Training duration
In general, it should be assumed that transfer effects are proportional to training
improvements in the practiced tasks, and many training studies have indeed found such a
relationship (Anguera et al., 2013; Basak et al., 2008; Jaeggi et al., 2008). It also should
be noted however, that most training studies have found transfer effects only after
extensive practice (>20 hours). In contrast, we used a relatively short training (1,5-2
hours). Minear and Shah (2008) used a comparable amount of training (1152 trials). The
study by Zinke et al. (2012) used even less, only three training sessions. The presence of
134
near transfer effects even after such a short training in older adults is encouraging, and it
would be interesting to know how far older adults’ performance might be improved with
more extensive training. Furthermore, the short training duration coupled with a decrease
in task difficulty might be responsible for the lack of far-transfer effects in the present
study as compared to previous studies (Karbach & Kray, 2009).
Training difficulty
While in our study the training difficulty was not adaptive, other studies used
adaptive training designs to achieve far-transfer effects (e.g., Anguera et al., 2013; Jaeggi
et al., 2008). With regard to updating training with n-back tasks Jaeggi (2008) argues that
updating demands need to be kept high throughout training in order for updating
processes to improve. Another study with working memory training directly compared
the effectiveness of adaptive and non-adaptive regimens (Brehmer, Westerberg, &
Bäckman, 2012) and showed that adaptive training results in generally larger transfer
gains. In contrast, the task-switching trainings applied in the previously mentioned
studies did not fulfill that criterion with the exception of von Bastian and colleagues
(2013). They used a more intensive (20 sessions, 30-40 min / session), adaptive training,
with three different stimulus dimensions (pictorial, verbal and figural, i.e., cliparts,
words, and simple geometrical shapes respectively). Also, as there were more sessions,
new task sets were introduced every fourth session to keep participants motivated and
enhance variability of training. Future task-switching training studies should therefore
apply adaptive training paradigms.
Control groups
As mentioned in the introduction the implementation of proper control groups in
training studies is essential. However, there were differences in the training studies with
135
regard to what kind of control groups they used, and these differences might be important
to keep in mind as we compare the separate studies. In the study by von Bastian and
colleagues (2013), the active control group did not perform single-task blocks as in the
Karbach study. Their task comprised three visual matching tasks (face matching, digit
matching, pattern matching). Training for this control group was also adaptive, which
meant reducing the allowed time to respond as participants improved their performance.
The study by Zinke at al. (2012) included a task-switching training group and a nocontact control group. Matching of control groups to experimental groups is also often
carried out based on only a subset of the tests that are eventually used during
comparisons. The present study was relatively well controlled in that respect compared to
other studies, and it is recommended for future studies as well to use a comprehensive
matching along all measures.
MAINTENANCE OF TRAINING GAINS
With regard to the maintenance of the training gains, our results showed enhanced
task-switching performance in older adults in high-inhibition groups compared to lowinhibition groups which lasted at least up to six months. This is a novel finding as
previous studies with task-switching training did not look for maintenance of training
gains. This result is important, as it indicates that the plasticity of cognitive control
functions achieved by the training is not a transient phenomenon, and joins studies which
showed maintenance effects after training (e.g., Brehmer et al., 2012; Dahlin, Nyberg, et
al., 2008; Li et al., 2008).
INDIVIDUAL AND GROUP LEVEL TRAINING GAINS
In studies of cognitive training we often look for differences on the group level.
However, individual variability in training gains of a given regimen can be also an
136
important aspect. Individual differences in the amount of training gains can be substantial
(Bissig & Lustig, 2007), and training benefits are often smaller for those individuals who
are cognitively more impaired. There is evidence for instance, that memory plasticity
decreases monotonically with advancing age (Verhaeghen et al., 1992). Our results
indicate that there is a strong correlation between mixing costs at baseline and pre-post
gain in mixing costs. This means that those individuals who have more problems at
baseline improve more, which is an encouraging finding from the perspective of remedial
applications.
FUTURE DIRECTIONS - MECHANISM OF CHANGE WITH TRAINING IN OLDER ADULTS
In this study we measured reaction times and try to decipher changes in cognitive
functions. However, direct measurements of the brain could complement our studies and
give additional information about cognitive aging. Multiple studies have indicated that
the prefrontal cortex plays a key role in cognitive control by modulating activity of
diverse brain areas (Miller, 2000). The exact mechanism for this long range modulation is
not entirely known, but inter-areal phase synchronization between distributed neural
populations is likely to play an important role in the process (Varela, Lachaux,
Rodriguez, & Martinerie, 2001). It has also been demonstrated that working memory
training increases prefrontal and parietal activity (Olesen, Westerberg, & Klingberg,
2004) and that during working memory performance increasing memory load strengthens
frontoparietal phase synchrony (Palva, Monto, Kulashekhar, & Palva, 2010). It might be
postulated, that with older age top-down biasing of functional networks is diminished
which leads to impaired cognitive performance. It has been shown that frontal thetapower and long-range theta-coherence is positively correlated with improved task
performance after multitask training in older adults, and that older adults show more
137
youth like patterns of theta-activity after training (Anguera et al., 2013). Slow wave theta
synchrony of distributed neural networks is indeed a likely signature of cognitive control
(Mizuhara & Yamaguchi, 2007; Schroeder & Lakatos, 2009; Womelsdorf, Johnston,
Vinck, & Everling, 2010; Womelsdorf, Vinck, Leung, & Everling, 2010), and might play
an important role in our understanding of the mechanism of age-related and trainingrelated changes in cognitive control. Future studies might focus more on these
physiological aspects which are so far largely underexplored.
138
LIMITATIONS OF THE STUDY
Selection of sample was not representative to the population. Our young adults
were mainly psychology students. Furthermore, there are many disadvantages of a crosssectional study in comparison to a longitudinal study (Raz & Lindenberger, 2011;
Salthouse, 2011). Age-differences in measurements might be attributed to factors other
than the effects of aging on the brain.
We often find age-related decline in cross-sectional comparisons of cognitive
measures (e.g. see review by Hedden & Gabrieli, 2004). We might uncritically make the
assumption that progressive age is related with mental deterioration. However, we should
have good explanations of how and why specific factors, such as specific changes in
brain volume or function, might cause changes in cognitive behavior. There can be many
competing explanations for differences between groups in cross-sectional studies that can
fit certain empirical findings equally well or even better than simply assuming age as the
causal agent. Not addressing these issues might hinder our progress towards
understanding cognitive aging. If one approaches the field with the mindset that there
must be age-related differences, one will easily find evidence in a cross-sectional dataset.
But one has to be always critical keeping in mind alternative explanations. In the specific
field of task-switching longitudinal studies are still lacking, and so a precise estimate of
age related decline in task-switching performance remains to be elucidated; although at
present there are no good alternative explanations for the observed cross sectional
differences than assuming progressive impairment of performance with the aging brain.
139
CONCLUSION
There is a growing body of literature investigating the transfer effects of cognitive
trainings, and remedial applications of such trainings in the elderly (Anguera et al., 2013;
Karbach & Kray, 2009). It is important to understand which aspects of cognition show
age-related decline, the extent to which such decline can be prevented, and how to restore
cognitive function to levels observed in younger adults. The present study was designed
to uncover which cognitive control processes contribute to general training related
improvements and elucidated important factors that need to be minded in future training
studies. Specifically, our findings lend support to the idea that cognitive control can be
enhanced in high-interference dual-task contexts in the elderly. Interference resolution
seems to be the most likely factor that underlies age related cognitive impairments, but
our study suggests that it can be improved through training with paradigms such as taskswitching featuring bivalent stimuli. Furthermore, we suggest that stimulus complexity is
an important factor in driving transfer effects that should be further examined in future
studies. We found no far transfer effects, which seems to be in agreement with recent
task-switching studies. However, other studies with high-interference multitasking
paradigms involving engaging complex stimuli did find far-transfer effects. Thus, we
believe that designing engaging training programs in keeping with the present theoretical
considerations (i.e. importance of interference level) might be a fruitful approach to
counteract cognitive aging. Lastly, the maintenance of transfer gains after six months also
points towards the practical applicability of the present approach.
140
Appendices
Table 15 Mean reaction times (ms) as a function of Session (1, 2, 3, 4), Age (younger
adults, older adults), Group (Group 2, Group 3, Group 4, Group 5) and Trial (stay,
switch)
Training
Group
Training 1
Stay
Switch
M
SD
M
SD
Session
Training 2
Training 3
Stay
Switch
Stay
Switch
M
SD
M
SD
M
SD
M
SD
Group 2
Group 3
Group 4
Group 5
592
724
595
703
63
94
129
122
721
950
757
939
122
210
211
222
537
627
536
613
56
89
86
78
Group 2
Group 3
Group 4
Group 5
848
1110
866
1104
181
280
198
223
1020
1329
1119
1440
244
373
329
247
712
997
777
968
112
245
192
179
Younger adults
94
508
151 574
135 519
191 577
Older adults
805
156 663
1155 333 903
952
365 705
1251 233 888
614
758
628
775
M
Stay
Training 4
Switch
SD
M
SD
47
68
81
83
557
667
591
700
74
110
124
180
501
565
514
564
52
79
81
78
540
652
574
667
70
121
111
159
100
197
124
160
735
1033
828
1080
133
273
221
210
651
855
688
847
93
209
123
154
715
979
798
1056
111
267
221
243
Table 16 Percentage of correct trials (%) as a function of Session (1, 2, 3, 4), Age
(younger adults, older adults), Group (Group 2, Group 3, Group 4, Group 5) and Trial
(stay, switch)
Training 1
Stay
Switch
M
SD
M
SD
Session
Training 2
Training 3
Stay
Switch
Stay
Switch
M
SD
M
SD
M
SD
M
SD
Group 2
Group 3
Group 4
Group 5
96
96
96
95
3.39
2.92
3.36
4.24
91
91
90
91
5.71
5.75
5.29
6.55
95
96
95
97
3.73
2.61
3.22
2.25
93
93
93
94
Group 2
Group 3
Group 4
Group 5
99
94
98
95
1.04
8.14
2.84
4.01
96
92
95
92
2.95
8.60
3.81
4.93
99
98
99
97
0.98
1.23
1.03
2.90
97
95
97
95
Training
Group
Younger adults
5.95 96 3.09
3.60 95 2.92
4.34 95 4.09
3.82 96 2.74
Older adults
2.18 99 0.63
4.05 99 1.10
3.33 99 0.62
4.25 98 1.88
141
Training 4
Stay
Switch
M
SD
M
SD
94
95
93
94
4.78
3.85
4.80
3.31
95
95
95
95
3.47
3.13
5.02
2.97
93
95
92
94
6.73
2.92
4.74
4.05
97
96
97
96
1.48
2.74
2.36
2.66
99
99
100
98
0.83
1.51
0.51
1.66
97
97
98
97
2.06
2.99
2.26
1.73
Table 17 Mean reaction times (M) and standard deviations (SD) of the Color Stroop test
for each trial type (neutral, incongruent) for each training group at pretest and posttest.
Group
Group 1 (n = 16)
Group 2 (n = 16)
Group 3 (n = 16)
Group 4 (n = 16)
Group 5 (n = 16)
Group 1 (n = 17)
Group 2 (n = 17)
Group 3 (n = 14)
Group 4 (n = 16)
Group 5 (n = 16)
Pretest
Posttest
Neutral Incongruent Neutral Incongruent
M SD
M
SD
M SD
M
SD
Younger adults
618 80
657 101 584 83
611
88
602 65
630
99 585 116 604 120
616 93
629 117 565 82
601
90
598 89
635
97 601 104 624 110
621 107 648
94 600 86
616
88
Older adults
862 122 984 139 829 142 934 152
947 175 1032 203 860 120 966 167
836 146 909 154 809 122 870 121
959 118 1071 179 928 121 1015 153
894 128 1005 171 877 99 1008 137
Table 18 Mean reaction times (M) and standard deviations (SD) of the Number Stroop
test for each trial type (neutral, incongruent) for each training group at pretest and
posttest.
Group
Group 1 (n = 16)
Group 2 (n = 16)
Group 3 (n = 16)
Group 4 (n = 16)
Group 5 (n = 16)
Group 1 (n = 17)
Group 2 (n = 17)
Group 3 (n = 14)
Group 4 (n = 16)
Group 5 (n = 16)
Pretest
Posttest
Neutral
Incongruent Neutral Incongruent
M
SD
M
SD
M SD
M
SD
Younger adults
638 84
651
79 599 67 614
67
659 92
679 114 616 79 624
80
613 71
649
80 583 75 596
85
650 148 661 159 611 91 635 111
628 68
655
79 593 69 606
73
Older adults
979 136 985 124 923 143 956 156
1051 153 1084 152 945 137 977 130
953 120 957 113 906 113 939 139
1011 138 1043 146 973 162 978 165
962 134 1010 148 929 115 943 127
142
Table 19 Mean percentage correct trials (M) and standard deviations (SD) of the Color
Stroop test for each trial type (neutral, incongruent) for each training group at pretest and
posttest.
Group
Group 1 (n = 16)
Group 2 (n = 16)
Group 3 (n = 16)
Group 4 (n = 16)
Group 5 (n = 16)
Group 1 (n = 17)
Group 2 (n = 17)
Group 3 (n = 14)
Group 4 (n = 16)
Group 5 (n = 16)
Pretest
Posttest
Neutral Incongruent Neutral Incongruent
M SD M
SD
M SD
M
SD
Younger adults
97 3.59 95
6.44 95 3.78 93
5.34
96 4.25 95
5.19 92 6.91 92
7.56
97 2.85 95
4.38 95 4.56 94
4.11
96 6.24 94
3.86 92 5.35 93
6.63
97 2.34 96
3.76 96 2.99 94
6.56
Older adults
97 3.90 91
9.18 98 3.75 95
7.33
97 5.05 90 16.77 99 2.23 97
4.75
98 1.91 97
4.42 99 2.33 98
2.33
99 2.25 92
8.54 98 2.27 96
5.19
97 3.46 93
7.72 98 2.77 95
5.47
Table 20 Mean percentage correct trials (M) and standard deviations (SD) of the Number
Stroop test for each trial type (neutral, incongruent) for each training group at pretest and
posttest.
Group
Group 1 (n = 16)
Group 2 (n = 16)
Group 3 (n = 16)
Group 4 (n = 16)
Group 5 (n = 16)
Group 1 (n = 17)
Group 2 (n = 17)
Group 3 (n = 14)
Group 4 (n = 16)
Group 5 (n = 16)
Pretest
Posttest
Neutral Incongruent Neutral Incongruent
M SD M
SD
M SD
M
SD
Younger adults
96 4.49 92
5.70 96 3.76 93
6.43
96 6.45 89
7.39 94 5.10 91
6.94
97 7.56 93 12.60 95 3.61 90
6.68
97 8.30 92 10.27 93 5.17 89
7.99
97 3.86 95
4.49 94 4.82 95
5.17
Older adults
97 4.06 90
8.61 97 2.81 92
7.31
96 4.21 91
6.72 97 2.68 95
4.00
98 3.71 91
8.92 97 3.77 93
7.60
96 4.82 92
8.22 97 4.34 94
7.13
96 3.99 94
5.13 96 4.60 94
6.24
143
Table 21 2-back mean (M) scores and standard deviations (SD) for younger and older
adults separately for each training group at pretest and posstest.
Group 1
Group 2
single task –
bivalent stimuli
cued switching –
univalent stimuli
Younger adults
Older adults
13.38 (6.96)
11.00 (7.32)
12.27 (8.05)
12.25 (7.57)
Younger adults
Older adults
15.75 (5.32)
13.24 (6.86)
14.13 (5.08)
14.13 (5.60)
Age group
M (SD)
Training group
Group 3
cued switching –
bivalent stimuli
M (SD)
M (SD)
Pretest
11.14 (7.13)
10.79 (7.68)
Posttest
13.47 (6.78)
13.21 (6.00)
Group 4
Group 5
uncued switching
– univalent stimuli
uncued switching
– bivalent stimuli
10.94 (8.55)
12.50 (6.92)
15.53 (5.26)
12.40 (8.44)
12.19 (7.49)
10.69 (7.99)
16.33 (5.43)
15.00 (4.10)
M (SD)
M (SD)
Table 22 3-back mean (M) scores and standard deviations (SD) for younger adults
separately for each training group at pretest and posstest.
Group 1
Group 2
single task –
bivalent stimuli
n=(14)
cued switching –
univalent stimuli
n=(13)
1.07 (7.77)
4.46 (3.45)
4.36 (8.47)
6.08 (4.37)
M (SD)
M (SD)
Training group
Group 3
cued switching –
bivalent stimuli
n=(15)
M (SD)
Pretest
1.80 (5.88)
Posttest
4.13 (5.72)
Group 4
Group 5
uncued switching
– univalent stimuli
n=(16)
uncued switching
– bivalent stimuli
n=(14)
2.31 (7.10)
6.14 (5.07)
3.94 (7.53)
6.29 (4.34)
M (SD)
M (SD)
Table 23 Working Memory aggregated scores (M) and standard deviations (SD) for
younger and older adults separately for each training group at pretest and posttest.
Group 1
Group 2
single task –
bivalent stimuli
cued switching –
univalent stimuli
Younger adults
Older adults
5.02 (.74)
4.79 (.99)
4.92 (1.12)
4.59 (.81)
Younger adults
Older adults
4.98 (.80)
4.50 (1.11)
5.27 (1.01)
4.57 (1.12)
Age group
M (SD)
M (SD)
144
Training group
Group 3
cued switching –
bivalent stimuli
M (SD)
Pretest
4.83 (1.27)
4.44 (1.07)
Posttest
4.86 (.93)
4.25 (.92)
Group 4
Group 5
uncued switching
– univalent stimuli
uncued switching
– bivalent stimuli
5.03 (1.01)
4.22 (1.26)
4.77 (1.09)
4.43 (.95)
5.12 (.92)
4.30 (.97)
5.17 (1.27)
4.47 (.92)
M (SD)
M (SD)
Table 24 Raven mean (M) scores and standard deviations (SD) for younger and older
adults separately for each training group at pretest and posstest.
Group 1
Group 2
single task –
bivalent stimuli
cued switching –
univalent stimuli
Younger adults
Older adults
10.93 (2.43)
5.28 (2.32)
11.25 (3.19)
5.27 (2.22)
Younger adults
Older adults
11.00 (1.56)
5.33 (2.20)
9.81 (3.23)
5.00 (2.04)
Age group
M (SD)
Training group
Group 3
cued switching –
bivalent stimuli
M (SD)
M (SD)
Pretest
11.44 (2.16)
5.33 (2.26)
Posttest
11.50 (1.79)
4.67 (1.76)
Group 4
Group 5
uncued switching
– univalent stimuli
uncued switching
– bivalent stimuli
11.47 (2.37)
4.69 (2.68)
11.63 (2.66)
4.88 (2.55)
10.00 (2.76)
4.38 (1.15)
10.50 (2.58)
5.00 (2.13)
M (SD)
M (SD)
Table 25 BOMAT mean (M) scores and standard deviations (SD) for older adults
separately for each training group at pretest and posstest.
Group 1
Group 2
single task –
bivalent stimuli
n=(18)
cued switching –
univalent stimuli
n=(16)
5.17 (2.64)
4.63 (3.44)
6.67 (2.95)
6.81 (2.20)
M (SD)
M (SD)
Training group
Group 3
cued switching –
bivalent stimuli
n=(15)
M (SD)
Pretest
5.80 (2.54)
Posttest
5.80 (2.65)
Group 4
Group 5
uncued switching
– univalent stimuli
n=(16)
uncued switching
– bivalent stimuli
n=(17)
5.56 (2.03)
5.65 (2.40)
6.94 (2.11)
5.29 (3.04)
M (SD)
145
M (SD)
Table 26 Counting span mean percentage of correct trials (M) and standard deviations
(SD) for younger and older adults separately for each training group at pretest and
posttest.
Group 1
Group 2
single task –
bivalent stimuli
Age group
M (SD)
cued switching –
univalent stimuli
Younger adults
Older adults
82 (9)
76 (15)
82 (14)
72 (12)
Younger adults
Older adults
83 (12)
73 (15)
86 (14)
76 (19)
M (SD)
Training group
Group 3
cued switching –
bivalent stimuli
M (SD)
Pretest
81 (13)
77 (17)
Posttest
80 (14)
77 (11)
Group 4
Group 5
uncued switching
– univalent stimuli
uncued switching
– bivalent stimuli
82 (11)
74 (13)
78 (12)
69 (11)
81 (11)
81 (11)
80 (12)
74 (16)
M (SD)
M (SD)
100
90
80
% correct
70
60
50
Pretest
40
Posttest
30
20
10
0
Single
Switch
Younger adults
Single
Switch
Older adults
Figure 27 Counting span mean performance (% correct) as a function of age group
(younger adults, older adults), Training group (single, switch) and Session (pretest,
posttest). Error bars refer to the standard errors of the mean.
146
Table 27 Reading span mean percentage of correct trials (M) and standard deviations
(SD) for younger and older adults separately for each training group at pretest and
posttest.
Group 1
Group 2
single task –
bivalent stimuli
Age group
M (SD)
cued switching –
univalent stimuli
Younger adults
Older adults
81 (10)
74 (14)
76 (14)
73 (15)
Younger adults
Older adults
77 (12)
66 (16)
78 (15)
71 (14)
M (SD)
Training group
Group 3
cued switching –
bivalent stimuli
M (SD)
Pretest
78 (13)
73 (14)
Posttest
78 (16)
71 (17)
Group 4
Group 5
uncued switching
– univalent stimuli
uncued switching
– bivalent stimuli
76 (18)
77 (12)
76 (15)
72 (16)
79 (15)
71 (14)
82 (10)
70 (19)
M (SD)
M (SD)
100
90
80
% correct
70
60
50
Pretest
40
Posttest
30
20
10
0
Single
Switch
Younger adults
Single
Switch
Older adults
Figure 28 Reading span mean performance (% correct) as a function of age group
(younger adults, older adults), Training group (single, switch) and Session (pretest,
posttest). Error bars refer to the standard errors of the mean.
147
Table 28 Digit backwards mean (M) scores and standard deviations (SD) for younger and
older adults separately for each training group at pretest and posstest.
Group 1
Group 2
single task –
bivalent stimuli
cued switching –
univalent stimuli
Younger adults
Older adults
8.75 (2.18)
7.17 (1.62)
8.53 (1.68)
6.00 (2.88)
Younger adults
Older adults
9.87 (2.22)
7.50 (2.38)
8.87 (1.88)
6.73 (2.66)
M (SD)
Age group
M (SD)
Training group
Group 3
cued switching –
bivalent stimuli
M (SD)
Pretest
8.67 (2.55)
6.27 (1.94)
Posttest
9.67 (2.23)
6.73 (1.83)
Group 4
Group 5
uncued switching
– univalent stimuli
uncued switching
– bivalent stimuli
8.29 (2.62)
5.25 (2.11)
8.67 (1.95)
6.94 (2.86)
8.76 (2.95)
6.00 (2.13)
10.07 (3.92)
7.06 (2.51)
M (SD)
M (SD)
12.0
Correct trials
10.0
8.0
6.0
Pretest
Posttest
4.0
2.0
0.0
Single
Switch
Younger adults
Single
Switch
Older adults
Figure 29 Digit backward mean performance (correct trials) as a function of age group
(younger adults, older adults), Training group (single, switch) and Session (pretest,
posttest). Error bars refer to the standard errors of the mean.
148
References
Alloway, T. P., & Alloway, R. G. (2010). Investigating the predictive roles of working
memory and IQ in academic attainment. Journal of Experimental Child
Psychology, 106(1), 20–29. doi:10.1016/j.jecp.2009.11.003
Allport, D. A., Styles, E. A., & Hsieh, S. (1994). Shifting intentional set: Exploring the
dynamic control of tasks. In C. Umiltà & M. Moscovitch (Eds.), Attention and
performance 15: Conscious and nonconscious information processing. (pp. 421–
452). Cambridge, MA US: The MIT Press.
Anguera, J. A., Boccanfuso, J., Rintoul, J. L., Al-Hashimi, O., Faraji, F., Janowich, J.,
Gazzaley, A. (2013). Video game training enhances cognitive control in older
adults. Nature, 501(7465), 97–101. doi:10.1038/nature12486
Baddeley, A. (2003). Working memory: looking back and looking forward. Nature
Reviews Neuroscience, 4(10), 829–839. doi:10.1038/nrn1201
Ball, M. J. (1977). Neuronal loss, neurofibrillary tangles and granulovacuolar
degeneration in the hippocampus with ageing and dementia. Acta
Neuropathologica, 37(2), 111–118. doi:10.1007/BF00692056
Baltes, P. B. (1987). Theoretical propositions of life-span developmental psychology: On
the dynamics between growth and decline. Developmental Psychology, 23(5),
611.
Baltes, P. B., & Kliegl, R. (1992). Further testing of limits of cognitive plasticity:
Negative age differences in a mnemonic skill are robust. Developmental
Psychology, 28(1), 121–125. doi:10.1037/0012-1649.28.1.121
149
Baltes, P. B., Kliegl, R., & Dittmann-Kohli, F. (1988). On the locus of training gains in
research on the plasticity of fluid intelligence in old age. Journal of Educational
Psychology, 80(3), 392–400. doi:10.1037/0022-0663.80.3.392
Baltes, P. B., & Lindenberger, U. (1988). On the range of cognitive plasticity in old age
as a function of experience: 15 years of intervention research. Behavior Therapy,
19(3), 283–300. doi:10.1016/S0005-7894(88)80003-0
Baltes, P. B., Lindenberger, U., & Staudinger, U. M. (2006). Life Span Theory in
Developmental Psychology. In R. M. Lerner & W. Damon (Eds.), Handbook of
child psychology (6th ed.): Vol 1, Theoretical models of human development. (pp.
569–664). Hoboken, NJ US: John Wiley & Sons Inc.
Baltes, P. B., Sowarka, D., & Kliegl, R. (1989). Cognitive training research on fluid
intelligence in old age: What can older adults achieve by themselves? Psychology
and Aging, 4(2), 217–221. doi:10.1037/0882-7974.4.2.217
Barnett, S. M., & Ceci, S. J. (2002). When and where do we apply what we learn?: A
taxonomy for far transfer. Psychological Bulletin, 128(4), 612–637.
doi:10.1037/0033-2909.128.4.612
Basak, C., Boot, W. R., Voss, M. W., & Kramer, A. F. (2008). Can training in a real-time
strategy video game attenuate cognitive decline in older adults? Psychology and
Aging, 23(4), 765–777. doi:10.1037/a0013494
Bengtsson, S. L., Nagy, Z., Skare, S., Forsman, L., Forssberg, H., & Ullén, F. (2005).
Extensive piano practicing has regionally specific effects on white matter
development. Nature Neuroscience, 8(9), 1148–1150. doi:10.1038/nn1516
150
Bherer, L., Kramer, A. F., Peterson, M. S., Colcombe, S., Erickson, K., & Becic, E.
(2005). Training effects on dual-task performance: Are there age-related
differences in plasticity of attentional control? Psychology and Aging, 20(4), 695–
709. doi:10.1037/0882-7974.20.4.695
Bialystok, E., & Craik, F. I. M. (2006). Lifespan Cognition: Mechanisms of Change.
Oxford University Press.
Bishop, N. A., Lu, T., & Yankner, B. A. (2010). Neural mechanisms of ageing and
cognitive decline. Nature, 464(7288), 529–535. doi:10.1038/nature08983
Bissig, D., & Lustig, C. (2007). Who Benefits From Memory Training? Psychological
Science (Wiley-Blackwell), 18(8), 720–726.
Blieszner, R., Willis, S. L., & Baltes, P. B. (1981). Training research in aging on the fluid
ability of inductive reasoning. Journal of Applied Developmental Psychology,
2(3), 247–265. doi:10.1016/0193-3973(81)90005-8
Boot, W. R., Basak, C., Erickson, K. I., Neider, M., Simons, D. J., Fabiani, M., Kramer,
A. F. (2010). Transfer of skill engendered by complex task training under
conditions of variable priority. Acta Psychologica, 135(3), 349–357.
doi:10.1016/j.actpsy.2010.09.005
Boyke, J., Driemeyer, J., Gaser, C., Büchel, C., & May, A. (2008). Training-Induced
Brain Structure Changes in the Elderly. The Journal of Neuroscience, 28(28),
7031–7035. doi:10.1523/JNEUROSCI.0742-08.2008
151
Braver, T. S. (2012). The variable nature of cognitive control: a dual mechanisms
framework. Trends in Cognitive Sciences, 16(2), 106–113.
doi:10.1016/j.tics.2011.12.010
Braver, T. S., & Barch, D. M. (2002). A theory of cognitive control, aging cognition, and
neuromodulation. Neuroscience & Biobehavioral Reviews, 26(7), 809–817.
Brehmer, Y., Li, S.-C., Straube, B., Stoll, G., von Oertzen, T., Müller, V., &
Lindenberger, U. (2008). Comparing memory skill maintenance across the life
span: Preservation in adults, increase in children. Psychology and Aging, 23(2),
227–238. doi:10.1037/0882-7974.23.2.227
Brehmer, Y., Westerberg, H., & Bäckman, L. (2012). Working-memory training in
younger and older adults: training gains, transfer, and maintenance. Frontiers in
Human Neuroscience, 6. doi:10.3389/fnhum.2012.00063
Burgess, G. C., Gray, J. R., A, R., & Braver, T. S. (2011). Neural mechanisms of
interference control underlie the relationship between fluid intelligence and
working memory span. Journal of Experimental Psychology: General, 140(4),
674–692. doi:10.1037/a0024695
Burke, S. N., & Barnes, C. A. (2006). Neural plasticity in the ageing brain. Nat Rev
Neurosci, 7(1), 30–40. doi:10.1038/nrn1809
Casey, B. J., Tottenham, N., Liston, C., & Durston, S. (2005). Imaging the developing
brain: what have we learned about cognitive development? Trends in Cognitive
Sciences, 9(3), 104–110. doi:10.1016/j.tics.2005.01.011
152
Castel, A. D., Pratt, J., & Drummond, E. (2005). The effects of action video game
experience on the time course of inhibition of return and the efficiency of visual
search. Acta Psychologica, 119(2), 217–230. doi:10.1016/j.actpsy.2005.02.004
Cepeda, N. J., Kramer, A. F., & Gonzalez de Sather, J. C. M. (2001). Changes in
executive control across the life span: Examination of task-switching
performance. Developmental Psychology, 37(5), 715–730. doi:10.1037/00121649.37.5.715
Clapp, W. C., Rubens, M. T., Sabharwal, J., & Gazzaley, A. (2011). Deficit in switching
between functional brain networks underlies the impact of multitasking on
working memory in older adults. Proceedings of the National Academy of
Sciences, 108(17), 7212 –7217. doi:10.1073/pnas.1015297108
Cohen, J. (1988). Statistical Power Analysis for the Behavioral Sciences. Psychology
Press.
Cohen, J. D., Botvinick, M., & Carter, C. S. (2000). Anterior cingulate and prefrontal
cortex: who’s in control? Nature Neuroscience, 3(5), 421–423. doi:10.1038/74783
Cole, M. W., Reynolds, J. R., Power, J. D., Repovs, G., Anticevic, A., & Braver, T. S.
(2013). Multi-task connectivity reveals flexible hubs for adaptive task control.
Nature Neuroscience, 16(9), 1348–1355. doi:10.1038/nn.3470
Coleman, P. D., & Flood, D. G. (1987). Neuron numbers and dendritic extent in normal
aging and Alzheimer’s disease. Neurobiology of Aging, 8(6), 521–545.
doi:10.1016/0197-4580(87)90127-8
153
Collette, F., Van der Linden, M., Laureys, S., Delfiore, G., Degueldre, C., Luxen, A., &
Salmon, E. (2005). Exploring the unity and diversity of the neural substrates of
executive functioning. Human Brain Mapping, 25(4), 409–423.
doi:10.1002/hbm.20118
Colom, R., Román, F. J., Abad, F. J., Shih, P. C., Privado, J., Froufe, M., Jaeggi, S. M.
(2013). Adaptive n-back training does not improve fluid intelligence at the
construct level: Gains on individual tests suggest that training may enhance
visuospatial processing. Intelligence, 41(5), 712–727.
doi:10.1016/j.intell.2013.09.002
Colzato, L. S., Wouwe, N. C. van, Lavender, T. J., & Hommel, B. (2006). Intelligence
and cognitive flexibility: Fluid intelligence correlates with feature “unbinding”
across perception and action. Psychonomic Bulletin & Review, 13(6), 1043–1048.
doi:10.3758/BF03213923
Conway, A. R. A., Kane, M. J., & Engle, R. W. (2003). Working memory capacity and
its relation to general intelligence. Trends in Cognitive Sciences, 7(12), 547–552.
doi:10.1016/j.tics.2003.10.005
Craik, F. I. M., & Bialystok, E. (2006). Cognition through the lifespan: mechanisms of
change. Trends in Cognitive Sciences, 10(3), 131–138.
doi:10.1016/j.tics.2006.01.007
Craik, F. I. M., & Salthouse, T. A. (2000). The Handbook of Aging and Cognition.
Lawrence Erlbaum Associates.
154
Crone, E. A., Wendelken, C., Donohue, S. E., & Bunge, S. A. (2006). Neural Evidence
for Dissociable Components of Task-Switching. Cerebral Cortex, 16(4), 475–
486. doi:10.1093/cercor/bhi127
Dahlin, E., Neely, A. S., Larsson, A., Bäckman, L., & Nyberg, L. (2008). Transfer of
Learning After Updating Training Mediated by the Striatum. Science, 320(5882),
1510–1512. doi:10.1126/science.1155466
Dahlin, E., Nyberg, L., Bäckman, L., & Neely, A. S. (2008). Plasticity of executive
functioning in young and older adults: Immediate training gains, transfer, and
long-term maintenance. Psychology and Aging, 23(4), 720–730.
doi:10.1037/a0014296
Deary, I. J., Penke, L., & Johnson, W. (2010). The neuroscience of human intelligence
differences. Nat Rev Neurosci, 11(3), 201–211. doi:10.1038/nrn2793
Derwinger, A., Neely, A. S., Persson, M., Hill, R. D., & Bäckman, L. (2003).
Remembering Numbers in Old Age: Mnemonic Training Versus Self-Generated
Strategy Training. Aging, Neuropsychology, and Cognition, 10(3), 202–214.
doi:10.1076/anec.10.3.202.16452
Draganski, B., Gaser, C., Busch, V., Schuierer, G., Bogdahn, U., & May, A. (2004).
Neuroplasticity: Changes in grey matter induced by training. Nature, 427(6972),
311–312. doi:10.1038/427311a
Dreher, J.-C., & Berman, K. F. (2002). Fractionating the neural substrate of cognitive
control processes. Proceedings of the National Academy of Sciences, 99(22),
14595 –14600. doi:10.1073/pnas.222193299
155
Ennis, G. E., Hess, T. M., & Smith, B. T. (2013). The impact of age and motivation on
cognitive effort: Implications for cognitive engagement in older adulthood.
Psychology and Aging, 28(2), 495–504. doi:10.1037/a0031255
Ericcson, K. A., Chase, W. G., & Faloon, S. (1980). Acquisition of a memory skill.
Science, 208(4448), 1181–1182. doi:10.1126/science.7375930
Falkenstein, M., Hoormann, J., & Hohnsbein, J. (2002). Inhibition-Related ERP
Components: Variation with Modality, Age, and Time-on-Task. Journal of
Psychophysiology, 16(3), 167–175. doi:10.1027//0269-8803.16.3.167
Fisk, J. E., & Sharp, C. A. (2004). Age-Related Impairment in Executive Functioning:
Updating, Inhibition, Shifting, and Access. Journal of Clinical and Experimental
Neuropsychology, 26(7), 874–890. doi:10.1080/13803390490510680
Flynn, J. R. (1987). Massive IQ gains in 14 nations: What IQ tests really measure.
Psychological Bulletin, 101(2), 171 – 191.
Friedman, N. P., Miyake, A., Corley, R. P., Young, S. E., DeFries, J. C., & Hewitt, J. K.
(2006). Not All Executive Functions Are Related to Intelligence. Psychological
Science (Wiley-Blackwell), 17(2), 172–179.
Gajewski, P. D., & Falkenstein, M. (2012). Training-Induced Improvement of Response
Selection and Error Detection in Aging Assessed by Task Switching: Effects of
Cognitive, Physical, and Relaxation Training. Frontiers in Human Neuroscience,
6. doi:10.3389/fnhum.2012.00130
156
Garon, N., Bryson, S. E., & Smith, I. M. (2008). Executive function in preschoolers: A
review using an integrative framework. Psychological Bulletin, 134(1), 31–60.
doi:10.1037/0033-2909.134.1.31
Gazzaley, A., Clapp, W., Kelley, J., McEvoy, K., Knight, R. T., & D’Esposito, M.
(2008). Age-related top-down suppression deficit in the early stages of cortical
visual memory processing. Proceedings of the National Academy of Sciences,
105(35), 13122–13126. doi:10.1073/pnas.0806074105
Gazzaley, A., Cooney, J. W., Rissman, J., & D’Esposito, M. (2005). Top-down
suppression deficit underlies working memory impairment in normal aging. Nat
Neurosci, 8(10), 1298–1300. doi:10.1038/nn1543
Gehring, W. J., Goss, B., Coles, M. G. H., Meyer, D. E., & Donchin, E. (1993). A Neural
System for Error Detection and Compensation. Psychological Science, 4(6), 385–
390. doi:10.1111/j.1467-9280.1993.tb00586.x
Geinisman, Y., Toledo-Morrell, L. de, & Morrell, F. (1986). Loss of perforated synapses
in the dentate gyrus: morphological substrate of memory deficit in aged rats.
Proceedings of the National Academy of Sciences, 83(9), 3027–3031.
Godefroy, O., Cabaret, M., Petit-Chenal, V., Pruvo, J. P., & Rousseaux, M. (1999).
Control functions of the frontal lobes. Modularity of the central-supervisory
system? Cortex; a Journal Devoted to the Study of the Nervous System and
Behavior, 35(1), 1–20.
157
Gottfredson, L. S. (1997). Mainstream science on intelligence: An editorial with 52
signatories, history and bibliography. Intelligence, 24(1), 13–23.
doi:10.1016/S0160-2896(97)90011-8
Grange, J., & Houghton, G. (Eds.). (2014). Task Switching and Cognitive Control. OUP
USA.
Green, C. S., & Bavelier, D. (2003). Action video game modifies visual selective
attention. Nature, 423(6939), 534–537. doi:10.1038/nature01647
Green, C. S., & Bavelier, D. (2008). Exercising your brain: a review of human brain
plasticity and training-induced learning. Psychology and Aging, 23(4), 692–701.
doi:10.1037/a0014345
Green, C. S., Sugarman, M. A., Medford, K., Klobusicky, E., & Bavelier, D. (2012). The
effect of action video game experience on task-switching. Computers in Human
Behavior, 28(3), 984–994. doi:10.1016/j.chb.2011.12.020
Greenwood, P. M. (2007). Functional plasticity in cognitive aging: Review and
hypothesis. Neuropsychology, 21(6), 657–673. doi:10.1037/0894-4105.21.6.657
Hahn, M., Wild-Wall, N., & Falkenstein, M. (2011). Age-related differences in
performance and stimulus processing in dual task situation. Brain Research, 1414,
66–76. doi:10.1016/j.brainres.2011.07.051
Hasher, L., & Zacks, R. T. (1988). Working memory, comprehension, and aging: A
review and a new view. Psychology of Learning and Motivation, 22, 193–225.
Hedden, T., & Gabrieli, J. D. E. (2004). Insights into the ageing mind: a view from
cognitive neuroscience. Nat Rev Neurosci, 5(2), 87–96. doi:10.1038/nrn1323
158
Hedges, L. V., & Olkin, I. (1985). Statistical Methods for Meta-Analysis (1 edition.).
Orlando: Academic Press.
Heinzel, S., Schulte, S., Onken, J., Duong, Q.-L., Riemer, T. G., Heinz, A., Rapp, M. A.
(2014). Working memory training improvements and gains in non-trained
cognitive tasks in young and older adults. Neuropsychology, Development, and
Cognition. Section B, Aging, Neuropsychology and Cognition, 21(2), 146–173.
doi:10.1080/13825585.2013.790338
Hofmann, W., Schmeichel, B. J., & Baddeley, A. D. (2012). Executive functions and
self-regulation. Trends in Cognitive Sciences, 16(3), 174–180.
doi:10.1016/j.tics.2012.01.006
Hossiep, R., & Hasella, M. (2010). Bochumer Matrizentest - Standard. Göttingen,
Hogrefe.
Hughes, C. (2011). Changes and challenges in 20 years of research into the development
of executive functions. Infant and Child Development, 20(3), 251–271.
doi:10.1002/icd.736
Huizinga, M., Dolan, C. V., & van der Molen, M. W. (2006). Age-related change in
executive function: Developmental trends and a latent variable analysis.
Neuropsychologia, 44(11), 2017–2036.
Jaeggi, S. M., Buschkuehl, M., Jonides, J., & Perrig, W. J. (2008). Improving fluid
intelligence with training on working memory. Proceedings of the National
Academy of Sciences, 105(19), 6829–6833. doi:10.1073/pnas.0801268105
159
Jaeggi, S. M., Buschkuehl, M., Jonides, J., & Shah, P. (2011). Short- and long-term
benefits of cognitive training. Proceedings of the National Academy of Sciences,
108(25), 10081 –10086. doi:10.1073/pnas.1103228108
Jaeggi, S. M., Buschkuehl, M., Shah, P., & Jonides, J. (2014). The role of individual
differences in cognitive training and transfer. Memory & Cognition, 42(3), 464–
480.
Jaeggi, S. M., Studer-Luethi, B., Buschkuehl, M., Su, Y.-F., Jonides, J., & Perrig, W. J.
(2010). The relationship between n-back performance and matrix reasoning implications for training and transfer. Intelligence, 38(6), 625–635.
doi:10.1016/j.intell.2010.09.001
Jersild, A. T. (1927). Mental set and shift. Archives of Psychology, 14, 89.
Jurado, M. B., & Rosselli, M. (2007). The elusive nature of executive functions: a review
of our current understanding. Neuropsychology Review, 17(3), 213–233.
doi:10.1007/s11065-007-9040-z
Kane, M. J., Hambrick, D. Z., Tuholski, S. W., Wilhelm, O., Payne, T. W., & Engle, R.
W. (2004). The Generality of Working Memory Capacity: A Latent-Variable
Approach to Verbal and Visuospatial Memory Span and Reasoning. Journal of
Experimental Psychology: General, 133(2), 189–217. doi:10.1037/00963445.133.2.189
Karbach, J. (2008). Potential and limits of executive control training: Age differences in
the near and far transfer of task-switching training. (Doctoral Dissertation).
160
Karbach, J., & Kray, J. (2009). How useful is executive control training? Age differences
in near and far transfer of task-switching training. Developmental Science, 12(6),
978–990. doi:10.1111/j.1467-7687.2009.00846.x
Karbach, J., Mang, S., & Kray, J. (2010). Transfer of task-switching training in older age:
The role of verbal processes. Psychology and Aging, 25(3), 677–683.
doi:10.1037/a0019845
Kiesel, A., Steinhauser, M., Wendt, M., Falkenstein, M., Jost, K., Philipp, A. M., &
Koch, I. (2010). Control and interference in task switching - A review.
Psychological Bulletin, 136(5), 849–874. doi:10.1037/a0019842
Klauer, K. J. (2001). Handbuch Kognitives Training. Hogrefe, Verlag für Psychologie.
Klingberg, T. (2010). Training and plasticity of working memory. Trends in Cognitive
Sciences, 14(7), 317–324. doi:10.1016/j.tics.2010.05.002
Klingberg, T., Fernell, E., Olesen, P. J., Johnson, M., Gustafsson, P., Dahlström, K.,
Westerberg, H. (2005). Computerized Training of Working Memory in Children
With ADHD-A Randomized, Controlled Trial. Journal of the American Academy
of Child & Adolescent Psychiatry, 44(2), 177–186. doi:10.1097/00004583200502000-00010
Kramer, A. F., Hahn, S., & Gopher, D. (1999). Task coordination and aging: explorations
of executive control processes in the task switching paradigm. Acta Psychologica,
101(2–3), 339–378. doi:10.1016/S0001-6918(99)00011-6
161
Kramer, A. F., Humphrey, D. G., Larish, J. F., & Logan, G. D. (1994). Aging and
inhibition: Beyond a unitary view of inhibitory processing in attention.
Psychology and Aging, 9(4), 491–512. doi:10.1037/0882-7974.9.4.491
Kramer, A. F., Larish, J. F., & Strayer, D. L. (1995). Training for attentional control in
dual task settings: A comparison of young and old adults. Journal of
Experimental Psychology: Applied, 1(1), 50–76. doi:10.1037/1076-898X.1.1.50
Kramer, A. F., & Willis, S. L. (2002). Enhancing the cognitive vitality of older adults.
Current Directions in Psychological Science, 11(5), 173–177. doi:10.1111/14678721.00194
Kray, J. (2006). Task-set switching under cue-based versus memory-based switching
conditions in younger and older adults. Brain Research, 1105(1), 83–92.
doi:10.1016/j.brainres.2005.11.016
Kray, J., Eber, J., & Lindenberger, U. (2004). Age differences in executive functioning
across the lifespan: The role of verbalization in task preparation. Acta
Psychologica, 115(2–3), 143–165. doi:10.1016/j.actpsy.2003.12.001
Kray, J., Karbach, J., Haenig, S., & Freitag, C. (2012). Can Task-Switching Training
Enhance Executive Control Functioning in Children with Attention Deficit/Hyperactivity Disorder? Frontiers in Human Neuroscience, 5.
doi:10.3389/fnhum.2011.00180
Kray, J., Li, K. Z. H., & Lindenberger, U. (2002). Age-Related Changes in TaskSwitching Components: The Role of Task Uncertainty. Brain and Cognition,
49(3), 363–381. doi:10.1006/brcg.2001.1505
162
Kray, J., & Lindenberger, U. (2000). Adult age differences in task switching. Psychology
and Aging, 15(1), 126–147. doi:10.1037/0882-7974.15.1.126
Lawo, V., Philipp, A. M., Schuch, S., & Koch, I. (2012). The role of task preparation and
task inhibition in age-related task-switching deficits. Psychology and Aging,
27(4), 1130–1137. doi:10.1037/a0027455
Li, K. Z., & Dupuis, K. (2008). Attentional switching in the sequential flanker task: Age,
location, and time course effects. Acta Psychologica, 127(2), 416–427.
Li, S. C., Schmiedek, F., Huxhold, O., Röcke, C., Smith, J., & Lindenberger, U. (2008).
Working memory plasticity in old age: Practice gain, transfer, and maintenance.
Psychology and Aging, 23(4), 731–742. doi:10.1037/a0014343
Lindenberger, U., & Mayr, U. (2013). Cognitive aging: is there a dark side to
environmental support? Trends in Cognitive Sciences.
doi:10.1016/j.tics.2013.10.006
Linn, R. L. (1989). Intelligence: Measurement, Theory, and Public Policy : Proceedings
of a Symposium in Honor of Lloyd G. Humphreys. University of Illinois Press.
Lussier, M., Gagnon, C., & Bherer, L. (2012). An Investigation of Response and
Stimulus Modality Transfer Effects after Dual-Task Training in Younger and
Older. Frontiers in Human Neuroscience, 6. doi:10.3389/fnhum.2012.00129
Lustig, C., Hasher, L., & Tonev, S. T. (2006). Distraction as a determinant of processing
speed. Psychonomic Bulletin & Review, 13(4), 619–625.
Lustig, C., Hasher, L., & Zacks, R. T. (2007). Inhibitory deficit theory: Recent
developments in a “new view.” Inhibition in Cognition, 145–162.
163
MacDonald, A. W., Cohen, J. D., Stenger, V. A., & Carter, C. S. (2000). Dissociating the
Role of the Dorsolateral Prefrontal and Anterior Cingulate Cortex in Cognitive
Control. Science, 288(5472), 1835–1838. doi:10.1126/science.288.5472.1835
MacLeod, C. M. (1991). Half a century of research on the Stroop effect: An integrative
review. Psychological Bulletin, 109(2), 163–203. doi:10.1037/00332909.109.2.163
Mayr, U. (2001). Age differences in the selection of mental sets: The role of inhibition,
stimulus ambiguity, and response-set overlap. Psychology and Aging, 16(1), 96–
109. doi:10.1037/0882-7974.16.1.96
Mayr, U. (2008). Introduction to the special section on cognitive plasticity in the aging
mind. Psychology and Aging, 23(4), 681–683. doi:10.1037/a0014346
Mayr, U., & Kliegl, R. (1993). Sequential and coordinative complexity: age-based
processing limitations in figural transformations. Journal of Experimental
Psychology: Learning, Memory, and Cognition, 19(6), 1297.
Mayr, U., & Liebscher, T. (2001). Is there an age deficit in the selection of mental sets?
European Journal of Cognitive Psychology, 13(1-2), 47–69.
doi:10.1080/09541440042000214
McElree, B. (2001). Working memory and focal attention. Journal of Experimental
Psychology: Learning, Memory, and Cognition, 27(3), 817–835.
doi:10.1037/0278-7393.27.3.817
164
Meiran, N. (1996). Reconfiguration of processing mode prior to task performance.
Journal of Experimental Psychology: Learning, Memory, and Cognition, 22(6),
1423–1442. doi:10.1037/0278-7393.22.6.1423
Melby-Lervag, M., & Hulme, C. (2013). Is working memory training effective? A metaanalytic review. Developmental Psychology, 49(2), 270.
Miller, E. K. (2000). The prefontral cortex and cognitive control. Nature Reviews
Neuroscience, 1(1), 59–65. doi:10.1038/35036228
Miller, E. K., & Cohen, J. D. (2001). An Integrative Theory of Prefrontal Cortex
Function. Annual Review of Neuroscience, 24(1), 167–202.
doi:10.1146/annurev.neuro.24.1.167
Miller, G. A. (1956). The magical number seven, plus or minus two: some limits on our
capacity for processing information. Psychological Review, 63(2), 81–97.
doi:10.1037/h0043158
Minear, M., & Shah, P. (2008). Training and transfer effects in task switching. Memory
& Cognition, 36(8), 1470–1483. doi:10.3758/MC.336.8.1470
Miyake, A., & Friedman, N. P. (2012). The Nature and Organization of Individual
Differences in Executive Functions Four General Conclusions. Current
Directions in Psychological Science, 21(1), 8–14.
doi:10.1177/0963721411429458
Miyake, A., Friedman, N. P., Emerson, M. J., Witzki, A. H., Howerter, A., & Wager, T.
D. (2000). The unity and diversity of executive functions and their contributions
165
to complex “Frontal Lobe” tasks: A latent variable analysis. Cognitive
Psychology, 41(1), 49–100. doi:10.1006/cogp.1999.0734
Mizuhara, H., & Yamaguchi, Y. (2007). Human cortical circuits for central executive
function emerge by theta phase synchronization. NeuroImage, 36(1), 232–244.
doi:10.1016/j.neuroimage.2007.02.026
Monsell, S. (2003). Task switching. Trends in Cognitive Sciences, 7(3), 134–140.
doi:10.1016/S1364-6613(03)00028-7
Moody, D. E. (2009). Can intelligence be increased by training on a task of working
memory? Intelligence, 37(4), 327–328. doi:10.1016/j.intell.2009.04.005
Morrison, A. B., & Chein, J. M. (2011). Does working memory training work? The
promise and challenges of enhancing cognition by training working memory.
Psychonomic Bulletin & Review, 18(1), 46–60.
Noack, H., Lövdén, M., Schmiedek, F., & Lindenberger, U. (2009). Cognitive plasticity
in adulthood and old age: gauging the generality of cognitive intervention effects.
Restorative Neurology and Neuroscience, 27(5), 435–453. doi:10.3233/RNN2009-0496
Norman, D. A., & Shallice, T. (1980). Attention to Action: Willed and Automatic Control
of Behavior Technical Report No. 8006. Retrieved from
http://www.eric.ed.gov/ERICWebPortal/detail?accno=ED205562
Nyberg, L., Lövdén, M., Riklund, K., Lindenberger, U., & Bäckman, L. (2012). Memory
aging and brain maintenance. Trends in Cognitive Sciences.
doi:10.1016/j.tics.2012.04.005
166
Oelhafen, S., Nikolaidis, A., Padovani, T., Blaser, D., Koenig, T., & Perrig, W. J. (2013).
Increased parietal activity after training of interference control.
Neuropsychologia, 51(13), 2781–2790.
doi:10.1016/j.neuropsychologia.2013.08.012
Olesen, P. J., Westerberg, H., & Klingberg, T. (2004). Increased prefrontal and parietal
activity after training of working memory. Nat Neurosci, 7(1), 75–79.
doi:10.1038/nn1165
Owen, A. M., Hampshire, A., Grahn, J. A., Stenton, R., Dajani, S., Burns, A. S., Ballard,
C. G. (2010). Putting brain training to the test. Nature, 465(7299), 775–778.
doi:10.1038/nature09042
Palva, Monto, S., Kulashekhar, S., & Palva, S. (2010). Neuronal synchrony reveals
working memory networks and predicts individual memory capacity. Proceedings
of the National Academy of Sciences. doi:10.1073/pnas.0913113107
Pereg, M., Shahar, N., & Meiran, N. (2013a). Task switching training effects are
mediated by working-memory management. Intelligence, 41(5), 467–478.
doi:10.1016/j.intell.2013.06.009
Pereg, M., Shahar, N., & Meiran, N. (2013b). Task switching training effects are
mediated by working-memory management. Intelligence, 41(5), 467–478.
doi:10.1016/j.intell.2013.06.009
Raven, J. C. (1988). Standard Progressive Matrices. Weinhelm: Beltz.
Raz, N., Gunning-Dixon, F., Head, D., Rodrigue, K. M., Williamson, A., & Acker, J. D.
(2004). Aging, sexual dimorphism, and hemispheric asymmetry of the cerebral
167
cortex: replicability of regional differences in volume. Neurobiology of Aging,
25(3), 377–396. doi:10.1016/S0197-4580(03)00118-0
Raz, N., & Lindenberger, U. (2011). Only time will tell: Cross-sectional studies offer no
solution to the age-brain-cognition triangle - comment on Salthouse (2011).
Psychological Bulletin, 137(5), 790–795.
Redick, T. S., Shipstead, Z., Harrison, T. L., Hicks, K. L., Fried, D. E., Hambrick, D. Z.,
Engle, R. W. (2013). No evidence of intelligence improvement after working
memory training: A randomized, placebo-controlled study. Journal of
Experimental Psychology: General, 142(2), 359–379. doi:10.1037/a0029082
Reimers, S., & Maylor, E. A. (2005). Task switching across the life Span: Effects of age
on general and specific switch costs. Developmental Psychology, 41(4), 661–671.
Reuter-Lorenz, P. A. (2002). New visions of the aging mind and brain. Trends in
Cognitive Sciences, 6(9), 394–400. doi:10.1016/S1364-6613(02)01957-5
Ridderinkhof, K. R., Ullsperger, M., Crone, E. A., & Nieuwenhuis, S. (2004). The role of
the medial frontal cortex in cognitive control. Science, 306(5695), 443–447.
doi:10.1126/science.1100301
Rogers, R. D., & Monsell, S. D. (1995). Costs of a predictable switch between simple
cognitive tasks. Journal of Experimental Psychology. General, 124(2), 207.
Salminen, T., Strobach, T., & Schubert, T. (2012). On the impacts of working memory
training on executive functioning. Frontiers in Human Neuroscience, 6.
doi:10.3389/fnhum.2012.00166
168
Salthouse, T. (1996). The processing-speed theory of adult age differences in cognition.
Psychological Review, 103(3), 403.
Salthouse, T. A. (2011). Neuroanatomical substrates of age-related cognitive decline.
Psychological Bulletin, 137(5), 753–784. doi:10.1037/a0023262
Salthouse, T. A., & Meinz, E. J. (1995). Aging, inhibition, working memory, and speed.
The Journals Of Gerontology. Series B, Psychological Sciences And Social
Sciences, 50(6), P297–P306.
Schmiedek, F., Lövdén, M., & Lindenberger, U. (2010). Hundred days of cognitive
training enhance broad cognitive abilities in adulthood: findings from the
COGITO study. Frontiers in Aging Neuroscience, 2.
doi:10.3389/fnagi.2010.00027
Scholz, J., Klein, M. C., Behrens, T. E. J., & Johansen-Berg, H. (2009). Training induces
changes in white-matter architecture. Nature Neuroscience, 12(11), 1370–1371.
doi:10.1038/nn.2412
Schroeder, C. E., & Lakatos, P. (2009). Low-frequency neuronal oscillations as
instruments of sensory selection. Trends in Neurosciences, 32, 9–18.
doi:10.1016/j.tins.2008.09.012
Servan-Schreiber, D., Cohen, J. D., & Steingard, S. (1996). Schizophrenic deficits in the
processing of context. A test of a theoretical model. Archives Of General
Psychiatry, 53(12), 1105–1112.
Shipstead, Z., Redick, T. S., & Engle, R. W. (2012). Is working memory training
effective? Psychological Bulletin, 138(4), 628.
169
Singer, T., Lindenberger, U., & Baltes, P. B. (2003). Plasticity of memory for new
learning in very old age: A story of major loss? Psychology and Aging, 18(2),
306–317.
Smith, D. E., Rapp, P. R., McKay, H. M., Roberts, J. A., & Tuszynski, M. H. (2004).
Memory impairment in aged primates is associated with focal death of cortical
neurons and atrophy of subcortical neurons. The Journal of Neuroscience, 24(18),
4373–4381. doi:10.1523/JNEUROSCI.4289-03.2004
Smith, E. E., & Jonides, J. (1999). Storage and Executive Processes in the Frontal Lobes.
Science, 283(5408), 1657–1661. doi:10.1126/science.283.5408.1657
Spector, A., & Biederman, I. (1976). Mental Set and Mental Shift Revisited. The
American Journal of Psychology, 89(4), 669–679. doi:10.2307/1421465
Sternberg, R. J. (2008). Increasing fluid intelligence is possible after all. Proceedings of
the National Academy of Sciences, 105(19), 6791–6792.
doi:10.1073/pnas.0803396105
Strobach, T., Frensch, P. A., & Schubert, T. (2012). Video game practice optimizes
executive control skills in dual-task and task switching situations. Acta
Psychologica, 140(1), 13–24. doi:10.1016/j.actpsy.2012.02.001
Stroop, J. (1935). Studies of interference in serial verbal reactions. Journal of
Experimental Psychology, 18(6), 643–662. doi:10.1037/h0054651
Thompson, T. W., Waskom, M. L., Garel, K.-L. A., Cardenas-Iniguez, C., Reynolds, G.
O., Winter, R., Gabrieli, J. D. E. (2013). Failure of working memory training to
170
enhance cognition or intelligence. PLoS ONE, 8(5), e63614.
doi:10.1371/journal.pone.0063614
Van Muijden, J., Band, G. P. H., & Hommel, B. (2012). Online games training aging
brains: limited transfer to cognitive control functions. Frontiers in Human
Neuroscience, 6. doi:10.3389/fnhum.2012.00221
Varela, F., Lachaux, J.-P., Rodriguez, E., & Martinerie, J. (2001). The brainweb: Phase
synchronization and large-scale integration. Nat Rev Neurosci, 2(4), 229–239.
doi:10.1038/35067550
Vaupel, J. W. (2010). Biodemography of human ageing. Nature, 464(7288), 536–542.
doi:10.1038/nature08984
Verhaeghen, P. (2011). Aging and executive control: reports of a demise greatly
exaggerated. Current Directions in Psychological Science (Sage Publications
Inc.), 20(3), 174–180.
Verhaeghen, P., & Cerella, J. (2002). Aging, executive control, and attention: a review of
meta-analyses. Neuroscience & Biobehavioral Reviews, 26(7), 849–857.
doi:10.1016/S0149-7634(02)00071-4
Verhaeghen, P., Marcoen, A., & Goossens, L. (1992). Improving memory performance in
the aged through mnemonic training: A meta-analytic study. Psychology and
Aging, 7(2), 242–251. doi:10.1037/0882-7974.7.2.242
Verhaeghen, P., Steitz, D. W., Sliwinski, M. J., & Cerella, J. (2003). Aging and dual-task
performance: A meta-analysis. Psychology and Aging, 18(3), 443–460.
doi:10.1037/0882-7974.18.3.443
171
Von Bastian, C. C., & Oberauer, K. (2013). Distinct transfer effects of training different
facets of working memory capacity. Journal of Memory and Language, 69(1),
36–58. doi:10.1016/j.jml.2013.02.002
Vygotsky, L. S. (1980). Mind In Society. Harvard University Press.
Wascher, E., Falkenstein, M., & Wild-Wall, N. (2011). Age related strategic differences
in processing irrelevant information. Neuroscience Letters, 487(1), 66–69.
doi:10.1016/j.neulet.2010.09.075
Wasylyshyn, C., Verhaeghen, P., & Sliwinski, M. J. (2011). Aging and Task Switching:
A Meta-Analysis. Psychology & Aging, 26(1), 15–20.
Wechsler, W. (1981). The Manual for the Wechsler Adult Intelligence Scale Revised.
New York: The Psychological Cooperation.
Wechsler, W. (1982). Manual for the Hamburg-Wechsler-Intelligence Test for Adults
(HAWIE). Bern, Schweiz: Huber.
West, R. L. (1996). An application of prefrontal cortex function theory to cognitive
aging. Psychological Bulletin, 120(2), 272–292. doi:10.1037/00332909.120.2.272
Wilkinson, A. J., & Yang, L. (2011). Plasticity of inhibition in older adults: Retest
practice and transfer effects. Psychology and Aging, No Pagination Specified.
doi:10.1037/a0025926
Wilkinson, L. (1999). Statistical methods in psychology journals: Guidelines and
explanations. American Psychologist, 54(8), 594–604. doi:10.1037/0003066X.54.8.594
172
Williams, B. R., Ponesse, J. S., Schachar, R. J., Logan, G. D., & Tannock, R. (1999).
Development of inhibitory control across the life span. Developmental
Psychology, 35(1), 205–213.
Womelsdorf, T., Johnston, K., Vinck, M., & Everling, S. (2010). Theta-activity in
anterior cingulate cortex predicts task rules and their adjustments following
errors. Proceedings of the National Academy of Sciences, 107(11), 5248 –5253.
doi:10.1073/pnas.0906194107
Womelsdorf, T., Vinck, M., Leung, L. S., & Everling, S. (2010). Selective thetasynchronization of choice-relevant information subserves goal-directed behavior.
Frontiers in Human Neuroscience, 4, 210. doi:10.3389/fnhum.2010.00210
Zehnder, F., Altgassen, M., Martin, M., & Clare, L. (2009). Memory training effects in
old age as markers of plasticity: A meta-analysis. Restorative Neurology &
Neuroscience, 27(5), 507–520.
Zinke, K., Einert, M., Pfennig, L., & Kliegel, M. (2012). Plasticity of executive control
through task switching training in adolescents. Frontiers in Human Neuroscience,
6. doi:10.3389/fnhum.2012.00041
173


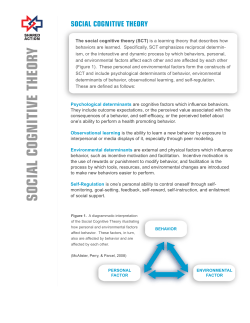

© Copyright 2026