
THE USE OF LIVED EXPERIENCE DESCRIPTIONS IN A
THE USE OF LIVED EXPERIENCE DESCRIPTIONS
IN A REMEDIAL MATHEMATICS CLASSROOM
____________
A Thesis
Presented
To the Faculty of
California State University, Chico
____________
In Partial Fulfillment
of the Requirements for the Degree
Master of Science
in
Mathematics Education
____________
by
© Tierra T. Lloyd 2014
Fall 2014
THE USE OF LIVED EXPERIENCE DESCRIPTIONS
IN A REMEDIAL MATHEMATICS CLASSROOM
A Thesis
by
Tierra T. Lloyd
Fall 2014
APPROVED BY THE DEAN OF GRADUATE STUDIES
AND VICE PROVOST FOR RESEARCH:
Eun K. Park, Ph.D.
APPROVED BY THE GRADUATE ADVISORY COMMITTEE:
Richard L. Ford, Ph.D.
Graduate Coordinator
Yuichi Handa, Ph.D., Chair
Nancy J. Carter, Ph.D.
Jörgen J. Berglund, Ph.D.
PUBLICATION RIGHTS
No portion of this thesis may be reprinted or reproduced in any manner
unacceptable to the usual copyright restrictions without the written permission of the
author.
iii
ACKNOWLEDGMENTS
I could not have completed this thesis without the support, encouragement,
and direction of friends, family members, students, colleagues, and instructors. In
particular, I would like to thank my committee chair, Dr. Yuichi Handa, for his
encouragement, patience, and advice. I am also grateful to the other members of my
committee, Dr. Nancy J. Carter and Dr.Jörgen J. Berglund, for their insight and
instruction.
My parents offered both practical and emotional support when needed, for
which I am grateful. And finally, a special thanks to my four children, Landon, Gavin,
Eliot, and Adia, who endured the discomfort of an often sleep-deprived and
preoccupied mother with patient grace.
iv
TABLE OF CONTENTS
PAGE
Publication Rights ..............................................................................................................
iii
Acknowledgments .............................................................................................................
iv
List of Tables .......................................................................................................................
viii
List of Figures .....................................................................................................................
x
Abstract ...............................................................................................................................
xi
CHAPTER
I.
II.
III.
Introduction.....................................................................................................
1
Background and Statement of the Problem ...................................
Purpose ...............................................................................................
Definitions of Terms..........................................................................
1
6
6
Review of Literature.......................................................................................
7
Challenges of Developmental Mathematics ..................................
Student Characteristics .....................................................................
Reasons for Failure or Success .........................................................
Solution Strategies .............................................................................
Affect ...................................................................................................
Mathematics Anxiety ...........................................................
Emotion as an Educational Tool.........................................
Meta-affect and Identity ......................................................
Mathematics and Writing.................................................................
7
8
9
10
12
13
17
19
22
Methods ...........................................................................................................
27
Sample .................................................................................................
27
v
CHAPTER
PAGE
Data Collection ..................................................................................
Questionnaire and Essay Questions ..................................
Lived Experience Descriptions ...........................................
Teacher Observations ..........................................................
Times Tests ............................................................................
Data Analysis .....................................................................................
Analysis of Test Scores ........................................................
Analysis of Test Times .........................................................
Analysis of the Attitude Toward Mathematics
Inventory ............................................................................
Analysis of the Lived Experience Descriptions................
Limitations of the Study ...................................................................
27
28
30
31
31
32
32
32
Findings ...........................................................................................................
38
Introduction........................................................................................
Student Test Scores ...........................................................................
Student Test Times ............................................................................
Attitude Toward Mathematics Inventory Scores..........................
Writing Assignments ........................................................................
Approach ...............................................................................
Analysis .................................................................................
38
39
40
42
47
49
54
Discussion ........................................................................................................
58
Discussion of Individual Research Questions ...............................
Research Question 1 .............................................................
Research Question 2 .............................................................
Research Question 3 .............................................................
Research Question 4 .............................................................
Further Discussion ............................................................................
Recommendations .............................................................................
58
58
59
60
61
63
65
References ...........................................................................................................................
66
IV.
V.
33
36
36
Appendices
A.
B.
Mathematics Attitude Instrument................................................................
Short Essay 1 ...................................................................................................
vi
72
75
Appendices
C.
D.
Short Essay 2 ...................................................................................................
Writing Prompts .............................................................................................
vii
77
79
LIST OF TABLES
TABLE
PAGE
1.
Analysis of Variance of Student Test Scores...............................................
41
2.
Analysis of Variance of Student Test Times: Between Groups and
Group by Test ..............................................................................................
43
Paired T Test for Students’ Pre- and Post-ATMI Score: Control
Group ............................................................................................................
44
Paired T Test for Students’ Pre- and Post-ATMI Score:
Experimental Group....................................................................................
44
A Summary of the Change in ATMI Scores in Each of the Four
Attitude Subgroups .....................................................................................
45
6.
Paired T Test for Students’ ATMI Enjoyment Score: Control Group......
45
7.
Paired T Test for Students’ ATMI Enjoyment Score: Experimental
Group ............................................................................................................
46
8.
Paired T Test for Students’ ATMI Motivation Score: Control Group .....
46
9.
Paired T Test for Students’ ATMI Motivation Score: Experimental
Group ............................................................................................................
47
Paired T Test for Students’ ATMI Self Confidence Score: Control
Group ............................................................................................................
47
Paired T Test for Students’ ATMI Self Confidence Score:
Experimental Group....................................................................................
48
12.
Paired T Test for Students’ ATMI Value Score: Control Group ..............
48
13.
Paired T Test for Students’ ATMI Value Score: Experimental Group ....
49
3.
4.
5.
10.
11.
viii
TABLE
PAGE
14.
Two-sample T Test for ATMI Change .........................................................
50
15.
Two-sample T Test for Enjoyment Change ................................................
50
16.
Two-sample T Test for Motivation Change ................................................
51
17.
Two-sample T Test for Self Confidence Change ........................................
51
18.
Two-sample T Test for Value Change .........................................................
52
19.
Percentage of Students Whose Writing Assignment Included
Theme-related Text .....................................................................................
56
ix
LIST OF FIGURES
FIGURE
PAGE
1.
Data collection timeline ....................................................................................
29
2.
Interaction plot comparing average test percent between groups .............
40
3.
Interaction plot comparing average test time between groups...................
42
4.
Theme representation by assignment .............................................................
57
x
ABSTRACT
THE USE OF LIVED EXPERIENCE DESCRIPTIONS
IN A REMEDIAL MATHEMATICS CLASSROOM
by
© Tierra T. Lloyd 2014
Master of Science in Mathematics Education
California State University, Chico
Fall 2014
A large number of American college students are placed in remedial, or
developmental, mathematics courses, and those same students then go on to abandon or
fail those courses at a staggering rate. Research has produced cognitive, affective,
socioeconomic, and pedagogical explanations for this phenomenon; several recent
studies advocate for a more unified view, emphasizing the interplay between these
aspects of experience.
In this study, students in a post-secondary remedial algebra class were taught
to write lived experience descriptions: first–person, present-tense narratives which
describe affective, cognitive, and other aspects of experience. Students were then asked
to write about specific mathematical experiences several times throughout the semester.
xi
These students’ test scores, test times, and attitudes toward mathematics were compared
to those of students in a control group.
Over the course of the semester, the students who wrote lived experience
descriptions showed a statistically significant improvement in test scores as compared to
those in the control group. The students’ writing assignments appear to document the
emergence of personal agency in relation to mathematics: as the semester progressed,
the students spoke less of themselves and mathematics as separate, fixed entities, and
instead described a relationship which they had the power to improve.
xii
CHAPTER I
INTRODUCTION
Background and Statement of the Problem
A large number of college students are placed in remedial, or developmental,
mathematics courses, and those same students then go on to abandon or fail those
courses at a staggering rate. A 2010 survey of 57 two-year colleges found that while 59%
of students were referred to developmental mathematics courses, only 33% of those students successfully completed their remediation sequence, and a mere 20% went on to
complete a mathematics gatekeeper course (Bailey, Jeong, & Cho, 2010). Remediation is
not just an issue at two-year colleges, more than 35% of California State University fall
2010 entering freshmen required remediation in mathematics (California State
University, 2014).
It is hardly necessary to establish this as a problematic situation; the size of
the body of research on developmental mathematics shows that educators are well
aware of the crisis. Anthony S. Bryke, president of the Carnegie Foundation for the
Advancement of Teaching has said “Developmental mathematics courses represent the
graveyard of dreams and aspirations” (Merseth, 2011, p. 32). The financial impact of
remediation is felt as well. A 2008 study estimated the national cost of remediation at
public universities to be between 2.31-2.89 billion dollars (Strong American Schools,
1
2
2008). The evidence leaves two questions to be answered: “Why?” and “What can be
done?”
Researchers have produced a sea of explanations to account for the high failure rate in remedial mathematics courses. Student failure has been attributed to both
educator-controlled factors and to student factors. Educator-controlled factors include
teacher disinterest, teaching style and other pedagogical issues, perceived irrelevance,
and style of assessment. Student factors include preparedness, procrastination, anxiety,
and various socioeconomic issues (Bonham & Boylan, 2011; Boylan, 2011; Mekonnen &
Reznichenko, 2008). Recent studies have also put greater and greater emphasis on the
role of affect in mathematics education. In the math department where I teach, conversations about how to help struggling students often include the mantra: “It’s not the math,
it’s how they feel about the math.”
The idea that issues of affect influence students’ academic achievement is not
new. In a 1994 issue of the Journal for Research in Mathematical Education, McLeod summarized the 100+ JRME articles that had been published over the previous 24 years on
the role of affect in mathematics education. He indicated that the bulk of these articles
focused on the affective constructs of attitude, belief, and emotion (McLeod, 1994). In
subsequent years, Debellis and Goldin (1999, 2006) and Goldin (2002) expanded their
study of affect in mathematics to include meta-affect, and coined the term “mathematical intimacy.” This construct refers to students’ emotional engagement with a mathematics problem. More recent research emphasizes the power of self belief and identity.
3
Dweck’s (2008) research establishes the relationship between mindset (whether a student believes that intelligence is fixed or has the potential for growth) and math
achievement, and Heyd-Metzuyanim and Sfard (2012) illuminated some of the social
factors influencing student work.
“Test anxiety” has long been a recognized condition; recently a broad body of
research has accumulated around the idea of “mathematics anxiety.” A study performed
by Young, Wu, and Menon (2012) at the Stanford University School of Medicine established the reality of mathematics anxiety with empirical evidence. Brain scans run on
elementary school students as they worked on math problems showed that students
who complained of mathematics anxiety had unusually high levels of activity in the
brain’s amygdala, or fear center, which correlated with limited functionality in areas of
the brain associated with problem-solving and numerical processing (Young et al., 2012).
And in the past decade, several papers have been published characterizing the intellectual impact of students’ emotional responses to frustration (Op’t Eynde, De Corte, &
Verschaffel, 2006; Op’t Eynde & Turner, 2006).
So where should one start? Mathematics anxiety has been successfully treated using both systemic desensitization (a hierarchal exposure/relaxation process originally developed for the treatment of phobias) and cognitive restructuring (in which
individuals identify their own maladaptive thought processes and then develop cognitive responses to them) (Hembree, 1990). Heyd-Metzuyanim and Sfard (2012), who were
working with middle-school children, believed that if educators became more aware of
4
social dynamics in their classrooms, they could better help students to cope with those
influences, and Liljedahl’s 2005 study found that facilitating “aha” moments for students
could dramatically change their attitudes about mathematics.
But rather than focusing solely on one affective domain, or even solely on
affect itself, Malmivuori (2001) suggests that educators and researchers take a more
holistic approach, acknowledging the interplay between cognitive, social, and emotional
aspects of learning, and studying the process as a whole instead of attempting to isolate
a single dynamic. Op‘t Eynde and Turner (2006) put forth a similar philosophy. And
certainly this is how learning is experienced for students, not as isolated moments cleanly compartmentalized by attitude, intellect, or emotion, but a multifaceted experience in
which it can be difficult to identify the reasons behind one’s own behavior.
This notion of focusing on the experience in its entirety rather than analyzing
certain affective, cognitive, or social aspects of the experience brings to mind the phenomenological practice of “phenomenological description” or “lived experience.” Lived
experience refers to all aspects of firsthand human experience (e.g., cognitive, emotional,
sensory) viewed as a whole. Lived experience descriptions (LEDs) attempt to capture
these details directly; the subject describes each component of an experience as it happened chronologically. The subject makes no attempt to characterize or interpret the
experience, only to document the experience as fully as possible. And while LEDs are
typically used to supply insight into another individual’s experience, the process of writing one’s own experience can be illuminating in itself (Stinson, 2009). Asking students to
5
write careful descriptions of their own mathematical experiences might make their invisible struggles visible, not only to a teacher, but to the student himself. Whether or not a
teacher ever reads the descriptions a student writes, the student has re-lived the experience in the writing of it, and likely uncovered aspects of the experience that they were
previously unconscious of. Such a task might allow students to see how affective issues
are interacting with cognitive issues. The one-dimensional “This problem is hard” might
be revealed to be less about the problem itself and more about how the student feels as
they work on the problem: the identity they bring to the task, their response to frustration, and the influence of peers and other environmental factors.
Standard research instruments unavoidably measure from the outside in. We
observe, survey, interview, and test. Only the student himself has the access to truly
witness the learning (or not learning) taking place; only the student has a front row seat
as his or her own cognitive, affective, and behavioral issues collide. Could LEDs make
the invisible, internal moment when student meets subject visible? Could our students
themselves become instruments of research? And if so, how will they respond to this
new point of view? Is there evidence suggesting that this intervention might produce
something of value? These are the questions I attempted to answer.
6
Purpose
The purpose of this study was to analyze the effect writing LEDs has on postsecondary remedial algebra students. In particular, I attempted to answer the following
questions:
1. How does writing LEDs affect remedial algebra students’ performance on course
tests?
2. How does writing LEDs alter the attitudes of remedial algebra students?
3. How does writing LEDs alter remedial algebra students’ persistence in the face
of cognitive struggle?
4. What alterations in students’ relationships to mathematics do LEDs reveal?
Definition of Terms
Lived experience refers to all aspects of firsthand human experience (e.g., cognitive,
emotional, sensory) viewed as a whole.
Lived experience descriptions attempt to capture these details directly; the subject
describes each component of an experience as it happened chronologically. The subject
makes no attempt to characterize or interpret the experience within the LED itself, only
to document the experience as fully as possible.
CHAPTER II
REVIEW OF LITERATURE
While no current research specifically addresses the use of LEDs in mathematics classrooms, many areas of study can inform the endeavor. Three topics seem particularly relevant. First, understanding the challenges that students and instructors of
developmental mathematics face will both identify the nature of the problem and highlight potential areas of improvement. Second, as the intervention is expected to address
and influence attitudes, emotions, and beliefs, establishing the ways in which these elements of affect impact students is essential. And finally, despite the novelty of writing
LEDs, the use of other forms of mathematics writing has produced a sizeable and relevant body of research. Studying the reasoning for, and results of, other efforts to incorporate writing into mathematics classrooms might justify and direct this intervention.
Each of these three topics will be individually addressed in the following literature
review.
Challenges of Developmental Mathematics
Developmental mathematics courses, originally conceived as a stepping
stone to higher education, have instead become something of stumbling block. Well over
half of community college students test into developmental mathematics and
7
8
remediation at the university level is widespread as well. In 2010, 35% of entering
freshman at California State University required remediation in mathematics (Bailey et
al., 2010; California State University, 2014). In one sense, the “stepping stone” is serving
its purpose. Students who complete their remediation sequence perform just as well in
college mathematics courses as those who were not required to take developmental
mathematics (Bahr, 2008). However, only about 20% of students who test into developmental mathematics actually complete the required coursework (Bailey et al., 2010;
Bonham & Boylan, 2011).
Both the vast number of developmental mathematics classes being taught
and the high incidence of student withdrawal and failure have inspired large bodies of
research. Studies have attempted to identify and characterize the student population,
investigate the sources of student failure, and guide efforts at reform. These areas of
research are each addressed in the following three sections.
Student Characteristics
Students are directed into developmental mathematics courses after failing a
college or university mathematics entrance exam, an indicator that these students either
test poorly or lack mathematical proficiency. To gain entrance into college-level mathematics, students must first complete their remedial course sequence, which can mean
taking up to four semesters of developmental mathematics (Bonham & Boylan, 2011). It
is not surprising, then, that students often enter developmental mathematics courses
with a negative attitude toward math (Sierpinska, 2006). One of the respondents to
9
Sierpinska’s (2006) survey wrote, “Math is extremely discouraging when you are forced
to take it as a prerequisite…. I feel math is the only thing that’s stopping me from getting
into the program I want” (p. 124). Woodard (2004) describes high levels of mathematics
anxiety in developmental math students, but empirical data on the attitudes and beliefs
of these students is underrepresented. In 2008, Saxon, Levine-Brown, and Boylan issued
a call to increase the use of affective assessment in developmental students, saying, “The
lack of assessment information on the affective characteristics of developmental students
represents a serious weakness in the assessment, advising, and placement processes of
postsecondary institutions” (p. 1). And finally, several studies have found that the
developmental mathematics population consists of disproportionately high numbers of
first generation and minority students, making it an “at-risk” group (Bonham & Boylan,
2011; Grassl, 2010).
Reasons for Failure or Success
Enrollment and persistence in postsecondary education are closely linked to
socioeconomic status, and community college students (who make up the bulk of developmental mathematics students) come from lower socioeconomic planes than do students at four-year universities (American Mathematical Association of Two-year Colleges [AMATYC], 2006; Bailey, Jenkins, & Leinbach, 2005). Approximately 20% of students who test into developmental mathematics never enroll in a developmental mathematics course (Bailey et al., 2010), and even for students who do enroll, attendance is an
issue. Zientek, Ozel, Fong, and Griffin (2013) report that attendance is the most accurate
10
predictor of student success. After class attendance, several studies have found that selfefficacy, or a student’s belief in their own ability to succeed, is the most influential factor
(Grassl, 2010; Zientek et al., 2013). Ma and Xu (2004) establish the correlation between
positive attitude and mathematical achievement, and Bonham and Boylan (2011) attest
to the negative impact of both test anxiety and math anxiety.
Solution Strategies
Bonham and Boylan (2011) report on a multitude of teaching strategies being
used to address issues in developmental mathematics education, most of which are
based on current research. Educators are redesigning their courses to include cooperative and collaborative learning, laboratory instruction, supplemental instruction, problem solving, and the integration of math study skills (p. 3). There appears to be particular emphasis placed on the use of technology, which can facilitate increased laboratory
work, provide online instruction, and enhance student modeling capabilities through
the use of graphing calculators (Bonham & Boylan, 2011; Martin, 2008). Most of these
methods have produced modest improvements in student success rates. Sierpinska
(2006), who studied sources of frustration in developmental mathematics students, suggests that instructors lessen students’ dependence on algorithms and instructor approval
by teaching more of the theory behind mathematical practices.
In addition to the pedagogical changes made by individual instructors, colleges, universities, and other educational entities are working to create new models for
developmental mathematics. The AMATYC has two projects underway. The Syllabus
11
Project provides an online forum where instructors can share syllabi and other resources
with one another. A joint project with the Monterrey Institute for Technology and Education aims to unite the topics covered in the four traditional developmental mathematics courses and then dispense them as custom courses made to meet individual student’s
needs (Bonham & Boylan, 2011). The Carnegie Foundation for the Advancement of
Teaching is also pursuing reform. Hoping to make developmental mathematics more
useful to students, the foundation has created a developmental “statistics pathway” as
an alternative to the traditional algebra approach (Carnegie Foundation for the
Advancement of Teaching, n.d.).
Although there are very few strategies being implemented to directly address
the affective factors that hinder student success, several studies have called for change in
this area. Saxon et al. (2008) and Levine-Brown, Bonham, Saxon, and Boylan (2008) have
asked college administrators to institute standard affective testing of developmental
mathematics students, explaining that the results could both inform student placement
and improve student support services. Bonham and Boylan (2011) also emphasize the
significance of affective factors, calling the affective domain an “untapped resource,”
and “a rich area of information for educators designing developmental mathematics
courses and one that should definitely not be ignored by anyone attempting to improve
student performance in developmental mathematics” (p. 6). They suggest the use of
group work as a means to increase students’ confidence and emphasize student writing
as a means to improve attitudes and beliefs.
12
Affect
While the idea that feelings and emotion have a place in mathematics may
seem counterintuitive, researchers have been studying the interactions between affect
and mathematics learning for decades. The first hurdle for students may simply be
accepting that the experience of learning and doing mathematics consists of more than
robotic memorization and manipulations. Jardine (2006) describes the stereotype:
Mathematics is considered a serious and exact science, a strict discipline, and
such images of seriousness, exactness, and strictness often inform how it is
taught and how it is understood. It requires silence and neat rows and ramrod postures that imitate its exactitudes. It requires neither joy nor sadness,
but a mood of detached inevitability: Anyone could be here in my place and
things would proceed identically. (p. 187)
Yet, in reality, the experience of learning and doing mathematics is steeped in affect. At
the highest level, mathematicians themselves describe “coming to know” as a feeling.
After conducting interviews with 70 research mathematicians, Burton (1999) states, “So
coming to know, for my participants, was represented by feelings, the powerful sense of
Aha! which is what holds them in mathematics” (p. 135). In interviews with mathematics instructors, Handa (2011) also identifies understanding as a feeling. Two of his subjects describe both the experience of not yet understanding: “It doesn’t help me feel that
I understand,” “It feels funny,” and of understanding, “It has to feel right” (p. 50-53).
The mathematics students studied by Liljedahl (2005) were asked to describe an “Aha!”
experience. The adjectives they use tell a story of affect, not intellect: “It felt great,” “The
best feeling,” “Wow!” and “Joy…like none other” (p. 228).
13
The previous examples describe positive emotions associated with mathematics, but, of course, affect includes negative feelings as well, and perhaps these are
more familiar. The arrival at “Aha!” only comes after some confusion. John Dewey
described this partnership: “The origin of thinking is some perplexity, confusion, or
doubt” (as cited in Hiebert et al., 1996, p. 15). And speaking specifically with regard to
mathematics education, the mathematician and educator George Polya emphasized the
importance of the emotional aspect of confusion, saying, “If the student had no opportunity in school to familiarize himself with the varying emotions of the struggle for the
solution his mathematical education failed him in the most vital of ways” (as cited in
Allen & Carifio, 2007, p. 163).
There is no longer any debate over whether issues of affect play a part in
mathematics education, instead current research attempts to characterize the nature and
significance of the influence. Ideally, “emotion energizes, organizes, focuses, and
improves performance” (Allen & Carifio, 2007, p. 166). But these are idealized responses
to emotion; certainly the affective experience does not always strengthen students’ facilities. In fact, research shows that issues of affect can also severely impair both focus and
performance.
Mathematics Anxiety
Mathematics anxiety is defined as “a feeling of tension, apprehension, or fear
that interferes with math performance” (Ashcraft, 2002, p. 181). In 1990, Hembree integrated the results of 151 studies in order to identify “The Nature, Effects, and Relief of
14
Mathematics Anxiety.” He concluded that mathematics anxiety negatively influences
students’ test performance and attitudes, and is directly associated with avoidance of the
subject entirely. Mathematics anxiety has often been associated with or even mistaken
for test anxiety, but research justifies differentiating between the two. Rather than being
limited to testing environments, mathematics anxiety “appears to comprise a general
fear of contact with mathematics, including classes, homework and tests” (Hembree,
p. 45).
The sources of mathematics anxiety remain largely undetermined. Although
mathematics anxiety and poor performance go hand in hand, “there is no compelling
evidence that poor performance causes mathematics anxiety” (Hembree, 1990, p. 44).
Later studies have also failed to find any significant correlation between intelligence and
mathematics anxiety (Ashcraft, 2002; Young et al., 2012). Ashcraft (2002) refers to
Eysenck and Calvo’s “processing efficiency theory” for anxiety in general (p. 183). It
postulates that anxiety-related poor performance, and in particular poor performance
associated with working memory, is due to fear-based and worry-based thoughts interrupting the individual’s thought processes. Ashcraft takes a slightly different view, suggesting that it is the uninhibited attention to such thoughts rather than the thoughts
themselves that distinguishes an individual as a victim of math anxiety (p. 184).
Although there are no conclusive studies on the causes of mathematics anxiety, research has suggested a few possibilities. Turner, Midgley, Meyer, Gheen,
Anderman, Kang, and Patrick’s (2002) work investigating the relationship between
15
classroom environment and student avoidance behaviors in mathematics is relevant.
The study found high levels of avoidance (self-handicapping, an aversion to help seeking, and an avoidance of novel forms of cognitive engagement) in classrooms where
teachers demanded correctness but provided little support during lessons and were
intolerant of student mistakes. Ashcraft’s (2002) participants reported similar sources of
anxiety, explaining that a history of “public embarrassment in mathematics class contributed to their math anxiety” (p. 184).
Highly math anxious individuals certainly perform poorly on assessments,
but mathematics anxiety affects students in a variety of ways. The predominant behavior associated with mathematics anxiety is avoidance (Ashcraft, 2002; Hembree, 1990).
Highly math anxious individuals not only take fewer math classes, they attempt to minimize their cognitive contact with the subject even in the classes they do take. They
“learn less of what they are exposed to” (Ashcraft, 2002, p. 182). When Ashcraft asked
college students to work on simple arithmetic problems, he found that highly math anxious individuals soon began to rush through the problems, sacrificing accuracy in order
to end the experience as quickly as possible (p. 182).
Mathematics anxiety is also associated with negative attitudes and beliefs.
Math anxious individuals’ dislike of mathematics is characterized by Faust (1992) and
Hembree (1990) as a phobia. Independent instruments have found that math anxious
individuals are equal in intelligence and ability to their peers, yet Ashcraft (2002) found
that such individuals believed themselves to be unusually incapable of learning
16
mathematics (p. 182). This seems to explain math anxious individuals’ abnormally low
measures of motivation (Ashcraft).
Until very recently, researchers relied exclusively on subjective measures of
mathematics anxiety, using interviews, classroom observations, and questionnaires to
identify and quantify the phenomenon. But Young et al. (2012) were able to establish the
neurological effects of mathematics anxiety by running functional MRI scans on elementary school children as they worked on math problems. Their results confirmed much of
what was already believed. Students suffering from mathematics anxiety had unusually
high levels of activity in the brain’s amygdala, an area associated with fear and the processing of negative emotions. These same children were found to have decreased activity in areas of the brain associated with working memory, attention, and mathematical
reasoning (Young et al.).
Educators have pursued an assortment of math anxiety interventions with
varying success. Hembree’s (1990) survey clearly identified some of what does and does
not work to treat mathematics anxiety. After integrating 151 mathematics anxiety studies, he concluded that whole class psychology treatments did not improve the performance of students who suffered from math anxiety. Curricular changes were equally
unsuccessful. In fact, the only effective treatments for mathematics anxiety were purely
psychological interventions which did not involve teaching or practicing mathematics at
all.
17
The first successful intervention, systemic desensitization (also called graduated exposure therapy), has been used for the treatment of phobias since the 1950s. Participants first create a stimulus hierarchy, in which they identify and rank the sources of
their fear or anxiety. After being taught relaxation strategies, the participants work their
way through the hierarchy, exposing themselves to the least disagreeable item first, and
only moving on to the next item when (with the help of relaxation techniques) the first
item is no longer a significant source of fear or anxiety.
Cognitive restructuring, a component of cognitive behavior therapy, is
another effective treatment for mathematics anxiety. Individuals who participate in cognitive restructuring are taught to identify and then dispute their own maladaptive
thought processes. The treatment is fundamentally metacognitive. Participants must first
recognize the (often subconscious) text of their responses to anxiety inducing stimuli (in
this case encounters with mathematics), then work to develop productive responses to
those thought processes. Both the set of students who participated in systemic desensitization and the set of students who were taught cognitive restructuring were able to
achieve anxiety-free levels of performance (Ashcraft, 2002; Hembree, 1990).
Emotion as an Educational Tool
The previous sections discuss both the positive emotional experiences that
often accompany newfound understanding and the negative emotions which block the
path to understanding, thus establishing affect as a significant component of
18
mathematical experience. But emotion can do more than punctuate an experience; many
researchers believe that emotion is an essential ingredient of educational experience.
Bruner (1990), a psychologist, draws on the work of Frederick Bartlett to suggest that “Remembering serves … to justify an affect, an attitude” (p. 58). In this view,
the affective experience is what sears something into memory; the context (academic or
otherwise) is secondary, saved only as a means to explain the affective incident. Thus, in
order to remember, students first must feel.
Op’t Eynde, De Corte, and Verschaffel (2006) also emphasize the role of emotions in mathematics learning. They state, “Clearly, from a socio-constructivist perspective, students’ emotions and other affective processes are conceived as an integral part of
problem solving and learning” (p. 194). After careful observations of their student subjects, Op’t Eynde et al. concluded that it was almost always an emotional cue (e.g., frustration) that “triggered students to redirect their behavior” (p. 202).
Allen and Carifio (2007) created a study to investigate George Polya’s claim
that more sophisticated problem solvers “experience more differentiated emotion during mathematical problem solving” (p. 163). They found that while some of their subjects experienced either uniformly positive or uniformly negative emotions, the most
sophisticated problem solvers experienced a blend of the two. These students were able
to use emotion to motivate, direct, and monitor their problem-solving experience. The
authors concluded that incorporating both positive and negative emotional experiences
in mathematical learning “generates valuable meta-cognitive evaluation information as
19
well as stimulating, energizing, organizing, and focusing effects” (p. 166). They are careful to clarify that it is a student’s response to the emotional impact of problem solving
that makes the emotion productive for the student. Students must be able to both experience differentiated emotion and then manage that emotion in order to benefit from
emotional feedback.
Meta-affect and Identity
We have seen how emotion can either impair or improve cognitive function.
In the one case, emotions like fear and worry become distractions that reduce problemsolving power. In the other, problem solving is directed and fueled by emotion. The difference seems to lie not in the original experience of the emotion but in the secondary
response to the emotion. Students who feel but can inhibit fear and worry do not suffer
from mathematics anxiety (Ashcraft, 2002). Frustration can lead to despair or fuel motivation (Allen & Carifio, 2007). DeBellis and Goldin (2006) call these different affective/cognitive sequences “affective pathways,” and distinguish between positive pathways, which produce successful learning outcomes, and negative pathways, which do
not. While positive and negative pathways may include many of the same emotional
waypoints (e.g., curiosity, bewilderment, frustration), the difference is in the subsequent
emotional destination. Does bewilderment lead to anxiety or to determination? DeBellis
and Goldin refer to these secondary emotions as “affect about affect” or “meta-affect.”
To explain, Goldin (2002) gives the following illustration:
20
Consider, for example, the emotion of fear. One thinks first of fear as a negative state of feeling, signaling danger. In the absence of actual danger in the
environment, fear might be seen as a counterproductive state, an incorrect
encoding, a feeling to be avoided or soothed. A young child may be terrified
of the dark, or of being alone. An adolescent may experience fear of rejection
or of failure. Some people are terribly and involuntarily afraid of crowds, of
heights of flying in airplanes, or of public speaking. Some, of course, fear
mathematics. In these situations, our first impulse is to try to assuage the feeling.
But a moment’s reflection reminds us that in the right circumstances, individuals can find fear highly pleasurable. People flock to horror movies. They
enjoy amusement park rides, where the more terrifying the roller coaster experience, the more exhilarating and “fun” it is. Why is this? The cognition
that the person is “really safe” on the roller coaster permits the fear to occur in a
meta-affective context of excitement and joy. The more afraid the rider feels, the
more wonderful she feels about her fear. …Imagine however, that a cable
breaks during such a ride, and the roller coaster swerves uncontrollably. The
experience changes entirely! Now the rider is “truly” afraid, as the danger is
(believed to be) actual. This fear feels entirely different, because the meta-affect
has changed. Even if the person is really in no danger, the removal of the belief that she is safe changes the nature of the affective state. (p. 62)
Notice that it is belief which informs meta-affect. To better understand how
meta-affect guides affective pathways, let us expand our current focus on the emotional
manifestations of affect to include other affective spheres: attitude, belief, and identity.
McLeod’s (1992) oft-cited chapter in the Handbook of Research on Mathematics
Teaching and Learning divides affect into three categories: emotions, attitudes, and beliefs
(p. 578). Emotions, the most intense and least permanent of the three, arise when students use beliefs to appraise a situation (McLeod, 1992; Op’t Eynde et al., 2006). Some of
the most powerful emotional arousals come as the result of “appraisals of the self”
(Malmivuori, 2006). For instance, if a student who believes that mathematics problems
are generally formulaic reproductions encounters a problem for which he or she knows
21
no algorithm, then the student is likely to become angry or frustrated. If such a student
also believes that success in mathematics is primarily the product of ability rather than
effort, then the student is likely to form a new self-belief, “I don’t have the ability to do
mathematics,” which comes with its own emotional and behavioral consequences. When
the same emotional experience is repeated over and over again, the response (say, to a
certain type of problem) becomes automatic, and is now ingrained in the student as an
attitude or even a belief, that is, “I don’t like word problems” or “I’m not good at word
problems” (McLeod, 1992). Thus, emotions are both the window through which attitudes and beliefs can be seen and a means by which attitudes and beliefs evolve. Op’t
Eynde et al. (2006) say of students in math class, “Who they are, what they value, what
matters to them in what way in this situation is revealed to them through their
emotions” (p. 194).
In this way, doing mathematics can become an identifying activity. Students
create mathematical identities for themselves through “continuous unconscious evaluation of the situation with respect to personal goals” (Hannula, 2002, p. 29). Of course, the
personal goals of students are often very different from the goals of educators. Hannula’s case study of “Rita,” a middle-school student, illustrates this. He found that while
Rita’s negative attitude in math class was counterproductive to her learning mathematics, it was a “successful defence strategy of a positive self-concept” (p. 42). Rita’s
view that math was “stupid” and “useless” allowed her to maintain a positive selfimage when faced with the discomfort of math-induced confusion. Naturally, Rita’s
22
negative attitude and associated disengagement, while protecting her ego, led to more
confusion in mathematics. However, over the course of several years, Rita was able to
change her response to confusion. Although her teacher-assessed proficiency in the subject remained essentially the same, her self-belief improved, and, as a result, “she no
longer had to deny the necessity of problematic topics but, instead, she asked for help
until she understood” (p. 42). A shift in belief allowed her affective pathway to change.
Mathematics and Writing
Van Manen (1990) shapes an argument in favor of, and a framework for,
using LEDs in educational research. Mathematics researchers have made only minimal
use of his methods. However, since lived experience generally takes the form of a first
person, present tense narrative written by the subject, the body of research on writing in
mathematics is relevant.
Mathematics education researchers and reformers have championed the use
of writing in mathematics classrooms for decades. In the 1980s, the “Writing Across the
Curriculum” movement encouraged the use of writing in all subject areas, mathematics
included. The movement originated with literacy concerns as American students had
demonstrated increasingly weaker reading and writing skills on standardized tests and
in the expressed complaints of employers (Kinneavy, 1983). Likely because the theory
was developed to address literary rather than mathematic shortcomings, its relevance to
mathematics learning was initially unclear. Thus its application in mathematics classrooms took on a variety of forms (Bossé & Faulconer, 2008).
23
More recently, the National Council for the Teaching of Mathematics
([NCTM], 2000, 2014) has drawn attention to the essential role writing can play in the
learning of mathematics. Their communication standard clearly makes a case for the
importance of writing in mathematics classrooms:
Instructional programs from prekindergarten through grade 12 should enable all students to:
• Organize and consolidate their mathematical thinking through communication
• Communicate their mathematical thinking coherently and clearly to peers,
teachers, and others
• Analyze and evaluate the mathematical thinking and strategies of others
• Use the language of mathematics to express mathematical ideas precisely.
(NCTM, 2000, p. 60)
Bossé and Faulconer (2008) also draw connections between writing and NCTM’s representation standard, calling mathematical writing “the conjoining of all representations”
(p. 10).
Throughout the current reformative period and also during the earlier “Writing Across the Curriculum” era, the maxim “writing to learn” has given direction to
efforts to use writing to teach mathematics.
“Writing to learn” has Vygotskyan origins. The Russian psychologist’s belief
that “language and thought are both transformed in the act of representation” (Borasi &
Rose, 1989, p. 346) is often cited as the foundation upon which the principle of learning
via writing rests (Borasi & Rose; Lim & Pugalee, 2004; Pugalee, 2001). Vygotsky held
that the formation of written language is an analytical process which requires the writer
to form a “web of meaning,” identifying connections both within the current area of
24
interest and to prior concepts (Pugalee, 2004). The writer culls and refines his own inner
language to create a more pointed, succinct, and generally intelligible product.
Bossé and Faulconer (2008) report that the most common forms of writing
found in mathematics classrooms are note-taking, biographies of historical figures, journal writing, and expository writing. They distinguish between writing about mathematics, a genre which includes biographies and informal journals in which students describe
their feelings about mathematics, and writing in mathematics, which asks students to
explain and engage with pure mathematical concepts. These authors advocate for the
latter, believing that the hypothetical benefits of “writing to learn” can only be realized
when students participate in “deeper conversations about the underlying principles of
mathematics” (p. 11).
Pugalee (1997) describes some of the gains experienced by students who participate in expository mathematical writing. Using examples from research to support
each claim, he asserts that expository writing helps students connect prior knowledge to
new information, develop problem-solving skills, and assess their own understanding of
a topic. Lim and Pugalee (2004) used expository journal writing to investigate the NCTM
goal “They communicate to learn mathematics and they learn to communicate mathematically.” Participants in this study used journals to solve mathematical problems, conscientiously describing each step of their problem-solving process. The authors’
carefully analyzed findings demonstrated that this writing activity engaged students,
improved students’ expository writing, and helped students to remember the
25
mathematical principles they wrote about. Another study by Pugalee (2004) compared
the effects of verbal communication and written communication, finding that “students
who wrote descriptions of their thinking were significantly more successful in the
problem solving tasks than students who verbalized their thinking” (p. 27).
Borasi and Rose (1989) describe another learning aspect of writing. The students they studied kept informal mathematics journals and wrote on topics of their own
choosing. The final products contained a variety of entries: expository-type explanations
of problem-solving processes, accounts of their own mathematical practices and beliefs,
personal feelings and opinions about mathematics, and, occasionally, responses to
teacher-generated questions. The authors noted the journals’ revelatory power: in the act
of writing, students often discovered they knew more than they thought they knew
about mathematics, but more significantly, students uncovered their own relationship to
mathematics. “The open and exploratory nature of the journal may in fact invite students to record events, thoughts, feelings, and ideas, of which the writer may not initially recognize the relevance or value” (p. 353). By putting a thought or feeling onto paper
students became observers of themselves. They became more aware of “how they do
mathematics,” and of “how their feelings affect their learning of mathematics” (pp. 354355). Then, as the entries accrued, the journals became an account through time of student progress, historical documents which illuminated tendencies, trends, and patterns
of belief and behavior. At the end of the course, the students themselves commented on
the use of journals:
26
“It gave me an outlet to express my feelings” (p. 354)
“I have been able to realize what I am doing wrong in my thinking process. Once I
know what I am doing wrong, I have been able to change and thus do better” (p. 357)
“I am able to see on paper my thought processes towards problems instead of
some abstract thought in my mind which are hard to keep” (p. 357)
Writing’s self-monitoring influence is also evident in Pugalee’s (2001) study
of student descriptions of thoughts during problem solving. The participants were asked
to record “every thought that came to mind while solving the problem” (p. 238). Knowing that more successful problem solvers have more active metacognitive processes,
Pugalee analyzed the writing samples for evidence of those metacognitive processes. His
findings emphasized the importance of mental awareness and self-regulation, and also
support the claim that writing itself can develop powerful metacognitive tools.
Whether writing about a problem increases a student’s success on that problem, writing an LED is fundamentally an exercise in reflection, and according to Philipp
(2007), who reviewed 23 years of research on beliefs and affect, the “essential ingredient
[for changing beliefs] is reflection upon practice” (p. 309). In both formal and informal
contexts, the benefits of writing are largely tied to its tendency to inspire reflection.
Reflection is both a pre-requisite to and a consequence of writing. First, writers reflect to
organize and refine thoughts into language. Then, as readers of their own thoughts, they
are invited to reflect again, to watch and wonder at themselves.
CHAPTER III
METHODS
Sample
The sample for this study consisted of 40 undergraduate math students
enrolled in Beginning Algebra at Butte-Glenn Community College, in Oroville, California. Beginning Algebra is the second of three remedial mathematics courses currently
offered at Butte College. The students came from two different course sections: 20 students were members of a section which was not asked to write LEDs, creating a control
group; the other 20 students were members of a course section which did write LEDs.
Both course sections began the semester with approximately 35 students, all of whom
were invited to participate in the study. The smaller number of participants is the result
of both student withdrawal and elective non-participation. The researcher was the
instructor in each of these sections.
Data Collection
Since this intervention has no clear precedent, the potential effects were
unpredictable, thus a wide variety of assessment tools were used. Data collected in this
study included
27
28
1. an attitude questionnaire (administered both prior to and following the
treatment),
2. students’ written responses to essay questions,
3. the students’ LEDs themselves,
4. observations made by the teacher over the duration of the course (including
observations of class behaviors and observations of classwork),
5. student scores on the five course tests (including four tests and one final exam),
6. the length of time each student spent taking each test.
The data collection timeline is outlined in Figure 1. The attitude questionnaire and essay
questions, LEDs, teacher observations, and test times are described in greater detail
below.
Questionnaire and Essay Questions
On the fourth day of the course, students were asked to complete Tapia’s
(1996) Attitudes Towards Mathematics Inventory (ATMI), a validated research instrument which measures four attitudinal factors: self-confidence, value, enjoyment, and
motivation. Although the ATMI was developed using high school students, it has also
been validated for use with college students (Tapia & Marsh, 2002).
After completing the initial ATMI, the researcher asked the students in both
course sections to answer two essay questions. The questions encouraged students to
reflect on their own identity as it arises in a mathematics setting and on their relationship to mathematics. Students who were absent on the fourth day of class or
29
Week 1
Week 2
Week 3
Week 4
Week 5
Week 6
Week 7
Week 8
Week 9
Week 10
Week 11
Week 12
Week 13
Week 14
Week 15
Week 16
Week 17
Week 18
Figure 1: Data collection timeline.
who ran out of time to complete the survey and/or answer the essay questions were
encouraged to do so at home.
During the last week of class, students in both course sections were asked to
complete the ATMI again. Students in the experimental (LED writing) group were also
30
asked to provide written answers to several interview-type questions which investigated
students’ views on the effects and usefulness of writing LEDs. In each course section,
several students were absent on this day; these students were asked to complete the
ATMI (and interview questions, where relevant) either at home or in class following the
final exam. Completing the survey under different circumstances could influence students’ responses, particularly in the case of students who had just completed the final
exam. But as only a few students fell into this category, any such effects on the data as a
whole were assumed to be negligible. The questionnaire and both sets of essay questions
can be found in Appendixes A, B, and C.
Lived Experience Descriptions
In addition to the essay questions previously described, students in the
experimental group spent class time writing LEDs on four different occasions throughout the semester: one each during the 5th, 7th, 11th, and 15th weeks of class. These students
received class instruction on writing LEDs. The instructor presented and discussed
examples of LEDs, encouraging students to focus on documenting, rather than interpreting experience. Students wrote the first two LEDs about their experience working on an
in-class problem which had been assigned that day. In order to preserve the accuracy of
the experience as much as possible, students wrote the LEDs immediately after completing the class work. In lieu of writing, students in the control group were given additional time to work on the problem, or time to attempt a similar problem. Prompts for the
student LEDs are found in Appendix D.
31
Not all of the students in the experimental group were present to complete
the first two LEDs. As a result, the instructor decided to conduct the final two LED
assignments on days when a course quiz was scheduled, knowing that attendance
would be unusually high on such days. The quiz itself was used as the subject of the
third LED: after completing the 15-minute quiz, students wrote about the experience of
taking the quiz. For the fourth LED, students were given a choice: to write about the
quiz itself, as in the previous LED, or to write about their experience the previous day
working on an in-class problem. The control group section spent the extra time discussing the quiz and reviewing previous material.
Teacher Observations
The teacher/researcher observed students throughout the course with an eye
to evolving student/subject relationships, as well as student attitudes, success, and persistence. This data category was meant to supplement the data collected in other areas,
rather than to stand alone. Therefore, no formal protocol was followed. Classroom
behavior, as well as class work and homework (e.g., responses to test and homework
questions), were noted. The instructor also participated in several unplanned, studentled discussions about writing LEDs and students’ experience in, and impressions of, the
course in general.
Timed Tests
Thinking that the experience of writing LEDs might affect students’ tolerance
for cognitive struggle, the researcher collected data on the amount of time students
32
spent working on course tests. The tests for this course were designed to be completed
within one class period, although the entire 50-minute period is generally longer than is
needed to complete the work. Students were permitted to use as much or as little of the
time as they chose, and left class when finished. As course tests were handed in, the
researcher manually “time-stamped” each student’s paper, thus recording the number
of minutes the student spent engaged in the work.
Data Analysis
By the end of the semester, student attrition and elective non-participation
left a control group consisting of 20 students and an experimental group consisting of 20
students. The data collected from these two groups included student test scores, test
times, attitude surveys, and the writing assignments themselves. The data analysis for
each of these measures is addressed individually in the following sections.
Analysis of Test Scores
As is typical for the course, students participated in five major tests throughout the semester: four smaller tests and one comprehensive final exam. A repeated
measures analysis was used to look for variation in student test scores in two areas:
between the control group and the experimental group, and, of most interest, between
the two groups over time (group by test).
Analysis of Test Times
In addition to recording students’ test scores, the number of minutes each
student spent working on each of the four course tests was recorded as previously
33
described. As students were given twice as much time to complete the final exam, the
researcher chose not to include test times for the final exam in the analysis. As with the
test score analysis, a repeated measures analysis was used to look for variation in student test times in four areas: between the control group and the experimental group,
between tests, between students, and between the two groups over time (group by test).
Analysis of the Attitude Toward
Mathematics Inventory
The sample size for the analysis of ATMI scores varied slightly from the
sample size used in the analyses of the test scores and test times because two of the subjects in the experimental group did not complete the ATMI administered at the beginning of the course, the “pre-ATMI.” Although these students did complete an ATMI at
the end of the course, this study’s focus on the change in student attitudes, rather than
the attitudes themselves, makes a single measure of a student’s attitude useless, as no
change can be calculated. Thus these students’ data was eliminated from the data set,
and while the sample size for the control group remained 20 students, the sample size
for the experimental group used in the analysis was 18 students.
The ATMI consists of 40 statements; each statement can be categorized into
one of four aspects of attitude: enjoyment (10 items), self confidence (5 items), motivation (15 items), and value (10 items). Students use a Likert scale to respond to each
statement, with choices ranging from “strongly disagree” to “strongly agree”
(Appendix A).
34
To interpret students’ ATMI results, the responses were assigned values 1
through 5. Where appropriate, responses were reverse scored. For example, a “strongly
agree” response to the statement “I really like mathematics” was coded as a 5, while the
same “strongly agree” response to the statement: “Mathematics is dull and boring” was
coded as a 1. In every case, a higher number corresponds to a more positive attitude
toward mathematics; a score completely comprised of 5s could be understood to represent a student who thoroughly enjoys mathematics, is extremely motivated in mathematics, has a great deal of self-confidence in regards to mathematics, and highly values
mathematics. A score comprised solely of 1s represents a student who gets little to no
enjoyment out of mathematics, is not motivated or self-confident in regards to mathematics, and does not value mathematics.
Not all of the students answered every question. If a student failed to answer
a question in either their pre- or post-ATMI, then, as no difference could be calculated
for that question, the question was eliminated from the student’s pre- and post-ATMI
totals and that student’s ATMI scores were calculated using 39, rather than 40 questions.
For this reason, one question was removed from the ATMI totals of four different students in the control group, and one question was removed from the ATMI totals of a
single student in the experimental group. This, of course, lowered the value of these
students’ ATMI totals, and, so, rather than compare ATMI totals, the final ATMI scores
are averages, that is, to calculate a student’s pre-ATMI score the sum of all pre-ATMI
responses to items for which a student had both a pre- and post-ATMI response was
35
divided by the number of such items. While this method eliminated the numerical discrepancy between typical 40-item scores and the five 39-item scores, it cloaked another
concern: not all scores had been created equally. Thirty-three of the students’ scores
were based on the original, unaltered ATMI, and five were based on an individually
adapted ATMI. In essence, the students had responded to different sets of questions.
Could their scores be compared? There seemed to be three options: remove the four partially answered items from every student’s ATMI, weakening the instrument, remove
the five “39-item” students from the data set, substantially shrinking the sample size, or
assume that the difference between a 40-item ATMI and a 39-item ATMI was negligible.
Prioritizing an intact instrument and a healthy sample size, the researcher chose to leave
all 40 questions and all 38 students in the data set.
A two-tailed, paired t test was used to compare the pre- and post-ATMI
scores for both the control group and the experimental group. Hoping to better understand the nature of the students’ attitude changes, the researcher also considered each
attitude subgroup (enjoyment, motivation, self-confidence, and value) individually, and
ran two-tailed, paired t tests on the pre- and post-ATMI scores in each of these areas.
In order to compare the ATMI changes between groups, an independent two
sample t test was run on the differences in pre- and post-ATMI scores, where each student’s difference was assigned to the proper group.
36
Analysis of the Lived Experience
Descriptions
The students’ writing assignments were first read without any particular
theme or pattern in mind. Instead, anything that stood out or made an impression was
highlighted. Rather than organizing the reading schedule by student, the assignments
were read by assignment group. After reading every student’s first writing assignment,
the researcher summarized her observations and then moved on to read the second, the
third, and the fourth assignments, again summarizing observations of each group before
moving on to the next.
From these four sets of observations six themes, or categories, were identified
which seemed to encompass most of what the students had written and emphasized
some of the distinct patterns of thought which stood out to the researcher while reading.
After defining these six themes, the assignments were reread, this time with the themes
in mind. Using a different color for each theme, any text which met a theme’s description was highlighted. Not all of the text was highlighted, as some of it did not fit into
any of the defined categories, but most of the text could be categorized. Nearly every
individual paper included statements from several themes.
Limitations of the Study
The small sample size and single geographic location of the sample limited
this study. In addition, the control and experimental groups were not populated by any
random selection process, but were formed by existing developmental mathematics
37
classes. All participating students were enrolled in Math 108, a Beginning Algebra
course, at Butte-Glenn Community College in Oroville, California.
CHAPTER IV
FINDINGS
Introduction
After reading all of the writing assignments the students produced, the
researcher feels it would be disingenuous to continue to refer to them as LEDs. Convincing the students to write “true” LEDs (pure descriptions of an experience, free of
analysis and interpretation) proved nearly impossible. Despite continuous efforts to
communicate and model this ideal, in the end, students wrote what they wanted to
write: a mix of experience, interpretation, and commentary. This study cannot, therefore,
report on the effects of writing LEDs, only on the effects of being asked to write LEDs
and of the writing experiences which followed.
The findings of this study are described in four sections, representative of the
types of data collected: student test scores, student test times, attitude toward mathematics instrument scores, and writing assignments. Although six types of data were collected, the data collected via teacher observations and student responses to essay questions was deemed insufficient to warrant individual analysis, and was used, instead, to
support the analysis and interpretation of the other four data categories.
38
39
Student Test Scores
The repeated measures analysis used to analyze test scores first compared the
control group’s aggregated test scores to those of the experimental group and then
examined the variation between the two groups’ scores over time.
When viewed collectively, no significant difference was found between the
test scores of the experimental and control groups. The average score over all five tests
for all students in the control group was 72.0%, nearly identical to the average in the
experimental group: 72.2%. The p value of the analysis of variance between groups was
0.993.
The final component of the analysis of variance compared how the test scores
of the two groups changed over time. This analysis addressed the question of whether,
over the course of the semester, participating in the writing assignments had produced a
measureable effect in the experimental group’s ability to perform on tests. The group
averages on each test indicated that while the control group began the semester with
higher test scores than the experimental group, as time went on, the experimental group
caught up to and then surpassed the control group. The analysis of variance on this data
produced a p value of 0.029, well below the 0.05 value commonly accepted as sufficient
to reject the null hypothesis (that the variation between groups in test scores over time
was due to random factors). Thus the data indicates that there is an interaction between
group and time, meaning that the groups were affected differently over time. Figure 2
summarizes these test score results. Table 1 presents both analysis of variance results.
40
Figure 2. Interaction plot comparing average test percent between groups.
Student Test Times
As with the analysis of test scores, a repeated measures analysis was used to
compare test times. The analysis first compared the experimental group’s aggregated
test times to the control group’s aggregated test times and then compared the variation
in the groups’ test times over subsequent tests.
There was a significant difference in the average time spent working on tests
by the control group and the experimental group. Averaged over all four tests, the control group spent an average of 41.2 minutes per test, while the experimental group spent
an average of 48.2 minutes per test. The p value associated with this variance was 0.005,
emphasizing the distinction between groups. Figure 3 illustrates the difference in the
groups’ average test times.
41
Table 1
Analysis of Variance of Student Test Scores
Source
DF
Adj SS
Group
1
0.2
TestNumber
4
Adj MS
F
P
0.15
0.00
0.993
7221.9
1805.48
17.14
0.000
38
66039.5
1737.88
16.50
0.000
4
1174.2
293.54
2.79
0.029
Error
151
15902.8
105.32
Total
198
90628.4
Student(Group)
Group*TestNumber
Note: The TestNumber and Student(Group) p values indicate the significant variation
in test scores on different tests and by different students. Although this variation may
be of some interest, it is not relevant to the purposes of this study. The Group and
Group*TestNumber p values indicate that while the variation between groups’
aggregated test scores was not significant at the p < 0.05 level, the variation between
average group scores over subsequent tests was significant at the p < 0.05 level. That is,
there is a statistically significant interaction between group and test number at the
p < 0.05 level.
The analysis of variance also addresses the question: Is the change over time
in the amount of time students spend working on tests dependent on group? Or in other
words, did the experimental group’s test times evolve differently than the control
group’s test times? The answer appears to be a resounding no. The p value for the interaction between group and test number was 0.303, indicating no statistically significant
interaction between patterns of test time change and group. The p values for the analyses of variance are shown in Table 2.
42
Figure 3. Interaction plot comparing average test time between groups.
Attitude Toward Mathematics Inventory Scores
The pre- and post-ATMI scores for both the control group and the experimental group were compared using a two-tailed, paired t test. The data means indicate
that both groups’ ATMI scores decreased, implying that, on average, the students’ attitudes toward mathematics had worsened. The control group’s average ATMI score
decreased from 3.285 to 3.132, a change of -0.153, but, as the p value for this data was
0.096, this change is not statistically significant at the 0.05 level. The experimental
group’s average score decreased from 3.525 to 3.271, a change of -0.254. The p value
associated with this change, 0.030, indicates that this change falls within the 95%
confidence interval and so could be considered statistically significant. Tables 3 and 4
report these results.
43
Table 2
Analysis of Variance of Student Test Times: Between Groups and Group by Test
Source
DF
Adj SS
Adj MS
Group
1
1598.7
TestNumber
3
F
P
1598.70
8.80
0.005
530.0
176.67
4.62
0.004
38
7061.6
185.83
4.86
0.000
3
140.8
46.95
1.23
0.303
Error
106
4054.9
38.25
Total
151
13730.8
Student(Group)
Group*TestNumber
Note: The TestNumber and Student(Group) p values indicate the significant variation
in test scores on different tests and by different students. Although this variation may
be of some interest, it is not relevant to the purposes of this study. The Group and
Group*TestNumber p values indicate that the variation between groups’ test times was
significant at the p < 0.05 level, while the variation between groups over subsequent
tests was not (i.e., there was no statistically significant interaction between group and
test number).
In addition to comparing the groups’ collective ATMI scores, two-tailed
paired t tests were also run on each of the ATMI subgroups: enjoyment, motivation, selfconfidence, and value. The only control group change found to be statistically significant
at the 95% confidence level was an average decrease in motivation, with a p value of
0.009. The experimental group’s decrease in enjoyment and decrease in self confidence
were both found to be significant at the 95% confidence level, with respective p values of
0.020 and 0.028. Tables 5-13 report these results.
The preceding tests look for and analyze the change in ATMI scores within
each group, but for the purposes of this study, the more significant question is how the
44
Table 3
Paired T Test for Students’ Pre- and Post-ATMI Score: Control Group
N
Mean
SD
SE Mean
Control post-ATMI
20
3.132
0.574
0.128
Control pre-ATMI
20
3.285
0.608
0.136
Difference
20
-0.1531
0.3910
0.0874
95% CI for mean difference: (-0.3361, 0.0299)
t test of mean difference = 0 (vs. ≠ 0): t = -1.75 p = 0.096
Note: Possible ATMI scores range from a low of 1 to a high of 5; not significant at the
p < .05 level.
two groups compare, or, in other words, not whether any single group’s ATMI scores
changed, but whether or not the two groups changed in different ways. An independent
Table 4
Paired T Test for Students’ Pre- and Post-ATMI Score: Experimental Group
N
Mean
SD
SE Mean
Control post-ATMI
18
3.271
0.663
0.156
Control pre-ATMI
18
3.525
0.326
0.077
Difference
18
-0.254
0.457
0.108
95% CI for mean difference: (-0.482, -0.027)
t test of mean difference = 0 (vs. ≠ 0): t = -2.36 p = 0.030
Note: Possible ATMI scores range from a low of 1 to a high of 5; significant at the p < .05
level.
45
Table 5
A Summary of the Change in ATMI Scores in Each of the Four Attitude Subgroups
Enjoyment
Motivation
Self confidence
Value
Average difference:
control group
-0.032
-0.2750*
-0.170
-0.188
Average difference:
experimental group
-0.283*
-0.211
-0.285*
-0.197
*Statistical significance at the p < 0.05 level.
Note: Possible ATMI scores range from a low of 1 to a high of 5.
two-sample t test on the differences in pre-and post-ATMI scores was used to address
this question, comparing between groups. Although an evaluation of the mean differences in Table 5 might suggest that the experimental group’s attitudes worsened more
Table 6
Paired T Test for Students’ ATMI Enjoyment Score: Control Group
N
Mean
SD
SE Mean
Control post-enjoyment
20
3.125
0.641
0.143
Control pre-enjoyment
20
3.157
0.696
0.156
Difference
20
-0.032
0.507
0.113
95% CI for mean difference: (-0.270, 0.205)
t test of mean difference = 0 (vs. ≠ 0) t = -0.29 p = 0.777
Note: Possible ATMI scores range from a low of 1 to a high of 5; not significant at the
p < .05 level.
46
Table 7
Paired T Test for Students’ ATMI Enjoyment Score: Experimental Group
N
Mean
SD
SE Mean
Exp post-enjoyment
18
3.083
0.749
0.177
Exp pre-enjoyment
18
3.367
0.504
0.119
Difference
18
-0.283
0.467
0.110
95% CI for mean difference: (-0.515, -0.051)
t test of mean difference = 0 (vs. ≠ 0): t = -2.57 p = 0.020
Note: Possible ATMI scores range from a low of 1 to a high of 5; significant at the p < .05
level.
than the control group’s attitudes worsened, according to the t tests the distinction is
statistically insignificant. The p values for the ATMI as a whole, and for each of the four
attitude subcategories, range from 0.121 to 0.965, as seen in Tables 14-18.
Table 8
Paired T Test for Students’ ATMI Motivation Score: Control Group
N
Mean
SD
SE Mean
Control post-motivation
20
2.508
0.849
0.190
Control pre-motivation
20
2.783
0.807
0.181
Difference
20
-0.2750
0.4191
0.0937
95% CI for mean difference: (-0.4712, -0.0788)
t test of mean difference = 0 (vs. ≠ 0): t = -2.93 p = 0.009
Note: Possible ATMI scores range from a low of 1 to a high of 5; significant at the p < .05
level.
47
Table 9
Paired T Test for Students’ ATMI Motivation Score: Experimental Group
N
Mean
SD
SE Mean
Exp post-motivation
18
2.914
0.747
0.176
Exp pre-motivation
18
3.125
0.439
0.104
Difference
18
-0.211
0.816
0.192
95% CI for mean difference: (-0.617, 0.195)
t test of mean difference = 0 (vs. ≠ 0): t = -1.10 p = 0.288
Note: Possible ATMI scores range from a low of 1 to a high of 5; not significant at the
p < .05 level.
Writing Assignments
Although the methodology described in Chapter 3 outlines a procedure for
analyzing student LEDs, the procedure is designedly incomplete. Categories of thought
Table 10
Paired T Test for Students’ ATMI Self Confidence Score: Control Group
N
Mean
SD
SE Mean
Control post-self confidence
20
3.100
0.642
0.144
Control pre-self confidence
20
3.270
0.711
0.159
Difference
20
-0.170
0.620
0.139
95% CI for mean difference: (-0.460, 0.120)
t test of mean difference = 0 (vs. ≠ 0): t = -1.23, p = 0.235
Note: Possible ATMI scores range from a low of 1 to a high of 5; not significant at the
p < .05 level.
48
Table 11
Paired T Test for Students’ ATMI Self Confidence Score: Experimental Group
N
Mean
SD
SE Mean
Exp post-self confidence
18
3.248
0.839
0.198
Ex pre-self confidence
18
3.533
0.482
0.114
Difference
18
-0.285
0.505
0.119
95% CI for mean difference: (-0.536, -0.034)
t test of mean difference = 0 (vs. ≠ 0): t = -2.40 p = 0.028.
Note: Possible ATMI scores range from a low of 1 to a high of 5; significant at the p < .05
level.
can only be detected and defined after the assignments have been written and read. This
analysis, therefore, is divided into two sections: “Approach,” which fleshes out the
methodology previously described, and “Analysis,” which uses that methodology to
present findings.
Table 12
Paired T Test for Students’ ATMI Value Score: Control Group
N
Mean
SD
SE Mean
Control post-value
20
3.498
0.689
0.154
Control pre-value
20
3.686
0.903
0.202
Difference
20
-0.188
0.745
0.167
95% CI for mean difference: (-0.537, .0.161)
t test of mean difference = 0 (vs. ≠ 0): t = -1.13 p = 0.273
Note: Possible ATMI scores range from a low of 1 to a high of 5; not significant at the
p < .05 level.
49
Table 13
Paired T Test for Students’ ATMI Value Score: Experimental Group
N
Mean
SD
SE Mean
Exp post-value
18
3.667
0.713
0.168
Ex pre-value
18
3.864
0.475
0.112
Difference
18
-0.197
0.509
0.120
95% CI for mean difference: (-0.451, 0.056)
t test of mean difference = 0 (vs. ≠ 0): t = -1.64 p = 0.119
Note: Possible ATMI scores range from a low of 1 to a high of 5; not significant at the
p < .05 level.
Approach
A first reading of the writing assignments produced six themes, categories
which accounted for most of what students had written and identified prominent
patterns of thought:
1. Statements which characterize, rate, or define either a specific set of problems or
math in general. (Examples: “An extremely easy math problem,” “Math is still hard,”
“The quiz seemed to be an easy one.”)
2. Statements in which a student defines him- or herself in regard to math. (Examples: “I suck at math,” “I’m not good on fraction [sic],” “How bad I am at math.”)
3. Writing which characterizes or rates the interaction between the mathematical
task and the students themselves. Although this might seem similar to the defining
statements of the first two themes, statements in this category do not label a
50
Table 14
Two-sample T Test for ATMI Change
N
Mean
SD
SE Mean
Control group (C)
20
-0.153
0.391
0.087
Experimental group (E)
18
-0.254
0.457
0.11
Difference = μ (C) - μ (E)
Estimate for difference: 0.101
95% CI for mean difference: (-0.181, 0.384)
t test of mean difference = 0 (vs. ≠ 0): t = 0.73 p = 0.470 df = 33
Note: Not significant at the p < 0.05 level.
mathematics problem as intrinsically “hard” or “easy,” nor do they define the student as
either “good” or “bad” at math. Instead, the focus is on the experience, viewed as a student/mathematics interaction. Students acknowledge their own part in the ease,
Table 15
Two-sample T Test for Enjoyment Change
N
Mean
SD
SE Mean
Control group (C)
20
-0.032
0.507
0.11
Experimental group (E)
18
-0.283
0.467
0.11
Difference = μ (C) - μ (E)
Estimate for difference: 0.251
95% CI for mean difference: (-0.070, 0.572)
t test of mean difference = 0 (vs. ≠ 0): t = 1.59 p = 0.121 df = 35
Note: Not significant at the p < 0.05 level.
51
Table 16
Two-sample T Test for Motivation Change
N
Mean
SD
SE Mean
Control group (C)
20
-0.275
0.419
0.094
Experimental group (E)
18
-0.211
0.816
0.19
Difference = μ (C) - μ (E)
Estimate for difference: -0.064
95% CI for mean difference: (-0.505, 0.378)
t test of mean difference = 0 (vs. ≠ 0): t = -0.30 p = 0.768 df = 24
Note: Not significant at the p < 0.05 level.
difficulty, or other aspects of the experience. (Examples: “If I put my mind to it, it was
quite easy,” “Forgot what degree of the expression is had trouble multiplying on
question #9 [sic],” “There were some things that I didn’t completely know.”)
Table 17
Two-sample T Test for Self Confidence Change
N
Mean
SD
SE Mean
Control group (C)
20
-0.170
0.620
0.14
Experimental group (E)
18
-0.285
0.505
0.12
Difference = μ (C) - μ (E)
Estimate for difference: 0.115
95% CI for mean difference: (-0.255, 0.486)
t test of mean difference = 0 (vs. ≠ 0): t = 0.63 p = 0.532 df = 35
Note: Not significant at the p < 0.05 level.
52
Table 18
Two-sample T Test for Value Change
N
Mean
SD
SE Mean
Control group (C)
20
-0.188
0.745
0.17
Experimental group (E)
18
-0.197
0.509
0.12
Difference = μ (C) - μ (E)
Estimate for difference: 0.009
95% CI for mean difference: (-0.409, 0.427)
t test of mean difference = 0 (vs. ≠ 0): t = 0.04 p = 0.965 df = 33;
Note: Not significant at the p < 0.05 level.
4. Writing in which a student reflects on, analyzes, or philosophizes about his or
her mathematics experience. Students may recount personal histories, attempt to explain
the underlying reasons for their success or difficulty on a recent problem, or contemplate
the origins of their own relationship to the subject. (Examples: “In third grade graphing
was introduced to me and I never understood it other than seeing a picture if I conected
[sic] the dots or oh there’s a bunch of dots that I located,” “I think I did well but if not it
was because I didn’t study for too long,” “Working in a group helps a lot for me,” “I
believe that my attention falls more toward the process of using y=mx+b.”)
5. Statements of emotional release. Occasionally the writing assignments seemed to
serve a cathartic purpose for students, giving them an avenue to express some relatively
intense emotion. The feelings commonly expressed included frustration, excitement, and
53
relief. (Examples: “This was bullshit,” “This new material amazes me,” “Blehhhhhh I’m
glad it’s over.”)
6. Messages for the instructor. Some students used the writing assignments to
speak to the instructor: giving feedback, expressing appreciation, or writing for entertainment purposes. (Examples: “If this class was 1½ or 2 hrs long 4 days a week the students (myself) would benefit from the lessons more,” “Thank you Miss Lloyd for all
your hard work, it shows I have a great teacher,” “Then you came over and confirmed
that I am a genius!”)
Both the choice of themes and the process of categorization are admittedly
subjective, and often a piece of writing seemed to fit in more than one category. For
instance, in the last example given (“Then you came over and confirmed that I am a
genius!”), the student both addresses the instructor (“Then you came over”) and defines
himself (“I am a genius!”) thus meeting the criteria for both theme 2 and theme 6. But is
this student genuinely calling himself a genius, or is the statement sarcastic, in which
case he might be actually deriding himself? There is also the possibility that the student
is not making a statement about himself at all, but alluding instead to a comment the
instructor made with which he was either pleased (if the statement is genuine) or displeased (if the statement is sarcastic). If the statement is sarcastic, then perhaps it should
be categorized as an emotional release. Or is he merely making a joke? In cases like this,
the researcher used her personal knowledge of the student and memory of the experience to determine the meaning. In this example, it was decided that while the student
54
was trying to entertain the instructor (and so the sentence should not be taken at face
value), the statement “I am a genius!” is also reflective of his high level of self-belief. The
statement was placed in two categories: messages for the instructor and definitions of
self.
Analyzing test times, test scores, and survey results is a systematic, impersonal endeavor. A computer program does most of the work. But analyzing students’
writing (and, in particular, one’s own students’ writing) can be an intimate, human
undertaking. LEDs are designed to reveal an individual’s inner world. Both as a reader
and, in this case, as a character in the story, the researcher becomes involved and invested, bringing her personal experience, observations and intuition to the table. For this
reason, the following sections are written in a less formal tone, a tone which acknowledges the researcher/teacher’s part in the analysis process.
Analysis
The writing assignments offer a rich area for study. I was given the privilege
of experiencing my course through my students’ eyes, a perspective which will inform
my presentation and assessment style in the future. I was also able to take part in some
of the cognitive and emotional struggles my students experienced, which lent insight
into the sources of student confusion and frustration. But my focus in analyzing the
writing assignments necessarily recalls the purpose of this study: to understand the
effect writing LEDs has on remedial algebra students. In other words, I looked for
55
change: as the semester progressed, how did the writing itself (and, in turn, the students
whom the writing revealed) evolve?
My first impression after reading the writing assignments was that students
began the course defining mathematics and themselves in very firm, flat terms, and finished the course instead describing their own complex interaction with mathematics,
having left simple labels behind. To investigate this further, and with the hope of discovering other patterns of change, I counted the number of individual assignments within each group which had at least one “theme 1” piece of text. As yellow was the color I
had used to identify theme 1 text, I counted the number of papers in each assignment
group with any yellow on them. I then did the same for each of the other themes, collecting by group, by theme frequency data. Note that choosing to count the number of
assignments in which a theme was represented as opposed to counting the number of
representations of a theme emphasizes the evolution of the students as a group, preventing one student from distorting the data with multiple pieces of on-theme text within a
single writing assignment. Table 19 (and Figure 4) summarize the results of this analysis.
The data in Table 19 and Figure 4 appears to support my initial impressions.
The downward trends of theme 1 and theme 2 demonstrate that, as time went on, fewer
and fewer students used the writing assignments to assign fixed definitions to either
themselves or mathematics. Simultaneously, more and more students used the writing
assignments to observe, analyze, and reflect upon their interaction with mathematics, as
indicated by the upward trends of themes 3 and 4. The portion of students whose
56
Table 19
Percentages of Students Whose Writing Assignment Included Theme-related Text
Assignment
Theme
1
2
3
4
1
Defining mathematics
33
40
33
11
2
Defining self
39
13
10
0
3
Characterizing subject/self interaction
28
60
86
68
4
Reflection and analysis
28
53
67
68
5
Emotional release
17
27
43
21
6
Messages for the instructor
17
27
19
11
writing assignments included statements of emotional release (theme 5) or messages for
the instructor (theme 6) remained relatively stable, with the exception of assignment 3,
in which an unusually high number of students made statements of emotional release.
This data describes only the portion of students who mentioned a theme, it
does not represent the prevalence of a theme within students’ individual writing
assignments. In one case, this seems worth mentioning. Although the number of students whose fourth writing assignment held either theme 3 (characterizing the mathematics/student interaction) or theme 4 (reflecting on and analyzing mathematical experience) material is the same, the quantity of writing on each theme was very different. In
the process of reviewing the data, I spread all of the fourth writing assignments on the
floor in front of me. My impression while viewing the fourth assignment was of a sea of
57
100
Theme 1: Defining
Mathematics
90
Theme 2: Defining Self
80
Percent
70
Theme 3: Characterizing
Subject/Self Interaction
60
Theme 4: Reflection and
Analysis
50
40
Theme 5:Emotional
Release
30
Theme 6: Messages for
the Instructor
20
10
0
Assignment 1 Assignment 2 Assignment 3 Assignment 4
Figure 4. Theme representation by assignment.
blue, the color I had chosen to represent theme 4. The assignments did not just touch on
theme 4, theme 4 was the predominant motif of these assignments.
CHAPTER V
DISCUSSION
Both the limitations of this study and the open-ended nature of the research
questions prevent them from being answered in any final, definitive way, but the data
collected clearly indicates change. The ways in which attempting to write LEDs changed
my students surprised and intrigued me. I found change in unexpected places, and
found no change in places where change was expected.
Discussion of Individual Research Questions
Research Question 1
How does writing LEDs affect remedial algebra students’ performance on
course tests? Analyzing the change in students’ test scores was almost an afterthought to
this study; it seemed unlikely that the students’ writing activities would affect their performance on course tests. But as the data was so easy to come by, “test scores” was added to the list of measures to be investigated. To my surprise, this data provided some of
the strongest evidence of change. During the course of the algebra class, the average test
scores of students in the experimental group first caught up to and then surpassed the
scores of those in the control group. This distinct difference between groups was underscored by a p value of 0.029.
58
59
The increase in the experimental groups’ test scores is simpler to document
than to explain. The experimental and control groups’ classes were similarly sized, similarly skilled, and came into the course with similar attitudes toward math, so it seems
reasonable to attribute the distinctive pattern of improvement to the main distinction
between classes, the writing assignments. And as the effect was gradual, it is likely due
to the cumulative, rather than immediate, influence of being asked to write LEDs. But to
understand how completing the writing assignments might have affected test scores we
should first understand how completing the writing assignments affected students. With
this in mind, the question of how being asked to write LEDs might have increased test
scores will be discussed after research question 4 has been addressed.
Research Question 2
How does writing LEDs alter the attitudes of remedial algebra students? At
the outset of this study, changes in student attitudes seemed the most likely consequence of writing LEDs. However, the data collected from student attitude surveys indicated that although some attitude changes were observed within each group, the two
groups’ attitude changes were statistically indistinguishable from one another.
Why did the perspective changes observed in students’ writing assignments
not correlate with measurable attitude changes? As discussed in the literature review,
student success is more dependent on students’ response to emotion rather than the type
or degree of emotion a student experiences. Debellis and Goldin (2006) emphasize the
importance of meta-affect, or affect about affect. Perhaps the changes observed in the
60
writing assignments describe a secondary response to emotion, a new affective pathway,
while the ATMI is only able to measure the original, unchanged emotion. Future studies
might focus on this secondary change, identifying and characterizing student responses
to initial emotions.
Research Question 3
How does writing LEDs alter remedial algebra students’ persistence in the
face of cognitive struggle? The experimental group consistently spent more time working on tests, on average working for approximately seven minutes, or 15%, longer than
the control group. The p value associated with this difference was 0.005. But since the
difference, while pronounced, did not evolve over time, it is difficult to attribute it to the
intervention. At the time of the first test, students in the experimental group had been
introduced to the idea of LEDs, but had yet to write one of their own. Even so, their
average test time was almost eight minutes longer than that of the control group.
What then, might explain the additional time spent by the experimental
group? One possibility relates to scheduling: the control group’s classroom was scheduled for immediate use by another class, while the experimental group’s classroom was
vacant following class. This may have made the control group feel more pressure to finish quickly. Measurement error is another, although unlikely, possibility. Since the first
several minutes of class before a test were usually spent making announcements and
passing out scratch paper, to record test times I needed to subtract out those minutes.
Perhaps I was less consistent in making that adjustment in the experimental group, or
61
perhaps that class regularly took more time getting started on tests. Whatever the reason, further research could attempt to explain or duplicate this result.
Research Question 4
What alterations in students’ relationships to mathematics do LEDs reveal?
Reading students’ writing assignments was easily the most interesting component of
data analysis. Despite my initial concern that the results would be overly subjective,
clear patterns emerged. Students began the semester describing mathematics and themselves in flat, inflexible terms:
“How bad I am at math.”
“I’m good but not THAT good.”
“This shit is hard.”
As the semester progressed, these types of one-dimensional statements were replaced
with statements that acknowledged the interaction between student and subject, the give
and take:
“The substitution method was a challenge for me.”
“This test was quite easy for me.”
“I managed to understand.”
The final writing assignments were replete with reflection and introspection, often
directed at providing constructive criticism for themselves:
62
“It’s stressing [sic] trying to find common denominators to me. I can go through a
whole problem feeling like I did OK and then get to the end and feel like the answer is
completely wrong or doesn’t look right.”
“I have no idea how to figure this stuff out on my own. I use examples for homework and in class we figure it out together … I need a tutor.”
“I was a little mad at first, but I told myself to stay calm and just concentrate.”
My sense, after reading the writing assignments in chronological order, was
that many students had repositioned themselves in regards to math. Students wrote
their first assignments from the point of view of commentator, offering definitive
assessments of the nature of math and of their own abilities. In later assignments, students appeared to have evolved from commentator to participant, an influential element
of the student/subject interaction. By the end of the semester, many students wrote from
the point of view of an activist, an intelligent, contemplative instrument of change.
Is it possible that students in the control group experienced this same evolution? Certainly. In this case, the intervention and instrument are one and the same, so
there is no way to compare these writing assignments to ones written by the control
group. Yet even if this type of transformation is typical of remedial math students, the
act of writing gave the experimental group an opportunity to contemplate their mathematical interactions, likely developing their reflection and insight abilities beyond those
of the control group.
63
Further Discussion
Identifying individual aspects of student change immediately prompts further questions, some of which have been addressed: Why did students who were asked
to write LEDs spend more time taking tests? Why did the perspective changes observed
in students’ writing assignments not correlate with measurable attitude changes? Why
did students who were asked to write LEDs outperform others on course tests? Considering the observed changes as a group, asking how one change relates to another, might
begin to illuminate the essence of the supposed evolution, producing hypotheses which
could direct future research.
The results of research question 1 are particularly intriguing. Student test
scores are intended to be a measure of student understanding, but, in practice, the scores
are also influenced by a student’s test-taking ability and other factors. High levels of
anxiety, low levels of engagement, and difficulty concentrating all affect the final score.
Were the experimental group’s increasing test scores a result of improved mastery of the
material? Or were they reflective of a change in test-taking ability, perhaps a byproduct
of an affective shift?
Several aspects of the findings lead me to believe that the students’ improved
scores should be attributed primarily to increased understanding. First, according to the
ATMI results, these students’ enjoyment of mathematics and self confidence in regards
to mathematics both decreased over the course of the semester. Their motivation and
value scores also decreased, although not by any statistically significant amount. If the
64
higher test scores are associated with a more positive, optimistic outlook, with improved
self belief or greater determination, then surely this would have shown up in the ATMI
results.
Secondly, although the experimental group’s average score on the final exam
was still significantly higher than the control group’s average score, the difference was
somewhat less pronounced than it had been on the previous test. If their superiority
were due simply to better test-taking abilities, their advantage should have been similar
on the final exam. But unlike previous tests, the final exam was decidedly cumulative; it
included questions which were nearly identical to those on all four previous tests. On
test 1 and test 2, the control group’s average score was higher. Thus, it seems likely that
the experimental group’s slightly depressed scores are reflective of earlier shortcomings
in comprehension, supporting the argument that the improved performance is not likely
due to enhanced test-taking skills.
And finally, the changes documented in students’ writing assignments
describe a process of evolution. These victims of “hard” math and inferior mathematical
talent became instruments of change; they ascribed success and failure to their own
choices and, in so doing, gained power. Their mathematical experience was within their
control. Students used the later assignments to diagnose their own mathematical weaknesses and prescribe treatments: more study time, relaxing self-talk, and participation in
study groups. Although we have no way of knowing whether students took their own
advice, it seems reasonable to assume that some did. This sort of LED–inspired self-
65
treatment describes the mechanism by which increased understanding might evolve.
While writing LEDs, students observed their own failings, found reasons for or solutions
to those failings, and then resolved to do better. Future studies might look for LED–
inspired changes in student behavior, both in and out of class.
Recommendations
In addition to attempting to duplicate the results of this study, future studies
might try to explain the results. If improved test scores are typical of students who are
asked to write LEDs, then identifying the ways in which the intervention works could
inform application of the intervention. This study asked how writing LEDs affected students. Future studies might investigate the ways in which reading LEDs affects teachers,
or could use the descriptions to inform research in cognitive/affective processes. The use
of LEDs in mathematics classrooms is new and promising territory.
REFERENCES
REFERENCES
Allen, B. D., & Carifio, J. (2007). Mathematical sophistication and differentiated emotions
during mathematical problem solving. Journal of Mathematics & Statistics, 3(4),
163-167.
American Mathematical Association of Two-year Colleges. (2006). Beyond crossroads.
Implementing mathematics standards in the first two years of college. Memphis:
Author.
Ashcraft, M. H. (2002). Math anxiety: Personal, educational, and cognitive consequences.
Current Directions in Psychological Science, 11(5), 181-185.
Bahr, P. R. (2008). Does mathematics remediation work?: A comparative analysis of
academic attainment among community college students. Research in Higher
Education, 49(5), 420-450.
Bailey, T., Jeong, D., & Cho, S. (2010). Referral, enrollment, and completion in developmental education sequences in community colleges. Economics of Education
Review, 29(2), 255-270.
Bailey, T., Jenkins, D., & Leinbach, T. (2005, January). Community college low-income and
minority student completion study: Descriptive statistics from the 1992 high school
cohort. New York: Community College Research Center, Columbia
University.
Bonham, B. S., & Boylan, H. R. (2011). Developmental mathematics: Challenges, promising practices, and recent initiatives. Journal Of Developmental Education, 34(3),
2-4.
Borasi, R., & Rose, B. J. (1989). Journal writing and mathematics instruction. Educational
Studies in Mathematics, 20(4), 347-365.
Bossé, M. J., & Faulconer, J. (2008). Learning and assessing mathematics through reading
and writing. School Science and Mathematics, 108(1), 8-19.
Boylan, H. R. (2011). Improving success in developmental mathematics: An interview
with Paul Nolting. Journal Of Developmental Education, 34(3), 20-22.
Bruner, J. S. (1990). Acts of meaning. Cambridge, MA: Harvard University Press.
67
68
Burton, L. (1999) The practices of mathematicians: What do they tell us about coming to
know mathematics? Educational Studies in Mathematics. 37(2), 121-143.
California State University. (2014). Analytic studies [data file]. Retrieved from
http://www.asd.calstate.edu/performance/proficiency.shtml
Carnegie Foundation for the Advancement of Teaching. Developmental math: What is the
problem. Retrieved from: http://www.carnegiefoundation.org/print/1260
Debellis, V. A., & Goldin, G. A. (1999). Aspects of affect: Mathematical intimacy, mathematical integrity. In O. Zaslavsky (Ed.), Proceedings of the Twenty-third Annual
Meeting of PME (vol. 2) (pp. 249-256). Haifa, Israel: Technion Printing Center.
DeBellis, V. A., & Goldin, G. A. (2006). Affect and meta-affect in mathematical problem
solving: A representational perspective. Educational Studies in Mathematics, 63(2), 131-147.
Dweck, C. (2008). Mindsets and math/science achievement. New York: Carnegie Corporation of New York Institute for Advanced Study.
Faust, M. W. (1992). Analysis of physiological reactivity in mathematics anxiety (Unpublished
doctoral dissertation). Bowling Green State University, Bowling Green, Ohio.
Goldin, G. A. (2002). Affect, meta-affect, and mathematical belief structures. In G. C.
Leder, E. Pehkonen, & G. Torner (Eds.), Beliefs: A hidden variable in mathematics
education? (pp. 59-72). Dordrecht, The Netherlands: Kluwer.
Grassl, R. (2010). The effects of motivation, perceived learning strategy use, and mathematics
anxiety on the mathematics competency of postsecondary developmental mathematics
students (Doctoral dissertation). Available from ProQuest LLC (UMI No.
3437960)
Handa, Y. (2011). What does understanding mathematics mean for teachers?: Relationship as a metaphor for knowing. New York: Routledge.
Hannula, M. S. (2002). Attitude towards mathematics: Emotions, expectations and values. Educational studies in Mathematics, 49(1), 25-46.
Hembree, R. (1990). The nature, effects, and relief of mathematics anxiety. Journal for
Research in Mathematics Education, 21(1), 33-46.
Heyd-Metzuyanim, E., & Sfard, A. (2012). Identity struggles in the mathematics classroom: On learning mathematics as an interplay of mathematizing and identifying. International Journal of Educational Research, 51-52, 128-145.
69
Hiebert, J., Carpenter, T., Fennema, E., Fuson, K., Human, P., Murray, H., … Wearne, W.
(1996). Problem solving as a basis for reform in curriculum and instruction:
The case of mathematics. Educational Researcher, 25(4), 12-21.
Jardine, D. W. (2006). On the ecologies of mathematical language and the rhythms of the
earth. In D. W. Jardine, S. Friesen, & P. Clifford (Eds.), Curriculum in abundance (pp. 187-200). Mahwah, NJ: Lawrence Erlbaum Associates.
Kinneavy, J. L. (1983). Writing across the curriculum. Profession, 13-20.
Levine-Brown, P., Bonham, B. S., Saxon, D. P., & Boylan, H. R. (2008). Affective assessment
for developmental students, Part 2, 22(2), 1-4.
Liljedahl, P. G. (2005). Mathematical discovery and affect: The effect of AHA! experiences on undergraduate mathematics students. International Journal of Mathematical Education in Science & Technology, 36(2/3), 219-235.
Lim, L., & Pugalee, D. K. (2004). Using journal writing to explore “They communicate to
learn mathematics and they learn to communicate mathematically.” Ontario
Action Researcher, 7(2), 17-24.
Ma, X., & Xu, J. (2004). Determining the causal ordering between attitude toward mathematics and achievement in mathematics. American Journal of Education,
110(3), 256-280.
Malmivuori, M.-L. (2001). The dynamics of affect, cognition, and social environment in the
regulation of personal learning processes: The case of mathematics (Unpublished
dissertation). University of Helsinki, Finland.
Malmivuori, M. L. (2006). Affect and self-regulation. Educational Studies in Mathematics, 63(2), 149-164.
McLeod, D. B. (1992). Research on affect in mathematics education: A reconceptualization. In D. A. Grouws (Ed.), Handbook of research on mathematics teaching and
learning (pp. 575-596). New York: MacMillan.
McLeod, D. B. (1994). Research on affect and mathematics learning in the JRME: 1970 to
present. Journal For Research In Mathematics Education, 25(6), 637-47.
Mekonnen, A., & Reznichenko, N. (2008, October). Factors that contribute to the failure of
developmental mathematics courses. Paper presented at the National Council of
Teachers of Mathematics Regional Conference, Cleveland, OH.
70
Merseth, K. K. (2011). Update: Report on innovations in developmental mathematics—
moving mathematical graveyards. Journal of Developmental Education, 34(3),
32-33.
National Council of Teachers of Mathematics. (2000). Principles and standards for school
mathematics. Reston, VA: Author.
National Council of Teachers of Mathematics. (2014). Principles to actions: Ensuring mathematical success for all. Reston, VA: Author.
Op’t Eynde, P., De Corte, E., & Verschaffel, L. (2006). Accepting emotional complexity: A
socio-constructivist perspective on the role of emotions in the mathematics
classroom. Educational Studies in Mathematics, 63(2), 193-207.
Op’t Eynde, P., & Turner, J. E. (2006). Focusing on the complexity of emotion issues in
academic learning: A dynamical component systems approach. Educational
Psychology Review, 18(4), 361-376.
Philipp, R. A. (2007). Mathematics teachers’ beliefs and affect. In F. K. Lester (Ed.),
Second handbook of research on mathematics teaching and learning (pp. 257-315).
Charlotte, NC: Information Age.
Pugalee, D. K. (1997). Connecting writing to the mathematics curriculum. The Mathematics Teacher, 90(4), 308-310.
Pugalee, D. K. (2001). Writing, mathematics, and metacognition: Looking for connections
through students’ work in mathematical problem solving. School Science and
Mathematics, 101(5), 236-245.
Pugalee, D. K. (2004). A comparison of verbal and written descriptions of students’
problem solving processes. Educational Studies in Mathematics, 55(1-3), 27-47.
Saxon, D. P., Levine-Brown, P., & Boylan, H. R. (2008). Affective assessment for developmental students, Part 1. Research in Developmental Education, 22(1), 1-4.
Sierpinska, A. (2006). Sources of students’ frustration in bridging mathematics courses.
In Novotna, J., Moraova, H., Kratka, M., & Stehlikova, N. (Eds.). Proceedings of
30th Conference of the International Group for the Psychology of Mathematics Education (vol. 5) (pp. 121-129). Prague: PME.
Stinson, A. B. (2009). An Autoethnography: A mathematics teacher’s journey of identity construction and change (Doctoral dissertation). Available from ProQuest LLC
(ED515207)
71
Strong American Schools. (2008). Diploma to nowhere. Retrieved from
http://inpathways.net/DiplomaToNowhere.pdf
Tapia, M. (1996). The attitudes toward mathematics instrument. Paper presented at the
annual meeting of the Mid-South Educational Research Association,
Tuscaloosa, AL.
Tapia, M., & Marsh, G. (2002). Confirmatory factor analysis of the attitudes toward mathematics inventory. Paper presented at the annual meeting of the Mid-South
Educational Research Association, Chattanooga, TN.
Turner, J. C., Midgley, C., Meyer, D. K., Gheen, M., Anderman, E. M., Kang, Y., &
Patrick, H. (2002). The classroom environment and students’ reports of
avoidance strategies in mathematics: A multimethod study. Journal of Educational Psychology, 94(1), 88-106.
Van Manen, M. (1990). Researching lived experience: Human science for an action sensitive
pedagogy. Albany: State University of New York Press.
Woodard, T. (2004). The effects of math anxiety on post-secondary developmental students as related to achievement, gender, and age. Inquiry, 9(1). Retrieved
from http://www.vccaedu.org/inquiry/index.html
Young, C. B., Wu, S. S., & Menon, V. (2012). The neurodevelopmental basis of math
anxiety. Psychological Science, 23(5), 492-501. doi:10.1177/0956797611429134
Zientek, L. R., Yetkiner Ozel, Z. E., Fong, C. J., & Griffin, M. (2013). Student success in
developmental mathematics courses. Community College Journal of Research
and Practice, 37(12), 990-1010.
APPENDIX A
MATHEMATICS ATTITUDE INSTRUMENT
(SD=Strongly disagree; D=Disagree; N=Neither agree nor disagree; A=Agree;
SA=Strongly agree)
SD D
1.
N
A SA
I get a great deal of satisfaction out of solving a mathematics
problem.
2.
I have usually enjoyed studying mathematics in school.
3.
Mathematics is dull and boring.
4.
I like to solve new problems in mathematics.
5.
I would prefer to do an assignment in mathematics than to
write an essay.
6.
I really like mathematics.
7.
I am happier in a mathematics class than in any other class.
8.
Mathematics is a very interesting subject.
9.
I am comfortable expressing my own ideas on how to look for
solutions to a difficult problem in mathematics.
10. I am comfortable answering questions in mathematics classes. 11. I am confident that I could learn advanced mathematics.
12. I would like to avoid using mathematics in university.
13. I am willing to take more than the required amount of
mathematics.
14. I plan to take as much mathematics as I can during my
education.
15. The challenge of mathematics appeals to me.
16. Mathematics is one of my most dreaded subjects.
17. My mind goes blank and I am unable to think clearly when
working with mathematics.
18. Studying mathematics makes me feel nervous.
73
74
SD D
N
A SA
19. Mathematics makes me feel uncomfortable.
20. I am always under a terrible strain in a mathematics class.
21. When I hear the word mathematics, I have a feeling of dislike. 22. It makes me nervous to even think about having to do a
mathematics problem.
23. Mathematics does not scare me at all.
24. I expect to do fairly well in any mathematics class I take.
25. I am always confused in my mathematics class.
26. I have a lot of self-confidence when it comes to mathematics.
27. I am able to solve mathematics problems without too much
difficulty.
28. I feel a sense of insecurity when attempting mathematics.
29. I learn mathematics easily.
30. I believe I am good at solving mathematics problems.
31. Mathematics is a very worthwhile and necessary subject.
32. I want to develop my mathematical skills.
33. Mathematics helps to develop the mind and teaches a person
to think.
34. Mathematics is important in everyday life.
35. Mathematics is one of the most important subjects for people
to study.
36. College mathematics lessons would be very helpful no matter
what I decide to study in the future.
37. I can think of many ways that I use mathematics outside of
school.
38. I think studying advanced mathematics is useful.
39. I believe studying mathematics helps me with problem
solving in other areas.
40. A strong mathematics background could help me in my
professional life.
APPENDIX B
SHORT ESSAY 1
Sometimes we bring different versions of ourselves to different activities. For example,
someone who knows you only from your English class might describe your personality
differently than someone who knows you only from your PE class. Try to describe the
persona you bring to mathematics (not just math class), both in terms of how you see
yourself and how you think others (classmates, teachers) might see you.
We tend to use the word relationship to mean the connection between two people, but
we can also use it to describe the connection between a person and a subject. Describe
your “relationship” to mathematics in a few sentences, using the metaphor of
interpersonal relationships as a starting point.
76
APPENDIX C
SHORT ESSAY 2
During this course you were asked to write detailed descriptions of mathematical
experiences. What did you think of the assignment? Does anything about the experience
stand out?
Did you get anything out of the write up exercises, and if so, could you explain?
78
APPENDIX D
WRITING PROMPTS
1. Think back upon a time when you had a particularly strong emotional response—
positive or negative— in relation to mathematics. It could be in a classroom setting or
outside, as long as it’s related to mathematics. Please write in the present tense, focusing
as much as you can on what was happening for you emotionally and even in your body
(e.g., sweating, heart beating, etc). Also, make sure to focus on the kinds of thoughts that
are running through your mind.
2. Take a moment from the past week or two in this class when you were either
struggling with or frustrated at learning mathematics. Please write in the present tense,
focusing as much as you can on what was happening for you emotionally and even in
your body (e.g., sweating, heart beating, etc). Also, make sure to focus on the kinds of
thoughts that are running through your mind.
3. Take a moment from the past week or two in this class when something made sense
for you, or when you were able to have a feeling of understanding. If you cannot think
of an episode like this, then focus instead on a moment when you were either struggling
with or frustrated at learning mathematics. Please write in the present tense, focusing as
much as you can on what was happening for you emotionally and even in your body
(e.g., sweating, heart beating, etc). Also, make sure to focus on the kinds of thoughts that
are running through your mind.
4. During the lesson, I had asked you to pay particular attention to a portion of the
lesson which I marked by ringing a bell. Please write about your experience following
the ringing of the bell. Please write in the present tense, focusing as much as you can on
what was happening for you emotionally and even in your body (e.g., sweating, heart
beating, etc). Also, make sure to focus on the kinds of thoughts that are running through
your mind.
5. During today’s lesson you were given the opportunity to work on a problem first
independently and then with other students. Please describe that experience as it
happened, in the present tense. In addition to narrating what you were thinking, be sure
to describe what you were feeling, both in terms of emotions and physical sensations.
The more completely and accurately/honestly you are able to capture/paint the
experience, the better.
80
81
6. During today’s lesson you took a short quiz. Please describe that experience as it
happened, in the present tense. In addition to narrating what you were thinking, be sure
to describe what you were feeling, both in terms of emotions and physical sensations.
The more completely and accurately/honestly you are able to capture/paint the
experience, the better.
7. Try to recall an experience from the past week when you had a particularly strong
emotional response—either positive or negative—in relation to mathematics. Please
describe that experience as it happened, in the present tense. In addition to narrating
what you were thinking, be sure to describe what you were feeling, both in terms of
emotions and physical sensations. The more completely and accurately/honestly you are
able to capture/paint the experience, the better.
8. Try to recall an experience from the past week when you had a particularly strong
positive emotional response in relation to mathematics. Please describe that experience
as it happened, in the present tense. Include any relevant back story (for example the
experience may have started out negative before it became positive). In addition to
narrating what you were thinking, be sure to describe what you were feeling, both in
terms of emotions and physical sensations. The more completely and
accurately/honestly you are able to capture/paint the experience, the better.
9. Try to recall an experience from the past week when you had a particularly strong
negative emotional response in relation to mathematics. Please describe that experience
as it happened, in the present tense. In addition to narrating what you were thinking, be
sure to describe what you were feeling, both in terms of emotions and physical
sensations. The more completely and accurately/honestly you are able to capture/paint
the experience, the better.


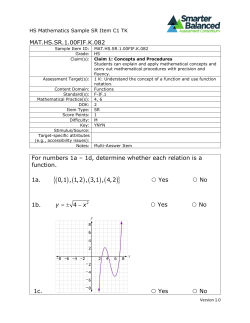


© Copyright 2026