
Full Text
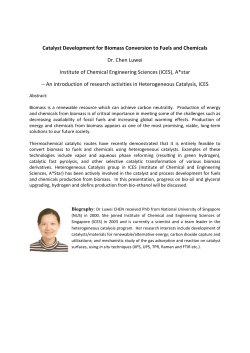
Page 1 of 43 The Plant Genome Accepted paper, posted 04/15/2015. doi:10.3835/plantgenome2014.12.0090 Genomic prediction of biomass yield in two selection cycles of a tetraploid alfalfa breeding population Xuehui Li, Yanling Wei, Ananta Acharya, Julie L. Hansen, Jamie L. Crawford, Donald R. Viands, Réal Michaud, Annie Claessens, and E. Charles Brummer* X. Li, Department of Plant Sciences, North Dakota State University, Fargo, ND 58108 A. Acharya, Department of Crop and Soil Sciences, University of Georgia, Athens, GA 30602 J.L. Hansen, J.L. Crawford, and D.R. Viands, School of Integrative Plant Science, Plant Breeding and Genetics Section, Cornell University, Ithaca, NY 14850 R. Michaud and A. Claessens, Agriculture and Agri-Food Canada, Quebec, QC G1V 2J3, Canada Y. Wei and E.C. Brummer, Plant Breeding Center and Department of Plant Sciences, The University of California, Davis, CA 95616 Received ___________. *Corresponding author ([email protected]). Abbreviations: MAS, marker-assisted selection; GS, genomic selection; LD, linkage disequilibrium; GBS, genotyping-by-sequencing. The Plant Genome Accepted paper, posted 04/15/2015. doi:10.3835/plantgenome2014.12.0090 Abstract Alfalfa is a widely planted perennial forage legume grown throughout temperate and dry subtropical regions in the world. Long-breeding cycles limit genetic improvement of alfalfa, particularly for complex traits such as biomass yield. Genomic selection (GS), based on predicted breeding values obtained using genomewide molecular markers could enhance breeding efficiency in terms of gain per unit time and cost. In this study, we genotyped tetraploid alfalfa plants that had previously been evaluated for yield during two cycles of phenotypic selection using genotyping-by-sequencing (GBS). We then developed prediction equations using yield data from three locations. Approximately 10,000 SNP markers were useful for GS modeling. The genomic prediction accuracy of total biomass yield ranged from 0.34 to 0.51 for the Cycle 0 population and from 0.21 to 0.66 for the Cycle 1 population, depending on the location. The GS model developed using Cycle 0 as the training population in predicting total biomass yield in Cycle 1 resulted in accuracies up to 0.40. Both genotype by environment interaction and the number of harvests and years used to generate yield phenotypes had effects on prediction accuracy across generations and locations., Based on our results, the selection efficiency per unit time for GS is higher than phenotypic selection, although accuracies will likely decline across multiple selection cycles. This study provided evidence that GS can accelerate genetic gain in alfalfa for biomass yield. Page 2 of 43 Page 3 of 43 The Plant Genome Accepted paper, posted 04/15/2015. doi:10.3835/plantgenome2014.12.0090 Alfalfa is one of the most important perennial forage legumes in temperate and subtropical regions in the world. Most alfalfa cultivars are synthetic populations of genetically heterogeneous plants that are heterozygous at many loci throughout the genome. Breeding is conducted as recurrent selection with or without progeny testing. The focus of most breeding programs is on improvements in disease and insect resistance, which have been striking over the past 60 years, on long-term persistence, and on other specific traits, such as multifoliolate leaflets and recently, transgenes, such as Roundup Ready. Increased yield is often not explicitly selected and in fact, yield improvement has stagnated in recent years (Brummer and Casler 2014). Even with intentional selection for biomass yield, progress is likely to be slow due to long selection cycles required to adequately assess multi-year persistence. One way to improve breeding selection efficiency is to select molecular markers associated with desirable target trait alleles (Lande and Thompson, 1990). Genomic selection (GS) using markers across the genome to predict breeding values could accelerate genetic gain in both animals and plants. To conduct GS, phenotypic and genotypic data are collected in a training population so that effects of all markers can be simultaneously estimated to develop a prediction equation (Meuwissen et al., 2001). Based on the GS prediction model, genomic estimated breeding values (GEBVs) are computed on individual plants and serve as the basis for selection in subsequent cycles. Similar to marker-assisted selection (MAS), GS could accelerate breeding by selecting candidate individuals at an early stage and/or in an off-season nursery or green house. Instead of only focusing on previously identified major quantitative trait loci (QTLs) in MAS, small- to medium-effect QTLs could be also captured using markers across the entire genome, thereby contributing to prediction accuracy in GS (Meuwissen et al., 2001). Numerous simulation and empirical studies have shown that GS is superior to MAS on The Plant Genome Accepted paper, posted 04/15/2015. doi:10.3835/plantgenome2014.12.0090 prediction accuracy (Bernardo and Yu, 2007; Heffner et al., 2011; Lorenzana and Bernardo, 2009; Zhong et al., 2009). Genomic selection has been reported to result in greater response in actual selection experiments and breeding programs (Asoro et al., 2013; Massman et al., 2013). Alfalfa and other perennial crops could greatly benefit from GS by reducing the time to complete each breeding cycle (Hayes et al., 2013; Li and Brummer, 2012; Resende et al., 2014). Transcriptome sequencing has identified millions of single nucleotide polymorphisms (SNP) in alfalfa (Han et al., 2011; Li et al., 2012; Yang et al., 2011), some of which have been used to develop an Illumina Infinium SNP array containing about 10,000 SNP markers (Li et al., 2014a). In addition, we have identified thousands of SNP using Genotyping-by-Sequencing (GBS) (Elshire et al., 2011), and have genetically mapped them in a tetraploid alfalfa biparental population (Li et al., 2014b). These advances in genotyping make exploration of GS in an alfalfa breeding population possible. For a previous experiment, we conducted two cycles of recurrent selection for high yield in the autotetraploid alfalfa breeding population NY0358. In this experiment, we genotyped the same plants that were evaluated in each of those two selection cycles using GBS and explored genome prediction accuracy of biomass yield across locations and breeding cycles. MATERIALS AND METHODS Plant material The tetraploid breeding population (NY0358) used in this experiment was described in Li et al. (2011b). Briefly, NY0358 was a strain cross between three commercial cultivars, 5454, Oneida VR (Viands et al., 1990), and AC Viva. The fall dormancy ratings (Teuber et al., 1998) were 4 for 5454 and 3 for Oneida VR and AC Viva. Approximately 100 plants of each cultivar were Page 4 of 43 Page 5 of 43 The Plant Genome Accepted paper, posted 04/15/2015. doi:10.3835/plantgenome2014.12.0090 intercrossed in the greenhouse. Seeds from those crosses were germinated in the greenhouse, and approximately 100 randomly chosen progeny were subsequently intercrossed to form the Cycle 0 (C0) base population. Phenotypic selection and data collection Evaluations were conducted using clonal ramets in each of two cycles of selection. Details of the first cycle of selection were given in Li et al. (2011b). Briefly, cuttings of 190 randomly selected genotypes from the C0 population were made in the greenhouse. The rooted clones were then planted into field experiments at the Agronomy and Agricultural Engineering Research Farm west of Ames, IA, in April 2004; at the Snyder 5 east field adjacent to the Game Farm Road Weather Station in Ithaca, NY, in June 2004; and at the Harlaka experimental site in Levis, QC, in May 2005. At each location, each genotype was clonally replicated nine times in the experiment, with three clones of each genotype representing an experimental unit in each of three replications of a randomized complete block design. Clones were spaced 15 cm apart within plot and plots were spaced 75 cm apart with rows. Rows were 75 cm apart. Nurseries in IA and NY were oversown with the low-growing turfgrass creeping red fescue (Festuca rubra L.) to minimize weed encroachment and eliminate the need for cultivation. No yield data were collected in the year of establishment. Yield data were collected in 2005 at Iowa and New York and at all locations in 2006 by hand clipping forage approximately 5 cm above the soil surface. In NY and IA, grass was removed prior to weighing each plot. Between two and four harvests were taken at each location in each year (Table 1). For each harvest in a given year and location, random samples were taken of harvested biomass, weighed wet, dried for 5 d at 60oC in a forcedair dryer, and then weighed dry. The average dry matter content of the samples was used to compute dry matter biomass yield of each plant. The Plant Genome Accepted paper, posted 04/15/2015. doi:10.3835/plantgenome2014.12.0090 The 20 highest yielding genotypes based on the mean biomass yield across the three locations were selected from Cycle 0 and randomly mated to generate the Cycle 1 (C1) population. In spring 2009, 185 C1 genotypes were clonally propagated and planted at NY and QC as described above; Iowa was not included in the second cycle. Biomass yield was measured at NY in 2010 (NY10) and 2011 (NY11) and at QC in 2010 (QC10) (Table 1). Two or three harvests were taken each year at each location (Table 1). The dry matter biomass yield was collected for each harvest as described in Cycle 0 above, with the exception of the first harvest at NY in 2011. For that harvest, grass was mowed in between rows prior to harvest, but grass within the row was included in the plot weight. Phenotypic data analysis Yield data were collected for 14 harvests across three locations for Cycle 0 and eight harvests across two locations for Cycle 1. The yield of individual harvests at a location was summed to obtain total biomass yield at each location. Total biomass yield across locations was then analyzed using a generalized linear model as follows: yijk = µ +lk + ri(k) + gj + gljk + εijk (1) in which yijk is the yield for the jth genotype in the ith replication of the kth location, µ is the grand mean, lk is the effect of the kth location, ri(k) is the effect of ith replication nested in the kth location, gj is the genetic effect of the jth genotype, glij is the interaction effect of jth genotype and kth location, and eijk is the residual. All factors were considered as random, and the ANOVA was performed using PROC GLM (SAS Institute, 2010). Significant genotype × location interaction was found in both cycles (data not shown), and therefore, we subsequently analyzed individual locations separately. Page 6 of 43 Page 7 of 43 The Plant Genome Accepted paper, posted 04/15/2015. doi:10.3835/plantgenome2014.12.0090 For each individual harvest in a given environment, best linear unbiased predictors (BLUPs) were estimated using a random effects model. The model was yij = µ + ri + g j + εij (2) in which yij was the yield value for the jth genotype in the ith replication, µ was the grand mean yield of the specific harvest in the specific environment being evaluated, ri was the effect of the ith replication, gj was the genetic effect of the jth genotype, and εik was the residual. The grand mean is the only fixed effect and others are considered as random effects. The BLUPs of total biomass yield at each location were estimated with the same mixed model (2), substituting total biomass yield for yield of a specific harvest. The estimated BLUPs, denoted as y, were considered as the observed phenotypic values for GS prediction model evaluation. To estimate the BLUP of total biomass yield across locations, the estimated BLUPs at each location were fit to a mixed model as follows: y jk = µ + lk + g j + ε jk (3) in which yjk is the estimated BLUPs for the jth genotype in the kth location, µ is the grand mean, lk is the effect of the kth location, gj is the genetic effect of the jth genotype. The grand mean and location are considered as fixed effects and the genotypes were treated as random effects. In all cases, the BLUPs estimation was performed using the R package lme4 (R Development Core Team, 2008). The estimated BLUPs were considered as the observed phenotypic values of total biomass yield for further GS prediction model evaluation. The genotype (σ2g) and residual (σ2) variance components were estimated using the mixed model (2) and used to compute broad-sense heritability as: H2 = σ g2 (σ 2 / r + σ g2 ) (4) The Plant Genome Accepted paper, posted 04/15/2015. doi:10.3835/plantgenome2014.12.0090 DNA isolation, GBS library construction, and sequencing DNA was isolated from C0 plants using the traditional CTAB method (Doyle and Doyle, 1990) in a 96 well format; for C1, DNA was isolated with the Wizard® Genomic DNA Purification Kit (Promega, A1125) per the manufacturer’s instructions. DNA was quantified with a Quant-iT PicoGreen dsDNA assay kit (Life Technologies, P7589). One library was constructed each for C0 at 190-plex and C1 at 185-plex, using the protocol of Elshire et al. (2011) with minor modifications. Briefly, 100 ng of each DNA was digested with ApeKI (NEB, R0643L), and then ligated to a unique barcoded adapter and a common adapter. An equal volume of the ligated product from each genotype was pooled and the mixture was purified using the QIAquick PCR purification kit (QIAGEN, 28104) prior to PCR amplification. In the PCR, 50 ng of template DNA was mixed with NEB 2X Taq Master Mix and two primers (5 nmoles each) in a 50 ul total volume and amplified on a thermocycler for 18 cycles with 10 sec of denaturation at 98 ºC, followed by 30 sec of annealing at 65 ºC, and finally 30 sec extension at 72 ºC. Each library was sequenced in two lanes on Illumina HiSeq 2000 at the Genomic Sequencing and Analysis Facility at the University of Texas at Austin, Texas, USA. All sequences were submitted to the National Center for Biotechnology Information (NCBI) Short Read Archive (study #SRX685967). Genotype calling The UNEAK pipeline (Lu et al., 2013) was used for SNP discovery and genotype calling. Briefly, the raw reads (100 bp, single end read) obtained from the sequencer were first quality filtered and de-multiplexed. All reads that began with one of the expected barcodes immediately followed by the expected cut site remnant (CAGC or CTGC for ApeKI) were trimmed to 64 bp Page 8 of 43 Page 9 of 43 The Plant Genome Accepted paper, posted 04/15/2015. doi:10.3835/plantgenome2014.12.0090 (including the cut site remnant but removing the barcode). Reads with identical sequences were grouped into one tag. The tags with 10 or more reads across all individuals were retained for pairwise alignment. Pairwise alignment was performed to find pairs of tags that differed by only 1 bp. For each SNP marker, the read distribution of the paired tags in each individual was used for SNP genotype calling as described by Li et al. (2014b). Briefly, for a given SNP (e.g., A/T), if only a single allele was observed for a given individual, then a minimum of eleven reads was required to call a homozygote (e.g., AAAA). If fewer than eleven reads were present, we assigned a missing genotype to avoid misclassifying a triplex heterozygote (AAAT) as homozygous. The probability of miscalling a triplex heterozygote as a homozygote (AAAA) is less than 0.05 if eleven or more reads are present and allele amplification is unbiased. When both alleles were observed in a given individual, we required a minimum of two reads per allele and a minimum minor allele frequency for that locus in a given individual greater than 0.10 to call a heterozygote; otherwise a missing genotype call (NA) was assigned. Requiring two reads of the minor allele limits the likelihood that an allele resulted from a sequencing error. However, if a large number of sequencing reads are available for a given locus, multiple sequencing errors might be likely. Therefore, we included the minor allele frequency limit to avoid calling homozygotes as heterozygotes that were obtained solely due to sequence errors. Reliably discriminating among the three heterozygote genotypes in an autotetraploid would require a read depth of at least 60 (Uitdewilligen et al., 2013). Because only a small percentage of our GBS SNP markers met this criterion, we did not attempt to distinguish among heterozygote genotypes. The Basic Local Alignment Search Tool (BLAST) was used to query the consensus sequence of each tag pair containing a SNP against the M. truncatula reference genome Version 4.1. The best The Plant Genome Accepted paper, posted 04/15/2015. doi:10.3835/plantgenome2014.12.0090 hit with a cutoff of E-value < 1 × 10⁻⁵ was selected as the physical location of the GBS SNP markers. Population structure and linkage disequilibrium (LD) estimation For each breeding cycle, the GBS SNP markers with fewer than 20% missing values were used for model-based clustering using the R package HDclassif (Berge et al., 2012). The best model, which had the optimal number of clusters, was established according to the Bayesian Information Criterion (BIC). For each cycle, the LD between pairs of GBS SNP markers was estimated as r2 using the software program TASSEL (Bradbury et al. 2007), with heterozygous calls treated as missing values. We estimated LD in four datasets representing GBS SNP markers with fewer than 30%, 50%, 70%, or 80% missing genotypic values and, in all cases, with a minor allele frequency higher than 5%. The functional relationship between LD and physical distances on the M. truncatula genome was evaluated by fitting a non-linear model. The expected r2 under driftrecombination equilibrium was E(r 2 ) = 1 / (1+ C) , and C = 4ad , where d is the physical distance in bp and a is a regression coefficient estimated from our data (Sved 1971). With a low level of mutation and finite sample size n, the expectation becomes (Hill and Weir 1988): (3+ C)(12 + 4C + C 2 ) 10 + C E(r 2 ) = 1+ n(2 + C)(11+ C) (2 + C)(11+ C) (4) GS prediction model development and validation The general GS prediction model used was: y = µ + Zu + ε (5) in which y is the observed phenotypic value [estimated BLUP from equation (1)], µ is the intercept, Z is the marker matrix, and u is a vector of estimated marker effects. Ridge regression Page 10 of 43 Page 11 of 43 The Plant Genome Accepted paper, posted 04/15/2015. doi:10.3835/plantgenome2014.12.0090 method was used to estimate effects of markers using the R package rrBLUP (Endelman, 2011). GBS SNP marker data sets with varying levels of missing values were used to model each trait at each environment. Prior to fitting the models, the missing values were imputed using the random forest method with the R package missForest (Stekhoven and Buhlmann, 2012). We evaluated genomic prediction accuracy for single harvest biomass yield in each location and total biomass yield at each location and across locations. The genomic prediction model was validated by cross validation, in which 90% of individuals were randomly selected as a training population to estimate marker effects and the remaining 10% of individuals were used to validate the genomic prediction accuracy. The genomic prediction accuracy was estimated as the Pearson correlation (r) between estimated GEBVs and estimated BLUPs of phenotypic values. Random sampling training and validation sets were repeated 3,000 times and the mean of correlations was defined as the genomic prediction accuracy. For total biomass yield, we evaluated the accuracy of GS models developed using one location as the training population to predict biomass yield in other locations. We also evaluated the accuracy of GS models developed using Cycle 0 as the training population to predict biomass yield in Cycle 1. For this analysis, all individuals from Cycle 0 were used to develop a GS prediction model and all individuals from Cycle 1 were used for validation based on the SNP markers in common with the Cycle 0 training set. RESULTS Phenotype data The broad-sense heritability of biomass yield ranged from 0.70 to 0.93 across harvests for Cycle 0 and from 0.61 to 0.88 across harvests for Cycle 1 (Table 1). These results indicated that large The Plant Genome Accepted paper, posted 04/15/2015. doi:10.3835/plantgenome2014.12.0090 genetic variation for biomass yield existed in the population at all harvests and in all environments in both Cycle 0 and Cycle 1. GBS genotype data After quality filtering and processing, we identified a total of 448,080,472 sequencing reads for Cycle 0 and 369,843,942 for Cycle 1. The read number per genotype was 2,358,318 on average for Cycle 0, ranging from 430,090 to 10,390,898. One genotype in Cycle 1 had only 2,776 reads and was dropped from further analysis. The average read number per genotype in Cycle 1 was 2,010,006, ranging from 1,213,037 to 6,354,979. The sequence reads from both breeding cycles were analyzed together using the UNEAK pipeline. In total 177,205 GBS SNP markers were identified in this breeding population and 73,256 of them (41.3%) aligned to the eight chromosomes of M. truncatula pseudomolecules v4.1. After read-depth filtering, we genotyped 18,525 SNPs in Cycle 0 and 14,913 in Cycle 1 that had up to 90% missing values (Table S1 and S2). We aligned 76% of Cycle 0 SNPs and 77% of Cycle 1 SNPs to the eight chromosomes of the M. truncatula reference genome (Tables S1 and S2). Within these SNP datasets, 7,075 SNPs in Cycle 0 and 6,241 SNPs in Cycle 1 had fewer than 50% missing values and about 85% aligned to the M. truncatula pseudomolecules (Table S1 and S2). For the markers having fewer than 10% missing values, about 90% aligned to the M. truncatula pseudomolecules (Table S1 and S2). In all cases, we imputed missing data using random forest imputation prior to model development. Population structure and LD For each breeding cycle, we used model-based clustering analysis of GBS SNP markers with fewer than 20% missing values to assess population substructure. Based on the Bayesian Page 12 of 43 Page 13 of 43 The Plant Genome Accepted paper, posted 04/15/2015. doi:10.3835/plantgenome2014.12.0090 Information Criterion (BIC), the best model for either Cycle 0 or Cycle 1 was a single cluster (data not shown), suggesting no subpopulation structure. We measured LD as r2 between a pair of markers based on marker data sets having missing values for fewer than 30%, 50%, 70%, or 80% of the genotypes. The estimated LD decreased as the percentage of missing values increased to 70% in both cycles (Figure 1). Using the dataset with SNP markers having fewer than 70% missing values, LD in Cycle 0 decayed to 0.42 at 200 Kbp between markers, but in Cycle 1, LD was more extensive, with r2 = 0.74 at 200 Kbp (Figure 1). Genomic prediction accuracy Marker number is one of major factors affecting genomic prediction accuracy (Heffner et al., 2011; Heslot et al., 2013; Poland et al., 2012 and Zhong et al., 2009). For single harvest biomass yield at each location and total biomass yield at each location and across locations, we developed and validated GS models using a series of GBS SNP marker datasets that had a threshold for missing values that ranged from 10 to 90% of the genotypes in the population. Marker sets that accepted higher amounts of missing data had more markers. We found that the prediction accuracies increased as missing values increased to between 60 and 70% in Cycle 0 (Table S3) and to 80% in Cycle 1 (Table S4). The harvest NY11-1 in Cycle 1 had consistently low accuracies and was unusual compared to all other harvests (Table S4). The broad-sense heritability of this particular harvest was much lower than other harvests, implying poor quality phenotypic data (Table 1). These results likely resulted because a flail-type harvester was used for this harvest and the oversown companion grass was included in the plot weight. Based on these results, we used SNP datasets represented by up to 65% missing data for Cycle 0 and up to 80% missing data for Cycle 1 to develop and validate GS models. The Plant Genome Accepted paper, posted 04/15/2015. doi:10.3835/plantgenome2014.12.0090 Validation within Cycle 0 Using the dataset of 9,906 markers that each had fewer than 65% missing genotypic values, the prediction accuracy among the 14 harvests in Cycle 0 was 0.26 to 0.51 (Table S3). Accuracies from one harvest from IA (IA05-1) and one harvest from NY (NY06-3) were lower than 0.30 (Table S3). In Cycle 0, six harvests in total from two years were taken at IA and NY and two harvests from one year at QC. We further evaluated genomic prediction accuracy of total biomass yield within a location and between locations. The prediction accuracy of total biomass yield was 0.43 at IA, 0.49 at NY, 0.44 at QC and 0.51 across the three locations (Table 2). The prediction accuracies validated between locations, especially between IA and QC, were much lower than prediction accuracies validated within location (Table 2). Based on NY data only, 16 of the top 20 highest yielding genotypes would have also been selected using GEBVs (data not shown). Across all locations, 11 of 20 individuals selected for maximum yield based on phenotypic data were also among the highest 20 individuals based on GEBVs (data not shown). Validation within Cycle 1 In Cycle 1, an accuracy of 0.40 to 0.67 was observed for the seven individual harvests (excluding NY11-1) in NY and QC using the 11,282 markers with fewer than 80% missing values (Table S4). The prediction accuracy of total biomass yield was 0.45 at NY based on all five harvests and 0.51 based on the four harvests excluding NY11-1 (Table 3). The prediction accuracy of total biomass yield was 0.66 for QC and 0.59 across the two locations (Table 3). The prediction accuracies validated between the two locations were 2-3 times lower than the prediction accuracies validated within location (Table 3). Page 14 of 43 Page 15 of 43 The Plant Genome Accepted paper, posted 04/15/2015. doi:10.3835/plantgenome2014.12.0090 Prediction across generations We further evaluated prediction accuracy of total biomass yield across generations. We identified 9,077 of the 9,906 markers that were part of the Cycle 0 data set that were also part of the Cycle 1 dataset. We developed a genomic prediction model considering Cycle 0 as the training population to then predict biomass yield in Cycle 1. The GS model developed from NY C0 showed an accuracy of 0.40 when applied to data from NY C1, the best of all models, and 0.39 when applied to QC C1 (Table 4). Models developed from QC C0 had low prediction accuracy for C1 at either location. IA C0 models also had low prediction to C1 from NY or QC (Table 4). Models developed from total yield across the three locations at C0 showed higher prediction accuracies compared to IA C0 and QC C0 models, but lower prediction accuracies relative to the NY C0 model (Table 4). Removing Iowa and analyzing NY and QC together resulted in an accuracy of 0.38 for predicting mean yield across NY and QC in the Cycle 1 population. DISCUSSION Genotyping-By-Sequencing With GBS, we were able to identify over 175,000 SNP in a tetraploid alfalfa breeding program. However, only about 10% of these SNP could be genotyped due to an insufficient read depth in enough individuals in the population for the loci to be useful in mapping. The main issue we face in alfalfa (as in other allogamous polysomic polyploids) is heterozygosity; in order to effectively call a genotype as heterozygous or homozygous, multiple reads are required, and consequently, only 18,525 GBS SNP markers were genotyped in our population. These markers were distributed throughout the M. truncatula reference genome. About 90% of loci for which The Plant Genome Accepted paper, posted 04/15/2015. doi:10.3835/plantgenome2014.12.0090 genotype calls could be made in over 90% of individuals aligned to the M. truncatula reference genome, but only 41.3% of all markers could be aligned. Genomic regions with highly conserved sequences between M. truncatula and M. sativa – such as exons – would also be more conserved among diverse alfalfa haplotypes and therefore, possibly more commonly sequenced. Large numbers of genome-wide markers are needed to apply genomic selection to alfalfa, or to conduct various other mapping and trait dissection experiments. Previously, we developed an Illumina Infinium array with ~10,000 features (Li et al., 2014a). Arrays have particular advantages, including very little missing data, known loci as markers (selected for specific reasons), and facile comparison among experiments. However, they suffer ascertainment bias, and the number of markers is fixed, so that experiments needing fewer markers or those requiring many more cannot be accommodated, and the cost is quite high on an experiment basis. In contrast, GBS-based SNP markers are typically cheaper, and assuming a relatively large amount of missing data can be handled and accepted, they represent an alternative highthroughput genotyping platform. Compared to the SNP array, GBS has no ascertainment bias and is tunable to generate more or fewer markers depending on the purpose of the experiment. Using GBS, we have generated about 9,000 SNP markers polymorphic for a tetraploid alfalfa biparental F1 mapping population and mapped over 3,500 SNP markers on 32 linkage groups for each of the two parents, four linkage groups per chromosome representing the four haplotypes (Li et al., 2014b). For our purposes here, GBS appears to be the only way to get sufficient markers within budget constraints to implement a GS program in alfalfa at the current time. Population structure and LD Population structure has effects on GS accuracy and needs to be integrated into a GS model if present (Lorenz et al., 2011; Hayes et al., 2009; Toosi et al., 2010). Based on 71 SSR markers, Page 16 of 43 Page 17 of 43 The Plant Genome Accepted paper, posted 04/15/2015. doi:10.3835/plantgenome2014.12.0090 we found no subpopulation structure in Cycle 0 of this breeding population (Li et al., 2011b). Using the GBS SNP markers, we conducted model based analysis and found no subpopulations in either breeding cycle. These results indicated that the two generations of random mating used to develop Cycle 0 of this breeding population successfully intermixed the parental genomes. The number of markers needed to perform GWAS or GS in this population can be inferred from LD estimates. LD quickly decayed within a few Kbp in a wild diploid alfalfa collection based on SSR markers (Sakiroglu et al., 2012). Using the Illumina Infinium alfalfa SNP array, we evaluated genome-wide LD with a large number of markers and found that LD quickly decayed to 26 Kbp at r2=0.2 over all germplasms tested, but varied by population (Li et al., 2014a). In this study, we estimated LD of the two breeding cycles using GBS SNP markers and found that the estimated LD decreased as the percentage of missing values increased to 70%. Removing markers with more missing values results in fewer markers tested, which could bias the LD estimation. In contrast, including the markers with more missing values results in a small sample size for some markers, which could cause an overestimation of LD (Yan et al., 2009). Using markers with fewer than 70% missing values, we found that the LD is about r2=0.42 in Cycle 0 and r2=0.74 in Cycle 1 at a distance of 200 Kbp. One cycle of selection likely caused the increased LD in Cycle 1. Based on the estimated LD, about 42% of the genetic variation in Cycle 0 could be captured by using 5,000 markers, assuming an alfalfa genome size of 1,000 Mbp and equally distributed markers throughout the genome. However, our LD estimates were made based on the physical distances between markers in the M. truncatula reference genome. Although numerous studies have shown a high level of synteny between M. truncatula and alfalfa (Choi et al., 2004; Li et al., 2011a), the estimated LD could be biased because we do not have a full genome sequence of alfalfa for comparison. Nevertheless, while we did not The Plant Genome Accepted paper, posted 04/15/2015. doi:10.3835/plantgenome2014.12.0090 completely cover the genome with this experiment, we were able to make considerable improvement relative to previous mapping experiments. Genomic prediction accuracy and implication in alfalfa breeding We imputed missing GBS SNP genotypes using the random forest method. Imputation errors are expected to increase as the amount of missing marker data increases (Poland et al., 2012). However, because the number of markers increases in the dataset as the stringency for missing data is relaxed, the imputation errors may be outweighted by improved models with more markers. In this study, we found that the average GS accuracies increased as marker number increased until the allowable amount of missing data per marker exceeded 70-80% in spite of the potential higher imputation error caused by more missing values. Our results are congruent with an experiment in wheat where 35,000 GBS SNP markers with up to 80% missing data points gave higher prediction accuracy than 2,000 DArT markers with 2% missing values (Poland et al., 2012). The better genomic prediction accuracy observed using GBS was mainly due to the large increase in marker numbers and not to ascertainment bias from the DArT markers (Heslot et al., 2013). Thus, more markers, even with increased amounts of missing values, will generally result in higher prediction accuracy until the missing data percentage per marker becomes very high (>70-80%). High genomic prediction accuracies were observed in numerous empirical studies from a diverse set of plant species such as 0.39 for leaf length and 0.48 for leaf width in maize (Guo et al., 2013), 0.72 for fusarium head blight resistance in barley (Lorenz et al., 2012), 0.70-0.90 for various fruit quality traits in apple (Kumar et al., 2012), and 0.63-0.74 for height in loblolly pine (Resende et al., 2012). As a perennial forage crop, alfalfa generally survives in the field at least 3-4 years and, depending on location, can be harvested from two to ten or more times each year. Page 18 of 43 Page 19 of 43 The Plant Genome Accepted paper, posted 04/15/2015. doi:10.3835/plantgenome2014.12.0090 If genomic prediction accuracies of total biomass yield can be identified that are reasonably robust, then the gain from GS could be significant relative to phenotypic selection that occurs after 3-4 years. In this experiment, we observed prediction accuracies of 0.43 to 0.66 for total biomass yield when validated within a location, providing evidence that genomic prediction accuracies in an autotetraploid species and in a synthetic alfalfa breeding population could conceivably be high enough to make GS worthwhile for complex traits like biomass yield. We also found that one harvest (NY11-1) caused lower prediction accuracy when it was included in total biomass yield for that location, reinforcing the point that high quality phenotypic data from as many harvests as possible is essential for alfalfa GS prediction models. Lower prediction accuracies between locations compared to the accuracies validated within location suggest presence of genotype × location interaction for biomass yield, as found in the analysis of variance, particularly between IA and the two northeastern North American locations. A scheme of GS in alfalfa could be developed in which one generation is used as a training population to develop a model that is then applied to selection in later generations (Li and Brummer, 2012). By making use of phenotypic and genotypic data from the two breeding cycles, we estimated the GS prediction accuracy across generations to be 0.40 for populations grown in NY. Even more interesting was the 0.38 prediction accuracy of Cycle 1 NY-QC yield based on the NY-QC model from Cycle 0. The lower GS accuracy across generations compared to that validating within a generation is expected and can be explained by less relatedness of individuals across generations than within generations and by genotype × environment interaction (Ly et al. 2013). In this experiment, the Cycle 1 genotypes are the products of phenotypic selection; we did not conduct GS to generate the C1 population. The prediction The Plant Genome Accepted paper, posted 04/15/2015. doi:10.3835/plantgenome2014.12.0090 accuracy of the model developed in C0 could have been different if the C1 population had been developed based on GS selection. For the GS model developed at IA in Cycle 0, the accuracy in predicting biomass yield in Cycle 1 was low for NY and very poor for QC. This implied that there was G×E interaction on biomass yield between location IA and QC. However, for the GS model developed at QC in Cycle 0, the accuracy in predicting biomass yield in Cycle 1 was very low even at the same location. Only two harvests were taken from the first production year at QC in Cycle 0. No data were collected in subsequent years because many plants were killed by severe winter. This could result in a GS model that did not capture most biomass yield genes across ages or growth seasons and therefore that had the poor prediction. Taken together, GS models for alfalfa yield prediction need to be developed using multiple harvests from multiple years and likely need to be applied to a certain target breeding region to avoid bias from G×E interaction. Nevertheless, the model developed across all locations from Cycle 0 to predict Cycle 1 still had an accuracy of 0.33, which would still be useful in a breeding program, and which shows that the presence of G×E does not preclude across location prediction, at least in this population. Compared to phenotypic selection, the higher selection efficiency from GS is mainly derived from the cumulative response of more selection cycles per unit time (Jannink, 2010). In alfalfa, recurrent selection is the common breeding method, and it generally takes 2-5 years to conduct one cycle of selection. It could take only half a year to conduct one cycle of genomic selection. Given the prediction accuracy of 0.40 and assuming a reduction of 75% per breeding cycle, the selection efficiency per unit time of GS is estimated to be about 60% higher compared to phenotypic selection. The prediction accuracy was estimated as the correlation between GEBVs and observed phenotypes here. A higher correlation between GEBVs and true breeding Page 20 of 43 Page 21 of 43 The Plant Genome Accepted paper, posted 04/15/2015. doi:10.3835/plantgenome2014.12.0090 values could be expected, particularly if the observed phenotypic variation has a significant component of dominance genetic variance. Our reasonably good accuracies between generations suggest that, in this population, yield is under substantial additive genetic control. The prediction accuracy observed here with no more than 200 individuals of training population can be higher given a larger training population in alfalfa breeding industry. In addition, an improved statistical model that could integrate allele dosage information might result in a better prediction for polyploid alfalfa. Alfalfa biomass yield has had a low genetic gain per year and have been stagnant since the 1980’s (Brummer 1999; Lamb et al., 2006, Brummer and Casler, 2014). In addition to long breeding cycles, less intense selection is another reason for the slower genetic gain. For alfalfa and also other perennial forage crops, breeding populations of small size have been commonly evaluated for selection in each cycle of phenotypic selection. More intense selection in larger selection population could be carried out in GS, which could result in higher selection efficiency compared to phenotypic selection (Heffner et al., 2009). CONCLUSION Previously, we used GBS to construct a high-density linkage map for a tetraploid alfalfa F1 mapping population. Here we showed that GBS could be used to generate a large number of genome wide markers for GS studies in a tetraploid alfalfa breeding population. The high genomic prediction accuracy of total biomass yield was observed even across generations in this study and many ways could be implemented to potentially enhance the prediction accuracy in the future studies or breeding applications. This study demonstrates that GS could accelerate The Plant Genome Accepted paper, posted 04/15/2015. doi:10.3835/plantgenome2014.12.0090 improvement of alfalfa biomass yield and other complex traits by shortening breeding cycles and increasing selection intensity. Acknowledgements: The population NY0358 was initially developed to evaluate the potential value of clonal selection to improve biomass yield as part of the NE1010 Multistate Cooperative Research Project. This experiment was funded in part by the NE1010 Multistate Cooperative Research Project (DRV and ECB) and by a USDA-DOE Plant Feedstock Genomics for Bioenergy grant to ECB, award # 2009-65504-05809. We thank Mark Smith for technical assistance in Iowa. Page 22 of 43 Page 23 of 43 The Plant Genome Accepted paper, posted 04/15/2015. doi:10.3835/plantgenome2014.12.0090 REFERENCES Asoro, F.G., M.A. Newell, W.D. Beavis, M.P. Scott, N.A. Tinker, and J.L. Jannink. 2013. Genomic, marker-assisted, and pedigree-BLUP selection methods for beta-Glucan concentration in elite oat. Crop Sci. 53:1894-1906. Berge, L., C. Bouveyron, and S. Girard. 2012. HDclassif: An R package for model-based clustering and discriminant analysis of high-dimensional data. Journal of Statistical Software 46:1-29. Bernardo, R., and J. Yu. 2007. Prospects for genome wide selection for quantitative traits in Maize Crop Sci. 47:1082-1090. Bradbury, P.J., Z. Zhang, D.E. Kroon, T.M. Casstevens, Y. Ramdoss, and E.S. Buckler. 2007. TASSEL: software for association mapping of complex traits in diverse samples. Bioinformatics 23:2633-2635. Brummer, E.C. 1999. Capturing heterosis in forage crop cultivar development. Crop Sci. 39:943954. Brummer, E.C., and M.D. Casler. 2014. Cool-Season Forages, p. 33-52, In S. Smith, et al., eds. Yield Gains in Major U.S. Field Crops. American Society of Agronomy, Inc., Crop Science Society of America, Inc., and Soil Science Society of America, Inc., Madison, Wisconsin, USA. Choi, H.K., D. Kim, T. Uhm, E. Limpens, H. Lim, J.H. Mun, P. Kalo, R.V. Penmetsa, A. Seres, O. Kulikova, B.A. Roe, T. Bisseling, G.B. Kiss, and D.R. Cook. 2004. A sequence-based genetic map of Medicago truncatula and comparison of marker colinearity with M. sativa. Genetics 166:1463-1502. The Plant Genome Accepted paper, posted 04/15/2015. doi:10.3835/plantgenome2014.12.0090 Doyle, J.J., and J.I. Doyle. 1990. Isolation of plant DNA from fresh tissue. BRL Life Technologies: Focus 12:13-15. Endelman, J.B. 2011. Ridge regression and other kernels for genomic selection with R package rrBLUP. The Plant Genome 4:250. Elshire, R.J., J.C. Glaubitz, Q. Sun, J.A. Poland, K. Kawamoto, E.S. Buckler, and S.E. Mitchell. 2011. A robust, simple Genotyping-by-Sequencing (GBS) approach for high diversity species. PLoS One 6:e19379. Guo, Z., D.M. Tucker, D. Wang, C.J. Basten, E. Ersoz, W.H. Briggs, J. Lu, M. Li, and G. Gay. 2013. Accuracy of across-environment genome-wide prediction in maize nested association mapping populations. G3 (Bethesda) 3:263-272. Han, Y., Y. Kang, I. Torres-Jerez, F. Cheung, C.D. Town, P.X. Zhao, M.K. Udvardi, and M.J. Monteros. 2011. Genome-wide SNP discovery in tetraploid alfalfa using 454 sequencing and high resolution melting analysis. BMC Genomics 12:350. Hayes, B.J., P.J. Bowman, A.J. Chamberlain, and M.E. Goddard. 2009. Invited review: Genomic selection in dairy cattle: progress and challenges. J. Dairy Sci. 92:433-443. Hayes, B.J., N.O.I. Cogan, L.W. Pembleton, M.E. Goddard, J.P. Wang, G.C. Spangenberg, and J.W. Forster. 2013. Prospects for genomic selection in forage plant species. Plant Breeding 132:133-143. Heffner, E.L., M.E. Sorrells, and J.L. Jannink. 2009. Genomic selection for crop improvement. Crop Sci. 49:1-12. Heffner, E.L., J.L. Jannink, H. Iwata, E. Souza, and M.E. Sorrells. 2011. Genomic selection accuracy for grain quality traits in biparental wheat populations. Crop Sci. 51:2597-2606. Page 24 of 43 Page 25 of 43 The Plant Genome Accepted paper, posted 04/15/2015. doi:10.3835/plantgenome2014.12.0090 Heslot, N., J. Rutkoski, J. Poland, J.L. Jannink, and M.E. Sorrells. 2013. Impact of marker ascertainment bias on genomic selection accuracy and estimates of genetic diversity. PLoS One 8:e74612. Hill, W.G., and B.S. Weir. 1988. Variances and covariances of squared linkage disequilibria in finite populations. Theor Popul Biol 33:54-78. Jannink, J.L. 2010. Dynamics of long-term genomic selection. Genet. Sel. Evol. 42:35. Kumar, S., D. Chagne, M.C. Bink, R.K. Volz, C. Whitworth, and C. Carlisle. 2012. Genomic selection for fruit quality traits in apple (Malusxdomestica Borkh.). PLoS One 7:e36674. Lamb, J.F.S., C.C. Sheaffer, L.H. Rhodes, R.M. Sulc, D.J. Undersander, and E.C. Brummer. 2006. Five decades of alfalfa cultivar improvement: Impact on forage yield, persistence, and nutritive value. Crop Sci. 46:902-909. Lande, R., and R. Thompson. 1990. Efficiency of marker-assisted selection in the improvement of quantitative traits. Genetics 124:743-756. Li, X., A. Acharya, A.D. Farmer, J.A. Crow, A.K. Bharti, R.S. Kramer, Y. Wei, Y. Han, J. Gou, G.D. May, M.J. Monteros, and E.C. Brummer. 2012. Prevalence of single nucleotide polymorphism among 27 diverse alfalfa genotypes as assessed by transcriptome sequencing. BMC Genomics 13:568. Li, X., and E.C. Brummer. 2012. Applied genetics and genomics in alfalfa breeding. Agronomy 2:40-61. Li, X., X. Wang, Y. Wei, and E.C. Brummer. 2011a. Prevalence of segregation distortion in diploid alfalfa and its implications for genetics and breeding applications. Theor. Appl. Genet. 123:667-679. The Plant Genome Accepted paper, posted 04/15/2015. doi:10.3835/plantgenome2014.12.0090 Li, X., Y. Wei, K.J. Moore, R. Michaud, D.R. Viands, J.L. Hansen, A. Acharya, and E.C. Brummer. 2011b. Association mapping of biomass yield and stem composition in a tetraploid alfalfa breeding population. The Plant Genome 4:24-35. Li, X., Y. Han, Y. Wei, A. Acharya, A.D. Farmer, J. Ho, M.J. Monteros, and E.C. Brummer. 2014a. Development of an alfalfa SNP array and its use to evaluate patterns of population structure and linkage disequilibrium. Plos One 9. Li, X., Y. Wei, A. Acharya, Q. Jiang, J. Kang, and E.C. Brummer. 2014b. A high-density genetic linkage map of autotetraploid alfalfa (Medicago sativa L.) developed using Genotypingby-Sequencing is highly syntenous with the M. truncatula genome. G3 (Bethesda) DOI: 10.1534/g3.114.012245. Lorenz, A.J., S. Chao, F.G. Asoro, E.L. Heffner, T. Hayashi, H. Iwata, K.P. Smith, M.E. Sorrells, and J.L. Jannink. 2011. Genomic selection in plant breeding: Knowledge and prospects. Adv. Agron. 110:77-123. Lorenz, A.J., K.P. Smith, and J.L. Jannink. 2012. Potential and Optimization of Genomic Selection for Fusarium Head Blight Resistance in Six-Row Barley. Crop Sci. 52:16091621. Lorenzana, R.E., and R. Bernardo. 2009. Accuracy of genotypic value predictions for markerbased selection in biparental plant populations. Theor. Appl. Genet. 120:151-161. Lu, F., A.E. Lipka, J. Glaubitz, R. Elshire, J.H. Cherney, M.D. Casler, E.S. Buckler, and D.E. Costich. 2013. Switchgrass Genomic Diversity, Ploidy, and Evolution: Novel Insights from a Network-Based SNP Discovery Protocol. Plos Genetics 9. Page 26 of 43 Page 27 of 43 The Plant Genome Accepted paper, posted 04/15/2015. doi:10.3835/plantgenome2014.12.0090 Ly, D., M. Hamblin, I. Rabbi, G. Melaku, M. Bakare, H.G. Gauch, R. Okechukwu, A.G.O. Dixon, P. Kulakow, and J.L. Jannink. 2013. Relatedness and genotype x environment interaction affect prediction accuracies in genomic selection: A study in Cassava. Crop Sci. 53:1312-1325. Massman, J.M., A. Gordillo, R.E. Lorenzana, and R. Bernardo. 2013. Genomewide predictions from maize single-cross data. Theor. Appl. Genet. 126:13-22. Meuwissen, T.H., B.J. Hayes, and M.E. Goddard. 2001. Prediction of total genetic value using genome-wide dense marker maps. Genetics 157:1819-29. Poland, J., J. Endelman, J. Dawson, J. Rutkoski, S.Y. Wu, Y. Manes, S. Dreisigacker, J. Crossa, H. Sanchez-Villeda, M. Sorrells, and J.L. Jannink. 2012. Genomic selection in wheat breeding using Genotyping-by-Sequencing. Plant Genome 5:103-113. Resende, R.M.S., M.D. Casler, and M.D.V. Resende. 2014. Genomic selection in forage breeding: Accuracy and methods. Crop Sci. 54:143-156. Resende, M.F., Jr., P. Munoz, J.J. Acosta, G.F. Peter, J.M. Davis, D. Grattapaglia, M.D. Resende, and M. Kirst. 2012. Accelerating the domestication of trees using genomic selection: accuracy of prediction models across ages and environments. New Phytol. 193:617-624. Sakiroglu, M., S. Sherman-Broyles, A. Story, K.J. Moore, J.J. Doyle, and E.C. Brummer. 2012. Patterns of linkage disequilibrium and association mapping in diploid alfalfa (M. sativa L.). Theor. Appl. Genet. 125:577-590. SAS Institute. 2010. The SAS system for Windows. Release 9.3. SAS Institute, Cary, NC. The Plant Genome Accepted paper, posted 04/15/2015. doi:10.3835/plantgenome2014.12.0090 Stekhoven, D.J., and P. Buhlmann. 2012. MissForest: non-parametric missing value imputation for mixed-type data. Bioinformatics 28:112-118. Sved, J.A. 1971. Linkage disequilibrium and homozygosity of chromosome segmens in finite populations. Theor Popul Biol 2:125-141. Teuber, L.R., K.L. Taggard, L.K. Gibbs, M.H. McCaslin, M.A. Peterson, D.K. Barnes. 1998. Fall Dormancy. In Standard tests to characterize alfalfa cultivars, 3rd ed. (Amended 1998). North American Alfalfa Improvement Conference, Beltsville, MD. (Available online at http://www.naaic.org/stdtests/Dormancy2.html.) (Verified 16 Dec. 2013.) Toosi, A., R.L. Fernando, and J.C.M. Dekkers. 2010. Genomic selection in admixed and crossbred populations. J. Anim. Sci. 88:32-46. Uitdewilligen, J.G., A.M. Wolters, B. D'Hoop B, T.J. Borm, R.G. Visser, and H.J. van Eck. 2013. A next-generation sequencing method for genotyping-by-sequencing of highly heterozygous autotetraploid potato. PLoS One 8:e62355. Viands, D.R., C.C. Lowe, R.P. Murphy, and R.L. Millar. 1990. Registration of 'Oneida VR' alfalfa. Crop Sci. 30:955. Yan, J., T. Shah, M.L. Warburton, E.S. Buckler, M.D. McMullen, and J. Crouch. 2009. Genetic characterization and linkage disequilibrium estimation of a global maize collection using SNP markers. PLoS One 4:e8451. Yang, S.S., Z.J. Tu, F. Cheung, W.W. Xu, J.F. Lamb, H.J. Jung, C.P. Vance, and J.W. Gronwald. 2011. Using RNA-Seq for gene identification, polymorphism detection and transcript profiling in two alfalfa genotypes with divergent cell wall composition in stems. BMC Genomics 12:199. Page 28 of 43 Page 29 of 43 The Plant Genome Accepted paper, posted 04/15/2015. doi:10.3835/plantgenome2014.12.0090 Zhong, S., J.C. Dekkers, R.L. Fernando, and J.L. Jannink. 2009. Factors affecting accuracy from genomic selection in populations derived from multiple inbred lines: a Barley case study. Genetics 182:355-364. The Plant Genome Accepted paper, posted 04/15/2015. doi:10.3835/plantgenome2014.12.0090 Figure captions Figure 1. Linkage disequilibrium estimated in C0 and C1 using markers with fewer than 30%, 50%, 70%, and 80% missing values. Page 30 of 43 Page 31 of 43 The Plant Genome Accepted paper, posted 04/15/2015. doi:10.3835/plantgenome2014.12.0090 Table 1. Description of biomass yield at each harvest and their broad-sense heritability. Generation Location Year Harvest Abbreviation Heritability Cycle 0 IA 2005 2006 NY 2005 2006 QC Cycle 1 NY 2006 2010 2011 QC 2010 1 IA05-1 0.78 2 IA05-2 0.77 3 IA05-3 0.83 4 IA05-4 0.81 1 IA06-1 0.73 2 IA06-2 0.78 1 NY05-1 0.90 2 NY05-2 0.92 3 NY05-3 0.91 1 NY06-1 0.93 2 NY06-2 0.83 3 NY06-3 0.84 1 QC06-1 0.76 2 QC06-2 0.70 1 NY10-1 0.88 2 NY10-2 0.88 1 NY11-1 0.61 2 NY11-2 0.78 3 NY11-3 0.79 1 QC10-1 0.82 2 QC10-2 0.77 3 QC10-3 0.85 The Plant Genome Accepted paper, posted 04/15/2015. doi:10.3835/plantgenome2014.12.0090 Table 2. The genomic prediction accuracy of total biomass yield in Cycle 0 validated within and across locations. Validation † Estimation IA NY QC IA-NY-QC IA 0.43 0.43 0.34 0.47 NY 0.37 0.49 0.39 0.48 QC 0.34 0.46 0.44 0.46 IA-NY-QC † 0.40 0.49 0.41 0.51 IA-NY-QC is the total biomass yield across the three locations of IA, NY, and QC. Page 32 of 43 Page 33 of 43 The Plant Genome Accepted paper, posted 04/15/2015. doi:10.3835/plantgenome2014.12.0090 Table 3. The genomic prediction accuracy of total biomass yield in Cycle 1 validated within and across locations. Validation † Estimation NY-A NY-B QC NY-QC NY-A † 0.45 0.49 0.22 0.29 NY-B 0.47 0.51 0.21 0.28 QC 0.22 0.21 0.66 0.60 NY-QC 0.29 0.29 0.61 0.59 NY-A is the total biomass yield from all five harvests at NY; NY-B is the total biomass yield from the four harvests by excluding the harvest NY11-1. NY-QC is the total biomass yield across the two locations of NY and QC. Page 34 of 43 The Plant Genome Accepted paper, posted 04/15/2015. doi:10.3835/plantgenome2014.12.0090 Table 4. Genomic prediction accuracy of total biomass yield across generations. Validation in Cycle 1 Estimation in † Cycle 0 NY-A ‡ NY-B QC NY-QC IA 0.26 0.28 0.08 0.14 NY 0.40 0.40 0.39 0.42 QC 0.26 0.24 0.22 0.25 NY-QC † 0.36 0.36 0.35 0.38 IA-NY-QC 0.38 0.39 0.28 0.33 NY-QC is the total biomass yield across the two locations of NY and QC; IA-NY-QC is the total biomass yield across the three locations of IA, NY, and QC in Cycle 0. ‡ NY-A is the total biomass yield from all five harvests in Cycle 1; NY-B is the total biomass yield from the four harvests by excluding the harvest NY11-1, which had a low heritability; NYQC is the total biomass yield across the two locations of NY and QC in Cycle 1. Page 35 of 43 The Plant Genome Accepted paper, posted 04/15/2015. doi:10.3835/plantgenome2014.12.0090 Figure 1. Linkage disequilibrium estimated in C0 and C1 using markers with fewer than 30%, 50%, 70%, and 80% missing values. 152x152mm (300 x 300 DPI) Page 36 of 43 The Plant Genome Accepted paper, posted 04/15/2015. doi:10.3835/plantgenome2014.12.0090 Table S1. Number of GBS SNP markers genotyped in Cycle 0 and markers' distribution along the eight chromosome Chromosome 10 20 30 chr1 119 307 506 chr2 93 287 447 chr3 102 289 461 chr4 109 339 561 chr5 79 228 378 chr6 30 81 133 chr7 86 239 414 chr8 109 291 460 Total genotyped markers aligned to M. truncatula 727 2061 3360 Percentage of the markers aligned to M. truncatula 91.4 89.3 87.7 Total genotyped markers 795 2308 3832 Mean percentage missing genotype calls (%) 7.1 12.6 17.7 Page 37 of 43 The Plant Genome Accepted paper, posted 04/15/2015. doi:10.3835/plantgenome2014.12.0090 along the eight chromosomes of theM. truncatula reference genome Percentage of missing values 40 50 60 65 70 80 90 717 900 1113 1245 1368 1659 2106 619 770 930 1014 1104 1351 1669 652 837 1044 1163 1259 1565 2023 759 975 1184 1316 1435 1731 2176 532 691 851 945 1026 1273 1664 201 281 361 398 451 601 857 572 742 904 988 1099 1360 1744 636 794 966 1066 1183 1436 1854 4688 5990 7353 8135 8925 10976 14093 86.2 84.7 82.9 82.1 81.3 79.1 76.1 5441 7075 8872 9906 10982 13880 18525 22.9 28.1 33.6 36.6 39.7 47.2 56.9 Page 38 of 43 The Plant Genome Accepted paper, posted 04/15/2015. doi:10.3835/plantgenome2014.12.0090 Table S2. Number of GBS SNP markers genotyped in Cycle 1 and markers' distribution along the eight chromosome Chromosome 10 20 30 chr1 230 403 542 chr2 194 358 460 chr3 208 358 507 chr4 240 421 570 chr5 160 290 406 chr6 60 103 155 chr7 190 317 429 chr8 212 370 488 Total genotyped markers aligned to M. truncatula 1494 2620 3557 Percentage of the markers aligned to M. truncatula 90.2 88.3 86.5 Total genotyped markers 1656 2968 4114 5.8 9.7 13.9 Mean percentage missing genotype calls (%) Page 39 of 43 The Plant Genome Accepted paper, posted 04/15/2015. doi:10.3835/plantgenome2014.12.0090 along the eight chromosomes of theM. truncatula reference genome Percentage of missing values 40 50 60 65 70 80 90 663 797 937 1032 1133 1372 1774 563 673 786 851 925 1099 1363 625 756 900 999 1095 1307 1635 694 844 998 1088 1183 1422 1771 487 595 730 813 881 1066 1368 202 238 303 337 368 487 682 534 632 762 836 917 1101 1419 587 722 850 934 999 1198 1507 4355 5257 6266 6890 7501 9052 11519 85.1 84.2 83.5 82.8 82.1 80.2 77.2 5116 6241 7506 8322 9139 11282 14913 18.2 23.1 28.5 31.9 35.1 42.9 53.3 Page 40 of 43 The Plant Genome Accepted paper, posted 04/15/2015. doi:10.3835/plantgenome2014.12.0090 Table S3. Genomic prediction accuracy of biomass yield at each single harvest and total biomass at each location an using marker datasets with varied levels of missing values Percentage of missing values Traits 10 20 30 40 50 60 IA05-1† 0.196 0.195 0.212 0.222 0.251 0.261 IA05-2 0.322 0.319 0.338 0.351 0.379 0.382 IA05-3 0.342 0.397 0.398 0.396 0.415 0.430 IA05-4 0.383 0.452 0.473 0.472 0.485 0.491 IA06-1 0.334 0.371 0.355 0.379 0.390 0.406 IA06-2 0.345 0.379 0.400 0.390 0.405 0.400 NY05-1 0.358 0.385 0.403 0.397 0.415 0.405 NY05-2 0.425 0.417 0.422 0.413 0.433 0.435 NY05-3 0.360 0.381 0.399 0.396 0.415 0.409 NY06-1 0.396 0.467 0.471 0.473 0.492 0.494 NY06-2 0.247 0.275 0.295 0.305 0.339 0.316 NY06-3 0.156 0.252 0.215 0.232 0.255 0.233 QC06-1 0.315 0.374 0.391 0.394 0.403 0.413 QC06-2 0.393 0.434 0.450 0.449 0.460 0.454 IA 0.341 0.369 0.372 0.371 0.400 0.425 NY 0.407 0.432 0.437 0.441 0.463 0.459 QC 0.343 0.402 0.420 0.415 0.422 0.440 IA-NY-QC 0.405 0.466 0.476 0.473 0.495 0.497 †IA is the total biomass yield at IA; NY is the total biomass yield at NY; QC is the total biomass yield at QC; IA-NY across the three locations. Page 41 of 43 The Plant Genome Accepted paper, posted 04/15/2015. doi:10.3835/plantgenome2014.12.0090 otal biomass at each location and across locations in Cycle 0 issing values 65 70 80 90 0.260 0.261 0.241 0.188 0.398 0.384 0.372 0.344 0.428 0.422 0.413 0.390 0.486 0.457 0.439 0.433 0.413 0.409 0.387 0.348 0.420 0.415 0.399 0.358 0.425 0.429 0.406 0.384 0.462 0.457 0.437 0.432 0.446 0.441 0.432 0.417 0.513 0.513 0.500 0.469 0.356 0.362 0.348 0.281 0.278 0.279 0.270 0.240 0.410 0.399 0.402 0.372 0.474 0.458 0.444 0.422 0.433 0.414 0.389 0.356 0.485 0.482 0.467 0.448 0.443 0.429 0.424 0.397 0.515 0.514 0.487 0.466 otal biomass yield at QC; IA-NY-QC is the total biomass yield Page 42 of 43 The Plant Genome Accepted paper, posted 04/15/2015. doi:10.3835/plantgenome2014.12.0090 Table S4. Genomic prediction accuracy of biomass yield at each single harvest and total biomass yield at each locati datasets with varied levels of missing genotype calls. Percentage of missing values Traits 10 20 30 40 50 NY10-1† 0.336 0.343 0.350 0.340 0.350 NY10-2 0.445 0.461 0.486 0.479 0.485 NY11-1 0.074 0.041 0.065 0.061 0.082 NY11-2 0.391 0.405 0.398 0.399 0.407 NY11-3 0.359 0.353 0.361 0.356 0.369 QC11-1 0.550 0.566 0.590 0.611 0.626 QC11-2 0.521 0.538 0.552 0.574 0.585 QC11-3 0.570 0.593 0.605 0.607 0.621 NY-A 0.381 0.402 0.396 0.393 0.400 NY-B 0.426 0.448 0.447 0.439 0.447 QC 0.527 0.541 0.547 0.556 0.570 NY-QC 0.453 0.476 0.482 0.489 0.494 †NY-A is the total biomass yield from all five harvests at NY; NY-B is the total biomass yield from the four harvests biomass yield at QC; NY-QC is the total biomass yield across the two locations. Page 43 of 43 The Plant Genome Accepted paper, posted 04/15/2015. doi:10.3835/plantgenome2014.12.0090 al biomass yield at each location and across locations in Cycle 1 using marker 60 65 70 80 90 0.351 0.372 0.382 0.399 0.360 0.493 0.512 0.526 0.536 0.507 0.082 0.094 0.096 0.084 0.113 0.418 0.428 0.437 0.458 0.428 0.372 0.382 0.398 0.433 0.386 0.649 0.658 0.654 0.669 0.650 0.612 0.621 0.622 0.635 0.606 0.636 0.644 0.646 0.651 0.642 0.405 0.415 0.430 0.457 0.420 0.454 0.465 0.478 0.511 0.462 0.573 0.578 0.579 0.665 0.635 0.502 0.506 0.515 0.588 0.568 ss yield from the four harvests by excluding the harvest NY11-1; QC is the total


© Copyright 2026