
Vertical distribution of Plasmodiophora brassicae resting spores in
Vertical distribution of Plasmodiophora brassicae resting spores in soil and the effect of
weather conditions on clubroot development
by
Travis J. Cranmer
A Thesis
presented to
The University of Guelph
In partial fulfilment of requirements
for the degree of
Master of Science
in
Plant Agriculture
Guelph, Ontario, Canada
© Travis J. Cranmer, 2015
ABSTRACT
VERTICAL DISTRIBUTION OF PLASMODIOPHORA BRASSICAE RESTING SPORES
IN SOIL AND THE EFFECT OF WEATHER CONDITIONS ON CLUBROOT
DEVELOPMENT
Travis John Cranmer
University of Guelph 2015
Advisors:
Dr. Mary Ruth McDonald
Dr. Bruce D. Gossen
Canola (Brassica napus L.) is a high-value agricultural commodity in Canada.
Plasmodiophora brassicae Woronin, the causative agent of clubroot, can cause substantial
decreases in yield of susceptible crucifer species. To help understand and possibly model the
epidemiology of disease, the influence of weather on development of clubroot was examined.
Soil moisture and air temperature were found to be important variables affecting disease
development. The etiology of disease is also influenced by the presence of resting spores in
infested soils. A qPCR method was developed and assessed to quantify the prevalence and
vertical distribution of these resting spores in the soil profile. Management techniques targeting
resting spores should be applied to depths of the deepest brassica roots for complete disease
suppression since resting spores were found in levels high enough to cause severe disease at the
deepest sampling depth of 53 cm.
iii
ACKNOWLEDGEMENTS
I would like to take this opportunity to extend my gratitude and appreciation to the
individuals and groups that have allowed me to further my education and the completion of this
degree at the University of Guelph. Firstly, my sincere appreciation to my co-advisors Dr. Mary
Ruth McDonald and Dr. Bruce Gossen for providing me with this opportunity, continuous
guidance, advice and encouragement. Your encouragement has allowed me to develop my
analytical and writing skills, for which I will always be grateful. I would also like to extend my
thanks to the final member of my committee, Dr. Greg Boland. Your teaching inspired me to
study in the field of plant pathology, ultimately changing my perspective of the plants around me
and the challenges they face.
The support of several colleagues was critical for the completion of this thesis research. I
owe a great deal of gratitude to Dr. Abhinandan Deora for his guidance in the lab, qPCR support
as well as for his encouragement and advice. In the lab I am thankful for the assistance from Dr.
Fadi Al-Daoud and Chris Granger for their attentive guidance with my molecular work. I am also
thankful to Dr. Michael Tesfaendrias, Dennis Van Dyk and Brian Collins for their knowledge of
statistical analysis as well as their technical support with weather stations. The advice, plot set-up
and mechanical help obtained from Laura Riches, Kevin Vanderkooi, Misko Mitrovic and Shawn
Janse was greatly appreciated and made trips to the Muck Crops Research Station enjoyable.
Numerous thanks to the summer crew in 2013 and 2014 at the Muck Crops Research Station for
their field assistance whether it was weeding or conducting DSI ratings. Furthermore, much
appreciation to Kate Delfosse who helped with DNA extractions as well as preparing and
assessing controlled environment trials.
iv
I would like to thank Thomas Gludovacz, Dr. Sean Westerveld and Kalpana Adhikari for
their advice as well as their field data from previous seeding date trials. I am very grateful for the
advice and field assistance from Mike Celetti. The samples obtained with help from Dustin
Burke, Don Almas, Fred Nyland, Jeremy Schotsman and Jill Dalton were integral to this thesis
and are greatly appreciated.
I am grateful to Agriculture and Agri-Food Canada and the University of Guelph,
Department of Plant Agriculture for providing financial support and working behind the scenes
allowing for this work to be completed.
I am extremely appreciative to Angela Tiessen for her daily support throughout this
program and her assistance editing this thesis. I would also like to recognize my friends who
have been there to offer recommendations and solutions to obstacles over the last two years.
Finally, I will always be thankful to my parents and family for encouraging and supporting me in
my academic pursuits as well as seeding my interest in plant biology and allowing it to grow.
Thank you.
v
TABLE OF CONTENTS
ABSTRACT
ii
ACKNOWLEDGEMENTS
iii
TABLE OF CONTENTS
v
LIST OF TABLES
viii
LIST OF FIGURES
ix
CHAPTER ONE - LITERATURE REVIEW
1
1.1 Agricultural significance of canola and other Brassica spp.
1
1.1.1 Canola and brassica crops in Canada
1
1.1.2 Pests of Brassica spp.
3
1.1.3 Diseases of canola and Brassica spp.
4
1.2 Clubroot
5
1.2.1 Significance
5
1.2.2 Clubroot history
6
1.2.3 Plasmodiophora brassicae
7
1.2.4 Characterization, distribution and dissemination of P. brassicae
10
1.2.5 Detection of P. brassicae in the soil
14
1.3 Factors affecting clubroot severity
15
1.3.1 Spore load, horizontal distribution and depth
15
1.3.2 Temperature
16
1.3.3 Soil moisture
16
1.3.4 Soil pH and calcium
17
1.3.5 Soil type
18
1.3.6 Spore longevity
19
1.4 Clubroot management
19
vi
1.4.1 Cultural controls
19
1.4.2 Crop rotation
20
1.4.3 Fungicides
21
1.4.4 Fumigants
22
1.4.5 Biological controls and biofumigants
23
1.4.6 Bait crops and soil additives
24
1.4.7 Host resistance
25
1.5 Objectives
28
CHAPTER TWO - QUANTIFICATION OF RESTING SPORES THROUGHOUT THE
SOIL PROFILE
30
2.1 Introduction
30
2.2 Materials and Methods
34
2.2.1 Field sites
34
2.2.2 Sampling methods
36
2.2.3 Primer, probe and internal control
37
2.2.4 Quantifying soil DNA and qPCR
40
2.2.5 Normalization of qPCR data and quantifying inhibition
41
2.2.6 Direct counts of manual extractions
41
2.2.7 Statistical analysis
42
2.3 Results
42
2.3.1 Assessment of vertical distribution
44
2.3.2 Comparison of manual counts to qPCR estimates
47
2.4 Discussion
48
CHAPTER THREE - INFLUENCE OF TEMPERATURE AND SOIL MOISTURE ON
CLUBROOT INCIDENCE AND SEVERITY
57
3.1 Introduction
57
vii
3.2 Materials and Methods
62
3.2.1 Seeding
62
3.2.2 Assessment
63
3.2.3 Weather data
64
3.2.4 Statistical analysis
65
3.3 Results
67
3.3.1 Weather
67
3.3.2 Clubroot incidence and severity
71
3.3.3 Model calibration
75
3.3.4 Influence of soil moisture
79
3.3.5 Model validation
80
3.4 Discussion
82
CHAPTER FOUR - GENERAL DISCUSSION
90
LITERATURE CITED
99
APPENDIX 1: SUPPLEMENTARY TABLES FOR CHAPTER ONE
115
APPENDIX 2: SUPPLEMENTARY TABLES FOR CHAPTER TWO
116
APPENDIX 3: SUPPLEMENTARY TABLES FOR CHAPTER THE
124
APPENDIX 4: RAW DATA FOR TILLAGE RADISH
153
ABSTRACT
ACKNOWLEDGEMENTS
TABLE OF CONTENTS
viii
LIST OF TABLES
Table 1.1. Pathotypes of P. brassicae based on the William’s differentials (1966) in
Canada.
11
Table 2.1. Properties of the soil collected from naturally infested fields of
Plasmodiophora brassicae in Alberta and Ontario, Canada.
35
Table 2.2. Nucleotide sequence of primers and probes used for the qPCR assays for
quantification of resting spore concentration of Plasmodiophora brassicae in soil (Deora
et al., 2015).
38
Table 2.3. qPCR mix components used to amplify and quantify DNA of Plasmodiophora
brassicae in naturally infested soil samples.
40
Table 2.4. Comparison of resting spore concentrations (x 1000) per g of dry soil in 12
samples using manual counts and multiplex qPCR1.
48
Table 3.1. Mean monthly air temperature and rainfall during the canola seeding date trials
at the Holland Marsh, ON, 2013 and 2014.
68
Table 3.2. Clubroot incidence (%) at 4 and 6 weeks after seeding on flowering cabbage
planted at approximately 2-wk intervals in naturally infested muck soil at the Muck Crops
Research Station, Holland Marsh, ON, 2014.
74
Table 3.3. Linear correlations (r) between clubroot incidence or severity and temperature,
air degree days and rainfall during the various time intervals for 47 seeding dates of
canola cv. ‘InVigor 5030 LL’ and Chinese flowering cabbage grown at the Holland Marsh,
ON in 1999–20141,3.
74
Table 3.4. Stepwise regression of the effect of rainfall, air temperature degree days (°D),
air temperature and soil moisture over selected time intervals on clubroot incidence (CI)
and severity (DSI) over time on flowering cabbage and canola based on 35 seeding dates
at the Holland Marsh, ON.
76
ix
LIST OF FIGURES
Figure 2.1. Amplicon of the competitive internal positive control (CIPC) designed by
Deora et al. (2015). Primers for Plasmodiophora brassicae are indicated by broken lines
and the CIPC primer is indicated by solid lines.
40
Figure 2.2. Median resting spore concentrations of P. brassicae in soils from different
depths from Bassano AB, Flamborough ON, Holland Marsh ON, and Millgrove ON.
45
Figure 2.3. Median (box and stem) and mean (◇) resting spore concentrations of P.
brassicae from various depths in the soil profile at Flamborough, ON (Χ2(6) = 24.70, P =
0.0004) with outliers as ‘○’.
46
Figure 3.1. Mean daily air temperature and daily precipitation at the Muck Crops
Research Station, Holland Marsh, ON, 2013.
69
Figure 3.2. Mean daily air temperature, soil moisture and daily precipitation at the Muck
Crops Research Station, Holland Marsh, ON, 2014.
70
Figure 3.3. Clubroot incidence on canola planted at approximately 2-wk intervals in
naturally infested muck soil at the Muck Crops Research Station, Holland Marsh, ON,
2013. There were no significant differences within sampling week based on Tukey’s
multiple mean comparison test at P = 0.05.
73
Figure 3.4. Clubroot incidence on canola planted at approximately 2-wk intervals in
naturally infested muck soil at the Muck Crops Research Station, Holland Marsh, ON in
2014. Significant differences within sampling week based on Tukey’s multiple mean
comparison test at P = 0.05 are presented in Table A3.9.
73
Figure 3.5. Linear regression relationship between mean air temperature at 7–21 days
after seeding and validation set of clubroot incidence over time on canola and flowering
cabbage at the Holland Marsh, ON showing scatter plot of individual data points and best
fit linear regression. (n = 47).
77
Figure 3.6. Scatter plot if individual data points between season total rainfall with a 1week delay after seeding and validation set of clubroot incidence over time on canola and
flowering cabbage at the Holland Marsh, ON (n = 47).
77
Figure 3.7. Scatter plot if individual data points between mean air temperature 7–21 days
after seeding and validation set of clubroot severity over time on canola and flowering
cabbage at the Holland Marsh, ON (n = 47).
78
Figure 3.8. Scatter plot if individual data points between season total rainfall with a 1week delay after seeding and validation set of clubroot severity over time on canola and
flowering cabbage at the Holland Marsh, ON (n = 47).
78
x
Figure 3.9. Relation between soil moisture 5–10 days after seeding and clubroot
incidence on canola at the Holland Marsh, ON in 2012 and 2014 (n = 14).
79
Figure 3.10. Relation between soil moisture 5–10 days after seeding and clubroot disease
severity on canola at the Holland Marsh, ON in 2012 and 2014 (n = 14).
80
Figure 3.11. Deviation of predicted clubroot incidence from observed clubroot incidence
on canola and flowering cabbage (n = 47) grown for 6 weeks at the Holland Marsh, ON.
81
Figure 3.12. Deviation of predicted clubroot severity from observed severity on canola
and flowering cabbage (n = 47) grown for 6 weeks at the Holland Marsh, ON.
81
1
CHAPTER ONE - LITERATURE REVIEW
1.1 Agricultural significance of canola and other Brassica spp.
1.1.1 Canola and brassica crops in Canada
There are over 375 genera of wild and cultivated plants in the Brassicaceae family, many
of which are economically important crops around the world (Jones and Luchsinger, 1979).
Broccoli, cabbage, cauliflower (all Brassica oleracea), radish (Raphanus sativus) and turnip
(B. rapa L.) are the five major brassica vegetables grown in Canada. Ontario and Quebec are the
largest producers of these five crops, with ~2000 ha of any crop per year (Statistics Canada,
2009). However, these brassica vegetables have not had the economic impact that canola has had
on Canada over the last decade.
Canola is a quality designation associated with the seed of qualifying cultivars of the field
crops oilseed rape (Brassica napus L.), brown mustard (B. juncea L. Czern.) and field mustard/
turnip rape (B. rapa L.) seed. The term ‘canola’ is restricted by trademark to cultivars of oilseed
Brassica spp. whose seed contains less than 2% erucic acid and fewer than 30 µmoles of
glucosinolates (Rempel et al., 2013). Oil of the original oilseed rape (rapeseed) crop has a bitter
taste due to the high concentration of glucosinolates and is used for lubrication, lighting and fuel.
Glucosinolates decompose into compounds that are toxic to humans and livestock (Food
Standards Australia New Zealand, 2003). Erucic acid, another toxic compound found in oilseed
rape, has been directly linked to heart disease in animal studies (Food Standards Australia New
Zealand, 2003). Reduction of erucic acid and glucosinolates concentrations in oilseed rape was
developed through conventional breeding in programs led by Drs. B. Stefansson and K. Downey
starting in the 1970s (Rempel et al., 2013).
2
Canola contributes an estimated $19.3 billion to the Canadian economy annually, with
$1.1 billion from the crop in Ontario and Quebec, but the largest proportion produced on the
Canadian prairies (Canola Council of Canada, 2014). Over 228,000 jobs in Canada are supported
directly by the growing and processing of canola (Miller, 2012). In 2013, over 7 million metric
tons (MT) of canola seed were exported of the 18 million MT grown in Canada. This was
produced on an estimated 8.1 million ha of canola (Statistics Canada, 2013). Currently Canada is
the leading producer of canola in the world, followed closely by China (FAOSTAT, 2013).
Brassica vegetables are generally grown for human consumption, and on occasion radish
is used to feed livestock or used as a cover crop to enhance cash crop yields and build topsoil.
Unlike most brassica vegetables, canola seed is crushed and separated into oil and meal
components when processed. Canola oil has many uses, including use in oil salad dressings,
margarine and shortening. After the oil is extracted from the crushed seed, the meal is used for
cattle and poultry feed (Rempel et al., 2013).
The climate and soil in much of the Canadian prairies is suitable for growing canola,
which is likely why it has become Canada’s most valuable crop (Canola Council of Canada,
2014). Unlike canola and other shorter-season crops such as radish and Asian brassica vegetables
which can be seeded directly into the field, broccoli, cabbage and other brassica vegetables are
long-season crops. These crops generally will not reach maturity in the Canadian growing season
if they are directly seeded into the field. Therefore, broccoli and cabbage are started in plug trays
and transplanted into the field 4–6 weeks later, when the risk of frost has passed (LeBoeuf,
2012).
3
1.1.2 Pests of Brassica spp.
Pests of brassica crops are plentiful and their presence can directly influence the crops
that can be produced economically in a given field. Cabbageworm larvae (Artogeia rapae L.),
cabbage looper (Trichoplusia ni Hubner) and alfalfa looper (Autographia californica Speyer)
feed on the underside of leaves, while the diamondback moth larvae (Lutella xylostella L.) feeds
on both the upper and lower leaf surfaces. Bertha armyworm larvae (Mamestra configurata
Wik.) feed on the leaves while the crop is growing, but move to the seed pods as the crop
matures causing severe losses to canola yields. All five caterpillars cause serious leaf damage to
broccoli, Brussels sprouts, cabbage, canola, cauliflower, as well as other brassica vegetables
(Chaput, 2009).
Cabbage seedpod weevil (Ceutorhynchus obstrictus Marsham) feeds within pods and
destroys developing seeds (Canola Council of Canada, 2011). Cabbage aphids (Brevicoryne
brassica) draw sap from the host brassica leaves and are difficult to control once they are
established in the field. Flea beetles (Phyllotretra spp.) cause an estimated annual loss of $300
million on canola in North America by consuming the cotyledons and first true leaves of
seedlings (Knodel and Olsen, 2002). Cabbage maggots (Delia radicum L.) attack the roots of
canola, Napa cabbage and many Asian brassica vegetables, allowing secondary pathogens, such
as soft rots, to establish in wounded areas (Chaput, 2009).
Swede midge (Contarinia nasturtil Kieffer) is an invasive, gall-forming dipteran pest that
was first identified in Canada in Ontario in 2000 and has since spread to the Canadian prairies
(Chen et al., 2011). The larvae generally feed on the meristem, causing stunted growth, multiple
heads and twisted leaves. As a result, the quality of many brassica vegetable crops is severely
4
reduced (Chen et al., 2011). Damage varies depending on the age of the canola plant, but some
crop losses in Ontario, CA have been reported to be as much as 85% (Chen et al., 2011). Wet
seasons are ideal for C. nasturtil because the larvae require a soil moisture content of 25 to 75%,
depending upon the soil type. Crop rotation can be effective at reducing plant damage if the field
has been free of C. nasturtil and cruciferous crops for over two years, because dispersion of an
adult C. nasturtil is limited to about 1 km from its larval site (OMAFRA, 2009).
1.1.3 Diseases of canola and Brassica spp.
Reduced seed germination and seedling establishment is often caused by the soil-borne
fungus Rhizoctonia solani Kühn, which can cause pre-and post-emergence damping off of
seedlings (Acharya et al., 1984; Gugel et al., 1987; Hwang et al., 2014a). Constriction of the
hypocotyl and basal stem are often symptoms caused by R. solani, however, Fusarium spp. and
Pythium spp. are also important components of the disease complex (Hwang et al., 2014a). Yield
losses in excess of 20% have been reported on canola in heavily infested areas (Hwang et al.,
2014a).
Leptosphaeria maculans is the main pathogen causing blackleg disease on canola, which
produces grey to black cankers on stems and leaves and can cause substantial loss in seed yield.
The fungus is dispersed by wind and wet conditions which are also conducive for disease
development. Removal or tillage of infected residue of previous canola crops, application of
fungicides, crop rotation, and planting resistant cultivars are used to manage blackleg (Kutcher et
al., 2011).
5
Sclerotinia stem rot, caused by Sclerotinia sclerotiorum (Lib.) de Bary, is a common
fungal disease in canola, but the pathogen is known to attack more than 400 species of plants
worldwide (Boland and Hall, 1994). Timely application of foliar fungicides is the primary
management strategy, however insensitivity to some fungicides has developed in S. sclerotiorum
(Gossen et al., 2001; Hu et al., 2011). Alternaria black spot, also known as grey leaf spot, is
found as a complex of Alternaria spp. including A. brassicae, A. alternata and A. raphani
(Nowicki et al., 2012). Disease incidence can be reduced through use of disease-free seed in
combination with fungicide application(s) when weather conditions are conducive for Alternaria
development (Nowicki et al., 2012).
Plasmodiophora brassicae Woronin causes clubroot, the most devastating disease of
brassica crops in western Canada. It is a serious constraint to canola production and has been
spreading rapidly across the region in recent years. Clubroot is the focus of a major program of
research into pathogen biology and disease management, and is described in detail in the
following section.
1.2 Clubroot
1.2.1 Significance
On susceptible cruciferous crops, infection by the pathogen Plasmodiophora brassicae,
the causative agent of clubroot, leads to hyperplasia and hypertrophy in root tissues, which result
in the formation of large clubs on roots that are the characteristic symptom. Tissue organization
in affected roots is disrupted, resulting in restricted flow of water and nutrients leading to
premature chlorosis, stunted and delayed growth, and reduced yield (Woronin, 1878; Pageau et
6
al., 2006; Deora et al., 2012; Cao et al., 2013). Once a field becomes heavily infested with
resting spores, susceptible crops can no longer be grown and resistant crops can still experience a
reduction in yield from the pathogen (Hwang, et al., 2011). Clubroot causes an estimated yield
loss of 10–15% in cruciferous crops worldwide (Dixon, 2009) and in severely infested fields in
western Canada, 30 to 100% yield loss can occur (Strelkov et al., 2007).
1.2.2 Clubroot history
Clubroot on oilseed rape, turnip and radish was first identified by a Roman, Pallitius, in
Italy in the fourth century AD and was described as the development of spongy roots after the
plant was fertilized with manure (Watson and Baker, 1969). Pallitius suggested avoiding manure
as a fertilizer to limit the spread of the spongy roots (Watson and Baker, 1969). The pathogen
was first described in detail by Mikhail Woronin in 1878 from cabbage fields near St. Petersburg,
Russia. Woronin advised removing infested plants, using crop rotation and dipping the roots of
transplants in soot (Woronin, 1878).
Plasmodiophora brassicae has been recognized as a pathogen in Canada for over a
century. In 1916, researchers at the Nova Scotia Agricultural College in Truro, Nova Scotia (now
part of Dalhousie University) started conducting research specific to clubroot (Estey, 1994;
Howard et al., 2010). Watson and Baker (1969) hypothesized that turnip cultivation was the main
cause of P. brassicae dispersal from the Mediterranean and it was likely introduced into Canada
on fodder turnips (B. rapa subs. rapa L.) used by European settlers to feed livestock (Howard et
al., 2010). From the 1920s to the 1950s, clubroot was reported on cabbage, cauliflower and
rutabaga in British Columbia, Quebec and the Maritime provinces (Howard et al., 2010).
7
Clubroot is currently found in every province of Canada (Cao et al., 2009; DokkenBouchard et al., 2010; Tewari et al., 2005). Clubroot on canola in Canada was first described in
2003 in 12 fields in Sturgeon County near Edmonton, Alberta (Tewari et al., 2005). Since 2003,
clubroot on canola has spread throughout Alberta (Tewari et al., 2005) and has recently been
reported in fields in North Dakota (Chittem et al., 2014), two isolated canola nurseries in
northern Saskatchewan (Dokken-Bouchard et al., 2010), and in experimental field plots near Elm
Creek, Manitoba (Cao et al., 2009).
1.2.3 Plasmodiophora brassicae
Plasmodiophora brassica is a soil-borne obligate biotroph in the kingdom Chromista,
infra-kingdom Rhizaria, phylum Cercozoa, class Phytomyxea, order Plasmodiophorales and
family Plasmodiophoraceae (Cavalier-Smith and Chao, 2003; Cavalier-Smith, 2013; Dixon,
2014). The Rhizaria infra-kingdom is a phylogenetic supergroup that was originally classified as
a clade of Protozoa. The current classification is:
Domain: Eukarya (Group Bikont)
Kingdom:
Chromista (InfraKingdom Rhizaria)
Phylum:
Cercozoa (Subphylum Endomyxa)
Class:
Phytomyxea
Order:
Plasmodiophorales
Family:
Plasmodiophoraceae
Genus:
Plasmodiophora
Species:
brassicae
The infection process starts when exudates from a potential host root stimulate resting
spores to germinate, releasing primary zoospores. Zoospore have two whiplash flagella of
different lengths, which allow them to swim to a root hair in water films. The zoospores are
highly vulnerable because the cell wall of the resting spore no longer provides protection
8
(Kageyama and Asamo, 2009). When a primary zoospore makes contact with a root hair, it
attaches and flattens on the surface (Dixon, 2014). The zoospore protoplasm is injected into the
root hair causing a root hair infection (RHI) and can develop into a primary plasmodium in less
than four days after inoculation (DAI) (Deora et al., 2012). Multinucleate primary plasmodia
divide into zoosporangia to produce 4–16 secondary zoospores about 5 DAI at the optimum
temperature of 25 °C (Kageyama and Asamo, 2009). Secondary zoospores go on to infect other
root hairs or to initiate secondary infection of the root cortex (Naiki et al., 1984; McDonald et
al., 2014). When cortical cells are penetrated by secondary zoospores, the secondary phase of
infection begins, resulting in cell enlargement as first described by Cook and Schwartz (1930)
and later by Ingram and Tommerup (1972).
The connection between root hair invasion and subsequent infection of cortical cells is
not well understood. Secondary zoospores have been hypothesized to penetrate directly into the
root cortex after fusing in pairs containing two nuclei and undergoing genetic recombination,
however, all secondary zoospores identified in a recent study were found have a single nucleus
(Tommerup and Ingram,1972; McDonald et al., 2014). It has also been hypothesized that the
secondary zoospores may develop a myxamoeboid phase in the root hair (Mithen and Magrath,
1992). In this phase, small plasmodia formed during primary infection are motile and can
actively move between cells in the root tissue, moving from root hair cells to cortical cells
(Kunkle, 1918; Mithen and Magrath, 1992).
Primary infection (root hair infection, RHI), occurs on both susceptible and resistant host
plants (McDonald et al., 2014). In a resistant plant, primary infection initiates the unknown
resistance mechanisms and limits cortical infection and development. Inoculation of a canola cv
9
‘Zephyr’, resistant to pathotype 6, with secondary zoospores of pathotype 6 resulted in both
primary and secondary infection while resting spores of pathotype 6 alone produced no disease
incidence or severity (McDonald et al., 2014). Direct infection into the cortical of resistant plants
by secondary spores from susceptible plants cause host resistance to be bypassed or delayed
(McDonald et al., 2014)
Secondary plasmodia are responsible for the formation of clubs, the characteristic
symptoms of clubroot (Kageyama and Asano, 2009). In optimal conditions, cortical colonization
occurs 22 DAI and by 28 DAI, abnormal cell division and the development of resting spores
occurs (Deora et al., 2012). Secondary symptoms include abnormal enlargement of hypocotyl
cells above the soil line, yellowing of leaves, severe wilting, stunting, early flowering, and
premature ripening (Butcher et al., 1974; Wallenhammar et al., 1996; Diederichsen et al., 2009;
Donald and Porter, 2009; Hwang et al., 2011). Infected plants often senesce prematurely, causing
various problems depending on the brassica crop. In canola, qualities such as oil content,
uniformity, and yield are likely to decrease with P. brassicae infection (Howard et al., 2010).
Inside the root cortex, the metabolism of the host is disrupted when glucobrassicins are degraded
and the formation of indole-3-acetic acid (IAA/auxin) increases, causing parenchyma cells to
expand and cell division to increase (Raa, 1971; Butcher et al., 1974; Rausch et al., 1981;
Rausch et al., 1983; Dixon, 2006). These expanding cells become major carbohydrate sinks as
clubs are formed (Evans and Scholes, 1995; Dixon, 2006). As the cells rapidly divide, they push
into areas of xylem cells with lignified secondary walls (Deora et al., 2013). Clubs form as cells
expand from the increase in auxin and xyloglucan endotransglucosylase/hydrolase activity
10
(Devos et al., 2005). Clubbed roots eventually deteriorate, releasing millions or billions of newly
formed resting spores into the soil.
In a time-course study using the model plant Arabidopsis thaliania, nitrolase 1 and 2
concentrations were higher in clubroot-affected roots than in healthy controls (Grsic-Rausch et
al., 2000). When the enzymes were repressed, smaller secondary P. brassicae structures
developed (Neuhaus et al., 2000). Three key enzymes that are required for IAA synthesis are upregulated in plants with symptom development, and jasmonic acid increased with plant response
to clubroot infection (Grsic et al., 1999).
1.2.4 Characterization, distribution and dissemination of P. brassicae
For plant pathogens, a race is a subgroup of a pathogen species, distinguished from other
races by virulence, symptom expression, or host range, but not by morphology (D’Arcy et al.,
2014). A pathotype is a less precise characterization of a race, and is based primarily on virulence
on differential host cultivars (D’Arcy et al., 2014). Subgroups of P. brassicae can not be easily
distinguished by symptom expression on susceptible cultivars and single-spore isolations have
identified multiple pathotypes in a single field (Xue et al., 2008). Therefore, subgroups of P.
brassicae should be defined as pathotypes rather than races (Strelkov et al., 2007).
The differential set developed by Williams (1966) is commonly used to characterize the
major pathotypes of P. brassicae in Canada. The set consists of two cultivars of rutabaga (B.
napus L. var. napobrassica) and four of cabbage (B. oleracea L. var. capitata), which are
susceptible, intermediately resistant or resistant to specific pathotypes (Williams, 1966). This
differential set is limited because it was originally developed to classify pathotypes of
11
P. brassicae in cabbage and rutabaga but not canola (Strelkov and Hwang, 2014). Sharma and
colleagues (2013) outline a case for an improved differential series using genetically uniform
rapid cycling brassica collection (RCBC) or Arabidopsis lines. These lines are not used in
commercial production, yet are readily available, easy to grow and could serve as model plants
for future research on clubroot (Sharma et al., 2013).
The composition of Canadian populations of P. brassicae is summarized in Table 1.
Europe has adopted the European Clubroot Differential (ECD) set (Buczacki et al., 1975), which
consists of 15 genotypes.
Table 1.1. Pathotypes of P. brassicae based on the William’s differentials (1966) in Canada.
Pathotype
1
3
Alberta
Nova Scotia
Saskatchewan
Author
Hildebrand and Delbridge, 1995
Reyes et al., 1972
Strelkov et al., 2006
Williams, 1966
Reyes et al., 1972
Hildebrand and Delbridge, 1995
Williams, 1966
Reyes et al., 1972
Reyes et al., 1974
Williams, 1966
Strelkov et al. 2006
Hildebrand and Delbridge, 1995
S.E. Strelkov, unpublished data
4
5
Prince Edward Island
Alberta
Manitoba
Ontario
Quebec
British Columbia
Ontario
Reyes et al., 1972
Strelkov et al., 2006
Cao et al., 2009
Saude et al., 2012
Cao et al., 2009
Williams, 1966
Reyes et al., 1972
2
6
Location
Nova Scotia
Quebec
Alberta
British Columbia
New Brunswick
Nova Scotia
Prince Edward Island
Ontario
Quebec
12
Around the world, P. brassica has been detected in most areas that grow brassica crops.
Finland, Japan, New Zealand, Sweden and Russia have pathotype 2 while Australia,
Czechoslovakia, Germany, Sweden and the USA have pathotype 6 (Reyes et al., 1974; Williams,
1966; Williams and Seidel, 1969). Clubroot has been reported in Australia since the 1890s, and
the pathogen has spread rapidly in vegetable brassica crops with the extensive use of transplants
in the 1980s and 1990s (Donald and Porter, 2014).
To date, no large-scale survey of P. brassicae pathotypes throughout the world using a
differential set is available. Variation of differential hosts makes it difficult to compare the results
obtained from different studies. The ECD and Williams set are the main methods of
classification, though others developed by Ayers (1957) and Lammerink (1967) are also used.
Differential sets require a large proportion of intermediate host reactions that are not always
consistent, often resulting in several pathotypes to be assigned to one sample (Agarwal et al.,
2009). This may be attributed to populations of P. brassicae being more diverse than what was
once believed (Crute et al., 1980). For example, three pathotypes were identified and confirmed
from one field collection by single-spore isolations (Xue et al., 2008). This finding indicates that
diverse pathotype compositions could shift rapidly in response to selection pressure imposed by
resistant host cultivars and as a result, reduce the effectiveness of management strategies
(Hwang, et al., 2012). Molecular methods capable of detecting individual pathotypes will be the
best solution to test differences within populations worldwide in the future.
Many practices have contributed to the spread of clubroot throughout Canada. The
movement of soil on machinery is likely the largest cause of pathogen spread throughout the
Canadian prairies. Heavy equipment is routinely moved between fields, which can facilitate
13
movement of infested soil among fields. A tractor and cultivator can carry as much as 150 kg and
50 kg of soil, respectively, from one field to another if not cleaned between fields (Hwang et al.,
2014). In infested fields in Alberta, the incidence of clubroot was highest at field entrances
(90%) and dropped sharply 150 m and 300 m from the entrance (Cao et al., 2009; Strelkov and
Hwang, 2014). Contaminated farm machinery would likely deposit the most soil upon entering a
new field, which supports the hypothesis that machinery is the primary vector of P. brassicae
(Strelkov and Hwang, 2014).
Wind-borne dust from infected fields may also play a role in short- and long-distance
dissemination of resting spores (Gossen et al., 2014). Dust samples were found to have resting
spore concentrations as high as 2.2 x 10⁵ spores g-1 soil (S.E. Strelkov, unpublished data;
Strelkov and Hwang, 2014). Fields that are managed to minimize wind and water erosion not
only conserve topsoil but also limit the spread of resting spores to neighbouring fields.
Areas susceptible to flooding are at risk of clubroot spread if surrounding fields are
contaminated with the pathogen. The majority of the fields of the Bradford Marsh (Ontario) were
free of clubroot until an extensive flood occurred in 1954 following Hurricane Hazel. It is
hypothesized that flooding spread resting spores from a single clubroot infested field to clubrootfree fields as far as 8 km away (Creelman et al., 1958). Pathotype 6 was determined to be the
predominant pathotype in Ontario and this has since been confirmed in the Holland Marsh
(Strelkov et al., 2006; Deora et al., 2013; Strelkov, personal communication).
The future distribution of P. brassicae will likely be affected dramatically by climate and
soil type. Researchers have used temperature and moisture parameters in climate models such as
CLIMEX V2.0 software (Hearne Scientific Software Pty. Lit, Melborne, Australia) to predict the
14
occurrence of clubroot in clubroot-free areas. The Red River Valley Region of Manitoba and
north-central Alberta have high potential for losses (Turkington et al., 2004), but P. brassicae has
already spread beyond the areas of high risk from these predictions. Recent work has
demonstrated that moderate levels of clubroot can develop in regions with neutral or slightly
alkaline soil when soil temperature and moisture levels are favourable (Gossen et al., 2013). The
likelihood of P. brassicae becoming established in areas of low mean rainfall, neutral to alkaline
soil pH, and high calcium that are characteristic of large parts of Saskatchewan are low unless
large amounts of inoculum are introduced. Conditions in Manitoba are more conducive for
pathogen establishment and, as such, P. brassicae could become a serious threat to canola
production there (Gossen et al., 2014).
1.2.5 Detection of P. brassicae in the soil
!
Bioassays, manual extractions, PCR and real-time PCR (qPCR) can determine the
presence of P. brassicae resting spores in the soil. Bioassays require a large amount of space and
require a period of at least six weeks for symptom development (Faggian and Strelkov, 2009).
Manual extractions require substantial technical skill and inaccurate identification of stained
resting spores can result in false positive diagnoses (Takahashi and Yamaguchi, 1988, 1989).
Conventional polymerase chain reactions (PCR) have been used to detect the presence of
P. brassicae at concentrations as low as 103 resting spores g-1 soil (Faggian et al., 1999) and
qPCR can detect and quantify concentrations as low as 500–1000 resting spores g-1 soil (Faggian
et al., 1999; Cao et al., 2007; Wallenhammar et al., 2012). False negatives can potentially occur
15
in PCR and qPCR analysis if insufficient subsampling is conducted since DNA is extracted from
less than 1 g of soil (Wallenhammar et al., 2012).
1.3 Factors affecting clubroot severity
1.3.1 Spore load, horizontal distribution and depth
Spore load is correlated with club formation (Naiki et al., 1978). Single resting spores
have been shown to induce an infection resulting in a few small clubs two months after
inoculation (Narisawa et al., 1996). Consistent symptom development is obtained when resting
spore concentrations are greater than 103 spores g-1 of dry soil (Donald and Porter, 2009; Faggian
and Strelkov, 2009). While symptom development may be minimal if the initial infestation level
is low, the spore load will increase considerably for the next growing season (Dixon, 2014).
Few studies have looked at the vertical distribution of resting spores within the soil
profile. More than 97% of the total population of resting spores was found within the first 5 cm
of the soil, without any clustering around the Chinese cabbage plants that were cultivated in that
field (Kim et al., 2000).
Agronomic practices influence resting spore dispersal within and among fields and
machinery has been found to be the main cause for pathogen dissemination (Hwang et al., 2014).
Soil density was found to increase after rototilling, therefore, limiting the movement of resting
spores into the subsoil (Murakami et al., 2003). However, in the same study, resting spores were
still detected in the subsoil. Resting spores are initially released from rotting clubs and so they
likely remain within the tillage layer. Tillage equipment can move spores throughout the field
and to other fields when the machinery is transported. No-till, now a widespread agronomic
16
practice across the prairies, allows growers to leave residue in the field after harvest and seed
directly in the soil in the spring without the need to till. This limits the amount of contact
between machinery and soil, and as a result, reduces the rate of pathogen dissemination when
compared to conventional tillage practices.
1.3.2 Temperature
Primary root hair infection is dependent on the temperature of the surrounding soil and
air (Colhoun, 1953). An early study showed that air temperatures between 27–30 °C were
optimal for germination of resting spores and infection of cabbage roots in a greenhouse setting
(Chupp, 1917). A more recent study showed that air temperatures of 25 °C were optimal for
primary and cortical infection in Shanghai pak choy (Brassica rapa ssp. chinensis) plants in a
controlled environment (Sharma et al., 2011a, 2011b). Under optimal conditions of 25 °C,
primary root hair infection takes as little as 1 day after inoculation (McDonald et al., 2014).
Secondary zoospores are expected to be released 3-5 days after primary infection, resulting in
secondary infection occurring in as little as 4 days after inoculation (McDonald et al., 2014).
1.3.3 Soil moisture
Moisture allows zoospores to travel through soil moisture films using twin flagellae to
reach host root hairs (Dixon, 2009). Drier soils inhibit P. brassicae movement, while wet soils
containing continuous moisture films between soil particles favour movement (Dixon, 2014).
Infection developed at moisture levels as low as 9% in mineral soils, while a soil moisture
concentration of 60% was required with organic/muck soils (Hamilton and Crête, 1978).
17
The minimum soil moisture level necessary for P. brassicae infection is unknown.
Studies measuring soil moisture content generally assess the volume or mass of water present in
the soil. Gravimetric soil moisture measurements are based on the ratio of the weight of water in
the soil to the mass of the dry soil (Or and Wraith, 2002). Volumetric soil moisture is a ratio of
the volume of water present in the soil divided by the total volume of water and dry soil (Or and
Wraith, 2002). Since the water holding capacity of soils is based on pore size, degree of
compaction and organic matter content, it is difficult to compare measurements between
gravimetric and volumetric soil moisture when all of the variables are not measured. This has
made it difficult to compare assessments involving soil moisture across studies.
1.3.4 Soil pH and calcium
Soil pH also has an important influence on the level of clubroot infection. Raising the pH
with calcium has been shown to be able to regulate the development of P. brassicae (Webster,
1986; Dixon, 2014). Disease is still prevalent in the years following an application involving
calcium and an increase in pH. As a result, additional applications may be required for several
years to limit future P. brassicae development.
The germination of resting spores was lower in limed soils with a pH of 8.0, than in soils
with a pH of 5.8 (MacFarlane, 1952). This led to the conclusion that acidic soils were favourable
for clubroot development and liming could be used as a management strategy (Karling, 1968).
As a result, the application of calcitic lime has been recommended for clubroot management to
achieve an alkaline soil pH of 7.2 or more (Myers et al., 1985). The increase in free calcium ions
18
from lime increases the pH of the soil, reduces the development of zoosporangia in root hairs and
slows the release of secondary zoospores (Webster and Dixon, 1991).
However, clubroot has been found in fields with a pH greater than 7.5 (Howard et al.,
2010). In studies under controlled conditions, clubroot severity was reduced and disease
development delayed at a pH above 7.0, but disease developed at a pH of 8.0 when soil moisture
was adequate and temperatures were in the optimal range of 20–25°C (Gossen et al., 2013).
Similarly, a pH of 7.8 in both naturally- and artificially infested soils did not influence disease
incidence in a heavy loam soil (Colhoun, 1953).
Calcitic lime applied at 25 t/ha at 9 days before planting did not provide satisfactory
clubroot reduction in cauliflower (Bélec and Tremblay, 2004). The slow-release fertilizer calcium
cyanamide (50% calcium oxide, 19.8% nitrogen and 1.5% magnesium), sold in Canada as
Perlka®, has shown potential for reducing the viability of resting spores with its fungicidal
effects (Klasse, 1996). It also stimulates microbes antagonistic to P. brassica (Dixon, 2012). Wet
soils, which are favourable for clubroot development, are also necessary to release, dissolve and
distribute hydrogen cyanamide, which is a by-product of calcium cyanamide (Klasse, 1996). In
Canada, Perlka® has shown to have limited efficacy in dry soil conditions (Hwang et al., 2013).
1.3.5 Soil type
Soil type greatly influences soil moisture levels and as a result will likely influence
clubroot severity (Gossen et al., 2013). Organic matter content, moisture holding capacity, pH,
and the physical, chemical and biological properties of soil likely also influence clubroot
incidence (CI) (Dixon, 2014; Gossen et al., 2014). High levels of clubroot can develop in soil
19
with high (70%) organic matter, as well as soils with low (<6%) organic matter (McDonald and
Westerveld, 2008; Wallenhammar, 1996). High concentrations of organic matter may favour the
movement of the pathogen due to an increase in water holding capacity, but may also support
antagonistic microflora that could decrease resting spore counts within the soil. Compacted soils
with a smaller pore size may result in high clubroot severity, as there is a positive correlation
between bulk density and clubroot severity (Kasinathan, 2012). Dense, water-logged soils favour
clubroot, while disease is reduced in well-drained soil (Dixon and Tilston, 2010).
1.3.6 Spore longevity
Resting spores are able to withstand a wide range of environmental conditions. With an
estimated half-life of 3.6 years in Sweden, P. brassicae can still infect host plants in a bioassay
after 17.3 years (Wallenhammar, 1996). The half-life of resting spores in Alberta was 4.4
growing seasons (Hwang et al., 2013), likely due to the cooler climate and shorter growing
season experienced in Edmonton.
1.4 Clubroot management
1.4.1 Cultural controls
Plasmodiophora brassicae has a wide host range; over 3700 species of the family
Brassicaceae are potential hosts (Dixon, 2009). It is uncertain whether all of these species allow
P. brassicae to develop root hair infection and produce resting spores. The Alberta Clubroot
Management Plan recommends controlling volunteer canola, mustard and other possible hosts to
20
limit multiplication of resting spores (Alberta Clubroot Management Committee, 2008). Fields
should also be managed to control host weed species that may act as potential hosts (Table A1.1).
Seeding early or late in the season, when soil temperatures are low, can provide effective
management of clubroot in short-season crops (McDonald et al., 2004; Gossen et al., 2012a). In
canola, earlier seeding dates generally produce higher yields even without a P. brassicae
interaction (Christensen et al., 1985), but clubroot development is reduced and yield is slightly
increased in canola that is seeded in clubroot-infested soil early in the season (Hwang et al.,
2012).
1.4.2 Crop rotation
Most of the severely infested fields in Alberta that have been examined had produced
canola yearly or every other year (Strelkov et al., 2006a). Crop rotation with non-hosts such as
cereal grains and alfalfa is recommended (Howard et al., 2010). The Alberta Clubroot
Management Plan recommends 3 year cropping rotations between canola crops if the field is
lightly infested, or 5 year rotations for moderate to heavy infections (Alberta Clubroot
Management Committee, 2008).
Rotating crop within an infested field with non-brassicae species will eventually reduce
the resting spore concentration, but this strategy is limited by several factors. Resting spores can
survive in the soil for many years, with a half-life of approximately 3.6 years (Wallenhammar,
1996; Wallenhammar et al., 2012). Theoretically, even after an 18 year absence of a susceptible
host, 3% of the original spore population would remain, which in many situations would be more
than adequate to produce rapid and severe infection in a susceptible crop (Dixon, 2014). Crop
21
rotation could be used to slow down the accumulation of resting spores, but the long rotations
required to reduce resting spore populations in moderate or heavily infested fields may not be
economically sustainable. (Strelkov and Hwang, 2014).
1.4.3 Fungicides
Although P. brassicae is not classified as a fungus, several fungicides reduce clubroot,
but none have emerged as an effective management strategy. In Australia, fungicides containing
pentachloronitrobenzene (PCNB) were common before the 1990s and provided adequate
efficacy at relatively high application rates (18 kg/ha) in fields with low disease pressure
(Colhoun, 1958; Donald and Porter, 2014). When PCNB was applied in the eastern United
States, its performance was inconsistent and it was phytotoxic to plants at the high
concentrations necessary to provide effective control (Porth et al., 2003). Currently PCNB-based
fungicides (Adobe® 75WP and Crusoe® 75WP) are registered for management of clubroot on
brassica vegetable crops in Canada (Howard et al., 2010; Hwang et al., 2011). Quintozene
(Terraclor® 75 WP) was found to reduce disease severity, but in-row applications at rates that
would be economically feasible showed little potential to increase yield in commercial canola
fields (Hwang et al., 2011).
Fluazinam (Allegro® 500F; ISK Biosciences Corp., Concord, OH) and cyazofamid
(Ranman® 400 SC) are also registered in Canada for brassica vegetable crops. Both products
inhibit spore germination by uncoupling protons in the production of ATP (Guo et al., 1991;
Adhikari, 2012). Fluazinam and cyazofamid have been shown to slightly decrease disease in
22
field trials of canola (Hwang et al., 2011), but not nearly enough to exceed the economic
threshold necessary to be used as a management control in canola.
Chemical surfactants used as wetting agents may also suppress P. brassicae infection if
they have a lytic effect on zoospores. They also lower the surface tension of water around
particles in soil, limiting zoospore movement (Porth et al., 2003). A rate of 0.5% AquaGro 2000L (80% ethoxylated alkyl phenols, 5% fatty acid esters) was found to be most effective to reduce
P. brassicae development on Chinese cabbage in a controlled environment and in field
conditions (Hildebrand and McRae, 1998). However, a rate of 0.5% AquaGro 2000-L had a
phytotoxic effect on plants and only under severe disease conditions was advocated for use
(Hildebrand and McRae, 1998). At lower levels of infection common to most production fields,
two applications at 0.2% 10 days apart, showed the greatest reduction in disease development
without reductions in yield due to phytotoxicity (Hildebrand and McRae, 1998).
1.4.4 Fumigants
Fumigant efficacy against resting spores is strongly influenced by soil type (Donald and
Porter, 2013). In Canada, both chloropicrin and metam sodium (Vapam® HL) are registered for
field use on cruciferous vegetables. Both products are labelled for control of nematodes and plant
pathogens (OMAFRA, 2013). Metam sodium is a liquid fumigant that breaks down into methyl
isothiocyanates (MITCs), which are the compounds with activity against resting spores. Partial
control was achieved by soil fumigation with metam sodium in Australia in heavy clay soils
(Porter et al., 1994). Chloropicrin (95% trichloronitromethane) has been found to achieve partial
control against P. brassicae in naturally infested soils (White and Buczacki, 1977). However,
23
efficacy is inconsistent and is often dependent upon the method of application, such as soil
compaction after application, water drench method or sealing with polyethylene sheeting (White
and Buczacki, 1977).
Solarization, in which polyethylene sheeting is laid over the soil to trap heat and
humidity, used in combination with the fumigant dazomet, reduced resting spore concentrations,
but was not cost effective and could only be applied during the summer season when crops are
usually grown (Porter et al., 1991).
1.4.5 Biological controls and biofumigants
Several biological control agents have been tested for suppression of P. brassicae. These
microbes may be able to inhibit metabolic activities of the pathogen (Feng et al., 2012). A
reduction of 52–97% in clubroot was observed when Chinese cabbage seedlings were dipped in
an isolate of Heteroconium chaetospira before transplanting into the field (Narisawa et al.,
2000). Heteroconium chaetospira isolate BC2HB1, a non-mycorrhizal endophyte of canola and
other Brassica spp., colonized cortical tissues in roots and also induced plant resistance (Lahlali
et al., 2014). The bacterium Baccillus subtilis, and the fungus Gliocladium catenulatum, reduced
clubroot severity by more than 80% in a controlled environment (Peng et al., 2011). In the field,
there was no significant impact on the susceptible canola cultivar, but there was a 54–84%
decrease in disease severity when the two biological controls were applied as an in-furrow
drench at 500 L ha-1 (Peng et al., 2011).
MustGrow™ is a biofumigant manufactured from the pressed meal of B. juncea. It is
used to manage nematodes in berry crops. It is possible that it may act in a similar way to a bait
24
crop, stimulating the germination of resting spores that subsequently die in the absence of a
living host (Murakami et al., 2000). However, this hypothesis has not yet been tested.
Plant growth stimulants to strengthen plant defense mechanisms have been tested for
efficacy against P. brassicae. Greenhouse trials of PlasmaSoil® suppressed club formation and
reduced clubroot severity on rapeseed (B. napus) and Chinese cabbage (B. rapa) when applied at
a concentration of 10% (Kammerich et al., 2014).
1.4.6 Bait crops and soil additives
Bait or trap crops have been used to stimulate the germination of resting spores while
preventing P. brassicae from completing its life cycle. When radish (Raphanus sativus) was
grown in advance of Chinese cabbage in a field experiment, resting spores were reduced by 94%
compared to the start of the experiment. However, there was no reduction in clubroot severity in
the Chinese cabbage. When a pot trial was conducted using the same methodology, disease
indices of Chinese cabbage plants were lower compared with control pots where no plants had
been grown previously (Murakami et al., 2000). Bait crops had no effect on clubroot severity in
two naturally infested fields in Alberta, ON where the concentration of resting spores was above
1 x 10⁶ spores g -1 of soil (Ahmed et al., 2011).
Boron has been identified as a major micronutrient required for brassica crops to thrive,
yet phytotoxic effects such as chlorosis and necrosis can occur if excessive amounts are applied
(Brown and Shelp, 1997; Deora et al., 2011). The penetration of zoospores or development of the
pathogen in the root cortex may be constrained by sufficient amounts of boron in plant cells
(Dixon, 1996). In high-organic-matter muck soil, boron applied at 4 kg B ha-1 decreased clubroot
25
severity by 64% at 6 weeks after planting compared with a non-treated control (Deora et al.,
2011). Boron leaches out of mineral soil more quickly than muck soil due to the lack of organic
matter (Parks and White, 1952). Therefore, not only is a drench application not economical for
canola, but the vast majority of canola growing regions in Canada are composed of mineral soils
which allows for greater leaching. The application of boron will likely not provide significant
control unless other parameters from an integrated pest management program are included.
1.4.7 Host resistance
The degree of susceptibility to clubroot, specifically different pathotypes of P. brassicae,
is variable in different brassica cultivars. In general, bok choy (Brassica campestris, L. var.
chinensis ‘bok choy’ (Makino)), Brussels sprouts (Brassica oleracea L. var. gemmifera
(Wenderoth)), cabbage, (Brassica oleracea L. var. capitata (Schübler & Martens)) and
pak choy (Brassica campestris L. var. chinensis ‘Shanghai choy sum’ (Makino)) are highly
susceptible to clubroot. Radish cultivars tend to be much less susceptible to P. brassica (Howard
et al., 2010; Sharma et al., 2013).
Effective clubroot management in fields highly infested with P. brassicae can be obtained
using genetic resistance (Cao et al., 2009). Long-term management of clubroot will require
development of cultivars with durable resistance in combination with rotation with non-host
crops and other IPM strategies (Hwang et al., 2014). Development of durable genetic resistance
to P. brassicae may require pyramiding of both quantitative and qualitative resistance genes (Van
der Plank, 1963).
26
The first clubroot-resistant cabbage was developed by Walker and Larson (1960) from a
cross between a cabbage cultivar (B. oleracea (L.) var. capitata L.) with kale (B. oleracea (L.)
var. viridis L.). Since then, sources of resistance to P. brassicae have been identified in kale
(Manzanares-Dauleux et al., 2000), Chinese cabbage (Hirai et al., 1998; Piao et al., 2004), and
turnip (Hirai et al., 2004). Much of the resistance seen in commercial brassicae varieties today is
from resistance genes from B. rapa (stubble turnip) (Dixon, 2014).
Clubroot resistance in commercial varieties has broken down in the past due to short
rotations of the same cultivar allowing for the selection of virulent races of P. brassicae
(Kuginuki et al., 1999). Resistance is generally pathotype specific, which makes it hard to breed
a cultivar as a single solution worldwide (Diederichsen et al., 2009; Howard et al., 2010).
Resistance to pathotype 3 was identified in winter canola ‘Mendel’, rutabaga, pak choy (B. rapa
(L.) ‘Flower Nabana’), black mustard (B. nigra), cabbage and turnip (Rahman et al., 2013; Peng
et al., 2014). Resistant spring canola lines with RoundUp® tolerance, resistance to pathotype 3,
and spring growth habit were developed using marker-assisted breeding (MAB) (Rahman et al.,
2013). However, there are strong indications that this resistance is beginning to break down in
parts of Alberta (Canola Council of Canada, 2014). This single-gene resistance puts a selection
pressure on the pathogen to select for virulent races and could be avoided by pyramiding multigene resistance to create a more durable resistance package. Identifying new clubroot resistance
(CR) genes and mapping known CR genes using MAB can be used in breeding programs to
create multi-gene resistance.
Many canola cultivars in Canada are resistant to pathotype 6 (Williams, 1966, McDonald,
pers. comm) and susceptible to pathotype 3 (Deora et al., 2013). Primary infection was found to
27
induce susceptibility in a cultivar that was susceptible to pathotype 3 or induce resistance in a
cultivar resistant to pathotype 3 in the root cortex of canola plants (McDonald et al., 2014). This
indicates that primary infection can initiate the resistance reaction and result in an incompatible
reaction (McDonald et al., 2014).
Clubroot-resistant canola cultivars available today are resistant to specific pathotypes.
Released in 2009, the first highly resistant canola cultivar 45H29 (Pioneer Hi-Bred, Caledon,
ON, USA) is resistant to pathotype 3, the dominate pathotype in Alberta. Since then, 6056CR
(Brett-Young, Winnipeg, MB, Canada), 1960 (Canterra, Winnipeg, MB, Canada), DeKalb 74-47,
74-54 (Monsanto, St. Louis, MO, USA), InVigor L135C (Bayer CropScience, ON, Canada),
D3155C, 45H33 and Proven VR 9558 GC (Pioneer Hi-Bred, Caledon, ON, USA) have been
released as clubroot-resistant cultivars for western Canada.
In canola, effective blackleg resistance is not always available in new clubroot-resistant
cultivars. This can force growers to make a choice between protecting the crop against the
immediate threat of blackleg, or longterm preventative measures of clubroot. If two or more
seasons of a susceptible cultivar are planted, clubroot levels can increase quickly. As a
comparison, blackleg can be managed over a four-year rotation if it starts to cause large yield
losses (Canola Council of Canada, 2014).
In 2013, a clubroot-resistant cultivar showed a high incidence of clubroot infection in a
commercial canola field near Edmonton (Canola Council of Canada, 2014). Preliminary testing
indicated that the novel pathotype may be present in this field. The new, highly virulent
pathotype (colloquially known as 5x), is virulent on all of the commercially available clubrootresistant canola cultivars in Canada (Canola Council of Canada, 2014).
28
1.5 Objectives
Resting spores can remain dormant for many years and are extremely resilient. To date,
treatments aimed at killing resting spores are either toxic to the environment or do not provide
consistent reductions. Resting spores are expected to be concentrated within the upper region of
the soil profile, but there have been no thorough studies to investigate the vertical distribution of
resting spores or to assess differences in distribution in different soil types.
The environmental conditions that are conducive to clubroot development are fairly well
understood. For example, the pathogen develops most rapidly at temperatures of 20 to 25°C and
soil moisture levels over 40% w/w. However, additional data would contribute to developing a
model to predict clubroot development.
Therefore, the objectives of this research were to:
1. Determine the vertical distribution of resting spores within the profile of various soils, and
compare the effectiveness of qPCR relative to manual extraction for quantifying resting spore
concentrations in naturally infested soil.
2. Quantify the effect of the interaction of temperature and soil moisture on the development of
P. brassicae in a field setting and develop a simple clubroot prediction model.
The following hypotheses were tested:
1. The highest concentration of resting spores occurs within the top 15 cm of mineral and muck
soils, with few or no spores present below the top 15 cm of soil.
29
2. Weather conditions, especially the interaction of temperature and soil moisture, have a
substantial impact on infection by P. brassicae and subsequent development of clubroot
severity on canola, and so can be used in disease prediction.
30
CHAPTER TWO - QUANTIFICATION OF RESTING SPORES THROUGHOUT THE
SOIL PROFILE
2.1 Introduction
The distribution and population density of soil-borne microorganisms can greatly depend
on soil structure (Workneh et al., 1998). Soil-borne plant pathogens are limited by physical
barriers and often rely on gradients of host exudates to induce germination (Friberg et al., 2005).
Soil-borne pathogens provide a unique challenge for the application of management strategies
whose efficiency is strongly influenced by on the distribution of the target organism. The
distribution of a microorganism throughout the soil profile is related to the abundance of cracks
and macropores, moisture, or vectors for movement as well as the size of the target
microorganism (Smith et al., 1985).
The movement of microorganisms through soil has been studied in programs to protect
groundwater from pathogen contamination. Soil texture can have a strong influence on this
movement. For example, 22–79% of cells of the bacterium, Escherichia coli, which are 2–6 µm
in length, moved through the 28 cm depth of intact silt soil columns over a 12-hr period at an
irrigation rate of 22 mm h-1 (Smith et al., 1985). Soil cores became more effective bacteria filters
when the soil structure was compromised by disturbance. The authors suggested that cells were
likely transported through macropores that facilitate rapid movement of water and bacteria cells
through the soil profile (Smith et al., 1985). Resting spores of P. brassicae may act in a similar
manner and move downward from clubbed roots to the subsoil.
31
Similarly, Pseudomonas fluorescens is a root-colonizing bacterium that is capable of
suppressing other plant pathogens by producing antimicrobial metabolites (Natsch et al., 1994).
When P. fluorescens was added to undisturbed soil columns, population densities declined down
to a depth of 30 cm before leveling off (Natsch et al., 1994). Undisturbed soil cores, closely
resembling soil profiles found in the field, did not retain P. fluorescens as effectively as disturbed
soil cores. It is hypothesized that P. fluorescens cells measuring between 2–7 µm long and 1 µm
wide did not move downward uniformly, but followed macropores, cracks and earthworm and
root channels in undisturbed soils (Gish and Shirmonhammadi, 1991; Natsch et al., 1994;
Okazaki et al., 1997).
Phytophthora root and stem rot causes stunting, damping-off and wilting in soybean
resulting in a reduction in yield (Workneh et al., 1998). The vertical distribution of Phytophthora
sojae was analyzed at 5 cm increments to a depth of 30 cm by using leaf disc bioassays to
measure the amount of colonization in no-till and conventional-till soybean fields (Workneh et
al., 1998). No-till fields had high levels of the pathogen starting at 5 cm from the soil surface, but
concentrations eventually decreased as depth increased (Workneh et al., 1998). Fields that were
conventionally tilled showed lower numbers of leaf discs colonized at 5 and 10 cm below the soil
surface, but peaked at 20 cm before decreasing with additional depth (Workneh et al., 1998).
While the developmental stage of P. sojae causing disease development in the leaf disc bioassay
is unknown, zoospores of P. sojae are over 25 µm in diameter (Schmitthenner, 1999).
Ascospores of the fungal pathogen responsible for sudden wilt of cantaloupe,
Monosporascus cannonballus, measuring 35 to 50 µm in diameter, were observed throughout the
top 25 cm of commercial cantaloupe fields and native desert sites (Stanghellini et al., 1996). No
32
significant differences were found between depths, but many of the sampling sites showed a
trend of the number of ascospores increasing to a depth of 25 cm (Stanghellini et al., 1996).
!
Resting spores of P. brassicae are approximately 3 to 5 µm in diameter (MacFarlane,
1970), and millions of resting spores can be present in small soil aggregates. Resting spore
concentrations in mineral soil in Alberta have been reported up to 1.0 x 10⁶ spores g-1 soil or
more (Ahmed et al., 2011) and at 2.4 x 10⁷ spores g-1 in high-organic-matter soil in Ontario
(Kasinathan, 2012). The distribution of resting spores throughout the soil has not been examined
in detail, but examination of the vertical distribution of resting spores may contribute to the
development of improved management strategies for this pathogen.
Resting spores were thought to be clustered with host roots within the ‘A’ horizon of the
soil profile (Murakami et al., 2003). The ‘A’ horizon of surface soil contains the greatest amount
of root mass from susceptible host plants, and the ‘B’ horizon or subsoil, which often reflects
characteristics of the parent material, contains much fewer roots (Gan et al., 2009). The vertical
distribution of resting spores from two cores from a single, heavily infested field was examined
in a previous study using a modified form of manual extraction (Kim et al., 2000). In this study,
a series of meshes was used to filter out debris and a calcofluor dye giving the resting spores a
bright blue fluorescence under a fluorescence microscope (Kim et al., 2000). The process
requires extensive technical expertise and takes several days to process a sample. While 97% of
resting spores were found within 5 cm of the soil surface and 99.9% of resting spores were found
within the depth of 0–30 cm, 4 x 10³ spores g-1 soil were detected as deep as 40 cm. No resting
spores were found in the lowest soil layer at a depth of 45 cm (Kim et al., 2000). The efficacy of
disease management techniques will be greatly influenced by the depth that resting spores are
33
distributed throughout the vertical soil profile. For example, fumigants such as Busan® (43%
metam sodium) must be injected below the level of the resting spores to allow the volatile gas
phase of the active ingredient to rise through the soil and make effective contact with resting
spores (Littke, 2010).
Bioassays using susceptible brassica species and large soil samples are a common and
reliable method of determining the presence and quantifying the concentration of resting spores
of P. brassicae in soil (Faggian and Strelkov, 2009). However, since bioassays require the
susceptible plants to be grown for 6 weeks for symptom development, they require a large
amount of greenhouse space and are time consuming (Faggian and Strelkov, 2009).
The process of determining the presence of P. brassicae resting spores could be
accelerated by using microscopic examination of susceptible host root hairs at one week after
seeding to determine if infection has occurred (MacFarlane, 1952; Hwang et al., 2011). Staining
with fluorochromes has also been used to distinguish the resting spores of P. brassicae from soil
particles (Takahashi and Yamaguchi, 1988, 1989). This method requires substantial operator skill
(Faggian and Strelkov, 2009).
While bioassays are reliable in detecting P. brassicae resting spores, samples containing
fewer than 1000 resting spores g-1 soil may result in false negatives, while large quantities of
resting spores cause severe symptom development and often result in being indistinguishable
from one another (Faggian and Strelkov, 2009). Manual counts after extracting resting spores
from soil samples is labour intensive and time consuming. Depending on the soil type,
P. brassicae resting spores are still difficult to identify after staining with fluorochromes,
potentially resulting in a wrong diagnoses.
34
Conventional polymerase chain reactions (PCR) have been used to detect the presence of
P. brassicae at concentrations as low as 1000 resting spores g-1 soil (Faggian et al., 1999).
Quantitative PCR (qPCR) allows spore concentration to be estimated, while conventional PCR is
used primarily to detect the presence of the pathogen. Detection limits with qPCR for artificially
infested soil samples correspond to approximately 500–1000 P. brassicae resting spores g-1 soil
(Faggian et al., 1999; Cao et al., 2007; Wallenhammar et al., 2012). A recent study using an
internal control to calibrate for inhibitors of qPCR amplification in soil showed the detection
limit to be as low as approximately 1 x 10⁴ P. brassicae resting spores g-1 soil in muck soil
(Deora et al., 2015).
There are limitations to conventional and qualitative PCR methods. At present, these
methods cannot determine the identity of the pathotype or whether the spores are viable, since
they only require detection of P. brassica DNA. It is likely that once spores are killed, DNA does
not last for a prolonged period of time in the soil, but the rate of decomposition is not known.
Limitations also exist due to the variability of inoculum distribution within a small area, which
increases the risk of false negative results when insufficient subsampling is conducted
(Wallenhammar et al., 2012). The current study examined several soil types and assessed several
techniques for quantifying resting spore concentrations at different depths within the soil profile.
2.2 Materials and Methods
2.2.1 Field sites
Soil samples were obtained from clubroot-infested fields on mineral soils at Bassano,
AB; Millgrove, ON; Flamborough, ON; and an infested high-organic-matter soil at the MCRS,
35
Holland Marsh, ON (Hemic histosol). soil composition, pH and texture was determined by
Agrifood Laboratories (Guelph, ON) March, 2014 (Table 2.1).
Table 2.1. Properties of the soil collected from fields naturally infested with Plasmodiophora
brassicae in Alberta and Ontario, Canada.
Soil composition (%)
Longitude,
Latitude
pH
Sand
Silt
Clay
OM1
Bassano, AB
50.7˚, -112.2˚
8.3
32
66
2
1.3
Silt loam
Flamborough, ON
43.3˚, -80.1˚
7.4
28
60
12
1.8
Silt loam
Holland Marsh, ON 44.0˚, -79.6˚
5.6
50
45
5
81.4
Muck
Millgrove, ON
7.2
79
12
9
0.8
Loamy sand
Location
1Organic
!
43.4˚, -80.0˚
Soil texture
matter was measured separately from the sand, silt and clay soil compositions.
The field near Bassano has been planted primarily with wheat since 1999. Canola
cultivars susceptible to P. brassicae were planted in 1998, 2004, and 2007, and a clubrootresistant cultivar, 45H29, was seeded in 2010. Susceptible brassica crops were grown almost
every year with no rotation at the fields in Flamborough, Millgrove and the Holland Marsh. The
field in Flamborough has been planted with broccoli and cauliflower on a 2- to 3-year rotation
for over 15 years, with rye planted as an occasional cover crop in Flamborough, ON. At the
Holland Marsh, cores were taken at one site where clubroot-susceptible brassica crops such as
Shanghai pak choy, Chinese flowering cabbage and canola cv. ‘Invigor 5030 LL’ have been
grown repetitively over the last decade. At the second site in the Holland Marsh, cores were
retrieved from an adjacent area where fewer clubroot susceptible crops have been grown in past
years and where lower levels of infection have been recorded in recent trials. The final field site,
in Millgrove, ON, had a 2-year cauliflower, 1-year lettuce rotation for the last 10 years.
36
2.2.2 Sampling methods
Samples were collected from each field using a 56-cm long soil corer inserted vertically
until the entire core cavity was filled. The corer was driven to a depth of 53 cm, using a rubber
mallet/sledgehammer if necessary. The core was divided into seven nearly equal increments, 0–
7.9, 8–15.9, 16–22.9, 23–29.9, 30–37.9, 38–45.9 and 46–53 cm. Soil cores inserted too far or
missing soil within an increment were discarded. Three core replications were taken within 1 m2,
and then a second 1 m2 site was sampled at the same field. A total of six cores from two sites
from each clubroot-infested field were obtained.
The outer layer of soil of each soil core was removed from the deepest depth towards the
soil surface to reduce the possibility of contamination as the core was being pulled from the
ground. Scoopulas (stainless steel utensils with a spatula-like scoop) were used to extract the
samples from the soil corer and were disinfected with 70% ethyl alcohol to avoid contamination
between samples. A soil sample from the centre of the core at each depth was extracted using a
clean scoopula and placed in a vial or paper envelope. The containers were sealed between cores
to avoid contamination.
Each soil sample was dried at 37 °C overnight or longer until no moisture was present.
Samples were ground to a fine powder using a porcelain mortar and oversized pestle (CoorsTek
Golden, CO, USA), which was cleaned with dish detergent followed by 70% ethanol between
samples. Samples were thoroughly mixed to ensure that subsamples were uniform and
representative, and single-use paper scoops were used to transfer soil to the weigh scale to avoid
contamination.
37
A Power Soil DNA isolation kit (MO BIO Laboratories Inc., Carlsbad, CA), was used for
DNA extraction. The recommended weight of 0.25 g of powdered mineral soil was added
directly to the beaded tubes provided with the kit. For the high-organic-matter soil, only 0.1 g of
powdered soil was used, as recommended in a previous study of this soil type (Deora et al.,
2015). A mechanical bead rupture (Omni 116 International Inc., Kennesaw, GA) was used to
homogenize the contents of the beaded tubes for 1 min at high speed. The remaining DNA
extraction and purification was conducted according to the Power Soil DNA isolation kit
requirements.
2.2.3 Primer, probe and internal control
A TaqMan multiplex system with a competitive internal positive control (CIPC)
developed previously (Deora et al., 2015) was used for the detection of P. brassicae in soil
samples. A forward primer (DC1F) and reverse primer (DC1mR) for P. brassicae were used
(Table 2.2). Both primers contained an amplified region of 90 bp of the internal transcribed
spacer (ITS1) region of the P. brassicae genome. A probe (PB1) using a FAM reporter dye at the
5’ end and a NFQ-MGB quencher at the 3’ end was used. The final cycle threshold (Cq) values
for each sample were used to estimate the initial DNA concentration in the sample. The Cq value
was inversely proportional to the initial concentration of DNA, such that a lower Cq value
corresponded to a higher initial concentration of DNA. Primers and probes were designed using
a Primer Express (version 3) software using the TaqMan® MGB Quantification option (Table
2.2.).
38
Table 2.2. Nucleotide sequence of primers and probes used for the qPCR assays for
quantification of resting spore concentration of Plasmodiophora brassicae in soil (Deora et al.,
2015).
Amplified
Sequence name and purpose Sequence (5’ to 3’)
length (bp)
DC1F
Forward primer
CCT AGC GCT GCA TCC CAT AT
90
DC1mR
Reverse primer
CGG CTA GGA TGG TTC GAA A
PB1
P. brassicae probe
[6-FAM] CCA TGT GAA CCG GTG AC
[NFQ-MGB]
pDSKGFPuv1
CIPC forward hybrid CCT AGC GCT GCA TCC CAT ATC GAT
primer
GGC CCT GTC CTT TTA C
116
PBGFPuv3 CIPC reverse hybrid CGG CTA GGA TGG TTC GAA AGT GTA
F
primer
ATC CCA GCA GCA GTT A
GFP1
CIPC probe
[VIC] ACC ATT ACC TGT CGA CAC AAT
CTG CCC T [NFQ-MGB]
Differences in amplification efficiency among samples were assessed using a competitive
internal positive control (CIPC) (Deora et al., 2015). A plasmid (pDSK-GFPuv1) containing the
green fluorescent protein from a jellyfish (Aequorea victoria) was used, as it was assumed that
this DNA was not present in the soil. PCR amplification of GFPuv1 was achieved by forward
(PBGFPuv3F) and reverse (PBGFP3R) hybrid primers designed based on the sequenced
plasmid, pDSK-GFPuv1. Binding sites to allow amplification of both P. brassicae and the CIPC
were produced by incorporating forward (DCIF) and reverse (DC1mR) primers for P. brassicae
on the hybrid primers. The resulting 77 bp amplicon was generated using 0.4 µM of both hybrid
primers (PBGFPuv3F: CCTAGCGCTGCATCCCATATCGATGGCCCTGTCCTTTTAC and
PBGFPuv3R: CGGCTAGGATGGTTCGAAAGTGTAATCCCAGCAGCAGTTA), where
regular letters indicate the P. brassicae primer sequences and bold letters indicate primer
sequences to amplify the GFPuv1 (Figure 2.1; Deora et al., 2015). The mix contained 0.1 mM
39
dNTPs, 2 mM MgCl2, 1 x reaction buffer, 1 unit of DNA polymerase (JumpStartTM Taq DNA
Polymerase, Sigma-Aldrich, St. Louis, MO), and 5 µl of template DNA of plasmid pDSKGFPuv1 (Table 2.2). The amplicon was increased using cycling conditions of 94 °C for 2 min
and 40 cycles at 94 °C for 30 sec, 55 °C for 30 sec, 72 °C for 1 min, and a final stabilization at
72 °C for 10 min in a reaction volume of 25 µl. The amplified product was purified using the
Wizard SV Gel and PCR Clean-up kit (Promega, Madison, WI) following the manufacturers’
instructions to remove excess primers and dNTPs. The amplified product was quantified using a
Qubit fluorometer (Life Technologies, Eugen, OR) and then further tested on a Step-One realtime PCR (Applied Biosystems, CA). A TaqMan probe (GFP1) using a VIC reporter dye at the
5’ end and a NFQ-MGB quencher at the 3’ end were used to quantify the CIPC amplification
(Applied Biosystems). A previous study (Deora et al., 2015) determined that 2 µl of 5 x 10⁻⁸ µg
µl-1 (5 fg µl-1) of the CIPC amplicon (in 20 µl of reaction mix) had a Cq value of 20.9 to 21.4
when amplified together with concentrations of P. brassicae DNA. To determine the necessary
amount of CIPC to be added to the master mix of the P. brassicae assay, a dilution series
consisting of 108 to 102 resting spores g-1 was tested to achieve a target Cq value. The GFP1
TaqMan® probe was added to the mastermix at a concentration of 0.8 µl of 6.25 µM to assess
CIPC amplification (Table 2.3).
40
Figure 2.1. Amplicon of the competitive internal positive control (CIPC) designed by Deora et
al. (2015). Primers for Plasmodiophora brassicae are indicated by broken lines and the CIPC
primer is indicated by solid lines.
Table 2.3. qPCR mix components used to amplify and quantify DNA of Plasmodiophora
brassicae in naturally infested soil samples.
Component
Final stock (nM)
Volume in reaction (µl)
TaqMan MasterMix
1x
10.0
Forward primer (DC1F)
900
0.8
Reverse primer (DC1mR)
900
0.8
P. brassicae probe (PB1)
250
0.8
CIPC probe (GFP1)
250
0.8
CIPC amplified product
2.0
Sample DNA
2.0
Sterile de-ionized water
2.8
Total volume
20.0
2.2.4 Quantifying soil DNA with qPCR
All of the qPCR assays were conducted in a 48- or 96-well plate Step-One real-time PCR
thermal cycler (Applied Biosystems) according to the manufacturer’s instructions. Each sample
well had a 20 µl reaction mixture consisting of 10 µl of 2 x TaqMan® Universal PCR Master Mix
(P/N 4304437, Applied Biosystems), 0.8 µl of 22.5 µM of P. brassicae primer pairs, 0.8 µl of
6.25 µM of P. brassicae GFP1 probe, and 2 µl of extracted DNA. A standard curve of known
concentrations of P. brassicae spores was created using a 10-fold dilution series 108 to 102
41
resting spores g-1 soil and added in duplicate to each qPCR assay. Plates were centrifuged at 1500
x g for 2 min to eliminate air bubbles within the wells. Assays with r ≥ 0.97 were kept and used
for data analysis. Thermal cycling conditions were 50 °C for 2 min, 95 °C for 10 min, and 40
cycles of 95 °C for 15 s followed by 62 °C for 1 min.
2.2.5 Normalization of qPCR data and quantifying inhibition
Assays were normalized using procedures developed by Deora et al. (2015). Values were
adjusted when the cycle threshold (Cq) value of the CIPC rose above the CIPC of the negative
control. Samples with high levels of inhibition (∆Cq values of 3.3 or greater) were diluted 10 and
15 times and assayed again to obtain a lower ∆Cq value. For samples with only moderate
inhibition, (∆Cq values of 3.2 or less), the following formula developed by Bilodeau (2011) was
used: Concentration = the estimated concentration based on the standard curve x (E + 1)∆Cq
where, E = efficiency and ∆Cq = Cq sample – Cq control (water).
2.2.6 Direct counts of manual extractions
Manual extractions and direct counts of resting spore concentration in samples of
naturally infested soil from Flamborough, ON were conducted using established methods
(Dhingra and Sinclair, 1985) to compare with the estimates from real-time qPCR. Mineral soil
from Elora, ON, where clubroot was not present, was used as a negative control, and naturally
infested Flamborough soil was used as a natural source of resting spores. Aliquots (25 g) of dry,
thoroughly mixed soil with varying amounts of resting spores were used from each soil sample
and mixed with 100 mL of 2% sodium hexametaphosphate (NaPO3)6, stirred for 1 min and left to
42
settle overnight. The mixture was filtered through eight layers of cheesecloth and centrifuged at
1000 x g for three 10-min cycles. The supernatant was discarded and the remaining pellet was
dispersed in 50 mL of 40% sucrose and the suspension was allowed to settle for 2 days at 4 °C.
The supernatant was poured into a 50 ml tube and centrifuged again for 1 hour at 1000 x g. The
resulting supernatant was discarded and the remaining pellet was suspended in 5 mL of
deionized water. The concentration of resting spores was estimated by direct counting using a 20
x objective lens in a compound microscope and a haemocytometer.
2.2.7 Statistical analysis
The data were continuous but not normally distributed, so a non-parametric analysis
(Friedman test, PROC FREQ, SAS software version 9.3, SAS Institute, Cary, NC) was used. The
Friedman Chi-squared test was used with the fixed effects as field location, sampling site, core
and depth, with spores as the continuous variable to determine differences among depths, cores,
sites and fields. Regression analysis (PROC REG) with increasing depth was used to determine
if a significant quadratic relationship existed between depth and resting spore concentration.
Analysis of variance was performed using PROC MIXED (SAS software version 9.3, SAS
Institute, Cary, NC) comparing manual counts and qPCR quantities using single-degree-offreedom contrasts.
2.3 Results
The four clubroot-infested sites that were assessed represented a wide range of soil types
and textures (Table 2.1). The soil collected 7 November, 2013 at Bassano consisted mainly of silt
43
and a moderate amount of inhibition occurred in the qPCR analyses (CIPC ΔCq <2.8). Soil from
Flamborough sampled 5 June, 2013 was a silt-loam, had the highest clay concentration (12%) of
the fields sampled, and a homogeneous texture from 10–53 cm below the soil surface. It also had
low qPCR inhibition (CIPC ΔCq <1.0). The loamy sand field at Millgrove, sampled 14
November, 2013 consisted of 79% sand, also had a homogeneous texture with a 5–10 cm layer
of clay or silt found approximately 30 cm below the soil surface, and a CIPC ΔCq of less than
2.1. Soil from the Holland Marsh sampled 22 October, 2012 had 81% organic matter and
exhibited a high level of inhibition (CIPC ΔCq <3.3) (Table 2.1, Table A2.6).
Resting spores of P. brassicae were present throughout the soil profile at each location.
The highest concentrations of resting spores were found in one of the sampling sites at
Millgrove, which had 2.1 x 10⁷ resting spores g-1 soil at depths of 33–37.9 cm and 2.6 x 10⁷
spores at depths of 46–53 cm (Table A2.5). The lowest resting spore concentration that fell
within the standard curve was found in Flamborough with 2.6 x 10³ spores g-1 soil at a depth of
46–53 cm (Table A2.3). A single core from Bassano was negative for resting spore DNA at each
depth, but resting spores were present in both of the two other cores (range 3.0 x 10³ – 9.0 x 10⁴
spores g-1 soil) taken within 1 m2 (Table A2.2). In general, the overall levels of resting spores at
the four fields were highly variable and not uniform between depths, cores, sites and fields. The
two sites sampled at every field often had very different mean resting spore g-1 soil
concentrations even though they were sampled from fields with the same soil type and a history
of similar brassica crops. (Table A2.2, 2.5).
44
2.3.1 Assessment of vertical distribution
Resting spores were unevenly distributed in all soils, but all soils had the greatest
percentage of resting spores in the top 30 cm, with the exception of the Holland Marsh and one
core from site 2 removed from the Millgrove site.
Analyses of the soil samples from Bassano, AB, indicated that resting spores were
unevenly distributed throughout the soil profile. About 90% of the resting spore DNA was
located within 30 cm of the soil surface (Figure 2.2, Table A2.2). Based on the small number of
samples assessed, there were no differences among the two sampling sites (Χ2(1) = 2.16, P =
0.14) or depths (Χ 2(6) = 5.37, P = 0.50) at this site, but cores (Χ 2(2) = 5.92, P = 0.052) and site
× core interaction (Χ 2(2) = 5.38, P = 0.07) were significant at P ≤ 0.10. While the two sampling
sites were very close to being significantly different, the site with the greater total of resting
spores had one core where no resting spores were detected (Table A2.2). Similarly, most cores at
the Bassano, AB field showed a pattern of decreasing resting spores with depth. The site × core
interaction was likely associated with the single core that was negative for DNA of P. brassicae
at one sampling site; DNA was detected from the other two cores taken less than 1 m away, and
from all three cores at the second sampling site (Table A2.2).
45
Figure 2.2. Median resting spore concentrations of P. brassicae in soils from different depths
from Bassano AB, Flamborough ON, Holland Marsh ON, and Millgrove ON.
Samples from Flamborough, ON showed a decrease in resting spores with depth (Figures
2.3.1, 2.3.2), with 82% of the resting spores within the top 23 cm of the soil profile (Table A2.3).
There were no differences among the sampling sites (Χ2(1) = 3.51, P = 0.06) or cores (Χ2(2) =
0.44, P = 0.80). The concentration of resting spores was significantly higher in samples from the
soil surface to a depth of 8 cm, than in the 23–53 cm sampled soil (Table A2.3). Significant
differences were found among depths from all cores (Χ2(6) = 24.70, P = 0.0004) (Figure 2.3),
when sites were controlled (Χ2(6) = 28.0, P = <0.0001) as well as when every core was observed
separately (Χ2(6) = 26.57, P = 0.0002). The highest resting spore concentration (4.2 x 10⁶ resting
spores g-1 soil) was found in the top 8 cm of soil of the third replicate core of site 1 (Table A2.3).
46
Figure 2.3. Median (box and stem) and mean (◇) resting spore concentrations of P. brassicae
from various depths in the soil profile at Flamborough, ON (Χ2(6) = 24.70, P = 0.0004) with
outliers as ‘○’.
The concentration of resting spores in the soil at the Holland Marsh, ON was highly
variable among depths and cores (Figure 2.2, Table A2.4). The highest concentration (4.8 x 10⁶
resting spores g-1 soil) was observed at a depth of 16–22.9 cm (Table A2.4). There was at least
one sample from every core and from every depth where no P. brassicae DNA was detected.
There were significant differences between the two sampling sites (Χ2(1) = 8.23, P = 0.004), but
no differences among depths (Χ2(6) = 6.67, P = 0.35) or cores (Χ2(2) = 1.37, P = 0.50). There
were no patterns of decreasing resting spores with depth at the Holland Marsh field. Inhibition
levels were well above the recommended threshold (ΔCq <3.3) when 0.25 g of soil was used for
the DNA extraction. To reduce this level of inhibition, smaller soil samples (0.15 g) were
assessed and end values were adjusted accordingly. From the four field sites sampled, the soil at
47
the Holland Marsh had the highest adjustment for inhibition, resulting in an average change of
462% from initial to final values (Table A2.6).
The sandy soil at Millgrove, ON had resting spore concentrations similar to those at
Flamborough, ON in the upper layers of soil (0–30 cm), but large amounts of resting spores were
also found in one core between 30–37.9 cm and 46–53 cm (Figure 2.2, Table A2.5). The highest
concentrations of P. brassicae DNA were detected in two samples from the lowest depth of one
sampling core (2.6 x 10⁷ resting spores g-1 soil, Table A2.5). Differences were found in spore
concentrations among sampling sites (Χ2(1) = 18.83, P <0.0001), but no differences were found
between cores (Χ2(2) = 0.46, P = 0.79) or depths (Χ2(6) = 5.41, P = 0.49). Cores from the
Millgrove, ON field showed a pattern of higher resting spores close to the soil surface and
decreasing concentrations lower in the soil profile, with the exception of the first core from the
second sample site (Table A2.5).
No differences among sites, cores or depths were observed when data were pooled across
the four fields using a Friedman’s test. A field × site interaction (Χ2(1) = 5.82, P = 0.02) and a
field × depth interaction (Χ2(6) = 20.19, P = 0.003) showed differences among all sampling sites
and depths. In addition, there was a field × site × depth interaction (Χ2(6) = 22.77, P = 0.0009)
and a field × site × core × depth interaction (Χ2(6) = 22.71, P = 0.0001) (Table A2.1).
2.3.2 Comparison of manual counts to qPCR estimates
Manual extractions using the method of Dhingra and Sinclair (1985) were compared to
estimates from qPCR to evaluate the efficiency of both approaches for estimating resting spore
concentration in soil. Naturally infested soil samples from Flamborough, ON were collected
48
separately but from the same location as the vertical distribution trial, were used to estimate
resting spore concentrations. A single soil sample from Elora, ON was used as a negative control.
As a positive control, 3g of severely infected Shanghai pak choy root with pathotype 6 was
macerated and added to a naturally infested Flamborough sample. Estimates of spore
concentration obtained using qPCR were consistently higher than from manual extraction for
almost all samples (Table 2.4). Estimates from samples 1–12 of manual counts were not
correlated with those from qPCR based on a rank correlation (r = 0.18, p = 0.33). A high resting
spore concentration in qPCR was often associated in a high deviation from the quantity found
using manual extraction (Table 2.4).
Table 2.4. Comparison of resting spore concentrations (x 1000) per g of dry soil in 12 samples
using manual counts and multiplex qPCR1
Sample Location
Elora, ON
Flamborough, ON
Manual counts
± Std Dev.
0 ±0
qPCR
± Std Dev.
0 ±0
% Difference
100*[qPCR - MC) / qPCR
--
54 ± 3.8
770 ± 230
93%
61 ± 8.9
520 ± 110
88%
70 ± 8.1
2200 ± 1000
97%
71 ± 22
440 ± 300
84%
72 ± 7.2
2100 ± 750
97%
85 ± 9.9
74 ± 42
-0.15%
86 ± 25
87 ± 71
1%
95 ± 14
1200 ± 580
92%
100 ±12
150 ± 140
33%
160 ± 17
250 ± 71
36%
3500 ± 95
7800000 ± -100%
1Each sample was based on three technical replicates of one biological replicate. Negative
control consisted of a single soil sample from Elora, ON and positive control (bottom sample)
consisted of inoculating a naturally infested soil sample from Flamborough, ON. For the qPCR
run, R2 = 0.97, Eff% = 97.0, Slope = -3.20. Std. Dev. = standard deviation
49
2.4 Discussion
Rapid and accurate quantification of resting spores of P. brassicae from field samples
would be of value to brassica growers, agronomists, regulators and researchers. Resting spores
were found over 30 cm below the soil surface and below the depths where secondary infection
generally occurs. In this study, 69–82% of resting spores were found in the top 0–30 cm of soil,
but this was different from the 99.9% concentrations found by Kim et al. (2000). In this previous
study, the vertical distribution of resting spores was taken from two cores from a single, heavily
infested field. No resting spores were found in the lowest soil layer, a depth of 45 cm (Kim et al.,
2000). It is possible that resting spores were present below 45 cm in that study, however, perhaps
not in concentrations above the detection threshold of the extraction method utilized.
In the current study, estimates of spore concentration within each core and among cores
at each sampling site and field were highly variable. With only six cores taken from each field
known to have clubroot, it was not surprising to find that most samples had some levels of
P. brassicae DNA detected and only one core was completely free of P. brassicae DNA. Similar
variability was reported in previous studies that assessed the quantity of resting spore DNA in
soil (Wallenhammar et al., 2012). Additional replicates and larger, homogenized samples are
needed to reduce variability in future studies.
The high variability in this study was similar to that in previous studies assessing the
quantity of resting spore DNA in soil (Wallenhammar et al., 2012). Clubroot was first identified
at the Bassano, AB site in 2007, and identified as a mixture of pathotype 3 and 5 (D. Burke,
personal communication). Unlike the Flamborough, Millgrove and the Holland Marsh sites,
where susceptible brassica crops were grown almost every year with no rotation, the field near
50
Bassano has been planted primarily with wheat since 1999. Canola cultivars susceptible to
P. brassicae were planted in 1998, 2004, and 2007, and a clubroot-resistant cultivar, 45H29, was
seeded in 2010. Ninety percent of the resting spore DNA was found from the soil surface to a
depth of 30 cm (Table A2.2) and there were no trends in distribution over depth.
At Flamborough, ON, broccoli and cauliflower had been grown on a 2- to 3-year rotation
for over 15 years, with rye planted as an occasional cover crop (D. Almas, personal
communication). This short rotation likely contributed to a rapid accumulation of P. brassicae
resting spores. The sites in the field that were sampled were high points, selected to minimize the
possibility of overland flow or flooding affecting the natural distribution of resting spores. Levels
of resting spores were high near the soil surface but decreased with depth. While canola roots can
grow over 1 m from the soil surface, resting spores are produced by roots that have cortical
infection, which are generally observed near the soil surface (Gan et al., 2009). Across all of the
cores taken from the Flamborough field, the majority (82%) of the resting spores were found
within the top 23 cm of the soil profile. The other 18% of resting spores found between 23–53
cm below the soil surface were likely not produced in this region of the soil profile and were
moved there by other means. Previous literature on the vertical distribution of resting spores has
indicated that resting spores move downward over time due to water movement (Kim et al.,
2000). If water is the primary cause of the downward movement of resting spores, the uniform
soil consistency throughout the Flamborough soil profile may have facilitated the development
of significant differences with depths (Figure 2.3). Other possibilities include vertical tunnels
created by disintegrating brassica roots throughout the soil which may facilitate downward
51
movement of resting spores. It is also possible that machinery disturbing the soil profile may
allow resting spores to settle deeper than where they were originally produced.
At the Holland Marsh, cores were taken at one site where clubroot-susceptible brassica
crops have been grown repetitively over the last decade and an adjacent area where fewer
clubroot susceptible crops have been grown and where lower amounts of infection have been
recorded in recent trials (McDonald and Westerveld, 2008; Adhikari, 2010; Kasinathan, 2012;
Gludovacz, 2013). There were no significant trends among cores or depth, but there were
differences between the two sampling sites. Rototilling is the preferred method of preparing soil
before planting at the Holland Marsh Muck Crops Research Station every spring, compared to
discing, ploughing or no-till practiced at the other fields sampled. Rototilling uses motorized
spinning blades to mix the soil. Therefore, no significant differences between cores or depths
were expected since the soil was rototilled. However, there were samples in each soil core that
tested negative for P. brassicae, indicating that there are pockets with very few resting spores.
There was a high amount of inhibition present in several samples, so these samples were
reassessed after further dilution. The CIPC allowed for the quantity of resting spores to be
recalculated based on the amount of PCR inhibition caused by other soil components such as
clay particles, humic acids and phenolic compounds (Deora et al., 2015). Even with adjustment
for the impact of inhibition on the amplification of the target DNA using the CIPC, high levels of
inhibition may reduce the accuracy of results and as a consequence, make it difficult to identify
significant trends among depths.
The Millgrove, ON, field had a 2-year cauliflower, 1-year lettuce rotation for the last 10
years (J. Schotsman, personal communication). Similar to the field at the Holland Marsh, there
52
were differences between sample sites, but no differences between replications or depth. The
highest spore concentration detected in this study was at 46–53 cm below the soil surface at the
Millgrove field with 2.6 x 10⁷ resting spores g-1 soil. A layer of clay or silt was found
approximately 30 cm below the soil surface at the Millgrove field, possibly causing the
accumulation of resting spores. It is possible that secondary infection occurred on deep roots
over 46 cm below the soil surface, however it is more likely that resting spores were produced
closer to the soil surface and washed down to this layer over time.
The high concentration of sand (79%) at the Millgrove location possibly resulted in larger
macropores within the soil (Jiang et al., 2010) and easier flow of resting spores downward
throughout the soil profile. If retention of resting spores is higher in soils with smaller
macropores such as in clay soils, the pockets of high resting spore concentration might reflect the
location of these aggregates in the soil (Jiang et al., 2010).
The vertical pattern of spore distribution differed among the fields assessed. This was
likely due to differences in soil composition, as well as the susceptibility and root structure of
past brassica crops. Variability has been seen in previous studies among samples obtained from
nearby sites in the same field (Wallenhammar et al., 2012). In the current study, the Flamborough
field had the lowest variation, with no differences among the three cores taken from two sites
approximately 10 m apart (Table A2.3). In contrast, the two sample sites at Bassano were much
farther apart, and one site had fewer resting spores than the other (Table A2.2).
Past studies investigating vertical distribution of other soil-borne microorganisms have
shown that population density can greatly depend on soil structure (Workneh et al., 1998), and
smaller microorganisms, such as P. fluorescens, have lower retention in undisturbed soils where
53
macropores, cracks and root channels exist (Natsch et al., 1994). Unlike air, where many types of
dry spores are readily dispersed by wind, resting spores within the soil column likely remain in
the spot where they were released unless the soil is moved or water transfers the resting spores
through pores. The physical barriers found in soil are likely why there is so much variation in
concentrations at different depths, even within a 1 m2 sampling site. Plasmodiophora brassicae
resting spores are similar in size to Pseudomonas fluorescens cells (2–7 µm in length) and are
likely to exhibit similar characteristics when water is moving throughout the soil. Pseudomonas
fluorescens population density declined until a depth of 30 cm from the point of inoculation on
the soil surface (Natsch et al., 1994). Given the assumption that most P. brassicae resting spores
are produced within 20 cm from the soil surface, P. brassicae resting spores showed similar
trends to P. fluorescens in fields composed of mineral soil. While the movement of both P.
fluorescens and P. brassicae throughout the soil profile was not uniform and likely depended on
the structure of the soil, both pathogens had a pattern of decreasing resting spores with depth.
The fields at Bassano, Flamborough and Millgrove all showed a pattern of fewer resting
spores with increasing depth in most cores, but there were a few exceptions (Table A2.2, A2.3 &
A2.5). These three fields had the majority of resting spores within the top 30 cm with the
exception of core 1 of site 2 at Millgrove ON (Table A2.2, A2.3 & A2.5). This is the same trend
observed as the first vertical distribution study on P. brassicae by Kim et al. (2000). In that study,
99.9% of resting spores were found within the top 30 cm in Yeoncheon, South Korea compared
to only 75% (Bassano), 82% (Flamborough) and 75% (Millgrove with core 1, site 2 removed) of
the resting spores in fields in Canada. The results of this previous study indicate management
techniques should be focused on the top 10 cm, or 30 cm if eradication is desired (Kim et al.,
54
2000). The results from these four fields in Canada indicate that there were still large
concentrations of spores capable of causing severe disease at depths of 50 cm if these resting
spores are viable and roots are able to grow to these depths.
Resting spores residing deep in the soil should not be a great concern for brassica
growers. These resting spores are less likely to come into contact with feeder roots until late in
the season, allowing less time for clubroot to successfully develop and decrease yields (Hwang,
et al., 2012a). Also, soil temperatures at a 50 cm depth in the prairies would likely be less
conducive for clubroot development, further limiting the possibility of infection occurring at
these depths. While resting spores deep in the soil profile are unlikely to infect brassica roots to
begin with, they are even more unlikely to be responsible for contributing to spore production for
future brassica crops. Frost heaving, sub-soil tillage, a rising water table, soil saturation and road
and pipeline construction are possible ways that spores deep in the soil could get back to the
main root zone and initiate disease. Governments constructing roads and petroleum companies
constructing pipelines should be concerned about spreading resting spores on machinery from
contaminated fields to fields free of clubroot. The strategy of removing the top layers of soil
from a worksite to avoid having clean machinery as it leaves a contaminated field will likely not
be effective at limiting resting spore movement and so should not be used because it will spread
P. brassicae to fields free of clubroot.
There are a number of modifications that could be made to the methods of the current
study to improve the accuracy and consistency of the results. Sampling could be improved by
increasing the number of cores per m2. Approximately 3 g of soil were collected from each level
of the soil core, ground to a powder, and mixed thoroughly. Extracting larger cores or larger
55
samples per layer and then homogenizing the larger samples prior to DNA extraction may serve
to smooth out some of the spikes in DNA concentrations. If soil aggregates were not ground to a
fine powder, it is possible that a large proportion of the DNA would be lost in the extraction
process.
Another area to improve the method would be to remove or denature the DNA of dead
cells prior to amplification. Non-viable resting spores may be present within the soil sample, and
PCR cannot distinguish DNA of dead vs viable spores (Faggian and Strelkov, 2009). As a result,
qPCR may over-estimate the inoculum potential in the soil. This may have an important effect on
spore concentration estimates for some management studies (e.g. sanitation and fumigation), but
may also affect estimates of vertical spore distribution. It is possible that older resting spores
found deeper within the soil profile are no longer viable and as a result can no longer infect host
plants and reduce yield. Quantification of non-viable resting spores in a sample could be an area
of future research.
Estimates of resting spore concentration based on direct counts conducted using manual
extractions methods (Dhingra and Sinclair, 1985) were time consuming and did not correspond
to the results from the qPCR. The process took a minimum of three days and was labour
intensive. Large differences between estimates from different counts and qPCR were found
between estimates that contained high resting spore concentration. It is possible that the
extraction step involving a 40% sucrose concentration to maintain the resting spores in the
supernatant becomes less efficient as spores per ml increase. As the concentration of spores in
the suspension increases, spores are increasingly likely to clump together and settle with the
mineral matter to the bottom of the beaker, which is later discarded. Also, direct counts from the
56
haemocytometer can be variable if the measured suspension is not mixed well or clumping of
resting spores occurs. These errors can be avoided by using the qPCR method discussed in this
chapter (Deora et al., 2015) to provide accurate results for detection and quantification.
While many studies have focused on detecting if a field is contaminated with P. brassicae
(Cao et al., 2007), the aim of this study was to determine the proportion of resting spores in
fields known to be infested with P. brassicae. This is the first study to look at resting spores to a
depth of 50 cm and to quantify their densities using qPCR in several different soil types. The
results of this study have implications for growers, contractors constructing roads, private
companies constructing pipelines as well as for researchers. Researchers and producers applying
fumigants or biocontrols to reduce spore loads often need to apply the active ingredients to a
depth below where the bulk of host brassica crop roots are active growing where secondary
infection could develop before frost. Ultimately, this will increase the efficiency of management
strategies, which will help brassica growers make practical decisions to increase yield, profit and
sustainability. The observation that the resting spores of P. brassicae are often present deep in the
soil profile may help to explain why the pathogen is so difficult to eradicate. The removal of
topsoil will not remove the risk of heavy machinery (e.g. for road / pipeline construction or oil /
gas exploration) coming into contact with spores. If contaminated machinery is not cleaned after
leaving a clubroot-infested field before entering a clubroot-free field, resting spores may be
spread to the non-infested field.
57
CHAPTER THREE - INFLUENCE OF TEMPERATURE AND SOIL MOISTURE ON
CLUBROOT INCIDENCE AND SEVERITY
3.1 Introduction
Clubroot is among the most destructive pathogen of brassicas worldwide. Management of
this soil-borne pathogen is difficult and the resting spores are long-lived once a field is infested
(Wallenhammar, 1996; Dixon, 2014). The potential geographic range of clubroot is still unknown
and clubroot prediction models based on environmental factors would provide insights into the
relative importance and impact of these factors on clubroot development (Turkington et al.,
2004; Gossen et al., 2014). Clubroot prediction models can also be used to improve disease
management strategies via modification of irrigation practices, seeding before a soil temperature
is conducive for clubroot development, or providing a warning when the weather is conducive
for clubroot development. Vegetable growers would then have the option of harvesting early to
avoid potential yield loss.
Knowledge of the relative importance of environmental factors can be used to identify
locations where temperature and soil moisture conditions are outside the range for clubroot
development and could help explain differences in the rate of clubroot spread in some areas. In
the longer term, climate change may result in some areas becoming more suitable for pathogen
development and increase the risk of clubroot establishment and development (Gossen et al.,
2014). Climate models such as CLIMEX V2.0 software (Hearne Scientific Software Pty. Lit,
Melborne, Australia) were used to predict the spread of clubroot in clubroot-free areas of the
Canadian prairies (Turkington et al., 2004), but P. brassicae has already spread beyond the areas
of high risk predicted by these models (Gossen et al., 2014).
58
Temperature and soil moisture are environmental factors that have an important
influence on the germination of resting spores of P. brassicae, primary and secondary infection
of the host and symptom development (Gossen et al., 2012b). An early study reported that
resting spores required 14 °C for germination (Chupp, 1917), while later studies estimated the
minimum temperature for clubroot development to be at least 18 °C (Colhoun, 1953).
Temperatures between 27–30 °C were optimal for the germination of resting spores and infection
of cabbage roots in a greenhouse setting (Chupp, 1917). Clubroot development in both Shanghai
pak choy and canola was optimal between 20–26 °C, based on a quadratic response over the
range of 12.5–30 °C (Sharma et al., 2011a). The highest incidence of root hair infection in canola
(Gossen et al., 2013), cortical infection in Shanghai pak choy seedlings (Sharma et al., 2011a)
and the number of mature and dehisced zoosporangia in cabbage roots (Gludovacz, 2013)
occurred at 25 °C. In a recent study conducted at 25 °C, primary root hair infection took place as
little as 1 day after a drench-applied inoculation and secondary zoospores were released
approximately 3–5 days after primary infection had occurred (McDonald et al., 2014). Therefore,
secondary infection can occur in as little as 4 days after inoculation (McDonald et al., 2014). At
25 °C, secondary symptom development was visible at as early as 10 days after inoculation
(Sharma et al., 2011a).
Environmental conditions outside of the optimal range for germination and infection
reduce the incidence and severity of clubroot. Temperatures above 35 °C limit cortical infection
and symptom development (Wellman, 1930), but are also unfavourable for crop development. It
was nearly impossible to obtain infection between 10–18 °C (Chupp, 1917). At 14 °C, variable
levels of clubroot severity were observed in cabbage, Chinese cabbage, mustard and radish
59
(Thuma et al., 1983). Similarly, little or no clubroot developed on Shanghai pak choy at
temperatures at or below 17 °C (Sharma et al., 2012; Gossen et al., 2012b). In a controlled
environment study using a temperature gradient plate, constant temperatures resulted in similar
pathogen development than daily temperature fluctuations of 10 °C within the optimal range of
20–30 °C (Gludovacz, 2013). However, root hair infection occurred at temperatures as low as
12.5 °C.
Seeding early or late in the season, when soil temperatures are low, can provide effective
management of clubroot in short-season crops (McDonald et al., 2004; Gossen et al., 2012a). In
canola, earlier seeding dates generally produce higher yields even without a P. brassicae
interaction (Christensen et al., 1985), but clubroot development is reduced and yield is slightly
increased in canola that is seeded in clubroot-infested soil early in the season (Hwang et al.,
2012).
Degree-day calculations are often used to summarize heat units to predict timing of a
biological process, especially when these processes start above, or stop below a certain
temperature (McMaster and Wilhelm, 1997). The effect of temperature on disease incidence or
severity might be reflected more accurately with degree days than mean daily temperatures, since
a degree day calculation involves a minimum base temperature. For example, a degree-day
calculation might better represent the lack of disease development below the low temperature
threshold of 14 °C, as compared to a daily average temperature. Accumulated degree days with a
threshold of 12.2 °C based on soil temperatures was one of the most important variables for
predicting clubroot severity on radish (Raphananus sativus L.) in muck soils (r = 0.73) (Thuma
et al., 1983). A basic degree day equation is structured as follows:
60
°D = [(TMax + TMin)/2] - TBase
Where TMax and TMin are the daily maximum and minimum temperatures, respectively, and TBase
is the base or minimum temperature (McMaster and Wilhelm, 1997), which, in this case are
thought to be the threshold for disease development (Gludovacz, 2013).
Soil moisture is also important in the disease cycle of P. brassicae. Zoospores are
equipped with twin flagellae, which they use to swim toward root hairs in the water film around
soil particles (Dixon, 2014). Wet soils, where the moisture film between soil particles is
continuous, are much more favourable for movement than drier soils (Dixon, 2014). Zoospores
are attracted to root hairs by a nutrient gradient of root exudates found in moisture films
(MacFarlane, 1970; Friburg et al., 2005). Root hairs may also aid zoospore movement as they
absorb moisture from the rhizosphere and potentially pull zoospores towards them, but this has
not been tested in any host-pathogen system.
The minimum soil moisture level necessary for P. brassicae infection is not well
understood. It is difficult to compare the various studies measuring the effect of soil moisture
content on clubroot since studies use a variety of methods to describe soil moisture content,
including gravimetric, volumetric and water holding capacity. Gravimetric soil moisture
measurements are based on the ratio of the mass of water in the soil to the mass of the dry soil,
and volumetric soil moisture is a ratio of the volume of water present in the soil divided by the
total volume of water and dry soil.
In an early study, clubroot incidence (CI) increased when soil moisture levels were
between 40–70% gravimetric soil moisture, with 70% being most favourable for clubroot
development (Colhoun, 1953). Subsequent studies have shown that a high gravimetric soil
61
moisture content of 80% favoured clubroot development, with substantial reductions in clubroot
levels at soil moisture contents of 40 and 60% (Narisawa et al., 2005).
In another study, clubroot development in mineral soil required gravimetric soil moisture
levels of 9%, while in organic soils moisture levels of at least 60% were needed (Hamilton and
Crête, 1978). Soil bulk density and clubroot infection are strongly correlated (r = 0.99)
(Kasinathan, 2012). In mineral soil, a clubroot disease severity index (DSI) of 27 was observed
in samples packed to a bulk density of 0.35 g/cm3,while samples with a higher density of 0.68g/
cm3 (muck soil) had a clubroot severity of 90 DSI (Kasinathan, 2012). There is wide variation in
the literature among the soil moisture values that have been found to limit disease development
and these differences are likely due to differences in soil texture, bulk density and pH.
In radish (Raphanus sativus L.), temperature and rainfall were monitored and plants were
harvested at 4 and 6 weeks after seeding and rated for clubroot severity (Thuma et al., 1983).
Multiple regression analyses explained 59–73% of the variability in clubroot severity for plants
harvested at 4 weeks and equations for plants harvested at 5 and 6 weeks were very similar
(Thuma et al., 1983). Clubroot severity increased as a linear function of soil temperature or
moisture individually (Thuma et al., 1983). Similarly, in another study on muck soils, mean air
temperatures during crop development (range: 15–22 °C) for the season were positively
correlated with clubroot incidence and severity for both Shanghai pak choy (r = 0.68), and
Chinese flowering cabbage (B. rapa L. var. chinensis var. utilis (Tsen and Lee)) (r = 0.73)
(McDonald and Westerveld, 2008). In the same study, clubroot incidence and severity on
Shanghai pak choy (r = 0.82) and Chinese flowering cabbage (r = 0.84) were greatly influenced
by air temperature during the last 10 days before harvest. In a more recent study, clubroot
62
severity was strongly correlated with season-long rainfall (range 68–173 mm) in both Shanghai
pak choy (r = 0.74) and Chinese flowering cabbage (r = 0.83) (Gossen et al., 2012a). In canola,
clubroot incidence and severity were correlated with accumulation of air degree days (r = 0.81 –
0.83) and soil degree days (r = 0.31 – 0.35) (Gludovacz, 2013).
The objective of this research was to examine the relationship between weather
conditions and clubroot development on canola and brassica vegetables under field conditions. It
would then be possible to develop a linear regression model that describes clubroot development
using temperature and rainfall data that can be easily obtained by a grower. The effect of
temperature on infection and subsequent development of P. brassicae has been studied in detail
under controlled conditions (Gossen et al., 2013), but the impact of soil moisture is less well
understood. It is hypothesized that soil moisture and temperature will account for a large portion
of the variability on clubroot incidence and severity.
3.2 Materials and Methods
3.2.1 Seeding
All trials were conducted in organic soil (pH ~ 6.7, organic matter ~ 81%) naturally
infested with P. brassicae pathotype 6 at the Muck Crops Research Station, Holland Marsh,
Ontario in 2013 and 2014. Canola cv. ‘Invigor 5030 LL’ (Bayer CropScience, ON, Canada),
which is moderately susceptible to pathotype 6 (Deora et al., 2012), was used. The canola seed
was treated with carbathiin (50 g/L), clothianidin (285.7 g/L), metalaxyl (5.36 g/L) and
trifloxystrobin (7.14 g/L) at a rate of 1.4 L per 100 kg of seed to control flea beetles up to the 4leaf stage as well as damping off, early season root rot and blackleg (Bayer CropScience,
63
Calgary, AB, Canada). Seeding dates were spaced at approximately 2-week intervals each year: 3
May, 15 May, 30 May, 12 June, 26 June, 9 July, 24 July and 7 August in 2013; and 8 May, 22
May, 4 June, 18 June, 3 July, 16 July, 30 July and 15 August in 2014. In 2014, Chinese flowering
cabbage was also seeded at the same intervals as the canola. An Earthway® push seeder fitted
with an Earthway® 1002-9 mustard disc was used to seed approximately 18 seeds per m of row.
Each trial was designed as a randomized complete block design with four replications.
Plots were 5 m long. There were seven rows per plot for canola and four rows per plot for
Chinese flowering cabbage. Weeds were managed according to recommended commercial
practices (OMAFRA, 2014), and flea beetles and Swede midge were managed using label rates
of Actara® 240SC and Movento® 240 SC. In 2013, Swede midge caused damage in the 26 June,
9 July and 24 July seeding dates, causing many plants to die prematurely. Despite this, there
were still enough plants to sample at the 4- and 6-week harvest dates. In 2014, a soil formulation
instead of a foliar formulation of Actara® was applied in early June (as a result of mislabeling by
a supplier), causing severe wilt on the Chinese flowering cabbage. As a result, the Chinese
flowering cabbage seeded on 18 June and 3 July were removed from the trial.
3.2.2 Assessment
In each replication, 50 canola plants were uprooted and assessed at approximately 14-day
intervals starting 4 weeks after seeding. Fifty Chinese flowering cabbage plants were assessed at
4 and 6 weeks after seeding, and two 1-m-long rows were harvested at 6 weeks to assess total
yield. Sampling of canola plants continued until all plants within a treatment reached a disease
severity of 100, plants senesced, or frost terminated plant growth. All roots were assessed for
64
clubroot incidence (%) and severity using a 0–3 rating scale where 0 = no clubbing, 1 < 1/3 of
root clubbing, 2 = 1/3 to 2/3 of root clubbing, and 3 > 2/3 of root clubbing. A standard disease
severity index (DSI) was calculated with the following equation (Crête et al., 1963; Strelkov et
al., 2006):
∑[(class no.)(no. of plants in each class)]
DSI = (total no. plants per sample)(no. classes –1) x 100
The area under the disease progress curve (AUDPC) was calculated to combine multiple
observations of disease progress into a single value so that intensity can be compared across
years. An improved alternative to AUDPC was also calculated, as the area under the disease
progress stairs (AUDPS) (Simko and Piepho, 2012), which provided a weighted estimate closer
to the optimal to the first and last observations (Simko and Piepho, 2012). In this study, clubroot
incidence and severity were measured at 4 and 6 weeks after seeding from multiple seeding dates
throughout the growing season. Since only two observations over time were obtained, the use of
AUDPC or AUDPS is limited since the observation points are also the first and the last
observations.
3.2.3 Weather data
!
Ambient air temperature was measured using a CR21X weather station (Campbell
Scientific, Edmonton, AB, Canada) with a HMP35C probe positioned in the shade at 1.2 m
above ground level in the field plots. Hourly mean air temperatures were recorded. Daily mean
temperatures were calculated as maximum plus minimum temperature each day divided by two.
A TE35C tipping bucket rain gauge placed less than 100 m from the trial was used to measure
65
rainfall, reported hourly. Cumulative rainfall over a given time period was calculated based on
adding daily totals.
In 2014, soil volumetric water content in the trial was measured using a EC-5 Soil
Moisture Smart Sensor (Onset Computer Corporation, Bourne, MA, USA). The EC-5 Soil
Moisture Smart Sensor uses a 70 MHz frequency to measure the dielectric constant of soil,
which is primarily a function of soil water content (Decagon Devices, 2014). The result is
volumetric soil moisture (volume of water per cubic m by the volume of soil, water and air space
per cubic m (m3 m-3)). A value of 0.3 m3 m-3 or higher represents wet to saturated soil.
The degree day equation for air temperatures was:
°D = [(TMax + TMin)/2] – TBase
Where TMax and TMin are the daily maximum and minimum temperatures, respectively, and TBase
is the base temperature (McMaster and Wilhelm, 1997). A base temperature, TBase, of 14 °C was
used, as a compromise between 12 °C where there was no clubroot development (Monteith,
1924) and 15 °C (Sharma et al., 2012) where clubroot development is possible (Gludovacz,
2013). The daily degree day values were added over each time period of interest, for instance 14
and 21 days after seeding. Cumulative degree days were used in all correlations.
3.2.4 Statistical analysis
Analysis of variance was performed on clubroot incidence and severity (DSI) as well as
AUDPC and AUDPS incidence and severity ratings using PROC MIXED (SAS software version
9.3, SAS Institute, Cary, NC). The data were tested for outliers using the Shapiro-Wilk test of
66
residuals and for normality using Lund's test. All of the data sets were normal and no outliers
were identified. Means were separated using Tukey’s multiple mean comparison (Tukey, 1949).
Correlations among clubroot incidence, clubroot severity, AUDPC and AUDPS clubroot
incidence and severity ratings, and weather parameters based on different time intervals were
conducted using PROC CORR. These parameters included mean daily air temperature,
cumulative degree days, cumulative daily rainfall, and mean daily volumetric soil moisture
(when available). Parameters were calculated at selected time points (0- and 1-week delays, 5–
10, 5–15, 7–14, 10–15, and 14–21 days after seeding or before harvest) to account for a potential
lag in biological response to changing abiotic variables at different time points throughout the
disease cycle. Linear correlations with these parameters were calculated with final disease levels
at 6 weeks after seeding with seeding dates from 2013 and 2014 (n = 16). Similar seeding date
trials using Chinese flowering cabbage from 1999–2002 (n = 15) (McDonald and Westerveld,
2008), 2008–2009 (n = 10) (Adhikari, 2010) and from canola trials from 2011 and 2012 (n = 9)
(Gludovacz, 2013) were included in the analysis.
Stepwise regression was conducted using PROC REG for final clubroot incidence and
severity using the same environmental parameters (mean daily air temperature, rainfall,
volumetric soil moisture and cumulative degree days) and selected time points as in the
correlations. To validate the model, data of canola and Chinese flowering cabbage were pooled
and randomly partitioned into two subsets using the random function in Microsoft® Excel 2008.
One subset containing 35 seeding date treatments was used to produce the stepwise regression
models, while the other subset containing 15 seeding dates was used to validate the model.
67
Stepwise regression significance levels were set at P = 0.15 to enter the model and P = 0.10 to
stay.
3.3 Results
3.3.1 Weather
The mean monthly air temperature for the growing season (May – October) was 1 °C
higher than the 10-year average in 2013 and 0.4 °C higher in 2014 (Table 3.1). The highest
monthly mean was 21.3 °C in July 2013. The Holland Marsh experienced above average rainfall
in both years. During the 2013 growing season, rainfall was above average in every month
except September, which resulted in over 100 mm more precipitation than normal over the
duration of the trial. The cumulative monthly rainfall in 2014 was above average for June and
September, below average for May and August and approximately the same as the 10-year
average for July (Table 3.1), resulting in 60 mm more precipitation than the 10-year long-term
average.
There were no more than 10 days between rainfall events during the growing season in
both 2013 and 2014 (Figures 3.2 and 3.3). Mean daily air temperatures were higher than the 14
°C threshold from 8 June to 4 September in 2013 and from 6 June to 11 September in 2014,
except for two days (14 June and 14 August), where the mean temperature was 13 °C. In 2013,
119 days (3 May – 31 October, n = 183) had a mean temperature over 14 °C and in 2014, 114
days (8 May – 24 September, n = 140) had a mean temperature over 14 °C.
68
Table 3.1. Mean monthly air temperature and rainfall during the canola seeding date trials at the
Holland Marsh, ON, 2013 and 2014.
Temperature (°C)
Rainfall (mm)
Month and Year
2013
May
June
July
August
September
October
Average temperature and total rainfall
2014
May
June
July
August
September
Average temperature and total rainfall
1 Long-term
LTA1
Actual
LTA1
Actual
12.9
17.8
20.4
19.2
15.0
8.7
15.7
14.7
18.5
21.3
19.6
15.3
10.5
16.7
74
76
86
80
83
69
468
112
94
104
87
83
92
572
12.9
17.8
20.4
19.2
15.0
17.1
13.6
19.4
19.3
19.1
15.6
17.4
74
76
86
80
83
399
54
114
87
62
147
464
average (10-year mean) (Muck Vegetable Cultivar and Research Report, 2013).
69
Figure 3.1. Mean daily air temperature and daily precipitation at the Muck Crops Research Station, Holland Marsh, ON, 2013.
70
Figure 3.2. Mean daily air temperature, soil moisture and daily precipitation at the Muck Crops Research Station, Holland
Marsh, ON, 2014.
71
3.3.2 Clubroot incidence and severity
In 2013, clubroot levels increased over time and two seeding dates, 15 May and 12 June,
reached 100% incidence at 24 weeks and 18 weeks after seeding, respectively (Figure 3.3,
A3.11). Disease severity (DSI) followed a similar pattern. A rating of 95 DSI or higher was
reached by the last harvest on canola seeded on the first four dates, 3 May, 15 May, 30 May, and
12 June (Figure A4.4). There was a decline in clubroot incidence and severity in the 26 June
seeding. This was likely due to stunted growth of the plants during peak Swede midge damage
around July 24.
Environmental conditions in 2014 were conducive for clubroot development, and five
seeding date treatments reached 100% incidence and severity: 22 May, 4 June, 18 June, 3 July,
and 16 July while the remainder of seeding dates had a DSI of 90 or above (Table A3.9).
Maximum severity on canola developed within 6 weeks after seeding on 3 July, and 16 July
(Figure 3.4). Canola seeded on the first date, 8 May, gradually developed symptoms throughout
the season but did not reach 100% incidence before senescence, which occurred 18 weeks after
seeding (Figure 3.4, A3.12).
Chinese flowering cabbage was seeded and harvested at the same time as canola in 2014,
with the exception of the treatments seeded on 18 June and 3 July that were sprayed with the
incorrect insecticide formulation and removed from the trial (described in 3.2 Materials and
Methods). Plants that were seeded earlier in the season developed less clubroot than those
planted later (Table 3.2). Flowering cabbage was found to have a slightly lower incidence of
clubroot (range 5–95%, mean = 55%) than canola (‘InVigor 5030’) (range 5–100%, mean =
74%) at 6 weeks after seeding in 2014, as has been reported previously (Adhikari, 2010; Deora et
72
al., 2012). Clubroot severity showed a similar trend, with flowering cabbage having a DSI of 4–
90% (mean = 47%) and canola at 4–100% (mean = 66%). Clubroot incidence and severity on
flowering cabbage were slightly but consistently lower than canola, with the exception of the
treatment planted on 30 July. However, the trends were similar and clubroot incidence (r = 0.91)
and severity (r = 0.87) of the two crops were strongly correlated. In an initial analysis, a linear
adjustment factor created by obtaining an average difference between the two crops was used to
adjust the CI and DSI of flowering cabbage to be similar to canola (not shown). However,
correlations and regression parameters were not improved after this linear adjustment factor was
applied. As a result, previous data from seeding date trials with flowering cabbage from years
1999–2002 (McDonald and Westerveld, 2008) and 2008–2009 (Adhikari, 2010) were added
directly to the pool of canola data. Previous seeding dates using canola cv. ‘InVigor 5030 LL’
from 2011 and 2012 were combined with canola seeding dates from this current study
(Gludovacz, 2013). By adding data from flowering cabbage and the previous canola trial to the
data set for canola from 2013–2014, an additional 34 data points were added to the model.
73
Figure 3.3. Clubroot incidence on canola planted at approximately 2-wk intervals in naturally
infested muck soil at the Muck Crops Research Station, Holland Marsh, ON, 2013. There were
no significant differences within sampling week based on Tukey’s multiple mean comparison test
at P = 0.05.
Figure 3.4. Clubroot incidence on canola planted at approximately 2-wk intervals in naturally
infested muck soil at the Muck Crops Research Station, Holland Marsh, ON in 2014. Significant
differences within sampling week based on Tukey’s multiple mean comparison test at P = 0.05
are presented in Table A3.9.
74
Table 3.2. Clubroot incidence (%) at 4 and 6 weeks after seeding on flowering cabbage planted
at approximately 2-wk intervals in naturally infested muck soil at the Muck Crops Research
Station, Holland Marsh, ON, 2014.
Clubroot incidence by seeding dates
8 May 22 May 4 June 18 June
3 July 16 July
30 July 15 August
4 WAS1
6 WAS
1Weeks
0
5
0
47
1
.
.
.
2
59
76
95
48
48
0
76
after seeding
Table 3.3. Linear correlations (r) between clubroot incidence or severity 6 weeks after seeding
and temperature, air degree days and rainfall during the various time intervals for 47 seeding
dates of canola cv. ‘InVigor 5030 LL’ and Chinese flowering cabbage grown at the Holland
Marsh, ON in 1999–20141,3.
Variable and time interval Sample
size
Incidence
Severity
r
p
r
p
Temperature
First 14 days after seeding
First 21 days after seeding
7–14 days after seeding
7–21 days after seeding
14–21 days after seeding
Last 14 days before sampling
Last 21 days before sampling
5–10 days before sampling
10–15 days before sampling
5–15 days before sampling
50
50
50
50
50
50
50
50
50
50
0.26
0.29
0.28
0.32
0.21
0.05
0.10
0.09
-0.11
-0.00
NS
0.047
NS
0.03
NS
NS
NS
NS
NS
NS
0.19
0.21
0.20
0.23
0.15
-0.07
-0.02
0.00
-0.20
-0.10
NS
NS
NS
NS
NS
NS
NS
NS
NS
NS
Degree days2
Total
Total (7 day delay)
First 14 days after seeding
First 21 days after seeding
7–14 days after seeding
7–21 days after seeding
14–21 days after seeding
Last 14 days before sampling
Last 21 days before sampling
5–10 days before sampling
10–15 days before sampling
5–15 days before sampling
50
50
50
50
50
50
50
50
50
50
50
50
0.19
0.16
0.21
0.26
0.22
0.27
0.20
0.05
0.08
0.15
0.23
-0.02
NS
NS
NS
NS
NS
NS
NS
NS
NS
NS
NS
NS
0.06
0.03
0.13
0.16
0.13
0.17
0.13
-0.08
-0.06
0.04
0.21
-0.13
NS
NS
NS
NS
NS
NS
NS
NS
NS
NS
NS
NS
75
Variable and time interval Sample
size
Incidence
Severity
r
p
r
p
-0.08
0.03
-0.13
0.04
-0.21
-0.09
NS
-0.01
0.09
-0.05
0.07
-0.16
-0.09
NS
NS
NS
NS
NS
NS
Rainfall (mm)
Total
Total (7 day delay)
First 2 weeks after seeding
First 3 weeks after seeding
Last 2 weeks before sampling
Last 3 weeks before sampling
50
50
50
50
50
50
Soil moisture (volumetric %)
First 14 days after seeding
First 21 days after seeding
5–10 days after seeding
10–15 days after seeding
5–15 days after seeding
Last 14 days before sampling
Last 21 days before sampling
20
20
20
20
20
20
20
NS
NS
NS
NS
NS
0.01
-0.57
0.008
-0.56
0.02
-0.52
0.02
-0.53
0.005
0.009
-0.60
-0.57
0.01
0.02
-0.55
-0.52
NS
-0.46
0.04
-0.43
0.02
-0.36
NS
-0.51
0.04
-0.30
NS
-0.45
1 Plants were assessed for clubroot symptoms at 6 weeks after seeding. Mean daily ambient
temperature, cumulative degree days, cumulative daily rainfall, and mean daily volumetric soil
moisture were calculated for the specified time intervals.
2 Degree Days = [(T
max + Tmin) / 2] - Tbase where Tbase = 14 °C.
3Values in bold are significant at P < 0.05.
3.3.3 Model calibration
Stepwise regression was used to indicate the parameters that could be used for a clubroot
incidence or severity model. Environmental parameters that had a high positive autocorrelation
from the correlation analysis were removed before the stepwise regression was conducted
(Legendre, 1993).
Harvesting 6 weeks after seeding was chosen as the optimum time to assess clubroot
incidence and severity based on the results of earlier studies. In the current study, assessments of
canola continued until all plants within a treatment reached a severity of 100, plants senesced, or
frost terminated plant growth, allowing for different time-points to be used for correlations.
76
Using the disease assessments at 8 weeks after seeding resulted in weaker correlations (data not
shown). Therefore, 6 weeks after seeding was retained as the best time point for assessing the
effects of environment parameters on clubroot development.
Stepwise regression showed that clubroot incidence increased with increasing daily mean
air temperature 7–21 days after seeding and with season-long total rainfall with a 1-week delay.
Mean air temperature at 7–21 days after seeding (range = 13.8–23.3 °C) accounted for 22% of
the variation and season-long total rainfall with a 1-week delay (range = 17.8–211.9 mm)
accounted for 9% of the variation (Table 3.4, Figures 3.6, 3.7). Similarly, severity increased with
mean air temperature at 14–21 days after seeding (15%) and with season total rainfall with a 1week delay, which accounted for 11% of the variation in the model (Table 3.4, Figures 3.8–3.9).
Table 3.4. Stepwise regression of the effect of rainfall, air temperature degree days (°D), air
temperature and soil moisture over selected time intervals on clubroot incidence (CI) and
severity (DSI) over time on flowering cabbage and canola based on 35 seeding dates at the
Holland Marsh, ON.
Step
CI
Parameter
Partial R2
Model R2
F Value
Pr > F
1 Air temperature 7–21 days after seeding
0.22
0.22
9.14
0.005
2 Total precipitation with a 1-week delay
0.09
0.31
4.10
0.05
DSI 1 Air temperature 7–21 days after seeding
0.15
0.15
5.70
0.02
2 Total precipitation with a 1-week delay
0.11
0.26
4.75
0.05
CI = -91.77 + 5.69 × (Air temperature 7–21 days after seeding) + 0.18 × (Total precipitation with
a 1-week delay).
DSI = -70.50 + 4.11 × (Air temperature 7–21 days after seeding) + 0.17 × (Total precipitation
with a 1-week delay).
77
y = 4.4x - 45.7
R2 = 0.39 P = 0.005
Figure 3.5. Linear regression relationship between mean air temperature at 7–21 days after
seeding and validation set of clubroot incidence six weeks after seeding on canola and flowering
cabbage at the Holland Marsh, ON showing scatter plot of individual data points and best fit
linear regression. (n = 47).
Figure 3.6. Scatter plot of individual data points between season total rainfall with a 1-week
delay after seeding and validation set of clubroot incidence on canola and flowering cabbage six
weeks after seeding at the Holland Marsh, ON (n = 47).
78
Figure 3.7. Scatter plot of individual data points between mean air temperature 7–21 days after
seeding and validation set of clubroot severity on canola and flowering cabbage six weeks after
seeding at the Holland Marsh, ON (n = 47).
Figure 3.8. Scatter plot of individual data points between season total rainfall with a 1-week
delay after seeding and validation set of clubroot severity on canola and flowering cabbage six
weeks after seeding at the Holland Marsh, ON (n = 47).
79
3.3.4 Influence of soil moisture
There was a negative relationship between soil moisture and clubroot incidence for all of
the available data from canola grown in 2012 (Gludovacz, 2013, n = 6) and this trial (2014, n =
8) (Table 3.3). Mean soil moisture 5–10 days after seeding showed a negative correlation for
disease incidence (r = -0.60) and severity (r = -0.57) (Figures 3.9 and 3.11). The mean
volumetric soil moisture was 0.35 m3 m-3 (range = 0.27–0.48 m3 m-3) in 2012 and 0.22 m3 m-3
(range = 0.11–0.29 m3 m-3) in 2014.
Figure 3.9. Relation between soil moisture 5–10 days after seeding and clubroot incidence on
canola six weeks after seeding at the Holland Marsh, ON in 2012 and 2014 (n = 14).
80
Figure 3.10. Relation between soil moisture 5–10 days after seeding and clubroot disease
severity on canola six weeks after seeding at the Holland Marsh, ON in 2012 and 2014 (n = 14).
3.3.5 Model validation
Thirty of forty-seven (63.8%) of deviations between predicted and observed clubroot
incidence values were within the range of ± 20%. The highest absolute deviation was 70%.
When clubroot incidence was over 50%, the model predicted values to be higher than they
actually were (Figure 3.11). All deviations over +35% were treatments from 2014 where
environmental conditions proved to be very conducive for pathogen development. Treatments
from 1999–2013 had deviations between -34% and +34% (Figure A4.1).
Similar results were found for the prediction of clubroot severity. The highest absolute
deviation between observed and predicted values was 78 DSI and the majority of values fell
within the range of ± 20%. The highest deviations were found when 100% incidence or 100 DSI
81
was encountered (Figure 3.12). All deviations over +29% were treatments from 2014; treatments
from 1999–2013 had deviations between -29% and +29% (Figure A4.1).
Figure 3.11. Deviation of predicted clubroot incidence from observed clubroot incidence on
canola and flowering cabbage (n = 47) grown for 6 weeks at the Holland Marsh, ON.
Figure 3.12. Deviation of predicted clubroot severity from observed severity on canola and
flowering cabbage (n = 47) grown for 6 weeks at the Holland Marsh, ON.
82
3.4 Discussion
Soil moisture and temperature are most important factor influencing the development of
many plant diseases, including clubroot. This study, combined with data from past studies from
as early as 1999, found a trend of increasing clubroot incidence and severity with increasing air
temperature up to 3 weeks after seeding (r = 0.29–0.32). There was also a trend of decreasing
disease with increasing soil moisture (r = -0.52 to -0.60), which is consistent with previous
studies (Thuma et al., 1983). The increase in incidence with increasing mean temperature during
the first 21 days and 7–21 days after seeding is consistent with what is known about temperature
effects on the various stages of the disease cycle of P. brassicae on canola. Primary zoospores
infect root hairs of very young roots and secondary infection occurs ~5 days after primary
infection at temperatures of 20–25 °C and with sufficient moisture. If canola and flowering
cabbage seeds germinated 2 days after seeding and became infected, cortical infection and
development would begin about 7 days after seeding and show symptoms as early as 10 days
after inoculation (Sharma et al., 2011a). In a previous study, seedlings infected at an earlier stage
of development resulted in a higher disease severity compared to plants with infection delayed
by a week or more (Hwang et al., 2012). Increasing mean temperature 7–21 days after seeding is
a reasonable environmental parameter for this model since seedlings infected 1 week after
seeding should result in higher disease severity if conditions are favourable.
The temperature range known to allow for P. brassicae development (above 14 °C and
below 30 °C) under controlled conditions (Sharma et al., 2011a; Sharma et al., 2012; Gludovacz
et al., 2013) occurred throughout most of the growing season. Mean daily temperature fell below
this range only in the earliest seeding date and at the end of the growing season. The lack of a
83
clear and consistent correlation between temperature and clubroot symptoms in this study may
be associated with the relatively narrow range of temperature assessed in the two years of the
current trial. In 2013, the period from 8 June until 4 September and in 2014, 6 June until 10
August (with the exception of two days), were warm enough to be conducive for pathogen
development. Half of the 16 possible seeding dates fell entirely within this range of conducive
temperatures, while the other eight seeding date treatments had various portions of development
outside the conducive zone. Of the 8 seeding dates with daily averages outside the conducive
zone of disease development, there were 53 days in 2013 and 42 days in 2014 for the duration of
the seeding date to its 6-week assessment. Similar dates where the temperature remained over 14
°C were recorded in 2011 (3 June to 26 August) and 2012 (5 June to 8 September) which
accounted for a large proportion of the treatments in both years (Gludovacz, 2013). Since
treatments were generally started as soon as possible in the early spring, seeding even later in the
season would be an alternative for a treatment to experience a 6-week period where the mean
daily temperature remained below 14 °C, however, depending upon the year, frost makes this
strategy difficult to achieve under normal environmental conditions in Ontario.
Seeding dates with a clubroot incidence of less than 5% and a DSI of 5 (n = 6) generally
were seeded in early May or late in the summer (Table A3.5). The seeding dates with low or no
clubroot development at 6 weeks after seeding also experienced low average temperatures at 7–
21 days after seeding (treatment mean = 16.3 °C, season mean = 18.8 °C), total air degree days
(108 °D, mean 203 °D) and near average total rainfall (118 mm, mean 111 mm) (data not
shown). When finding thresholds for clubroot development, there are many seeding dates that
had a clubroot incidence of more than 5% and a DSI greater than 5 that have lower mean
84
temperatures and air degree days than seeding dates with very little clubroot. Mean temperatures
above 18.5 °C at 3 weeks after seeding were associated with incidence of > 5% only 50% of the
time. Thresholds for the initiation of clubroot development in the field likely lie within a mean
temperature at 7–21 days after seeding of 14–18.5 °C, but the interaction with other factors such
as soil moisture and precipitation make finding a threshold difficult. More treatments with
temperatures outside the zone that is conducive for pathogen development are necessary to
determine a threshold for clubroot development.
Abnormally high mean monthly temperatures and above average rainfall, resulting in
over 100 mm more precipitation than averages were experienced in the 2013 growing season.
Even though there was higher mean monthly temperatures and above average rainfall in 2013,
clubroot levels were higher in 2014. High rainfall often decreased clubroot development. There
was a negative correlation between total rainfall (r = -0.54) and clubroot incidence when data
from 2013 and 2014 were analyzed separately. Rainfall was not correlated with clubroot
development on flowering cabbage in 1999–2002 (McDonald and Westerveld, 2008). Since plots
were irrigated before seeding if the soil was dry, the high water-holding capacity of the highorganic-matter soil resulted in sufficient soil moisture for clubroot development throughout the
growing season (McDonald and Westerveld, 2008). Accumulated rainfall at 2 weeks after
seeding was correlated (r = 0.59 and r = 0.33) with clubroot severity in radish grown in Carlisle
muck soil near Hartville, Ohio in 1980 and 1981 (Thuma et al., 1983). In the same study, soil
moisture was negatively correlated (r = -0.25) with severity in 1981. More recently, a strong
correlation (r = 1) between clubroot severity and accumulated precipitation at 30 days after
seeding was reported on canola in 2010–2011 (Adhikari, 2012).
85
Stepwise regression was used to examine the relationships between weather parameters
and clubroot incidence and severity 6 weeks after seeding. Since only one year of soil moisture
data was collected in the current study, these data were not included in the stepwise regression
models. The best predictive parameters for forecasting clubroot incidence and severity at 6
weeks was mean air temperature and air degree days at 7–21 days after seeding and season total
rainfall with a 1-week delay.
In 2013 and 2014, no irrigation was applied nor necessary, and there was a negative
correlation between soil moisture two weeks after seeding and clubroot incidence (r = -0.59) and
severity (r = -0.66) when soil moisture was measured in 2014. A negative relationship between
clubroot levels and soil moisture has been reported previously (Thuma et al., 1983), but is
difficult to reconcile this relationship with the requirement for soil moisture to facilitate zoospore
movement. It is possible that since soil moisture was likely conducive for clubroot incidence and
severity throughout the season, that temperature was more of a limiting environmental parameter.
It is also possible that once a minimum soil moisture threshold was reached for zoospore
movement, extra soil moisture may have caused resting spores to be washed downward via
precipitation (Dixon, 2014). With a greater amount of moisture, lower resting spore
concentrations per mL of water might result, causing a decrease in infection. Additionally,
greater soil moisture levels might dilute the root exudates that act as triggers for resting spore
germination. Soil moisture levels also tend to be the highest after accumulated snow melts in the
spring. The average daily temperatures at the start of the season are colder, which would result in
lower amounts of clubroot incidence or severity. The level of moisture necessary for infection is
unknown, and several studies that values above some threshold do not produce greater amounts
86
of disease. In mineral soil, the critical moisture level was below 9% soil moisture (25% of water
holding capacity). In muck soil, the threshold moisture level to cause clubroot was found to
require soil moisture levels above 45% and below 60% soil moisture (40% of water holding
capacity) (Hamilton and Crête, 1978). In the current study on muck soil, average volumetric soil
moisture was 0.35 m3 m-3 in 2012 and 0.22 m3 m-3 in 2014. When the data from 2012 and 2014
were combined, all of the parameters measured for soil moisture had a negative correlation with
clubroot incidence and severity. While soil moisture at 5–10 days had the strongest association
with clubroot incidence (r = 0.60) and severity (r = 0.57), soil moisture 2 and 3 weeks after
seeding, as well as at 5–15 and 10–15 days after seeding, were also significant for both incidence
and severity (r = -0.52 to r = -0.57).
Seeding susceptible brassicas as early as possible minimized clubroot severity in the
current study as well as previous studies at the Holland Marsh (McDonald and Westerveld, 2008;
Gossen et al., 2012a). Clubroot severity developed slowly on the first seeding of canola each
year, but developed much more quickly in later seeding date treatments. In 2014, the 8 May
seeding took 16 weeks to reach a DSI of 98.5, yet crops planted later quickly reached a DSI of
100. This observation supports the conclusions of studies in Alberta, where the delay of infection
for several weeks after seeding canola or early seeding had a positive impact on seed yield and a
negative impact on clubroot severity (Hwang et al., 2012a).
The degree-day calculation was based on a threshold of TBase = 14 °C, where temperatures
below 14 °C would not be suitable for clubroot development. A previous study (Gludovacz,
2013) used 14 °C as a compromise among the diverse estimates of the lower threshold from
previous studies (Monteith, 1924; Thuma et al.; 1983; Sharma; 2011; Gossen et al., 2012a).
87
Sharma (2011) found no clubroot development at 10 and 15 °C, while Monteith (1924) reported
no clubroot development at 12 °C. A TBase = 12 °C was chosen based on ratings of field-grown
radishes in 1980 using a regression with mean soil temperature (Thuma et al., 1983). Controlled
environment studies on Shanghai pak choy demonstrated that temperatures below 17 °C slowed
or halted clubroot development (Gossen et al., 2012a). In the current study, preliminary results
(not shown) demonstrated that a TBase of 14 °C provided stronger correlations between clubroot
incidence and severity with the multiple time intervals tested. A TBase of 14 °C provided an
estimate of the minimum threshold for clubroot development based on symptom development at
these low temperatures.
In both 2011 and 2012, correlations with clubroot incidence were stronger when
accumulated season total rainfall and degree days of soil temperature were assessed with a 1-wk
delay (Gludovacz, 2013). In the current study, correlations between air degree days in 2013 and
2014 were not significant in canola, most likely because suitable temperatures for clubroot
development were present across most of the growing season. Accumulated seasonal rainfall was
also not correlated with clubroot incidence or severity in 2013 and 2014. Clubroot incidence of
20% and severity of 20 DSI or greater for 13 of the 16 possible seeding dates may indicate that
environmental parameters for these seeding dates were conducive for clubroot development.
With only three seeding dates with low clubroot levels, it comes as no surprise that direct
relations between environmental parameters and clubroot incidence and severity were weak.
When the additional two years of data from the study by Gludovacz (2012) were added to
that from the current study, there is still a large amount of unexplained variation. Year-to-year
variability was high, which rendered the model unsuitable for prediction. In both 2013 and 2014,
88
the Holland Marsh experienced monthly mean temperature and rainfall amounts close to the
long-term average, yet clubroot was much more severe than in 2011 and 2012. Between 1999
and 2009, incidence in flowering cabbage (moderately susceptible) never exceeded 70% (mean =
28%) or 50 DSI (mean = 18 DSI) at 6 weeks after seeding. In 2013, flowering cabbage had a
mean incidence of 73% and 67 DSI at 6 weeks after seeding, and 94% incidence and 90 DSI in
2014. A similar pattern of response was observed in canola cv. ‘InVigor 5030’, with the highest
incidence at 6 weeks of 30% in 2011 and 67% in 2012 (Gludovacz, 2012) compared to 52% in
2013 and 100% in 2014. Each year showed an increase in the maximum clubroot incidence and
severity, with the exception of incidence in 2013. Six of the eight seeding dates from 2014
showed the highest variation between predicted and observed incidence and severity when the
stepwise regression model was utilized (Table A3.6). The eight seeding dates from 2014 had an
average deviation of +40 incidence and severity when predicted values were compared to
observed values. The environment in 2014 may have been extremely favourable for pathogen
development, but it is more likely that the trial location experienced a large increase of inoculum
from the 2013 growing season. The majority of the 2014 trial was positioned in the same
location as the 2013 trial, and the entire area was rototilled several times prior to 2014 seeding in
attempt to thoroughly mix the soil and provide uniform disease pressure throughout the study
area. Previous seeding date trials (McDonald and Westerveld, 2008; Adhikari, 2010; Gludovacz,
2013) were conducted in approximately the same location as the current study. Resting spore
concentrations could have increased dramatically with each successive trial. Assessments based
on manual extraction (Dhingra and Sinclair, 1985) showed that there were 1.3 × 10⁶ resting
spores g-1 soil in 2009, 9.0 × 10⁶ resting spores g-1 soil in 2010 (Saude et al., 2011), and 2.4 × 10⁷
89
resting spores g-1 soil in 2011 (Kasinathan, 2012). Estimates of resting spore numbers at this site
using real time qPCR in 2013 were as high as 4.7 x 10⁷ resting spores g-1 soil (Table A2.4). It is
also possible that a pathotype shift has occurred, causing a breakdown of the moderate
susceptibility of flowering cabbage and intermediate resistance of canola cv. ‘InVigor
5030’ (Deora et al., 2012) to pathotype 6. However, this latter possibility is unlikely because
pathotype shifts are more likely to occur when resistant cultivars are planted and the selection
pressure for virulent pathotypes is increased.
There are small differences in the susceptibility of canola and Chinese flowering cabbage
and the inoculum density has definitely increased from 1999. While the soil type has remained
unchanged for all the seeding dates used within this study, it may be difficult to convert results
obtained from muck soil to mineral soil used in canola and other brassica vegetable production.
This research adds data to further the development of a calibrated clubroot forecast model that
has potential to be integrated into a clubroot management program. Modification of irrigation
practices, seeding before the soil temperature is conducive for disease development or harvesting
before a potential yield loss could help lower the effect of clubroot.
90
CHAPTER FOUR - GENERAL DISCUSSION
Plasmodiophora brassicae causes a complex disease that remains difficult to manage.
The recent development of a new pathotype that is virulent on canola cultivars that previously
were clubroot resistant demonstrates the need for continued research on disease management.
The research described in this thesis addressed questions important to the understanding of the
pathogen’s biology as well as increasing the effectiveness of applied management strategies. The
effectiveness of qPCR was compared with manual extractions to quantify resting spore
concentrations in naturally infested soil. Also, the vertical distribution of resting spores within
the soil profile of multiple soil types was explored. The effect of the interaction of temperature
and soil moisture on P. brassicae development was investigated for use in a clubroot prediction
model. The knowledge gained from this research will strengthen existing management strategies
as well as influence novel practices in the future.
This is the first study to look at resting spores to a depth of 50 cm in different soil types.
This research supports the results of previous trials, which indicate that qPCR is an effective
method to quantify resting spore concentrations in naturally infested soil (Deora et al., 2015),
and has demonstrated that it represents an improvement in estimates based on manual extraction.
The current study demonstrated that soil type and stratification has a substantial influence on the
vertical distribution of resting spores. Future studies of resting spores movement throughout the
soil profile may offer additional strategies to growers of high value brassica crops, such as
irrigation to flush resting spores downward and away from plant roots.
91
Information on the vertical distribution of resting spores is important for determining the
depth of treatments, such as fumigation and other disease management practices as well as for
optimizing sampling for assessment of pathogen incidence and inoculum pressure. The results of
this study demonstrated that the distribution of resting spores was highly variable and large
concentrations capable of causing severe disease symptoms were found at depths 50 cm below
the soil profile. Removing the top layers of soil will not prevent resting spores from
contaminating machinery used for pipeline or road construction. We conclude that equipment
should be cleaned before leaving a clubroot-infested field. Researchers testing fumigants, biocontrols or other strategies aimed at decreasing resting spore levels, especially eradication, need
to consider the implications of resting spores below the level of application. Applying such
management strategies to the full rhizosphere will be difficult, and devising alternative
application methods may be the only option if eradication is necessary.
Prior to the research reported here, there had been only one previous study that
investigated the vertical distribution of resting spores, which reported that these spores were
highly concentrated in the upper 5 cm of the soil (Kim et al., 2000). These estimates were based
on experiments that were conducted with a modified form of manual extraction that required a
substantial amount of skill and took several days to process a sample. A simpler process to
rapidly detect and accurately quantify live resting spore populations in the soil profile in various
soil types was needed. A novel qPCR protocol was used to quantify resting spores in the soil
profile in naturally infested fields in Canada. The hypothesis that there would be few or no
spores present 30 cm below the soil surface was rejected. Large concentrations of spores were
92
found below the plough layer at several locations, and these concentrations were high enough to
cause disease given they were viable.
Quantitative PCR has recently been shown to be a high-throughput method of assessing
the concentration of resting spores in soil or other substrates, with detection limits of 104
P. brassicae resting spores g-1 soil (Deora et al., 2015). Values near the lower limit of detection
are at risk of providing false negative values because the quantified value is outside the lowest
concentration of the standard curve (Bilodeau et al., 2012). Samples near the lower limit of
detection also tend to have a greater variation among replications since there are low amounts of
target DNA present (Bilodeau et al., 2012). A TaqMan multiplex system was used for the
detection of P. brassicae in soil samples with a competitive internal positive control (CIPC) to
quantify inhibition so accuracy and precision near the detection limit are increased (Deora et al.,
2015). Primers contained an amplified region of 90 bp of the internal transcribed spacer (ITS1)
region of the P. brassicae genome and amplified both the CIPC and the target P. brassicae DNA.
Assays were normalized by adjusting values when the cycle threshold (Cq) value of the CIPC
rose above the CIPC of the negative control. Samples with high levels of inhibition were diluted
10 and 15 times and assayed again to obtain a lower ∆Cq value. When acceptable amounts of
inhibition were detected, a formula developed by Bilodeau (2011) was used to estimate a more
precise quantity of P. brassicae DNA present. For example, without a CIPC, one sample from
Bassano, AB had an initial concentration of 2.4 x 10⁴ resting spores g-1 soil (Table A2.6). With
inhibition quantified, the same sample were adjusted to 9.0 x 10⁴, over three times greater than
its original concentration. This improved precision, along with a decrease in time needed to
analyze a sample, makes this method superior to manual extractions and bioassays for
93
quantifying resting spores, whether they are from different soil layers or as a detection method
for fields that may be infested with P. brassicae.
In the past, bioassays were one of the only ways to measure efficiency of management
strategies, however, bioassays are often unable to differentiate between soil with 1 x 10⁴ resting
spores g-1 soil or with 1 x 10⁷ spores g-1 soil since both concentrations are capable of causing
severe clubroot symptoms. Even if a management strategy reduced the spore load by 90%, there
are still more than enough resting spores g-1 soil to cause severe disease. However, molecular
methods and manual extraction have the drawback that they cannot differentiate between a live
and dead P. brassicae resting spores since the amplification of DNA is non-selective (Martin et
al., 2012). Research is already underway to develop a method where only the DNA from viable
resting spores will be amplified, which might provide a more accurate assessment of the
effectiveness of management strategies (F. Al-Daoud, personal communication). Preliminary
results provide evidence that PMA (propidium monoazide) only crosses into non-viable cells of
many microbes and inhibits subsequent amplification by qPCR (Nocker, et al., 2006; Pan and
Breidt, 2007).
Future research should also confirm whether precipitation is the primary cause of
downward resting spore movement. Undisturbed mineral soil cores with a set amount of resting
spores placed on the soil surface and a method of catching and quantifying the percentage of
resting spores found in the leachate would allow us to understand the role of precipitation in
downward spore movement. Another potential trial could involve testing water from field tiles
for P. brassicae DNA after a sufficient amount of precipitation has occurred. These results may
94
determine whether there is potential for brassica growers to contaminate their crops by using this
water to irrigate.
A clubroot forecast model that could be integrated into a clubroot management strategy
would be useful, but more sampling treatments with temperature, soil moisture or other
parameters outside the conducive zone for clubroot development are necessary to reduce the
amount of unexplained variation in the model. Seeding dates with a clubroot incidence of less
than 5% and a DSI of 5 (n = 6) generally were seeded in early May or late in the summer, and
while they usually experienced low average temperatures at 7–21 days after seeding, this was not
always the case. Treatments with low clubroot incidence and severity often occurred at the
beginning of the growing season, which is also when the field is at, or near, water-holding
capacity (Gludovacz, 2013). It is unclear how soil moisture levels and temperatures in different
combinations influence clubroot incidence and severity.
Temperatures over 14 °C may not be necessary for all stages of clubroot development.
Primary plasmodia developed at a high frequency at 12.5 °C (Gludovacz, 2013), but mature
zoospores are not yet formed or released (Sharma et al., 2011b). It is likely that primary infection
has occurred at levels below 14 °C, but secondary infection resulting in clubroot symptoms
developed only above 15 °C (Sharma et al., 2011a).
Cumulative degree days may be an inaccurate parameter for use in a model. Both
clubroot development and cumulative degree days increase over time, resulting in a correlation.
Degree days generally accumulate at a slower rate early in the season. Plants that were seeded
early and developed clubroot symptoms at later growth stages produced greater yield than those
planted later in the season (Hwang et al., 2012a).
95
There was a negative correlation between soil moisture and clubroot incidence and
severity. This correlation has been reported previously (Thuma et al., 1983), but is not consistent
across all such trials (McDonald and Westerveld, 2008; Adhikari, 2010; Gludovacz, 2013). Soil
moisture is required both for zoospores to swim and for kinetic penetration of zoospores into root
hairs and cortical tissue (Dixon, 2009). Interestingly, a negative correlation was found in this
study between soil moisture and clubroot incidence (r = -0.60) and severity (r = 0.57) 5–10 days
after seeding in 2013 and 2014. While surprising, these results are consistent with a previous
study involving canola, where clubroot incidence and severity two weeks after seeding were
negatively correlated with soil moisture in 2011 and 2012 (Gludovacz, 2013), and a negative
interaction between total rainfall and clubroot incidence (r = 0.25) in radish was observed in
1980 (Thuma et al., 1983). While it is not certain, a previous author has suggested that rainfall
and, subsequently excess moisture causes the downward movement of resting spores away from
the developing brassica root and, therefore, reduces disease incidence (Gludovacz, 2013). A
greater amount of moisture could also lower resting spore concentrations per mL, resulting in a
decrease in infection or a decrease in concentration of root exudates, which are responsible for
resting spore germination.
Finding the threshold to determine the exact volumetric soil moisture level that limits
clubroot development will be difficult. An ideal experiment would include a precise irrigation
system using multiple soil moisture sensors to maintain a soil moisture level by automatically
watering when necessary, and a computer network to control different soil moisture levels.
Manually watering plants based on soil moisture measurements every day could achieve the
same result, however labour and daily fluctuations in soil moisture may be limiting factors.
96
Susceptible or intermediate-resistant canola cultivars could be planted in naturally infested
mineral soil in pots in a controlled environment. The plants in such a study would experience the
same light conditions, and the experiment could be repeated at different temperatures if
necessary to clearly identify the relationships among soil moisture, temperature and clubroot
incidence and severity.
The current study was conducted on high-organic-matter muck soil at the Holland Marsh
because the Muck Crops Research Station provided a research site naturally infested with P.
brassicae. Only two comparable research sites are available in western Canada. In western
Canada, canola is grown on mineral soil. This means that for a model to work on mineral soils,
additional trials in mineral soils would be required. Strict sanitation requirements and limited
space make it difficult to conduct similar trials at the Alberta Agriculture and Food clubroot
nursery in Edmonton or the clubroot site at Bassano in southern Alberta.
It would be valuable for future seeding date trials on canola in Canada investigating the
effects of soil moisture and temperature to seed a bulk amount of treatments early and late in the
season. Weather conditions midway through the season are conducive for clubroot development
and likely will not be useful for calculating parameter thresholds. Future seeding dates should
confirm the negative relationship between clubroot levels and soil moisture which was found in
this study and has been reported previously (Thuma et al., 1983).
The properties of high organic muck soil are substantially different compared to mineral
soil. Mineral soil has smaller pores, lower water holding capacity and a higher bulk density than
muck soil (Kasinathan, 2012). A recent study has shown that high levels of clubroot were found
in both much and mineral soil when there was high moisture (Kasinathan, 2012). Clubroot levels
97
were also correlated with bulk density, but negatively correlated with water holding capacity and
pore volume. The larger pore volumes in muck soils may allow resting spores to move
downward much more easily than in many mineral soils. Therefore, retention of resting spores
may be higher in mineral soils compared to muck due to lower pore volumes and higher bulk
densities.
A portion of the unexplained variation in the regression models for clubroot incidence
and severity may be associated with the limitation that most of the seeding dates occurred during
periods when conditions were conducive for pathogen development. Also, factors that were not
measured in this study, such as sunlight irradiance, nutrient levels and microflora of the soil, may
influence clubroot at various stages of development. Sunlight irradiance might determine the
speed at which germination occurs or the rate of plant growth. Plants with sufficient nutrients
such as boron, may show less clubroot severity than those grown in nutrient deficient soils
(Deora et al., 2013). Antagonistic microbes could reduce the germination rates of P. brassicae
and as a result, lower clubroot incidence and severity of the brassica host (Wang et al., 2011).
The current study demonstrated that air temperature at 7–21 days after seeding influenced
clubroot incidence, and air temperature 14–21 days after seeding has a greater impact on
clubroot severity than any other variable assessed. The hypothesis that soil moisture and
temperature would have a substantial impact on the development of P. brassicae and subsequent
levels on canola was accepted. These data have helped identify some relationships that might be
used in a prediction model, however additional studies are required to develop a model that can
be used by growers or agronomists to predict clubroot development. A successful clubroot
forecasting model would help vegetable growers to make an informed decision on the utility of
98
additional inputs such as irrigation, to a potentially infested crop. In brassica vegetable
production, it might be possible to harvest the crop at the current yield or if it is an alternative,
disc the crop under and seed an alternative crop.
In summary, this study evaluated the effect of temperature and soil moisture on secondary
development of P. brassicae. A negative relationship between clubroot levels and soil moisture
was found when soil moisture was measured in 2014, which, is consistent with previous studies
(Thuma et al., 1983). The increase in incidence with increasing mean temperature during the first
21 days and 7–21 days after seeding is consistent with what is known about temperature effects
on the various stages of the disease cycle of P. brassicae on canola. This study also used a novel
qPCR protocol to quantify resting spores in the soil profile in naturally infested fields in Canada.
The results demonstrated that the distribution of resting spores was highly variable and large
concentrations capable of causing severe disease symptoms were found at depths 50 cm below
the soil profile.
99
LITERATURE CITED
Acharya, S. N., Verma, P. R., Dueck, J., & Downey, R. K. (1984). Screening rapeseed/canola for
resistance to damping-off and seedling root rot caused by Rhizoctonia solani. Canadian
Journal of Plant Pathology, 6(4), 325–328.
Adhikari, K.C., (2010). Effect of temperature, biofungicides and fungicides on clubroot on
selected brassica crops. M.Sc. thesis, University of Guelph, Guelph, Ontario, Canada.
University of Guelph.
Agarwal, A., Kaul, V., Faggian, R., & Cahill, D. M. (2009). Development and use of a model
system to monitor clubroot disease progression with an Australian field population of
Plasmodiophora brassicae. Australasian Plant Pathology, 38, 120–127.
Alberta Clubroot Management Committee. (2010). Alberta clubroot management plan:
Agriculture and Rural Development. Available from: http://www1.agric.gov.ab.ca/
$Department/deptdocs.nsf/all/agdex11519.
Allen, J., Fraser, H., & Hallet, R. (2009). The Swede midge - a pest of crucifer crops. OMAFRA
Publication 625/252, Queen’s Printer for Ontario, Toronto, ON, Canada.
Ayers, G. W. (1957). Races of Plasmodiophora brassicae. Canadian Journal of Botany, 35, 923–
932.
Ayers, G. W. (1972). Races of Plasmodiophora brassicae infecting crucifer crops in Canada.
Canadian Plant Disease Survey, 52(3), 77–81.
Bélec, C., Tremblay, N., & Coulombe, J. (2004). Liming and calcium cyanamid for clubroot
control in cauliflower. Acta Horticulturae, 635, 41–46.
Bhattacharya, I., Dutta, S., Mondal, S., & Mondal, B. (2013). Clubroot disease on brassica crops
in India. Canadian Journal of Plant Pathology, 36(sup 1), 1–18.
Bilodeau, G. J. (2011). Quantitative polymerase chain reaction for the detection of organisms in
soil. CAB Reviews: Perspectives in Agriculture, Veterinary Science, Nutrition and Natural
Resources, 6(014), 1–14.
Bilodeau, G. J., Koike, S. T., Uribe, P., & Martin, F. N. (2012). Development of an assay for
rapid detection and quantification of Verticillium dahliae in soil. Phytopathology, 102(3),
331–343.
Bilodeau, G. J., Lévesque, C. A., de Cock, A. W. A. M., Duchaine, C., Brière, S., Uribe, P.,
Martin, F.N and Hamelin, R. C. (2007). Molecular detection of Phytophthora ramorum by
real-time polymerase chain reaction using TaqMan, SYBR Green, and molecular beacons.
Phytopathology, 97(5), 632–642.
100
Boland, G. J., & Hall, R. (1994). Index of plant hosts of Sclerotinia sclerotiorum. Canadian
Journal of Plant Pathology, 16(2), 93–108.
Brown, P. H., & Shelp, B. J. (1997). Boron mobility in plants. Plant and Soil, 193, 85–101.
Buczacki, S. T., Toxopeus, H., Mattusch, P., Johnston, T. D., Dixon, G. R., & Hobolth, L. A.
(1975). Study of physiologic specialization in Plasmodiophora brassicae: proposals for
attempted rationalization through an international approach. Transactions of the British
Mycological Society, 65(2), 295–303.
Butcher, D. N., & Ingram, D. S. (1974). The role of indole glucosinolates in the club root disease
of the Cruciferae. Physiological Plant Pathology, 4, 127–140.
Canola Council of Canada (2014). Clubroot pathogen shift: Management. Retrieved September
10, 2014. Available from: http://www.canolawatch.org/2014/09/10/clubroot-pathogenshift-management/
Canola Council of Canada (2011). Industry Overview: Market & Stats, Insects, Canola
Encyclopedia. Retrieved February 11, 2014. Available from: http://
www.canolacouncil.org/canola-encyclopedia/insects/.
Cao, T., Manolii, V. P., Hwang, S.-F., Howard, R. J., & Strelkov, S. E. (2009). Virulence and
spread of Plasmodiophora brassicae [clubroot] in Alberta, Canada. Epidemiology, 329,
321–329.
Cao, T., Rennie, D. C., Manolii, V. P., Hwang, S. F., Falak, I., & Strelkov, S. E. (2014).
Quantifying resistance to Plasmodiophora brassicae in Brassica hosts. Plant Pathology,
63(3), 715-726.
Cao, T., Tewari, J., & Strelkov, S. E. (2007). Molecular detection of Plasmodiophora brassicae,
causal agent of clubroot of Crucifers, in plant and soil. Plant Disease, 91(1), 80–87.
Cavalier-Smith, T. (2013). Symbiogenesis: mechanisms, evolutionary consequences, and
systematic implications. Annual Review of Ecology, Evolution, and Systematics, 44(1),
145–172.
Cavalier-Smith, T., & Chao, E. E. . (2003). Phylogeny and classification of phylum Cercozoa
(Protozoa). Protist, 154, 341–358.
Chai, a. L., Xie, X. W., Shi, Y. X., & Li, B. J. (2014). Research status of clubroot
(Plasmodiophora brassicae) on cruciferous crops in China. Canadian Journal of Plant
Pathology, 36(S1), 142–153.
Chaput, J. (2009). Caterpillar pests of cruciferous crops: Ontario Ministry of Agriculture, Food
and Rural Affairs. Retrieved February 11, 2013. Available from http://
101
www.omafra.gov.on.ca/english/crops/facts/99-035.htm.
Chen, M., Shelton, A. M., Hallett, R. H., Hoepting, C. A., Kikkert, J. R., & Wang, P. (2011).
Swede Midge (Diptera: Cecidomyiidae), ten years of invasion of crucifer crops in North
America. Journal of Economic Entomology, 104(3), 709–716.
Chittem, K., Mansouripour, S., & Rio Mendoza, L. (2014). First report of clubroot on canola
caused by Plasmodiophora brassicae in North Dakota. Plant Disease, 98, 1438.
Christensen, J. V., Hennig, A., McKenzie, J. S., Legge, W., DePauw, G., Siemens, R. M., &
Thomas, J. B. (1985). Effect of seeding date, nitrogen and phosphate fertilizer on growth,
yield and quality of rapeseed in northwestern Alberta. Canadian Journal of Plant Science,
65, 275–284.
Chupp, C. (1917). Studies on clubroot of cruciferous plants: Bulletin of Cornell Agriculture
Experimental Station, 387, 419–452. Retrieved February 15, 2013. Available from https://
archive.org/details/studiesonclubroo00chup.
Colhoun, B. Y. J. (1953). The study of the epidemiology of club-root disease of brassicae. Annals
of Applied Biology, 40(2), 262–283.
Colhoun, B. Y. J. (1958). Club root disease of crucifers caused by Plasmodiophora brassicae
Woronin. Phytolpathological Paper No. 3 Kew:UK. Commonwealth Mycological Institute,
p. 108
Canola Council of Council, (1992). Canola oil. Plant and Soil, 4(2), 2–7.
Canola Council of Canada. (2014). Blackleg resistance vs. clubroot resistance: Canola Watch.
Retrieved December 10, 2014. Available from: www.canolawatch.org/2014/12/10/
blackleg-resistance-vs-clubroot-resistance/.
Creelman, D. W. (1958). Thirty-eight annual report of the Canadian Plant Disease Survey.
Canadian Plant Disease Survey, 38, 48–97.
Crute, I. R., Gray, A. R., Crisp, P., & Buczacki, S. T. (1980). Variation in Plasmodiophora
brassicae and resistance to clubroot disease in brassicas and allied crops - a critical
review. Plant Breeding Abstracts, 50(2), 91–104.
D’Arcy, C. J., Eastburn, D. M., & Schumann, G. L. (2014). Illustrated Glossary of Plant
Pathology: American Phytopathological Society. Retrieved September 18, 2014. Available
from: http://www.apsnet.org/edcenter/illglossary/Pages/N-R.aspx#p.
Decagon Devices. (2014). EC-5 Soil moisture smart sensor - S-SMC-M005: Sensors. Retrieved
August 25, 2014. Available from http://www.onsetcomp.com/products/sensors/s-smcm005.
102
Deora, A., Gossen, B.D., Amirsadeghi, S., & McDonald, M. R. (2015). A multiplex qPCR assay
for detection and quantification of Plasmodiophora brassicae in soil. Plant Disease, 99,
(in press). http://dx.doi.org/10.1094/PDIS-06-14-0608-RE.
Deora, A., Gossen, B. D., & McDonald, M. R. (2013). Cytology of infection, development and
expression of resistance to Plasmodiophora brassicae in canola. Annals of Applied
Biology, 163(1), 56–71.
Deora, A., Gossen, B. D., Walley, F., & McDonald, M. R. (2011). Boron reduces development of
clubroot in canola. Canadian Journal of Plant Pathology, 33(4), 475–484.
Diederichsen, E., Frauen, M., Linders, E. G. A., Hatakeyama, K., & Hirai, M. (2009). Status and
perspectives of clubroot resistance breeding in crucifer crops. Journal of Plant Growth
Regulation, 28(3), 265–281.
Dixon, G. R. (1996). Repression of the morphogenesis of Plasmodiophora brassicae Wor. by
boron - a review. Acta Horticulturae, 407, 393–401.
Dixon, G. R. (2006). The biology of Plasmodiophora brassicae Wor. – a review of recent
advances. Acta Horticulturae, 706, 271–282.
Dixon, G. R. (2009). The occurrence and economic impact of Plasmodiophora brassicae and
clubroot disease. Journal of Plant Growth Regulation, 28(3), 194–202.
Dixon, G. R. (2014). Clubroot (Plasmodiophora brassicae Woronin) – an agricultural and
biological challenge worldwide. Canadian Journal of Plant Pathology, 36(sup 1), 5-18.
Dixon, G. R., Rising, H., & Lane, H. (2012). Calcium cyanamide – A synoptic review of an
environmentally benign fertiliser which enhances soil health. Acta Horticulturae, 938,
211–218.
Dixon, G. R., & Tilston, E. L. (2010). Soil-borne pathogens and their interactions with the soil
environment. In G. R. Dixon & E. L. Tilston (Eds.), Soil Microbiology and Sustainable
Crop Production (pp. 197–271). Dordrecht: Springer, Netherlands.
Dokken-Bouchard, F., Bouchard, A. J., Ippolito, J., Peng, G., Strelkov, S. E., Kirkham, C. &
Kutcher, H. R. (2010). Detection of Plasmodiophora brassicae in Saskatchewan.
Canadian Plant Disease Survey, 90, 126.
Donald, C., & Porter, I. (2009). Integrated control of clubroot. Journal of Plant Growth
Regulation, 28(3), 289–303.
Donald, E. C., Cross, S. J., Lawrence, J. M., & Porter, I. J. (2006). Pathotypes of
Plasmodiophora brassicae, the cause of clubroot, in Australia. Annals of Applied Biology,
148(3), 239–244.
103
Donald, E. C., & Porter, I. J. (2014). Clubroot in Australia: the history and impact of
Plasmodiophora brassicae in brassica crops and research efforts directed towards its
control. Canadian Journal of Plant Pathology, 36(sup 1), 66-84.
Estey, R. H. (1994). Essays on the early history of plant pathology and mycology in Canada.
McGill-Queen’s University Press, Montreal, Quebec and Kingston. p.384.
Evans, J., & Scholes, J. D. (1995). How does clubroot alter the regulation of carbon metabolism
in its host? Journal of Applied Biology, 42, 125–132.
Faggian, R., Bulman, S. R., Lawrie, A. C., & Porter, I. J. (1999). Specific polymerase chain
reaction primers for the detection of Plasmodiophora brassicae in soil and water.
Phytopathology, 89, 392–397.
Faggian, R., & Strelkov, S. E. (2009). Detection and measurement of Plasmodiophora brassicae.
Journal of Plant Growth Regulation, 28(3), 282–288.
[FAOSTAT] Food and Agriculture Organization of the United Nations. (2012). Value of
Agriculture Production: Commodity Production. Retrieved February 11, 2014. Available
from: http://faostat.fao.org/site/613/DesktopDefault.aspx?PageID=613#ancor.
Feng, J., Xiao, Q., Hwang, S.-F., Strelkov, S. E., & Gossen, B. D. (2012). Infection of canola by
secondary zoospores of Plasmodiophora brassicae produced on a nonhost. European
Journal of Plant Pathology, 132(3), 309–315.
Food Standards Australia New Zealand. (2003). Erucic acid in food: A toxicological review and
risk assessment: Technical Report Series NO. 21. Retrieved February 11, 2014. Available
from: http://www.foodstandards.gov.au/Search/pages/results.aspx?k=Erucic%20acid
%20in%20food%3A%20A%20toxicological%20review%20and%20risk%20assessment
%3A
Friberg, H., & Lagerlöf, J. (2005). Germination of Plasmodiophora brassicae resting spores
stimulated by a non-host plant. European Journal of Plant Pathology, 113, 275–281.
Friberg, H., Lagerlöf, J., & Rämert, B. (2006). Usefulness of non-host plants in managing
Plasmodiophora brassicae. Plant Pathology, 55(5), 690–695.
Gan, Y. T., Campbell, C. A., Janzen, H. H., Lemke, R., Liu, L. P., Basnyat, P., & McDonald, C.
L. (2009). Root mass for oilseed and pulse crops: Growth and distribution in the soil
profile. Canadian Journal of Plant Science, 85, 883–893.
Gish, T. J., & Shirmohammadi, A. (1991). Preferential flow. American Society of Agricultural
Engineers, St. Joseph, Michigan, 16-17.
Gludovacz, T. (2013). Clubroot development on canola and cabbage in relation to soil
104
temperature and resistance. M.Sc. thesis, University of Guelph, Guelph, Ontario, Canada.
University of Guelph.
Gossen, B. D., Adhikari, K. K. C., & McDonald, M. R. (2012a). Effect of seeding date on
development of clubroot in short-season Brassica crops. Canadian Journal of Plant
Pathology, 34(4), 516–523.
Gossen, B. D., Adhikari, K. K. C., & McDonald, M. R. (2012b). Effects of temperature on
infection and subsequent development of clubroot under controlled conditions. Plant
Pathology, 61(3), 593–599.
Gossen, B. D., Deora, A., Peng, G., Hwang, S.-F., & McDonald, M. R. (2014). Effect of
environmental parameters on clubroot development and the risk of pathogen spread.
Canadian Journal of Plant Pathology, 36(sup 1), 37-48.
Gossen, B. D., Kasinathan, H., Cao, T., Manolii, V. P., Strelkov, S. E., Hwang, S.-F., &
McDonald, M. R. (2013). Interaction of pH and temperature affect infection and symptom
development of Plasmodiophora brassicae in canola. Canadian Journal of Plant
Pathology, 35(3), 294–303.
Gossen, B. D., Rimmer, S. R., & Holley, J. D. (2001). First report of resistance to benomyl
fungicide in Sclerotinia sclerotiorum. Plant Disease, 95(11), 1206.
Graveland, R., Dale, P., & Mithen, R. (1992). Gall development in hairy root cultures infected
with Plasmodiophora brassicae. Mycological Research, 96(3), 225–228.
Grsic, S., Kirchheim, B., Pieper, K., Fritsch, M., Hilgenberg, W., & Ludwig-Müller, J.(1999).
Induction of auxin biosynthetic enzymes by jasmonic acid and in clubroot diseased
Chinese cabbage plants. Physiologia Plantarum, 105, 521–531.
Grsic-Rausch, S., Kobelt, P., Siemens, J. M., Bischoff, M., & Ludwig-Müller, J. (2000).
Expression and localization of nitrilase during symptom development of the clubroot
disease in Arabidopsis. Plant Physiology, 122(2), 369–378.
Gugel, R. K., Yitbarek, S. M., Verma, P. R., Morrall, R. A. A., & Sadasivaiah, R. S. (1987).
Etiology of the Rhizoctonia root rot complex of canola in the Peace River region of
Alberta. Canadian Journal of Plant Pathology, 9(2), 119–128.
Guo, Z., Miyoshi, H., Komyoji, T., Haga, T., & Fujita, T. (1991). Uncoupling activity of a newly
developed fungicide, fluazinam [3-chloro-N-(3-chloro-2,6-dinitro-4trifluoromethylphenyl)-5-trifluoromethyl-2-pyridinamine]. Biochimica et Biophuysica
Acta,, 1056, 89–92.
Hallett, R. H., Chen, M., Sears, M. K., Shelton, A. M., & Chen, M. A. O. (2009). Insecticide
management strategies for control of Swede midge (Diptera  : Cecidomyiidae) on cole
105
crops. Journal of Economic Entomology, 102(6), 2241–2254.
Hildebrand, P. D., & McRae, K. B. (1998). Control of clubroot caused by Plasmodiophora
brassicae with nonionic surfactants. Canadian Journal of Plant Pathology, 20(1), 1–11.
Hildebrand, P. D., & Delbridge, R. W. (1995). Race survey of Plasmodiophora brassicae in
Nova Scotia. Canadian Plant Disease Survey, 75, 170.
Hirai, M., Ajisaka, H., Kuginuki, Y., & Mamiko, Y. (1998). Utilization of DNA polymorphism in
vegetable breeding. Japan Society for Horticultural Science, 67(6), 1168–1188.
Hirai, M., Harada, T., Kubo, N., Tsukada, M., Suwabe, K., & Matsumoto, S. (2004). A novel
locus for clubroot resistance in Brassica rapa and its linkage markers. Theoretical and
Applied Genetics, 108(4), 639–43.
Howard, M., Rutenberg, A., & de Vet, S. (2001). Dynamic compartmentalization of bacteria:
accurate division in E. coli. Physical Review Letters, 87(27), 1–4.
Howard, R. J., Strelkov, S. E., & Harding, M. W. (2010). Clubroot of cruciferous crops – new
perspectives on an old disease. Canadian Journal of Plant Pathology, 32(1), 43–57.
Hu, X., Roberts, D. P., Maul, J. E., Emche, S. E., Liao, X., Guo, X., Liu, Y., McKenna, L. F.,
Buyer, J. S., & Liu, S. (2011). Formulations of the endophytic bacterium Bacillus subtilis
Tu-100 suppress Sclerotinia sclerotiorum on oilseed rape and improve plant vigor in field
trials conducted at separate locations. Canadian Journal of Microbiology, 57, 539–546.
Hwang, S. F., Cao, T., Xiao, Q., Ahmed, H. U., Manolii, V. P., Turnbull, G. D., Gossen, B. D.,
Peng, G., & Strelkov, S. E. (2012a). Effects of fungicide, seeding date and seedling age on
clubroot severity, seedling emergence and yield of canola. Canadian Journal of Plant
Science, 92, 1175–1186.
Hwang, S. F., Strelkov, S. E., Feng, J., Gossen, B. D., & Howard, R. J. (2012b). Plasmodiophora
brassicae: A review of an emerging pathogen of the Canadian canola (Brassica napus)
crop. Molecular Plant Pathology, 13(2), 105–13.
Hwang, S. F., Ahmed, H. U., Turnbull, G. D., Gossen, B. D., & Strelkov, S. E. (2014a). The
effect of seed size, seed treatment, seeding date and depth on Rhizoctonia seedling blight
of canola. Canadian Journal of Plant Science, 94, 311–321.
Hwang, S. F., Howard, R. J., Strelkov, S. E., Gossen, B. D., & Peng, G. (2014b). Management of
clubroot (Plasmodiophora brassicae) on canola (Brassica napus) in western Canada.
Canadian Journal of Plant Pathology, 36, 49-65.
Ingram, D. S., & Tommerup, C. (1972). The life history of Plasmodiophora brassicae.
Proceedings of the Royal Society of London, 180(1058), 103–112.
106
Ivimey Cook, W. R., & Schwartz, E. J. (1930). The life-history, cytology and method of infection
of Plasmodiophora brassicae Woron., the cause of finger-and-toe disease of cabbages and
other crucifers. Annals of Botany, CCXVIII, 283–314.
Jiang, S., Pang, L., Buchan, G. D., Simůnek, J., Noonan, M. J., & Close, M. E. (2010). Modeling
water flow and bacterial transport in undisturbed lysimeters under irrigations of dairy shed
effluent and water using HYDRUS-1D. Water Research, 44(4), 1050–1061.
Jones, S. B., & Luchsinger, A. E. (1979). Introduction to plant systematics. McGraw-Hill, New
York (p. 388). Department of Botany, Georgia University, Athens, GA 30602, USA.
Kageyama, K., & Asano, T. (2009). Life cycle of Plasmodiophora brassicae. Journal of Plant
Growth Regulation, 28(3), 203–211.
Kageyama, K., Kamimura, Y., & Hyakumachi, M. (1995). A simple inoculation method with a
single resting spore of Plasmodiophora brassicae. Annals of the Phytopathological
Society of Japan, 61, 415-418.
Kammerich, J., Beckmann, S., & Scharafat, I. (2014). Suppression of the clubroot pathogen
Plasmodiophora brassicae by plant growth promoting formulations in roots of two
Brassica species. Plant Pathology, 63, 846–857.
Karling, J. S. (1968). The Plasmodiophorales. 2nd ed. Hafner Publishing Company New York
and London (p. 265).
Kasinathan, H. (2012). Influences of pH, temperature and biofungicides on clubroot of canola.
M.Sc. thesis, University of Guelph, Guelph, Ontario, Canada. University of Guelph.
Kim, C.H., Cho, W.D., & Kim, H.M. (2000). Distribution of Plasmodiophora brassicae causing
clubroot disease of Chinese cabbage in soil. Plant Disease Research, 6(1), 27–33.
Klasse, H.-J. (1996). Calcium cyanamide - An effective tool to control clubroot - A review. Acta
Horticulturae, 407, 403–409.
Knodel, J., & Olsen, D. L. (2002). Crucifer flea beetle: biology and integrated pest management
in canola. North Dakota State, University Extension Service, Publication E123, 1–8.
Kunkle, L. (1918). Tissue invasion by Plasmodiophora brassicae. Journal of Agricultural
Research, 12, 543–572.
Kurepin, L. V., Qaderi, M. M., Back, T. G., Reid, D. M., & Pharis, R. P. (2008). A rapid effect of
applied brassinolide on abscisic acid concentrations in Brassica napus leaf tissue
subjected to short-term heat stress. Plant Growth Regulation, 55(3), 165–167.
Kutcher, H. R., Fernando, W. G. D., Turkington, T. K., & McLaren, D. L. (2011). Blackleg
107
strategic plan in Canada. Prairie Soils and Crops Journal, 4, 122–134.
Lahlali, R., McGregor, L., Song, T., Gossen, B. D., Narisawa, K., & Peng, G. (2014).
Heteroconium chaetospira induces resistance to clubroot via upregulation of host genes
involved in jasmonic acid, ethylene, and auxin biosynthesis. PLOS ONE, 9(4), 1–9.
Lammerink, J. (1967). The inheritance of clubroot resistance in Brassica napus L. New Zealand
Journal of Agricultural Research, 10(1), 109–115.
LeBoeuf, J. (2012). Growing vegetable transplants in plug trays. Ontario Ministry of Agriculture,
Food and Rural Affairs. Retrieved February 11, 2013. Available from: http://
www.omafra.gov.on.ca/english/crops/facts/transplants-plugtrays.htm.
Legendre, P. (1993). Spatial autocorrelation: Trouble or new paradigm? Ecology, 74(6), 1659–
1673.
Littke, M. H. (2010). Effect of soil application method on surface emission rates of methyl
isothiocyanate. M.Sc. thesis, Washing State University, Pullman, Washington, Washing
State University.
Lu, G. (2003). Engineering Sclerotinia sclerotiorum resistance in oilseed crops. African Journal
of Biotechnology, 2(December), 509–515.
MacFarlane, I. (1952). Factors affecting the survival of Plasmodiophora brassicae Wor. in the
soil and its assessment by a host test. Annals of Applied Biology, 39(2), 239.
Manzanares-Dauleux, M. J., Delourme, R., Baron, F., & Thomas, G. (2000). Mapping of one
major gene and of QTLs involved in resistance to clubroot in Brassica napus. Theory of
Applied Genetics, 101, 885–891.
Martin, B., Raurich, S., Garriga, M., & Aymerich, T. (2012). Effect of amplicon length in
propidium monoazide quantitative PCR for the enumeration of viable cells of Salmonella
in cooked ham. Food Analytical Methods, 6(2), 683–690.
McDonald, M. R., Kornatowska, B., & McKeown, A. W. (2004). Management of clubroot of
Asian brassica crops grown on organic soils. Acta Horticulturae, 635, 25–30.
McDonald, M. R., & Westerveld, S. M. (2008). Temperature prior to harvest influences the
incidence and severity of clubroot on two Asian brassica vegetables. HortScience, 43(5),
1509–1513.
McDonald, M. R., Sharma, K., Gossen, B. D., Deora, A., Feng, J., & Hwang, S.F. (2014). The
role of primary and secondary infection in host response to Plasmodiophora brassicae.
Phytopathology, 104(10), 1078–1087.
McMaster, G. S., & Wilhelm, W. (1997). Growing degree-days: One equation, two
108
interpretations. Agricultural and Forest Meteorology, 87, 291–300.
Merrill, S. D., Tanaka, D. L., & Hanson, J. D. (2002). Root length growth of eight crop species in
haplustoll soils. Soil Science Society of America, 66, 913–923.
Miller, P. (2012). Canola Council of Canada: growing forward. Retrieved February 11, 2012.
Available from: http://www.canolacouncil.org/news/growing-forward-2-is-on-track-forcanada’s-canola-industry/
Mithen, R., & Magrath, R. (1992). A contribution to the life history of Plasmodiophora
brassicae: Secondary plasmodia development in root galls of Arabidopsis thaliana.
Mycological Research, 96(10), 877–885.
Murakami, H., Tsushima, S., Akimoto, T., Murakami, K., Goto, I., & Shishido, Y. (2000). Effects
of growing leafy daikon (Raphanus sativus) on populations of Plasmodiophora brassicae
(clubroot). Plant Pathology, 49, 584–589.
Murakami, H., Shinoda, H., Maruta, R., & Goto, I. (2003). Relationship between physical and
chemical properties of soil and resting spore density of Plasmodiophora brassicae and
clubroot disease index in production areas of cruciferous vegetables. Japanese Journal of
Soil Science and Plant Nutrition, 74(6), 781–786.
Myers, D. F., & Campbell, R. N. (1985). Lime and the control of clubroot of crucifers: effects of
pH, calcium, magnesium and their interactions. Phytopathology, 75(6), 670–673.
Naiki, T., Dixon, G. R., & Ikegami, H. (1987). Quantitative estimation of spore germination of
Plasmodiophora brassicae. Transactions of the British Mycological Society, 89(4), 569–
572.
Naiki, T., Kageyama, K., & Ikegami, H. (1978). The relation of spore density of Plasmodiophora
brassicae Wor. to the root hair infection and club formation in Chinese cabbage. Annals of
the Phytopathological Society of Japan, 44, 432–439.
Naiki, T., Tanahashi, K., & Kageyama, K. (1984). The relationship between root hair infection
with Plasmodiophora brassicae Wor. and subsequent club formation among Cruciferous
species. Annals of the Phytopathological Society of Japan, 50, 211–215.
Narisawa, K., Kageyama, K., & Hashiba, T. (1996). Efficient root infection with single resting
spores of Plasmodiophora brassicae. Mycological Research, 100(7), 855–858.
Narisawa, K., Ohki, K. T., & Hashiba, T. (2000). Suppression of clubroot and Verticillium
yellows in Chinese cabbage in the field by the root endophytic fungus, Heteroconium
chaetospira. Plant Pathology, 49(1), 141–146.
109
Natsch, A., Keel, C., Pfirter, H. A., Haas, D., & Defagoi, G. (1994). Contribution of the global
regulator gene gacA to persistence and dissemination of Pseudomonas fluorescens
biocontrol strain CHA0 introduced into soil microcosms. Applied and Environmental
Microbiology, 60(7), 2553–2560.
Neuhaus, K., Grsic-Rausch, S., Sauerteig, S., & Ludwig-Müller, J. (2000). Arabidopsis plants
transformed with nitrilase 1 or 2 in antisense direction are delayed in clubroot
development. Journal of Plant Physiology, 156(5-6), 756–761.
Nocker, A., Cheung, C.-Y., & Camper, A. K. (2006). Comparison of propidium monoazide with
ethidium monoazide for differentiation of live vs. dead bacteria by selective removal of
DNA from dead cells. Journal of Microbiological Methods, 67(2), 310–20.
Nowicki, M., Nowakowska, M., Niezgoda, A., & Kozik, E. (2012). Alternaria black spot of
crucifers: symptoms, importance of disease, and perspectives of resistance breeding.
Vegetable Crops Research Bulletin, 76, 5–19.
OMAFRA. (2013). Vegetable crop protection guide 2012-2013. Publication 838 (pp. 1–64).
Queen’s Printer for Ontario, Toronto, ON, Canada.
OMAFRA. (2014). Field crop protection guide 2014-2015. Publication 812 (pp. 1–176). Queen’s
Printer for Ontario, Toronto, ON, Canada.
Okazaki, M., Sugita, T., Shimizu, M., Ohode, Y., Iwamoto, K., deVrind Jong, E.W., deVrind,
J.P.M., & Corstjens, P. L. A. M. (1997). Partial purification and characterization of
manganese-oxidizing factors of Pseudomonas fluorescens GB-1. Applied and
Environmental Microbiology, 63(12), 4793–4799.
Or, D., & Wraith, J. M. (2002). Soil physics companion: Soil water content and water potential
relationships. CRC Press Boca Raton. (p. 49–84).
Pageau, D., Lajeunesse, J., & Lafond, J. (2006). Impact of clubroot (Plasmodiophora brassicae)
on the yield and quality of canola. Canadian Journal of Plant Pathology, 28(1), 137–143.
Pan, Y., & Breidt, F. (2007). Enumeration of viable Listeria monocytogenes cells by real-time
PCR with propidium monoazide and ethidium monoazide in the presence of dead cells.
Applied and Environmental Microbiology, 73(24), 8028–8031.
Parks, W. L., & White, W. L. (1952). Boron retention by clay and humus systems saturated with
various cations. Soil Science Society of America, 16, 298–300.
Peng, G., Falk, K. C., Gugel, R. K., Franke, C., Yu, F., James, B., Strelkov, S. E., Hwang, S. F.,
& McGregor, L. (2014). Sources of resistance to Plasmodiophora brassicae (clubroot)
pathotypes virulent on canola genetics and resistance. Canadian Journal of Plant
Pathology, 36(sup1), 89–99.
110
Peng, G., McGregor, L., Lahlali, R., Gossen, B. D., Hwang, S. F., Adhikari, K. K., Strelkov, S. E.
& McDonald, M. R. (2011). Potential biological control of clubroot on canola and crucifer
vegetable crops. Plant Pathology, 60(3), 566–574.
Piao, Z. Y., Deng, Y. Q., Choi, S. R., Park, Y. J., & Lim, Y. P. (2004). SCAR and CAPS mapping
of CRb, a gene conferring resistance to Plasmodiophora brassicae in Chinese cabbage
(Brassica rapa ssp. pekinensis). Theoretische Und Angewandte Genetik, 108(8), 1458–
1465.
Porter, I. J., Merrimana, P. R., & Keaneb, P. J. (1991). Soil solarisation combined with low rates
of soil fumigants controls clubroot of cauliflowers, caused by Plasmodiophora brassicae
Woron. Austrialian Journal of Experimental Agriculture, 31, 843–851.
Porter, I. J., Cross, S. J., Asirifi, N., & Morgan, W. (1994). Integrated management of clubroot of
crucifers: Survey and pilot studies. Final report for project VG306. Sydney (Australia):
Horticultural Research and Development Corporation.
Porth, G., Mangan, F., Wick, R., & Autio, W. (2003). Evaluation of management strategies for
clubroot disease of brassica crops. Vegetable Notes, 13, 25.
Raa, J. A. N. (1971). Indole-3-acetic acid levels and the role of indole-3-acetic acid oxidase in
the normal root and clubroot of cabbage. Physiologia Plantarum, 25, 130–134.
Rahman, H., Peng, G., Yu, F., Falk, K. C., Kulkarni, M., & Selvaraj, G. (2013). Genetics and
breeding for clubroot resistance in Canadian spring canola (Brassica napus L.). Canadian
Journal of Plant Pathology, 36, 122-134.
Rastas, M., Latvala, S., & Hannukkala, A. (2012). Occurrence of Plasmodiophora brassicae in
Finnish turnip rape and oilseed rape fields. Agricultural and Food Science, 21, 141–158.
Rausch, T., Butcher, D. N., & Hilgenberg, W. (1983). Indole-3-methylgIucosinoIate biosynthesis
and metabolism in clubroot diseased plants. Physiologia Plantarum, 58, 93–100.
Rausch, T., Mattusch, P., & Hilgenberg, W. (1981). Influence of clubroot disease on the growth
kinetics of Chinese cabbage. Phytopathology, 102, 28–33.
Reyes, A. A. (1969). The season occurrence of fungal and bacterial disease of crucifer in Ontario
in 1967 and 1968. Canadian Plant Disease Survey, 49, 56–57.
Reyes, A. A., Davidson, T. R., & Marks, F. C. (1974). Races, pathogenicity and chemical control
of Plasmodiophora brassicae in Ontario. Phytopathology, 64, 173–177.
Samuel, G., & Garrett, S. D. (1945). The infected root-hair count for estimating the activity of
Plasmodiophora brassicae Woron. in the soil. The Annals of Applied Biology, 32(2), 96–
101.
111
Saude, C., Mckeown, A., Gossen, B. D., & McDonald, M. R. (2012). Effect of host resistance
and fungicide application on clubroot Pathotype 6 in green cabbage and Napa cabbage.
HortTechnology, 22, 311–319.
Schmitthenner, A. F. (1999). Phytophthora rot of soybean: Compendium of soybean diseases, 4th
edition. The American Phytopathological Society Press, St Paul: 39–42.
Sharma, K., Gossen, B. D., Greenshields, D., Selvaraj, G., Strelkov, S. E., & McDonald, M. R.
(2013). Reaction of lines of the rapid cycling Brassica collection and Arabidopsis thaliana
to four pathotypes of Plasmodiophora brassicae. Canadian Journal of Plant Pathology,
97(6), 720–727.
Sharma, K., Gossen, B. D., Howard, R. J., Gludovacz, T., & McDonald, M. R. (2013). Reaction
of selected Brassica vegetable crops to Canadian pathotypes of Plasmodiophora
brassicae. Canadian Journal of Plant Pathology, 35(3), 371–383.
Sharma, K., Gossen, B. D., & McDonald, M. R. (2011a). Effect of temperature on cortical
infection by Plasmodiophora brassicae and clubroot severity. Phytopathology, 101(12),
1424–1432.
Sharma, K., Gossen, B. D., & McDonald, M. R. (2011b). Effect of temperature on primary
infection by Plasmodiophora brassicae and initiation of clubroot symptoms. Plant
Pathology, 60, 830–838.
Smith, M. S., Thomas, G. W., White, R. E., & Ritonga, D. (1985). Transport of Escherichia coli
through intact and disturbed soil columns, Journal of Environmental Quality, 14, 87-91.
Stanghellini, M. E., Kim, D. H., & Rasmussen, S. L. (1996). Ascospores of Monosporascus
cannonballus: Germination and distribution in cultivated and desert soils in Arizona.
Phytopathology, 86(5), 509–514.
Statistics Canada. (2013a). Area, production and farm gate value of vegetables: Table 001-0017.
Retrieved February 11, 2013. Available from: http://www5.statcan.gc.ca/cansim/a26?
lang=eng&retrLang=eng&id=0010013&pattern=Grain&tabMode=dataTable&srchLan=-1
&p1=1&p2=-1.
Statistics Canada. (2013b). Exports of grains by final destination: Table 001-0015. Retrieved
February 11, 2014. Available from: http://www5.statcan.gc.ca/cansim/pick-choisir?
lang=eng&p2=33&id=0010015.
Statistics Canada. (2014). Field and special crops seeded area: Catalogue #22-002-X. Retrieved
February 11, 2014. Available from: http://www.statcan.gc.ca/tables-tableaux/sum-som/l01/
cst01/prim11a-eng.htm.
Strelkov, S. E., Cao, T., Manolii, V. P., Lange, R. M., Smith-Degenhardt, E., Orchard, D., &
112
Tewari, J. P. (2006). Incidence of clubroot of canola in Alberta in 2005. Canadian Plant
Disease Survey, 86, 91–93.
Strelkov, S. E., & Dixon, G. R. (2013). Special Issue: Clubroot (Plasmodiophora brassicae) on
canola and other Brassica species – disease development, epidemiology and management.
Canadian Journal of Plant Pathology, 36(sup 1), 1–4.
Strelkov, S. E., & Hwang, S.F. (2014). Clubroot in the Canadian canola crop: 10 years into the
outbreak. Canadian Journal of Plant Pathology, 36(sup 1), 27–36.
Strelkov, S. E., Manolii, V. P., Cao, T., Xue, S., & Hwang, S. F. (2007). Pathotype classification
of Plasmodiophora brassicae and its occurrence in Brassica napus in Alberta, Canada.
Journal of Phytopathology, 155, 706–712.
Strelkov, S. E., Tewari, J. P., & Smith-Degenhardt, E. (2006). Characterization of
Plasmodiophora brassicae populations from Alberta, Canada. Canadian Journal of Plant
Pathology, 28, 467–474.
Sturhan, D. (1985). Species, subspecies, race and pathotype problems in nematodes. EPPO
Bulletin, 15(2), 139–144.
Takahashi, K., & Yamaguchi, T. (1988). A method for assessing the pathogenic ability of resting
spores of Plasmodiophora brassicae by fluorescence microscopy. Annals of the
Phytopathological Society of Japan, 54, 621–475.
Takahashi, K., & Yamaguchi, T. (1989). Assessment of pathogenicity of resting spores of
Plasmodiophora brassicae in soil by fluorescence microscopy. Annals of the
Phytopathological Society of Japan, 55, 621–628.
Tewari, J. P., Strelkov, S. E., Orchard, D., Hartman, M., Lange, R. M., & Turkington, T. K.
(2005). Identification of clubroot of crucifers on canola (Brassica napus) in Alberta.
Canadian Journal of Plant Pathology, 144, 143–144.
Thuma, B. A. (1983). Relationships of soil temperature and moisture to clubroot
(Plasmodiophora brassicae) severity on radish in organic soil. Plant Disease, 67, 758–
762.
Tomerlin, J. R., & Jones, A. L. (1983). Effect of temperature and relative humidity on the latent
period of Venturia inaequalis in apple leaves. Phytopathology, 73(1), 73–76.
Tommerup, I. C., & Ingram, D. S. (1971). The life-cycle of Plasmodiophora brassicae Woron. in
brassica tissue cultures and in intact roots. New Phytologist, 70(2), 327–332.
Toxopeus, H., Oost, E. ., & Reuling, G. (1984). Current aspects of the taxonomy of cultivated
Brassica species. The use of B. rapa L. versus B. campestris L. and a proposal for a new
113
intraspecific classification of B. rapa L. Cruciferae Newsletter, 9, 55–57.
Tukey, J. W. (1949). Comparing individual means in the analysis of variance. Biometrics, 6, 99–
114.
Turkington, T., Olfert, O. O., Weiss, R. M., Clear, R. M., Xi, K., Tewari, J. P., & Strelkov, S. E.
(2004). Forecasting the potential distribution and abundance of plant diseases using
CLIMEXTM modeling with historical and potential weather scenarios associated with
climate change: Manitoba Agronomy Conference (pp. 99–110). Available from: http://
www.umanitoba.ca/afs/agronomists_conf/proceedings/
2004/0turkington_forecasting_potential.pdf.
Van der Plank, J. E. (1963). Plant diseases: Epidemics and control. New York and London:
Academic Press.
Walker, J. C., & Larson, R. (1960). Development of the first clubroot resistant cabbage variety.
Bulletin Wisconsin Agricultural Experiment Station 547, 12–16.
Wang, J., Huang, Y., Zhang, Y., & Yao, J. (2011). Control of rapeseed clubroot by screened
antagonistic microorganisms against Plasmodiophora brassicae. Chinese Journal of Oil
Crop Sciences, 33(2), 169–174.
Wallenhammar, A. C. (1996). Prevalence of Plasmodiophora brassicae in a spring oilseed rape
growing area in central Sweden and factors influencing soil infestation levels. Plant
Pathology, 45, 710–719.
Wallenhammar, A. C. (2010). Monitoring and control of Plasmodiophora brassicae in spring
oilseed Brassica crops. Acta Horticulturae, 867, 181–190.
Wallenhammar, A. C., Almquist, C., Soderstrom, M., & Jonsson, A. (2012). In-field distribution
of Plasmodiophora brassicae measured using quantitative real-time PCR. Plant
Pathology, 61, 16–28.
Watson, A. G., & Baker, K. F. (1969). Possible gene centers for resistance in the genus Brassica
to Plasmodiophora brassicae. Economic Botany, (8), 245–252.
Webster, M. A. (1986). pH and nutritional effects on infection by Plasmodiophora brassicae
Wor. and clubroot symptoms. Ph.D. thesis, University of Aberdeen. Aberdeen, United
Kingdom.
Webster, M. A., & Dixon, G. R. (1991a). Boron, pH and inoculum concentration influencing
colonization by Plasmodiophora brassicae. Mycological Research, 95(1), 74–79.
Webster, M. A., & Dixon, G. R. (1991b). Calcium, pH and inoculum concentration influencing
colonization by Plasmodiophora brassicae. Mycological Research, 95(1), 64–73.
114
Wellman, F. L. (1930). Clubroot of crucifers: United States Department of Agriculture, 181.
Retrieved February 11, 2014. Available from: http://books.google.ca/books?
id=JecDE43ZSnAC&printsec=frontcover&source=gbs_ge_summary_r&cad=0#v=onepag
e&q&f=false.
Williams, P. H. (1966). A system for the determination of races of Plasmodiophora brassicae
that infect cabbage and rutabaga. Phytopathology, 56(6), 624–626.
Williams, P. H., & Siedel, D. (1968). Zum vorkommen von Plasmodiophora brassicae-rassen in
der Deutschen Demokratischen Republik. Arch Pflanzenschutz, 4, 31–36.
Workneh, F., Yang, X. B., & Tylka, G. L. (1998). Effect of tillage practices on vertical
distribution of Phytophthora sojae. Plant Disease, 82(11), 1258–1263.
Woronin, M. (1878). Plasmodiophora brassicae Urheber der Kohlpflanzen - Hernie. Jahrbücher
für Wissenschaftliche Botanik, 11, 548–574. [translated by Chupp C (1934)
Phytopathological Classics No. 4. St. Paul, MN: American Phytopathological Society]
Xue, S., Cao, T., Howard, R. J., Hwang, S. F., & Strelkov, S. E. (2008). Isolation and variation in
virulence of single-spore isolates of Plasmodiophora brassicae from Canada. Plant
Disease, 92(3), 456–462.
115
APPENDIX 1: SUPPLEMENTARY TABLES FOR CHAPTER ONE
Table A1.1. Weed species that may act as potential host for clubroot (Howard et al., 2010; Feng
et al., 2012)
Scientific Name
Common Name
Armoracia rusticana (P.G. Gaertn., B. Mey. and Scherb) horseradish, red cole
Barbarea vulgaris (R. Br.)
wintercress, yellow rocket
Brassica hirta (Moench)
white mustard
B. kaber (DC.) L.C. Wheeler
wild mustard
Camelina sativa (L.) Crantz
camelina, false flax
C. microcarpa (Andrz.)
small-seeded false flax
Capsella bursa-pastoris (L.) Medik.
shepherd’s purse
Erysimum asperum (Nutt.) DC.
western wallflower
Hesperis matronalis (L.)
dame’s rocket, dame’s violet
Lepidium campestre (L.) W.T. Aiton
pepperwort
Rorippa islandica (Oeder) Borbás
marsh cress
R. sylvestris (L.) Besser
creeping yellow cress, yellow field cress
Sisymbrium altissimum (L.)
tumbling mustard
S. officinale (L.) Scop.
hedge mustard
Thlaspi arvense (L.)
stinkweed
Rumex spp. (L.)
dock
116
APPENDIX 2: SUPPLEMENTARY TABLES FOR CHAPTER TWO
Table A2.1. Friedman’s chi-square test for treatment differences of resting spore quantities
between fields, locations, replications and depths1
Field
Bassano, AB
Flamborough, ON
Holland Marsh, ON
Millgrove, ON
All fields
Comparison
site×spores
core×spores
depth×spores
site×core×spores
site×depth×spores
site×core×depth×spores
site×spores
core×spores
depth×spores
site×core×spores
site×depth×spores
site×core×depth×spores
site×spores
core×spores
depth×spores
site×core×spores
site×depth×spores
site×core×depth×spores
site×spores
core×spores
depth×spores
site×core×spores
site×depth×spores
site×core×depth×spores
site×spores
core×spores
depth×spores
site×core×spores
site×depth×spores
site×core×depth×spores
field×site×spores
field×core×spores
field×depth×spores
DF
1
2
6
2
6
6
1
2
6
2
6
6
1
2
6
2
6
6
1
2
6
2
6
6
1
2
6
2
6
6
1
2
6
Chi-square
2.16
5.92
5.37
5.38
5.52
6.58
3.51
0.44
24.70
0.63
28.00
26.57
8.23
1.37
6.67
1.50
6.51
8.61
18.83
0.46
5.41
0.08
10.90
11.07
0.79
1.51
10.84
1.58
13.07
11.75
5.82
2.79
20.19
Probability
0.14
0.05
0.50
0.07
0.48
0.36
0.06
0.80
0.0004
0.73
<0.0001
0.0002
0.004
0.50
0.35
0.47
0.37
0.20
<0.0001
0.79
0.49
0.96
0.09
0.09
0.37
0.46
0.09
0.45
0.04
0.07
0.02
0.25
0.003
117
Field
Comparison
field×site×core×spores
field×site×depth×spores
field×site×core×depth×spores
DF
2
6
6
Chi-square
3.56
22.77
27.17
Probability
0.17
0.0009
0.0001
Values in bold are significant at P < 0.05.
1
Table A2.2. Bassano, Alberta resting spore quantification using qPCR1
Sample Site 1
Sample Site 2
Depth(cm)
Core 1
Core 2
Core 3
Core 1
Core 2
0–7.9
90
0
0
27
64
8–15.9
86
0
5
11
96
16–22.9
58
0
0
21
14
23–29.9
9
0
3
17
0
30–37.9
0
0
4
0
0
38–45.9
70
0
0
5
9
46–53
19
0
18
0
0
2
Mean Core
48
0
4
12
26
Mean Site
107
1spore concentration x 1000
Site 1: R2 = 0.97, Eff% = 93.5, Slope = -3.465.
Site 2: R2 = 0.98, Eff% = 96.8, Slope = -3.40.
Table A2.3. Flamborough, Ontario resting spore quantification using qPCR1
Sample Site 1
Sample Site 2
Depth(cm)
1
2
3
1
2
0–7.9
257
1750
1052
906
1866
8–15.9
732
1378
671
1101
1381
16–22.9
690
158
284
1524
1060
23–29.9
131
48
128
91
36
30–37.9
248
85
26
602
114
38–45.9
143
91
30
138
55
46–53
532
3
17
26
190
2
Mean Core
390
502
315
627
672
Mean Site
402
1spore concentration x 1000
Site 1: R2 = 0.97, Eff% = 96.0, Slope = -3.20.
Site 2: R2 = 0.97, Eff% = 96.0, Slope = -3.30.
Core 3
56
27
4
36
68
0
32
32
23
3
4259
1976
1381
451
67
889
732
1394
897
118
Table A2.4. Holland Marsh, Ontario resting spore quantification using qPCR1
Sample Site 1
Sample Site 2
Depth(cm)
1
2
3
1
2
0–7.9
140
720
640
44
33
8–15.9
100
330
200
0
0
16–22.9
110
18
4800
0
22
23–29.9
60
10
73
36
8
30–37.9
590
50
1700
54
29
38–45.9
0
0
0
49
18
46–53
610
12
17
34
89
2
Mean Core
230
163
1061
31
28
Mean Site
485
1spore concentration x 1000
Site 1: R2 = 0.97, Eff% = 106.0, Slope = -3.18.
Site 2: R2 = 0.98, Eff% = 111.0, Slope = -3.18.
Table A2.5. Millgrove Ontario resting spore quantification using qPCR1
Sample Site 1
Sample Site 2
Depth(cm)
1
2
3
1
2
0–7.9
481
3241
535
167
2470
8–15.9
269
77
106
177
459
16–22.9
66
343
325
529
1253
23–29.9
196
185
195
1282
1464
30–37.9
130
284
156
20868
800
38–45.9
255
227
247
1605
986
46–53
89
0
122
25873
538
Mean Core2
212
622
241
7214
1139
Mean Site
357
1spore concentration x 1000
Site 1: R2 = 0.98, Eff% = 95.0, Slope = -3.20.
Site 2: R2 = 0.97, Eff% = 91.0, Slope = -3.18.
3
0
24
28
0
0
14
8
11
23
3
1875
812
1237
991
653
752
428
964
3105
Table A2.6. Initial and final resting spore concentration across sample cores and soil depths at
sites in Alberta and Ontario using the formula: QTYFinal = QTYInitial x (Efficiency + 1)∆Cт
Resting spore quantity1
Field
Site
Core
Depth Efficiency
IC ΔCq
QTYInitial
QTYFinal
Bassano
1
0.94
2.01
24
90
1
1
1
0.94
2.50
17
86
1
2
1
0.94
2.41
12
58
1
3
1
0.94
2.28
2.1
9.3
1
4
119
Flamborough
1
1
1
1
1
1
1
1
1
1
1
1
1
1
1
1
1
2
2
2
2
2
2
2
2
2
2
2
2
2
2
2
2
2
2
2
2
2
1
1
1
1
1
1
1
1
2
2
2
2
2
2
2
3
3
3
3
3
3
3
1
1
1
1
1
1
1
2
2
2
2
2
2
2
3
3
3
3
3
3
3
1
1
1
1
1
5
6
7
1
2
3
4
5
6
7
1
2
3
4
5
6
7
1
2
3
4
5
6
7
1
2
3
4
5
6
7
1
2
3
4
5
6
7
1
2
3
4
5
0.94
0.94
0.94
0.94
0.94
0.94
0.94
0.94
0.94
0.94
0.94
0.94
0.94
0.94
0.94
0.94
0.94
0.97
0.97
0.97
0.97
0.97
0.97
0.97
0.97
0.97
0.97
0.97
0.97
0.97
0.97
0.97
0.97
0.97
0.97
0.97
0.97
0.97
0.96
0.96
0.96
0.96
0.96
2.08
2.51
2.57
3.42
0.61
2.28
0.25
-0.55
-0.55
-0.90
-0.25
0.61
0.38
0.52
1.26
0.78
1.36
1.38
1.33
1.10
0.39
2.72
2.31
0.98
0.87
1.98
1.16
1.01
0.70
0.98
1.27
2.03
1.98
2.05
2.76
1.77
1.12
2.04
-0.84
-0.18
-0.47
-0.46
-0.06
0
13
3.6
0
0
0
0
0
0
0
0
3.4
0
2.3
1.6
0
7.4
11
4.5
10
13
0
0.96
0
36
25
6.3
0
0
4.9
0
14
7.0
0.90
5.5
20
0
8.0
450
820
940
180
260
0
70
19
0
0
0
0
0
0
0
0
5.1
0
3.2
3.7
0
18
27
11
21
17
0
4.6
0
64
96
14
0
0
9.5
0
56
27
3.6
36
68
0
32
260
730
690
130
250
120
Holland Marsh
1
1
1
1
1
1
1
1
1
1
1
1
1
1
1
1
2
2
2
2
2
2
2
2
2
2
2
2
2
2
2
2
2
2
2
2
2
1
1
1
1
1
1
1
1
2
2
2
2
2
2
2
3
3
3
3
3
3
3
1
1
1
1
1
1
1
2
2
2
2
2
2
2
3
3
3
3
3
3
3
1
1
1
1
1
1
6
7
1
2
3
4
5
6
7
1
2
3
4
5
6
7
1
2
3
4
5
6
7
1
2
3
4
5
6
7
1
2
3
4
5
6
7
1
2
3
4
5
6
0.96
0.96
0.96
0.96
0.96
0.96
0.96
0.96
0.96
0.96
0.96
0.96
0.96
0.96
0.96
0.96
0.96
0.96
0.96
0.96
0.96
0.96
0.96
0.96
0.96
0.96
0.96
0.96
0.96
0.96
0.96
0.96
0.96
0.96
0.96
0.96
0.96
1.06
1.06
1.06
1.06
1.06
1.06
0.06
-0.40
-0.33
0.09
0.27
-0.32
-0.56
-0.13
-0.34
-0.36
0.09
0.44
-0.06
-0.66
-0.21
0.02
0.08
0.24
-0.24
0.14
0.49
0.39
0.67
-0.02
0.00
0.54
-0.23
0.40
-0.03
0.33
-0.40
0.00
0.22
0.38
0.55
0.38
0.62
2.19
2.82
3.14
1.57
2.60
2.36
140
700
2200
1300
130
60
120
100
4
1300
630
210
130
40
36
16
860
940
1800
84
430
100
16
1900
1400
740
44
88
56
150
5600
2000
1200
350
48
690
480
30
13
11
19
90
0
140
530
1800
1400
160
48
85
91
2.6
1100
670
280
130
26
30
17
910
1100
1500
91
0600
140
26
1900
1400
1100
36
110
55
190
4300
2000
1400
450
67
890
730
140
100
110
60
590
0
121
Millgrove
1
1
1
1
1
1
1
1
1
1
1
1
1
1
1
2
2
2
2
2
2
2
2
2
2
2
2
2
2
2
2
2
2
2
2
2
1
1
1
1
1
1
1
1
2
2
2
2
2
2
2
3
3
3
3
3
3
3
1
1
1
1
1
1
1
2
2
2
2
2
2
2
3
3
3
3
3
3
3
1
1
1
1
1
1
1
7
1
2
3
4
5
6
7
1
2
3
4
5
6
7
1
2
3
4
5
6
7
1
2
3
4
5
6
7
1
2
3
4
5
6
7
1
2
3
4
5
6
7
1.06
1.06
1.06
1.06
1.06
1.06
1.06
1.06
1.06
1.06
1.06
1.06
1.06
1.06
1.06
1.11
1.11
1.11
1.11
1.11
1.11
1.11
1.11
1.11
1.11
1.11
1.11
1.11
1.11
1.11
1.11
1.11
1.11
1.11
1.11
1.11
0.95
0.95
0.95
0.95
0.95
0.95
0.95
3.28
2.94
2.35
1.61
1.66
2.67
1.73
2.46
3.72
2.35
4.61
4.73
2.31
2.25
1.93
-0.03
-0.34
1.51
-0.49
0.97
1.31
-0.50
0.11
-0.10
-0.06
0.14
1.98
0.22
0.98
-0.09
-0.10
0.01
0.10
0.34
-0.04
-0.95
0.82
1.18
0.31
0.87
1.10
0.92
0.87
57
85
60
5.6
3.0
7
0
32.0
43
36
170
2
330
0
4.2
45
0
0
52
26
19
49
30
0
23
6.7
6.6
15
43
0
26
28
0
0
15
16
280
120
52
1100
64
140
48
610
720
330
18
10.0
50
0
12
640
200
4800
73
1700
0
17
44
0
0
36
54
49
34
33
0
22
7.5
29
18
89
0
24
28
0
0
14
8.0
480
270
66
200
130
260
89
122
1
1
1
1
1
1
1
1
1
1
1
1
1
1
2
2
2
2
2
2
2
2
2
2
2
2
2
2
2
2
2
2
2
2
2
1spore concentration x 1000
2
2
2
2
2
2
2
3
3
3
3
3
3
3
1
1
1
1
1
1
1
2
2
2
2
2
2
2
3
3
3
3
3
3
3
1
2
3
4
5
6
7
1
2
3
4
5
6
7
1
2
3
4
5
6
7
1
2
3
4
5
6
7
1
2
3
4
5
6
7
0.95
0.95
0.95
0.95
0.95
0.95
0.95
0.95
0.95
0.95
0.95
0.95
0.95
0.95
0.91
0.91
0.91
0.91
0.91
0.91
0.91
0.91
0.91
0.91
0.91
0.91
0.91
0.91
0.91
0.91
0.91
0.91
0.91
0.91
0.91
1.00
0.62
1.18
1.09
1.26
0.97
-0.22
0.51
0.62
0.84
2.02
0.94
0.82
0.55
0.31
-0.29
-0.70
-0.09
-0.09
0.39
1.49
0.42
1.10
1.34
1.84
0.69
1.00
1.10
1.05
1.10
1.06
1.57
1.44
1.08
1.42
1700
52
160
88
120
120
0
380
72
180
52
84
140
84
140
210
830
1400
22000
1300
10000
1900
220
520
440
510
520
260
950
400
620
360
260
380
170
3200
77
340
190
280
230
0
540
110
330
200
160
250
120
170
180
530
1300
21000
1600
26000
2500
460
1300
1500
800
990
540
1900
810
1200
990
650
750
430
123
Table A2.7. Manual counts compared to qPCR
Source
df
Treatment (T)
10
Manual vs qPCR
(1)
Error
22
Mean Square
44298650568
6771
551906
F value
8.03
0.50
Pr>F
<0.0001
0.49
124
APPENDIX 3: SUPPLEMENTARY TABLES FOR CHAPTER THREE
Table A3.1. Clubroot incidence: 2013
Source
df
Block (B)
3
Seeding Date (S)
7
Time (T)
1
TxS
(7)
Error
189
Mean Square
1200
1242
35529
1268
673
F value
1.78
1.85
52.80
1.88
Pr>F
0.15
0.08
<0.0001
0.07
Table A3.2. Disease severity index: 2013
Source
df
Block (B)
3
Seeding Date (S)
7
Time (T)
1
TxS
(7)
Error
189
Mean Square
1323
1057
28445
1149
680
F value
1.95
1.56
41.84
1.69
Pr>F
0.12
0.15
<0.0001
0.11
Table A3.3. Clubroot Incidence: 2014
Source
Block (B)
Seeding Date (S)
Time (T)
TxS
Error
df
3
7
1
(7)
93
Mean Square
21
3087
58163
4354
349
F value
0.06
8.83
166.43
12.46
Pr>F
0.98
<0.0001
<0.0001
<0.0001
Table A3.4. Disease Severity Index: 2014
Source
df
Block (B)
3
Seeding Date (S)
7
Time (T)
1
TxS
(7)
Error
93
Mean Square
20
1873
53272
3678
245
F value
0.08
7.65
217.56
15.02
Pr>F
0.97
<0.0001
<0.0001
<0.0001
125
Table A3.5. Observed and predicted values of clubroot incidence and disease severity and
incidence over time of Chinese Flowering cabbage (1999, 2000, 2001, 2002, 2008 and 2009) and
canola (2011, 2012, 2013 and 2014) using regression equations:
CI = -91.77 + 5.69 × (Air temperature 7-21 days after seeding) + 0.18 × (Total precipitation with
a 1-week delay)
DSI = -70.50 + 4.11 × (Air temperature 7-21 days after seeding) + 0.17 × (Total precipitation
with a 1-week delay)
Seeding Date
Observed
DI
Predicted
+/-
Observed
DS
Predicted
+/-
1999-06-01
1999-08-09
2000-06-12
2000-08-24
2001-05-24
2001-05-30
2001-06-01
2001-06-01
2001-06-25
2001-07-25
2001-08-23
2002-05-21
2002-05-24
2002-05-24
2002-06-24
2008-05-13
2008-06-11
2008-07-09
2008-08-06
2008-09-03
2009-05-13
2009-06-11
2009-07-08
2009-08-05
2009-09-02
2011-05-25
2011-06-11
2011-06-22
2012-05-02
2012-05-16
2012-05-30
2012-06-13
2012-06-27
2012-07-11
45.40
1.90
22.50
0.00
38.30
13.30
59.20
31.70
1.70
25.00
50.80
50.80
50.90
24.20
21.70
6.80
36.00
63.80
0.80
0.20
18.00
68.00
60.00
17.00
0.00
15.50
12.98
28.98
31.86
38.66
49.55
66.00
46.66
44.66
22.70
34.97
45.87
25.07
27.40
27.40
42.68
19.83
25.88
28.30
24.85
24.85
31.83
36.70
27.34
7.36
43.95
66.18
30.26
-0.48
4.79
34.40
39.48
33.87
10.35
25.13
27.81
41.35
7.01
18.30
39.37
47.23
67.59
61.37
-22.70
33.07
23.37
25.07
-10.90
14.10
-16.52
-11.87
24.18
3.30
-25.95
-25.95
-19.07
12.50
5.64
0.56
7.95
2.38
29.46
-0.68
-13.21
-33.60
-20.52
16.87
10.35
9.63
14.83
12.37
-24.85
-20.36
-10.18
-18.77
20.93
16.71
26.20
0.50
11.11
0.00
22.80
8.30
35.60
15.60
0.60
17.20
33.60
33.60
33.60
19.20
12.00
3.00
28.90
48.10
0.40
0.80
10.00
43.00
36.00
6.00
0.00
7.33
5.40
10.80
11.24
15.77
37.11
37.11
22.88
25.88
13.98
25.75
36.12
17.94
18.29
18.29
28.38
12.77
19.09
22.73
19.76
19.76
19.60
24.08
17.94
3.88
31.99
51.01
21.78
-2.04
3.64
25.03
30.93
21.51
7.17
17.66
18.30
28.17
3.00
11.48
26.17
33.08
51.38
47.47
-12.22
25.25
25.01
17.94
-4.51
9.99
-7.22
-2.83
18.49
5.53
-13.84
-13.84
-14.00
4.88
5.94
0.88
3.09
2.91
21.38
-2.84
-6.36
-17.97
-5.07
15.51
7.17
10.33
12.90
17.37
-8.24
-4.29
-10.94
-4.03
28.50
21.59
126
Seeding Date
Observed
DI
Predicted
2013-05-02
2013-05-15
2013-05-30
2013-06-12
2013-06-26
2013-07-09
2013-07-24
2013-08-07
2014-05-08
2014-05-22
2014-06-04
2014-06-18
2014-07-03
2014-07-16
2014-07-30
2014-08-15
3.00
26.00
31.00
51.50
32.50
21.00
8.00
43.50
5.00
84.50
81.40
97.06
100.00
100.00
25.50
95.00
17.03
13.78
29.72
47.16
66.93
40.80
28.82
32.42
13.67
28.41
50.73
46.61
34.33
30.38
21.68
43.64
+/-
14.03
-12.22
-1.28
-4.34
34.43
19.80
20.82
-11.08
8.67
-56.09
-30.67
-50.45
-65.67
-69.62
-3.82
-51.36
Observed
DS
Predicted
+/-
1.17
16.67
22.83
41.33
30.00
10.50
5.83
31.83
3.83
63.67
75.14
94.95
100.00
100.00
22.83
68.50
15.59
10.32
23.78
34.63
50.70
28.95
20.88
22.14
11.67
21.67
41.91
34.08
24.93
22.13
14.86
32.37
14.42
-6.35
0.95
-6.70
20.70
18.45
15.05
-9.69
7.84
-42.00
-33.23
-60.87
-75.07
-77.87
-7.97
-36.13
Table A3.6. Linear correlations (Prob > r) among mean air temperature, air degree days, rainfall
and soil moisture for 47 seeding dates of Chinese flowering cabbage and canola cv. ‘InVigor
5030 LL’ grown at the Holland Marsh, ON, 1999, 2000, 2001, 2002, 2008, 2009, 2011, 2012,
2013 and 20141
Disease
Parameter Incidence
Disease
Incidence
Disease
Severity
AUDPCDI
AUDPCDS
AUDPSDI
AUDPSDS
Temp
2 WAS
Temp
Temp
Temp
3 WAS 7-14DAS 7-21DAS
1.00000
0.95341 0.86756 0.84131 0.78258 0.77544 0.25593 0.29161 0.27960 0.31587
<.0001 <.0001 <.0001 <.0001 <.0001 0.0825
0.0467
0.0570
0.0305
47
47
25
25
25
25
47
47
47
47
Disease
Severity
0.95341 1.00000 0.86453 0.91337 0.78533 0.85208 0.18607
<.0001
<.0001 <.0001 <.0001 <.0001 0.2105
47
47
25
25
25
25
47
0.21109 0.20194 0.22760
0.1544
0.1734
0.1239
47
47
47
AUDPCDI
0.86756 0.86453 1.00000 0.93965 0.98637 0.93591 0.35343 0.40013 0.32317 0.38772
<.0001 <.0001
<.0001 <.0001 <.0001 0.0831
0.0475
0.1151 0.0555
25
25
25
25
25
25
25
25
25
25
AUDPCDS
0.84131 0.91337 0.93965 1.00000
<.0001 <.0001 <.0001
25
25
25
25
0.91199 0.99008 0.25933 0.27021 0.24794 0.26248
<.0001 <.0001 0.2106
0.1914
0.2321
0.2050
25
25
25
25
25
25
AUDPSDI
0.78258 0.78533 0.98637
<.0001 <.0001 <.0001
25
25
25
0.91199 1.00000 0.92954 0.38576 0.42805 0.33267 0.39832
<.0001
<.0001 0.0568
0.0328
0.1042
0.0486
25
25
25
25
25
25
25
AUDPSDS
0.77544 0.85208 0.93591 0.99008 0.92954 1.00000 0.27226 0.27833 0.24381 0.25741
<.0001 <.0001 <.0001 <.0001 <.0001
0.1880
0.1779
0.2402
0.2142
25
25
25
25
25
25
25
25
25
25
Temp
2 WAS
0.25593 0.18607 0.35343 0.25933 0.38576 0.27226 1.00000 0.95105 0.92161 0.86449
0.0825
0.2105
0.0831
0.2106
0.0568
0.1880
<.0001 <.0001 <.0001
47
47
25
25
25
25
47
47
47
47
127
Temp
3 WAS
0.29161
0.0467
47
0.21109 0.40013 0.27021 0.42805 0.27833 0.95105 1.00000 0.88248 0.95108
0.1544
0.0475
0.1914
0.0328
0.1779
<.0001
<.0001 <.0001
47
25
25
25
25
47
47
47
47
Temp
7-14DAS
0.27960 0.20194 0.32317 0.24794 0.33267 0.24381 0.92161 0.88248 1.00000 0.91352
0.0570
0.1734
0.1151 0.2321
0.1042
0.2402
<.0001 <.0001
<.0001
47
47
25
25
25
25
47
47
47
47
Temp
7-21DAS
0.31587 0.22760 0.38772 0.26248 0.39832 0.25741 0.86449 0.95108 0.91352 1.00000
0.0305
0.1239
0.0555
0.2050
0.0486
0.2142
<.0001 <.0001 <.0001
47
47
25
25
25
25
47
47
47
47
Temp
14-21
DAS
0.21118 0.14573 0.30795 0.16870 0.32219 0.16615 0.52873 0.75727 0.52157 0.81370
0.1542
0.3284
0.1342
0.4202
0.1163 0.4273
0.0001
<.0001 0.0002
<.0001
47
47
25
25
25
25
47
47
47
47
Temp
2 WBS
0.04984 -0.06602 -0.09600 -0.22149 -0.05987 -0.19652 0.14019 0.10201 0.18440
0.7394
0.6593
0.6480
0.2873
0.7762
0.3464
0.3473
0.4950
0.2147
47
47
25
25
25
25
47
47
47
0.11988
0.4222
47
Temp
3 WBS
0.09657 -0.02463 0.00917 -0.14902 0.04880 -0.12119 0.27292 0.24852 0.33563 0.28200
0.5185
0.8695
0.9653
0.4771
0.8168
0.5639
0.0634
0.0921
0.0211 0.0548
47
47
25
25
25
25
47
47
47
47
Temp
5-10 DBS
0.08847 0.00282 -0.01935 -0.10425 0.01398 -0.08173 0.19354 0.12095 0.26245 0.14536
0.5543
0.9850
0.9269
0.6199
0.9471
0.6977
0.1924
0.4180
0.0747
0.3296
47
47
25
25
25
25
47
47
47
47
Temp -0.11343 -0.19800 -0.23543 -0.34684 -0.19131 -0.32332
10-15
0.4477
0.1822
0.2572
0.0894
0.3596
0.1149
DBS
47
47
25
25
25
25
0.30486 0.29508 0.28825 0.27522
0.0372
0.0441
0.0494
0.0612
47
47
47
47
Temp -0.00057 -0.09590 -0.11342 -0.22647 -0.07169 -0.20021
5-15
0.9970
0.5214
0.5893
0.2763
0.7334
0.3373
DBS
47
47
25
25
25
25
0.25480 0.20726
0.0839
0.1622
47
47
0.29114 0.21489
0.0471
0.1469
47
47
Total DD
0.18783 0.05674 0.19801 0.02792 0.24400 0.05196 0.73213 0.76784 0.73907 0.77234
0.2061
0.7048
0.3427
0.8946
0.2398
0.8052
<.0001 <.0001 <.0001 <.0001
47
47
25
25
25
25
47
47
47
47
Total DD
(7 day
delay)
0.16390 0.02782 0.14712 -0.02464 0.18484 -0.00586 0.60352 0.65298 0.67934 0.71338
0.2710
0.8527
0.4828
0.9069
0.3764
0.9778
<.0001 <.0001 <.0001 <.0001
47
47
25
25
25
25
47
47
47
47
DD
2 WAS
0.21432 0.13496 0.31084 0.20651
0.1480
0.3657
0.1304
0.3220
47
47
25
25
DD
3 WAS
0.25562 0.16474 0.36536
0.0829
0.2685
0.0725
47
47
25
0.35112 0.22387 0.98438 0.93826 0.88824 0.83990
0.0853
0.2820
<.0001 <.0001 <.0001 <.0001
25
25
47
47
47
47
0.22118 0.39903 0.23256 0.92272 0.98697 0.84130 0.93380
0.2880
0.0482
0.2633
<.0001 <.0001 <.0001 <.0001
25
25
25
47
47
47
47
DD
7-14 DAS
0.21782 0.13370 0.26234 0.18194 0.27919 0.18050
0.1413
0.3703
0.2052
0.3841
0.1765
0.3879
47
47
25
25
25
25
DD
7-21 DAS
0.26588 0.17007 0.34345 0.20476 0.35932 0.20205 0.82937 0.93683 0.86470 0.98271
0.0709
0.2531
0.0928
0.3262
0.0777
0.3328
<.0001 <.0001 <.0001 <.0001
47
47
25
25
25
25
47
47
47
47
DD
14-21
DAS
DD
2 WBS
0.20429 0.12756
0.1684
0.3928
47
47
0.91157 0.87544 0.97776 0.89870
<.0001 <.0001 <.0001 <.0001
47
47
47
47
0.29118 0.14229 0.30607 0.14058 0.51084 0.74504 0.50136 0.80176
0.1579
0.4975
0.1368
0.5027
0.0002
<.0001 0.0003
<.0001
25
25
25
25
47
47
47
47
0.05142 -0.08299 -0.10498 -0.24521 -0.07789 -0.22700 0.14297 0.12510 0.18859 0.15001
0.7314
0.5792
0.6175
0.2374
0.7113 0.2752
0.3377
0.4021
0.2043
0.3142
47
47
25
25
25
25
47
47
47
47
128
DD
3 WBS
0.07645 -0.05981 -0.01323 -0.18602 0.02235 -0.16142 0.29045 0.28595 0.35231 0.32448
0.6095
0.6896
0.9500
0.3733
0.9156
0.4408
0.0476
0.0514
0.0152
0.0261
47
47
25
25
25
25
47
47
47
47
DD
5-10 DBS
0.14865 0.03719 0.00602 -0.10087 0.02076 -0.09132 0.24395 0.18689 0.31973 0.22030
0.3186
0.8040
0.9772
0.6314
0.9216
0.6642
0.0984
0.2084
0.0285
0.1367
47
47
25
25
25
25
47
47
47
47
DD
10-15
DBS
0.23086 0.21465 0.15848 0.13986 0.17516 0.15339 0.30745 0.30659 0.23855 0.25185
0.1185 0.1474
0.4493
0.5049
0.4023
0.4641
0.0355
0.0361
0.1064
0.0877
47
47
25
25
25
25
47
47
47
47
DD -0.01789 -0.12683 -0.12079 -0.24919 -0.08760 -0.22907
5-15 DBS
0.9050
0.3956
0.5652
0.2297
0.6771
0.2707
47
47
25
25
25
0.28176 0.25086 0.31646 0.26190
0.0550
0.0890
0.0302
0.0754
25
47
47
47
47
SM -0.57447 -0.55866 -0.41597 -0.50180 -0.33446 -0.47416 -0.14337 -0.15429 -0.18402 -0.18229
0.0081
0.0105
0.1391
0.0675
0.2425
0.0867
0.5465
0.5160
0.4374
0.4418
2 WAS
20
20
14
14
14
14
20
20
20
20
SM -0.51913 -0.52634 -0.32190 -0.43662 -0.23035 -0.39844 -0.06154 -0.08292 -0.12044 -0.12750
3 WAS
0.0190
0.0171
0.2617
0.1185 0.4282
0.1582
0.7966
0.7282
0.6130
0.5922
20
20
14
14
14
14
20
20
20
20
SM -0.59723 -0.57049 -0.53432 -0.57260 -0.48439 -0.57027 -0.24349 -0.23814 -0.27095 -0.25051
5-10 DAS
0.0054
0.0086
0.0490
0.0324
0.0792
0.0332
0.3009
0.3120
0.2479
0.2867
20
20
14
14
14
14
20
20
20
20
SM -0.55387 -0.52154 -0.34495 -0.43537 -0.25262 -0.40140 -0.13735 -0.13257 -0.22103 -0.18320
5-15 DAS
0.0113 0.0184
0.2271
0.1197 0.3836
0.1549
0.5636
0.5774
0.3490
0.4395
20
20
14
14
14
14
20
20
20
20
SM -0.46055 -0.42519 -0.14899 -0.27278 -0.02919 -0.21464 -0.03517 -0.03232 -0.16014 -0.11185
10-15
0.0410
0.0616
0.6112 0.3454
0.9211 0.4612
0.8830
0.8924
0.5000
0.6387
DAS
20
20
14
14
14
14
20
20
20
20
SM -0.36086 -0.50580 -0.25317 -0.49796 -0.17644 -0.47485
0.1180 0.0229
0.3825
0.0700
0.5462
0.0862
2 WBS
20
20
14
14
14
0.18656
0.4310
14
20
0.37311 0.12728 0.38852
0.1052
0.5928
0.0905
20
20
20
SM -0.29962 -0.45416 -0.18635 -0.43900 -0.11664 -0.41982
0.1994
0.0443
0.5236
0.1163 0.6913
0.1351
3 WBS
20
20
14
14
14
0.25808 0.40779 0.15848 0.38457
0.2719
0.0743
0.5046
0.0941
14
20
20
20
20
Season -0.07555 -0.01231
Rainfall
0.6137
0.9346
47
Season
Rainfall
(7 day
delay)
0.06962 0.04344 0.10400 0.06062 -0.32283 -0.28725 -0.41662 -0.33885
0.7409
0.8367
0.6208
0.7735
0.0269
0.0503
0.0036
0.0198
47
25
25
25
25
47
47
47
47
0.03407 0.08879 0.25333 0.19827 0.28706 0.20535 -0.29561 -0.24279 -0.36828 -0.27477
0.8202
0.5529
0.2218
0.3421
0.1641
0.3248
0.0437
0.1001
0.0109
0.0616
47
47
25
25
25
25
47
47
47
47
Rain -0.12642 -0.05465
2 WAS
0.3971
0.7152
47
Rain
3 WAS
0.00176 0.04218 0.03588 0.07254 -0.14504 -0.13793 -0.15296 -0.13858
0.9934
0.8413
0.8648
0.7304
0.3307
0.3552
0.3047
0.3529
47
25
25
25
25
47
47
47
47
0.03650 0.07483 0.13866 0.16653 0.16615 0.19075 -0.26580 -0.25605 -0.31338 -0.28292
0.8076
0.6171
0.5086
0.4263
0.4273
0.3611 0.0709
0.0823
0.0320
0.0540
47
47
25
25
25
25
47
47
47
47
Rain -0.20620 -0.15990 -0.02633 -0.12580
2 WBS
0.1644
0.2830
0.9006
0.5491
47
47
25
0.02209 -0.10127 -0.27731 -0.20638 -0.36318 -0.24246
0.9165
0.6300
0.0591
0.1640
0.0121
0.1006
25
25
25
47
47
47
47
129
Rain -0.09277 -0.08578
3 WBS
0.5351
0.5664
47
Parameter
Temp
14-21
DAS
0.01783 -0.09095 0.03312 -0.09722 -0.28480 -0.21758 -0.38788 -0.26733
0.9326
0.6655
0.8751
0.6439
0.0523
0.1418
0.0071
0.0693
47
25
25
25
25
47
47
47
47
Temp
2 WBS
Temp
Temp
3 WBS 5-10 DBS
Temp
10-15
DBS
Temp
Total DD
5-15
(7 day
DBS Total DD
delay)
DD
2 WAS
DD
3 WAS
Disease
Incidence
0.21118 0.04984 0.09657 0.08847 -0.11343 -0.00057 0.18783 0.16390 0.21432 0.25562
0.1542
0.7394
0.5185
0.5543
0.4477
0.9970
0.2061
0.2710
0.1480
0.0829
47
47
47
47
47
47
47
47
47
47
Disease
Severity
0.14573 -0.06602 -0.02463 0.00282 -0.19800 -0.09590 0.05674 0.02782 0.13496 0.16474
0.3284
0.6593
0.8695
0.9850
0.1822
0.5214
0.7048
0.8527
0.3657
0.2685
47
47
47
47
47
47
47
47
47
47
AUDPCDI
0.30795 -0.09600 0.00917 -0.01935 -0.23543 -0.11342 0.19801 0.14712 0.31084 0.36536
0.1342
0.6480
0.9653
0.9269
0.2572
0.5893
0.3427
0.4828
0.1304
0.0725
25
25
25
25
25
25
25
25
25
25
AUDPCDS
0.16870 -0.22149 -0.14902 -0.10425 -0.34684 -0.22647 0.02792 -0.02464 0.20651
0.4202
0.2873
0.4771
0.6199
0.0894
0.2763
0.8946
0.9069
0.3220
25
25
25
25
25
25
25
25
25
0.22118
0.2880
25
AUDPSDI
0.32219 -0.05987 0.04880 0.01398 -0.19131 -0.07169 0.24400 0.18484
0.1163 0.7762
0.8168
0.9471
0.3596
0.7334
0.2398
0.3764
25
25
25
25
25
25
25
25
AUDPSDS
0.16615 -0.19652 -0.12119 -0.08173 -0.32332 -0.20021 0.05196 -0.00586 0.22387 0.23256
0.4273
0.3464
0.5639
0.6977
0.1149 0.3373
0.8052
0.9778
0.2820
0.2633
25
25
25
25
25
25
25
25
25
25
Temp
2 WAS
0.52873 0.14019 0.27292 0.19354 0.30486 0.25480 0.73213 0.60352 0.98438 0.92272
0.0001
0.3473
0.0634
0.1924
0.0372
0.0839
<.0001 <.0001 <.0001 <.0001
47
47
47
47
47
47
47
47
47
47
Temp
3 WAS
0.75727 0.10201 0.24852 0.12095 0.29508 0.20726 0.76784 0.65298 0.93826 0.98697
<.0001 0.4950
0.0921
0.4180
0.0441
0.1622
<.0001 <.0001 <.0001 <.0001
47
47
47
47
47
47
47
47
47
47
Temp
7-14DAS
0.52157 0.18440 0.33563 0.26245 0.28825
0.0002
0.2147
0.0211 0.0747
0.0494
47
47
47
47
47
Temp
7-21DAS
0.81370
<.0001
47
Temp
14-21
DAS
0.29114 0.73907 0.67934 0.88824 0.84130
0.0471
<.0001 <.0001 <.0001 <.0001
47
47
47
47
47
0.11988 0.28200 0.14536 0.27522 0.21489 0.77234 0.71338 0.83990 0.93380
0.4222
0.0548
0.3296
0.0612
0.1469
<.0001 <.0001 <.0001 <.0001
47
47
47
47
47
47
47
47
47
1.00000 -0.00442 0.12594 -0.05850 0.19988 0.05312 0.60517 0.56599 0.52122 0.77395
0.9765
0.3989
0.6961
0.1780
0.7229
<.0001 <.0001 0.0002
<.0001
47
47
47
47
47
47
47
47
47
47
Temp -0.00442
2 WBS
0.9765
47
Temp
3 WBS
0.35112 0.39903
0.0853
0.0482
25
25
1.00000
0.95734 0.87973 0.82021 0.95702 0.64359 0.70458 0.17765 0.12322
<.0001 <.0001 <.0001 <.0001 <.0001 <.0001 0.2322
0.4093
47
47
47
47
47
47
47
47
47
0.12594 0.95734 1.00000 0.88344
0.3989
<.0001
<.0001
47
47
47
47
Temp -0.05850
5-10 DBS
0.6961
0.81110 0.95400 0.75130 0.80477 0.28890 0.25349
<.0001 <.0001 <.0001 <.0001 0.0489
0.0856
47
47
47
47
47
47
0.87973 0.88344 1.00000 0.62949 0.91398 0.62340 0.68242 0.19927
<.0001 <.0001
<.0001 <.0001 <.0001 <.0001 0.1793
47
47
47
47
47
47
47
47
47
Temp
10-15
DBS
0.19988 0.82021
0.1780
<.0001
47
47
0.11301
0.4495
47
0.81110 0.62949 1.00000 0.88421 0.66220 0.68162 0.33009 0.30985
<.0001 <.0001
<.0001 <.0001 <.0001 0.0235
0.0340
47
47
47
47
47
47
47
47
130
Temp
5-15
DBS
0.05312 0.95702 0.95400 0.91398 0.88421 1.00000 0.69982 0.74764 0.27371 0.21245
0.7229
<.0001 <.0001 <.0001 <.0001
<.0001 <.0001 0.0626
0.1517
47
47
47
47
47
47
47
47
47
47
Total DD
0.60517 0.64359 0.75130 0.62340 0.66220 0.69982 1.00000 0.97575 0.73725 0.76858
<.0001 <.0001 <.0001 <.0001 <.0001 <.0001
<.0001 <.0001 <.0001
47
47
47
47
47
47
47
47
47
47
Total DD
(7 day
delay)
0.56599 0.70458 0.80477 0.68242 0.68162 0.74764 0.97575 1.00000 0.60258 0.65184
<.0001 <.0001 <.0001 <.0001 <.0001 <.0001 <.0001
<.0001 <.0001
47
47
47
47
47
47
47
47
47
47
DD
2 WAS
0.52122 0.17765 0.28890 0.19927 0.33009 0.27371 0.73725 0.60258 1.00000 0.93710
0.0002
0.2322
0.0489
0.1793
0.0235
0.0626
<.0001 <.0001
<.0001
47
47
47
47
47
47
47
47
47
47
DD
3 WAS
0.77395 0.12322 0.25349
<.0001 0.4093
0.0856
47
47
47
0.11301 0.30985 0.21245 0.76858 0.65184 0.93710 1.00000
0.4495
0.0340
0.1517
<.0001 <.0001 <.0001
47
47
47
47
47
47
47
DD
7-14 DAS
0.52633 0.20448 0.33591 0.25409 0.30806 0.29767 0.74443 0.68188 0.91052 0.86333
0.0001
0.1680
0.0210
0.0848
0.0351
0.0421
<.0001 <.0001 <.0001 <.0001
47
47
47
47
47
47
47
47
47
47
DD
7-21 DAS
0.84532
<.0001
47
0.11949 0.26672
0.4237
0.0699
47
47
0.11748 0.28027 0.20221 0.76513 0.70619 0.83170 0.94703
0.4316
0.0564
0.1728
<.0001 <.0001 <.0001 <.0001
47
47
47
47
47
47
47
DD
14-21
DAS
0.99413 0.00104 0.12470 -0.06148 0.20241 0.05312 0.59721 0.56069 0.51373 0.77303
<.0001 0.9944
0.4036
0.6814
0.1724
0.7229
<.0001 <.0001 0.0002
<.0001
47
47
47
47
47
47
47
47
47
47
DD
2 WBS
0.04610 0.97717 0.92447 0.85327 0.80689 0.93075 0.65953 0.72343 0.17433 0.14378
0.7583
<.0001 <.0001 <.0001 <.0001 <.0001 <.0001 <.0001 0.2412
0.3350
47
47
47
47
47
47
47
47
47
47
DD
3 WBS
0.18557 0.93940 0.97948 0.86425 0.81455 0.94051 0.78508 0.83996 0.30274 0.29125
0.2117 <.0001 <.0001 <.0001 <.0001 <.0001 <.0001 <.0001 0.0386
0.0470
47
47
47
47
47
47
47
47
47
47
DD
5-10 DBS
0.00283 0.80417 0.81904 0.94283 0.56446 0.84570 0.62848 0.68226 0.23598 0.16934
0.9850
<.0001 <.0001 <.0001 <.0001 <.0001 <.0001 <.0001
0.1103 0.2552
47
47
47
47
47
47
47
47
47
47
DD
10-15
DBS
0.19513 0.62767 0.60313 0.46479 0.73551 0.66084 0.54158 0.52916 0.29636 0.29157
0.1887
<.0001 <.0001 0.0010
<.0001 <.0001 <.0001 0.0001
0.0431
0.0468
47
47
47
47
47
47
47
47
47
47
DD
5-15 DBS
0.11291 0.92042 0.91637 0.86897 0.88417 0.97137 0.72319 0.77047 0.29212 0.25072
0.4499
<.0001 <.0001 <.0001 <.0001 <.0001 <.0001 <.0001 0.0463
0.0892
47
47
47
47
47
47
47
47
47
47
SM -0.11361
0.6334
2 WAS
0.42473 0.45074 0.41524 0.31230 0.40158 0.19515 0.24950 -0.06501 -0.08780
0.0620
0.0461
0.0687
0.1801
0.0793
0.4096
0.2888
0.7854
0.7128
20
20
20
20
20
20
20
20
20
20
SM -0.07759
3 WAS
0.7451
0.44389 0.48300 0.42730 0.29325 0.40293 0.25626 0.29568 0.02151 -0.01475
0.0499
0.0310
0.0602
0.2095
0.0782
0.2755
0.2056
0.9283
0.9508
20
20
20
20
20
20
20
20
20
20
SM -0.14982
5-10 DAS
0.5284
0.30905 0.32635 0.29608 0.25706 0.30166 0.06473 0.12368 -0.17165 -0.17546
0.1849
0.1602
0.2050
0.2739
0.1962
0.7863
0.6034
0.4693
0.4594
20
20
20
20
20
20
20
20
20
20
SM -0.06611
5-15 DAS
0.7819
0.42557 0.45089 0.40021 0.31517 0.39397 0.20483 0.24581 -0.05627 -0.06612
0.0614
0.0460
0.0804
0.1759
0.0857
0.3863
0.2962
0.8137
0.7818
20
20
20
20
20
20
20
20
20
20
131
SM
10-15
DAS
0.00852 0.48615 0.51571 0.45321 0.33329 0.43605 0.30377 0.32527 0.04602 0.03080
0.9716
0.0298
0.0199
0.0448
0.1510
0.0546
0.1929
0.1617
0.8472
0.8974
20
20
20
20
20
20
20
20
20
20
SM
2 WBS
0.57777 0.35350 0.43413 0.18212 0.44618 0.32891 0.50802 0.52855 0.25839 0.44433
0.0076
0.1263
0.0558
0.4422
0.0486
0.1568
0.0222
0.0166
0.2714
0.0497
20
20
20
20
20
20
20
20
20
20
SM
3 WBS
0.54356 0.35967 0.43295 0.18393 0.41329 0.31482 0.52680 0.52068 0.33302 0.47717
0.0132
0.1193 0.0566
0.4376
0.0701
0.1764
0.0170
0.0186
0.1514
0.0334
20
20
20
20
20
20
20
20
20
20
Season -0.13310
Rainfall
0.3725
0.00693 -0.01672 -0.06567 -0.01053 -0.02354 -0.19843 -0.20744 -0.28386 -0.25180
0.9631
0.9112 0.6610
0.9440
0.8752
0.1812
0.1618
0.0532
0.0877
47
47
47
47
47
47
47
47
47
47
Season -0.06584 -0.04136 -0.06680 -0.11482 -0.09171 -0.09448 -0.16934 -0.17464 -0.25715 -0.20577
Rainfall
0.6602
0.7825
0.6555
0.4422
0.5398
0.5276
0.2551
0.2404
0.0810
0.1653
(7 day
47
47
47
47
47
47
47
47
47
47
delay)
Rain -0.05109
2 WAS
0.7331
0.24137 0.27516 0.15728 0.25809 0.23889 0.02295 0.04582 -0.14270 -0.13893
0.1022
0.0612
0.2911 0.0799
0.1058
0.8783
0.7598
0.3386
0.3517
47
47
47
47
47
47
47
47
47
47
Rain -0.15931
3 WAS
0.2848
47
0.11574 0.08388 -0.00126 0.04909 0.04476 -0.16836 -0.16843 -0.23166 -0.23024
0.4385
0.5751
0.9933
0.7432
0.7651
0.2579
0.2577
0.1172
0.1195
47
47
47
47
47
47
47
47
47
Rain -0.00737 -0.13067 -0.11016 -0.17869 -0.02048 -0.09771 -0.20106 -0.21069 -0.24630 -0.16655
2 WBS
0.9608
0.3813
0.4611 0.2295
0.8913
0.5135
0.1754
0.1552
0.0951
0.2632
47
47
47
47
47
47
47
47
47
47
Rain -0.06005 -0.05065 -0.09146 -0.12858 -0.05585 -0.07673 -0.20730 -0.22721 -0.23436 -0.16686
3 WBS
0.6885
0.7353
0.5409
0.3890
0.7092
0.6082
0.1621
0.1246
0.1128 0.2623
47
47
47
47
DD
DD
Parameter 7-14 DAS 7-21 DAS
DD
14-21
DAS
DD
2 WBS
47
47
DD
DD
3 WBS 5-10 DBS
47
47
47
47
DD
10-15
DD
DBS 5-15 DBS
SM
2 WAS
SM
3 WAS
Disease
Incidence
0.21782 0.26588 0.20429 0.05142 0.07645 0.14865 0.23086 -0.01789 -0.57447 -0.51913
0.1413
0.0709
0.1684
0.7314
0.6095
0.3186
0.1185 0.9050
0.0081
0.0190
47
47
47
47
47
47
47
47
20
20
Disease
Severity
0.13370 0.17007 0.12756 -0.08299 -0.05981 0.03719 0.21465 -0.12683 -0.55866 -0.52634
0.3703
0.2531
0.3928
0.5792
0.6896
0.8040
0.1474
0.3956
0.0105
0.0171
47
47
47
47
47
47
47
47
20
20
AUDPCDI
0.26234 0.34345
0.2052
0.0928
25
25
AUDPCDS
0.18194 0.20476 0.14229 -0.24521 -0.18602 -0.10087 0.13986 -0.24919 -0.50180 -0.43662
0.3841
0.3262
0.4975
0.2374
0.3733
0.6314
0.5049
0.2297
0.0675
0.1185
25
25
25
25
25
25
25
25
14
14
AUDPSDI
0.27919 0.35932 0.30607 -0.07789 0.02235 0.02076 0.17516 -0.08760 -0.33446 -0.23035
0.1765
0.0777
0.1368
0.7113 0.9156
0.9216
0.4023
0.6771
0.2425
0.4282
25
25
25
25
25
25
25
25
14
14
AUDPSDS
0.18050 0.20205 0.14058 -0.22700 -0.16142 -0.09132 0.15339 -0.22907 -0.47416 -0.39844
0.3879
0.3328
0.5027
0.2752
0.4408
0.6642
0.4641
0.2707
0.0867
0.1582
25
25
25
25
25
25
25
25
14
14
0.29118 -0.10498 -0.01323 0.00602 0.15848 -0.12079 -0.41597 -0.32190
0.1579
0.6175
0.9500
0.9772
0.4493
0.5652
0.1391
0.2617
25
25
25
25
25
25
14
14
132
Temp
2 WAS
0.91157 0.82937 0.51084 0.14297 0.29045 0.24395 0.30745 0.28176 -0.14337 -0.06154
<.0001 <.0001 0.0002
0.3377
0.0476
0.0984
0.0355
0.0550
0.5465
0.7966
47
47
47
47
47
47
47
47
20
20
Temp
3 WAS
0.87544 0.93683 0.74504 0.12510 0.28595 0.18689 0.30659 0.25086 -0.15429 -0.08292
<.0001 <.0001 <.0001 0.4021
0.0514
0.2084
0.0361
0.0890
0.5160
0.7282
47
47
47
47
47
47
47
47
20
20
Temp
7-14DAS
0.97776 0.86470 0.50136 0.18859 0.35231 0.31973 0.23855 0.31646 -0.18402 -0.12044
<.0001 <.0001 0.0003
0.2043
0.0152
0.0285
0.1064
0.0302
0.4374
0.6130
47
47
47
47
47
47
47
47
20
20
Temp
7-21DAS
0.89870 0.98271 0.80176 0.15001 0.32448 0.22030 0.25185 0.26190 -0.18229 -0.12750
<.0001 <.0001 <.0001 0.3142
0.0261
0.1367
0.0877
0.0754
0.4418
0.5922
47
47
47
47
47
47
47
47
20
20
Temp
14-21
DAS
0.52633 0.84532 0.99413 0.04610 0.18557 0.00283 0.19513
0.0001
<.0001 <.0001 0.7583
0.2117 0.9850
0.1887
47
47
47
47
47
47
47
0.11291 -0.11361 -0.07759
0.4499
0.6334
0.7451
47
20
20
Temp
2 WBS
0.20448
0.1680
47
Temp
3 WBS
0.33591 0.26672 0.12470 0.92447 0.97948 0.81904 0.60313 0.91637 0.45074 0.48300
0.0210
0.0699
0.4036
<.0001 <.0001 <.0001 <.0001 <.0001 0.0461
0.0310
47
47
47
47
47
47
47
47
20
20
Temp
5-10 DBS
0.25409
0.0848
47
0.11949 0.00104 0.97717 0.93940 0.80417 0.62767 0.92042 0.42473 0.44389
0.4237
0.9944
<.0001 <.0001 <.0001 <.0001 <.0001 0.0620
0.0499
47
47
47
47
47
47
47
20
20
0.11748 -0.06148 0.85327 0.86425 0.94283 0.46479 0.86897 0.41524 0.42730
0.4316
0.6814
<.0001 <.0001 <.0001 0.0010
<.0001 0.0687
0.0602
47
47
47
47
47
47
47
20
20
Temp
10-15
DBS
0.30806 0.28027 0.20241 0.80689 0.81455 0.56446 0.73551 0.88417 0.31230 0.29325
0.0351
0.0564
0.1724
<.0001 <.0001 <.0001 <.0001 <.0001 0.1801
0.2095
47
47
47
47
47
47
47
47
20
20
Temp
5-15
DBS
0.29767 0.20221 0.05312 0.93075 0.94051 0.84570 0.66084 0.97137 0.40158 0.40293
0.0421
0.1728
0.7229
<.0001 <.0001 <.0001 <.0001 <.0001 0.0793
0.0782
47
47
47
47
47
47
47
47
20
20
Total DD
0.74443 0.76513 0.59721 0.65953 0.78508 0.62848 0.54158 0.72319 0.19515 0.25626
<.0001 <.0001 <.0001 <.0001 <.0001 <.0001 <.0001 <.0001 0.4096
0.2755
47
47
47
47
47
47
47
47
20
20
Total DD
(7 day
delay)
0.68188 0.70619 0.56069 0.72343 0.83996 0.68226 0.52916 0.77047 0.24950 0.29568
<.0001 <.0001 <.0001 <.0001 <.0001 <.0001 0.0001
<.0001 0.2888
0.2056
47
47
47
47
47
47
47
47
20
20
DD
2 WAS
0.91052 0.83170 0.51373 0.17433 0.30274 0.23598 0.29636 0.29212 -0.06501 0.02151
<.0001 <.0001 0.0002
0.2412
0.0386
0.1103 0.0431
0.0463
0.7854
0.9283
47
47
47
47
47
47
47
47
20
20
DD
3 WAS
0.86333 0.94703 0.77303 0.14378 0.29125 0.16934 0.29157 0.25072 -0.08780 -0.01475
<.0001 <.0001 <.0001 0.3350
0.0470
0.2552
0.0468
0.0892
0.7128
0.9508
47
47
47
47
47
47
47
47
20
20
DD
7-14 DAS
1.00000
DD
7-21 DAS
0.88607 1.00000 0.84529 0.14660
<.0001
<.0001 0.3254
47
47
47
47
DD
14-21
DAS
0.88607 0.51677 0.19943 0.34871 0.29604
<.0001 0.0002
0.1790
0.0163
0.0433
47
47
47
47
47
47
0.21106 0.31337 -0.10098 -0.03257
0.1544
0.0320
0.6719
0.8916
47
47
20
20
0.31107 0.18271 0.22503 0.24454 -0.11425 -0.05931
0.0333
0.2190
0.1283
0.0976
0.6315
0.8038
47
47
47
47
20
20
0.51677 0.84529 1.00000 0.05297 0.18752 -0.00214 0.18533
0.0002
<.0001
0.7236
0.2069
0.9886
0.2123
47
47
47
47
47
47
47
0.11119 -0.07646 -0.04062
0.4568
0.7487
0.8650
47
20
20
133
DD
2 WBS
0.19943 0.14660 0.05297 1.00000 0.94673 0.83173 0.60777 0.93803 0.34475 0.36704
0.1790
0.3254
0.7236
<.0001 <.0001 <.0001 <.0001 0.1366
0.1114
47
47
47
47
47
47
47
47
20
20
DD
3 WBS
0.34871
0.0163
47
DD
5-10 DBS
DD
10-15
DBS
DD
5-15 DBS
0.31107 0.18752 0.94673 1.00000 0.84607 0.58863 0.94345 0.38443 0.42146
0.0333
0.2069
<.0001
<.0001 <.0001 <.0001 0.0942
0.0642
47
47
47
47
47
47
47
20
20
0.29604 0.18271 -0.00214 0.83173 0.84607 1.00000 0.39782 0.87104 0.20629 0.22514
0.0433
0.2190
0.9886
<.0001 <.0001
0.0056
<.0001 0.3829
0.3399
47
47
47
47
47
47
47
47
20
20
0.21106 0.22503 0.18533 0.60777 0.58863 0.39782 1.00000 0.64996
0.1544
0.1283
0.2123
<.0001 <.0001 0.0056
<.0001
47
47
47
47
47
47
47
47
0.31337 0.24454
0.0320
0.0976
47
47
0.01190 -0.06069
0.9603
0.7994
20
20
0.11119 0.93803 0.94345 0.87104 0.64996 1.00000 0.30974
0.4568
<.0001 <.0001 <.0001 <.0001
0.1839
47
47
47
47
47
47
20
SM -0.10098 -0.11425 -0.07646
0.6719
0.6315
0.7487
2 WAS
0.01190 0.30974 1.00000 0.97185
0.9603
0.1839
<.0001
20
20
20
20
SM -0.03257 -0.05931 -0.04062
3 WAS
0.8916
0.8038
0.8650
0.31125 0.97185 1.00000
0.1816
<.0001
20
20
20
20
20
20
20
0.34475 0.38443 0.20629
0.1366
0.0942
0.3829
20
20
20
20
0.31125
0.1816
20
0.36704 0.42146 0.22514 -0.06069
0.1114 0.0642
0.3399
0.7994
20
20
20
20
20
SM -0.19418 -0.18390 -0.11462
5-10 DAS
0.4120
0.4377
0.6304
20
20
0.23505 0.26522 0.09753 -0.01891 0.21945 0.96769 0.90086
0.3185
0.2584
0.6825
0.9369
0.3526
<.0001 <.0001
20
20
20
20
20
20
20
20
SM -0.13654 -0.11404 -0.03583
5-15 DAS
0.5660
0.6321
0.8808
20
20
SM -0.07739 -0.04749
10-15
0.7457
0.8424
DAS
20
20
0.33482 0.37583
0.1490
0.1025
20
20
20
0.16211 0.01634 0.28824 0.98181 0.97381
0.4947
0.9455
0.2178
<.0001 <.0001
20
20
20
20
20
0.03136 0.38841 0.43480 0.20150 0.04492 0.31873 0.89685 0.94249
0.8956
0.0906
0.0554
0.3943
0.8509
0.1708
<.0001 <.0001
20
20
20
20
20
20
20
20
SM
2 WBS
0.20837 0.47068 0.60632 0.40805 0.48644 0.20500 -0.04078 0.37917 0.54772 0.58518
0.3780
0.0362
0.0046
0.0741
0.0296
0.3859
0.8644
0.0992
0.0124
0.0067
20
20
20
20
20
20
20
20
20
20
SM
3 WBS
0.24196 0.46274 0.57121 0.40406 0.47610 0.18495 -0.06087 0.34926 0.55610 0.62363
0.3040
0.0399
0.0085
0.0772
0.0338
0.4350
0.7988
0.1312
0.0109
0.0033
20
20
20
20
20
20
20
20
20
20
Season -0.39207 -0.30762 -0.12723 -0.06271 -0.07829 -0.13888
Rainfall
0.0064
0.0354
0.3941
0.6754
0.6009
0.3519
47
47
47
47
47
0.00719 -0.06870 0.18901 0.17503
0.9618
0.6464
0.4248
0.4605
47
47
47
20
20
Season -0.34319 -0.24109 -0.05697 -0.08377 -0.09833 -0.16322 -0.07245 -0.12111
Rainfall
0.0182
0.1026
0.7037
0.5756
0.5108
0.2730
0.6284
0.4174
(7 day
47
47
47
47
47
47
47
47
delay)
0.11041 0.18631
0.6431
0.4316
20
20
Rain -0.16655 -0.15031 -0.05926
2 WAS
0.2632
0.3132
0.6923
47
47
0.14149 0.18917 0.02388 0.22885 0.15778 0.26442 0.22483
0.3428
0.2028
0.8734
0.1218
0.2895
0.2599
0.3406
47
47
47
47
47
47
20
20
Rain -0.29689 -0.26809 -0.16208
3 WAS
0.0427
0.0685
0.2764
47
47
0.03618 0.01057 -0.06518 0.01895 -0.01078 0.02299 0.13784
0.8092
0.9438
0.6634
0.8994
0.9427
0.9234
0.5622
47
47
47
47
47
47
20
20
134
Rain -0.34120 -0.19906
2 WBS
0.0189
0.1798
0.01569 -0.16698 -0.13333 -0.21834 -0.03980 -0.10937 0.25812 0.17950
0.9166
0.2619
0.3716
0.1404
0.7906
0.4643
0.2719
0.4489
47
47
47
47
47
47
47
20
20
47
Rain -0.36127 -0.22520 -0.03676 -0.06366 -0.10805 -0.13364 -0.03313 -0.07418
3 WBS
0.0126
0.1280
0.8062
0.6707
0.4697
0.3705
0.8250
0.6202
47
Parameter
SM
5-10
DAS
47
SM
5-15
DAS
47
SM
10-15
DAS
47
SM
2 WBS
SM
3 WBS
47
47
47
Total
Rainfall
T Rain
(7 day
delay)
Rain
2 WAS
0.21258 0.15659
0.3682
0.5097
47
20
20
Rain
3 WAS
Rain
2 WBS
Rain
3 WBS
Disease -0.5972 -0.5538 -0.4605 -0.3608 -0.2996 -0.0755 0.03407 -0.1264 0.03650 -0.2062 -0.0927
Incidence
3
7
5
6
2
5 0.8202
2 0.8076
0
7
0.0054
20
0.0113
20
0.0410
20
0.1180
20
0.1994
20
0.6137
47
47
0.3971
47
47
0.1644
47
0.5351
47
Disease -0.5704 -0.5215 -0.4251 -0.5058 -0.4541 -0.0123 0.08879 -0.0546 0.07483 -0.1599 -0.0857
Severity
9
4
9
0
6
1 0.5529
5 0.6171
0
8
0.0086
20
0.0184
20
0.0616
20
0.0229
20
0.0443
20
0.9346
47
47
0.7152
47
47
0.2830
47
0.5664
47
AUDPCDI
-0.5343 -0.3449 -0.1489 -0.2531 -0.1863 0.06962 0.25333 0.00176 0.13866 -0.0263 0.01783
2
5
9
7
5 0.7409 0.2218 0.9934 0.5086
3 0.9326
0.0490 0.2271 0.6112 0.3825 0.5236
25
25
25
25 0.9006
25
14
14
14
14
14
25
AUDPCDS
-0.5726 -0.4353 -0.2727 -0.4979 -0.4390 0.04344 0.19827 0.04218 0.16653 -0.1258 -0.0909
0
7
8
6
0 0.8367 0.3421 0.8413 0.4263
0
5
0.0324 0.1197 0.3454 0.0700 0.1163
25
25
25
25 0.5491 0.6655
14
14
14
14
14
25
25
AUDPSDI
-0.4843 -0.2526 -0.0291 -0.1764 -0.1166 0.10400 0.28706 0.03588 0.16615 0.02209 0.03312
9
2
9
4
4 0.6208 0.1641 0.8648 0.4273 0.9165 0.8751
0.0792 0.3836 0.9211 0.5462 0.6913
25
25
25
25
25
25
14
14
14
14
14
AUDPSDS
-0.5702 -0.4014 -0.2146 -0.4748 -0.4198 0.06062 0.20535 0.07254 0.19075 -0.1012 -0.0972
7
0
4
5
2 0.7735 0.3248 0.7304 0.3611
7
2
0.0332 0.1549 0.4612 0.0862 0.1351
25
25
25
25 0.6300 0.6439
14
14
14
14
14
25
25
Temp -0.2434 -0.1373 -0.0351 0.18656 0.25808 -0.3228 -0.2956 -0.1450 -0.2658 -0.2773 -0.2848
2 WAS
9
5
7 0.4310 0.2719
3
1
4
0
1
0
0.3009
20
0.5636
20
0.8830
20
20
20
0.0269
47
0.0437
47
0.3307
47
0.0709
47
0.0591
47
0.0523
47
Temp -0.2381 -0.1325 -0.0323 0.37311 0.40779 -0.2872 -0.2427 -0.1379 -0.2560 -0.2063 -0.2175
3 WAS
4
7
2 0.1052 0.0743
5
9
3
5
8
8
0.3120
20
0.5774
20
0.8924
20
20
20
0.0503
47
0.1001
47
0.3552
47
0.0823
47
0.1640
47
0.1418
47
Temp -0.2709 -0.2210 -0.1601 0.12728 0.15848 -0.4166 -0.3682 -0.1529 -0.3133 -0.3631 -0.3878
7-14DAS
5
3
4 0.5928 0.5046
2
8
6
8
8
8
0.2479
20
0.3490
20
0.5000
20
20
20
0.0036
47
0.0109
47
0.3047
47
0.0320
47
0.0121
47
0.0071
47
Temp -0.2505 -0.1832 -0.1118 0.38852 0.38457 -0.3388 -0.2747 -0.1385 -0.2829 -0.2424 -0.2673
7-21DAS
1
0
5 0.0905 0.0941
5
7
8
2
6
3
0.2867
20
0.4395
20
0.6387
20
20
20
0.0198
47
0.0616
47
0.3529
47
0.0540
47
0.1006
47
0.0693
47
135
Temp -0.1498 -0.0661 0.00852 0.57777 0.54356 -0.1331 -0.0658 -0.0510 -0.1593 -0.0073 -0.0600
14-21
2
1 0.9716 0.0076 0.0132
0
4
9
1
7
5
DAS 0.5284 0.7819
20
20
20 0.3725 0.6602 0.7331 0.2848 0.9608 0.6885
20
20
47
47
47
47
47
47
Temp 0.3090 0.42557 0.48615 0.35350 0.35967 0.00693 -0.0413 0.24137 0.11574 -0.1306 -0.0506
2 WBS
5 0.0614 0.0298 0.1263 0.1193 0.9631
6 0.1022 0.4385
7
5
0.1849
20
20
20
20
20
47
0.7825
47
47
47
0.3813
47
0.7353
47
Temp 0.3263 0.45089 0.51571 0.43413 0.43295 -0.0167 -0.0668 0.27516 0.08388
3 WBS
5 0.0460 0.0199 0.0558 0.0566
2
0 0.0612 0.5751
0.1602
20
20
20
20
20
0.9112
47
0.6555
47
47
-0.1101 -0.0914
6
6
47 0.4611 0.5409
47
47
Temp 0.2960 0.40021 0.45321 0.18212 0.18393 -0.0656 -0.1148 0.15728 -0.0012 -0.1786 -0.1285
5-10 DBS
8 0.0804 0.0448 0.4422 0.4376
7
2 0.2911
6
9
8
0.2050
20
20
20
20
20
0.6610
47
0.4422
47
47
0.9933
47
0.2295
47
0.3890
47
Temp 0.2570 0.31517 0.33329 0.44618 0.41329 -0.0105 -0.0917 0.25809 0.04909 -0.0204 -0.0558
10-15
6 0.1759 0.1510 0.0486 0.0701
3
1 0.0799 0.7432
8
5
DBS 0.2739
20
20
20
20 0.9440 0.5398
47
47 0.8913 0.7092
20
47
47
47
47
Temp 0.3016 0.39397 0.43605 0.32891 0.31482 -0.0235 -0.0944 0.23889 0.04476 -0.0977 -0.0767
5-15
6 0.0857 0.0546 0.1568 0.1764
4
8 0.1058 0.7651
1
3
DBS 0.1962
20
20
20
20 0.8752 0.5276
47
47 0.5135 0.6082
20
47
47
47
47
Total DD 0.0647 0.20483 0.30377 0.50802 0.52680 -0.1984 -0.1693 0.02295 -0.1683 -0.2010 -0.2073
3
0.7863
20
0.3863
20
0.1929
20
0.0222
20
0.0170
20
3
0.1812
47
4
0.2551
47
0.8783
47
6
0.2579
47
6
0.1754
47
0
0.1621
47
Total DD 0.1236 0.24581 0.32527 0.52855 0.52068 -0.2074 -0.1746 0.04582 -0.1684 -0.2106 -0.2272
(7 day
8 0.2962 0.1617 0.0166 0.0186
4
4 0.7598
3
9
1
delay) 0.6034
20
20
20
20 0.1618 0.2404
47 0.2577 0.1552 0.1246
20
47
47
47
47
47
DD -0.1716 -0.0562 0.04602 0.25839 0.33302 -0.2838 -0.2571 -0.1427 -0.2316 -0.2463 -0.2343
2 WAS
5
7 0.8472 0.2714 0.1514
6
5
0
6
0
6
0.4693
20
0.8137
20
20
20
20
0.0532
47
0.0810
47
0.3386
47
0.1172
47
0.0951
47
0.1128
47
DD -0.1754 -0.0661 0.03080 0.44433 0.47717 -0.2518 -0.2057 -0.1389 -0.2302 -0.1665 -0.1668
3 WAS
6
2 0.8974 0.0497 0.0334
0
7
3
4
5
6
0.4594
20
0.7818
20
20
20
20
0.0877
47
0.1653
47
0.3517
47
0.1195
47
0.2632
47
0.2623
47
DD -0.1941 -0.1365 -0.0773 0.20837 0.24196 -0.3920 -0.3431 -0.1665 -0.2968 -0.3412 -0.3612
7-14
8
4
9 0.3780 0.3040
7
9
5
9
0
7
DAS 0.4120 0.5660 0.7457
20
20 0.0064 0.0182 0.2632 0.0427 0.0189 0.0126
20
20
20
47
47
47
47
47
47
DD -0.1839 -0.1140 -0.0474 0.47068 0.46274 -0.3076 -0.2410 -0.1503 -0.2680 -0.1990 -0.2252
7-21
0
4
9 0.0362 0.0399
2
9
1
9
6
0
DAS 0.4377 0.6321 0.8424
20
20 0.0354 0.1026 0.3132 0.0685 0.1798 0.1280
20
20
20
47
47
47
47
47
47
DD -0.1146 -0.0358 0.03136 0.60632 0.57121 -0.1272 -0.0569 -0.0592 -0.1620 0.01569 -0.0367
14-21
2
3 0.8956 0.0046 0.0085
3
7
6
8 0.9166
6
DAS 0.6304 0.8808
20
20
20 0.3941 0.7037 0.6923 0.2764
47 0.8062
20
20
47
47
47
47
47
136
DD 0.2350 0.33482 0.38841 0.40805 0.40406 -0.0627 -0.0837 0.14149 0.03618 -0.1669 -0.0636
2 WBS
5 0.1490 0.0906 0.0741 0.0772
1
7 0.3428 0.8092
8
6
0.3185
20
20
20
20
20
0.6754
47
0.5756
47
47
47
0.2619
47
0.6707
47
DD 0.2652 0.37583 0.43480 0.48644 0.47610 -0.0782 -0.0983 0.18917 0.01057 -0.1333 -0.1080
3 WBS
2 0.1025 0.0554 0.0296 0.0338
9
3 0.2028 0.9438
3
5
0.2584
20
20
20
20
20
0.6009
47
0.5108
47
47
47
0.3716
47
0.4697
47
DD 0.0975 0.16211 0.20150 0.20500 0.18495 -0.1388 -0.1632 0.02388 -0.0651 -0.2183 -0.1336
5-10 DBS
3 0.4947 0.3943 0.3859 0.4350
8
2 0.8734
8
4
4
0.6825
20
20
20
20
20
0.3519
47
0.2730
47
47
0.6634
47
0.1404
47
0.3705
47
DD -0.0189 0.01634 0.04492 -0.0407 -0.0608 0.00719 -0.0724 0.22885 0.01895 -0.0398 -0.0331
10-15
1 0.9455 0.8509
8
7 0.9618
5 0.1218 0.8994
0
3
DBS 0.9369
20
20 0.8644 0.7988
47 0.6284
47
47 0.7906 0.8250
20
20
20
47
47
47
DD 0.2194 0.28824 0.31873 0.37917 0.34926 -0.0687 -0.1211 0.15778 -0.0107 -0.1093 -0.0741
5-15 DBS
5 0.2178 0.1708 0.0992 0.1312
0
1 0.2895
8
7
8
0.3526
20
20
20
20
20
0.6464
47
0.4174
47
47
0.9427
47
0.4643
47
0.6202
47
SM 0.9676 0.98181 0.89685 0.54772 0.55610 0.18901 0.11041 0.26442 0.02299 0.25812 0.21258
9 <.0001 <.0001 0.0124 0.0109 0.4248 0.6431 0.2599 0.9234 0.2719 0.3682
2 WAS
<.0001
20
20
20
20
20
20
20
20
20
20
20
SM 0.9008 0.97381 0.94249 0.58518 0.62363 0.17503 0.18631 0.22483 0.13784 0.17950 0.15659
3 WAS
6 <.0001 <.0001 0.0067 0.0033 0.4605 0.4316 0.3406 0.5622 0.4489 0.5097
<.0001
20
20
20
20
20
20
20
20
20
20
20
SM 1.0000 0.94064 0.79556 0.52510 0.52351 0.26283 0.10504 0.29229 0.00112 0.33304 0.32725
5-10
0 <.0001 <.0001 0.0174 0.0178 0.2629 0.6594 0.2111 0.9963 0.1513 0.1590
DAS
20
20
20
20
20
20
20
20
20
20
20
SM 0.9406 1.00000 0.95391 0.58859 0.60626 0.30126 0.24562 0.35062 0.14389 0.29612 0.26516
5-15
4
<.0001 0.0063 0.0046 0.1968 0.2966 0.1296 0.5450 0.2049 0.2585
DAS <.0001
20
20
20
20
20
20
20
20
20
20
20
SM 0.7955 0.95391 1.00000 0.58315 0.61733 0.30327 0.34371 0.37222 0.26045 0.22817 0.17871
10-15
6 <.0001
0.0070 0.0037 0.1937 0.1379 0.1061 0.2674 0.3333 0.4509
DAS <.0001
20
20
20
20
20
20
20
20
20
20
20
SM 0.5251 0.58859 0.58315 1.00000 0.97461 0.23969 0.35524 0.01029 0.05383 0.34318 0.48608
0 0.0063 0.0070
<.0001 0.3087 0.1243 0.9657 0.8217 0.1385 0.0298
2 WBS
0.0174
20
20
20
20
20
20
20
20
20
20
20
SM 0.5235 0.60626 0.61733 0.97461 1.00000 0.25460 0.40792 -0.0437 0.10808 0.29626 0.49202
1 0.0046 0.0037 <.0001
0.2787 0.0742
2 0.6501 0.2047 0.0276
3 WBS
0.0178
20
20
20
20
20
20
20
0.8548
20
20
20
20
Season 0.2628 0.30126 0.30327 0.23969 0.25460 1.00000 0.87442 0.65422 0.75567 0.67025 0.79838
Rainfall
3 0.1968 0.1937 0.3087 0.2787
<.0001 <.0001 <.0001 <.0001 <.0001
0.2629
20
20
20
20
20
47
47
47
47
47
47
137
T Rain (7 0.1050 0.24562 0.34371 0.35524 0.40792 0.87442 1.00000 0.46552 0.66336 0.61018 0.75123
day
4 0.2966 0.1379 0.1243 0.0742 <.0001
0.0010 <.0001 <.0001 <.0001
delay) 0.6594
20
20
20
20
47
47
47
47
47
47
20
Rain 0.2922 0.35062 0.37222 0.01029 -0.0437 0.65422 0.46552 1.00000 0.75064 0.30933 0.22619
2 WAS
9 0.1296 0.1061 0.9657
2 <.0001 0.0010
<.0001 0.0344 0.1263
0.2111
20
Rain
3 WAS
20
20
20
0.8548
20
47
47
47
47
47
47
0.0011 0.14389 0.26045 0.05383 0.10808 0.75567 0.66336 0.75064 1.00000 0.19140 0.36090
2 0.5450 0.2674 0.8217 0.6501 <.0001 <.0001 <.0001
0.1975 0.0127
0.9963
20
20
20
20
47
47
47
47
47
47
20
Rain 0.3330 0.29612 0.22817 0.34318 0.29626 0.67025 0.61018 0.30933 0.19140 1.00000 0.77546
2 WBS
4 0.2049 0.3333 0.1385 0.2047 <.0001 <.0001 0.0344 0.1975
<.0001
0.1513
20
20
20
20
20
47
47
47
47
47
47
Rain 0.3272 0.26516 0.17871 0.48608 0.49202 0.79838 0.75123 0.22619 0.36090 0.77546 1.00000
3 WBS
5 0.2585 0.4509 0.0298 0.0276 <.0001 <.0001 0.1263 0.0127 <.0001
0.1590
20
20
20
20
20
47
47
47
47
47
47
Abbreviations are as follows; AUDPCDI = Area under the disease progress curve disease
incidence, AUDPCDS = Area under the disease progress curve disease severity, AUDPCDI =
Area under the disease progress steps disease incidence, AUDPCDS = Area under the disease
progress steps disease severity, WAS = Weeks after seeding, DAS = Days after seeding, WBS =
Weeks before sampling, DBS = Days before sampling, DD = Degree days, SM = Soil moisture,
T = Total, Temp = Temperature
1
138
Table A3.7. Clubroot incidence on canola planted at approximately 2-wk intervals in naturallyinfested muck soil at the Muck Crops Research Station, Holland Marsh, ON, 2013.1
Seeding date
WAS
3 May 22 May 30 May 18 June 26 June
9 July
24 July 7 August
4
0
0
10
4
47
1
4
2
6
3
26
31
52
33
21
8
44
8
28
35
65
50
50
23
18
49
10
40
49
61
75
59
31
48
96
12
57
65
62
84
52
33
19
71
14
63
81
69
95
47
50
39
16
74
91
75
98
83
53
18
78
79
93
100
65
20
81
87
91
22
79
97
96
24
97
100
26
99
1No
significant differences within sampling week based on Tukey’s multiple mean comparison
test (P = 0.05)
Table A3.8. Clubroot severity on canola planted at approximately 2-wk intervals in naturallyinfested muck soil at the Muck Crops Research Station, Holland Marsh, ON, 2013.1
Seeding date
WAS
3 May 22 May 30 May 18 June 26 June
9 July
24 July 7 August
4
0
0
7
2
38
1
3
1
6
1
17
23
41
30
11
6
32
8
14
26
58
43
40
17
12
35
10
24
35
57
62
54
25
38
68
12
49
57
60
78
47
23
12
65
14
52
66
66
89
41
40
32
16
69
86
74
96
73
43
18
73
74
88
100
60
20
79
83
89
22
76
94
94
24
95
100
26
99
1No significant differences within sampling week based on Tukey’s multiple mean comparison
test (P = 0.05) were observed.
139
Table A3.9. Clubroot incidence on canola planted at approximately 2-wk intervals in naturallyinfested muck soil at the Muck Crops Research Station, Holland Marsh, ON, 2014.1
Seeding date
WAS 8 May
22 May
4 June 18 June
3 July
16 July
30 July 15 August
4
0d
0d
39 b
30 bc
7 cd
95 a
24 bcd
0d
6
5b
85 a
81 a
97 a
100 a
100 a
26 b
95 a
8
32 b
100 a
93 a
100 a
90 a
10
84 a
100 a
100 a
12
97 a
14
97 a
16
99 a
18
98 a
1Significant differences within sampling week based on Tukey’s multiple mean comparison test
(P = 0.05)
Table A3.10. Clubroot disease severity on canola planted at approximately 2-wk intervals in
naturally-infested muck soil at the Muck Crops Research Station, Holland Marsh, ON, 2014.1
Seeding date
WAS 8 May
22 May
4 June 18 June
3 July
16 July
30 July 15 August
4
0b
0b
18 b
17 b
7b
87 a
21 b
0b
6
4d
64 c
75 abc
95 ab
100 a
100 a
23 d
69 bc
8
15 c
99 a
91 ab
100 a
65 b
10
53 b
100 a
100 a
12
75 a
14
89 a
16
94 a
18
97 a
1Significant differences within sampling week based on Tukey’s multiple mean comparison test
(P = 0.05)
140
Figure A3.1. Clubroot incidence throughout the growing season on canola planted at
approximately 2-wk intervals in naturally-infested muck soil at the Muck Crops Research
Station, Holland Marsh, ON, 2013.
Figure A3.2. Clubroot incidence throughout the growing season on canola planted at
approximately 2-wk intervals in naturally- infested muck soil at the Muck Crops Research
Station, Holland Marsh, ON, 2014.
141
Table A3.11 Raw data for canola trials at the Holland Marsh in 2013.
Seeding Date
TRT
WEEK
BLOCK
2013/05/02
4
1
1
2013/05/02
4
1
2
2013/05/02
4
1
3
2013/05/02
4
1
4
2013/05/02
6
1
1
2013/05/02
6
1
2
2013/05/02
6
1
3
2013/05/02
6
1
4
2013/05/02
8
1
1
2013/05/02
8
1
2
2013/05/02
8
1
3
2013/05/02
8
1
4
2013/05/02
10
1
1
2013/05/02
10
1
2
2013/05/02
10
1
3
2013/05/02
10
1
4
2013/05/02
12
1
1
2013/05/02
12
1
2
2013/05/02
12
1
3
2013/05/02
14
1
1
2013/05/02
14
1
2
2013/05/02
14
1
3
2013/05/02
16
1
1
2013/05/02
16
1
2
2013/05/02
16
1
3
2013/05/02
18
1
1
2013/05/02
18
1
2
2013/05/02
18
1
3
2013/05/02
20
1
1
2013/05/02
20
1
2
2013/05/02
20
1
3
2013/05/02
22
1
1
2013/05/02
22
1
2
2013/05/02
22
1
3
2013/05/02
12
1
4
2013/05/02
14
1
4
2013/05/02
16
1
4
2013/05/02
18
1
4
2013/05/02
20
1
4
CI
0
0
0
0
0
0
4
8
8
6
66
30
4
32
58
64
34
14
80
12
56
100
36
60
100
52
60
100
38
84
100
70
46
100
100
82
100
100
100
DSI
0
0
0
0
0
0
1
3
3
2
39
12
1
16
37
40
18
9
70
7
29
100
27
51
99
42
51
100
32
83
100
67
38
100
99
72
100
100
100
142
2013/05/02
2013/05/15
2013/05/15
2013/05/15
2013/05/15
2013/05/15
2013/05/15
2013/05/15
2013/05/15
2013/05/15
2013/05/15
2013/05/15
2013/05/15
2013/05/15
2013/05/15
2013/05/15
2013/05/15
2013/05/15
2013/05/15
2013/05/15
2013/05/15
2013/05/15
2013/05/15
2013/05/15
2013/05/15
2013/05/15
2013/05/15
2013/05/15
2013/05/15
2013/05/15
2013/05/15
2013/05/15
2013/05/15
2013/05/15
2013/05/15
2013/05/15
2013/05/15
2013/05/30
2013/05/30
2013/05/30
2013/05/30
2013/05/30
2013/05/30
1
2
2
2
2
2
2
2
2
2
2
2
2
2
2
2
2
2
2
2
2
2
2
2
2
2
2
2
2
2
2
2
2
2
2
2
2
3
3
3
3
3
3
22
4
4
4
4
6
6
6
6
8
8
8
8
10
10
10
12
12
12
14
14
14
16
16
16
18
18
18
20
20
20
10
12
14
16
18
20
4
4
4
4
6
6
4
1
2
3
4
1
2
3
4
1
2
3
4
1
2
3
1
2
3
1
2
3
1
2
3
1
2
3
1
2
3
4
4
4
4
4
4
1
2
3
4
1
2
100
0
0
0
0
10
4
10
80
12
8
22
98
24
40
38
96
38
30
98
68
56
100
86
76
72
86
58
78
106
70
94
94
100
100
100
100
2
24
12
2
6
70
100
0
0
0
0
5
3
5
53
5
6
11
83
15
23
21
93
30
24
65
48
49
94
84
67
67
75
55
75
93
66
82
82
100
100
100
100
1
17
8
1
4
55
143
2013/05/30
2013/05/30
2013/05/30
2013/05/30
2013/05/30
2013/05/30
2013/05/30
2013/05/30
2013/05/30
2013/05/30
2013/05/30
2013/05/30
2013/05/30
2013/05/30
2013/05/30
2013/05/30
2013/05/30
2013/05/30
2013/05/30
2013/05/30
2013/05/30
2013/05/30
2013/05/30
2013/05/30
2013/05/30
2013/05/30
2013/06/12
2013/06/12
2013/06/12
2013/06/12
2013/06/12
2013/06/12
2013/06/12
2013/06/12
2013/06/12
2013/06/12
2013/06/12
2013/06/12
2013/06/12
2013/06/12
2013/06/12
2013/06/12
2013/06/12
3
3
3
3
3
3
3
3
3
3
3
3
3
3
3
3
3
3
3
3
3
3
3
3
3
3
4
4
4
4
4
4
4
4
4
4
4
4
4
4
4
4
4
6
6
8
8
8
10
10
10
12
12
12
14
14
14
16
16
16
18
18
18
8
10
12
14
16
18
4
4
4
4
6
6
6
6
8
8
8
8
10
10
10
10
12
3
4
1
2
3
1
2
3
1
2
3
1
2
3
1
2
3
1
2
3
4
4
4
4
4
4
1
2
3
4
1
2
3
4
1
2
3
4
1
2
3
4
1
40
8
30
100
98
18
100
100
22
100
100
58
100
100
88
100
100
90
100
100
30
24
26
18
12
80
0
0
16
0
10
58
100
38
8
58
100
34
38
98
100
64
50
25
7
20
100
95
13
100
100
17
100
100
49
100
100
84
100
100
79
100
100
15
16
22
16
10
71
0
0
6
0
3
37
98
27
8
45
93
28
25
86
100
37
31
144
2013/06/12
2013/06/12
2013/06/12
2013/06/12
2013/06/12
2013/06/12
2013/06/12
2013/06/12
2013/06/12
2013/06/12
2013/06/12
2013/06/26
2013/06/26
2013/06/26
2013/06/26
2013/06/26
2013/06/26
2013/06/26
2013/06/26
2013/06/26
2013/06/26
2013/06/26
2013/06/26
2013/06/26
2013/06/26
2013/06/26
2013/06/26
2013/06/26
2013/06/26
2013/06/26
2013/06/26
2013/06/26
2013/06/26
2013/06/26
2013/06/26
2013/07/09
2013/07/09
2013/07/09
2013/07/09
2013/07/09
2013/07/09
2013/07/09
2013/07/09
4
4
4
4
4
4
4
4
4
4
4
5
5
5
5
5
5
5
5
5
5
5
5
5
5
5
5
5
5
5
5
5
5
5
5
6
6
6
6
6
6
6
6
12
12
12
14
14
14
14
16
16
16
16
4
4
4
4
6
6
6
6
8
8
8
8
10
10
10
10
12
12
12
12
14
14
14
14
4
4
4
4
6
6
6
6
2
3
4
1
2
3
4
1
2
3
4
1
2
3
4
1
2
3
4
1
2
3
4
1
2
3
4
1
2
3
4
1
2
3
4
1
2
3
4
1
2
3
4
98
100
88
88
96
100
94
90
100
100
100
94
30
42
20
60
18
42
10
98
36
48
16
100
52
66
16
100
54
26
28
100
30
40
18
0
4
0
0
16
44
4
20
95
100
83
82
88
100
87
83
100
100
100
85
23
29
16
60
15
38
7
97
25
27
10
100
43
61
11
100
47
17
25
100
18
30
15
0
3
0
0
7
26
1
7
145
2013/07/09
2013/07/09
2013/07/09
2013/07/09
2013/07/09
2013/07/09
2013/07/09
2013/07/09
2013/07/09
2013/07/09
2013/07/09
2013/07/09
2013/07/24
2013/07/24
2013/07/24
2013/07/24
2013/07/24
2013/07/24
2013/07/24
2013/07/24
2013/07/24
2013/07/24
2013/07/24
2013/07/24
2013/07/24
2013/07/24
2013/07/24
2013/07/24
2013/08/07
2013/08/07
2013/08/07
2013/08/07
2013/08/07
2013/08/07
2013/08/07
2013/08/07
2013/08/07
2013/08/07
2013/08/07
2013/08/07
6
6
6
6
6
6
6
6
6
6
6
6
7
7
7
7
7
7
7
7
7
7
7
7
7
7
7
7
8
8
8
8
8
8
8
8
8
8
8
8
8
8
8
8
10
10
10
10
12
12
12
12
4
4
4
4
6
6
6
6
8
8
8
8
10
10
10
10
4
4
4
4
6
6
6
6
8
8
8
8
1
2
3
4
1
2
3
4
1
2
3
4
1
2
3
4
1
2
3
4
1
2
3
4
1
2
3
4
1
2
3
4
1
2
3
4
1
2
3
4
Table A3.12. Raw data for canola trials at the Holland Marsh in 2014.
22
44
12
14
30
52
24
16
44
25
34
28
6
4
4
0
16
2
6
8
30
8
8
24
92
4
34
60
0
0
0
6
36
50
46
42
38
78
52
26
17
31
7
11
20
47
22
10
36
13
27
14
6
3
2
0
11
1
5
7
21
7
7
15
81
2
21
46
0
0
0
2
19
42
38
29
25
71
25
17
146
Seeding Date
2014/05/08
2014/05/08
2014/05/08
2014/05/08
2014/05/08
2014/05/08
2014/05/08
2014/05/08
2014/05/08
2014/05/08
2014/05/08
2014/05/08
2014/05/08
2014/05/08
2014/05/08
2014/05/08
2014/05/08
2014/05/08
2014/05/08
2014/05/08
2014/05/08
2014/05/08
2014/05/08
2014/05/08
2014/05/08
2014/05/08
2014/05/08
2014/05/08
2014/05/08
2014/05/08
2014/05/08
2014/05/08
2014/05/08
2014/05/08
2014/05/08
2014/05/08
2014/05/22
2014/05/22
2014/05/22
2014/05/22
2014/05/22
2014/05/22
TRT
1
1
1
1
1
1
1
1
1
1
1
1
1
1
1
1
1
1
1
1
1
1
1
1
1
1
1
1
1
1
1
1
1
1
1
1
2
2
2
2
2
2
Week
4
4
4
4
6
6
6
6
8
8
8
8
10
10
10
10
12
12
12
12
14
14
14
14
16
16
16
16
18
18
18
18
20
20
20
20
4
4
4
4
6
6
BLOCK
1
2
3
4
1
2
3
4
1
2
3
4
1
2
3
4
1
2
3
4
1
2
3
4
1
2
3
4
1
2
3
4
1
2
3
4
1
2
3
4
1
2
DI
0.00
0.00
0.00
0.00
4.00
0.00
4.00
12.00
42.00
32.00
14.00
38.00
86.00
78.00
78.00
94.00
100.00
92.00
98.00
96.00
100.00
94.00
98.00
96.00
100.00
96.00
98.00
100.00
100.00
96.00
94.00
100.00
0.00
0.00
0.00
0.00
0.00
0.00
0.00
0.00
94.00
88.00
DSI
0.00
0.00
0.00
0.00
2.00
0.00
3.33
10.00
17.33
14.00
6.67
20.00
54.00
45.33
44.67
66.67
93.33
61.33
64.67
79.33
98.00
75.33
87.33
94.67
100.00
84.00
92.00
100.00
100.00
96.00
92.67
100.00
0.00
0.00
0.00
0.00
0.00
0.00
0.00
0.00
69.33
74.00
147
2014/05/22
2014/05/22
2014/05/22
2014/05/22
2014/05/22
2014/05/22
2014/05/22
2014/05/22
2014/05/22
2014/05/22
2014/05/22
2014/05/22
2014/05/22
2014/05/22
2014/05/22
2014/05/22
2014/05/22
2014/05/22
2014/05/22
2014/05/22
2014/05/22
2014/05/22
2014/05/22
2014/05/22
2014/05/22
2014/05/22
2014/06/04
2014/06/04
2014/06/04
2014/06/04
2014/06/04
2014/06/04
2014/06/04
2014/06/04
2014/06/04
2014/06/04
2014/06/04
2014/06/04
2014/06/04
2014/06/04
2014/06/04
2014/06/04
2014/06/04
2
2
2
2
2
2
2
2
2
2
2
2
2
2
2
2
2
2
2
2
2
2
2
2
2
2
3
3
3
3
3
3
3
3
3
3
3
3
3
3
3
3
3
6
6
8
8
8
8
10
10
10
10
12
12
12
12
14
14
14
14
16
16
16
16
18
18
18
18
4
4
4
4
6
6
6
6
8
8
8
8
10
10
10
10
12
3
4
1
2
3
4
1
2
3
4
1
2
3
4
1
2
3
4
1
2
3
4
1
2
3
4
1
2
3
4
1
2
3
4
1
2
3
4
1
2
3
4
1
84.00
72.00
100.00
100.00
98.00
100.00
100.00
100.00
100.00
100.00
0.00
0.00
0.00
0.00
0.00
0.00
0.00
0.00
0.00
0.00
0.00
0.00
0.00
0.00
0.00
0.00
26.00
62.00
46.00
20.00
70.00
66.67
95.00
93.94
90.00
100.00
100.00
82.76
100.00
100.00
100.00
100.00
0.00
66.00
45.33
98.00
100.00
96.67
100.00
100.00
100.00
100.00
100.00
0.00
0.00
0.00
0.00
0.00
0.00
0.00
0.00
0.00
0.00
0.00
0.00
0.00
0.00
0.00
0.00
15.33
30.00
18.00
8.67
60.67
60.00
90.00
89.90
84.00
100.00
100.00
79.31
100.00
100.00
100.00
100.00
0.00
148
2014/06/04
2014/06/04
2014/06/04
2014/06/04
2014/06/04
2014/06/04
2014/06/04
2014/06/04
2014/06/04
2014/06/04
2014/06/04
2014/06/18
2014/06/18
2014/06/18
2014/06/18
2014/06/18
2014/06/18
2014/06/18
2014/06/18
2014/06/18
2014/06/18
2014/06/18
2014/06/18
2014/06/18
2014/06/18
2014/06/18
2014/06/18
2014/06/18
2014/06/18
2014/06/18
2014/06/18
2014/06/18
2014/06/18
2014/06/18
2014/06/18
2014/07/03
2014/07/03
2014/07/03
2014/07/03
2014/07/03
2014/07/03
2014/07/03
2014/07/03
3
3
3
3
3
3
3
3
3
3
3
4
4
4
4
4
4
4
4
4
4
4
4
4
4
4
4
4
4
4
4
4
4
4
4
5
5
5
5
5
5
5
5
12
12
12
14
14
14
14
16
16
16
16
4
4
4
4
6
6
6
6
8
8
8
8
10
10
10
10
12
12
12
12
14
14
14
14
4
4
4
4
6
6
6
6
2
3
4
1
2
3
4
1
2
3
4
1
2
3
4
1
2
3
4
1
2
3
4
1
2
3
4
1
2
3
4
1
2
3
4
1
2
3
4
1
2
3
4
0.00
0.00
0.00
0.00
0.00
0.00
0.00
0.00
0.00
0.00
0.00
0.00
28.57
20.00
72.73
88.24
100.00
100.00
100.00
100.00
100.00
100.00
100.00
0.00
0.00
0.00
0.00
0.00
0.00
0.00
0.00
0.00
0.00
0.00
0.00
3.33
0.00
5.88
20.00
100.00
100.00
100.00
100.00
0.00
0.00
0.00
0.00
0.00
0.00
0.00
0.00
0.00
0.00
0.00
0.00
14.29
11.11
42.42
88.24
100.00
97.62
93.94
100.00
100.00
100.00
100.00
0.00
0.00
0.00
0.00
0.00
0.00
0.00
0.00
0.00
0.00
0.00
0.00
3.33
0.00
5.88
18.00
100.00
100.00
100.00
100.00
149
2014/07/03
2014/07/03
2014/07/03
2014/07/03
2014/07/03
2014/07/03
2014/07/03
2014/07/03
2014/07/03
2014/07/03
2014/07/03
2014/07/03
2014/07/16
2014/07/16
2014/07/16
2014/07/16
2014/07/16
2014/07/16
2014/07/16
2014/07/16
2014/07/16
2014/07/16
2014/07/16
2014/07/16
2014/07/16
2014/07/16
2014/07/16
2014/07/16
2014/07/30
2014/07/30
2014/07/30
2014/07/30
2014/07/30
2014/07/30
2014/07/30
2014/07/30
2014/07/30
2014/07/30
2014/07/30
2014/07/30
2014/08/15
2014/08/15
2014/08/15
5
5
5
5
5
5
5
5
5
5
5
5
6
6
6
6
6
6
6
6
6
6
6
6
6
6
6
6
7
7
7
7
7
7
7
7
7
7
7
7
8
8
8
8
8
8
8
10
10
10
10
12
12
12
12
4
4
4
4
6
6
6
6
8
8
8
8
10
10
10
10
4
4
4
4
6
6
6
6
8
8
8
8
4
4
4
1
2
3
4
1
2
3
4
1
2
3
4
1
2
3
4
1
2
3
4
1
2
3
4
1
2
3
4
1
2
3
4
1
2
3
4
1
2
3
4
1
2
3
0.00
0.00
0.00
0.00
0.00
0.00
0.00
0.00
0.00
0.00
0.00
0.00
100.00
100.00
84.00
94.00
100.00
100.00
100.00
100.00
0.00
0.00
0.00
0.00
0.00
0.00
0.00
0.00
12.00
28.00
42.00
12.00
22.00
22.00
40.00
18.00
100.00
94.00
98.00
68.00
0.00
0.00
0.00
0.00
0.00
0.00
0.00
0.00
0.00
0.00
0.00
0.00
0.00
0.00
0.00
100.00
92.67
74.00
82.00
100.00
100.00
100.00
100.00
0.00
0.00
0.00
0.00
0.00
0.00
0.00
0.00
11.33
24.00
42.00
7.33
20.00
20.67
37.33
13.33
72.00
74.67
78.67
36.00
0.00
0.00
0.00
150
2014/08/15
2014/08/15
2014/08/15
2014/08/15
2014/08/15
8
8
8
8
8
4
6
6
6
6
4
1
2
3
4
0.00
102.00
86.00
92.00
100.00
0.00
78.00
55.33
52.00
88.67
Table A3.13. Raw data for Chinese flowering cabbage trials at the Holland Marsh in 2013.
Seeding Date
TRT
WEEK
BLOCK
DI
DSI
2013/08/07
4
72.00
49.33
1
1
2013/08/07
4
68.00
57.33
1
2
2013/08/07
4
72.00
62.00
1
3
2013/08/07
4
18.00
6.67
1
4
2013/08/07
6
28.00
20.00
1
1
2013/08/07
6
96.00
96.00
1
2
2013/08/07
6
100.00
98.67
1
3
2013/08/07
6
66.00
53.33
1
4
Table A3.14. Raw data for Chinese flowering cabbage trials at the Holland Marsh in 2014.
Seeding Date
TRT
WEEK
BLOCK
DI
2014/05/08
4
0.00
1
1
2014/05/08
4
0.00
1
2
2014/05/08
4
0.00
1
3
2014/05/08
4
0.00
1
4
2014/05/08
6
20.00
1
1
2014/05/08
6
0.00
1
2
2014/05/08
6
0.00
1
3
2014/05/08
6
0.00
1
4
2014/05/22
4
0.00
2
1
2014/05/22
4
0.00
2
2
2014/05/22
4
0.00
2
3
2014/05/22
4
0.00
2
4
2014/05/22
6
36.00
2
1
2014/05/22
6
84.00
2
2
2014/05/22
6
52.00
2
3
2014/05/22
6
16.00
2
4
2014/06/04
4
0.00
3
1
2014/06/04
4
0.00
3
2
2014/06/04
4
2.00
3
3
2014/06/04
4
0.00
3
4
2014/07/03
4
0.00
5
1
DSI
0.00
0.00
0.00
0.00
16.00
0.00
0.00
0.00
0.00
0.00
0.00
0.00
22.00
62.67
30.67
6.67
0.00
0.00
0.67
0.00
0.00
151
2014/07/03
2014/07/03
2014/07/03
2014/07/03
2014/07/03
2014/07/03
2014/07/03
2014/07/16
2014/07/16
2014/07/16
2014/07/16
2014/07/16
2014/07/16
2014/07/16
2014/07/16
2014/07/30
2014/07/30
2014/07/30
2014/07/30
2014/07/30
2014/07/30
2014/07/30
2014/07/30
2014/08/15
2014/08/15
2014/08/15
2014/08/15
2014/08/15
2014/08/15
2014/08/15
2014/08/15
5
5
5
5
5
5
5
6
6
6
6
6
6
6
6
7
7
7
7
7
7
7
7
8
8
8
8
8
8
8
8
4
4
4
6
6
6
6
4
4
4
4
6
6
6
6
4
4
4
4
6
6
6
6
4
4
4
4
6
6
6
6
2
3
4
1
2
3
4
1
2
3
4
1
2
3
4
1
2
3
4
1
2
3
4
1
2
3
4
1
2
3
4
0.00
2.00
4.00
98.00
16.00
68.00
52.00
86.00
78.00
88.00
52.00
98.00
90.00
92.00
98.00
72.00
88.00
10.00
22.00
72.00
86.00
16.00
16.00
0.00
0.00
0.00
0.00
78.00
98.00
80.00
48.00
0.00
2.00
2.00
92.67
8.00
56.67
48.67
76.67
65.33
70.67
35.33
98.00
84.00
88.00
89.33
70.00
83.33
6.67
17.33
70.00
83.33
16.00
14.00
0.00
0.00
0.00
0.00
62.67
89.33
66.67
29.33
152
Table A3.15. Raw data for calculated degree days (Tbase = 14 °C) and rainfall (mm) for 2013 and
2014.
Air DD
Season Total
Season Total
Seeding Date
Air DD
1 W Delay
Rainfall
Rainfall 1W Delay
2013/05/02
105.2
88.7
167.7
167.7
2013/05/15
162.5
138.3
162.4
102.0
2013/05/30
224.8
192.8
174.2
145.6
2013/06/12
305.6
281.0
119.8
106.5
2013/06/26
284.5
240.0
171.1
146.6
2013/07/09
259.0
202.3
83.1
82.0
2013/07/24
217.3
193.8
113.2
95.1
2013/08/07
202.4
168.5
71.2
65.2
2014/05/08
107.5
94.0
157.7
134.1
2014/05/22
196.6
174.8
135.9
119.5
2014/06/04
216.0
198.1
156.1
211.9
2014/06/18
234.9
199.9
96.7
102.9
2014/07/03
202.9
167.5
133.7
96.8
2014/07/16
195.6
159.4
98.6
98.0
2014/07/30
197.9
169.8
142.3
75.8
2014/08/15
138.0
110.6
122.2
112.7
153
APPENDIX 4: RAW DATA FOR TILLAGE RADISH STUDY
Table A4.1. Raw data for tillage radish trials in an controlled environment in Guelph, ON.
Cultivar
Pathotype
BLOCK
DI
DSI
Tillage radish
0.00
0.00
2
1
0.00
0.00
2
2
0.00
0.00
2
3
0.00
0.00
2
4
3.75
2.50
3
1
0.00
0.00
3
2
0.00
0.00
3
3
0.00
0.00
3
4
0.00
0.00
5
1
0.00
0.00
5
2
0.00
0.00
5
3
0.00
0.00
5
4
0.00
0.00
6
1
0.00
0.00
6
2
0.00
0.00
6
3
0.00
0.00
6
4
Shanghai pak choy
100.00
100.00
2
1
90.00
60.00
2
2
100.00
100.00
2
3
100.00
93.33
2
4
100.00
100.00
3
1
80.00
73.33
3
2
90.00
90.00
3
3
100.00
100.00
3
4
100.00
100.00
5
1
90.00
80.00
5
2
100.00
100.00
5
3
100.00
100.00
5
4
100.00
100.00
6
1
70.00
70.00
6
2
100.00
100.00
6
3
100.00
100.00
6
4


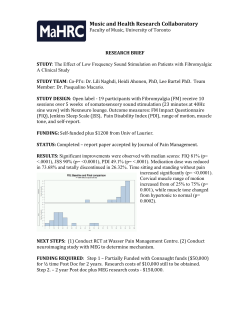


© Copyright 2026