
Third Quarterly Report FY-2014 to 2015 FWC/FWRI
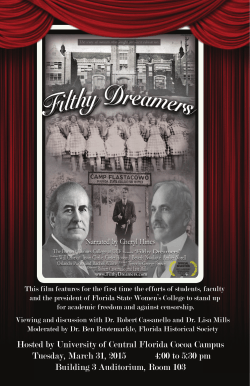
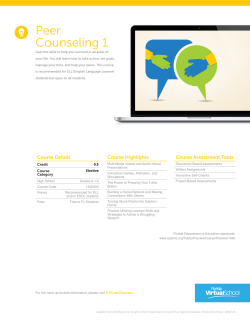
Third Quarterly Report FY-2014 to 2015 FWC/FWRI - MOTE COOPERATIVE RED TIDE PROGRAM: REDUCTION OF HARMFUL IMPACTS FROM FLORIDA RED TIDE FWC AGREEMENT NO. 12054 REPORT PERIOD: JANUARY 1, 2015 TO MARCH 31, 2015 SUBMITTED TO: DR. LEANNE FLEWELLING DR. ALINA CORCORAN FISH & WILDLIFE RESEARCH INSTITUTE FLORIDA FISH AND WILDLIFE CONSERVATION COMMISSION 100 8TH AVENUE SE ST. PETERSBURG, FLORIDA 33701-3093 SUBMITTED BY: VINCENT LOVKO, PI ERICH BARTELS, CO-PI KELLIE DIXON, CO-PI MICHAEL HENRY, CO-PI GARY KIRKPATRICK, CO-PI ARI NISSANKA, CO-PI RICHARD H. PIERCE, CO-PI MOTE MARINE LABORATORY 1600 KEN THOMPSON PARKWAY SARASOTA, FLORIDA 34236 April 7, 2015 Mote Marine Laboratory Technical Report No. 1879 TABLE OF CONTENTS LIST OF FIGURES ......................................................................................................................................... ii LIST OF TABLES ........................................................................................................................................... ii LIST OF PARTICIPANTS .............................................................................................................................. iii Project Background ................................................................................................................................... iv Goal 1. Evaluate and validate selected potential HAB control and mitigation techniques through analysis of existing data and new observations ...................................................... 1 Task 1A. Evaluate the prevalence of parasite-infected Karenia spp. .................................. 1 Goal 2 Mitigate red tide effects by tracking and forecasting bloom distribution and trajectory, in coordination with the efforts of FWRI and other partners and provide improved information on environmental responses of K. brevis to support modeling efforts. ....................................................................................................................................... 2 Task 2A. Perform routine Southwest Florida surveys ......................................................... 2 Task 2B. Conduct Florida Keys monitoring ...................................................................... 11 Task 2C. Execute adaptive red tide event responses .......................................................... 14 Task 2D. Quantify estuarine environmental gradients and differences ............................. 15 Task 2E. Quantify Karenia spp. and community response to nutrient challenges ............ 16 Task 2F. Deploy automated red tide sensors ...................................................................... 17 Task 2G. Perform supplemental support of collaborative programs .................................. 19 Goal 3 Investigate the persistence of toxicity in an unregulated, recreationally harvested shellfish species and a newly approved commercially produced shellfish species to enhance management for public health protection from resources previously and potentially associated with NSP ........................................................................................... 21 Task 3A. Determine persistence of brevetoxins in unregulated/recreational food species. 21 Task 3B. Provide information, in coroperation with FWRI, for public health protection..24 Goal 4 Minimize the harmful effects of red tide on public health, the economy and living natural resources through the increased education and outreach efforts towards stakeholders and the public. ................................................................................................. 25 Task 4A. Work with stakeholders in Goals 1, 2 & 3.......................................................... 25 Task 4B. Community outreach ........................................................................................... 26 Task 4C. Citizen science .................................................................................................... 27 FWC/FWRI – Mote Cooperative Red Tide Program Mote Marine Laboratory, Sarasota, Florida i LIST OF FIGURES Figure 1. Location of offshore survey stations for surveys conducted in Feb. and March 2015 . 3 Figure 2. Location of coastal survey stations sampled in Jan., Feb. and March 2015. Red circles indicate inlet and offshore stations that receive additional analyses ............................ 4 Figure 3. Time series of riverine flows sine 2010 at representative stations for Tampa Bay (Alafia River), Charlotte Harbor (Peace River), and Caloosahatchee River (S-79 control structure). Samplings indicated by vertical dashed lines ................................. 6 Figure 4. More recent time series of riverine flows since 2010 at representative stations for Tampa Bay (Alafia River), Charlotte Harbor (Peace River), and Caloosahatchee River (S-79 control structure). Samplings indicated by vertical dashed lines ....................... 6 Figure 5. Times series of flows at S-79 illustrated with cell counts ............................................ 7 Figure 6. Latitudinal distribution of Karenia brevis cell counts samples by Mote marine Laboratory, since 2007.................................................................................................. 7 Figure 7. Presence (1) and absence (0, <1000 cell/L) of Karenia brevis by time and latitude since 2007 ..................................................................................................................... 8 Figure 8. Presence (1) and absence (0, <1000 cell/L) of Karenia brevis by time and longitude since 2007 ..................................................................................................................... 8 Figure 9. Distribution of concentrations of selected parameters for coastal stations immediately outside the mouths of the SW Florida estuaries; prior to 2015 (upper), and during 2015 (lower). ................................................................................................................. 9 Figure 10. Map of K. brevis cell counts from Florida Keys samples, December 16, 2014 - March 15, 2015....................................................................................................................... 12 Figure 11. Keys transect station locations for toxin analysis ...................................................... 14 Figure 12. Location of stations sampled for the estuarine surveys conducted during this contract period .......................................................................................................................... 15 Figure 13. Total Brevetoxin at Sarasota County Beaches; 9/2/14 to 12/1/14 .............................. 21 Figure 14. Brevetoxin Metabolites in Sunray Venus Clams ....................................................... 23 Figure 15. Brevetoxin Metabolites in Sunray Venus Clams (w/o m/z 1018 and m/z 1034) ....... 24 Figure 16. Images of 3 phone-based microscopes tested during this quarter along with brief technical data .............................................................................................................. 28 Figure 17. Images of various phytoplankton cultures (fixed in 1% Utermohl’s iodine solution) captured using the Neewer phone scope at 60x magnification ................................... 29 Figure 18. Images of various phytoplankton cultures (fixed in 1% Utermohl’s iodine solution) captured using the Sky Rocket AppScope at 30x magnification ................................ 30 Figure 19. Images of various phytoplankton cultures (fixed in 1% Utermohl’s iodine solution) captured using the Carson HookUpz MicroMax Plus phone microscope .................. 30 LIST OF TABLES Table 1. Brevetoxin concentrations from the Nov. 12, 2014 coastal survey ........................... 10 FWC/FWRI – Mote Cooperative Red Tide Program Mote Marine Laboratory, Sarasota, Florida ii LIST OF PARTICIPANTS Vincent Lovko . .................................................................................................................. Project Manager Erich Bartels ...................................................................................................... Florida Keys Monitoring Jordan Beckler ....................................................................................... Automated Detection Technology Trish Blum ...................................................................................................................... Toxin Analysis Camia Charniga ..........................................................Nutrient Analysis, Field Sampling and Lab Analysis Jessica Devault ............................................................................................... Public Information/Education Kellie Dixon ..........................................................Nutrient Analysis, Field, Lab and Data Interpretation Karl Henderson ........................................................................................ Automated Detection Technology Mike Henry ......................................................................................... Toxin Analysis/Field Monitoring Jim Hillier ........................................................................................ Automated Detection Technology Gary Kirkpatrick ...................................................................................... Automated Detection Technology Susan Launay .................................................................................... Nutrient Analysis and Lab Analysis Stephanie Lear ............................................................... Field sampling and Laboratory Pigment Analysis Pat Minotti .................................................................................... Nutrient Analysis and Lab Analysis Ari Nissanka ............................................................ Nutrient Analysis, Laboratory and Data Processing Valeriy Palubok ............................................................................. Culture Maintenance/Lab Investigations Richard Pierce ..................................................................................................... Toxin Data Interpretation Hayley Rutger ............................................................................................... Public Information/Education Jennifer Vreeland .............................................................. Field sampling, pigments and Data Interpretation Cory Walter ...................................................................................................... Florida Keys Monitoring Lori Zaworski ..........................................................Nutrient Analysis, Field Sampling and Lab Analysis FWC/FWRI – Mote Cooperative Red Tide Program Mote Marine Laboratory, Sarasota, Florida iii Project Background: This report serves to detail progress made during the third quarter of Year 3 of the FWC/FWRIMote Cooperative Red-Tide Program. The Florida red tide causes adverse impacts to public health, natural resources and the economy. The red tide organism (Karenia brevis) produces a potent neurotoxin, the primary cause of the harmful effects including massive fish kills, deaths of marine mammals, birds and sea turtles and die-off of benthic communities. Public health is affected through exposure to the airborne toxins and ingestion of contaminated shellfish. This project is a cooperative effort between Mote Marine Laboratory (Mote) and the Fish and Wildlife Research Institute of the Florida Fish and Wildlife Conservation Commission, (FWRI/FWC) to mitigate the adverse impacts caused by harmful algal blooms, specifically the Florida red tide (Karenia brevis) along the Florida Gulf coast. This continuing cooperative program between Mote and FWRI/FWC involves specific areas of red tide monitoring, research, and public education that are of critical concern to the State of Florida, in cooperation with other on-going red tide initiatives. These monitoring, mitigation and research efforts are addressed as four goals including: 1) evaluate potential control techniques, 2) mitigate red tide effects through monitoring, forecasting, and improved knowledge, 3) investigate toxin persistence in recreationally-harvested shellfish, and 4) protect public health, the economy and living natural resources through increased education and outreach. Each goal is designed to make full use of existing partnerships and accomplish specific deliverables through shared resources and expertise, while maintaining progress toward long-term goals of predictive capabilities and directed response for management of red tides and reduction of adverse impacts on public health, ecological health, and the economy. Special care is taken to avoid redundancy between collaborative studies undertaken at Mote and FWRI/FWC, or with other ongoing research. Note that deliverables associated with this report are provided via Dropbox (FWRI-Mote RT Co-op 2012-15 Products). Files within the Dropbox are categorized by Goal and Task, as appropriate. Data tables within these files are routinely updated. FWC/FWRI – Mote Cooperative Red Tide Program Mote Marine Laboratory, Sarasota, Florida iv Progress During the Third Quarter of Year 3: January 1 through March 31, 2015. I. Goal 1. Evaluate and validate selected potential HAB control and mitigation techniques through analysis of existing data and new observations A. Task 1A. Evaluate the prevalence of parasite-infected Karenia spp. 1. 2. Description of task: a) As a result of the FWRI/FWC and START Red Tide Control and Mitigation (RTCM) Grant Program between 2007 and 2009, several novel methods of HAB control were funded by FWC. Two of these methods, evaluating interactions between Karenia and diatoms, were explored in years 1 and 2. A third method examines the presence and cross-infectivity of the parasitic dinoflagellate Amoebophrya spp., a naturally occurring parasite found to infect numerous bloom-forming dinoflagellate species, in Karenia brevis. b) In Year 3, samples from routine surveys (Task 2A) and adaptive event response efforts (Task 2C) containing high abundance of K. brevis, will be routinely processed for detection of Amoebophrya sp. using catalyzed reporter deposition fluorescent in-situ hybridization (CARDFISH). When possible, live samples will be collected in addition to those processed for CARD-FISH to allow for culturing of infected populations, should infected populations be detected. Any resulting cultures will be maintained in the Mote phytoplankton culture facility and will be shared with collaborators at FWRI/FWC in an attempt to produce a sustained culture of Karenia-specific Ameobophrya. c) Additionally, challenge studies will determine if non-infected K. brevis populations (including strains currently in culture at MML or FWRI/FWC, or natural populations) are susceptible to infection by Amoebophrya strains from other dinoflagellate species, either isolated from natural populations of other dinoflagellates, or obtained from collaborators or culture collections. Activities during this reporting period: a) Scheduled (1) Assess parasites during all sampling when Karenia detected (2) Culture parasites when they are detected in live samples (3) Conduct challenge studies with K. brevis and non-native Amoebophrya sp. obtained from other infected species. b) Conducted (1) No additional samples were collected for Amoebophrya analysis this quarter. (2) Analysis of samples with the ALV01 probe were conducted. These samples have not yet been observed under epifluorescent microscopy, therefore no results are reported at this time. FWC/FWRI – Mote Cooperative Red Tide Program Mote Marine Laboratory, Sarasota, Florida 1 3. 4. (3) An additional challenge study, exposing cultured K. brevis to Amoebophrya zoospores from non-Karenia hosts, is planned for Q4. Deliverables produced: a) None this quarter Discussion of findings: a) None this quarter II. Goal 2. Mitigate red tide effects by tracking and forecasting bloom distribution and trajectory, in coordination with the efforts of FWRI and other partners and provide improved information on environmental responses of K. brevis to support modeling efforts. A. Task 2A. Perform routine Southwest Florida surveys 1. Description of task: a) Routine surveys conducted under this project serve as monitoring efforts and have been designed to focus on periods when Karenia blooms are most likely, to sample an extensive region not typically addressed by other entities (from Tampa Bay to north of Naples, FL), and to be flexible enough to permit the rapid transition from monitoring to event response when a Karenia bloom is detected. During these efforts, data collected, in addition to providing early detection of Karenia blooms, will provide 1) a time series of chemical and physical information for the coastal waters of Southwest Florida, 2) estimates of the range of nutrient and nutrient ratios delivered by the major estuaries of the region, and 3) initiating data for modeling efforts when blooms do occur. 2. Activities during this reporting period: a) Scheduled (1) Three offshore surveys (monthly Jan. - March.) (2) Three coastal surveys (monthly Jan. - March.) b) Conducted (1) Two offshore surveys were conducted during this reporting period, on 12 Feb. and 3 March, 2015. An offshore survey scheduled for January was postponed due to weather. There are two more offshore surveys scheduled to be conducted during the current project year. With no bloom activity reported in the area, the standard “southern grid” (which was the focus of the offshore surveys during Year 2 of the current project) was surveyed. For these one-day survey, 18 stations (approximately 10 km apart) were sampled in a grid spanning the ~15-25m isobaths between Venice and North Captiva Island (Figure 1). At each station, profiles were obtained of conductivity, temperature and relative chlorophyll fluorescence. Discrete surface and near-bottom water samples were collected for determination of Karenia spp. abundance. At 6 select stations (OS22, OS24, OS28, OS30, OS34, OS36), surface and near-bottom samples were also analyzed for brevetoxins. FWC/FWRI – Mote Cooperative Red Tide Program Mote Marine Laboratory, Sarasota, Florida 2 Figure 1. Location of offshore survey stations for surveys conducted in Feb. and March 2015. (2) Three coastal surveys were conducted during this reporting period, on 20 Jan., 23 Feb. and 17 March 2015. As in previous quarters, these surveys were conducted as joint efforts between FWC/FWRI and Mote and followed the same survey track as previous coastal surveys (Figure 2). (3) For each one-day coastal survey, a total of 20 stations were sampled, including 16 stations along the 10m isobath, extending from the mouth of Tampa Bay to San Carlos Bay, and 4 offshore stations approximately along the 20 m isobath. At all stations, profiles were obtained of conductivity, temperature and relative chlorophyll fluorescence and discrete surface and near-bottom water samples were collected for determination of Karenia spp. abundance. At 8 stations, including four stations located just outside of the major estuaries (Tampa Bay, Sarasota Bay, Charlotte Harbor and San Carlos Bay) and four “offshore” stations located FWC/FWRI – Mote Cooperative Red Tide Program Mote Marine Laboratory, Sarasota, Florida 3 approximately along the 20 m isobath, bulk-water samples were also analyzed for nutrients (including dissolved silicates, inorganic N and P species, total dissolved N and P, urea, particulate C, N, P, and Si), CDOM absorption, phytoplankton community structure determinations based on HPLC pigment analysis, and HPLC-MSMS determination of brevetoxins. Additional samples were collected for molecular and microscopic analysis by FWC/FWRI. Figure 2. Location of coastal survey stations sampled in Jan., Feb. and March 2015. Red circles indicate inlet and offshore stations that receive additional analyses. 3. Deliverables produced: a) Karenia brevis cell counts for all surveys conducted during this reporting period have been provided to FWRI within 24-72 hours of collection and are included in updated data tables provided as part of the deliverables for this quarter associated with this report. b) Analytical results from samples collected to date in Year 3, including both scheduled and event response efforts, appear in updated water quality tables provided as part of the deliverables associated with this report. Analyses of dissolved inorganic species, urea, total dissolved FWC/FWRI – Mote Cooperative Red Tide Program Mote Marine Laboratory, Sarasota, Florida 4 4. N and P, particulate P, and particulate Si are complete through the March 17, 2015 sampling. All dissolved silica and urea analyses are complete through this date but final calculations requiring salinity data from the CTD are not yet completed. Particulate C and N are complete through the December 16, 2014 sampling with remaining samples processed but awaiting final data processing. CDOM absorption analyses are complete through the February 23, 2015 sampling. Graphical analyses of selected parameters as time series of Year 1-3 data and as relationships as a function of salinity from data since 2007 are provided as part of the deliverables associated with this report (Products Data Products Plots Bivariate Plots). c) Samples collected this quarter for toxin analysis from coastal and offshore surveys have been extracted and are awaiting analysis. Additional toxin data from coastal and offshore surveys conducted in quarter 2, but not previously reported, is provided in updated data tables provided as part of the deliverables for this report. d) Samples from coastal surveys this quarter collected for HPLC pigment analysis have been completed and the data is provided in updated data tables provided as part of the deliverables for this report. ChemTax analysis to determine phytoplankton community structure, has not yet been conducted on samples from this quarter. e) Contours and profiles of salinity, temperature, density and relative chlorophyll fluorescence, as well as other graphical analyses to provide insight into parameter inter-relationships as well as temporal and spatial trends, are being prepared and will be included in the final project report. Discussion of findings: a) Updated illustrations of riverine flows to the major estuaries along the SW Florida coast appears in Figure 3 with more recent detail in Figure 4. (Flows do not represent the total flow to each estuary and so cannot be used for regional comparisons but can be used for temporal comparisons.) Flows in 2014-2015 remained low and were apparently much reduced relative to wet season flows in 2012 or 2013. Flows are illustrated in Figure 5 with K. brevis cell counts superimposed. After the K. brevis bloom observed in late fall 2014, there have been few cells observed in the coastal or offshore monitoring. b) Figures 6-8 illustrate the cell count data since 2007, observed as a function of latitude, of time and latitude, and of time and longitude. Over time, comparable cell densities appear to be achieved along the entire coastal study area, and complex spatial patterns are visible relative to north-south incidence, and onshore-offshore that do not support simplistic theories of bloom initiation or progression. FWC/FWRI – Mote Cooperative Red Tide Program Mote Marine Laboratory, Sarasota, Florida 5 Daily Mean Flow (cfs) 20000 Alafia River @ Lithia Peace River @ Arcadia Caloosahatchee River @ S79 15000 10000 5000 0 2010 2011 2012 2013 Year 2014 2015 2016 Figure 3. Time series of riverine flows sine 2010 at representative stations for Tampa Bay (Alafia River), Charlotte Harbor (Peace River), and Caloosahatchee River (S-79 control structure). Samplings indicated by vertical dashed lines. Daily Mean Flow (cfs) 20000 15000 Alafia River @ Lithia Peace River @ Arcadia Caloosahatchee River @ S79 10000 5000 0 2014 2015 Year 2016 Figure 4. More recent time series of riverine flows since 2010 at representative stations for Tampa Bay (Alafia River), Charlotte Harbor (Peace River), and Caloosahatchee River (S-79 control structure). Samplings indicated by vertical dashed lines. FWC/FWRI – Mote Cooperative Red Tide Program Mote Marine Laboratory, Sarasota, Florida 6 10000000 15000 1000000 10000 100000 -1 10000 5000 K. brevis (cells L ) Daily Mean Flow (cfs) 20000 1000 0 2013 2014 2015 2016 Year Figure 5. Times series of flows at S-79 illustrated with cell counts. -1 K. brevis (cells L ) 10000000 1000000 100000 10000 1000 25.5 26.5 27.5 28.5 Latitude (Deg.) Figure 6. Latitudinal distribution of Karenia brevis cell counts samples by Mote marine Laboratory, since 2007. (Data at 500 cells/L indicates less than typical detection limit. FWC/FWRI – Mote Cooperative Red Tide Program Mote Marine Laboratory, Sarasota, Florida 7 29.0 K. brevis P/A Latitude (Deg.) 28.5 0 1 28.0 27.5 27.0 26.5 26.0 2007 2010 2013 2016 Year Figure 7. Presence (1) and absence (0, <1000 cell/L) of Karenia brevis by time and latitude since 2007. 2017 K. brevis P/A 0 1 Latitude (Deg.) 2015 2013 2011 2009 2007 -84 -83 -82 -81 Year Figure 8. Presence (1) and absence (0, <1000 cell/L) of Karenia brevis by time and longitude since 2007. FWC/FWRI – Mote Cooperative Red Tide Program Mote Marine Laboratory, Sarasota, Florida 8 c) The stations outside of the major estuaries which were analyzed for nutrients in addition to cell counts and CTD profiles were segregated and illustrated to examine persistent spatial patterns. Comparisons were limited to nutrients and ratios, using Stations CS00A (Tampa Bay), CS03A (Sarasota Bay), CS09A (Charlotte Harbor) and CS15A (Caloosahatchee River). Despite the wide range in inorganic nutrients between the freshwater portions of the various estuaries documented in Task 2D, the coastal stations did not display coherent spatial patterns (ammonia, urea, nitrate), with the exception of dissolved silica and as a result DIN:DSi ratios (Figure 9). Regional patterns of these two parameters indicated increasing silica concentrations outside of the southernmost estuaries and were persistent both in the bulk of the data and the most recent samplings during comparatively dry periods. Concentration (M) 10.0 1.0 0.1 TB SB CH CR 0.0 O4 DP H4 DN 3 O2 N D EA UR O2 I DS 40 4 A_ I DS N DI P DI N DI Parameter Concentration (M) 10.0 1.0 0.1 TB SB CH CR 0.0 4 O DP H4 DN 3 O2 DN EA UR O2 I DS I DS N I 40 4 A_ D P DI N DI Figure 9. Distribution of the concentrations of selected parameters for coastal stations immediately outside the mouths of the SW Florida estuaries; prior to 2015 (upper), and during 2015 (lower). FWC/FWRI – Mote Cooperative Red Tide Program Mote Marine Laboratory, Sarasota, Florida 9 d) Samples collected in the previous quarter during the coastal survey conducted on Nov. 2, 2014 contained considerable amounts of brevetoxin, likely a reflection of the K. brevis bloom observed near Sanibel Island at that time. The highest brevetoxin concentrations were in the region of the mouth of the Caloosahatchee River (station CS15A, near Estero Island) where cell counts exceeded 500,000 cells per liter in the surface waters. PbTx-2 dominated in the areas with high cell counts (Table 1). These samples also contained high levels of brevenal. Stations north of Sanibel Island contained brevetoxin profiles that were dominated by PbTx-3 and indicative of a waning bloom. Samples from the same area collected on Dec. 16, 2014, approximately one month after the survey described above, contained only trace amounts of brevetoxin and no cells were detected at any of the stations. Stations that did have traces of brevetoxin were dominated by PbTx-3 indicating lack of viable cells. e) Low levels of brevetoxin were detected at all sampled stations and at all depths for the offshore survey conducted on Dec. 11, 2014. The primary toxin at most station was PbTx-3 with the exception of stations OS24 surface, OS30 surface and bottom, and OS36 surface. These stations are located offshore of Lemon Bay, Gasparilla and Sanibel Island respectively. These are also the stations nearest to shore. The more offshore stations contained only low amounts of PbTx-3. Table 1. Brevetoxin concentration from the Nov. 12, 2014 coastal survey. FWC/FWRI – Mote Cooperative Red Tide Program Mote Marine Laboratory, Sarasota, Florida 10 B. Task 2B. Conduct Florida Keys monitoring 1. Description of task: a) Monthly transects will be undertaken along the Florida Keys from October to March at fifteen (15) previously established stations along the gulf-side of the Lower Keys and through Key West Harbor to the reef tract to provide early notification of bloom initiation and to monitor physical environmental conditions both when K. brevis is present and when blooms are absent. Water samples will be collected and stained for cell counts and algae identification, and additional bulk water samples collected and filtered/extracted in preparation for brevetoxin analysis. Temperature, salinity, and dissolved oxygen data will be collected at each station. Cell counts and filtration/extraction of samples will be performed by Mote staff in the Florida Keys. Extracted samples will be shipped to Sarasota for brevetoxin analysis by Mote personnel. Volunteer opportunistic sampling programs will also coordinate commercial fishermen, dive operators backcountry guides, researchers, and state and federal agency personnel to collect additional samples for cell counts and algal identification, and provided extended coverage along the areas north of the Lower and Middle Keys to Cape Sable, as well as along the entire offshore reef tract. In the event of a bloom, a more intensive sampling regime will be undertaken within and near the bloom area to collect sufficient physical data to statistically evaluate water quality differences associated with high cell counts (specifically dissolved oxygen) and possible secondary effects on coral reef communities. 2. Activities during this reporting period: a) Scheduled (1) Routine monthly is conducted from October – March. (2) Volunteer opportunistic sampling is ongoing. b) Conducted (1) Two routine monthly monitoring cruises were conducted during this report period in January and February. The December survey cruise occurred prior to Dec. 15th, and the March sampling cruise is scheduled for late March. Volunteer opportunistic sampling was coordinated throughout the report period. Approximately twice monthly volunteer opportunistic samples were obtained from three locations just north of the Lower Keys, as well as approximately 55 miles north of the Lower Keys, by staff from the Stone Crab Research Program at FWRI’s South Florida Regional Laboratory, located in the Middle Keys in Marathon, Florida. The project coordinator maintained communication with other previously utilized “on-call” volunteers from the Keys Association of Dive Operators (KADO) as well as several other independent fisherman and marine life collectors; however, these other volunteers were not utilized for additional sampling during the current report period. FWC/FWRI – Mote Cooperative Red Tide Program Mote Marine Laboratory, Sarasota, Florida 11 3. 4. Deliverables produced: a) A total of 107 samples were obtained from routine monitoring cruises and volunteer opportunistic sampling. An additional 14 bulk water samples were collected and filtered/extracted in preparation for brevetoxin analysis. Results from cell counts and identification were sent immediately to FWRI/FWC, usually within 48 hours from collection and are included in data spreadsheets provided as part of the deliverables associated with this report. b) Results of brevetoxin analysis from quarters 2 and 3 are completed and are included in updated tables provided as part of the deliverables associated with this report and are discussed below. Discussion of findings: a) Sampling locations are shown for Dec 16, 2014 - March 15, 2015 in Figure 10. Figure 10. Map of K. brevis cell counts from Florida Keys samples, December 16, 2014 - March 15, 2015. b) December 16 - 31, 2014: Routine monitoring samples collected in early December prior to this report period indicated no elevated levels of K. brevis in those areas directly adjacent to the Florida Keys. However, volunteer samples collected earlier in December prior to this report period FWC/FWRI – Mote Cooperative Red Tide Program Mote Marine Laboratory, Sarasota, Florida 12 near Oxfoot Key indicated “Very Low-a” levels (up to 3,000 cells/L) of K. brevis in that area of Florida Bay. Additional volunteer sampling on December 17-18 in the Sawyer Key and Harbor Keys areas indicated “Medium” levels (up to 814,000 cells/L) of K. brevis, verifying continued bloom persistence in the area north of the Lower Keys c) January 1 - 31, 2015: Routine monitoring samples collected on January 13, 2015 indicated no elevated levels of K. brevis. Additional volunteer samples indicated no elevated levels of K. brevis. No response efforts were initiated. d) February 1 - 28, 2015: Volunteer samples collected on February 11, 2015 indicated “very low A” levels (up to 2,000 cells/L) in the Harbor Key area north of the Lower Keys. However, additional volunteer sampling later in the month, as well as routine monitoring samples collected on February 23, 2015 indicated no elevated levels of K. brevis persisting north of the Lower Keys. e) March 1 - 15, 2015: No routine monitoring samples have been collected. A routine sampling cruise is scheduled for late March. Volunteer samples collected in early March indicated no elevated levels of K. brevis in the area of Pavilion Key, approximately 55 miles north of the Lower Keys. Additional volunteer samples for the first two weeks of March have not yet been received. No response efforts were initiated. f) During the November sampling event PbTx-2 and -3 were detected at 5 of the 7 stations sampled. In all cases, PbTx-2 was greater than or equal to that of PbTx-3 indicating the presence of viable K. brevis. During the December sampling event toxin was detected at only 3 of the seven stations with the highest concentration at the most westerly site, RT21 (Figure 11). PbTx-2 was much greater than PbTx-3 indicating a strong presence of viable cells. Again, no toxin was detected microscopically during either of these events. Toxin samples collected in January, February, and March of 2015 PbTx-2 and -3 were detected at some of the stations collected in January and February of 2015, with no toxin detected in March, 2015. PbTx-2 and -3 were detected at low concentrations at stations RT08, RT23, RT19 and RT21 (Figure 11) during the January sampling event. PbTx-3 was greater than PbTx-2 at all of these stations with the exception of RT21, the most westerly site. These results indicated that the cells were less viable at the more easterly stations. This was confirmed at the next sampling in February where only PbTx-3 was detected. No cells were observed with microscopic evaluation during any of the sampling events emphasizing the need for toxin analysis. FWC/FWRI – Mote Cooperative Red Tide Program Mote Marine Laboratory, Sarasota, Florida 13 Figure 11. Keys transect station locations for toxin analysis. C. Task 2C. Execute adaptive red tide event responses. 1. Description of task: a) In the event of a red-tide bloom, closely coordinated efforts between Mote, FWRI/FWC, DOH resource managers, and our other red tide partners will ensure that necessary data are generated and available to partners and stakeholders without redundant operations by any of the partners. A close collaboration with FWRI/FWC, NOAA, NASA, USF, and coastal counties will allow Mote to respond to bloom events by a) providing rapid and detailed information to inform and support public health protection decisions near marine resources, b) verifying remotelysensed bloom signatures as to the presence of Karenia and definitively map the spatial extent, c) providing information of cell abundances at depth where satellite observations are lacking, and d) deploying of autonomous vehicles to detect Karenia distribution and provide needed physical and cell count data to forecasting and trajectory modeling efforts conducted by Mote’s partners. 2. Activities during this reporting period: a) Scheduled: (1) Bloom area survey – During bloom event (2) Glider tracking – During bloom event (3) Expanded survey – During bloom event (4) Other Activities – Standard Bioassay, during bloom event b) Conducted: (1) No adaptive response activities were warranted during the current reporting period. 3. Deliverables produced: a) Additional data from previous adaptive response activities not included in past reports is available in updated data tables provided as part of the deliverables associated with this report. FWC/FWRI – Mote Cooperative Red Tide Program Mote Marine Laboratory, Sarasota, Florida 14 4. D. Discussion of findings: a) None Task 2D. Quantify estuarine environmental gradients and differences 1. Description of task: a) This task involves conducting detailed surveys of estuarine waters for the same suite of analytical parameters as performed during the routine monitoring surveys. Sampling will be conducted during both the dry season when riverine inflows are minimal and during the wet season when terrestrially derived nutrients are expected to dominate. Two 4-day cruises will characterize the water quality, nutrient and phytoplankton community dynamics at the outlets of Tampa Bay, Charlotte Harbor and the Caloosahatchee River. Sampling will be conducted inside and outside the outlets during one-day at each estuary. Analyses include dissolved silicates, total and inorganic dissolved N and P, urea, particulate C, N, P, and Si, chlorophyll via laboratory extraction and fluorometry, CDOM absorption, cell counts of K. brevis, photopigments for phytoplankton community structure determinations and brevetoxins. 2. Activities during this reporting period: a) Scheduled (1) A “wet season” estuarine survey was scheduled to be conducted in September 2014. b) Conducted (1) The “wet-season” estuarine survey was conducted September 22-24, 2014 as three one-day surveys aboard the RV William Mote. The “dry-season” estuarine survey is scheduled to be conducted April 13-16, 2015 aboard the RV Eugenie Clark, as in previous project years. Location of stations sampled for the estuarine surveys are illustrated in Figure 12. (2) Analysis of measured parameters is ongoing and will continue during subsequent quarters. Figure 12. Location of stations sampled for the estuarine surveys conducted during this contract period. FWC/FWRI – Mote Cooperative Red Tide Program Mote Marine Laboratory, Sarasota, Florida 15 3. 4. Deliverables produced: a) All nutrient analyses for the estuarine surveys for the September 2014 survey were reported in the Quarter 2 report. Tabular data, merged with in situ physical data, appear in updated water quality data tables provided as part of the deliverables associated with this report. Urea and dissolved silica concentrations from stations in coastal waters near the mouths of the estuaries have not been calculated due to the current unavailability of salinity data from CTD casts. b) Brevetoxin data has been previously reported. c) Phytoplankton community data generated by ChemTax analysis of HPLC pigment data are completed for the Spring (“dry season”) and Fall (“wet season”) estuary surveys conducted in 2014. This data is included in updated data tables provided as part of the deliverables associated with this report. Discussion of findings: a) Analysis of nutrient data and brevetoxin data were discussed in previous reports. Although phytoplankton community structure results are complete, analysis of the phytoplankton community structure in the context of measured physical and chemical variables has not been completed. It is anticipated that these analyses will be completed and included with the final report. E. Task 2E. Quantify Karenia spp. and community response to nutrient challenges 1. Description of task: a) This project year will focus on the use of simulated in situ continuous-culture (chemostat) assays that can be run for longer periods, providing more complete information regarding the dynamics of nutrient limitation in a mixed phytoplankton community. A series of assays (approximately 5) will be conducted using a targeted array of treatments and treatment combinations to validate and enhance the results of previous bioassays and to provide additional insight to the response of Karenia brevis, and other phytoplankton community components, to various nutrients and other environmental factors. The nutrient combinations and concentrations will be determined based on results from static bioassays conducted during previous and current cooperative agreements. The chemostat chambers will be maintained at constant temperature under 12:12 light:dark illumination (~50µmol m-2 s-1) while periodically being gently mixed. b) Growth rates and alterations in the phytoplankton community structure will be determined by pigment quantification (via HPLC analysis) and subsequent taxonomic classification using chemotaxonomic software. Discrete microscopic analysis will be used to identify and quantify not only Karenia, but other major taxa as well, as required. FWC/FWRI – Mote Cooperative Red Tide Program Mote Marine Laboratory, Sarasota, Florida 16 2. 3. 4. F. Particle analysis, using a FlowCam, will provide additional insight regarding alterations to community structure and cell physiology under different treatments and will provide an image record of the phytoplankton. Dissolved nutrient concentrations as well as cellular complements of nutrients will be measured in bulk media and outflow, as applicable, in order to confirm added media concentrations, to assess uptake rates of major nutrients when biomass and growth rates permit, and to provide a time course of cellular nutrient incorporation. Brevetoxins will be measured in bulk water and during the assays to determine the influence of nutrients and community structure changes on toxin production and availability. Activities during this reporting period: a) Scheduled: (1) Approximately 5 chemostat-based bioassays are scheduled to be conducted during the current project year b) Conducted: (1) A chemostat bioassay was attempted in January, 2015, but contamination from an unknown source required that the chemostat be dismantled and cleaned. Deliverables produced a) Some additional data for chemostat assays previously conducted is provided on Dropbox as part of the deliverables for this report as the data is analyzed. Full data and analysis will be provided in subsequent reports. Discussion of findings a) A chemostat bioassay was planned for January. This bioassay was to use a natural sample collected from the outflow of Boca Grande collected during the January coastal survey. This assay was to test the response of the phytoplankton community to different sources of inorganic (NH4, NO3) and organic nitrogen (amino acids, urea). While acclimating the natural sample to the chemostat environment (using L1/50 media made in sterile-filtered sea water) for >10days, the system became contaminated (presumably by a fungus). The entire system had to be dismantled and decontaminated. The system has been reassembled and another assay is planned as of the writing of this report. b) Results from previous chemostat bioassays are currently being analyzed and will be presented and discussed in the final report. Task 2F. Deploy automated red tide sensors 1. Description of task: a) Two Optical Phytoplankton Discriminators (OPD or BreveBusters) which can detect the presence of Karenia brevis are jointly supported by the State of Florida and NOAA/IOOS through GCOOS on fixed locations in SW Florida waters. Detection of Karenia is based on a statistical similarity index of the spectral properties of ambient particulates (which may or may not include Karenia) against a reference spectrum for Karenia. The task maintains the operation of the two OPDs on a FWC/FWRI – Mote Cooperative Red Tide Program Mote Marine Laboratory, Sarasota, Florida 17 2. continuous basis, maintained for six months per year by the FWC project and the other six-months by GCOOS. In Year 2, permanent moored OPD locations were secured at New Pass dock (MML) in Sarasota and at a dock at the Sanibel-Captiva Conservation Foundation. In Year 3 these locations are maintained and a third moored OPD will be added in a location to be determined. All data collected by the OPD detectors are available to FWRI/FWC and all other partners in near real-time. These data are also harvested nightly by GCOOS and incorporated into regional ocean observing databases. b) Routine monitoring with a Slocum glider equipped with an OPD will be employed along two to four offshore transects between either the 10 to 30 m isobaths or the 10 m to 40 m isobaths and roughly coinciding with the alongshore region sampled during the offshore transects of Task 2A. Typical sampling frequency during glider deployments provides physical parameters (temperature, salinity, density) roughly every 1 sec and a similarity index (SI) for Karenia approximately every 10-15 min. Differentials between dead-reckoning and observed positions on surfacing provide information on relative current strength and direction. An approximate 5 day deployment results in ~600-700 determinations of Karenia presence and over 400,000 points of physical data. While depth and descent-rate dependent, a complete surface-bottom-surface profile of the glider (a “YO”) occurs approximately once every 0.1 km, with between 500-1000 observations at the maximum depth collected over 5 days. Five deployments will be conducted during the period of August 2014 – May 2015. Activities during this reporting period: a) Scheduled (1) Maintain continuous operation of the two near-surface OPDs. (2) Begin installation of a third near-surface OPD in a location to be determined. (3) Conduct OPD-equipped glider missions (total of five during the contract year including event response activities). b) Conducted (1) Two sites (New Pass Dock and SCCF Dock) were continuously equipped with OPD’s (except for brief periods of maintenance) during this reporting period. The OPD at the MML dock in New Pass reported every 2 hours for the entire period. The other OPD located at the SCCF dock on the north coast of Sanibel Island experienced two periods, totaling 45 days, when communications failures prevented access to its data records. Communications equipment was replaced on February 25, 2015 and data has been available since that repair. (2) Fabrication of the mounting assembly for the OPD installation at the Venice inlet was completed. Departure of OPD technical staff has placed the installation on hold. FWC/FWRI – Mote Cooperative Red Tide Program Mote Marine Laboratory, Sarasota, Florida 18 3. 4. (3) No glider missions were conducted during this reporting period due to the departure of OPD technical staff. During the next reporting period glider missions for this project will be performed by USF/CMS under subcontract from MML. Deliverables produced: a) OPD data were made available to FWRI and other partners in near real-time at http://coolcloud.mote.org/socool_hab/products/60, and http://coolcloud.mote.org/socool_hab/fixed and were similarly available daily to the GCOOS regional ocean observing data portal during this reporting period. Discussion of findings: a) a) The Karenia sp. similarity indexes (SI) determined by the nearsurface OPDs at the MML dock in New Pass showed generally low values (indicative of low levels or absence of red tide) from January 1 until March 9, 2015. Then, coincident with the scheduled replacement of the OPD, several subsequent SI values exceeded 0.6, but were infrequent enough to be considered noise. The most likely explanation for SI offset associated with the maintenance replacement of OPD instruments is the use of different ‘standard’ Karenia sp. model files for the analysis of the SI values in the different instruments. More emphasis will be placed on using a single Karenia sp. model file in all instruments. The OPD at the SCCF dock reported several periods of high Karenia sp. SI values in late February through mid-March. Comparison with microscope counts of K. brevis have not been done to date. Those high SI values could also be caused by high concentrations of small centric diatoms that currently can confound the SI specificity for Karenia sp. Task 2G. Perform supplemental support of collaborative programs 3. Description of task: a) Mote Marine Lab will continue to economically provide essential services to our FWRI/FWC, Sarasota County Department of Health, and Sarasota County collaborators. Samples for daily cell counts (Monday through Friday) will continue to be collected from Mote’s New Pass and Sarasota docks. The existing record which this effort continues forms one of the few data sets suitable for long term trend analysis and allows the evaluation of questions on the impacts of estuarine nutrients on the progression of Karenia blooms. b) To enhance the Healthy Beaches Program and broaden the spatial and temporal coverage of data on red tide distribution, Mote will provide Karenia spp. cell counts in conjunction with weekly bacterial water quality tests at Sarasota beaches performed by the Sarasota County Department of Health. Approximately 16 water samples are analyzed weekly by Mote. Because our detection limits for brevetoxins allows us to detect brevetoxins at equivalent Karenia abundance (5 cells/L) far below detection level by microscope counts (1000 cells/L), brevetoxins will be analyzed for samples collected from the Healthy Beaches Program to FWC/FWRI – Mote Cooperative Red Tide Program Mote Marine Laboratory, Sarasota, Florida 19 4. 5. 6. enhance the capability of early detection of elevated Karenia abundance. For the current project year, we will seek to expand the number and spatial extent of samples we receive from the Florida Healthy Beaches program by partnering with neighboring counties to receive additional samples from these programs. This will be on an opportunistic, as available basis with the goal of adding additional counties by the end of the project year. c) Mote Marine Lab will also provide Karenia spp. cell counts in conjunction with monthly water quality measurements in Sarasota Bay conducted by Mote for Sarasota County. This county water quality monitoring program samples monthly at ~40 stations in the Intracoastal Waterway. Stations are distributed across a gradient of salinity and nutrient concentrations. Physical parameters are measured and samples collected for inorganic and total nutrients (N and P), chlorophyll, oxygen demands, color and turbidity. d) Additionally, water quality sampling in coastal waters of Sarasota County by the Sarasota County Water Resources Department collects samples from 17 stations that will also be analyzed for K. brevis counts at Mote. e) These collections, performed through other funding mechanisms, will be supplemented with cell counts under the proposed project to provide valuable information on the progress and duration of Karenia spp. blooms in a lagoonal environment with terrestrial nutrient sources and in coastal waters. In the event of a red tide, representative water samples will also be collected to monitor changes in brevetoxin composition changes in the Bay. Activities during this reporting period: a) Scheduled: (1) Cell count time series – daily (2) Healthy Beaches – weekly (3) Sarasota Monitoring – monthly (4) Sarasota Coastal – monthly b) Conducted: (1) Near daily local samples, weekly county Healthy Beaches samples, and monthly Sarasota Bay samples were performed as scheduled. The Sarasota County coastal monitoring program has ended. Deliverables produced: a) All cell counts were provided to FWC/FWRI and collaborative partners upon completion (1-3 days). These counts are also included in updated data tables as part of the deliverables associated with this report. b) Brevetoxin data from samples collected and analyzed this quarter and previously unreported data are available in updated data tables as part of the deliverables associated with this report. Discussion of findings: a) Figure 13 shows the total brevetoxin concentration at Sarasota County beach stations for the period of September 2nd to December 1st FWC/FWRI – Mote Cooperative Red Tide Program Mote Marine Laboratory, Sarasota, Florida 20 2014. Elevated concentrations (>3 ng/L) were overwhelmingly due to increases in PbTx-2. It may be worthwhile to compare these data to the longshore water movements. Highest concentrations began at Siesta and Manasota on 10/13/14. Elevated concentrations were later detected at Nokomis and Longboat Key on 10/27/14. The final elevated concentrations were located at Longboat and Blind Pass, the most northerly and most southerly stations. Figure 13. Total Brevetoxin at Sarasota County Beaches; 9/2/14 to 12/1/14. III. Goal 3. Investigate the persistence of toxicity in an unregulated, recreationally harvested shellfish species and a newly approved commercially produced shellfish species to enhance management for public health protection from resources previously and potentially associated with NSP. A. Task 3A. Determine persistence of brevetoxins in an unregulated recreational and a newly approved commercial shellfish food species. 1. Description of Task: a) The continued focus this quarter is definitive exposure, persistence and trophic transfer studies on a recreational species, the carnivorous lightning whelk, Busycon contrarium, and a recently approved commercially produced shellfish species, the filter-feeding sunray venus clam, Macrocallista nimbosa, both of which are a concern for NSP. The rapidly growing M. nimbosa is of particular interest due to an emerging aquaculture industry centered on this species (https://shellfish.ifas.ufl.edu/sunray_venus.html). Currently, little is known FWC/FWRI – Mote Cooperative Red Tide Program Mote Marine Laboratory, Sarasota, Florida 21 2. concerning accumulation, retention and depuration of brevetoxins in the sunray venus clam. Results from sunray venus exposure initiated in Year 2 have been used to design definitive studies for Year-3, consisting of static renewal exposure, monitoring persistence and rate of depuration of brevetoxins and metabolites as well as toxicity by mouse bioassay. In Year 3, results of the accumulation and persistence of brevetoxins and metabolites in sunray venus clams exposed to K. brevis culture will be completed, including the intensity and persistence of toxicity as determined through cooperative work with FWC-FWRI. b) Trophic transfer studies on whelk are also continued to ascertain brevetoxin and metabolite accumulation from contaminated quahog clams. Whelk are fed contaminated prey (Mercenaria mercenaria), in addition to being directly exposed to K. brevis culture. Each species will be monitored for selected periods of time to determine the brevetoxin and toxin metabolite concentrations and persistence, as well as NSP by mouse bioassay performed by FWC-FWRI. The carnivorous whelk will also be maintained in compartmented flow-through exposure habitat utilizing natural seawater. Clams will be added with individual whelks in each compartment to track consumption of brevetoxin-contaminated clams, following a modification of the procedure by Echevarria et al. (2012). In the event of a red tide during the maintenance period, the clams and whelk will be monitored for brevetoxin accumulation and subsequent persistence/depuration following termination of the bloom. Treatments exposing whelks to contaminated and non-contaminated clams will be compared. Results from Year 3 will detail accumulation and persistence of brevetoxins and metabolites in whelk resulting from ingestion of brevetoxin-contaminated clams and from exposure to K. brevis culture. Activities during this reporting period: a) Scheduled: (1) Brevetoxin exposure and persistence studies with sunray venus clam, Macrocallista nimbosa, are scheduled to be completed in Year 3 of the current project. (2) Trophic transfer studies with the lightening whelk, Busycon contrarium, are scheduled to be completed during Year 3 of the current project. (3) Data on accumulation and persistence of brevetoxins and metabolites in natural populations of exposed clams and whelks will be continued during Year 3 of the current project. b) Conducted: (1) A study examining the accumulation and depuration of bervetoxin in M. nimbosa exposed to cultured K. brevis was conducted between Oct. 28, 2014 and Jan. 5, 2015. This experiment is completed and data is presented with this report and discussed below. FWC/FWRI – Mote Cooperative Red Tide Program Mote Marine Laboratory, Sarasota, Florida 22 3. 4. (2) An accumulation and depuration study of trophic transfer of brevetoxins to whelk was initiated on Feb. 26, 2015 and is currently underway. Deliverables produced: a) Data from the accumulation/depuration study with M. nimbosa is included in data tables provided as part of the deliverables with this report and are presented graphically and discussed below. Discussion of findings: a) As shown in Figure 14 the 1018 and 1034 metabolites are the predominate metabolites in all treatments. Figure 15 shows the same data without those metabolites to more easily observe differences. Two peaks were detected with the m/z equal to 1006 and both are considered metabolites. Neither peak was present in control clams. Further collaboration with the FDA Dauphin Island will confirm the metabolites. b) These data clearly show an initial increase in metabolites during the accumulation phase (week 1 and week 2). An increase in 1034 and both 1006 compounds continues throughout the first week of depuration (1 week). Metabolites were greatly reduced but still present at the end of the depuration period (-8 weeks). c) The next phase of this study is to conduct definitive exposure studies using a greater number of individuals for statistical verification and to determine the persistence of NSP in cooperation with FWC-FWRI conducting bioassays on clam tissues. FWC/FWRI – Mote Cooperative Red Tide Program Mote Marine Laboratory, Sarasota, Florida 23 Figure 14. Brevetoxin Metabolites in Sunray Venus Clams Figure 15. Brevetoxin Metabolites in Sunray Venus Clams (w/o m/z 1018 and m/z 1034) B. Task 3B. Provide information, in cooperation with FWRI, for public health protection. 1. Description of Task: a) Results obtained from Years 1-3 for Task 3A will be compiled and analyzed. Long-term exposure and depuration studies will be used to determine the intensity and duration of brevetoxin contamination and toxicity. In collaboration with Dr. Ann Abraham with the US FDA Seafood Safety Lab, Dauphin Island, AL, a comparison of toxicity levels with abundance of primary metabolites will identify potential biomarkers of exposure to brevetoxins in both sunray venus clams and whelk. b) The finished and synthesized data will be provided to resource managers at FDACS and FWC-FWRI and to public health managers at FDOH. This information will be important for developing protocols to identify NSP-potential in the new commercial species, sunray venus clam, and for considering strategies to protect public health from recreational harvest of NSP-contaminated whelk. 2. Activities during this reporting period: a) Scheduled: (1) Compilation and analysis of results from Years 1-3 of the current contract. FWC/FWRI – Mote Cooperative Red Tide Program Mote Marine Laboratory, Sarasota, Florida 24 3. 4. (2) Synthesized data and recommendation for management applications delivered to resource managers at FDACS and FWRI and public health managers at FDOH in year 3. b) Conducted: (1) Compilation and analysis is ongoing. Deliverables produced: a) None during this quarter. Discussion of findings: a) None for this quarter. IV. Goal 4. Minimize the harmful effects of red tide on public health, the economy and living natural resources through the increased education and outreach efforts towards stakeholders and the public. A. Task 4A. Provide data and information to stakeholders from remaining tasks: 1. Description of task: a) Harmful algal blooms, including Karenia blooms, create a cascade of impacts in affected communities. It is crucial that an open dialogue between all community stakeholders and the HAB science community be established and nurtured. As research benchmarks are completed and/or unplanned findings are discovered, this progress will be shared with the community and media in a timely manner. These findings will be announced collaboratively with FWRI/FWC and other science collaborators. b) A variety of methods and platforms will be used to reach as many different stakeholders as possible. Examples of the different techniques to be used include 1) press releases/media events with new findings/developments (such as bloom initiation, ID of a dead zone etc), 2) weekly updates regarding bloom location and movement (when a bloom has been identified) to stakeholders such as resource managers and animal rehabilitation managers, 3) website updates with similar information as 1 and 2, 4) translation of the effort underway (the tasks described in this proposal to the public) on MML’s website, and 5) development and dissemination of fact sheets/brochures reporting new approaches and findings. 2. Activities during this reporting period: a) Scheduled: (1) Press releases, updates, website material (2) Translate updated SOW b) Conducted: (1) None this quarter. 3. Deliverables Produced: a) None this quarter. 4. Discussion of Findings: a) None this quarter. FWC/FWRI – Mote Cooperative Red Tide Program Mote Marine Laboratory, Sarasota, Florida 25 B. Task 4B. Perform community outreach activities 1. Description of task: a) Outreach will be provided by such avenues as maintaining close collaboration with coastal counties through the Beach Conditions Reporting System (BCRS) and enhancing public knowledge through the Mote Red Tide web pages and the collaborative Art of Red Tide Science programs conducted in conjunction with the Ringling Art School. The outcome will minimize harmful effects from red tide through enhanced public awareness. The use of the media (Task 4A) is one method to deliver HAB information to stakeholders. In addition, a variety of other techniques will be used to reach the general public who may or may not use the media as a resource for information and education. The primary objective will be to share important research findings with the public and increase public awareness of Mote’s red tide research programs, recent progress, and collaborations. b) A variety of methods and/or platforms will be used to reach the public with informational and educational material. Examples of these will be to 1) give presentations at the request of local community groups on red tide research and new findings, 2) prepare printed articles in the Mote quarterly magazine, 3) participate in Mote’s Monday@Mote lecture series, 4) provide information on Mote’s website from Goals 1,2, and 3, 5) continue to support SO COOL, the operations center that hosts the Beach Conditions Reporting System (BCRS), a key strategy to mitigate the human health impacts from Karenia blooms, 6) continue the collaboration with Ringling College of Art and Design, ‘The Art of Red Tide Science’ for new outreach products, and 7) establish and maintain a shared Facebook page with FWRI/FWC, and provide weekly postings. 2. Activities during this reporting period: a) Scheduled: (1) Community presentations, Monday @ Mote lecture (2) Magazine, website – opportunistic (3) Support of Beach Conditions Reporting System (BCRS) support (4) Ringling collaboration “The Art of Red Tide Science” (5) Maintain a Facebook page showcasing the FWRI/Mote Red Tide Cooperative agreement b) Conducted: (1) This quarter we continued the Tuesday/Thursday Facebook posts informing followers of project activities such as boat surveys, routing monitoring, and preparatory work for future experiments. 3. Deliverables Produced: a) Product development is ongoing. Accomplishments are documented in this and subsequent reports. 4. Discussion of Findings: a) None this quarter. FWC/FWRI – Mote Cooperative Red Tide Program Mote Marine Laboratory, Sarasota, Florida 26 C. Task 4C. Engage in Citizen Science Activities 1. Description of task: a) In the current project year, we have initiated expansion of outreach efforts to include development of citizen science activities to engage the public and work toward developing a mechanism for the submission of user-generated red-tide data. This involves the initial development of smartphone-based applications for the collection and input of usergenerated data pertaining to red tide. b) Smart-phone microscope application: One part of the project is focused on utilizing existing microscope accessories developed for smart phones to capture and upload images to a server that would run image recognition software to identify and enumerate HAB species. When completed, this project would provide a variety of user groups, including volunteer networks, existing monitoring programs, citizen science-based efforts and resource managers a user-friendly product that would provide real-time or near real-time identification and enumeration of target HAB species, with minimal training and equipment. Under the current project, the focus is on initial testing of the available phone-scopes to determine suitability for incorporating into an application. c) Crowd-sourcing application: A second component of the citizenscience based project is focused on the development of a smartphonebased application that will allow users to input data on red tide beach conditions which will then be uploaded to a server. This will provide beach-goers and other users with an accessible way to report data on potential red tide conditions, and allow citizen data to be harvested and compiled. The current focus is on application development and testing. It is anticipated that the full development of this project would, in the future, result in a BCRS-like site for citizen-generated data. 2. Activities during this reporting period: a) Scheduled: (1) Procurement and testing of smartphone-based microscopes (2) Determine user variables, design user interface for citizen red tide reporting app (3) Begin software development for citizen red tide reporting app b) Conducted: (1) Three (3) smart-phone microscopes were obtained for testing. They included the Neewer 60X Zoom LED Clip-on Microscope Magnifier Micro Lens, the Sky Rocket AppScope quick-attach microscope, and the Carson HookUpz MicroMax Plus 60x-100x LED Microscope MM-240 with Samsung Galaxy S4 adapter. Figure 16 shows images of the scopes in use and provides brief technical information for each scope. FWC/FWRI – Mote Cooperative Red Tide Program Mote Marine Laboratory, Sarasota, Florida 27 Figure 16. Images of 3 phone-based microscopes tested during this quarter along with brief technical data. 3. 4. (2) The development of the citizen science red tide reporting app has advanced considerably. The development environment has been decided (Java SE), the targeted variables that will be collected from users has been determined, and wireframes of the user interface have been developed using Invision, an online prototyping program. Code writing of code for the app has begun. Deliverables Produced: a) Results of testing 3 phone-based microscopes is presented below. b) A URL is provided below that provides a link to the user-interface wireframe mock-up for the red tide reporting app. https://projects.invisionapp.com/share/TU2HNILSD#/screens Discussion of Findings: a) Three smartphone microscopes have been tested. Generally, none of them have adequate magnification and resolution to discriminate different phytoplankton species. The clearest images were obtained by the Neewer scope (Figure 17). While these images were not adequate to discriminate features that would allow for accurate identification of phytoplankton species, there could be a capability of discriminating a very morphologically distinct species, or at least provide a coarse determination of potential species. It may also permit, with development and implementation of software, the ability to generate counts when a bloom of a known species is present. The Sky Rocket AppScope produced images of poorer quality than the Neewer scope, with only 30 x magnification (Figure 18). The Carson HookUpz MicroMax Plus had the highest magnification of the tested scopes (up to 100x with phone digital FWC/FWRI – Mote Cooperative Red Tide Program Mote Marine Laboratory, Sarasota, Florida 28 zoom of 4x) but had very poor image quality (Figure 19). At the maximum magnification, there appears to be the ability to discriminate at least some major features in certain species (Figure 19D), although the poor image quality would severely limit utility. This scope was also the most difficult to use and maintain stability, which would further limit its utility in the field. b) Two additional scopes were pursued but are not currently available. The MicrobeScope by 4D Optical was launched by a Kickstarter campaign but is not yet generally available. This scope seems extremely promising, as it has a magnification of up to 800x. This should be adequate to discriminate K. brevis, although the image quality is unknown at this point. Another scope, the Bodelin Technologies ProScope Micro Mobile Digital Microscope Kit is also promising, as it boasts high-quality glass optics (many of the other scopes use plastic or resin lenses) with an 80x lens. This scope is currently only available for iPhone. Additional scope testing is planned for the next quarter. Figure 17. Images of various phytoplankton cultures (fixed in 1% Utermohl’s iodine solution) captured using the Neewer phone scope at 60x magnification. Panel A is Karenia brevis, panel B is Gyrodinium impudicum, panel C is Prorocentrum rathymum, panel D is Tetraselmis sp. Scale bars = ~200µm. FWC/FWRI – Mote Cooperative Red Tide Program Mote Marine Laboratory, Sarasota, Florida 29 Figure 18. Images of various phytoplankton cultures (fixed in 1% Utermohl’s iodine solution) captured using the Sky Rocket AppScope at 30x magnification. Panel A is Karenia brevis, panel B is Gyrodinium impudicum, panel C is Tetraselmis sp. Scale bars = ~400µm. Figure 19. Images of various phytoplankton cultures (fixed in 1% Utermohl’s iodine solution) captured using the Carson HookUpz MicroMax Plus phone microscope. Panel A is Karenia brevis at 60x, panel B is Karenia brevis at 100x, panel C is Gyrodinium impudicum at 60x, panel D is Gyrodinium impudicum at 100x. Scale bars = ~100µm. FWC/FWRI – Mote Cooperative Red Tide Program Mote Marine Laboratory, Sarasota, Florida 30 c) The development of the smartphone application for citizen red tide reporting is nearly back in-line with the timeline laid out in the Year 3 SOW. The app is being designed for Android phones, in keeping with the current BCRS network that uses Android phones. This also allows the app to be written in Java, which has a broader range of potential platforms and is a more common language. A wireframe mock-up of the user interface has been created by Mote intern Miriam Zeitz with input from the collaborative group currently working on the app project (Barabara Lausche, director of the Marine Policy Institute at Mote, Vince Lovko, program manager for the Mote Phytoplankton Ecology Program, Jim Culter, program manager for the Mote Benthic Ecology Program, and Dr. David Gillman, computer science professor at New College of Florida). This wireframe mock-up is available at the link listed under “Deliverables”. Code writing for the app has also been initiated. It is expected that a full demonstration version of this application will be available by the end of this project year. FWC/FWRI – Mote Cooperative Red Tide Program Mote Marine Laboratory, Sarasota, Florida 31


© Copyright 2026