
Document 175566
How to Make a Decision: The Analytic
Hierarchy Process
T H O M A S L . SAATY
322 Menus Hall
University of Pittsburgh
Pittsburgh, Pennsylvania 15260
People make three general types of judgments to express importance, preference, or likelihood and use them to choose the
best among alternatives in the presence of environmental, social, political, and other influences. They base these judgments
on knowledge in memory or from analyzing benefits, costs, and
risks. From past knowledge, we sometimes can develop standards of excellence and poorness and use them to rate the alternatives one at a time. This is useful in such repetitive situations
as student admissions and salary raises that must conform with
established norms. Without norms one compares alternatives
instead of rating them. Comparisons must fall in an admissible
range of consistency. The analytic hierarchy process (AHP) includes both the rating and comparison methods. Rationality requires developing a reliable hierarchic structure or feedback
network that includes criteria of various types of influence,
stakeholders, and decision alternatives to determine the best
choice.
P
olicy makers at all levels of decision
facilitate their decision making. Through
making in organizations use multiple
criteria to analyze their complex problems.
Multicriteria thinking is used formally to
trade offs it clarifies the advantages and
disadvantages of policy options under circumstances of risk and uncertainty. It is
Copyrishl n-' 1944, Thi> Insliluti^ i>i ManaBL-mfiit birn-iitL-s
(11141 2l(l2/94/24l1(i/0()l9Sl)l 2S
DECISION ANAl.YSrS—SYSThMS
DECISION ANALYSIS—AI'I'LICATIONS
Thi-. pjpef H'J5 ri'ffrifd
INTERFACES 24: 6 November-December 1994 (pp. 19-43)
SAATY
also a tool vital to forming corporate strategies needed for effective competition.
Nearly all of us, in one way or another,
have been brought up to believe that clearheaded logical thinking is our only sure
way to face and solve problems. We also
believe that our feelings and our judgments must be subjected to the acid test of
deductive thinking. But experience suggests that deductive thinking is not natural.
Indeed, we have to practice, and for a long
time, before we can do it well. Since complex problems usually have many related
factors, traditional logical thinking leads to
sequences of ideas that are so tangled that
their interconnections are not readily discerned.
The lack of a coherent procedure to
make decisions is especially troublesome
group. Participation and debate are needed
both among individuals and between the
groups affected. Here two aspects of group
decision making have to be considered.
The first is a rather minor complication,
namely, the discussion and exchange
within the group to reach some kind of
consensus on the given problem. The second is of much greater difficulty. The holistic nature of the given problem necessitates that it be divided into smaller subjectmatter areas within which different groups
of experts determine how each area affects
the total problem. A large and complex
problem can rarely be decomposed simply
into a number of smaller problems whose
solutions can be combined into an overall
answer. If this process is successful, one
can then reconstruct the initial question
and review the proposed solutions. A last
and often crucial disadvantage of many
We have been brought up to
traditional decision-making methods is that
believe that clear-headed
they require specialized expertise to design
logical thinking is our only
the appropriate structure and then to
sure way to solve problems.
embed the decision-making process in it,
A decision-making approach should
when our intuition alone cannot help us to have the following characteristics;
determine which of several options is the
—Be simple in construct,
most desirable, or the least objectionable,
—Be adaptable to both groups and indiand neither logic nor intuition are of help.
viduals,
Therefore, we need a way to determine
—Be natural to our intuition and general
which objective outweighs another, both
thinking,
in the near and long terms. Since we are
—^Encourage compromise and consensus
concerned with real-life problems we must
building, and
recognize the necessity for trade-offs to
—Not require inordinate specialization to
best serve the common interest. Therefore,
master and communicate [Saaty 1982].
this process should also allow for consenIn addition, the details of the processes
sus building and compromise.
leading up to the decision-making process
Individual knowledge and experience
should be easy to review.
are inadequate in making decisions conAt the core of the problems that our
cerning the welfare and quality of life for a method addresses is the need to assess the
INTERFACES 24:6
20
THE ANALYTIC HIERARCHY PROCESS
benefits, the costs, and the risks of the proposed solutions. We must answer such
questions as the following: Which consequences weigh more heavily than others?
Which aims are more important than others? What is likely to take place? What
should we plan for and how do we bring it
about? These and other questions demand
a multicriteria logic. It has been demonstrated over and over by practitioners who
use the theory discussed in this paper that
multicriteria logic gives different and often
better answers to these questions than ordinary logic and does it efficiently.
To make a decision one needs various
kinds of knowledge, information, and
technical data. These concern
— Details about the problem for which a
decision is needed,
^ T h e people or actors involved,
—Their objectives and policies,
—The influences affecting the outcomes,
and
—The time horizons, scenarios, and constraints.
The set of potential outcomes or alternatives from which to choose are the essence
of decision making. In laying out the
framework for making a decision, one
needs to sort the elements into groupings
or clusters that have similar influences or
effects. One must also arrange them in
some rational order to trace the outcome of
these influences. Briefly, we see decision
making as a process that involves the following steps:
(1) Structure a problem with a model that
shows the problem's key elements and
their relationships.
(2) Elicit judgments that reflect knowledge,
feelings, or emotions.
(3) Represent those judgments with meaningful numbers.
(4) Use these numbers to calculate the
priorities of the elements of the hierarchy.
(5) Synthesize these results to determine
an overall outcome.
(6) Analyze sensitivity to changes in judgment [Saaty 1977].
The decision making process described
in this paper meets these criteria. I call it
the analytic hierarchy process (AHP). The
November-December 1994
21
Deductive thinking is not
natural.
AHP is about breaking a problem down
and then aggregating the solutions of all
the subproblems into a conclusion. It facilitates decision making by organizing perceptions, feelings, judgments, and memories into a framework that exhibits the
forces that influence a decision. In the simple and most common case, the forces are
arranged from the more general and less
controllable to the more specific and controllable. The AHP is based on the innate
human ability to make sound judgments
about small problems. It has been applied
in a variety of decisions and planning projects in nearly 20 countries.
Here rationality is
—Focusing on the goal of solving the
problem;
—Knowing enough about a problem to develop a complete structure of relations
and influences;
—Having enough knowledge and experience and access to the knowledge and
experience of others to assess the prior-
SAATY
ity of influence and dominance (importance, preference, or likelihood to the
goal as appropriate) among the relations
in the structure;
—Allowing for differences in opinion with
an ability to develop a best compromise.
How to Structure a Hierarchy
Perhaps the most creative part of decision making that has a significant effect on
the outcome is modeling the problem. In
the AHP, a problem is structured as a hierarchy. This is then followed by a process
of prioritization, which we describe in detail later. Prioritization involves eliciting
judgments in response to questions about
the dominance of one element over another when compared with respect to a
property. The basic principle to follow in
creating this structure is always to see if
one can answer the following question:
Can I compare the elements on a lower
level using some or all of the elements on
the next higher level as criteria or attributes of the lower level elements?
A useful way to proceed in structuring a
decision is to come down from the goal as
far as one can by decomposing it into the
most general and most easily controlled
factors. One can then go up from the alternatives beginning with the simplest subcriteria that they must satisfy and aggregating
the subcriteria into generic higher level criteria until the levels of the two processes
are linked in such a way as to make comparison possible.
Here are some suggestions for an elaborate design of a hierarchy: (1) Identify the
overall goal. What are you trying to accomplish? What is the main question? (2)
Identify the subgoals of the overall goal. If
relevant, identify time horizons that affect
the decision. (3) Identify criteria that must
be satisfied to fulfill the subgoals of the
overall goal. (4) Identify subcriteria under
each criterion. Note that criteria or subcriteria may be specified in terms of ranges t)f
values of parameters or in terms of verbal
intensities such as high, medium, low. (5)
Identify the actors involved. (6) Identify
the actors' goals. (7) Identify the actors'
policies. (8) Identify options or outcomes.
(9) For yes-no decisions, take the most preferred outcome and compare the benefits
and costs of making the decision with
those of not making it. (10) Do a benefit/
cost analysis using marginal values. Be- ,
cause we are dealing with dominance hierarchies, ask which alternative yields the
greatest benefit; for costs, which alternative costs the most, and for risks, which alternative is more risky.
The Hospice Problem
Westmoreland County Hospital in Western Pennsylvania, like hospitals in many
other counties around the nation, has been
concerned with the costs of the facilities
and manpower involved in taking care of
terminally ill patients. Normally these patients do not need as much medical attention as do other patients. Those who best
utilize the limited resources in a hospital
are patients who require the medical attention of its specialists and advanced technology equipment—whose utilization depends on the demand of patients admitted
into the hospital. The terminally ill need
medical attention only episodically. Most
of the time such patients need psychological support. Such support is best given by
the patient's family, whose members are
able to supply the love and care the patients most need. For the mental health of
INTERFACES 24:6
22
THE ANALYTIC HIERARCHY PROCESS
the patient, home therapy is a benefit.
From the medical standpoint, especially
during a crisis, the hospital provides a
greater benefit. Most patients need the
help of medical professionals only during a
crisis. Some will also need equipment and
surgery. The planning association of the
hospital wanted to develop alternatives
and to choose the best one considering
various criteria from the standpoint of the
patient, the hospital, the community, and
society at large. In this problem, we need
to consider the costs and benefits of the
decision. Cost includes economic costs and
all sorts of intangibles, such as inconvenience and pain. Such disbenefits are not
directly related to benefits as their mathematical inverses, because patients infinitely
prefer the benefits of good health to these
intangible disbenefits. To study the problem, one needs to deal with benefits and
with costs separately.
Approaching the Problem
1 met with representatives of the planning association for several hours to decide
on the best alternative. To make a decision
by considering benefits and costs, one
must first answer the question; In this
problem, do the benefits justify the costs?
If they do, then either the benefits are so
much more important than the costs that
the decision is based simply on benefits, or
the two are so close in value that both the
benefits and the costs should be considered. Then we use two hierarchies for the
purpose and make the choice by forming
ratios of the priorities of the alternatives
(benefits ^,/costs c,) from them. One asks
which is most beneficial in the benefits hierarchy (Figure 1) and which is most costly
in the costs hierarchy (Figure 2). If the
benefits do not justify the costs, the costs
alone determine the best alternative—that
which is the least costly. In this example,
we decided that both benefits and costs
had to be considered in separate hierarchies. In a risk problem, a third hierarchy
is used to determine the most desired alternative with respect to all three: benefits,
costs, and risks. In this problem, we assumed risk to be the same for all contingencies. Whereas for most decisions one
uses only a single hierarchy, we constructed two hierarchies for the hospice
problem, one for benefits or gains (which
model of hospice care yields the greater
benefit) and one for costs or pains (which
model costs more).
The planning association thought the
concepts of benefits and costs were too
general to enable it to make a decision.
Thus, the planners and I further subdivided each (benefits and costs) into detailed subcriteria to enable the group to develop alternatives and to evaluate the finer
distinctions the members perceived between the three alternatives. The alternatives were to care for terminally ill patients
at the hospital, at home, or partly at the
hospital and partly at home.
For each of the two hierarchies, benefits
and costs, the goal clearly had to be choosing the best hospice. We placed this goal at
the top of each hierarchy. Then the group
discussed and identified overall criteria for
each hierarchy; these criteria need not be
the same for the benefits as for the costs.
The two hierarchies are fairly clear and
straightforward in their description. They
descend from the more genera! criteria in
the second level to secondary subcriteria in
the third level and then to tertiary subcri-
November-December 1994
23
SAATY
Choosing Best Hospice
QOM.
Benefits Hierarchy
Recipient Benefits
0.64
GENERAL
CRfTERIA
SECONDARY
SUBCRITERIA
Physical
0.16
TERTIARY
SUBCRITERIA
Diroct care of
- patients
D.D2
nstrtutkmal Benefits
0.26
Psycho-social
0.44
Vslunteer
support
0.02
histvvoiking in
' familiss
0.06
. Psiliativ« cars
0.14
Economic
Psycho-social
0.23
Reduced costs
0.01
Publtcrty and
public relations
0.19
Voluntoot
recruitmant
0.03
Improved
*-productivitv
0.03
Relief of post- death distress
0.12
ProfessForial
recruitment and
support
0.06
Societal Benefits
0.10
Economic
0.03
Death as a
social issue
0,02
Reduced length
ot stay
0.006
Better udllzat'ion
• of resources
0,023
Rehun^nization of
. medical, professiona/
and heatm institutions
COS
Increased finandal
support fnam the
community
aooi
Emotional suppori
to family and patient
0.21
Alleviation of guilt
0.03
- - - (Each altemative model below is ccmnected to everv tertiary subcriterionl - - ALTERNATIVES
MODEL 1
0.43
MODEL 2
0.12
MODEL 3
0.45
Unit of beds with Team
•ivir>q home care (as in a
nospital or nursing homs)
Mixed bad. contraciual home care
(Parjy in hospital tor emergency
care and partiy in home when bettor
- no nurses go to the ixiuse)
Hospital ar>d home care share
case marwgement (with visiting
nurses to tho i>ome; H extramely
sick pationt goes to tha hospital)
Figure 1: To choose the best hospice plan, one constructs a hierarchy modeling the benefits to
the patient, to the institution, and to society. This is the benefits hierarchy of two separate
hierarchies.
teria in tho fourth level on to the alternatives at the bottom or fifth level.
At the general criteria level, each of the
hierarchies, benefits or costs, invoived
three major interests. The decision should
benefit the recipient, the institution, and
society as a whole, and their relative importance is the prime determinant as to
which outcome is more likely to be preferred. We located these three elements on
the second level of the benefits hierarchy.
As the decision would benefit each party
differently and the importance of the benefits to each recipient affects the outcome,
the group thought that it was important to
specify the types of benefit for the recipi-
ent and the institution. Recipients want
physical, psycho-social and economic benefits, while the institution wants only psychosocial and economic benefits. We located these benefits in the third level of the
hierarchy. Each of these in turn needed
further decomposition into specific items in
terms of which the decision alternatives
could be evaluated. For example, while the
recipient measures economic benefits in
terms of reduced costs and improved productivity, the institution needed the more
specific measurements of reduced length of
stay, better utilization of resources, and increased financial support from the community. There was no reason to decompose
INTERFACES 24:6
24
THE ANALYTIC HIERARCHY PROCESS
Choosing Best Hospice
GOAL
Costs Hierarchy
GENERAL
CRITERIA
SECONDARY
SUBCRITERIA
Capital
0.03
TERTIARY
SUBCRITERIA
Societal Costs
0.15
Costs
Communrty Costs
0.14
0.21
Operating
0.40
Educatton
0.07
Community
0.01
Training staff
0.06
Recrurtment
0.06
Bad debt
0.15
Staff
0.06
Volunteers
0.01
(Each altemative model below is conrwcted to every node that has no further branch)
ALTERNATIVES
MODEL 1
0.58
MODEL 2
0.19
MODEL 3
0.23
Unit of beds with team
giving home care (as in a
hospital or nursir^ horr>e)
Mixed bed. contractual home care
(Partly in !v>spftal for emergency
care and partly in horrve when better
- no nurses go to the house)
Hospital and home care share
case menegement (with visiting
nurses to the home; (f uxtremely
sick patient goes to the hosprtaO
Figure 2: To choose the best hospice plan, one constructs a hierarchy modeling the community,
institutional, and societal costs. This is the costs hierarchy of two separate hierarchies.
the societal benefits into a third level subcriteria, hence societal benefits connects directly tu the fourth level. The group considered three models for the decision alternatives, and located them on the bottom or
fifth level of the hierarchy: In Model 1, the
hospital provided full care to the patients;
In Model 2, the family cares for the patient
at home, and the hospital provides only
emergency treatment (no nurses go to the
house); and in Model 3, the hospital and
the home share patient care (with visiting
nurses going to the home).
In the costs hierarchy there were also
three major interests in the second level
that would incur costs or pains: community, institution, and society. In this decision the costs incurred by the patient were
not included as a separate factor. Patient
and family could be thought of as part of
the community. We thought decomposi-
tion was necessary only for institutional
costs. We included five such costs in the
third level: capital costs, operating costs,
education costs, bad debt costs, and recruitment costs. Educational costs apply to
educating the community and training the
staff. Recruitment costs apply to staff and
volunteers. Since both the costs hierarchy
and the benefits hierarchy concern the
same decision, they both have the same alternatives in their bottom levels, even
though the costs hierarchy has fewer
levels.
Judgments and Comparisons
A judgment or comparison is tbe numerical representation of a relationship between two elements that share a common
parent. The set of all such judgments can
be represented in a square matrix in wbicb
the set of elements is compared with itself.
Each judgment represents the dominance
November-December 1994
25
SAATY
of an element in the column on the left
over an element in the row on top. It reflects the answers to two questions: Which
of the two elements is more important
with respect to a higher level criterion, and
how strongly, using the 1-9 scale shown in
Table 1 for the element on the left over the
element at the top of the matrix? If the element on the left is less important than that
on the top of the matrix, we enter the reIntensity of
Importance
ciprocal value in the corresponding position in the matrix. It is important to note
that the lesser element is always used as
the unit and the greater one is estimated as
a multiple of that unit. From all the paired
comparisons we calculate the priorities and
exhibit them on the right of the matrix. For
a set of n elements in a matrix one needs
n{ii - l)/2 comparisons because there are
u I's on the diagonal for comparing ele-
Definition
Explanation
Equal Importance
Two activities contribute equally to
the objective.
Experience and judgment slightly
favor one activity t>ver another.
Experience and judgment strongly
favor one activity over another.
An activity is favored very strongly
over another, its dominance
demonstrated in practice.
The evidence favoring one activity
over another is of the highest
Moderate importance
Strong importance
Very strt)ng or demonstrated
importance
Extreme importance
possible order of affirmation.
2, 4, 6, 8
For compromise between the
above values
Reciprocals
of above
Rationals
If activity i has one of the above
nonzero numbers assigned to
it when compared with
activity /, then / has the
reciprocal value when
compared with ('
Ratios arising from the scale
1.1-1,9
For tied activities
Sometimes one needs to interpolate
a compromise judgment
numerically because there is no
good word to describe it.
A comparison mandated by choosing
the smaller element as the unit to
estimate the larger one as a
multiple of that unit.
If consistency were to be forced by
obtaining ;/ numerical values to
span the matrix.
When elements are close and nearly
indistinguishable; moderate is 1,3
and extreme is 1,9,
Table 1: The fundamental scale is a scale of absolute numbers used to assign numerical values
to judgments made by comparing two elements with the smaller element used as the unit and
the larger one assigned a value from this scale as a multiple of that unit.
INTERFACES 24:6
26
THE ANALYTIC HIERARCHY PROCESS
ments with themselves and of the remaining judgments, half are reciprocals. Thus
we have {n^ — n)/2 judgments. In some
problems one may elicit only the minimum
of It — 1 judgments.
As usual with the AHP, in both the cost
and the benefits models, we compared the
criteria and subcriteria according to their
relative importance with respect to the parent element in the adjacent upper level.
For example, in the first matrix of comparisons of the three benefits criteria with respect to the goal of choosing the best hospice alternative, recipient benefits are moderately more important than institutional
benefits and are assigned the absolute
number 3 in the (1, 2) or first-row, secondcolumn position. Three signifies three
times more. The reciprocal value is automatically entered in the (2, 1) position,
where institutional benefits on the left are
compared with recipient benefits at the
top. Similarly a 5, corresponding to strong
dominance or importance, is assigned to
recipient benefits over social benefits in the
(1, 3) position, and a 3, corresponding to
moderate dominance, is assigned to institutional benefits over social benefits in the (2,
3) position with corresponding reciprocals
in the transpose positions of the matrix.
Judgments in a matrix may not be conChoosing Best
Hospice
Recipient Benefits
Institutional Benefits
Societal Benefits
sistent. In eliciting judgments, one makes
redundant comparisons to improve the validity of the answer, given that respondents may be uncertain or may make poor
judgments in comparing some of the elements. Redundancy gives rise to multiple
comparisons of an element with other elements and hence to numerical inconsistencies. For example, where we compare recipient benefits with institutional benefits
and with societal benefits, we have the respective judgments 3 and 5. Now \i x = 3y
and X = 5z then 3i/ = 52 or y ^ 5/32. If the
judges were consistent, institutional benefits would be assigned the value 5/3 instead of the 3 given in the matrix. Thus the
judgments are inconsistent. In fact, we are
not sure which judgments are more accurate and which are the cause of the inconsistency. Inconsistency is inherent in the
judgment process. Inconsistency may be
considered a tolerable error in measurement only when it is of a lower order of
magnitude (10 percent) than the actual
measurement itself; otherwise the inconsistency would bias the result by a sizable error comparable to or exceeding the actual
measurement itself.
When the judgments are inconsistent,
the decision maker may not know where
the greatest inconsistency is. The AHP can
Recipient
Benefit5
Institutional
Benefits
1
3
1
1/3
1/3
Social
Benefits
Priorities
.64
M
.11
C,R, - ,033
Table 2: The entries in this matrix respond to the question. Which criterion is more important
with respect to choosing the best hospice alternative and how strongly?
November-December 1994
27
SAATY
show one by one in sequential order which
judgments are the most inconsistent, and
also suggests the value that best improves
consistency. However, this recommendation may not necessarily lead to a more accurate set of priorities that correspond to
some underlying preference of the decision
object of evaluation is to elicit judgments
concerning relative importance of the elements of the hierarchy to create scales of
priority of influence.
Because the benefits priorities of the alternatives at the bottom level belong to a
ratio scale and their costs priorities also belong to a ratio scale, and since the product
or quotient (but not the sum or the differA decision-making approach
ence) of two ratio scales is also a ratio
should be natural to our
scale, to derive the answer we divide the
intuition and general thinking. benefits priority of each alternative by its
costs priority. We then choose the alternamakers. Greater consistency does not imtive with the largest of these ratios. It is
ply greater accuracy and one should go
also possible to allocate a resource proporabout improving consistency {if one can be tionately among the alternatives.
given the available knowledge) by making
I will explain how priorities are develslight changes compatible with one s unoped from judgments and how they are
derstanding. If one cannot reach an accept- synthesized down the hierarchy by a proable level of consistency, one should
cess of weighting and adding to go from
gather more information or reexamine the
local priorities derived from judgments
framework of the hierarchy.
with respect to a single criterion to global
Under each matrix I have indicated a
priorities derived from multiplication by
consistency ratio (CR) comparing the inthe priority of the criterion and overall
consistency of the set of judgments in that
priorities derived by adding the global
matrix with what it would be if the judgpriorities of the same element. The local
ments and the corresponding reciprocals
priorities are listed on the right of each
were taken at random from the scale. For a matrix. If the judgments are perfectly con3-by-3 matrix this ratio should be about
sistent, and hence CR = 0, we obtain the
five percent, for a 4-by-4 about eight perlocal priorities by adding the values in
cent, and for larger matrices, about 10 per- each row and dividing by the sum of all
cent.
the judgments, or simply by normalizing
the judgments in any column, by dividing
Priorities are numerical ranks measured
each entry by the sum of the entries in that
on a ratio scale. A ratio scale is a set of
column. If the judgments are inconsistent
positive numbers whose ratios remain the
but have a tolerable level of inconsistency,
same if all the numbers are multiplied by
we obtain the priorities by raising the maan arbitrary positive number. An example
trix to large powers, which is known to
is the scale used to measure weight. The
take into consideration all intransitivities
ratio of these weights is the same in
pounds and in kilograms. Here one scale is between the elements, such as those 1
showed above between x,xj,and 2 [Saaty
just a constant multiple of the other. The
INTERFACES 24:6
28
THE ANALYTIC HIERARCHY PROCESS
1994]. Again, we obtain the priorities from
this matrix by adding the judgment values
in each row and dividing by the sum of all
the judgments. To summarize, the global
priorities at the level immediately under
the goal are equal to the local priorities because the priority of the goal is equal to
one. The global priorities at the next level
are obtained by weighting the local priorities of this level by the global priority at
the level immediately above and so on.
The overall priorities of the alternatives are
obtained by weighting the local priorities
by the global priorities of all the parent criteria or subcriteria in terms of which they
are compared and then adding. (If an element in a set is not comparable with the
others on some property and should be left
out, the local priorities can be augmented
by adding a zero in the appropriate position.)
In comparing the three models for patient care, we asked members of the planning association which model they preferred with respect to each of the covering
or parent secondary criterion in level 3 or
with respect to the tertiary criteria in level
4. For example, for the subcriteritin direct
care (located on the left-most branch in the
benefits hierarchy), we obtained a matrix
of paired comparisons (Table 4) in which
Model 1 is preferred over Models 2 and 3
by 5 and 3 respectively, and Model 3 is
preferred by 3 over Model 2. The group
first made all the comparisons using semantic terms for the fundamental scale
and then translated them to the corresponding numbers.
Table 3: The entries in this matrix respond to
the question. Which subcriterion yields the
greater benefit with respect to institutional
benefits and how strongly?
For the costs hierarchy, I again illustrate
with three matrices. First the group compared the three major cost criteria and provided judgments in response to the question: which criterion is a more important
determinant of the cost of a hospice
model? Table 5 shows the judgments obtained.
The group then compared the subcriteria
under institutional costs and obtained the
importance matrix shown in Table 6.
Finally we compared the three models to
find out which incurs the highest cost for
each criterion or subcriterion. Table 7
shows the results of comparing them with
respect to the costs of recruiting staff.
As shown in Table 8, we divided the benefits priorities by the costs priorities for each
alternative to obtain the best alternative,
model 3, the one with the largest value for
the ratio.
Table 8 shows two ways or modes of
synthesizing the local priorities of the alternatives using the global priorities of
November-December 1994
29
The process is repeated in all the matrices by asking the appropriate dominance
or importance question. For example, for
the matrix comparing the subcriteria of the
parent criterion institutional benefits (Table
3), psychosocia! benefits are regarded as
very strongly more important than economic benefits, and 7 is entered in the (1,
2) position and 1/7 in the (2, 1) position.
Institutional
Benefits
Psychosocial Economic Priorities
Psychosocial
Economics
1
1/7
.875
.125
C.R. = .000
SAATY
Direct Care of
Patient
Model I—
Unit/Team
Model II—
Mixed/
Home Care
Model HI—
Case
Management
Model I
Model I!
Model III
1
Priorities
0.64
1/5
1/3
1/3
0.10
0.26
C.R. = .033
Table 4: The entries in this matrix respond to the question. Which model yields the greater
benefit with respect to direct care of the patient and how strongly?
their parent criteria: The distributive mode
and the idea! mode. In the distributive
mode, the weights of the alternatives sum
to one. It is used when there is dependence among the alternatives and a unit
priority is distributed among them. The
ideal mode is used to obtain the single best
alternative regardless of what other alternatives there are. In the ideal mode, the local priorities of the alternatives are divided
by the largest value among them. This is
done for each criterion; for each criterion
one alternative becomes an ideal with
value one. In both modes, the local priorities are weighted by the global priorities of
the parent criteria and synthesized and the
Choosing Best
Hospice (Costs)
Community
Costs
Institutional
Costs
Societal Costs
Community
benefit-to-cost ratios formed. In this case,
both modes lead to the same outcome for
hospice, which is model 3. As we shall see
below, we need both modes to deal with
the effect of adding {or deleting) alternatives on an already ranked set.
Model 3 has the largest ratio scale values
of benefits to costs in both the distributive
and ideal modes, and the hospital selected
it for treating terminal patients. This need
not always be the case. In this case, there
is dependence of the personnel resources
allocated to the three models because some
of these resources would be shifted based
on the decision. Therefore the distributive
mode is the appropriate method of syntheInstitutional
Societal
Priorities
1/5
0.14
1
1/5
0.71
0.14
C.R. = .000
Table 5: The entries in this matrix respond to the question, Which criterion is a greater determinant of cost with respect to the care method and how strongly?
INTERFACES 24:6
30
THE ANALYTIC HIERARCHY PROCESS
Institutional
Costs
Capital
Operating
Education
Bad Debt
Recruitment
Priorities
1
7
4
7
1
1/7
1
1/9
1/4
1/5
1/4
9
1
2
1
1/7
4
1/2
1
1/3
1
5
0.05
0,57
0,10
0.21
0.07
Capital
Operating
Hdiitzation
Bad Debt
Recruitment
1
3
1
C.R. = .08
Table 6: The entries in this matrix respond to the question. Which criterion incurs greater institutional costs and how strongly?
sis. If the alternatives were sufficiently distinct with no dependence in their definition, the ideal mode would be the way to
synthesize.
I also performed marginal analysis to determine where the hospital should allocate
additional resources for the greatest marginal return. To perform marginal analysis,
I first ordered the alternatives by increasing cost priorities and then formed the
benefit-to-cost ratios corresponding to the
smallest cost, followed by the ratios of the
differences of successive benefits to costs.
If this difference in benefits is negative, the
new alternative is dropped from consideration and the process continued. The alternative with the largest marginal ratio is
then chosen. For the costs and correspondInstitutional Costs
for Recruiting Staff
Model I—Unit/
Team
Model II—Mixed/
Home Care
Model III—Case
Management
ing benefits from the synthesis rows in Table 8 I obtained;
Costs:
Benefits:
0.20
0.12
Marginal Ratios:
0.21
0.45
0.59
0.43
0.12
= 0.60
0.20
0.45 - 0.12
- 33
0.21 - 0.20
0.43 - 0.45
- -0.05
0.59 - 0.21
The third alternative is not a contender
for resources because its marginal return is
negative. The second alternative is best, in
fact, in addition to adopting the third
model, the hospital management chose the
Model 1
Model II
Model III
Priorities
1
4
4
.66
1/4
1
1
.17
1/4
1
I
.17
C.R. = .000
Table 7: The entries in this matrix respond to the question. Which model incurs greater cost
with respect to institutional costs for recruiting staff and how strongly?
November-December 1994
31
SAATY
Distributive Mode
Bent-fits
Direct Care of Patient
Palliative Care
Volunlt'er Support
Networking in Families
Relief of Post Death Stress
Emotional Support of Family
and Patient
Alleviation of Guilt
Reduced Economic Costs for
Patient
Improved Productivity
Publicitv and Public Relations
Volunteer Recruitment
Professional Recruitment and
Support
Reduced Length of Stay
Better Utilization of Resources
Increased Monetary Support
Death as a Social Issue
Rehumanization of Institutions
Priorities
0,02
0.14
Model 1
Model 2
ell Mode
Model 3
Model 1
Model 2
Model 3
0.06
0.12
0.64
0.64
0.09
0.46
0.30
0.10
0.10
0.17
0,22
0.08
0.26
0.26
0.74
0.32
0.62
1.000
1.000
0.122
1.000
0,484
0.156
0.156
0.230
0.478
0,129
0.406
0.406
1.000
0.696
1.000
0.21
0.03
0.30
0,30
0.08
0.08
0.62
0,62
0,484
0.484
0.129
0.129
1.000
1.000
0.01
0.03
0,!9
0.03
0,12
0.12
0.63
0.64
0.65
0.27
0,08
0.10
0,23
0.61
0.29
0.26
0.185
0.197
1.000
1.000
1.000
0.443
0.127
0.156
0.354
1,000
0.460
0.406
0.06
0.006
0 023
0.001
0.02
0.08
0.65
0,26
0.09
0,73
0.20
0.24
0.23
0,10
0.22
0.08
0.20
0.14
0.12
0.64
0-69
0,19
0.60
0.62
1.000
0.406
0.130
1.000
0.333
0.387
0.354
0.406
0.130
1.000
0.333
0,226
0.185
1.000
1.000
0,260
1.000
1.000
0 428
0.121
0.451
0.424
0.123
0.453
0.14
0.03
0.40
0 33
0.76
0.73
0.33
0.09
0.08
0.33
0.15
0.19
1.000
1.000
1.000
1,000
0.118
0.110
1.000
0.197
0.260
0,01
0.65
0.24
0.11
1,000
0.369
0.169
0.06
0.15
0.56
0.60
0.32
0.20
0.12
0.20
1.000
1.000
0.571
0.333
0.214
0.333
0.03
0.66
0.17
0.17
1.000
0.258
0.258
0.01
0.15
0.60
0.33
0.20
0.33
0.20
0,33
1.000
1.000
0.333
1.000
0.333
1.000
Synthesis
0.583
0.192
0,224
0.523
0.229
0.249
Benefit/Cost Ratio
0.734
0,630
2.013
0.811
0,537
1,819
002
Synthesis
Costs
Community Costs
Institutional Capital Costs
Institutional Operating Costs
institutional Costs for Educating;
the Community
Institutional Costs tor Training
Staff
Institutional Bad Debt
Institutional Costs of Recruiting
Staff
Institutional Costs of Recruiting
Volunteers
Societal Costs
Table 8: The benefit/cost ratios of the three models given in the bottom row of the table are
obtained for both the distributive and ideal modes. Here one multiplies each of the six columns of priorities of a model by the column of criteria weights on the left and adds to obtain
the synthesis of overall priorities, once for the benefits (top half of table) and once for the costs
(bottom half of table) and forms the ratios of corresponding synthesis numbers to arrive at the
benefit/cost ratio (bottom row of table).
INTERFACES 24:6
32
THE ANALYTIC HIERARCHY PROCESS
second model of hospice care for further
development.
Absolute Measurement
Cognitive psychologists have recognized
for some time that people are able to make
two kinds of comparisons—absolute and
relative. In absolute comparisons, people
compare alfernatives with a standard in
their memory that they have developed
through experience. In relative comparisons, they compared alternatives in pairs
according to a common attribute, as we did
throughout the hospice example.
People use absolute measurement
(sometimes also called rating) to rank independent alternatives one at a time in terms
of rating intensities for each of the criteria.
An intensity is a range of variation of a criterion that enables one to distinguish the
quality of an alternative for that criterion.
An intensity may be expressed as a numerical range of values if the criterion is measurable or in qualitative terms. For exampic, if ranking students is the objective and
one of the criteria on which they are to be
ranked is performance in mathematics, the
mathematics ratings might be: excellent,
good, average, below average, poor; or, using the usual school terminology, A, B, C,
D, and F. Relative comparisons are first
used to set priorities on the ratings themselves, if desired, one can fit a continuous
curve through the derived intensities. This
concept may go against our socialization.
However, it is perfectly reasonable to ask
how much an A is preferred to a B or to a
C. Tbe judgment of bow much an A is
preferred to a B might be different under
different criteria. Perhaps for mathematics
an A is very strongly preferred to a B,
while for physical education an A is only
November-December 1994
moderately preferred to a B. So the end result might be that the ratings are scaled differently. For example one could have the
following scale values for the ratings:
MATH
A
B
C
D
E
0.50
0.30
0.15
0.04
0.01
PHYSICAL
EDUCATION
0.30
0.30
0.20,
OM.
0.10
The alternatives are then rated or ticked
off one at a time on the intensities.
I will illustrate absolute measurement
with an example. A firm evaluates its employees for raises. The criteria are dependability, education, experience, and quality.
Each criterion is subdivided into intensities, standards, or subcriteria (Figure 3).
The managers set priorities for the criteria
by comparing them in pairs. They then
pairwise compare the intensities according
to priority with respect to tbeir parent criterion (as in Table 9) or with respect to a
subcriterion if they are using a deeper hierarchy. The priorities of the intensities are
divided by the largest intensity for each
criterion (second column of priorities in
Figure 3). Table 9 shows a paired comparison matrix of intensities with respect to dependability. The managers answer the
question. Which intensity is more important and by how much with respect to dependability? The answer will depend on
the kind of job. "Outstanding" is much
more preferred t)ver "above average" for a
soldier guarding a nuclear missile sight
than for a waiter in a restaurant. Comparison of intensities requires expert judgment
33
SAATY
GOAL
Dependability
.4347
Education
.211A
Outstanding
(0.182) 1.000
Experience
.1755
- Doctorate
(0.144) 1.000
Exceptional
(0.086) 1.000
Outstanding
(0.056) 1.000
Above Average
(0.029) 0.518
Above Average
(0.114) 0.626
Masters
(0.071) 0.493
A Lot
(0.050)
Average
(0.070) 0.385
Bachelor
(0.041) 0.285
Average
(0.023) 0.267
Below Average
(0.042) 0.231
H.S.
(0.014)
Unsatisfactory
(0.027) 0.148
Uneducated
(0.007) 0.049
0.097
0.580
V A Little
(0.010) 0.116
None
(0.006)
Average
(0.018) 0.321
Beiow Average
(0.006) 0.107
Unsatisfactory
(0.003) 0.054
0.070
Figure 3: An evaluation hierarchy can be used lo rate employees.
in each problem and for each criteritm. Finally, the managers rate each individual
(Table 10) by assigning the intensity rating
that applies to him or her under each criterion. The scores of these intensities are
each weighted by the priority of its criterion and summed to derive a total ratio
scale score for the individual (shown on
the right of Table 10). These numbers beOutstanding
Outstanding
Above Average
Average
Below Average
Unsatisfactory
1.0
V2
1/3
1/4
1/5
Above
Average
2.0
1,0
1/2
1/3
1/4
long to a ratio scale, and the managers can
give salary increases precisely in proportion to the ratios of these numbers. Adams
gets the highest score and Kesselman the
lowest. This approach can be used whenever it is possible to set priorities for intensities of criteria; people can usually do this
when they have sufficient experience with
a given operation. This normative mode
Average
Below
Average
Unsatisfactory
Priorities
3.0
2,0
1,0
1/2
1/3
4,0
3.0
2,0
1,0
1/2
5,0
4,0
3,0
2.0
1.0
0,419
0,263
0.160
0.097
0,062
CR, = 0,015
Table 9: Ranking intensities: Which intensity is preferred most with respect to dependability
and how strongly?
INTERFACES 24:6
34
THE ANALYTIC HIERARCHY PROCESS
1,
2,
3,
4,
5,
6.
7.
Adams, V,
Becker, L.
Hayat, F.
Kesseiman, S.
O'Shea, K,
Peters, T,
Tobias, K.
Dependability
0.4347
Education
0.2774
Experience
0,1775
Quality 0,1123
Total
Outstanding
Average
Average
Above Average
Average
Average
Above Average
Bachelor
Bachelor
Masters
H.S.
Doctorate
Doctorate
Bachelor
A Little
A Little
A Lot
None
A Lot
A Lot
Average
Outstanding
Outstanding
Below Average
Above Average
Above Average
Average
Above Average
0.646
0,379
0,418
0,369
0,605
0.583
0,456
Table 10: Ranking alternatives. The priorities of the intensities for each criterion are divided
by the largest one and multiplied by the priority of the criterion. Each alternative is rated on
each criterion by assigning the appropriate intensity. The weighted intensities are added to
yield the total on the right.
requires that alternatives be rated one by
one without regard to how many there
may be and how high or low any of them
rates on prior standards. Some corporations have insisted that they no longer
trust the normative standards of their experts and that they prefer to make paired
comparisons of their alternatives. Still,
wht-n there is wide agreement on standards, the absolute mode saves time in rating a large number of alternatives.
Homogeneity and Clustering
Think of the following situation: we
need to determine the relative size of a
blueberry and a watermelon. Here, we
need a range greater than 1-9. Human
beings have difficulty establishing appropriate relationships when the ratios get beyond 9. To resolve this human difficulty,
we can use a method in which we cluster
different elements so we can rate them
within a cluster and then rate them across
the clusters. We need to add other fruits to
make the comparison possible and then
form groups of comparable fruits. In the
first group we include the blueberry, a
grape, and a plum. In the second group we
include the same plum, an apple, and a
grapefruit. In the third group we include
the same grapefruit, a melon, and the watermelon. The AHP requires reciprocal
comparisons of homogeneous elements
whose ratios do not differ by much on a
property, hence the absolute scale 1-9;
when the ratios are larger, one must cluster
the elements in different groups and use a
common element (pivot) that is the largest
in one cluster and the smallest element in
the next cluster of the next higher order of
magnitude. The weights of the elements in
the second group are divided by the priority of the pivot in that group and then
multiplied by the priority of the same pivot
element (whose value is generally different) from the first group, making them
comparable with the first group. The process is then continued. The AHP software
program Expert Choice performs these
functions for the user. The reason for using
clusters of a few elements is to ensure
greater stability of the priorities in face of
inconsistent judgments. Comparing more
than two elements allows for redundancy
and hence also for greater validity of realworld information. The AHP often uses
seven elements and puts them in clusters if
November-December 1994
35
SAATY
there are more. (Elaborate mathematical
derivations are given in the AHP to show
that the number of elements compared
should not be too large in order to obtain
priorities with admissible consistency.)
Problems with Analytic Decision
Making
At this point you may wonder why we
have three different modes for establishing
priorities, the absolute measurement mode
and the distributive and ideal modes of
relative measurement. Isn t one enough?
Let me explain why we need more than
one mode.
A major reason for having more than
one mode is concerned with this question.
What happens to the synthesized ranks of
alternatives when new ones are added or
old ones deleted? With consistent judgments, the original relative rank order cannot change under any single criterion, but
it can under several criteria.
Assume that an individual has expressed
preference among a set of alternatives, and
that as a result, he or she has developed a
ranking for them. Can and should that individual's preferences and the resulting
rank order of the alternatives be affected if
alternatives are added to the set or deleted
from it and if no criteria are added or deleted, which would affect the weights of
the old criteria? What if the added alternatives are copies or near copies of one or of
several of the original alternatives and
their number is large? Rank reversal is an
unpleasant property if it is caused by the
addition of truly irrelevant alternatives,
However, the addition of alternatives may
just reflect human nature: the straw that
broke the camel's back was considered irrelevant along with all those that went be-
INTERFACES 24:6
fore it. Mathematically, the number and
quality of newly added alternatives are
known to affect preference among the
original alternatives. Most people, unaided
by theory and computation, make each decision separately, and they are not very
concerned with rank reversal unless they
are forced for some reason to refer to their
earlier conclusions. I think it is essential
to understand and deal with this phenomenon.
An Example of Rank Reversal
Two products A and B are evaluated according to two equally important attributes
P and Q as in the following matrices:
p
A
A
1
1/5
B
B
Priorities
5
0.83
0.17
1
B
Q
Priorities
A
0.25
1/3
0.75
B
1
We obtain the following priorities: W^
= 0.542, Wj, - 0.458, and A is preferred to
B.
A third product C is then introduced
and compared with A and B as follows:
p
A
A
B
C
1/5
1
Q
A
1
A
1
B
3
C
1/2
B
5
1
5
B
1/3
1
1/6
C
1
1/5
1
C
2
6
1
Priorities
0.455
0.090
0.455
Priorities
0.222
0.666
0.111
THE ANALYTIC HIERARCHY PROCESS
Synthesis yields W^ ^ 0.338, W^
= 0.379, and W^ - 0.283, Here B is preferred to A and there is rank reversal.
For a decision theory to have a lasting
value, it must consider how people make
decisions naturally and assist them in organizing their thinking to improve their decisions in that natural direction. Its assumptions should be tied to evolution and not to
present day determinism. This is the fundamental concept on which the AHP is
based. It was developed as a result of a decade of unsuccessful attempts to use normative theories, with the assistance of
some of the world's best minds, to deal
with negotiation and trade-off in the strategic political and diplomatic arena at the
Arms Control and Disarmament Agency in
the Department of State, In the early
1970s, I asked the question, how do ordinary people process information in their
minds in attempting to make a decision
and how do they express the strength of
their judgments? The answer to this question led me to consider hierarchies and
networks, paired comparisons, ratio scales,
homogeneity and consistency, priorities,
ranking, and the AHP.
Resolution of the Rank Preservation
Issue
Early developers of utility theory axiomatically ruled that introducing alternatives,
particularly irrelevant" ones, should not
cause rank reversal [Luce and Raiffa 1957],
A theory that rates alternatives one at a
time, as in the absolute measurement salary-raise example given above, assumes
the existence of past standards established
by experts for every decision problem and
would thus assume that every decision can
be made by rating each alternative by itself
November-December 1994
without regard to any other alternative and
would inexorably preserve rank. But if past
standards are inapplicable to new problems and if experts are not sufficiently familiar with the domain of a decision to establish standards and the environment
changes rapidly, an insistence on making
decisions based on standards will only
force the organization to shift its efforts
from solving the problem to updating its
standards. For example, practitioners have
improvised many techniques to relate standards defined by utility functions in the
context of a specific decision problem.
Connecting theory to practice is important
but often difficult. We need to distinguish
between fixing the axioms of a decision
theory to be followed strictly in all situations and learning and revising in the process of making a decision. The rank preservation axioms of utility theory and the
AHP parallel the axioms of the classical
frequentist method of statistics and
Bayesian theory. Bayesian theory violates
the axioms of statistics in updating prediction by including information from a previous outcome, a process known as learning. When we integrate learning with decision making, we question some of the
static basic axioms of utility theory.
The AHP avoids this kind of formulation and deals directly with paired comparisons of the priority of importance, preference, or likelihood (probability) of pairs of
elements in terms of a common attribute or
criterion represented in the decision hierarchy. We believe that this is the natural {but
refined) method that people followed in
making decisions long before the development of utility functions and before the
AHP was formally developed.
37
SAATY
The major objection raised against the
AHP by practitioners of utility theory has
been this issue of rank reversal. The issues
of rank reversal and preference reversal
have been much debated in the literature
as a problem of utility theory [Grether and
Plott 1979; Hershey and Schoemaker 1980;
Pommerehne, Schneider, and Zweifel
1982; Saaty 1994, Chapter 5; Tversky and
Simonson 1993; Tversky, Slovic, and
Kahneman 1990).
Regularity is a condition of choice theory
that has to do with rank preservation. R.
Corbin and A. Marley [1974] provide a
utility theory example of rank reversal. It
"concerns a lady in a small town, who
wishes to buy a hat. She enters the only
hat store in town, and finds two hats, A
and B, that she likes equally well, and so
might be considered equally likely to buy.
However, now suppose that the sales clerk
discovers a third hat, C, identical to B,
Then the lady may well choose hat A for
sure (rather than risk the possibility of
seeing someone wearing a hat just like
hers), a result that contradicts regularity,"
Utility theory has no clear analytical answer to this paradox nor to famous examples having to do with phantom alternatives and with decoy alternatives that arise
in the field of marketing [Saaty 1994].
Because of such examples, it is clear that
one cannot simply use one procedure for
every decision problem because that procedure would either preserve or not preserve
rank. Nor can one introduce new criteria
that indicate the dependence of the alternatives on information from each new alternative that is added. In the AHP, this issue has been resolved by adding the ideal
mode to the normalization mode in relative
to preserve rank, (2) and (3) below.
(1) We can allow rank to reverse by using
the distributive mode of the relative measurement approach of the AHP.
(2) We can preserve rank in the case of irrelevant alternatives by using the ideal
mode of the AHP relative measurement
approach.
(3) We can preserve rank absolutely by using the absolute measurement mode of the
AHP.
As a recap, in relative measurement, we
use normalization by dividing by the sum
of the priorities of the alternatives to define the distributive mode. In this mode,
we distribute the unit value assigned to the
goal of a decision proportionately among
the alternatives through normalization.
When we add a new alternative, it takes its
share of the unit from the previously existing alternatives. This mode allows for rank
reversal because dependence exists among
the alternatives, which is attributable to
the number of alternatives and to their
measurements values and which is accounted for through normalization. For example, multiple copies of an alternative
INTERFACES 24:6
38
measurement. The ideal mode prevents an
alternative that is rated low or "irrelevant"
on all the criteria from affecting the rank
of higher rated alternatives.
In the AHP, we have one way to allow
rank to change, (1) below, and two ways
The essence of the AHP is the
use of ratio scales in elaborate
structures to assess complex
problems.
THE ANALYTIC HIERARCHY PROCESS
can affect preference for that alternative in
some decisions. We need to account for
such dependence in allocating resources, in
voting and in distributing resources among
the alternatives.
In the ideal mode, we would simply
compare a new alternative with the ideal
(with the weight of one), and it would fall
below or above the ideal and could itself
become the ideal. As a result, an alternative that falls far below the ideal on every
criterion cannot affect the rank of the best
chosen alternative. Using absolute measurement, we rate alternatives one at a
time with respect to an ideal intensity on
each criterion, and this process cannot give
rise to rank reversal,
I conducted an experiment involving
64,000 hierarchies with priorities assigned
randomly to criteria and to alternatives to
test the number of times the best choice
obtained by the distributive and ideal
modes coincided with each other. It turns
out that the two methods yield the same
top alternative 92 percent of the time. I obtained similar results for the top two alternatives [Saaty and Vargas 1993a].
Decision Making in Complex
Environments
The AHP makes group decision making
possible by aggregating judgments in a
way that satisfies the reciprocal relation in
comparing two elements. It then takes the
geometric mean of the judgments. When
the group consists of experts, each works
out his or her own hierarchy, and the AHP
combines the outcomes by the geometric
mean. If the experts are ranked according
to their expertise in a separate hierarchy,
we can raise their individual evaluations to
the power of their importance or expertise
priorities before taking the geometric
mean. We have also used special questionnaires to gather data in the AHP.
Practitioners have developed multicriteria decision approaches largely around
techniques for generating scales for alternatives. But I believe that making decisions
in real life situations depends on the depth
and sophistication of the structures decision makers use to represent a decision or
prediction problem rather than simply on
manipulations^although they are also important. It seems to me that decision making and prediction must go hand in hand if
a decision is to survive the test of the
forces it may encounter [Saaty and Vargas
1991]. If one understands the lastmg value
of a best decision, one will want to consider feedback structures with possible dependencies among all the elements. These
would require iterations with feedback to
determine the best outcome and the most
likely to survive. I believe that ratio scales
are mathematically compelling for this process. The AHP is increasingly used for decisions with interdependencies (the hierarchic examples I have described are simple special cases of such decisions). I
describe applications of feedback in Chapter 8 of Saaty [1994] and in a book I am
currently writing on applications of feedback, I and my colleague Luis Vargas
used the supermatrix feedback approach of
the AHP in October 1992 to show that the
well-known Bayes theorem used in decision making follows from feedback in the
AHP, Furthermore, we have since shown
through examples that some decisions with
interdependence can be treated by the
AHP but not Bayes theorem [Saaty and
Vargas 1993bl.
November-December 1994
39
SAATY
The essence of the AHP is the use of ratio scales in elaborate structures to assess
complex problems. Ratio scales are the
fundamental tool of the mind that people
use to understand magnitudes. The AHP
well fits the words of Thomas Paine in his
Common Sense, "The more simple anything is, the less liable it is to be disordered
and the easier repaired when disordered."
In August 1993, Sarah Becker compiled
a list of what are now more than 1,000 papers, books, reports, and dissertations written on the subject of AHP, an early version of which is included as a bibliography
in my 1994 book [Saaty 1994].
The Benefits of Analytic Decision
Making
Many excellent decision makers do not
rely on a theory to make their decisions.
Are their good decisions accidental, or are
there implicit logical principles that guide
the mind in the process of making a decision, and are these principles complete and
consistent? I believe that there are such
principles, and that in thoughtful people,
they work as formalized and described in
the analytic hierarchy process. Still academics differ about how people should
and should not make decisions. Experiments with people have shown that what
people do differs from the theoretical and
normative considerations the experts consider important. This may lead one to believe that analytical decision making is of
little value. But our experience and that of
many others indicate the opposite.
Analytic decision making is of tremendous value, but it must be simple and accessible to the lay user, and must have scientific justification of the highest order.
Here are a few ideas about the benefits of
the descriptive analytical approach. First is
the morphological way of thoroughly
modeling the decision, inducing people to
make explicit their tacit knowledge. This
leads people to organize and harmonize
their different feelings and understanding.
An agreed upon structure provides ground
for a complete multisided debate. Second,
particularly in the framework of hierarchies and feedback systems, the process
permits decision makers to use judgments
and observations to surmise relations and
strengths of relations in the flow of interacting forces moving from the general to
the particular and to make predictions of
most likely outcomes. Third, people are
able to incorporate and trade off values
and influences with greater accuracy of understanding than they can using language
alone. Fourth, people are able to include
judgments that result from intuition and
emotion as well as those that result from
logic. Reasoning takes a long time to learn,
and it is not a skill common to all people.
By representing the strength of judgments
numerically and agreeing on a value, decision-making groups do not need to participate in prolonged argument. Finally, a formal approach allows people to make gradual and more thorough revisions and to
combine the conclusions of different people studying the same problem in different
places [Saaty and Alexander 1989]. One
can also use such an approach to piece together partial analyses of the components
of a bigger problem, or to decompose a
larger problem into its constituent parts.
This is not an exhaustive list of the uses of
the AHP, However, to deal with complexity we need rationality, and that is best
manifested in the analytical approach.
INTERFACES 24:6
40
THE ANALYTIC HIERARCHY PROCESS
APPENDIX
Thf AHP has four axioms: (1) reciprocal
judgments, (2) homogeneous elements, (3)
hierarchic or feedback dependent structure, and (4) rank order expectations [Saaty
1986].
Assume that one is given n stones, Ax,
. . . , A,,, with known weights U',, . . . , U',,,
respectively, and suppose that a matrix of
pairwise ratios is formed whose rows give
the ratios of the weights of each stone with
respect to all others. Thus one has the
equation;
A.
Aw ^ \
A.
= mL\
where A has been multiplied on the right
by the vector of weights it'. The result of
this multiplication is mv. Thus, to recover
the scale from the matrix of ratios, one
must solve the problem ATV = nw or {A
- n!)w = 0. This is a system of homogeneous linear equations. It has a nontrivial
solution if and only if the determinant of A
- nl vanishes, that is, n is an eigenvalue of
A. Now A has unit rank since every row is
a constant multiple of the first row. Thus
all its eigenvalues except one are zero. The
sum of the eigenvalues of a matrix is equal
to its trace, the sum of its diagonal elements, and in this case the trace of A is
equal to n. Thus n is an eigenvalue of A,
and one has a nontrivial solution. The solution consists of positive entries and is
unique to within a multiplicative constant.
To make lo unique, one can normalize its
entries by dividing by their sum. Thus,
November-December 1994
given the comparison matrix, one can recover the scale. In this case, the solution is
any column of A normalized. Notice that
in A the reciprocal property a,, = I/a,,
holds; thus, also fl,, = 1. Another property
of A is that it is consistent: its entries satisfy the condition a,^ - a,i/a,,. Thus the entire matrix can be constructed from a set of
n elements which form a chain across the
rows and columns.
In the general case, the precise value of
IV Jw, cannot be given, but instead only an
estimate of it as a judgment. For the moment, consider an estimate of these values
by an expert who is assumed to make
small perturbations of the coefficients. This
implies small perturbations of the eigenvalues. The problem now becomes A'lv'
^ A,,,uvU'' where X,,,,j, is the largest eigenvalue of A'. To simplify the notation, we
shall continue to write Aw = \,,,a^w, where
A is the matrix of pairwise comparisons.
The problem now is how good is the estimate of w. Notice that if w is obtained by
solving this problem, the matrix whose entries are wjw, is a consistent matrix. It is a
consistent estimate of the matrix A. A itself
need not be consistent. In fact, the entries
of A need not even be transitive; that is. A]
may be preferred to Aj and A2 to A^ but A^
may be preferred to A,. What we would
like is a measure of the error due to inconsistency. It turns out that A is consistent if
and only if X,,,«, ^ n and that we always
have \»,,,, > n.
Since small changes in a,, imply a small
change in A,,,,n, the deviation of the latter
from n is a deviation from consistency and
can be represented by (X,,,,,, - »))/(" ~~ I)which is called the consistency index (C.I.).
When the consistency has been calculated,
the result is compared with those of the
same index of a randomly generated reciprocal matrix from the scale 1 to 9, with reciprocals forced. This index is called the
random index (R.I.). Table 11 gives the order of the matrix (first row) and the average R.I. (second row).
41
SAATY
1 2
10
Random Consistency Index (R.I.) 0 0 0.52 0.89 1.11
1.25
1.35 1.40 1.45
1.49
Table 11: The order of the matrix (first row) and the average R. I. (second row).
The ratio of C.I. to the average R.I. for
the same order matrix is called the consistciJC]/ ratio {C.R). A consistency ratio of
0.10 or less is positive evidence for informed judgment.
The relationsfl,,- \/a,, and a,, = 1 are
preserved in these matrices to improve
consistency. The reason for this is that if
stone #1 is estimated to be k times heavier
than stone #2, one should require that
stone #2 be estimated to be 1/k times the
weight of the first. If the consistency ratio
is significantly small, the estimates are accepted; otherwise, an attempt is made to
improve consistency by obtaining additional information. What contributes to the
consistency of a judgment are (1) the homogeneity of the elements in a group, that
is, not comparing a grain of sand with a
mountain; (2) the sparseness of elements in
the group, because an individual cannot
hold in mind simultaneously the relations
of many more than a few objects; and (3)
the knowledge and care of the decision
maker about the problem under study.
Figure 4 shows five areas to which we
can apply the paired comparison process in
a matrix and use the 1-9 scale to test the
validity of the procedure. We can approximate the priorities in the matrix by assuming that it is consistent. We normalize each
column and then take the average of the
corresponding entries in the columns.
The actual relative values of these areas
are A - 0.47, B - 0.05, C = 0.24, D - 0.14,
and E = 0.09 with which the answer may
be compared. By comparing more than two
alternatives in a decision problem, one is
able to obtain better values for the derived
scale because of redundancy in the comparisons, which helps improve the overall
accuracy of the judgments.
References
Figure 4: Fivefiguresdrawn with appropriate
size of area. The object is to compare them in
pairs to reproduce their relative weights.
Corbin, R. and Marley, A. A. J. 1974, "Random
utility models with equality: An apparent, but
not actual, generalization of random utility
models," journal of Mathematical Psi/chalog]/,
Vol. 11, No. 3, pp. 274-293.
Grether, D. M. and Plott, C. R. 1979, "Economic theory of choice and the preference reversal phenomenon," The American Economic
Review. Vol. 69, No. 4, pp. 623-638.
Hershey, J. C. and Schoemaker, P. J. H. 1980,
"Prospect theory's reflection hypothesis: A
critical examination," Organization of Behavioral tluina)! Performances, Vol. 25, No. 3, pp.
395-418.
Luce, R. D. and Raiffa, H. 1957, Games and Decisions, John Wiley and Sons, New York.
Pommerehne, W. W.; Schneider, F.; and
Zweifel, P. 1982, "Economic theory of choice
and the preference reversal phenomenon: A
reexammation," The American Economic Re-
INTERFACES 24:6
42
THE ANALYTIC HIERARCHY PROCESS
view. Vol. 72, No, 3, pp. 569-574.
Saaty, T. L. 1977, "A scaling method for priorities in hierarchical structures," journal of
Mathematical Psychologii. Vol. 15, No. 3, pp.
234-281.
Saaty, T, L. 1982, Decision Making for Leaders,
RWS Publications, 4922 Ellsworth Avenue,
Pittsburgh, Pennsylvania.
Saaty, T. L. 1986, "Axiomatic foundation of the
analytic hierarchy process," Management Science. Vol. 32, No. 7, pp. 841-855.
Saaty, T. L. 1994, Fundamentals of the Analytic
Hierarchy Process, RWS Publications, 4922
Ellsworth Avenue, Pittsburgh, Pennsylvania.
Saaty, T. L and Alexander, j . 1989, Conflict Resolution: The Analytic Hierarchy Process, Praeger, New York.
Saaty, T. L. and Vargas, L. G. 1991, Prediction,
Projection and Forecasting. Kluwer Academic
Publishers, Boston, Massachusetts.
Saaty, T. L and Vargas, L G. 1993a, "Experiments on rank preservation and reversal in
relative measurement," Mathematical and
Computer Modelling, Vol. 17, No. 4 / 5 , pp.
13-18.
Saaty, T. L. and Vargas, L. G. 1993b, "Diagnosis with dependent symptoms: Bayes theorem
derived from the analytic hierarchy process,"
working paper. University of Pittsburgh,
Pittsburgh, Pennsylvania,
Tversky, A. and Simonson, I. 1993, "Contextdependent preferences," Management Science,
Vol. 39, No. 10, pp. 1179-1189.
Tversky, A.; Slovic, P.; and Kahneman, D.
1990, "The causes of preference reversal,"
The American Economic Review, Vol. 80, No.
1, pp. 204-215,
November-December 1994
43


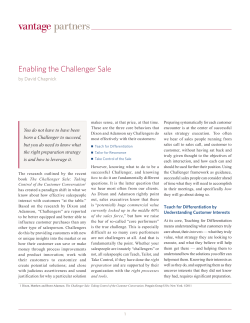


© Copyright 2026