
Document 178098
1
How to Approach the Isolation of a Natural Product
Richard J. P. Cannell
1. Introduction
It can seem a formidable task, faced with a liter of fermentation broth-a dark,
viscous sludge-knowing that in there is one group of molecules that has to be
separated from all the rest. Those molecules possibly represent only about
O.OOOl%, or 1 ppm of the total biomass and are dispersed throughout the
organism, possibly intimately bound up with other molecules. Like the proverbial needle in a haystack, you have to remove lot of hay to be left with just the
needle, without knowing what the needle looks like or where in the haystack it is.
1.1. What Are Natural Products?
The term “natural product” is perhaps something of a misnomer. Strictly
speaking, any biological molecule is a natural product, but the term IS usually
reserved for secondary metabolites, small molecules (mol wt C 1500 amu
approx) produced by an organism but that are not strictly necessary for the
survival of the organism, unlike the more prevalent macromolecules such as
proteins, nucleic acids, and polysaccharides that make up the basic machinery
for the more fundamental processesof life.
Secondary metabolites are a very broad group of metabolites, with no distinct boundaries, and grouped under no single unifying definition. Concepts of
secondary metabolism include products of overflow metabolism as a result of
nutrient limitation, or shunt metabolites produced during idiophase, defense
mechanisms, regulator molecules, and so on. Perhaps the most cogent theory
of secondary metabolism has been put forward by Zahner, who described secondary metabolism as evolutionary “elbow room” (I). If a secondary metabolite has no adverse effect on the producing organism at any of the levels of
From Methods in Bmtechnology,
Vol. 4’ Natural Products lsolatron
Edited by R J P Cannell 0 Humana Press Inc , Totowa, NJ
1
2
Canned
differentiation, morphogenesis, transport, regulation, or intermediary metabolism, it may be conserved for a relatively long period during which time it may
come to confer a selective advantage. Secondary metabolism therefore provides a kmd of testing ground where new metabolites have the opportunity, as
it were, to exist without being eliminated, during which time they may find a
role that will give an advantage to the producing organism. This is supported
by the fact that secondary metabolites are often unique to a particular species
or group of organisms and, while many act as antifeedants, sex attractants, or
antibiotic agents, many have no apparent biological role. It is likely that all
these concepts can play some part in understanding the production of the broad
group of compounds that come under the heading of secondary metabolite.
Isolation of natural products differs from that of the more prevalent biological macromolecules because natural products are smaller and chemically more
diverse than the relatively homogeneous proteins, nucleic acids and carbohydrates, and isolation methods must take this into account.
1.2. The Aim of the Extraction
The two most fundamental questions that should be asked at the outset of an
extraction are:
1. What am I trying to isolate?
There are a number of possibletargetsof an isolation:
a. An unknown compound responsible for a particular biological activity.
b. A certain compound known to be produced by a particular organism.
c. A group of compounds within an organism that are all related in some way,
such as by a common structural feature
d. All of the metabolites produced by one natural product source that are not
produced by a different “control” source, e.g., two species of the same genus,
or the same organism grown under dtfferent conditions.
e. A chemical “dissection” of an organism, in order to characterize all of its
interesting metabohtes, usually those secondary metabohtes confined to that
organism, or group of organisms, and not ubiquitous in all living systems,
Such an inventory might be useful for chemical, ecologtcal, or chemotaxonomic reasons, among others.
2. Why am I trying to isolate it?
The second fundamental question concerns what one is trying ultimately to
achieve, for defining the aims can minimize the work required. Reasons for the
extraction might be:
a. To purify sufficient amount of a compound to characterize it partially or fully.
b. More specifically, to provide sufficient material to allow for confirmation or
denial of a proposed structure. As in many cases this does not require mapping out a complete structure from scratch but perhaps simply comparison
with a standard of known structure; it may require less material or only par-
Approaching
an Isolation
3
tially pure matenal. There is no point in removing minor impurities if they do not
get m the way of ascertaining whether the compound IS, or is not, compound X.
c. The generation/production of the maximum amount of a known compound so
that it can be used for further work, such as more extensive biological testing.
(Alternatively, it may be more efficient to chemically synthesize the compound; any natural product that is of serious interest, i.e., is required in large
amounts, will be considered as a target for synthetic chemistry.)
1.3. Purity
With a clear idea of what one is trying to achieve, one can then question the
required level of purity. This in turn might give some indication of the approach
to be taken and the purification methods to be employed.
For example, if you are attempting to characterize fully a complex natural
product that is present at a low concentration in an extract, you will probably
want to produce a compound that is suitable for NMR. The purity needed is
dependent on the nature of the compound and of the impurities, but to assign
fully a complex structure, material of 95-l 00% purity is generally required. If
the compound is present at high concentration in the starting material and there
already exists a standard against which to compare it, structure confirmation
can be carried out with less pure material and the purification will probably
require fewer steps.
The importance of purity m natural products isolation has been highlighted
by Ghisalberti (2), who described two papers that appeared at about the same
time, both reporting the isolation from plants of ent-kauran-3-oxo- 16,17-diol.
In one paper, the compound has a melting point of 173-174°C and [alo39.20(CHC13); in the other, no melting point is reported, but the compound has
an [a],,-73.1°(CHC13). Either the compounds are different or one 1s srgnificantly less pure than the other.
If a natural product is required for biological testing, it is important to know
at least the degree of purity and, preferably, the nature of the impurities. It is
always possible that the impurities are giving rise to all or part of the biological
activities in question. If a compound is to be used to generate pharmacological
or pharmacokmetic data, it is usually important that the material be very pure
(generally >99% pure), particularly if the impurities are analogs of the main
compound and may themselves be biologically active.
In some cases,a sample need only be partially purified prior to obtaining sufficient structural information. For example, it may be possible to detect the absence
of a certain structural feature in a crude mixture-perhaps by absenceof a particular
ultraviolet (UV) maximum-and conclude that the mixture does not contain compound A. In other cases,suchasX-ray crystallography studies,material will almost
certainly be required in an extremely pure state,generally >99.9% pure.
4
Cannell
It is worth bearing in mind that the relationship between the degree of purity
achieved m a natural product extraction, and the amount of work required to
achieve this, is very approximately exponential. It is often relatively easy to
start with a crude, complex mixture and eliminate more than half of what is not
wanted, but it can be a painstaking chore to remove the minor impurities that
will turn a 99.5% pure sample into one that IS 99.9% pure. It is also probably
true to say that this exponential relationship also often holds for the degree of
purity achieved versus the yield of natural product. In the same way that no
chemical reaction results in 100% yield, no extraction step results m 100%
recovery of the natural product. Compound will be lost at every stage; in many
cases it may be that, to achieve very high levels of purity, it is necessary to
sacrifice much of the desired material. In order to remove all the impurities it
may be necessary to take only the cleanest “cuts” from a separation, thus losing much of the target material in the process (though these side fractions can
often be reprocessed).
These factors may, of course, have some bearing on the level of purity
deemed satisfactory, and it is useful to ask at each stage of the extraction,
whether the natural product is sufficiently pure to answer the questions that are
to be asked of it.
At present,there are two main reasonswhy scientistsextract natural products: to
find out what they are and/or to carry out further experimental work using the
purified compound. In the future, it may be easy to determme structures of compounds in complex mixtures; indeed, it is already possible to do this under some
circumstances,but at present,most casesof structural determination of anunknown
compound require that it be essentiallypure. Similarly, to obtain valid biological or
chemical data on a natural product usually requires that it be free from the other
experimental variables present in the surroundmg biological matrix.
1.4. Fractionation
All separation processes involve the division of a mixture into a number of
discrete fractions. These fractions may be obvious, physically discrete divisions, such as the two phases of a liquid-liquid extraction, or they may be the
contiguous eluate from a chromatography column that is artificially divided by
the extractor into fractions.
The type of fractionation depends on the individual sample and the aims of
the separation. Typically, a column is run and the eluate divided mto a manageable number of even-sized fractions, followed by analysis of the fractions
to determine which contain the desired compounds. (So, the eluate from a silica
column with a bed volume of 10 mL becomes, perhaps, 20 x 5-mL fractions.)
Obviously, collecting the eluate as a large number of very small fractions means
that each fraction is more likely to contain a pure compound, but it requires
Approaching
an Isolation
5
more work in analyzing every fraction, This also runs the risk of spreading the
target compound over so many fractions that, if originally present in only low
concentrations, it may evade detection in any one of the fi+actions.If the separation
process is relatively crude, it is probably more sensibleto collect only a few large,
relatively crude fractions and quickly home in on those containing the target.
Alternatively, one may monitor “on-line” and fractionate the eluate accordingly. This is generally used at the later stagesof separation for separations of
less complex mixtures, typically on high-performance liquid chromatography
(HPLC) separations monitored by UV, where one can identify and isolate
material corresponding to individual peaks.
1.5. Assays
A point that may seem fairly obvious, but worth reiterating, is that, with a
complex mixture from which one or a few specific compounds are to be isolated, a means of keeping track of the compound through the extraction process is needed. There are two main ways to follow a compound: (1) physical
assay (for example, HPLC, thin-layer chromatography [TLC], liquid chromatography-mass spectometry [LC-MS], and perhaps involving comparison with
a standard), or (2) bioactivity assay.
It is not within the scope of this book to discuss at length biological screening and the rapid developments that are being made in this field, but some
typical bioactivity screens are listed in Table 1.
There are a number of basic points that should be kept m mmd when assaying fractions:
1. Samplesdissolved or suspendedin a solvent different from the original extraction solvent should be filtered or centrifuged to remove any insoluble matter.
Assay samplesthat include a volatile solvent, or different solvents, are usually
bestdried and redissolved in the original extraction solvent, water, or other solvent in which the compoundis known to be soluble. For example,an ahquot of a
methanol extract of a broth may be dried, then resuspendedand partitioned
between water and chloroform. The two phases,or part thereof, can then be
redried, redissolved in equal volumes of methanol, and assayed.This may make
subsequentassayeasierfor two reasons:
a. The test solvent may not be compatiblewith the assay.
b. Redissolvingthe two phasesbackinto the samesolventmakesquantitativeand
qualitativecomparisonsmucheasier,particularlyif oneof the testsolventsis very
volatile, creatingproblemswith evaporationanddifferencesin concentration.
2. Samplesacidified or basified should bereadjustedto their original pH to prevent
them from interfering with the assay.If volatile acids/basesarepresent,they may
be removed by evaporation,
3. Controls consisting of the solvents and/or buffers, acids, and so on, without
sample,should always be carried out to ensurethat observed assayresults are in
Cannel
6
Table 1
Tvpical Bioactivitv
Activity
Antibacterial
Antifungal
Enzyme inhibitory
Antitumor
Toxicity
Antiparastttc
Receptor bmdmg
Transcription-based
Screens
Common assay form
Seeded agar diffusion, turbtdometrtc
Seeded agar diffuston, turbtdometric
UV, colorimetrtc, radrolabeled,
scintillation proximity assay (SPA)
Cell lme
Whole organism, e.g., brine shrtmp lethality
Whole organism, e.g., insect larvae, antihelmmth
Enzyme-linked mununosorbent assay (ELBA),
radtomununoassay (RIA),
SPA, chemrlummescence, fluorescence
Chemtlummescence, fluorescence
fact caused by the natural product. The separation may result m fractions that do
not have homogeneous “backgrounds” and this may affect the assay. For
example, a gradient chromatography system may well result m fractions with
increasing organic solvent concentration that might itself affect the assay. In order
to allow for the effect of this discrepancy, either a series of control samples should
be tested-m this case, fractions from a blank gradient run with no sample-and
these results subtracted from the assay results, or, all of the fraction ahquots must
be treated in a way that allows them to be presented to the assay in the same form.
This might mean drying the samples and redissolving them m the same solvent.
Care must be taken to redissolve m a solvent compattble with the assay (e.g., methanol, dimethylsufoxide [DMSO]), and that will solubilize compounds elutmg from
both the polar and nonpolar ends of a gradient elution. Addmonally, for practical
reasons, it is often preferable not to take samples to complete dryness as tt is sometimes difficult to resolubrlize all the components. Samples can be partially dned by
evaporatton or vacuum centrifugatlon, such that the more volattle organic solvent
is removed leaving only the residual aqueous extract; then volumes can be adjusted
to give the same relative concentration. Alternatively, samples may be adsorbed
each on its own solid phase extractant (see Subheading 2.3.2.) and then eluted m a
small volume of suitable solvent. This can serve both to concentrate and to further
clean the sample by “desalting’‘-separating the compounds from more polar materials or inorganic components that may have been introduced into the mobile phase
to improve chromatography, which may affect the assay.
4. Ideally, the assayshould be at least semiquantitatwe,and/or samplesshould be
assayed at a series of dilutions in order to determine where the majority of the
target compound restdes. It may well be that the separation process, e.g., the chromatography column, dilutes the activtty in a way such that it 1snot detectable in the
assay without concentration, and so the nonappearance of an active fraction may
Approaching an Isolation
7
not mean that the activity is lost but that the assay is msufficiently sensitive for
unconcentrated fractrons. For this reason, it is always wrse to quantrfy approximately the recovery of compound at each stage.
Such matters may sound obvious and trivial, but preparing fractionationsamples for assay in a suitable way can be a time-consuming and surprismgly
troublesome process, often representing a major portion of the work m a bioassay-guided extraction.
1,5. I. Overlay Assay
Sometimes
It is posstble to combine more closely the separation and the bio-
assay, as m the case of TLC overlay assays.In this case, the sample may be
separated by TLC, the TLC plate dried to remove traces of solvent, and the assay
performed
zn
MU, on top of the plate. This usually takesthe form of the reactants
immobilized
m a gel poured or sprayed over the plate and the results vlsualrzed.
The most commonly used form of this assay is an antimicrobial assay m which
the plate is covered with agar seeded with microorganism and then incubated,
after which microbial growth is seen throughout the agar except over those
regions of the chromatogram that contam the antimrcrobral components.
As long as the assay can be visualized, either by obvious microbial growth
or by the use of a colored reaction product, this principle
can be applied to a
wide range of assays,including enzyme and receptor-based assays.This principle of immobilizing,
or spotting, a small amount of sample onto a TLC plate
is one of the quickest and most convenient means of assaying a large number
of samples, and this method of overlay assay IS widely used for assaying fractions from all types of separation.
1.6. Quantification
During the isolation of a natural product, it is necessaryto track the compound
and, if possible, obtain some estimateof the recovery at each stage.This can often
be done by routine analytical techniquesthat may mvolve the use of a standard.
During the rsolatron of an unknown bioactive
compound,
the compound
is
monitored by following the bioactivity at each stage. It is also useful to quantify, at least approximately, this bioactivity at each stage. Approximate quantification is generally carried out by assaying a set of serial dilutions of each
fraction at each stage of the separation.
To detect the peaks of activity,
it IS
often necessary to assay fractions at a range of dilutions, which serves to mdicate the relative amounts of activity/compound present in each fraction. It can
then be seen in which fraction(s) the bulk of the active components lie and also
allows for some estimation
of the total amount of activity recovered, relative to
the starting material. Accounting for all the initial activity can be helpful m
avording potential
problems.
Cannel
8
For example, one may produce column fractions that obvrously contain active
compound but which a quick calculation reveals, represent only approx 5% of
the activity that went on to the column. There are many possible explanations for
such “disappearance” of activity, but essentially, quantification can act asa warning that there is more to look for. Likely explanations may include:
1. There is more than one active component and the major component has not
been eluted.
2. Most of the active component has been degraded or modtfied by the separation process.
3. The starting sample was not prepared so as to be fully compatible with the mobile
phase, so that a large proportion of the active component precipitated when loadmg on to the top of the column.
4. Most of the active component(s) spread across a wide range of fractions in a
concentration too low to be detected by the assay
Quantification also helps to avoid the temptation to assign all the activity of
an extract to a particular peak on a chromatogram, when in fact, much of the
activity may be represented by a very minor peak or a potent compound present
in very low concentrations almost insignificant apart from Its bioactivity. These
are often more interesting than abundantcompoundsas they are more bioactlve and
are less likely to have been previously described.
For similar reasons, tt is prudent to retain a reference sample of the mixture at
each stage of the process so that it can be assayedalongside the fiactrons and
serve as a record of material recovered at each stage of the process.
2. Where to Start?
How to begin the isolation of a natural product? First, something about the nature
of the compound needs to be known so that the approach to take can be determined.
2.1. Determination of the Nature of the Compound
How much needs to be drscovered depends on how much is already known
and what our aim is. The general features of a molecule that are useful to ascertain at this early stage might include: solubility (hydrophobicitykydrophilictty), acid/base properties, charge, stabihty, and size.
1. If the aim is to isolate all of the secondarymetabolitesof an organism and not to
focus on a specific molecule, this information may be less important but stall can
be useful in getting an idea of the range of compounds being worked with.
2. If the aim IS to isolate a known compound(s), much of thts information will
already be established, or will probably be apparent from the structure. (It may
even be that a physical assay exists for the compound and this may provide the
basis for an isolation.)
3. If the target is an unknown molecule,it is probable that little is known about the
nature of the compound.
Approaching
an Isolation
9
At this early stage, a small portion of the mixture can be examined in a
series of small batch-wise experiments.
2.7.1. Hydrophobicity/Hydrophi/kity
An indication of the polarity of the compound in question can be determmed
by drying a portion of the mixture and attempting to redissolve it m a few,
perhaps three or four, solvents covering the range of polarities. Suitable solvents include water, methanol, acetonitrile, ethyl acetate, dichloromethane,
chloroform, petroleum ether, and hexane.
It is usually fairly obvious tf everythmg redissolves, but if the mixture is a
complex one, the sample can be centrifuged or filtered and the supernatant
tested to determine solubility of the desired natural product (Note 1).
The same information can be obtained by carrymg out a range of solventpartitioning experiments, typically between water and ethyl acetate, chloroformldichloromethane, or hexane, followed by assay to determine how the
compound distributes itself (Note 2).
2.1.2. pU, (Acid/Base Propekes)
Further mformation can be gleaned by carrying out the partitionmg experiments mentioned above at a range of pH values-typically 3, 7, and 10. Adjust
the aqueous solution/suspensron with a drop or two of acid or alkali (or preferably buffer), then add the solvent, mix, and assaythe two phases.
HA+-“+ +AOrganic Phase AqueousPhase
As well as providing informatton on the pK, of the target compounds, these
tests can also be useful m ascertaining their stability at different pH values
(Note 3).
2.1.3. Charge
Information about the charge propertres of the compound can be obtained
by testing under batch conditions, the effect of adding a range of ionexchangers to the mixture.
To aliquots of the aqueous mixture (ion-exchangers will, of course, only act
as such in water), portions of different ion-exchange resins are added. When
dealing with an unknown quantity of a compound, it is not possible to know
how much to add-if ambiguous results are obtained, e.g., apparent binding to
all forms of exchanger, an order of magnitude more or less should be tried. The
important thing is that approximately the same amount in terms of binding
capacity is added to each to make the results comparable. An approximate starting concentration might be 100 mg resin/l mL microbial broth.
10
Cannell
The supematant of samplesshould be testedafter mixing with strong and weak
anion exchangers and strong and weak cation exchangers, each at a range of pH
values, e.g., pH 3.0, 7.0, and 10.0. From this can be deduced whether the compound is a strong or weak acid or base. This may then suggest an extraction
approach, perhaps involving ion exchange or adsorption chromatography (Note
4). A guide to the various types of ion-exchange resins 1sgiven in Chapter 5.
2.1.4. Heat Stability
If a biologtcally active natural product, or any product from a natural source,
is not stable to heat, there is a likelihood that tt IS a protein. If this is the case,
the observed biological activity may be as a result of enzyme activity or simply
to nonspecific binding by the protein to components of the biological assay,
giving rise to interference or “false” acttvtty. Most natural product chemists,
particularly those guided by bioactivity for the purposes of finding potential
therapeutic agents or those with chemotaxonomic interests, are generally more
interested in small nonprotein secondary metabolites where proteins are an
unwanted distraction.
A typical heat-stability test would involve incubation of the sample at 80/90°C
for 10 min in a water bath (taking mto account loss of volume or any physical
changes in the sample, e.g., clotting, aggregation), then assayfor the unaffected
compound. This is most appropriate for biological assaysas it may be difficult
to detect breakdown of a compound in a mixture by physical means.
A positive result may mean that the extraction comes to a halt because of
lack of further interest or that it can proceed unhindered by the interference of
associated protein. However, it should be remembered that heat can also denature or modify other natural products.
Many biological samples prior to assay are extracted with a water-miscible
solvent such as methanol. Proteins can be excluded from the extract by ensuring that the samples (and the methanol) are completely dry prior to extraction.
Proteins will rarely dissolve m most solvents m the absence of water. This can
be carried out by extracting the sample in methanol, drying the extract, then reextracting the extract with methanol, thus ensuring that no water is carried over
mto the final extract.
2.1.5. Size
Proteins can also be detected and/or eliminated by the use of ultrafiltration
membranes. These come in a variety of forms through which a sample may be
passed by pressure, by vacuum, or by centrifugal force m the case of ultrafiltration cones (filters contained in sample tubes that are centrifuged). The filters
have a cutoff at a given molecular weight and can be used to separate proteins
from small molecules. They are not generally useful for the fractionanon of
Approaching
II
an isolation
mixtures of small molecules as the lowest cutoff values are approx 2000 amu.
Dialysis tubing can be used in the same way; small molecules (less than a few
thousand amu) can pass through dialysis tubing mto the surrounding medium,
whereas proteins will be retained within the tubing.
2.2. Localization
of Activity
At the early stages of the extraction, one of the first and the most obvious
questions to ask is whether the natural product of interest is localized to one
part of the organism.
2.2.7. Microbial Broths-Extracellular
or Intracellular?
If the compound is in the free medium, already separated from the bulk of
the biomass, this is likely to make the extraction easier, particularly in a liquid
culture grown m a minimal medium (such as that generally used for a plant cell
or microalgal culture) and which is therefore fairly “clean.” If the material is
associated solely with the cells, it may be possible to separate immediately the
extracellular material and concentrate on extracting the cell mass. In this way,
the sample is at least concentrated in a single swift step, virtually free of media
constituents. If the material is divided between the cells and the supernatant, it
is desirable to shift this balance one way or the other so that the compound 1s
associated entirely with either the cells or the supernatant. This may be possible by altering the pH or by adding surfactants. It may be that the natural
product is actually excreted by the cells but remains associated with the cell
surface for reasons of hydrophobicity, adsorption, or biological affinity.
2.2.2. Plants
Provided that the whole plant is not already milled to a homogeneous powder, it should be fairly straightforward to determine whether the compounds of
interest are localized to certain parts of the plant, e.g., leaves, root, stem, bark,
root bark, and so on. If so, this may allow for disposal of perhaps three-quarters
of the plant before the actual work even begins, thus rendering’the mixture less
complex and possibly leading to avoidance of problems brought about by the
presence of other parts of the plant.
2.3. Selecting
Genera/ Separation
Conditions
2.3.1. Literature
It obviously makes sense to find out whether the extraction of the natural
product has been reported in the literature. However, there is no correct purification method for each natural product and no compulsion to follow such a method.
It may be easier to develop a new process,particularly if the biological matrix is
12
Cannel
different, e.g., the same compound from a different organism or a different
medmrn, or if facilities for the reported separation are not readily available.
In the isolation of unknown compounds, this approach is, of course, not
possible, but the hterature may be used to facilitate and limit the amount of
necessary work. This is discussed further in Chapter 10.
2.3.2. Solid Phase Extraction
This mvolves sorption of solutes from a liquid medium onto a solid adsorbent (like a flypaper removing flies from a room by retaining them when they
land on the sticky paper) by the same mechanisms by which molecules are
retained on chromatography stationary phases. These adsorbents, like chromatography media, come in the form of beads or resins that can be used in column
or in batch form. They are often used in the commercially available form of
syringes packed with medium (typtcally a few hundred milligrams to a few
grams) through which the sample can be gently forced with the plunger or by
vacuum. Solid phase extraction media include reverse phase, normal phase,
and ion-exchange media.
If an aqueous extract is passed down a column containing reverse phase
packing material, everything that is fairly nonpolar will bind, whereas everything polar will pass through. The nonpolar material can then be eluted with a
nonpolar solvent to give a sample that has been partially purified.
There are a number of uses of solid phase extraction:
1. Determination of the nature of the unknown compound: Determination of the
resinsthat bmd the desired natural product provides information about the nature of
the compound. For example, if the compound is retained by a reverse phase
medium, it must have some degree of hydrophobicity.
2. Selection of separation condnions: By the same reasoning, rt is possible to get
some idea of a sultable starting point for a purification. By eluting bound material
using a stepwise series of solvents with increasing elutmg power, rather than by
a single elutron step, it may be possible to find chromatographic condmons that
selectively bind and elute a particular compound.
3. Dereplication and characterization: The characteristic binding profile of a compound on a number of solid phase extraction resins can be used for comparative
and derephcation purposes. Compounds that bind differently to the same media
must be different, and if a series of extracts is suspected of containing the same
unknown natural product (e.g., all the extracts possess the same biological activity), the fact that they all exhibit the same binding profile might lead to a decision
to first isolate the component from one of the extracts, then use that as a standard
with which to examme the other extracts.
4. Preparatrve purification: As well as functionmg as a means of developing separation conditions, solid phase extraction is widely used as a pun&cation step in its
own right and in this sense can be viewed as a form of two-phase partition. This
Approaching
an /so/at/on
13
1scommonlyusedat the early stagesof an extractionas a fairly crude “clean-up”
step,to separatethe targetnaturalproductsfrom the bulk of the contammants,or at
the final stagesof a punficatlon to get the isolatednatural product in pure, concentratedsolution.In both cases,tins usuallyinvolves the removal of large amountsof
polar contaminants(e g , buffer salts,mediacomponents)by extractingtarget compoundsusing someform of nonionicbinding medium,washingthe resin with water
to removenonbinding contammants,
andthen eluting the compoundswith solvent.
5 Concentration’ Compoundsat low concentrationsin relatively large volumes can
be concentratedby extraction onto a solid phase extraction medium and then
eluted m a small volume of a strong eluent. This is typically used for concentrating analytesthat are present m only trace amounts,such as drug metabolitesm
serumsamples,or environmental contaminantsin seawater.
2.3.3. Gradient WLC
Running a sample of the natural product extract on analytical gradient HPLC
(Fig. 1) using a mobile phase gradient of wide rangmg polarity should serve to
separate the mixture and elute all the components. On the basis of retention
time, it should be possible to select general chromatographic conditions (either
HPLC or low-pressure columns) for further preparative punficatlon.
2.3.4. TLC
TLC separations can also be used to select column chromatography conditions. TLC conditions that give a useful Rf value, i.e., compound separatesfrom
the maJonty of other components without staying at the origin or with the solvent
front, can be approximately transferred to column chromatography. Identificatlon of the target compound or on the TLC plate can be carried out by comparison with a standard, by chemical staining, or by an overlay assay carried out on
top of the developed plate in the caseof an unknown biologically active component, or by scraping off, extracting, and assaying portions of the adsorbent,
However, it is not always straightforward to translate TLC systems to
column systems. This is partly because TLC cannot be seen simply as a twodimensional column. Unlike column chromatography, TLC is a nonequilibrium technique, which means that the condltlons of the mobile and stationary
phases are not constant throughout the plate but vary during the run and according to the position on the plate. This can lead to difficulties in trying to
reproduce TLC separations in a column form. As a general rule, it is advisable
to use a shghtly less polar mobile phase for normal phase column chromatography (and slightly more polar for reverse phase columns) than that used to
obtain a reasonable Rf value on TLC.
Armed with some knowledge of the nature of the compound and some idea of
suitable general separationapproaches,one can usually establisha successfulisolation method much more quickly than if none of thesepreliminary testsis carried out.
Cannel1
SOLUBILITY
SOLVENT PARTITIONS AT
DIFFERENT pH VALUES
3X3ml
Resuspendm
Hz0 MeCN
A\
Add 3 x 3ml Hz0
CHCh
pH3 NATURAL
pH-5-7
WF’ERNATANT
Hi
Redissolvem MeOH
pHlO
REslD”E
Iii
Assay
Redissolvem (equal vol ) MeOH
Fig. 1. Exampleof somesimpleteststhat might be carried out on a crude methanol
extractto determinethe natureof compoundfor selectionfor generalseparationmethods.
3. Chromatography
Many of the separation processes described in later chapters are forms of
chromatography. It might therefore be of value to have some understanding of
what chromatography is. Chromatography involves the distribution of a compound between two phases-a moving, mobile phase that IS passed over an
Approaching
an Isolation
15
rmmobrle stationary phase. Separation is based on the characteristic way in
which compounds distribute themselves between these two phases.
For Compound X this can be described in terms of its distribution coefficient:
KD= PI stationary phase
PI mobrle phase
This IS characteristic for a molecule independent of the amount of solute.
So, as one phase carrying the solute passes over the stationary phase, the
solutes are in constant, dynamic equilibrium between the two phases. For any
given compound, the posmon of this equilibrium is determined by the strength
of mteractron of the compound with the stationary phase and the competition
for the stationary phase between the compound and the mobile phase. The
stationary phase may be a solid or a liquid and the fluid mobile phase may be
liquid or gas,to give liquid chromatography and gaschromatography, respectively.
Gas chromatography, particularly gas-liquid chromatography (GLC) is a
widely used analytical technique but cannot be used for preparative isolation
of natural products and will not be discussed in this book. Liquid chromatography however, is widely used and comes in many different forms.
3.1. Classification of Liquid Chromatography
Chromatography can be classified in a number of ways (Fig. 2):
1 Classification on the basis of the physical arrangement of the system. Cbromatography can be carried out in the form of a column (column chromatography) (Fig. 3)
or on a flat surface (planar chromatography). The latter includes various forms of
TLC and paper chromatography, amongst others and IS the subject of Chapter 7.
Countercurrent chromatography involves two liquid phases and is the subject of
Chapter 8. Most chromatography is carried out in the form of a column of stationary
phase with a moving liquid mobile phase and comprises everything from capillary
columns, to HF’LC, to large-scale gravity-fed columns.
2. Classification according to the mode of separation. It is perhaps more useful to
divide chromatographic forms according to the mode of separation on which each
is based. These basic forms of molecular interaction, which determine chromatographic behavior, are listed below but are discussed at greater length in the relevant chapters.
3.1.1. Adsorption
This involves partitioning of molecules between the surface of a solid stationary phase and a hquid mobile phase. The dynamic equilibrium of solutes as
they switch between the stationary and mobile phases (the processes of sorption and desorption, respectively) is specific for each molecule and IS affected
by competition that exists between solutes and solvent for sites on the stationary phase. This is a purely physical process involving the formatron of no
16
Cannel/
NATURE OF
STATIONARY
PHASE
BASIS OF
SEPARATION
FORM
r
Llqutd
OF CHROMATOGRAPHY
Countercurrent
Llquld-llquld
Thm Layer
Bonded
Llquld-Modified
ParWon
Llqutd
Chromatography
-
Chromatography
Chromatography
Chromatography
(TLC)
HPLC
HPLC
Llquld-Solid
AdsorptIon
---E
f
Chromatography
Thtn Layer Chromatography
Paper Chromatography
Ion-Exchange-
Ion Exchange
Svze Exclusion-
Size Exclusion
(Gel Ftltration.
Blologlcal
Affimty Chromatography
(TLC)
Chromatography
Soltd
i_
Affimty-
Chromatography
Gel Permeatton
Chromatography
Fig. 2. Classrticatronof hqurd chromatography(LC) systems.
chemical bonds, but only the relatively weak forces of hydrogen bonds,
Van der Waals forces, and dtpole-dtpole interactions. For this reason,
almost any inert material can in theory be used as an adsorbent, the only
proviso being that it does not react either with the sample or the mobile
phase and that it is insoluble in the mobile phase. Common examples
include silica (as a column or as a TLC stationary phase), cellulose, styrene
divmylbenzene, alumina, and carbon.
3.1.2. Partition
Partition chromatography employs the separation principle of liquid-liquid
extraction. When one of the liquids is coated onto a solid support, such as a
column of cellulose coated with water, or a silica TLC plate coated with
adsorbed water, a stationary phase IS created on which separation can be carried out with an mnniscrble/organic mobile phase, employing the principles of
liqurd-liquid extraction with the advantages of chromatography. However, this
method suffers from the disadvantages that the liquid stationary phase tends to
be stripped (leached) from the column as a result of shear forces acting on it
from the movement of the mobile phase and by the solubtlity of the liquid
stationary phase in the mobile phase. For this reason, partrtron chromatography in this simplest form is rarely used these days.
More usually, the liquid stationary phase IS chemtcally bound to the inert
support to give a “bonded phase.” This mvolves the formation of a (hydrolytically) stable bond, often, for example, between the surface silanol group
of a silica support and a chlorosrlane. The silane usually carries a hydrocar-
Approaching
an Isolation
17
Direction of liquid mobile phase flow
-
Column
+
Sample applied to
top of column
Stationary
phase
Separated
bands
sample
Eluted components
of mixture
Fig. 3. Much preparative chromatographyis carried out asa form of liquid chromatography with a column of solid packing material (stationary phase) over which is
passeda liquid (mobile phase) containing the sample.
bon chain (usually of 1,2,6,8, or 18 carbon length) and this is in effect, the
liquid stationary phase. Bonded phase chromatography (also known as
modified partition chromatography) of this sort is really a combination of
partition and adsorption chromatography, and the distinction between these
two forms is generally somewhat blurred. A liquid can also act as a stationary phase even when it is not bound to a support, as in the case of countercurrent chromatography.
Normal phase/reverse phase: If the stationary phase is more polar than the
mobile phase, this is normal phase chromatography. An example of this is a
silica column with its polar silanol groups and a mobile phase of an organic
solvent. When the stationary phase is less polar than the mobile phase, this is
reverse phase chromatography, exemplified by the hydrocarbons bound to the
silica support and a water/acetonitrile mobile phase. Reverse phase
chromatography is very widely used as a form of HPLC (see Chapter 6) and
most natural products have a region of hydrophobicity that leads to their retention to some extent on a reverse phase column.
3.1.3. Charge
Many natural products exist as ionic species or are ionizable at a given pH
and this property can be used as a “handle” for isolating these molecules.
Cannell
18
3.1.3.1.
ION-EXCHANGE CHROMATOGRAPHY
This involves a stationary phase that consists of an insoluble matrix, the
surface of which carries a charged group, either negative or posmve. These
charged groups are associated with a counter-ton of the opposite charge, and as
the name suggests, the principle of separation lies in the ability of the sample
ions to exchange with the counter-ions and bind to the stationary phase. A
system in which the stationary phase carries a negative charge and the counterions are positively charged is cation-exchange chromatography, the opposite IS
anion-exchange chromatography. Separation occurs because of the differences
between sample molecules m then degree and strength of interactton with the
exchange sites. Once the sample molecules are bound, they can be eluted
selectively from the binding site by altering the pH of the mobile phase, thus
altering the drssoctatron characteristics of the charged species,or by increasing
the ionic concentration of the mobile phase, thus increasing competition for
the exchange sites and forcing off the sample tons. The degree of interaction
obviously depends on the nature of the sample ions and of the functional groups
on the ron-exchange resin, Sample ions that react strongly with the stationary
phase ions are strongly retained and will elute more slowly, whereas weakly
binding solute tons will be eluted more rapidly. This process is discussed at
greater length in Chapter 5.
3.1.3.2.
ION-PAIR CHROMATOGRAPHY/I• N-SUPPRESSION CHROMATOGRAPHY
Ions can also be separated on a nonpolar stationary phase such as a reversephase modified partition column by altering the pH of the mobile phase to
suppress the ionization of a molecule so that it will be retained as a neutral
species and hence will interact with the stationary phase. Essentially, the same
principle 1s applied for ion-pan chromatography, in which the mobile phase
contains a relatively large organic molecule with an ionizable group and lipophilic region and which acts as a counter-ion to form a reverstble ton-pair with
a sample ion. This iomc modifier acts either by pairing with the sample ion in
free solution to form an uncharged species that can then partmon mto the
stationary phase and/or by mteractmg with the stationary phase via Its hpophihc region to give a stationary phase with charged groups that can form an
ton-pan with sample ions. The advantage of this technique IS that it allows
polar and nonpolar samples to be separated in the same system.
3.1.4.
Size
Chromatography based on differences in the size of molecules IS somewhat
different from other forms of chromatography as there IS no direct sorption
between sample and stationary phase. Size exclusron chromatography (also
known as gel permeation chromatography or gel filtration) is based around a
79
Approaching an /so/a tion
column of packing material formed from beads of a polymer such as polyacrylamide, agarose, or sihca. The degree of polymer crosslinking is controlled
and gives rise to beads with a certain porosrty. This pore structure IS such that
the largest solute molecules cannot enter the pores-they are excluded because
they are too big, whereas the smaller molecules with a diameter less than that
of the pore diameter are able to diffuse into the beads, and the smallest molecules are able to diffuse into the smallest pores. It is these spacesin the crosslinked polymer that act as the stationary phase. The largest molecules will pass
rapidly through the column, followmg the most direct route between the beads.
Smaller molecules with a greater diffusible volume accessible to them will
take a more circuitous route through the column as they diffuse into the pores
and will take a longer time to reach the bottom of the column. The smallest
molecules can penetrate the smallest pores, travel further, and hence will be
eluted last (Fig. 4).
The interstitial spacesof the beads act as eddies where solutes are out of the
full flow of the mobile phase, and this serves to increase retention time.
Even though there is no physical interaction between the sample molecules
and the stationary phase, rt is still possible to describe the behavior of a sample
molecule/solute in terms of a distribution coefficient (Ku) where the stationary
phase IS represented by the interstitial spacesof the polymer bead.
KD = (V, - VJV,
where V, is the elution volume of the solute, V, IS the void volum+the elution volume of compounds that are completely excluded from the gel pores,
and V,is the volume of hquid inside the gel pores available to the very smallest
solutes.
Although size exclusion chromatography is a very sample and nondestructive technique, it is best suited for the separation of biological molecules over
a very wide size range, such as proteins, for which it is frequently used. As
most secondary metabolites are fairly small molecules without marked differences m size, size exclusron chromatography is rarely used for the separation
of these molecules. The exception to this is Sephadex LH20, which is widely
used because of its advantages of being usable in nonaqueous systems and that
gel filtration is not the only factor at work in the separation process; adsorption
also plays a major role.
3.1.5. Biological Specificity
Affinity chromatography depends on specific interactions of biological molecules such as an antibody-antigen interaction, enzyme-inhibitor interaction,
DNA-DNA binding, DNA-protein interaction, or a receptor-agonist/antagonist
interaction. The ligand (or receptor) is covalently,bound to the packing mate-
20
Cannell
Small molecules have
more tnterstttial space
avallable to them and
follow a longer flow path
Larger molecules
have less space
avallable to them
and follow a shorter
flow path
-
Fig. 4. Behavior of solutesin a stzeexclusion chromatographysystem
rial and acts as the stationary phase. The mtxture ts then passed through the
column, and those molecules with a specific affinity for the hgand are retained
while the remainder pass through. The material might then be eluted by altering the pH and/or the buffer composmon m order to weaken the interaction
between the samples and the ligand (Fig. 5).
As natural product extraction often mvolves the isolation of compounds wtth
specific biological activity, this might seem the ideal way to isolate such
molecules. Indeed, biological specificity is very often the basis by which the
natural product is originally detected within the mixture and is the means by
which the compounds or fractions can be assayed.
However, the preparative isolatton of secondary metabohtes 1s not often
carried out by affinity chromatography, mainly because it is often a rather
laborrous and time-consummg process to obtain sufficient quanttttes of a
suitable ligand and to carry out the reactions necessary to form a stable
stationary phase. Also, If the starting mixture is complex, as 1soften the case
with microbral or plant extracts, there are likely to be other components present
that interfere and/or disrupt the receptor-ligand interaction or themselves
adsorb nonspecifically to the stationary phase. Moreover, recovery of the
product depends on the interaction bemg reversible.
The useof affinity chromatographyfor the preparative isolation of natural products
is not discussedat length tn thts book though its role may rncreasem the future (as
purified recombinantproteinsbecomemore available). However, the useof btologtcal
specificity as the basisfor screeningorgamsmextractsaspart of the overall discovery
processof broacnve natural products 1sextremely important and is mcreasingas the
rangeof biological targetsfor which a bioactive molecule is aimed, mcreases.
Approaching
21
an Isolation
Bound receptor
Mobile phase flow
Sample rncdure
Resin
Receptor-ltgand
blndmg
Fig. 5. Principle of affinity chromatography.
3.2. Detection
Chromatography is usually monitored by changes in UV absorbance. As
each compound has a characteristic absorption coefficient, this absorbance may
be quite different for different compounds, particularly at longer wavelengths.
For this reason, monitoring unknown compounds by UV detection is best carried out using short wavelengths, near “end absorbance,” typically between
200 and 220 nm. Almost all organic compounds will exhibit some absorbance
in this range; wavelengths any shorter tend to cause the absorbance of the
mobile phase solvents to interfere. Ideally, a UV diode array detector is used;
this measures absorbance over the entire UV wave range so that a UV spectrum can be obtained at any point on the chromatogram. As every compound
has a characteristic UV spectrum, this can provide useful information about
the compounds in the mixture. Compounds with no sigmficant UV absorption
relative to the mobile phase can be monitored by changes in refractive index or
by electrochemical detection (rarely used for preparative work).
3.3. Principles of Chromatography
Detailed knowledge of chromatography theory is not necessary in order to
perform effective separations, but a knowledge of the principles underlying the
chromatographic separation 1s helpful in understanding how to monitor and
improve separations.
As has been described, separation occursbecausein the dynamic equilibrium of
solute molecules transferring between the two phases,different molecules spend
different proportions of time in the mobile and stationary phases.Solute molecules
22
Cannel
migrate only when they are m the mobile phase(and all solutesin the mobile phase
migrate at the same speed).The speedat which a solute moves through the column
1sdirectly related to the proportion-the mole fraction-of a particular group of
molecules in the mobile phase. If R, = mole fraction of X In the mobile phase.
Rx = P/P
px =‘;.R,
where px = rate of movement of solute band and pm = rate of movement of
mobile phase.
This is essentially the same as the distribution coefficient and the chromatographic process consists essentially of thousands of dynamic equilibria. However, there 1snot sufficient time for the sample to reach tilly Its equilibrium
distribution between the two phases.The sample remaining m the mobile phase
is carried down to a fresh portion of the column where it moves onto the stationary phase from the mobile phase. As concentration of the solute m the
mobile phase from this first portion decreases,solute m this region of the column moves back from stationary phase to mobile phase, m keeping with the
dlstrlbution coefficient, and is carried down to the second portion of the column where once again equilibrium is (nearly) achieved. This does not take
place as a series of discrete steps but as a continuous dynamic process (Fig. 6).
3.3.7. Retention
Solutes only move down the column when they are in the mobile phase,
moving at the same speed as the mobile phase. The rate of migration of a solute, therefore, is inversely proportional to its dlstributlon coefficient.
The degree of retention of a solute can be described by three retention
parameters: retention time (tR), retention volume ( VR),and capacity factor (rcl).
The retention time (or elution time) 1sthe time between injection and elution
(measured at peak maximum) of a solute. As this is directly related to the
mobile phase flow rate, which may vary between systems,It is sometimes more
appropriate to express this value in terms of retention volume, VR.
V, = F tR
where F = flow rate of mobile phase.
The retention time 1s the time that a solute spends in the stationary phase
plus the time it spends in the mobile phase (tM). tM is the same for all solutes
and includes time spent m the dead volume of the column, and so it is sometimes preferable to use the adJusted retention time (t’& which consists only of
the time a solute spends in the stationary phase.
g
Approaching an lsola tion
23
-AFig. 6. The sampleis continuously exchangingbetween the mobile and stationary
phasesasthe mobile phaseflow carries it down the column.
The phase capacity factor (k’) is the net retention time relative to the
nonsorbed time (to) and is therefore directly related to the distribution coefficient of a solute between two phases:
I? = tR - to
to
or in terms of retention volumes:
where V, is the volume of mobile phase in the column.
It = K*Vs
JGwhere Vs is the volume of the stationary phase.
The elution time of a nonsorbed compound (to) is equal to the column length
(L) divided by the mobrle-phase velocity (v). Therefore, the retention time of a
sorbed compound can be described as:
tR = L/v (1 + k’)
This gives the overall relationship between solute retention, distribution of a
solute across stationary and mobile phases, column length, and mobile phase
flow rate.
It can be seen from this that doubling the length of the column, for example,
will double the retention time. By substituting a term for k’ (k’ = [ VR- VM]lVM)
into this expression, it can be seen that, aside from column length and flow rate
(variables that will be the same for all the solutes of the same chromatographic
separation), the important factor affecting the retention time of a solute is Ko,
or its distribution between the stationary and mobile phases. This in turn is
dependent on the relative volumes of mobile phase and stationary phase (or
24
Cannel
more correctly, m the case of adsorption chromatography, the adsorbent surface area). Ultimately therefore, it can be seen once again that the relative
retention time depends on the distribution coefficient of a particular molecule,
and the larger this is, the greater will be the retention time. It is the differences
in this value between different molecules, that we can exploit to bring about
their separation by chromatography.
3.3.2. Column Efficiency
So, the process of sorption and desorption of solute molecules onto the stationary phase is similar to samples partitioning between two phases in a separating funnel, or it is analogous to a series of steps in fractional distillation,
except that the process of a group of solute molecules reaching equilibrium in
a particular part of the column is not a series of discrete steps but is a continuous, dynamic process. We can picture the chromatographic system as comprising a number of regions in which equilibrium is assumed to be achieved or,
effectively, to be a series of very short transverse columns.
The number of these theoretical transverse slices of column is known as the
theoretical plate number (N) and reflects the number of times a solute partitions
between the two phases.N is a measure of the efficiency of the column and will
determine how broad the chromatogram peaks will be. A column with a high
number of theoretical plates will be efficient and will produce narrow peaks.
N = (tRla)2
where a2 is the band variance.
N can be measured from the peak profile (Fig. 7). Assuming the peak to be
Gaussian, the baseline width of the peak as measured by drawing tangents from
the curve to the baseline is equivalent to four standard deviations. Therefore:
cs = 1q,/4 and N = 16(tRIwb)2
In practice, it is often preferable to use the value for the peak width at halfpeak height, particularly when the peak is not symmetrical. This results in the
expression:
N= 5.54 (t,lW1,2)2
N calculated this way using tR is a measure of the efficiency of the whole
system that includes the dead volume. In order to calculate and compare efficiencies of columns alone, it is necessary to use t’s (adjusted retention time) in
place of tR in the above expression, to obtain the effective plate number.
As N is a measure of the number of partitions a solute undergoes, it is directly
proportional to column length; i.e., the longer the column length, the greater
the separation. It is sometimes more useful to express the column efficiency in
25
Approachmg an Isolation
Detector
Response
Peak
height
I
4Wb
InjectIon
Time -W
Standard
(4o)+
dewation
of band
Fig. 7. Profile of a solute peak and measurement of N.
terms of the distance a solute travels in the mobile phase when undergoing one
partitron. This 1sthe height equivalent to a theoretical plate or plate height (I?).
H= LIN
where L is the column
length, and H is independent
of the column length.
3.3.3. Dispersion
Obviously, the aim is for a chromatographic separation in which peak width
is narrow relative to the time of elution (w&s is minimized), i.e., the number of
theoretical plates is maximized. There are three main factors that give rise to
band broadening: (1) multiple path effect (eddy diffusion), (2) axial (longitudinal) diffusion, and (3) mass transfer--slow transfer/equilibration between
mobile and stationary zones.
1 The multiple path effect refers to the fact that the flow through a packed bed of particulate matter is very tortuous The total distances traveled, and the velocity at any given
time, of individual particles will vary widely due to the heterogeneous and random
nature of the flow paths through the bed. As particles can dif&se laterally between two
flow paths (a process known as coupling), the overall effects of this Eddy drffision are
not as significant as they would be if every particle remained in its own “individual”
flow path, as this lateral diffisron tends to average out the flow paths. The effects of this
can be mmimized by the use of spherical particles of regular size.
This effect of Eddy drffuslon on the overall plate height can be expressed as
the A term
Cannel/
26
A=2hd,,
where dp is the particle diameter and h is a packing constant.
2. Within a column, there will also be longitudznal (or axial) dzffusion of solutes.
This IS most stgmficant at low flow rates when the band is resident in the column
for relatively long periods of time This can be expressed as the B term.
B = 2yDM
where DM is the diffusion coefficient of the solute m the mobile phase and y is an
obstruction factor.
3. Mass transfer relates to the rates at which equilibration of the chromatographic
process is achieved, and is governed by the diffusion of the solutes within the
mobile phase and a liquid stationary phase, and governed by the kinetics of sorption-desorption. When equilibratron between the mobile and stationary phases IS
slow, band dispersion will be relatively large due to the fact that molecules m the
stationary zone get “left behind” as the main band passes over. This dispersion
will increase with increase in flow rate (and with mcrease in equilibration time).
The effects of mass transfer can be expressed as two C terms; C,,, describes mass
transfer in the mobile phase, and C, describes mass transfer in the stationary phase
The overall effect of these factors can be combined in the van Deemter Equation, which relates plate height (column efficiency) to flow rate (r-l>.
H=A+B/p+C,p+C,,,p
An inverse plot of the van Deemter Equation (Fig. 8) illustrates the relationship between column efficiency and flow rate.
Other band-broadening
effects derive from the fact that solute species rn the
same flow path will not all move with the same velocity (those in the center
will move faster than those at the edge) and that the particle structure may
contain pores or eddies of nomnoving mobile phase out of which solute particles must diffuse in order to return to the main flow of mobile phase.
3.3.4. Sorption isotherms
Sorption is the general term that refers to the interaction of a solute with the
stationary phase, whether that interaction involves adsorptton, ion-exchange,
or gel permeation (size exclusion). When the relative concentrations of solute
in the stationary and mobile phases are the same, independent of concentration
(as is normally expected by reference to the Kn of the solute), the peak shape
will remam basically the same and will be symmetrical. This relationship,
which describes amount of solute sorbed relative to concentration in mobile
phase (at constant temperature), IS the sorptzon isotherm.
When describing or theorizmg about chromatography, the assumption IS
made that the sample load is a flat-ended plug that, through the processes of
Approaching
an Isolation
27
1-1(MoblIe phase flow rate) ---)
Ftg. 8. Typical Van Deemter Plot showing optimal flow rate.
diffusion, soon broadens with a Gaussian distribution. In this case, the sorption
tsothetm is linear-the value of Kn will be constant across the peak.
However, not all systems exhibit a linear isotherm; when relatively strong
interactions exist between solute and stationary phase, and relatively weak
interactions exist between solutes themselves, there will initially be rapid sorption of solute onto the stationary phase until the stationary phase is “covered”
by solute, at which point the uptake of solute will decrease.This means that the
Ko of the solute is not constant across the peak, at low concentrations, Kn will
be large and this results m a peak shape that is not symmetrical but that “tails.”
Less often, the interactions between solute molecules may be strong relative
to those between solute and stationary phase, in which case initial uptake of
solute molecules by the stationary phase is slow but increases as the first solute
molecules to be adsorbed draw up additional ones. In such a case, the peak has
a shallow front and a sharp tail and is said to be a “fronting” peak (Fig. 9).
Fronting and tailing can be a problem because they tend to lead to overlap of
peaks. Dealing with the sorts of problems associated with such phenomena is
discussed more fully in Chapter 6.
3.3.5. Separation and Selectivity
The preceding sections should show, if nothing else, that separation of compounds occurs because the compounds have different distribution coefficients.
The column shows selectivtty toward the compounds or, put another way, the
compounds are selectively retained as is shown by their different retentton
times. This selectivity (a) can be measured by the separation factor and the
relative retention and can be described in a number of ways:
28
Cannel
Fmntlng
Peak with
ltneat sorption
Isotherm
peak
+--
Tarlmg peak
Time
Fig 9 Fronting and tailmg peaks.
a = KBIKA = klBlkA = tRBItRA
Once again, all of these are expressions simply describing the relative values of the drstributlon coefficients ofA and B, that is, just a measure of the way
in which the equilibrmm of A lies between the mobile and stationary phases
compared to the way m which B is distributed between the two phases. If cI = 1,
A and B will partition between the two phases in exactly the same way and
there will be no separation (even on a very efficient column).
3.3.6.
Resolution
Figure 10 shows a typical chromatogram. It is clear that the peaks appearmg on the chromatogram after a short time are sharp and symmetrical whereas
compounds that elute later gave rtse to broader peaks.
The degree of separation of two compounds, or degree of resolution, is
determined by two factors: how far apart the tops of the peaks are and how
broad the base of the peaks are. As compounds separate, the individual bands
will tend to disperse and broaden, and to obtain the best resolution, peaks
should be as narrow as possible. So, two compounds may have very different
retention times-they may be well-separated-but if the column gives rise to
very broad dispersed bands, they will not be well-resolved. Similarly, two compounds may not be well-separated, but if they move through the system as tight
bands, they may be well-resolved.
The resolution (RR,)of two compounds can be defined as the peak separation
divided by mean peak width.
R, = tRB - tRA
1/2(wA + wB)
where tRB and tRA are the retention times of compounds B and A respectively and WA and wB are the basal peak widths of peaks A and B.
29
Approachmg an /so/a t/on
T
Detector
Response
Fig 10. Peakbroadeningwith time,
Figure 11A demonstrates that when two triangular peaks are just touching
on the baseline; i.e., when they are just resolved, R, = 1. However, this assumes
that the peaks are triangular, whereas in reality they are Gaussian and as shown
in Fig. llB, a value of R, = 1 corresponds to a separation of only approx 94%.
In order to achieve baseline resolution (Fig. llC), an R, value of about 1.5 is
required. Strictly speaking, these figures are only valid when the peaks are of
equal height.
Certainly, the most important factor in resolution is the selectivity of the
system, but it is not the only factor; the efficiency of the column is also important, as this determines the degree of peak broadening.
To describe resolution m terms of experimental variables that can be used to
optimize resolutions, the expression is:
R, =
1/4N[a - (lla)][k’l(k’ + I)]
The application of this expression is described in Subheading 3.5.
It is rarely necessary to carry out any calculations in the process of purifying
materials by chromatography, but making some estimates of resolution can
help to give an idea of how pure a sample one can expect to obtain from a given
separation. In practice, one rarely finds it necessary even to make estimates but
for the purpose of this exercise, applying some R, values to various peak profiles will help to grve an idea of the type of results to be expected from a given
separation (Fig. 12). This is the kind of information that can usefully be elicited from an analytical chromatogram prior to commiting a large amount of
sample onto a large-scale preparative separation.
Cannel
30
+w*B
we-
V-t,4
,-.
4 w*w
+W,C
Fig. 11, Measurementof peak resolution. (A) R, = 1. (B) R, = 1. (C) R, > 1.
3.4. How To Use a Chromatogram
Simply by looking at a chromatogram, one can obtain a good deal of information that is useful in the preparative isolation of a natural product.
3.4. I. identity
The single most useful piece of information that can be obtained from a
chromatogram is the retention time (tR>.A compound will always have the
same retention time under a given set of conditions, and if two samples have
31
Approaching an lsolatlon
05
R,=04
06
06
10
98%
07
125
994%
Fig. 12.Retention valuesfor two componentsof equal peakwidth with corresponding purity percentages(. representspoint of true band center).
the same retention time, they are very possibly the same compound. To be of
use, the process requires being able to measure tR with reasonable accuracy
(one of the strengths of HPLC). In practice, other compounds may have the
same, or at least indistinguishably similar, retention times, so one should not
rely on retention time as a sole means of identifying a peak/compound with
absolute certainty.
The surest means of determining whether two samples are the same compound by reference to their retention time is to inject them together in the same
sample, thus avoiding problems associated with slight variations in retention
times in different runs. If two samples coinjected produce a single peak, then it
is probable that they are the same compound (with the degree of certainty
dependent on the efficiency of the system and the “quality” of the chromatography). If, however, the two samples give rise to two peaks, it is certain that
they cannot be the samecompound. The use of diode array detectors also allows
for comparison of UV spectra.
The retention time of a sample in a particular chromatographic system also
reveals more general information about that compound.
3.4.2. Physical-Chemical Nature
Generally, nonpolar compounds will tend to elute more slowly from a
reverse phase system, whereas the more polar a compound, the later it will
elute from a normal phase system.
When starting with an unknown compound, a useful generic method for discovering something about the nature of its polarity is to run it on an HPLC (or
32
Cannel/
TLC) systemwith gradient elution,.followed by some form of assayto determine
the compound’s chromatographic behavior. By using a gradient mobile phase
covering a wide polarity range, it should be possible to ensure that almost every
compound is eluted. Some idea of the polarity of the compound and useful starting conditions for the development of a systemto separatethe compound(s) from
the rest of the mixture can be inferred from the time of elution.
3.4.3. Amount
For a given compound, the area under a chromatographic peak is
directly proportional to the amount of compound. By using standards of
known concentration, it is possible to calibrate a chromatographic system
and to use it to establish the amount of a known compound in a sample.
Of course, m the isolation of an unknown compound, no standard is available, and as each compound has a characteristic extinction coefficient
(absorptivity), the degree of UV absorbance is specific to individual compounds, It is possible to quantify material corresponding to a particular
peak only in relative terms.
Means of integration: Most modern HPLC apparatuses have an associated
integration system that integrates the peaks on a trace as a set of values or
relative percentage values that can then be translated into real values with standards of known concentration. If no built-in integration system is available, the
most common practice is to measure the peak height and to use this value as a
measure of quantity. On a chromatogram with sharp peaks, the relationship
between peak height and concentration bears a close approximation to that of
peak area and concentration. Although the relationship between peak height
and concentration deviates more for broader peaks, peak height is often sufficient to provide an approximate value of the proportion of natural product
recovered at each stage of the purification.
Alternatively, it is possible to calculate peak area by multiplying the
peak height by half-peak width at half-height, or even by cutting out peaks
from a paper chromatogram and weighing them to get a relative measure
of compound concentration. (Measurement of peak area is less convenient than that of peak height and may sometimes even be less accurate
due to the practical difficulties of measuring peak width.) Where two or
more peaks overlap, the best means of roughly estimating peak area is to
draw a line from the bottom of the valley between two peaks to the
baseline and calling this the division between the two compounds. However, the accuracy of this method decreases as the difference in size of the
peaks increases. However, in the case of overlapping peaks, the center of
the chromatographic band is not the same as the top of the peak when the
two bands are displaced toward each other (Fig. 13). This means that the
Approaching an Isolation
33
Fig. 13. Apparent and true position of overlapping peaks.
peak-height measurement m such casesIS an overestimation of concentration. It
also means that apparent retention times are shifted, so that obtaining an accurate
tR value for identification purposes is made much more difficult in cases of
mcomplete resolution. Ideally, to get both quantitative and retention time data with
reasonable accuracy, it is best to have a R, value in the region of at least 0.8-l .O.
Quantitation is generally more important m analytical chromatography than
in preparative isolation work. In natural product extraction, it is generally used
to monitor approximate levels of recovery following different stagesof extraction, or to get a feel for the amounts of material being examined. However, by
examination of peak shape, tt is also possible to get a feel for the degree of
purity that can be expected.
When collecting fractions from chromatographic separations in which
peaks overlap, a judgment has to be made between quality and quantity;
that is, taking a cut at A (Fig. 14) will result in recovery of the mam compound that 1s purer than that obtained if the cut were taken at B, but will
mean a lower recovery.
If the aim is to extract only some material of high purity, it is more sensible
to sacrifice some of the compound of mterest and take a cut that contains little
or none of the peak overlap. If, on the other hand, the emphasis is on isolating
the maximum yield, a broader cut should be taken with a view to subsequent
purification steps to remove minor contaminants. Additionally, of course, it is
often prudent to collect material in a number of fractions so that a majority of
compound will be contained in a fairly pure form, and only a small proportion
will need to be further purified. (All of these estimations are based on the
assumption that both compounds give the same detector response per unit of
concentration.)
Cannel/
34
T
Detector
Time +
Fig. 14. Overlapping peaks.
3.5. How To Improve a Separation
As described in a previous section,the resolution factor R, can be expressedas:
R, = 1/4N[a - (l/a)][k’l(ll
+ l)]
This shows that the resolution of a number of components can be related to
three main functions: the capacity factor (k’), number of theoretical plates (N),
and selectivity (a).
3.5.1. Capacity Factor (k ‘)
k’ is a measure of the number of additional volumes of mobile phase in the
systemrequtred to elute a solute followmg the elutton of a nonsorbed component
and hence is a direct measure of solute retention. In practice, often the easiestway
of improving the resolution of a separation is to ensure that a system is used in
which the compounds to be separatedhave a reasonablevalue of K. A value of II = 0
means that the solute 1snot retained at all-it elutes at the solvent “front.” In most
cases,a useful value of k’ is between 1 and 10, and m attempting to resolve two
close peaks,it is rarely of any value to increaseretention so that k’ > 20. k’ values of
greater than 20 represent inordinately long retention times; from the above equation, it can be seenthat as K increases,k/k+1 tends toward 1, and further increases
in II have little effect in improving resolution.
3.51 .l. SOLVENTSELECTION:
In practice, the means by which II 1s optimized in most chromatographic
separations 1s by the selection of a solvent of suitable polarity, or solvent
Approaching an Isolation
35
strength. There are a number of different measures of polarity of a solvent, the
most commonly used being the Snyder solvent strength parameter, E”. This IS
based on the adsorption energy of the mobile phase on alumina. A list of solvents in order of increasing eluent strength, an eluotropic series, IS given m
Table 2. Descending the table, the values of I!? increase, resulting in a higher
value of K in a reverse phase system. Generally, increasing solvent strength ,!?
by 0.05 ~111decrease k’ by a factor of 2-4 (Note 5).
There are a few basic rules of thumb that can usefully be followed m the
selection of a suitable mobile phase solvent.
1, The first basic starting point is to find a solvent in which the sample is soluble.
However, high solubilrty in the solvent at the expense of nonsolubility/
noninteraction m the stationary phase IS not desirable
2. When using an aqueous-organicsolvent mixture for partttion/adsorption chromatography, the 10% rule is a good approximate gmde. This states that a 10%
change m the organic solvent content of the mobile phase results in a two- to
threefold change in k
3 As most detection IS based on UV absorbance, it is usually necessary to use solvents that have low absorbance at fairly low wavelengths so that the absorbance
of the solutes is detectable against the background, even at wavelengths as low as
2 10 nm. Thus 1s one of the reasons why methanol, acetonitrile, tetrahydrofuran,
and water have become such widely used mobile phases for HPLC.
The selection of particular solvents for individual forms of chromatography
is discussed further m later chapters.
3.5.1.2.
GRADIENT ELUTION
In circumstances where not all of the components of a mixture are eluted
from the column within a reasonable time using a single, unchanging solvent
system (isocratic elutron), it may be necessary to use a system in which the
mobile phase composrtion changes during the separation (gradient elution). By
using two solvents, the proportions of which change during a run, rt IS possible
to separate solutes with widely different retention times. These mobile phase
changes may occur at a number of set Intervals (step gradient) or continuously
throughout the run (contmuous gradient). This is commonly used, for example,
in reverse phase chromatography, in which the polarity of the mobile phase is
gradually decreased (and vice versa in normal phase) or in ton-exchange chromatography, in which the tonic strength of the mobile phase is increased. Gradients also have the advantage that not only do they allow for the separation of
components with widely different properties in a single separation, but they
often result in better separations of closely eluting solutes because the gradient
serves to focus and sharpen the chromatographic bands. The disadvantages lie
m the extra apparatus required, as well as the greater inconvenience-repeat
36
Table 2
Eluotropic
Cannel/
Series of Solvents
Solvent
Pentane
Cyclohexane
cc14
Toluene
Dlethyl ether
Chloroform
Dichloromethane
Tetrahydrofuran
2-Butanone
Acetone
1,4-Dioxane
Ethyl acetate
Dlethylamme
Acetonitrile
2-Propanol
Ethanol
Methanol
Water
E”(A1,03)
0
0 04
0 18
0.29
0.38
0.40
0 42
0.45
0.51
0.56
0.56
0.58
0.63
0 65
0.82
0.88
0 95
1 00
Vwosity,
Boiling pt., OC mN s.m-2(20”C)
36
69
77
111
35
62
40
66
80
56
107
77
115
82
82
78
64
100
0.24
0 98
0.97
0.59
0 25
0.57
0 44
0.55
0.32
0.32
144
0.45
0.33
0.37
2.50
1.20
0.59
10
UV Cutoff, nm
210
210
265
286
218
245
235
220
330
330
215
255
275
190
210
210
210
-
gradient separations are lessamenable to automation and generally require more
time than the equivalent number of isocratic separations, as it is necessary to
equilibrate the column between runs (Note 6; Fig. 15). Examples of gradient
elutions relating to various forms of separation are given in the relevant chapters,
In developing separations of natural products, obtaining a useful value of k’
is so fundamental that we generally do it instmctlvely, and it IS obvious that a
primary objective is to find stationary and mobile phases that retain the solutes
but from which the solutes are eluted wlthm a reasonable time.
3.5.2, Efficiency (N)
Improving the column efficiency, i.e., Increasing N, will make the peaks
sharper and narrower and hence will reduce the overlap between peaks, but it
will not affect the fundamental basis of the separation. The relative retention
times of a mixture of components will remain the same. This factor in the
above expression involves the square root of N which means that in reality, an
increase in N has to be fairly large to make any significant difference. This sort
of improvement in separation is seen most dramatically m the difference
between classical gravity-fed, large particle columns with plate values of hun-
Approaching
an Isolation
37
Mobile phase B
4
Clamp prevents mixing
of mobile phases prior
to running the column
I
Stirring bar
Fig. 15. A simple gradient former (Note 6).
dreds or thousands, and HPLC columns with their small regular particles and
their typically high plate numbers of tens of thousands. This is why HPLC has
become such a valuable technique--the increase in theoretical plates has made it
possible to resolve componentsfor which classicalcolumns arejust too inefficient.
352.1.
PARTICLE SIZE
In order to increase the number of theoretical plates, it is necessary to
increase the opportunity for equilibrium of solutes between the mobile and
stationary phases to occur, i.e., it is necessary to maximize the surface area of
the stationary phase. This can usually be done by reducing the particle size-at
least in the case of a stationary phase in which the chromatography takes place
on the surface of the column packing material. This has led to common use of
columns consisting of regular particles 5 pm (or even 3 pm) in diameter. This
also means that high pressures are required to force mobile phase through such
tightly packed material, which is why HPLC columns, pumps, and associated
hardware are so widely used.
When discussing column efficiency, it is sometimes more valuable to express
this in relation to particle size.This is known as reduced plate height (h):
h = Hid,
where dp is the mean particle diameter. This describes the number of particles corresponding to H and is a dimensionless parameter that can be used to
directly compare columns of different particle size.
Increasing the column length will increase the number of theoretical plates;
but, as has been shown, this will also proportionately increase retention time
and, hence, band-broadening. In practice, there is not a great deal that can be
38
Cannell
done to alter N significantly in order to improve resolution, except by radically
changing the form of column used, e.g., switching from open column to HPLC
or to a column with a smaller, more regular particle size.
3.5.3. Selectivity (a)
In practice, once the basic type of chromatography and mode of separation
have been estabhshed, the factor that tends to occupy most of the extractor’s
time during the process of obtaining a separation is selectivity (a).
Even if two compounds have the same Kn under a given set of condttions, it
should be remembered that liquid chromatography involves three sets of
molecular interactions (see Fig. 16)
These interactions are all combinations of the various electrostatic forces,
namely:
1 Ionic interactions.
2. Dipole-dipole interactions.
3. Van der Waal’s forces
4. Hydrogen bonding
By changing the chemical nature of the mobile phase or stationary phase, it
is possible to alter the balance of all three sets of interactions. For example, if
a strongly nonpolar stationary phase is used with a very polar mobile phase to
separate lipids, the principle of “like has an affinity for like” applies and the
solutes will tend to spend a much greater proportion of time on the stationary
phase and hence will have a very long retention time.
The process of selecting a mobile phase solvent to give a suitable value of k
is mentioned above. However, in order to optimize relative retention (a) of
solutes, the commonest approach is to modify the mobile phase more subtly.
There are a number of baste approaches that can be tried in order to optimize
selectivity:
1. In systemsinvolving anorganic solvent, whetheralone or in an aqueousmixture,
changing the solvent to a different one that gives about the samevalue of K may
lead to changesin selectivity. This may require a slight alteration of the organic
solvent concentration.
2. The aqueous content of the mobile phase can be modified by addition of modifiers such as acids (or less commonly, bases) or inorganic buffer salts that can give
rise to changes in the overall sets of Interactions.
Solvents can be grouped on the basis of their properties as proton donors
(acidic), proton acceptors (basic), and dipole interactions. Solvents can be
positioned within the Solvent Selectivity Triangle (Fig. 17) on the basis of the
relative involvement of each of these three factors as parameters of solubility.
Mobile phases consisting of a mixture of three solvents can be optimized by
39
Approaching an Isolation
STATIONARY PHASE w
MOBILE PHASE
SOLUTE
Fig. 16.
PROTON ACCEPTORS (BASIC)
A
A
ETHER
TRETHYIAMIN
METHANOL
TETRAHYDROFURAN
PROTON DONORS (ACIDIC)
DIPOLE INTERACTIONS
Fig. 17. Solvent selectivity triangle.
selecting solvents from as far as possible from each other in the Solvent Selectivity Triangle (as long as they are miscible). In practice, it is rarely necessary
to go to such lengths to obtain a separation, but in problematic cases and as a
general underlying model of how to compare solvents, it may be of some use.
The interaction between mobile phase and stationary phase should not be
overlooked. For example, many of the very widely used HPLC columns consist of silica particles coated with chemically bonded hydrocarbons to give a
nonpolar reverse phase stationary phase. However, there are generally a number of free silanol (-Si-OH) groups that can play a significant role in the
adsorption of solutes. The addition of various mobile phase modifiers (e.g.,
inorganic buffer ions) can lead to interaction with these groups and alter the
nature of the solutes’ adsorption. This is particularly important in the elution of
40
Cannell
basic compounds, which, at the pH values generally used on silica-based columns, tend to interact strongly with silanol groups and in some casesprove very
difficult to elute. This is often the stageat which ion-pair modifiers may be added.
This may take the form of pH adjustment to ensure, for example, that weak acids
are protonated and so are retained satisfactorily on a reverse phase column, or it
may involve the addition of larger counter-ions (e.g., tetrabutylammonmm ion as
counter-ions for anionic species,and alkyl sulfonates as counter-ions for catiomc
solutes). When separating ionic and noniomc solutes m the same sample, it is
generally best to optimize the separation of the nomonic solutes first and then
add counter-ions to improve the chromatography of the ionic solutes.
In practice,nr many separationsystems,theseprocessesare at work to some extent
even if the separationsare not explicitly characterizedas such (e.g., much practical
reversephaseHPLC involves theuseof modifiers andpH adjustmentthatoften exploits
the processesof ion-pairing and ion suppression,m order to achieve separations).
3.5.4. Summary
It is worth remembering that most forms of chromatography involve more than
one form of interaction. Most systemstend to be classified neatly as adsorption,
partition, ion-exchange, or other single form of chromatography. In practice, however, a separation mechanism is almost always very complex and multifarious
becauseof the array of interactionsthat involve the sample molecules,and the vanous componentsof the mobile phaseand the stationaryphase,including the “inert”
stationaryphasematerial (e.g.,the cellulose on which an ion-exchanger may be supported or the free silanol groups of silica coatedwith areversephasestationaryphase).
This is perhaps both the beauty and the bane of chromatography. There is an
infimte number of overall interactions so that chromatography is an amazingly
versatile tool that can separatean infinite variety of mixtures, but working out how
this might be done in each individual caseis not always easy or stratghtforward
These same basic principles apply for all forms of chromatography.
Although at first sight HPLC, centrifugal TLC, countercurrent chromatography, and size exclusion chromatography are physically very different and the
basis of separation may or may not be different, the underlying principles governmg the chromatography are the same in all cases.
4. General Extraction Strategy
The purification of a natural product can often be broken down into three
main stages:
1. Releaseof compound from intracellular milieu/cell massand removal of bulk of
biomass. Most of the bulk of the biomass (plants or microbes) exists as fairly
inert, insoluble, and often polymeric material, such as the cellulose of plants or
fungi and the microbial cell wall. The first step of the extraction is to release and
Approaching an isolation
41
solubllize the smaller secondary metabolites by a thorough solvent or aqueous
extraction This can be done by a series of stepwise extractions, using solvents of
varying polarity, which acts as the first fractionation step, or by using a single
“all-purpose” solvent such as methanol, which should dissolve most natural products at the same time as enhancing their release from the cellular matrix/cell
surface by permeabllizmg the physical barrier of the cell walls. The bulk of the
msoluble material can then be removed by filtration or centrifugation.
2 Having made the initial extract, one IS usually still faced with a pretty complex
mixture. Much of this material will be grossly different from the target compound in that much of it may be inorganic or very polar organic material, whereas
the target compound IS fairly nonpolar, and the aim of the second step IS often to
try and strip away a large proportion of the unwanted material m a fairly lowresolution separation step. Such a step may Involve an open silica column or a
series of llquld-liquid
extractions, with the aim of a mixture containing all the
natural product of interest but comprising only a small proportion of the initial
extract, i.e., a relatively small volume of sample that is amenable to the final
high-resolution step that will follow.
3 The third general stage is often a high-resolution separation to separate those
components still remaining and which must, by reason of still being associated
with the target compound after two main fractionation procedures, bear at least
some similarity with it. Whereas the second stage might involve a general fractionation with subsequent analysis and work-up of the fractions, this third stage
tends to mvolve preliminary work modifying and altering conditions to achieve
the desired separation before preparative work is carried out. This final stage is
often, but not always, achieved by HPLC or TLC.
This breakdown of an extraction mto three well-defined stagesis certainly a
simplification. Many purifications do not divide neatly into routme steps, and
short cuts are more than welcome. Sometimes the extractor is lucky and a
desired compound crystallizes out of a crude broth extract, but unfortunately
this does not happen very often!
Schemes l-5 are typical examples of extractions taken fairly randomly from
the Journal of Antibiotics and the Journal of Natural Products. The general
process outlined above is exemplified in the isolation of spirocardms A and B
(Scheme 1) (3). The compounds were found to be in the broth filtrate, which
was extracted twice with ethyl acetate (half volume of supernatant). The ethyl
acetate phase containing the compounds was concentrated by evaporation
under reduced pressure, then washed with an equal volume of water saturated
with sodium chloride to completely remove water and very polar materials,
then fLrther reduced to give an oil. This was then redissolved in a minimal
volume of ethyl acetate and chromatographed on a silica column developed
with hexane containing increasing amounts of acetone. This resulted in two
fractions, containing spirocardins A and B, respectively, as the main compo-
42
Cannel
nents. These two fractions were then chromatographed separately again on
silica gel (the more polar spirocardin B requiring a more polar eluent). The
compounds were finally chromatographed on a reverse phase HPLC system to
remove minor impurities.
A similar type of procedure is shown in Scheme 2 for the isolation of
glucopiericidinols from a Streptomyces sp. fermentation, the main difference
being that this extraction mcorporates chromatography on Sephadex LH20.
This purification is also notable in that the final stage involved a chiral HPLC
separation of two diastereoisomers (4).
The isolation of antifungal and antimolluscicidal saponins from Serjania
salzmanniana also involved the use of a silica column, but it then followed this
with separationby countercurrent chromatography (Scheme 3). An interesting feature of the final preparative TLC stage was the use of water as a nondestructive
visualization “stain.” As these compounds are so hydrophobic, this region of the
plate remained white (dry), and the remainder of the plate turned dark (wet) (5).
For the more polar fungal metabolite epipentenomycin I (Scheme 4), an
aqueous extract of the fungus was purified by two forms of ion-exchange
chromatography. A final reverse phase HPLC step was employed, but the very
polar mobile phase suggests that the compound was hardly retained by this
stationary phase, and that this technique was only just within the hmits of its
usefulness for such a polar compound (6).
Cispentacin, shown in Scheme 5, bears some structural similarity to
epipentenomycm and was also isolated usmg two ion-exchange chromatography systems.The broth supernatant was loaded directly onto the ion-exchange
column without any prior treatment, and unlike the epipentenomycin I isolation, the final step employed chromatography on a column of activated charcoal to afford a solid of 96% purity. The compound was then purified even
further by recrystallization from acetone-ethanol-water (7).
An unusual extraction procedure is shown in Scheme 6 for the purification
of soraphen Al, from a myxobacterium. An adsorbent resin was added to a
large-scale fermentation vessel prior to inoculation so that the metabolite was
continuously adsorbed as it was produced. Not only did this simplify the isolation, but it also resulted m increased production of the compound by the organism, possibly because adsorbent effectively removed metabolite from the
system, thus reducing any feedback inhibition. The eluate from the resin was
sufficiently clean that it required only solvent extraction prior to a crystallization step that yielded reasonably pure soraphen Ai c1(8).
5. Conclusions
Once some information about the nature of the compound has been established, a strategy for the purification can be planned. There is no “correct way”
43
Approaching an /so/a tion
Fermentation
Broth (Nocafdia
Sp )
FILTERED
1
Flltrate
U(TRACTED WITH ElOAc
1
EtOAc
1
CONCENTRATEO. WASHED WITH WATER,
DRIED ON ANHYDROUS Na2504
01
1
S~llca Gel Column
f
Crude
Wlca
A
SpirOCardifl
Crude
4
Spimcardm
B
.
Gel Column
Silica
Gel Column
BENZENEiEtOAc (4 13 1)
1
Otl
BENZENE’EtOAc (2 l-3 1)
4
Oil
1
Reverse
Phase
1
Sp~mcardin
HPLC
Reverse
Phase
HPLC
1
A
Spirocardln
B
Scheme1. Isolation of SpirocardinsA andB.
to extract a natural product; there are a myriad of effective methods. In practiceand quite sensiblweople tend to turn to a method or techniquethat they are farniliar with or that is routinely used in their lab (and the experiencethat comeswith this
Cannell
Fermentailon
EtOAc
EtOAc
Broth
1
Extra&on
of Whole
Broth
4
Layer
CONCENTRATED,
WASHED
WITH METHANOL
1
011
4
Stlica Gel Column
Sephadex
&
LH20
Column
ELUTE WITH MeOH
c
Mwture of Glucoplenctdtnols
Al, A2 and Glucoptericldin
Siltca
c CHCI,-MeOH
Mixture
Reverie
A
4
Gel Column
of Glucoplencldmols
4
Phase
J
Glucoptencldinol
(9 1)
Al and A2
HPLC
Al
Glucoplencldmol
4
Glucopteric~dmolA2
A,, Glucoptenudmol
A,
Rl, R2 = OH, CH,
Scheme 2. Isolation of Glucoplericidmols
obviously makes a succesfhlisolation more likely). There is a danger, however, in
becoming blinded or narrow-minded and not considering lily the worth or easeof
other techniquesor being reluctantto try other approachesbecausethey areunfamiliar.
45
Approaching an Isolation
MeOH
Extract of Powdered
Stems of Seganie salzmannrana
EVAPORATED
TO DRYNESS
I
MeOH-H,O
(1 2) Susp nston of Resrdue Extracted
COMBINED
x3 wrth CHCI,
CHCI, EXTRACT
EVAPORATED
TO DRYNESS
I
Column
Chromatography
of Residue on Silrca Gel
I
Fractions
Fractions
Monrtored t$TLC (CHCl3-MeOH-H20
wrth R, Values 0 04-O 14 Pooled
Countercurrent
Chromitography
(CHCI,-MeOH-H,O
[7 3 11)
[7 3 l])
I
Siltca Gel Column Chrtmatography
of Fractions Containing Sapontns
OH
OR Preparative
TLC (EtOAc-MeOH-H,O
[I8 7 lo])
l-4
.J
R,
0
60
OH
RI
R2
1
CH,OH
H
2
C’-‘,
H
3
CHO
H
OH
4
CH,OH
0
OHka
OH
OH
Scheme3. Isolation of Saponinsfrom Serjania salzmanniana.
It is perhapsslightly artificial to discusspurification apartfrom the context
of structure determination. We rarely isolate compounds without attempting at
Cannel
46
Dried Fungus (Peziza sp.)
4
EXTRACTED
x4 WITH
H,O (WITH
SONICATION)
Pooled Aqueous Extracts
EVAPORATION
REDISSOLVED
CENTRIFUGED
IN SMALL VOLUME OF H,O
TO REMOVE PARTICULATES
Aqueous Concentrate
Anion Exchange Column (Sephadex QAE)
H,O ELUTION
1
Cation Exchange Column (SPC25)
1
Reverse Phase HPLC (Mobile Phase: 0.05% AcOH/H20)
Epipen 1 eneomycin I
0
CH,OH
“U,
OH
a
OH
Scheme4. Isolation of EpipentenomycinI.
some stage to determine exactly what they are. In many instances, the aim of
isolating a natural product is to determine its structure and whereas it has generally been the case that in order to elucidate the structure of a natural product,
that natural product has first to be isolated, technological developments mean
that this necessity is decreasing. Coupled, or “hyphenated,” techniques, such
as LC-MS and LC-NMR, that unite separation and structural analysis into a
47
Approaching an Isolation
Fermentation Broth (Bacillus cafeus)
1
Supernatant
CENTRIFUGED
1
Cation Exchange Column (Amberlite IR 120)
1
1
Activated Charcoal
Cation Exchange Column (Dowex SOVVXS)
Column
1
Cispentacin (96% pure)
I
f
Recrystallization
(from acetone-ethanol-water)
1
Cispentacin (>98% pure)
Scheme5. Isolation of Cispentacin.
single system,mean that structures can be fully or partly determined as a separation is carried out, without first preparing some pure material. Developments
in two-dimensional NMR techniques also mean that it is becoming increasingly possible to determine structures of components of complex mixtures such
as microbial broths. Additionally, the increasing power of physical methods
exemplified by the increasing field strength of NMR spectrometers, and
improving ionization techniques of mass spectrometry, mean that now it is
Cannel/
48
Ferment&on
Broth (Sorangium cellulosum) + Amberlite XAD-1180 Resin
FILTERED
1
Amberlite XAD-1180 Resin
WASHED WITH WATER TO REMOVE ADHERENT CELLS
ELUTED WITH MeOH
I
Methanol Eluate
CONCENTRATED
I
EtOAc Extra&on
TO WATER PHASE
of Concentrate
EVAPORATION
OF EtOAc
I
Viscous Residue
1
Recrystakation
1
Soraphen Al,
from Butyl Acetate
(85% Punty)
Scheme6 Isolation of SoraphenAla.
often possible to elucidate structures from very small amounts of material thus adding to the blurring of the boundaries between analytical and
preparative methods.
Approachmg an /so/a t/on
49
6. Notes
1. Care should be taken to ensure that the material is fully resuspended. If, for
example, the sample 1sdried for several hours in a heated vacuum centrifuge, tt
may settle on the bottom of a tube as a hard crust that may be very difficult to
fully resuspend. There 1s also a danger of a soluble compound appearing to be
insoluble because it is physically associated with msoluble material and not properly accessible to the solvent In this case, ultrasonication, or mechanical mtxmg
of samples is useful
2. If the compound does not appear to be in either phase, check that it does not form part
of the msoluble layer, or emulsion, that sometimes forms at the partition interface.
3. These tests, essentially very simple and straightforward, present their own practical problems. If a small portton of what may be a fairly hmlted sample is being
used, one may be forced to work with small volumes, which can lead to errors
and problems. It is difficult, for example, to carry out solvent-solvent extractions
using very small volumes. A small amount of solvent may eastly evaporate in a
short time or “creep” up the side of the vessel, and the loss of these small amounts may
represent a large proportion of the total volume and may lead to large errors m
the results of subsequent assays With small volumes, the formation of some
insoluble material/emulsion at the phase interface can lead to dtstortions in the
relative volumes of the phases, and sampling from, or separatmg, the phases wtthout significant carryover from the other phase can be tricky. These problems can
be countered by using larger volumes where possible.
Many of the solvents used (particularly water-immiscible solvents) ~111 need
to be evaporated before bioassay in aqueous systems The resulting residue can
be redissolved in a more suitable solvent, such as methanol or DMSO, then
diluted to an appropriate tolerable level. Similarly, it is sometimes wise to adjust
the pH with volatile acids, bases, or buffers so that they can be readily removed if
it is necessary to dry a sample prior to assay, thus reducing the chance of mterference with the assay or the compound.
4. The importance of testing controls (i.e., resins treated with solvents/solutton but
containing no sample) should be emphasized, particularly when using bioactivity
assays. It 1s not uncommon for assay-interfering materials to be washed from
resins or for traces of contaminants in solvents to be concentrated during the
process, giving rise to misleading bioactlvrty results or even spurious chromatogram peaks
5. Although adsorption energy on alumina is used as the standard parameter, the
values for sihca are very similar.
The other mam measures of solvent strength, the Hildebrand solubility parameter
(6) and the solvent polarity parameter (P’), are calculated by addition of the various
intermolecular forces and addition of figures related to the solubility of the solvent in
ethanol, dioxane, and mtromethane, respecttvely. They result in similar eluotroprc
series, though there are significant differences that reflect the fact that there are several properties of the solvent (dtpole moment, solvation properties, and so on) that
determine the degree of Interaction between the solvent and the stationary phase.
50
Cannel
6. Stepwise elutron has the advantage that it doesn’t require complex equipment.
However, it IS possible to make a simple gradient former suitable for some circumstances, as shown in Fig. 15.
References
1. Zahner, H., Drautz, H., and Weber, W. (1982) Novel approaches to metabohte
screening, in Bioactive Secondary Metabohtes. Search and Dtscovery (Bu’Lock,
J. D., Nisbet, L. J., Winstanley, D J , eds.), Academic, London, pp. 51-70.
2. Ghisalberti, E. L. (1993) Detection and Isolation of Bioactive Natural Products, m
Bioactive Natural Products:
3.
4.
5.
6.
7.
8.
Detection, Isolation
and Structural
Determinatton
(Colegate, S. M. and Molyneux, R. J , eds.), CRC, Boca Raton, FL.
NakaJima, M., Okazaki, T., Iwado, S., Kinoshna, T., and Haneishi, T. (1989) New
diterpenoid antibiotics, spirocardins A and B. J Anttbtot 42, 1741-1748.
Funayama, S., Ishrbasht, M., Anraku, Y., Miyauchi, M., Morr, H., Komtyama K ,
and Omura, S. (1989) Novel cytocrdal antibiotics, glucopiericidinols Al and A2.
Taxonomy, fermentation, isolation, structure elucidation and biological characteristics. J. Antibiot. 42, 1734-1740.
Ekabo, 0. A., Farnsworth, N. R , Henderson, T. 0 , Mao, G., and MukherJee R
(1996) Antifungal and molluscicidal saponins from Serjania salzmanniana J Nat
Prod. 59,43 l-435.
Bemillon, J., Favre-Bonvin, J., Pommier, M., and Arpin, N. (1989) First isolation
of (+)-epipentenomycin I from Peziza sp. carpophores J. Antzbiot. 42,1430-1432
Konishi, M., Nishio, M., Saitoh, K., Miyaki, T., Oki, T., and Kawaguchi, H. (1989)
Cispentacin, a new antifungal antibiotic I. Production, isolation, physico-chemical properties and structure. J Antibiot. 42, 1749-1755.
Gerth, K., Bedorf, N., Irschik, H., Hofle, G., and Reichenbach, H. ( 1994) The soraphens
a family of novel antitungal compounds from Sorangtum cellulosum (Myxobacteria) I.
Soraphen A,, fermentation, isolation, biological properties. J. Antibiot 47,23-3 1
Selected References
Sewell, P. A. and Clarke, B. (1987) Chromatographzc Separattons. Wiley, Chichester, U.K
Bristow, P. A. (1976) LC In Practzce hetp, Cheshire, UK.
Poole, C. K. and Poole, S. K. (1991) Chromatography Today Elsevier, Amsterdam
Colegate, S. M. and Molyneux, R. J. (eds.) (1993) Bioactive Natural Products: Detection, Isolation and Structural Determination. CRC, Boca Raton, FL.
Weinstein, M. J. and Wagman, G. H. (eds.) (1978) Antibiotics: Isolatton, Separation,
Purzftcation, Journal of Chromatography Library, vol. 15. Elsevier, Amsterdam.
Naton, S., Ikekawa, N., and Suzk, M. (1981) Advances in Natural Products Chemistry.
Extraction andlsolatton ofBiologically Active Compounds Halstead, Wiley, New York
Wagman, G. H. and Cooper, R. (eds.) (1989) Natural Products Zsolatzon. Separatzon
Methodsfor Antimtcrobtals, Antiviral and Enzyme Znhtbttors, Journal of Chromatography Library, vol. 43. Elsevier, Amsterdam.
Verrall, M. S. and Hudson, M. J. (eds.) (1987) Separations for Biotechnology. Ellis
Horwood, Chicester, UK.
Approaching an Isolation
57
Kennedy, J F. and Cabral, J. M. S. (eds.) (1993) Recovery Processes for Bzological
Materzals Wiley, Chicester, UK
Marston, A. and Hostettmann, K. (199 1) Modern separation methods. Nat Prod Rep.
8,391-413.
Verrall, M S. (1996) Downstream Processing ofNatural Products Wiley, Chichester, U.K.
Ikan, R. (1991) Natural Products A Laboratory Guzde. Academic, San Diego, CA.
Belter, P. A , Cussler, E L , and Hu, W. S. (1988) Bioseparations Wiley, New York


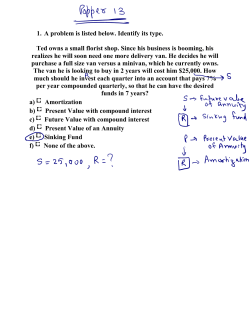


© Copyright 2026