
How to Use the Stand-Damage Model: Version 2.0 J.J. Colbert
United States
Department of
Agriculture
Forest Service
Northeastern
Research Station
How to Use the
Stand-Damage Model:
Version 2.0
General Technical
Report NE-281
J.J. Colbert
George Racin
Abstract
The stand-damage model is a distance independent tree growth simulator that
represents a stand, a spatially homogeneous collection of forest trees growing on a
site. The model simulates growth from an initial inventory, user-defined management
practices, and the effects of gypsy moth defoliation. Installation and operating
instructions for version 2.0 of the model are provided. The following new features
are presented: an expanded list of tree species, how to add new tree species, how
to edit parameters for a tree species, how to enter data directly from plots, and the
packaged scenarios for simulation of gypsy moth outbreak sequences. The
scenarios provide a variety of tabular and graphic outputs contrasting the range of
gypsy moth effects over a 20-year horizon.
The Authors
J.J. COLBERT is a mathematician and GEORGE RACIN is a computer specialist
with the USDA Forest Service’s Northeastern Research Station at Morgantown,
West Virginia.
Manuscript received for publication 28 November 2000
Published by:
For additional copies:
USDA FOREST SERVICE
11 CAMPUS BLVD SUITE 200
NEWTOWN SQUARE PA 19073-3294
USDA Forest Service
Publications Distribution
359 Main Road
Delaware, OH 43015-8640
Fax: (740)368-0152
September 2001
Visit our homepage at: http://www.fs.fed.us/ne
Contents
Introduction ........................................................................................................................... 1
The Stand-Damage Model ............................................................................................ 1
Platforms Supported by Stand-Damage Model ............................................................ 1
Errors in Original Documentation .................................................................................. 2
Companion Documents ................................................................................................ 2
Growing Degree-Days .................................................................................................. 2
Other Revisions to the Model ....................................................................................... 2
Conventions .................................................................................................................. 3
Using the Stand-Damage Model ........................................................................................... 4
Installation .................................................................................................................... 4
Using Windows® 3.1 .................................................................................................... 4
Installing Shortcut to the Windows® 95/98/NT Desktop ............................................... 4
Error Messages ............................................................................................................ 5
Cautions ....................................................................................................................... 5
Disk Files ...................................................................................................................... 5
User Interface and Documents ..................................................................................... 7
Running the Software ................................................................................................... 7
Obtaining Assistance .................................................................................................... 7
Editing Tree Species Defaults ............................................................................................... 8
Order in the Pick List .................................................................................................... 8
Change Values for Particular Species .......................................................................... 8
Data Defaults/Constants and Critical Values .............................................................. 10
Editing Data ................................................................................................................ 10
Relation to Other Variables ......................................................................................... 13
Cautions ..................................................................................................................... 13
Changes to the “Edit tree species” Window ................................................................ 13
Add New Species ................................................................................................................ 14
Use the Template/Interface ......................................................................................... 14
FORMATs in Template File ......................................................................................... 14
User-Defined Species ................................................................................................. 15
Merging New Data with Existing Files ........................................................................ 15
Plot Data-Entry System ....................................................................................................... 15
Accessing the Plot Data System ................................................................................. 15
Setting Up for Data Entry: Plots .................................................................................. 15
Setting up for Data Entry: Trees ................................................................................. 17
Entering Tree Data ...................................................................................................... 19
Managing Plot Data .................................................................................................... 20
Reviewing Plot Data ................................................................................................... 20
Packaged Scenarios for Simulating Defoliation .................................................................. 22
Background ................................................................................................................ 22
Scenario Design ......................................................................................................... 22
Scenario Results ........................................................................................................ 23
Command-Line Switches .................................................................................................... 27
Packaged Scenario Mode .......................................................................................... 27
Specific-Year Mode ..................................................................................................... 28
Details Mode ............................................................................................................... 28
Monochrome Mode ..................................................................................................... 28
Fast Start .................................................................................................................... 28
Plot System Tutorial ............................................................................................................ 29
Why Use the Plot System ........................................................................................... 29
Entering Plot Data ....................................................................................................... 29
Sample Fixed-Plot Data .............................................................................................. 29
Sample Variable-Radius or Prism-Plot Data ............................................................... 30
Fixed-Area Plot Data Entry ......................................................................................... 31
Variable-Radius Plot Data Entry ................................................................................. 36
Acknowledgments ............................................................................................................... 41
Literature Cited .................................................................................................................... 41
Appendix ............................................................................................................................. 43
Table 3.—FIA Codes, Common and Scientific Names ................................................ 43
Table 4.—Scientific and Common Names, Gypsy Moth Feeding Preferences ........... 49
Table 5.—New Tree Species ...................................................................................... 61
Sample Data Sheets for Fixed-Area Plot Data Entry .................................................. 62
Sample Data Sheets for Variable-Radius Plot Data Entry .......................................... 65
Introduction
The Stand-Damage Model
The Stand-Damage Model, a component of the Gypsy Moth Life System Model, calculates tree
diameter growth, current diameter and height, and tree mortality for each year of a simulation. The
model is a distant-independent, tree-growth simulator, a gap model based on the work of Botkin
(1993), Shugart (1984) and others. For details on model formulation or computational algorithms, see
Colbert and Sheehan (1995), Colbert and Racin (1995), and Racin and Colbert (1995). The model
interface now includes parameters for 71 tree species or species groups. The user can add up to 10
additional species for a stand simulation; 20 species can be included in a single simulation. Seven
additional categories for including noncommercial or other unidentified species (grouped by
susceptibility to defoliation as conifers or deciduous trees) allow you to provide a more complete and
accurate set of initial conditions. In addition to tree counts by species and diameter class, you can
assign one of three soil-moisture categories for the stand. Users supply information on defoliation
history (in broad categories by species for the 2 years prior to the simulation) and describe defoliation
scenarios for each species each year as a percentage for the overstory and for the understory. Each
year, the model calculates the diameter growth of trees as a function of relative stocking (a measure of
tree crowding), shading, heat, and defoliation.
Weather drives photosynthesis and tree growth. A cumulative heat unit measure, degree-days above a
single threshold (40° F) is used for all tree species as a primary driver of diameter growth. Default
constant weather data can be overridden by entering weather variation for each year simulated. Tree
mortality comprises three factors: a base rate, stress-induced mortality, and gypsy moth defoliationinduced mortality. The base rate is increased as diameter growth is reduced. Following mortality
calculations, tree growth is updated for the residual stems, and new stems are recruited to the
smallest classes. Management through silvicultural prescriptions can be simulated. The user provides
data for management actions, including the year of entry, selection criteria for removals, and speciesspecific targets.
Calculations that are used when linked to the Gypsy Moth Life System Model are available from the
authors (see page 7). Each year, potential resting sites for gypsy moth are calculated from tree
diameter and height using a predicted live crown ratio. The software calculates potential foliage
biomass on the basis of estimated growth in the absence of gypsy moth. Factors for converting foliage
biomass to surface area are species specific but used only for estimating defoliation when gypsy moth
growth and feeding is being simulated in the combined model. Foliage budbreak and growth also are
handled outside of the stand model code since these are important only in relation to gypsy moth
feeding.
Platforms Supported by Stand-Damage Model
The model currently runs under MS-DOS® and within a DOS Window or emulator under Windows®
3.1/95/98/NT on Intel or compatible processors1. It operates as a DOS package of programs, using a
graphical interface for management of input and output data, controlling simulations, and viewing
results. The model can run on older computer and does not require more than the base 640K of
memory, though usage is enhanced by a mouse for easy access and movement within and among
windows within the user interface. Instructions are included with the installation package for running
the program from Windows® 3.1 with the included PIF and icon files or from Windows® 95/98/NT.
1
The use of trade, firm, or corporation names is for the information and convenience of the reader. Such use
does not constitute an official endorsement or approval by the U.S. Department of Agriculture or Forest
Service of any product or service to the exclusion of others that may be suitable.
1
Errors in Original Documentation
In the Description manual (GTR NE-208, Colbert and Sheehan 1995), following equation (11b) on
page 14 and following equation (15) on page 17, Table 6 should be referenced rather than Table 4.
Also, in the caption for Figure 8 on page 18, the measure for DMAX should be 121.92 cm (48 inches).
In the User’s Guide (GTR NE-207, Colbert and Racin 1995), the illegible text box in Figure 17 (page
22) below the “Edit Tree Species” box, should read “choose from list.” And on page 36, the reference
to “General Technical Report NE- ” should include “208.”
Apart from these errata, we have made several revisions to the original Stand-Damage Model.
Feeding preference, which was not considered in Version 1 is included in this report for all original and
added tree species (Tables 3 and 4 in the Appendix). Also, recent work on the model revealed that the
maximum regeneration-establishment parameter, RECRUT, was set too high in earlier versions,
causing more than expected ingrowth. This has been corrected for all of the new and previously
defined species. Finally, the parameter that provides the stumpage value for species has been added
to the SPECIES parameter file. This parameter is used only in the packaged scenarios in Version 2.0.
Companion Documents
The data required for adding species to the model can be found in basic dendrology texts. The
“Textbook of Dendrology” (Harlow et al. 1979), the “Silvics of North America” volumes compiled by
Burns and Honkala (1990), and “Trees of the Southeastern United States” (Duncan and Duncan 1988)
are excellent sources. For scientific and common names, we follow the nomenclature in “Checklist of
United States Trees” (Little 1979). “Oaks of North America” (Miller and Lamb 1985) is valuable for
searches within specific families or genera. “Knowing Your Trees” (Collingwood and Brush 1978) was
used to assess tree-crown shape in assigning stocking classes, and “Important Forest Trees of the
Eastern United States” (USDA Forest Service 1991) was the source of information for each species.
“General Technical Report NE-211” (Liebhold et al. 1995) was the source for species feeding
preference of the gypsy moth (Appendix); data from Botkin (1993) and Shugart (1984) contributed
significantly to the formulations used in the model. To better understand and interpret the current
Stand-Damage Model, review the documentation for Version 1.0 (Colbert and Racin 1995, Colbert and
Sheehan 1995, Racin and Colbert 1995).
Growing Degree-Days
A basic function of the model is the use of growing degree-days for range specificity. As a result, you
will need to know the heat requirements for each species that you add as well as the average growing
degree-days for each stand to be simulated. A degree-day map of the coterminous United States is
available from our web site (http://www/fsl.wvu.edu/gypsymth/ddmap.html). When downloaded, the
map can be used to assess the local climatic conditions of a specific area at a spatial resolution of 10
km. The resolution of the data available for devising this map is course, so we recommend that they
be considered an approximation and that the surrounding cells be averaged. If local weather data are
available, you can calculate local degree-days from nearby weather stations and adjust for slope,
aspect, and elevation (Regniere et al 1995, Regniere and Bolstad 1994). A minimum sequence of
twenty years of historical data is recommended.
Other Revisions to the Model
In previous versions of the model, a stand was simulated as a stand table. Each cell in the table
represented trees/acre for the species (row) and diameter class (column). In Version 2.0 we
summarize data from various plot systems in that same way but we grow the inventory on a sample
tree basis. This eliminates the need to simulate tree growth by moving portions of the stem counts
from a diameter class to the next higher class. Now the initial inventory is used to create a stand
inventory, the stand inventory is projected forward, and then is classified and summarized for output
and management. Each tree diameter class is apportioned to a set of tree cohorts (1 to 10 depending
on the diameter-class width) so that the total number of stems per acre (per ha) is maintained.
We have also provided means for an unlimited species library, that is, you can add species to the files
or edit the currently available species to localize the model as necessary. The help information for
each tree species is in a separate file, SPECIES.HLP, that users can edit or to which they can append
new species-specific information. This allows you to add help information to this file for your own use.
2
Note that there still is a limit of 20 tree species for inclusion in a single stand for a simulation.
Additional information has been provided in the species selection list and the species edit window.
Alphabetic code, numeric FIA (Forest Inventory and Analysis) code, and common name appear in the
selection list. You can edit the scientific name and three-letter alphabetic code for any species that is
added to a stand. Within a saved input file, these can be distinguished by the user-defined tree
species scientific name field, the alpha code, and the program-defined numeric species code (000,
001, 002, ..., 009).
The greatest revision to the model concerns the user interface. The interface now allows direct input
from fixed- or variable-radius plots with variable plot size and prism factors supported. The initial
inventory to describe a stand for simulation is automatically compiled from plot data. Users can view
the per-acre summaries in several ways. The user interface has a second Run menu choice on the
Run pull-down menu. This Run Scenarios menu item allows the user to run a series of three
simulations from the initial stand inventory. Comparison tables are generated for assessing changes in
growth and mortality caused by moderate and severe outbreaks.
Conventions
Throughout this report, click refers to the left mouse button. Bold is used to signify either keys that are
to be pressed, or menu items or buttons that are to be activated when installing or running the
software. The Courier type face is used to signify a DOS file name or text to be typed at a DOS
prompt. Italics are used to indicate extremely important or cautionary text
3
Using the Stand-Damage Model
Installation
The model is installed using a Windows-based installation package that can be downloaded from the
Internet or mailed to you on a 3-1/2-inch floppy diskette. If you download the model from the Internet,
you will get a single, self-extracting file. By placing it in a clean directory and double clicking on it, you
will extract all of the files that are found on the installation diskette. The self-extracting file will remain
and can be moved or deleted. The Stand-Damage Model diskette contains the program that installs
the model onto your computer. To use the installation program, first close all other applications and
then place the diskette in floppy drive (usually A:). Select Start and then Run from the Windows task
bar. In the text field provided, type A:\SETUP (or the path to the folder where you unpacked the
Internet download) and click on OK or press Enter to start the installation. You will see a screen with
the Stand-Damage Model oak leaf logo and be presented with the options Next and Cancel. The
default option is Next for the following six screens:
1. Stand-Damage welcome screen;
2. README.TXT file (You can scroll through and read this file at any time as it is installed along
with the model program);
3. Name and Organization entry;
4. Destination folder choice for installation (the default is C:\DAMAGE);
5. Program folder destination;
6. All of the options selected. When you select Next, all of the Stand-Damage Model files are
installed.
When Setup is complete, you can choose to view the README.TXT file and/or launch the StandDamage Model software. If you reviewed this file under step 2 of the installation, you can skip this step
or fill in the registration form for printing and submission. Click on Finish to complete the installation.
Using Windows® 3.1
The Stand-Damage model can be run as a DOS application from Windows® 3.1. To make the model
accessible from within Windows, open the program group in which you wish to place Stand-Damage.
For example, if you want the model in the Applications group, double-click on the Applications Group
icon. From the Program Manger File menu select New, choose Program Item, and then click on OK.
Fill in the lines within Program Item Properties as follows:
Description:
Command Line:
Working Directory:
Shortcut Keys:
Stand Model
c:\damage\damage
c:\damage
None
This assumes you have named the Stand-Damage Model directory “DAMAGE” and that you installed
it on the C drive. After filling out this information, choose Change Icon. You will see the message “no
icons available for the specified file”. Click on OK to get to the Change Icon screen. Type in the path to
where the model was installed, ending with DAMAGE.ICO and click on OK. Using the default path you
would type
C:\DAMAGE\DAMAGE.ICO
From the Program Item Properties menu click on OK. You now have an icon representing the
Stand-Damage Model with “Stand-Damage Model” beneath it. When you wish to invoke
Stand-Damage from Windows, double-click the icon. The model will run the same from Windows 3.1
as it does from DOS.
Installing Shortcut to the Windows® 95/98/NT/2000 Desktop
The Stand-Damage model can be run as a DOS application directly from the Windows® 95/98/NT/2000
Desktop. Because many users do not want to have program shortcuts automatically loaded to their
desktops, we do not do that automatically. When the installation is complete, a program folder and
shortcut are added to your start menu. If you want to have access directly from your desktop, copy that
shortcut to your desktop by opening the Program folder for the model:
C:\WINDOWS\Start Menu\Programs\Stand-Damage Model
4
One way to find this path (or an alternate that you chose during installation) is to go to the Start menu,
choose Settings and then Task Bar & Start Menu. Then click on the Start Menu Programs tab to
reveal the Advanced button. When you click on that button a file navigator window will appear. In the
left pane, double-click on the Programs Folder and then click the Stand-Damage Model folder. The
start shortcut will appear in the right pane. Copy it to the desktop by clicking on it to highlight it, click
the Copy button, then right-click on the desktop and choose Paste. To ensure that the DOS window
closes on exit, right-click on the icon, choose Properties, click on the Program tab in the Properties
window, then click to check the “Close on exit” box. You can now double-click on the Stand-Damage
icon to run the Stand-Damage Model from the Windows® desktop.
Error Messages
If you start the Stand-Damage Model and the program does not run (a typical error message is:
Cscape error 141), you may have insufficient memory. As a DOS application, the model runs in the
first 640K of memory or an equivalent area assigned to it by the operating system. To check the
amount of available DOS memory, type the following at the DOS prompt:
C:\Windows > mem
A short report will be generated; look for the amount of Free Conventional Memory. Ideally, you should
have over 550K of Free Memory. If you have less than 550K, first restart your computer in DOS Mode.
Go to the Start Menu and choose Shut Down. When the Shutdown Windows screen appears, select
Restart in DOS Mode and click on OK. Then use the DOS cd command (change directory) to
navigate to the directory in which you installed the model. You can then start it from the DOS prompt
(assuming the default path):
C:\Damage > damage
and exit from DOS mode using the Exit command (type exit and press Enter) when you are
finished. You also may want to examine your AUTOEXEC.BAT file or CONFIG.SYS file for programs
that can be temporarily commented out (with the REM tag) so that you can run the Stand-Damage
Model. Start with your Autoexec.bat file. Look for lines that load programs (that contain either the
name of a program or fully qualified program [e.g., d:\myprogram\bin\program]). You should not
temporarily remove lines that start with Path or Set.
Cautions
The Stand-Damage Model can be run within a DOS window on the desktop on some systems. We
recommend running the application full screen and only switching to a window for short periods to access
other Windows applications. If you want to run the model within a window on the desktop under
Windows® 3.1 rather than full screen, you must edit the DAMAGE.PIF file in the model’s home directory.
Open the PIF editor, usually found under the Main Program Group. Add the Optional Parameter: “T” (for
text mode); change the Video Memory to Text mode from High Graphics, and the Display Usage from
“Full Screen” to “Windowed.” These changes will provide reasonable response but you will not be able to
view graphical results. Under this configuration, it is possible that your mouse will not function within the
window. Under some video display systems, the “DOS” mouse is visible but locked in the center of the
widow. Also, the Windows mouse pointer cannot be used within the application. Under some video
hardware and driver combinations, the application does run in full High Graphics mode and provides
graphical output but the response times for graphic screen changes (repaints) are poor. Because of these
potential problems, we recommend running the model full screen and quitting the program before running
other Windows applications to avoid loss of data and possible fatal program interactions.
Disk Files
Once the program is installed, you should be able to locate the following files in the directory that holds
the software. If a file is missing, reinstall the software or contact the authors. Before reinstallation, click
on the Add/Remove Programs in the Control Panel folder. If the Stand Damage Model is there, remove
it before installing again.
EXECUTABLE FILES
DAMAGE.EXE
SDM.EXE
Stand-Damage Model logo screen
main executable program file
5
DATA FILES
DEFAULT.
FILENAME.PRF
HELP.
HELP.IDX
INTRO.
OUTFILES.TXT
SDMTRANS.TXT
SPECIES.
SPECIES.HLP
TSTRINGS.INT
TAPER.DAT
default initial conditions and parameters for the model
filenames for output files
context-sensitive help system
index for help file (speeds access to text)
introductory text that describes the model and provides
assistance with program use
file names for packaged scenario output files
packaged defoliation scenarios input: data for running from the
command line (DOS Window) only; when packaged scenarios
are run from the user interface, the current stand and tree data
are used to initialize each simulation
parameter values for each tree species
help information for each tree species
output file headings
taper adjustment data for volume calculations
README FILES
README.TXT
SP-TMPLT.TXT
documentation — on the installation diskette, contains final
changes not found in the documentation as well as installation
and registration instructions
document file — templates for use in inserting text blocks into the
SPECIES and SPECIES.HLP files; use to add new tree species
EXAMPLE FILES
EXAMPLE.INP
EXAMPLE.TBL
PLOT-123.INP
STAND123.XLS
W-A-9614.INP
WAYNE.XLS
resource file — example input file
documentation file — output table generated from input file
EXAMPLE.INP
fixed area plot data file for the same stand used to generate
EXAMPLE.INP; Plot no. 123 is described in the EXAMPLE.INP file
and can be viewed by selecting Edit job description under the
Setup pull-down menu
all of the data that were used to create and additional history form
that stand for the period 1978-92; use these data to compare
model output with actual field data and build simulations of actual
defoliation histories for that stand
variable-radius prism plot example file; data are from Stand 14 in
Compartment 96 on the Athens District of the Wayne National
Forest in Ohio; the data are used in the Plot System Tutorial along
with the field data sheets used to create this file
sheet 1: data form for collecting example data for Stand 14; this
form can be modified to fit your data input needs; sheet 2: codes
used in data collection and their definitions, as well as notes for
field collection work
FONT AND GRAPHIC FILES
COURB.FON
OAK.PCX
ROMAN.FON
font file for graphic interface
logo graphic file
font file for graphic interface
UTILITY FILES
COMPARE.EXE
program to find differences between two ASCII text files
WINDOWS FILES
DAMAGE.ICO
icon for use in Windows shortcut
There are additional installation files that are not part of the model but are used to uninstall the
software if you choose to do that. These are deisreg.isr, isreg32.dll, and DelsL1.isu. To
6
remove these as well as all program files and linkages, use the Add/Remove Programs item in the
Control Panel.
User Interface and Documents
In addition to this document and the read-me file in the installation package, there are three
publications (manuals) that form the written documentation for the software. A copy of the Version 1.1
installation diskette is included with the User’s Guide (Colbert and Racin 1995). This document and
the User’s Guide should be your first references. This document explains the installation process and
the new components to the user interface. The User’s Guide explains how to access and use the
model. The Stand-Damage Model Description (Colbert and Sheehan 1995) provides the form,
background, and biological basis for the model code. The software’s internal help system is crossreferenced to the equations, tables, and figures in these publications. The Model Description also
contains a complete listing of the model equations and other formulations in the original FORTRAN. If
you are interested in the C language source code, it can be downloaded from our web site or
requested by mail. This document, updates and additions to it, and associated graphs and files also
can be downloaded or requested. The Interface Guide (Racin and Colbert 1995) provides details of
design and organization of the user interface and a description of associated data files. It contains a
listing of the user-interface written in C.
Running the Software
Start the software by typing damage and press Enter at the DOS prompt or by double-clicking on the
model icon. The horizontal Main Menu controls the program. Select your choice with the Arrow keys
or the capital letter of the appropriate menu item. Once a choice is highlighted, press Enter or point
and click the mouse. Use the Arrow keys or mouse to move between data fields. To exit a pop-up
window (or if you get lost) press Esc (possibly several times) to return to the main menu. From the
main menu, type T and press Enter to bring up the Add-Species list. This is an example of a scrollable
list. It is also searchable using the keyboard by typing the first letter of a common name (or alpha
code) for a tree species. Retyping that letter will cycle you through all the entries starting with that
letter. Note the arrows on the right border of this screen. Text windows such as output or help screens
use arrows and scroll bars to indicate that additional text is available. To reach this text, use the mouse
or the Page Up, Page Down, or Arrow keys. Each menu item and data-entry field is mouse sensitive,
so you can use it to move quickly between fields in a window, scroll or resize a window, or exit a
window (to exit, click outside the active window). Press the F1 function key to obtain context sensitive
help. Details on accessing the model and running simulations can be found in the User’s Guide.
Obtaining Assistance
Your comments and criticism are always welcome. To obtain assistance with any aspect of the StandDamage Model, you can contact us in several ways.
Address
USDA Forest Service
Northeastern Research Station
180 Canfield Street
Morgantown, WV 26505-3101
Authors
Jim Colbert
Phone: 304-285-1514
Fax: 304-285-1505
E-mail: [email protected]
George Racin
Phone: 304-285-1577
Fax: 304-285-1505
E-mail: [email protected]
Internet
For accessing information, updates, or to make requests, use:
http://www.fsl.wvu.edu/gypsymth/
To download models and related files, point your FTP client to:
[email protected]
Or you can download directly from our web site by looking for the download link from our home page.
If you have trouble using the 32-bit installation package, you can contact us for a 16-bit installer.
7
Editing Tree Species Defaults
Order in the Pick List
The tree species data file (SPECIES) and the species help file (SPECIES.HLP) are ordered
alphabetically by scientific name and coincidently by the three-digit FIA species code. This code is
used as the index search key by the software to locate the data for a species in the SPECIES file and
to locate the help information in the SPECIES.HLP file. This ordering is used by the software as it
builds the selection list for a user to add species to a stand for simulation. While it is ordered by
scientific name, you can search by common name. This pick list can be traversed using the keyboard
to move to the next common name starting with any letter entered. This process loops back to the
beginning of the list if there is no common name following the current location of the prompt as a letter
is pressed. This search function uses the first character on each line of the list so that having the 3character code start with the same letter as the common name allows the search to work with both the
code and the common name.
Change Values for Particular Species
There are slight changes in the mnemonic codes given to previously defined species since the
addition of the third character. In Version 1 we provided only two-letter codes; the 3-character codes in
Version 2 allow more useful mnemonics. These distinguish one species from others with similar
names, e.g., red oaks — northern and southern. As we move to the new Internet-based server/client
version using Java, we will provide 6-character mnemonic codes to allow for additional rational codes
and improve flexibility. You still can use 2 characters for a species mnemonic code.
Tables 1 and 2, respectively, list the original 21 species in Version 1 along with their new codes and
the 50 species that were added in Version 2.0.
Table 1.—Species carried over from Version 1.1 of the Stand-Damage Model
Species
code
Survey
code
UDa
EWP
000
129
user defined
eastern white pine
Pinus strobus L.
STM
RM
SM
315
316
318
striped maple
red maple
sugar maple
Acer pensylvanicum L.
Acer rubrum L.
Acer saccharum Marsh.
YB
SB
PB
371
372
375
yellow birch
sweet (black) birch
paper birch
Betula alleghaniensis Britton
Betula lenta L.
Betula papyrifera Marsh.
HIC
FD
AB
WA
400
491
531
541
hickory sp.
flowering dogwood
American beech
white ash
Carya sp.
Cornus florida L.
Fagus grandifolia Ehrh.
Fraxinus americana L.
YP
BGU
QAS
BC
621
693
746
762
yellow-poplar
blackgum (black tupelo)
quaking aspen
black cherry
Liriodendon tulipifera L.
Nyssa sylvatica Marsh.
Populus tremuloides Michx.
Prunus serotina Ehrh.
WO
SO
CO
NRO
BO
802
806
832
833
837
white oak
scarlet oak
chestnut oak
northern red oak
black oak
Quercus alba L.
Quercus coccinea Muenchh.
Quercus prinus L.
Quercus rubra L.
Quercus velutina Lam.
BAS
951
American basswood
Tilia americana L.
Common name
a
Scientific name
Model values provided for all parameters of user-defined species; range-checking values are similar for all
parameters of all tree species.
8
Table 2.—Species added to Version 2.0 of the Stand-Damage Model
Species
code
Survey
code
BF
ERC
TAM
WS
BS
RS
012
068
071
094
095
097
balsam fir
eastern redcedar
European larch (tamarack)
white spruce
black spruce
red spruce
Abies balsamea
Juniperus virginiana
Larix laricina
Picea glauca
Picea mariana
Picea rubens
JP
SLP
LLP
MOP
RP
PP
LOP
105
110
121
124
125
126
131
jack pine
shortleaf pine
longleaf pine
Monterey pine
red pine
pitch pine
loblolly pine
Pinus banksiana
Pinus echinata
Pinus palustris
Pinus radiata
Pinus resinosa
Pinus rigida
Pinus taeda
NWC
EH
241
261
northern white-cedar
eastern hemlock
Thuja occidentalis
Tsuga canadensis
BEM
SVM
MM
GAL
SAL
RRB
GB
AHB
313
317
319
349
353
373
379
391
boxelder maple
silver maple
mountain maple
green alder
speckled alder
river (red) birch
gray birch
American hophornbeam
(musclewood)
Acer negundo
Acer saccharinum
Acer spicatum
Alnus crispa
Alnus rugosa
Betula nigra
Betula populifolia
Carpinus caroliniana
CNX
421
American chestnut
Castanea dentata
BLA
GRA
PUA
543
544
545
black ash
green ash
pumpkin ash
Fraxinus nigra
Fraxinus pennsylvanica
Fraxinus profunda
BUT
BWA
SGU
MAG
601
602
611
652
butternut
black walnut
sweetgum
southern magnolia
Juglans cinerea
Juglans nigra
Liquidambar styraciflua
Magnolia grandiflora
EHH
701
Ostrya virginiana
SOW
ASY
BP
ECW
BTA
SCW
PC
CC
711
731
741
742
743
744
761
763
eastern hophornbeam
(ironwood)
sourwood
American sycamore
balsam poplar
eastern cottonwood
bigtooth aspen
swamp cottonwood
pin cherry
choke cherry
SRO
LO
BJO
PO
812
820
824
835
southern red oak
laurel oak
blackjack oak
post oak
Quercus falcata
Quercus laurifolia
Quercus marilandica
Quercus stellata
WIL
SAS
920
931
willow sp.
sassafras
Salix sp.
Sassafras albidum (Nutt.) Nees
Common name
Scientific name
Oxydendrum arboreum (L.) DC.
Platanus occidentalis
Populus balsamifera
Populus deltoides
Populus grandidentata
Populus heterophylla
Prunus pensylvanica
Prunus virginiana
Continued
9
Table 2.—Continued
Species
code
Survey
code
MAS
ELM
WEL
AEL
935
970
971
972
American mountain-ash
elm species
winged elm
American elm
Sorbus americana
Ulmus sp.
Ulmus alata
Ulmus americana
No$
OSC
ORC
OIC
OSD
ORD
OID
999
1010
1020
1030
1040
1050
1060
other noncommercial
other susceptible conifers
other resistant conifers
other immune conifers
other susceptible deciduous
other resistant deciduous
other immune deciduous
Mixture of species
Mixture
Mixture
Mixture
Mixture
Mixture
Mixture
Common name
Scientific name
Green ash (Fraxinus pennsylvanica) is one species that grows differently in the extremes of its range.
Its base growth rate ranges from 80 in the north to 100 in the south, and its maximum diameter and
height average 30 inches and 120 feet in the south verses 24 inches and 60 feet in the north. You can
edit any parameter for any of the existing species to suit local conditions or create your own race
variants within species; be sure to give them unique species and FIA survey codes and common name
identifiers. If you do not want to edit the SPECIES file of defaults directly, you can edit any of the
parameters for the species through the interface once you have added the data for that species. By
selecting that species to edit from the Tree Menu and Edit Tree Species item, you can access the
parameters and alter maximum height or diameter. Remember that by making changes for a single
stand through the interface, your changes will not carry to another stand and you will have to make the
changes again for each stand you simulate. You can save changes made through the interface to an
input (.INP) file, then paste that block into the SPECIES file. If you want to have two species that differ
only in their growth rate, use a text editor like DOS Edit, Windows Notepad, or your word processor to
open the SPECIES file for editing. Then use copy/paste to duplicate the species block you want to
“almost” duplicate. Make the changes to particular parameter fields in the new block and give it a new
set of identifiers (code and name). Changes or additions made to the SPECIES file will be available for
all future simulations.
In Tables 1 and 2 there are the original user-defined, noncommercial, as well as other-species groups.
These six groups correspond to the three defoliation susceptibility classes (susceptible, resistant, and
immune) for conifers and deciduous species.
Data Defaults/Constants and Critical Values
There are blocks of seven lines of data in the SPECIES file that provide all of the information and
parameters needed to describe a species. There are 30 numeric data items that must be supplied
(lines 4 - 7) for each species defined, but only 10 of these are essential to define the species. Nine of
the other 20 are needed only for predictions of foliage biomass, foliage growth during the larval
feeding stage, and those associated with gypsy moth dynamics. Ten others are mortality-interaction
parameters that have been given similar default values across all species. The final one is the default
(0.0) stumpage value given each species. Because stumpage values are volatile and subject to local
circumstances, it is left to the user to specify values. Users still can edit any parameter through the
interface for a particular simulation. Thus, there are only 10 values that must be supplied to define a
species. Each of these is described in detail in the following section.
Editing Data
Detailed descriptions and rational for setting values of each of the following parameters are found in
Colbert and Sheehan (1995) but they are scattered throughout that report. Here we cover the data that
need to be entered to parameterize a tree species in the order in which they occur in the SPECIES file.
A block of seven lines defines a species. Each block has a similar structure and format. The template
that follows provides a roadmap for data entry. For each of the places that you are required to fill in
information, that place is filled in the template by words (first two lines) or a set of letters (lines 3-7),
10
some with a decimal place shown, some without (these should be entered as integers, i.e., without
inserting a decimal place, just a series of digits). The following is similar to one of the SPECIES blocks:
1
2
3
4
5
6
123456789012345678901234567890123456789012345678901234567890
L1: common name
L2: scientific name
L3: nnn aaa m
L4:
n n
0.5000
0.5000
xxx.x lllll hhhhh 0.010
L5:
4.00 0.004
2.50 0.025
0.0
L6:
xx.x xxx nnn 0.03 1.8 600.0 n mmm
L7: 0.10 0.20 0.35 0.10 0.20 0.35 0.10 0.20 0.35
123456789012345678901234567890123456789012345678901234567890
1
2
3
4
5
6
By printing or viewing the SPECIES file in an editor or word processor, you will see how each block
has been constructed. Choose a mono-spaced font (e.g., Courier) to keep the alignment visible. A
template like the one shown is provided in the SP-TMPLT.TXT file. The following text is a detailed
review of each entry in the order in which they should appear. There should be at least one blank
space between entries. The exact location of data within a line is not critical but some white space
must separate individual parameters.
L1-L2:
The first line can contain up to 80 characters to describe the common name(s) for the species. The
second line should contain the scientific name.
L3:
1,2 There are two ways in which a species is coded in the model. First, the FIA or survey code (nnn)
is entered in the first three columns; this is used as the indexing internal code (Appendix, Table 3). The
second entry is the alphabetic code (aaa) that you can edit. This second code is used in all graphic
and tabular output to label lines for that species.
3 The final element (m) is the numerical code for feeding preference of this species by gypsy moth:
m = 1 for resistant species, m = 2 for acceptable species, m = 3 for preferred species. These values
have been summarized by Liebhold et al. (1995) and can be found in Table 4 in the Appendix.
L4:
1,2 There are two single-digit, shade-tolerance class indices (n); the first is for recruitment of new
trees into the smallest diameter class, the second is the shade tolerance of diameter increment
growth. Possible values for each range from most intolerant = 1 to most tolerant = 4, with special
cases for red maple (n = 5) and northern red oak (n = 6). See ISHADE, Table 4, page 9, in Colbert and
Sheehan (1995) for additional details.
3,4 Following the two required values are two constants: 0.5 = the number of resting sites per 100
cm2 on both lower boles (below crowns) and on upper boles and branches (within crowns). Note that
these are the first 2 of the 20 parameters that are read automatically by the input routines for each
species, but they do not affect a simulation unless it is used within the full Gypsy Moth Life System
Model where gypsy moth dynamics are simulated.
5 Base growth rate coefficient is next (xxx.x) and is defined as the coefficient that produces annual
growth increment (∆D) such that two-thirds of the maximum diameter is reached at half of the
maximum age for a species. While the model code does not use the following computation method,
the growth rate multiplier, G, can be estimated from the maximum annual diameter-growth increment
(∆Dmax) at breast height for a species as:
G = α Hmax ( ∆Dmax / Dmax)
where α = 152.4 if the maximum value for Hmax is provided in feet and ∆Dmax and Dmax are in inches.
Replace α with 12.7 if all units are in inches and with 5.0 if all maximum values are given in
centimeters. Smaller values of G mean that the species will gain diameter slowly during early life while
larger values will force the species to grow faster during its earlier life.
11
IMPORTANT: The earlier documentation (GTR-NE-207 and GTR-NE-208 [GROWR in equation 15 on
page 17]) incorrectly states that this is a dimensionless constant. Here this parameter is maintained
consistently in the interface in units of cm/yr. The interface does not alter the values provided as units
of measure change between English and metric. So long as you use the appropriate value of α when
computing a new value for G, the model will use your derived data (G value) correctly.
6,7 The lower (lllll) and upper (hhhhh) degree-day thresholds (COLDh, HOTh) for a species (h)
are accumulated using a 4.4° C (40° F) temperature threshold and summing the difference between
the daily temperature and the threshold, when positive, to accumulate an annual heat input for growth.
We have provided a somewhat course approximation to this process using monthly average
temperatures for a each 10-km grid cell across the continental United States and summing these
temperatures, less the lower threshold of 4.4° C, times the number of days in each month. We then
used a simple linear correction factor to adjust to the historical data (Botkin 1993; Shugart 1984). The
map can be obtained from the web site as either a GIF [24,212 bytes] or BMP [209,678 bytes] file or
as an EDRISI map (DOC [478 bytes] and IMG [277,300 bytes] files). Because it is a color image, it is
not reproduced in this document, as printed.
8 The final item is SLOWD = 0.01 in. (0.25 mm), the minimum diameter increment to avoid additional
mortality. If a tree’s diameter is below this threshold, additional stresses are assumed to accompany
this slow growth, and raise the probability of tree mortality.
L5:
1-4 These four parameters, CR1-CR4 (4.00 0.004 2.50 0.025), are the coefficients for the
crown ratio function; the crown ratio is used to predict bole length which, in turn, is used to predict
resting sites. While the model interface reads these parameters, crown ratio and resting sites are
relevant only to the full Gypsy Moth Life System Model.
5 The default value for stumpage value (0.0) for a species. Since the current formulation uses this
variable only when running the predefined simulations associated with the GypsES Decision Support
System linked version, it is not editable nor does it affect output. In a future release, it will be activated
but retain the zero initial value because stumpage prices vary greatly among regions and over time.
L6:
The next three variables are critical to defining a tree’s basic growth and mortality models. These
maximums are not the champion or extreme values but the generally accepted maximum values of the
“average” tree of the species (Burns and Honkala 1990).
1 DMAX is the maximum diameter (xx.x), in inches; it is required for designing the diameter growth
function as well as serving as the upper limit to diameter growth.
2 HMAX is the maximum height (xxx), in feet; it is required for designing the tree height function as
well as serving as the upper limit to height growth.
3 AGEMAX is the maximum age of the species (nnn), in years; it is assumed to be under normal
growing conditions (naturally occurring in expected habitat).
4,5 F1 and F2 (0.03 1.8) are the foliage prediction equation parameters. This is an allometric
equation for predicting the average foliage biomass of a tree, given its diameter.
6 The surface area conversion factor (from foliage biomass) SURFAR (600.0) is needed to predict
foliage consumption and destruction by gypsy moth when the stand model is part of the full Life
System Model.
7 Relative stocking index, ISTOKG (n), is calculated using a species group-specific set of prediction
equations that are indexed for narrow (1), intermediate (2), or broad (3) crowns. Choose the value that
best fits the tree species average tendency in crown width.
8 RECRUT (mmm) is the maximum recruitment of new trees into the smallest diameter class. This is
equivalent to surveying for trees that are between the lower limit for tree measurements (i.e., above
0.0 inch at breast height by default) and the diameter class width (2.0 inches at breast height by
default) each year to find what new individuals have grown into the survey.
12
L7:
1-9 FDIE is the matrix of mortality rate parameters that are site moisture regime-specific (1-3: mesic;
4-6: intermediate; 7-9: xeric) and vary as the number of consecutive years of defoliation above 65
percent (0.10 0.20 0.35 0.10 0.20 0.35 0.10 0.20 0.35).
Table 5 in the Appendix shows the new parameter values for each species that has been added to
Version 2.
Relation to Other Variables
The species-specific parameters interact with setting made for the stand as a whole, particularly with
the weather data. The default for annual total degree-days can be reset in the DEFAULT file to a
number that most effectively represents local conditions. This value will then be used as you alter the
simulation length or inventory year, filling in values for years not previously assigned values.
Cautions
Operate at your own risk! Care should be taken to see that data are properly being read in from the
SPECIES or DEFAULT file after edits, alterations, or additions are made to these files. Always back up
your files before appending or editing them. For laurel oak, note that the maximum number of new
trees that can move into the smallest diameter class is 4.5/acre, a nonintegral value. It is possible to
provide nonintegral data but you must be sure that the data are being read in and interpreted correctly.
Use the interface to edit a particular variable to see if the software will accept nonintegral values for
that parameter.
Changes to the “Edit tree species” Window
In updating the model interface to add the Plot Data-entry system, we have added information to assist
users in identifying and incorporating tree species into the model, and provided greater flexibility in
stand level tree data (per acre) entry. See page 12 and Figure 9 of the User’s Manual (Colbert and
Racin 1995). The changes can be seen at the top of the data-entry window (Fig. 1). First, the common
and scientific names are given, followed by the FIA and Letter codes, and then the gypsy moth feeding
preference class for the species is provided. (Liebhold et al. 1995). Pressing Enter while highlighting
the common name activates the species help system, providing a description useful for species
identification. The last addition is a lower limit for tree diameter classes (DLENBASE_min) that allows
you to input data for tree diameters starting at any nonnegative diameter less than 6 inches. This
parameter is set once for all tree data and is found in the Stand Data input window off the Stand pulldown menu. Using this parameter has two effects: it eliminates small trees from the initial inventory
and adjusts all diameter class midpoints up by this same amount, and it removes small trees from the
simulation. For example, if DLENBASE_min is set to 1.0, the first diameter class includes trees greater
than or equal to 1.0 inch and less than 3.0 inches. This first class midpoint is at 2.0 inches. Other
classes are centered at 4.0, 6.0, etc.
13
Figure 1.—The Tree Species Edit window is used to enter initial condition stem counts on a per-acre
basis, set defoliation history for start of simulations, or change the default parameters for a tree
species.
Add New Species
Use the Template/Interface
The easiest way to ensure that the information is saved in the proper format is to use the program user
interface to create user-defined species (Add tree species choice off the Trees selection item of the
main menu) and then save that information as an input file (the user interface will save the file with a
.INP file extension). You can then copy and paste the blocks into the SPECIES file after replacing the
first 3 lines of each block with a common name (line 1), scientific name (line 2), and entering a survey
(FIA) code and three character label for each new species (line 3). If the species is not in the
Appendix, we suggest using a survey code number distinct from those in the list so that your new
species will not conflict with future updates to the supplied species list.
FORMATs in Template File
There are two templates in the file SP-TMPLT.TXT that is installed with the model (and in the selfextracting ZIP file). These templates are designed to assist you in locating and editing or inserting a
block in the SPECIES file or in the associated help text in the SPECIES.HLP file. Because the text
requires formatting, lines surrounding each block are provided to indicate column position. These lines
are not part of the blocks and should not be left in the final text that is copied into the SPECIES or
SPECIES.HLP files. To make best use of this information, first print a copy of the file. Then, using a
text editor or word processor, open the template file, delete all lines but the template you want to use,
and then duplicate the template lines once for each species block you are going to enter. Next, use the
Save as... command to save this block as the SPECIES.NEW file. Finally, you can enter the data you
have prepared, and a final save upon exit will provide you with the product that you will need to merge
with the existing file. If you use a word processor, be sure that you save the final result as an ASCII
text file. See Editing Tree Species Defaults (page 8) and Editing data (page 10) for details on editing
these data.
14
User-Defined Species
As you add user-defined species through the user interface, the program automatically assigns them
survey code index values 0-9. If you add more than 10 of these to a single input file (saved input files
are provided with the .INP extension), you run the risk of possible interactions with lower FIA codes. If
you know you have a large number of new or user-defined species and want to use the interface to
construct them, add 10 or fewer new species, save them to an input file, and incorporate the contents
of that file into the SPECIES file. Following this process will avoid problems such as the loss of data.
Merging New Data with Existing Files
Once you have built a set of species that you want to add to the SPECIES file, first make a backup of
the current file using the DOS copy command as follows:
>copy species species.bak
Now you can append your new file to the old one:
>copy species.bak+species.new species
or replace the old one:
>copy species.new species
This procedure can be used to add help information to the SPECIES.HLP file. Remember that the
blocks are ordered in these files and that maintaining the survey code (and scientific name) order
enhances the search for a particular entry.
Plot Data-Entry System
Accessing the Plot Data System
Allowing users to enter data directly from field data sheets was suggested as an addition to the user
interface. This removes the need for a user to convert plot tallies to tree-per-acre estimates for each
species in the stand and then enter those data. The Plot data-entry system, the result of that
suggestion, has two sections. In the first section, you describe the plot system; in the second, you
enter the data for each plot. The Plot data system is entered via the Trees pull-down menu. When
Plot data is selected from the menu, the following message is displayed:
WARNING: Plot data replaces species specific Stem Counts
Utilize plot entry system?
By answering ‘Yes’ to this question, you are replacing the stem count (tree per acre) method of
providing initial tree data with the plot method. Be sure to save any data that you may already have
entered before starting a new input data set that uses the plot data system. After answering ‘Yes’, you
get two menu choices: Add new plot data (enter plot data for the first time) and Cancel (exit back to
the menu system). If you choose Cancel, the software reverts to the stem count method.
Setting Up for Data Entry: Plots
When you choose Add new plot data, you get a widow that allows you to design the specific use of
the plot data-entry system to fit your data. The software will automatically convert your plot data to
trees per acre for your review, create summaries of your data on a per-acre basis, and create the initial
conditions for simulations. Figure 2 shows the initial window as it appears with all defaults set. You
provide the method used to collect data and the options reflecting the data that were collected as
follows:
Plot type — Select the plot type(s) that you used in collecting the data: variable-radius
prism plots only, fixed-area plots only, or both prism and fixed-area plots. The default
setting is for fixed-area plots only.
15
Default prism — Enter the prism factor to be used for most of the variable-radius plots.
You will be able to reset the prism used in specific plots if necessary. A prism is a tool used
to sample trees in proportion to their basal area. To learn more about point sampling, see
“Simplified Point-Sample Cruising” (Northeast. Area, State and Priv. For.) or consult a
book on forest measurements or forest mensuration. Once you have provided the
diameter at breast height, the software will convert each sample tree to trees per acre.
Default fixed area — Set the size of most of the fixed-area plots. Again, you will be able
to reset this for any plot where a different plot area was used during data collection. Units
are given in acres; the default is 0.1 acre. Any positive number, up to 10 acres, can be
entered.
Number of plots — This is the total number of plots of tree data that you wish to enter. If
you have both fixed-area and variable-radius prism plots, enter the larger of the two. The
interface will provide twice that number of plots, assuming that you collected an equal
number of fixed and variable radius plots. The software will delete any unused plots that it
initially sets up. The default is three plots per stand, but this can be reset to any positive
integer, up to 100.
Maximum number of trees in any one plot — In building the data-entry screen, the
software constructs a fixed number of data-entry records for each plot. This keeps the
software efficient and the window interface for data entry manageable. Enter the largest
number of records to be entered in any one plot. This assures that you always will have
sufficient space for your data while keeping the size of the data-entry window manageable
(default: 5). This can be set to any positive integer, up to 120.
Figure 2.—When the plot system is entered, you are first taken to the Plot Design window where you
can edit the default or previously entered plot parameters. The defaults settings are shown here.
16
Setting up for Data Entry: Trees
Next is a collection of six choices that relate to the data collected for each tree. Each adds a data-entry
field to each tree record. These allow you to store most of the standard inventory tree characteristics
on sample trees. The first two and last two can be toggled on or off using the mouse or the space bar.
The Growing Stock and Crown Condition schemes are multi-choice selections and you are provided
with choice lists for the available categories.
Tally — The number of trees that are represented by one record. This is set to one tree per record
or, equivalently, one tree for each entry line in the plot data-entry window by default. If you choose
to tally your plot data by diameter classes, turning on this option will add fields to the data-entry
window where you can enter the tallies (counts) along with the associated diameters and species.
Marking grade — This field is used when the inventory should provide a measure of the quality as
sawtimber. A nine-class system is used here. This does not tally individual logs within trees but the
grade is for the whole tree. Log Grade specification for wood products uses (Marquis and Ernst
1992):
1 - Factory-lumber log grade 1;
2 - Factory-lumber log grade 2;
3 - Factory-lumber log grade 3;
4 - Locally defined log product (e.g., pallet) or construction log grade;
5 - Locally defined bulk product (e.g., boltwood);
6 - Pulpwood (minimum 2 contiguous 4-foot half-logs; minimum top DIB = 4.0 inches
and 50% sound);
7 - Fuelwood (same as pulpwood except min top DIB = 1.0 inch);
8 - Cull (tree with less than 50% sound wood or does not qualify for any of the grades
or products listed);
9 - Veneer log.
Growing stock — Growing stock is the silviculturist’s marking guide for tree-quality assessment
for retention or removal, looking toward either thinning to improve growing space for specific
residual trees. You can select either of the following systems:
For the 3-class system (Marquis et al. 1992):
A-Acceptable: suitable for retention for at least next 15 years, commercial species of form
and quality for sawtimber in future;
U-Unacceptable: undesirable species or disease, dieback, or damage threatens survival,
poor form;
X-Dead: standing dead tree.
For the 7-class system (USDA Forest Service, Eastern Region: FSH 2409.21d, R9,
Compartment Prescription Handbook, pages 245-2,3):
D-Desirable: optional use for black cherry, white ash, or yellow poplar;
A-Acceptable: growing stock that meets requirements in Marquis et al. (1992);
M-Mature: acceptable trees which are mature:
Species
Age
red and white pine
60
shortleaf and Virginia pine
50
scarlet oak
70
all other hardwoods
80
U-Undesirable: All other growing stock unless cull, wildlife, or dead;
C-Cull: does not meet minimum merchantability standards, i.e., no sound log 8 feet by 4
inches DIB at small end;
W-Wildlife tree: see wildlife tree descriptions below;
X-Dead.
Crown condition — Crown Condition is a classification system for assessing and rating tree
health. There are two schemes that are available; each uses numeric codes.
For the 3-class system, definitions and a photo-guide can be found in Gottschalk and
MacFarlane (1993).
1-good: healthy foliage, less than 25% dead branches, little or no epicormic sprouting;
2-fair: 25-94% of branches dead, epicormic sprouting is evident;
17
3-poor: 50% or more dead branches, foliage density, size, and coloration is subnormal,
epicormic sprouting is heavy.
For the 7-class system: unpublished study site guide, on file at the Northeastern Research
Station, 180 Canfield St., Morgantown, WV 26505-3101):
1-very good: 1-10% dead branches, healthy crown;
2-good: 11-25% dead branches, fair to good crown occasional dead branches in upper
portions, foliage density subnormal, some decline symptoms evident;
3-fair: 26-50% dead branches, fair to poor crown foliage density and color subnormal, some
branch sprouting;
4-poor: 51-80% dead branches, very poor crown, foliage density, color and size subnormal,
sprouting heavy;
5-dying: dead branches, apparently dying, subsisting on epicormic branches;
6-dead crown with some live stump sprouts;
7-completely dead tree.
Crown class — Crown classification or relative position of trees in the stand canopy:
1-open grown - full sunlight to all sides;
2-dominant - above general canopy, full sun from above and partly from sides;
3-codominant - forms general canopy, full sun from above but comparatively little from sides;
4-intermediate - shorter than codominant/dominant but crown extends into those above;
5-suppressed - crown entirely below main canopy, no direct sunlight from above or side.
Wildlife trees — Wildlife trees are classified as live or dead trees (snags) and whether they
currently are used by wildlife:
1-potential den tree, not actively used;
2-existing den, live tree is used;
3-snag-inactive, may serve as a wildlife tree;
4-snag with den, used by wildlife.
Figure 3.—The prism plot data entry screen is set to enter tally, crown condition, crown class and
default tree species and diameter for each record.
18
Entering Tree Data
Once you have specified the design of your plot data, a series of plot data-entry screens will appear,
one for each plot (Figs 3-4). These are numbered sequentially but you are given a 6-character plot
description field that can be used to identify each plot to your choosing. If you chose to enter prism
data, the first plot will be a prism plot (Fig. 3) and you are allowed to reset the default prism for this or
any particular prism plot. If you chose to enter any additional fields, they appear in this and
subsequent plot data-entry windows to the right of the species code and diameter fields. If you chose
to use both prism and fixed area plots, the second plot will be a fixed-area plot (Fig. 4). In this case,
each odd numbered plot will be a variable-radius prism plot and each even numbered plot will be a
fixed area plot. Each tree record must have a species code and nonzero diameter (inches) before it
will be saved. Recall that zero (0) is a valid (user defined) species code, so be sure that the proper
code is next to each diameter. You can go to the Tree pull-down menu and activate the Edit tree
species menu to see a list of all species in the stand after completing data entry. If you enter no data
in a plot, that plot will be dropped. The next time you enter the plot system to review, edit, or add data,
each plot data-entry window that you actually used (i.e., into which you entered data) will be present.
You can change the area of any fixed-area plots in the same way that the prism is changed for
individual variable-radius plots.
Figure 4.—Data entry screen for a fixed-area plot.
When entering data for any plot, the software will make sure the species codes that have been
entered are valid. This is not done on the individual field level as you enter data. When you exit from a
plot data-entry screen, each field is checked. If an unrecognized species code is found, the interface
will alert you to the particular offending record and provide you with the current species list from which
you will choose a valid species code for that sample. If you press Esc at that point, the software will
return you to the data-entry screen where you can make a series of edits or delete individual-tree
sample records by changing the associated diameters to zero (0).
19
Managing Plot Data
If you return to the plot data-entry system from the Tree Menu after you have entered plot data, you
will find additional choices on the Plot data pop-up menu:
Add more plots
Edit existing plot data
Delete one plot
Replace with new plot data
Cancel
Select this option to Add new plots to the existing plot data
system.
Select this option to enter the existing plot data-entry
screens to review or edit your current data.
This is where you can remove one plot and all the
associated data from your field data entries.
Replace the entire existing plot system with new plot data.
Be certain that you want to delete all existing tree data
before completing this sequence of steps.
Exits back to the menu system. Note that this does not reset
the system to per-acre stand-level tree data entry.
This menu provides you with the ability to review, edit, add to, or delete plots. If you choose the Delete
one plot option, you are prompted with the current plot list. If you gave each plot a name that you can
associate with the field data sheet, you can see that name beside the plot number that the user
interface software has assigned to the plot. This will help you ensure that you are deleting the correct
data. Caution: Once a plot has been deleted, it cannot be retrieved. You will need to Add more plots
and reenter all data.
Figure 5.—Following plot data entry, use the Output pull-down menu and select Plots to access plot
data records in file format and data summaries on a per-acre basis for the stand.
Reviewing Plot Data
Once all plot data are entered and you exit the Plot data-entry system, a notification message
appears that alerts you that these data have been converted to a per-acre summary set of data for the
stand. Remember to save these plot data before exiting the user interface. If you then go to the
Output pull-down menu and select Plots (Fig. 5), you can then View plot data records or Print plot
data records, or View plot summaries or Print plot summaries as they have been saved to disk:
View plot records
Provides a viewing window for plot data. The Arrow, Page-up,
and Page-down keys allow you to navigate through these
data. Press Esc to exit the viewing window.
20
Print plot records
Prints plot data to your local printer. Make sure the printer is
turned on, on line, and using parallel port LPT1. If the printer
cannot be initialized (as is the case for laser printers), a
WARNING message will be displayed. If the printer is not
functioning properly, proceeding with the print job may abort
the program. It is advised that you first save any data that has
not been backed up to disk before doing this for the first time.
View plot summaries
Plot data are summarized on a per-acre basis from all plots for
the stand.
Print plot summaries
Similar to printing plot records, this is limited to local printers on
LPT1.
From View plot records you can review the file copy of the individual plots so that you can review or
verify your entries as they will be saved to disk. Or you can look at several ways in which these data
have been summarized by choosing View plot summaries (Fig. 6). Similarly, Print plot summaries
provides the means to make paper copies of these summary data. Sawlog Volume, Total Volume,
Board-Foot Volume, Basal Area, or Stem Count summaries can be accessed. If you forget to save
these plot data, you will be prompted that they are unsaved as you exit the software. The summary
data are created as temporary files. You can save any of the summary data files by renaming the
temporary files (look for the .plt extension) found in the model directory. There is no way to save
these summary files directly from the user interface.
Figure 6.—The View plot summaries option provides a selection list of the five summary formats.
These summaries are constructed according to the diameter tally system that you are using. If you left
this set to the defaults, it will be 2-inch classes, starting at 0.0 as the lower limit, so the class midpoints
will be 1.0, 3.0, etc. These can be altered using the Stand pull-down menu, selecting the Stand Data
and then changing the lower limit, the diameter class width, or both. If you decide to do this after you
have entered plot data, to recalculate the summary statistics, enter the Plot Data system and cycle
through the data by selecting Edit existing plot data and hitting Esc as each data-entry window pops
up. Once all data have been reviewed, the summary statistics are recalculated automatically using the
revised diameter class limits.
21
Packaged Scenarios for Simulating Defoliation
Background
The Stand-Damage Model now generates a set of designed scenarios for simulation of no, light, and
heavy outbreaks over a 20-year interval. These scenarios allow you to quickly review the range of
possible damage from gypsy moth. The none or no-outbreak scenario provides a baseline for seeing
the effect of a sequence of two light outbreaks and a sequence of two heavy outbreaks. Volume, basal
area, and stem counts are totaled at the end of each simulation and the net effects (differences
between none and the light, and the difference between none and the heavy) are calculated. These
packaged scenarios have been used to evaluate the probable loss from gypsy moth damage in Ohio
(Colbert et al. 1997) and are being used to evaluate potential losses in the Ozark Ouachita Mountains
of southern Missouri, northern Arkansas, and eastern Oklahoma (Gottschalk et al. in press). Using
ecological land classification (Bailey 1995, Guldin in press), tree species distribution maps (Iverson et
al. 1999) and growing degree-days (http://www.fsl.wvu.edu/gypsymth/ddmap.html) for an area, one
can assess the potential for gypsy moth damage. Data are available from USDA Forest Service FIA
units for analyzing large regions of the United States. The Forest Service is developing high-resolution
maps of public lands as ecological land units (100’s to fewer than 10 acres) for project and
management-area planning and analysis2 (McNab and Avers 1994; Bailey 1995, 1997, 1998). These
tools will allow a much broader audience to make similar assessments of potential losses.
Scenario Design
The defoliation scenarios use susceptibility of tree species (three classes) to gypsy moth defoliation
(percent), the pattern of difference between the tallest trees (overstory) and those that are lower in the
stand canopy (understory):
Year/Strata
1 – Overstory
1 – Understory
2 – Overstory
2 – Understory
3 – Overstory
3 – Understory
4 – Overstory
4 – Understory
5 – Overstory
5 – Understory
Year/Strata
1 – overstory
1 – understory
2 – overstory
2 – understory
3 – overstory
3 – understory
4 – overstory
4 – understory
5 – overstory
5 – understory
Susceptible Species
Light Outbreak
Resistant Species
30
40
50
70
0
0
0
0
0
0
Susceptible Species
0
10
15
30
0
0
0
0
0
0
Heavy Outbreak
Resistant Species
40
60
90
100
100
100
50
30
0
0
0
30
25
40
50
70
30
15
0
0
Immune Species
0
0
0
10
0
0
0
0
0
0
Immune Species
0
0
0
10
10
25
0
0
0
0
These percent defoliation values were derived beginning with the scenarios used in the final national
gypsy moth environmental impact statement analysis (Northeast. Area, State and Priv. For. 1995), and
modifying them to account for overstory/understory differences in defoliation of each feeding
2
National hierarchical framework of ecological units, ECOMAP. [http://www.fs.fed.us/gpnf/ei/ maps/
ecomap.htm].
22
preference class and adding the minimal defoliation seen on immune species when the gypsy moth
completely defoliates the overstory susceptible trees and large larvae, searching for feeding sites,
move to nearby trees. See the Appendix (Table 4) to locate gypsy moth feeding preference for a
particular tree species. To use these data and generate the packaged scenario outbreaks through the
user interface, choose the Run scenarios option from the Run pull-down menu.
Figure 7.—The packaged scenarios provide 30 tables, 6 for each variable, including the initial
conditions, the final state at the end of each simulation, and difference between defoliation and nodefoliation scenarios.
Scenario Results
Figure 7 shows the variety of simulation initial condition and result files that can be viewed following
the simulation of the package scenarios. The volume totals that are generated include board-foot
volumes (BFV), sawlog volume, and total volume (sawlog plus pulpwood; the last two are in units of
cubic feet). The 20-year period provides two 10-year sequences: a 5-year defoliation period and a 5year period with no outbreak.
Volume and value calculations. Most of these parameters are set using the defaults from the
simulation program SILVAH (Marquis et al. 1992; Marquis and Ernst 1992). The age of the stand is set
at 65 years. Stand age is used for calculating log heights to the nearest half log. Form class,
computation rule (International ¼-inch), and sawlog, pulpwood, and BFV correction factors are
SILVAH defaults. Species-specific dollar values and a discount rate also are needed to compute Net
Present Value. These computations are not made unless the model is run from the command line with
the sdmtrans.txt file. See the section on Run as Batch Process from Command Line for details.
(Total dollar values will be calculated for the stand and on a per-acre basis.)
23
While the model is simulating each scenario, a message box is presented that displays a title line
showing which of the three simulations is currently running, and a status bar showing what portion of
the simulation is complete. Once the simulations are run, output table data are generated and placed
in ASCII text files. The output are on a per-acre basis. The names of these data files are:
File Name
STEMS.IC
STEMS.NUN
STEMS.LGT
STEMS.HEV
STEMS.DFL
STEMS.DFH
Description
Stem Counts: initial conditions
Stem Counts: no defoliation
Stem Counts: light defoliation
Stem Counts: heavy defoliation
Stem Counts: no defoliation minus light defoliation
Stem Counts: no defoliation minus heavy defoliation
BASAL.IC
BASAL.NUN
BASAL.LGT
BASAL.HEV
BASAL.DFL
BASAL.DFH
Basal Area: initial conditions
Basal Area: no defoliation
Basal Area: light defoliation
Basal Area: heavy defoliation
Basal Area: no defoliation minus light defoliation
Basal Area: no defoliation minus heavy defoliation
BDFT.IC
BDFT.NUN
BDFT.LGT
BDFT.HEV
BDFT.DFL
BDFT.DFH
Board-Foot Volumes: initial conditions
Board-Foot Volumes: no defoliation
Board-Foot Volumes: light defoliation
Board-Foot Volumes: heavy defoliation
Board-Foot Volumes: no defoliation minus light defoliation
Board-Foot Volumes: no defoliation minus heavy defoliation
SAWLOG.IC
SAWLOG.NUN
SAWLOG.LGT
SAWLOG.HEV
SAWLOG.DFL
SAWLOG.DFH
Sawlog Volume: initial conditions (cubic feet)
Sawlog Volume: no defoliation
Sawlog Volume: light defoliation
Sawlog Volume: heavy defoliation
Sawlog Volume: no defoliation minus light defoliation
Sawlog Volume: no defoliation minus heavy defoliation
TOTVOL.IC
TOTVOL.NUN
TOTVOL.LGT
TOTVOL.HEV
TOTVOL.DFL
TOTVOL.DFH
Total Volume (Sawlog + Pulpwood): initial conditions (cubic feet)
Total Volume (Sawlog + Pulpwood): no defoliation
Total Volume (Sawlog + Pulpwood): light defoliation
Total Volume (Sawlog + Pulpwood): heavy defoliation
Total Volume (Sawlog + Pulpwood): no defol. minus light defol.
Total Volume (Sawlog + Pulpwood): no defol. minus heavy defol.
And graph output from each simulation is available:
File Name
STEMNUN.GRA
STEMLGT.GRA
STEMHEV.GRA
Description
Stem Count graph file for no defoliation
Stem Count graph file for light defoliation
Stem Count graph file for heavy defoliation
BASALNUN.GRA
BASALLGT.GRA
BASALHEV.GRA
Basal Area graph file for no defoliation
Basal Area graph file for light defoliation
Basal Area graph file for heavy defoliation
VOLNUN.GRA
VOLLGT.GRA
VOLHEV.GRA
Volume graph file for no defoliation
Volume graph file for light defoliation
Volume graph file for heavy defoliation
24
Figure 8.—Following simulations, graphs you chose to generate are available for viewing; for
packaged scenarios, the final simulation (heavy defoliation) graphs are available.
Choose Graph from the Output pull-down menu (Fig. 8). Selecting Current Simulation Graphics
provides a selection list of the three graphs from the heavy (most severe) simulation — the last one
run. These graphs are immediately available to you from the Current Simulations selection list after
running the package from the user interface. Note that you will have to select Graphics from
Previous Session to view the graphs for the light (Fig. 9) and no defoliation scenarios and use the file
names provided here. File names are not case sensitive but you will need to enter the full name,
including the file extension ( “.GRA”). Figure 10 shows the result of running data from the
example.inp file through the packaged scenarios.
25
Figure 9.—To access a graph from the no-defoliation or light-defoliation scenario, choose the
Graph from Previous Session option and enter a name from the list.
Figure 10.—Graphs can be viewed following simulations, one line for each species; there are
nine graphs available following simulations of the packaged scenarios; here stem counts are
shown for each species following light defoliation.
26
Command-Line Switches
The Stand-Damage Model can be run directly from a DOS window using the command line. It can be
run in different modes depending on what command-line parameters are set when executing the
model. The model is run from the DOS prompt as:
C:\DAMAGE>damage
In other words, damage is typed in at the prompt, followed by the Enter key. This brings up the StandDamage interface. However, by typing in a space and an extra letter, one can access other special
features.
Packaged Scenario Mode
In order to “enable” the generation of packaged scenarios by the Stand-Damage Model, the user must
pass an “S” to the model as a command line switch. To generate packaged scenarios output files from
the model, type:
C:\DAMAGE> sdm
s
The “s” stands for Stand-alone (no user interface). This will generate basal area, volumes, and stem
count by species, as well as totals for each outbreak scenario: heavy, light, and no defoliation.
Otherwise, the normal user interface is activated when the model software is executed.
You can produce your own sdmtrans.txt file and run these scenarios from DOS if you are
interested in automating the process for a large set of input files. Currently, the transfer file,
sdmtrans.txt, contains the following information in the first line:
1
where:
1985
2
1
183.92 1.0
2.0
5.00
8
means that data are being passed in this file (use them to replace
the defaults);
initial inventory year, year “0” for simulations;
site (site moisture regime; 1 = dry, 2 = moderate, 3 = wet);
stand area (will be used only for the total dollar valuation);
DLENBASE_min (minimum [left edge] of first diameter class);
DLENBASE (diameter class width for incoming tree list);
discount rate used to estimate present value of future stand;
number of tree species that follow in this file.
1985
2
183.92
1.0
2.0
5.00
8
Note that the maximum number of species that may be simulated in a stand is 20 and the first 20
species you provide will be used. The most dominant or most important to your particular analysis
should be the first 20 species. You can group “other” species as a single species entry to provide an
adequate estimate of the full stocking or stand density. If you find a stand with more than 20 species
and want to maintain them all in the sdmtrans.txt file, the model will read the first 20 and ignore the
trailing data.
The second line of the file contains the output table column or class boundaries, with defaults:
0
6
12
18
24
The output is displayed in columns defined by class boundaries: current boundaries produce the
following classes: 0-6 inches, 6-12 inches, 12-18 inches, 18-24 inches, > 24 inches, (0, 6, 12, 18, 24).
These class boundaries are passed from the interface to the simulator, allowing the user to modify the
output table column definitions. Data generated during the simulations are passed as plain ASCII text
files with a title line at the top and a totals line at the bottom. Totals for rows are given in the last
(rightmost) column of numbers, followed by a trailing list of the species codes. The species order is the
same as that passed from the user interface, or from the sdmtrans.txt file. Marginal column totals are
placed at the bottom of each column. A grand total is provided as the lower right hand entry of the file.
If the user redefines the columns, the model will accept fewer than five distinct columns. For example,
if the user resets the values to 0, 0, 10, 20, 20, the model will return data for each of the ranges: 0-10
inches, 10-20 inches, and > 20 inches, The resulting data files will contain four columns (three range
27
totals, and a row total at the end) and a title line, one line (row) for each species, and the total line at
the bottom.
The remainder of the file depends on the number of species (last item on the first line) and number of
non-zero diameter classes within species. A two-line block is passed for each species. Each species is
designated by the 3-digit FIA species code and followed by the stumpage price for that species ($100/
Mbf is used in the default sdmtrans.txt file) and the number of diameter-class counts being
passed; the following line contains counts for each diameter class on a tree/acre basis.
For each species, the format of the next line is:
837
Where
150.0
837
150.0
16
16
species code;
stump price;
number of input classes.
and the next line would then have 16 entries, the last one being the largest non-zero count:
0.0 0.0 0.0 0.0 0.0 0.0 8.5 0.0 0.0 1.9 0.0 0.0 0.0 0.0 0.8 0.7
In this example, since we have the lowest class starting at 0.0 and each class is 2.0 inches wide, one
can see that the 13-inch class (12-14 inches) has 8.5 trees per acre while the 31-inch class has 0.7
trees per acre.
Specific-Year Mode
To run the model to a specific year, you need to use two parameters on the command line, for example:
C:\DAMAGE> sdm f 2020
The first parameter f, informs the software that you want to run forward to the year 2020 (the second
parameter). This option is most often used to bring a collection of stands that were sampled over a
period of several years to a common starting point for analysis. For example, if a watershed may be
defoliated in the near future and one is concerned of the impacts of that happening but the watershed
comprises many individual stands that were sampled over the past decade, the data for each stand
could be grown forward to some common year (2020) so that analysis of future defoliation impacts
could be assessed on each stand.
Details Mode
Use the details switch to obtain additional information on how the model generates the final results. To
obtain details on intermediate calculations and to maintain on disk all files that usually are temporary
as well as some that otherwise are not seen by the user (those deleted by the program upon exit),
type the following:
C:\DAMAGE> sdm d
The d switch tells the model to run in Details Mode.
Monochrome Mode
To run the model on monochrome monitors, type:
C:\DAMAGE> sdm m
This switches all menu displays into a mode that allows the various color differences (used in normal
color mode) to be mapped into gray shades for a monochrome (“back and white”) monitor.
Fast Start
To go directly to the model interface and skip the logo login screen, type:
28
C:\DAMAGE> sdm
that is, type sdm and press Enter to bypass the logo; this can be used from a Windows shortcut.
Plot System Tutorial
Why Use the Plot System
This tutorial describes in detail how to use the plot data-entry system, which allows direct data entry
from field tally sheets and eliminates the need for conversions by the user. This automatically converts
data to a stand table format, i.e., one that contains tree counts per acre by species and diameter class.
This table can be used immediately as the initial stand conditions for a simulation. These data also are
summarized in basal area/acre and three stand volume-per-acre formats. Whole-tree, log, and boardfoot volume tables are provided.
Entering Plot Data
Data collected from fixed-area plots, variable-radius (prism) plots, or from any combination of these
can be entered in to the program for summarization and projections. Fixed-area plots can be of any
size; any of six basal-area factors can be used on a prism plot. In the following examples, one plot
area was used for each fixed-area plot and all variable-radius plots were cruised with a 10-factor prism
(10 ft2 of basal area for each in-tree). To learn more about variable-radius point sampling, see
“Simplified Point-Sample Cruising” (Northeast. Area, State and Priv. For.).
In the following sections we will use data sets that are located in the Appendix. Data sheets labeled
Central Pennsylvania Risk Rating Plots Study 15 will be used as example data for the fixed-area plot
entry, and Stand 96-14 from the Dorr Run Gypsy Moth Survey will be used for the variable-radius plot
entry.
Sample Fixed-Plot Data
The Central Pennsylvania Risk Rating study was established in 1978. This stand was located in Mifflin
County. The data consist of information collected on all trees more than 1 inch in diameter at breast
height (4.5 feet). Three 1/10-acre circular plots were established at the corners of an equilateral
triangle, 300 feet on a side. Stands were located throughout central Pennsylvania to measure the
effects of gypsy moth defoliation. The following are lines of the data collected from one plot:
These data also are in an Excel ™ file, stand123.xls, in the directory where the software was installed.
That file includes both a copy of the data in the Appendix and a complete set of data for these plots. If
you examine that file you will find individual-tree defoliation data for 1978-92. You can use these data
to compile a test and compare simulation output to growth and mortality resulting from the defoliation
data stored there.
The Species column on the data sheet lists tree species by 3-digit FIA codes. A look-up table listing
these codes is found in Table 3 of the Appendix. From the table, one can see that the following species
are present in this plot:
29
Code
316
315
833
832
Common
red Maple
striped Maple
northern Red Oak
chestnut Oak
Scientific name
Acer rubrum
Acer pensylvanicum
Quercus rubra
Quercus prinus
The column DBH78 refers to the diameter of each tree at breast height (4.5 feet above ground on the
uphill side of the tree). The Vigor78 column refers to the health of the tree’s crown; Vigor78 will be
referred to as crown condition in the Stand-Damage Model. This study used the 3-class system to rate
crown condition.
Code
1
2
3
Definition
good: healthy foliage, less than 25% dead branches, little or no epicormic
sprouting
Fair: 25- 49% of branches dead, epicormic sprouting is evident.
Poor: 50% or more dead branches, foliage density, size and coloration is
subnormal, epicormic sprouting is heavy.
The final column in the display, CClass78, refers to the Crown Class of the tree in the forest canopy.
Five codes were used for rating:
Code
1
2
3
4
5
Definition
open grown: full sunlight to all sides
dominant: above general canopy, full sun from above and partly from the sides
codominant: forms general canopy, full sun from above but comparatively little from
sides
intermediate: shorter than codominant/ dominant but crown extends into those
above
suppressed: crown entirely below canopy, no direct sunlight from above or side
Sample Variable-Radius or Prism-Plot Data
The Dorr Run Gypsy Moth Survey sample data sheets consist of fifteen 10-factor prism plots
distributed throughout Stand 14, Compartment 96, Athens District, on the Wayne National Forest. Data
were collected in April 1999. These inventory data collected were used with the Stand Damage Model
to simulate the growth of this stand. The following stand map shows the distribution of plots sampled in
this and six other stands. Plots usually are located along a series of transects or line segments that
traverse the plot and are reasonably equally spaced
30
The protocol established for data collection on each
prism plot entailed identifying the tree species, and
measuring DBH, crown condition (vigor), and crown
class for each overstory tree. As in the Pennsylvania
Risk Rating data set, the FIA species codes and five
crown class codes were used. Here the 3-class
system for crown condition was replaced with a 5class system. Since the software has options only for
3- or 7-class data, we choose the latter to
accommodate the data, noting the differences
between the 5-class definitions that follow and those
given in the on-line help and on page 23 of this report.
These are essentially the same except that the 7class system refines the dead-tree information.
5-Class System (Crown Condition)
Code
1
2
3
4
5
Definition
Healthy crown: 0-10% dead branches
Fair to good crown: 11-25% dead branches
Fair to poor crown: 26-50% dead branches; some branches sprouting
Very poor crown: 51-80% dead branches; heavy sprouting
Apparently dying: 81-100% dead branches; subsisting on epicormics
Fixed-Area Plot Data Entry
The following steps will guide you into the plot system (steps 1-3), through set up (4), data entry (5-6),
saving your work (7), and viewing the results of your work in file format (8) as it was saved to disk, or
in summary form (9) on a per-acre basis. Steps 10-13 demonstrate how to make additions, deletions,
and edits to existing plot data. Step 14 leads you through printing your data as well as comparing your
work to the fixed-plot example data file that should match yours exactly.
1) Locate field data sheets labeled Central Pennsylvania Risk Rating Plots Study 15 in the Appendix
(page 62). There are three plots; data for each is on a
separate page that is a copy of the field data sheet and is
included as one of the installed files,
PLOT-123.XLS
that can be found where you installed the software.
2) Click on Trees located on main menu bar. Next, click on
Plot data on the drop menu. A warning will appear.
31
3) If you have data that
previously were entered but
not saved, this is your chance
to stop and save those data.
Click on No on the warning.
Click on File on the main
menu bar to access the Save
option. See step 7 for details on saving data to disk. Once you
have saved your data return to step 2. If there are no data to
save, click on yes. Then click on Add new plot data to gain
access to Plot Parameters.
4) The previous description of the Risk Rating Study tells us that the Plot Type is Fixed and that each
plot is 1/10 acre, so we set the Default Fixed Area to 0.1. Because we are using only fixed- area
plots in this example, we ignore the Default Prism. Using the Arrow keys or the mouse, navigate
to each field to enter the parameters. Navigation on the Plot Parameters screen should be done
with the mouse or arrow keys; the Enter key may inadvertently exit this screen. There are three
plots in this sample so set Total Number of Plots to 3. By counting the trees on each plot the
Maximum number of trees in any one plot is 42. Crown Condition is labeled as VIGOR78 on
the data sheet and the 3-Class system was used; clicking on the data-entry field to the right of the
Crown Condition label exposes the three choices for this field. Crown Class data were collected so
check that field (this can be done with the mouse). Press Enter to advance to the next screen only
when all fields are complete. Your screen should look like this when you are finished.
5) Once parameters are set and the Plot Parameter screen is exited, the first data-entry screen will
appear. Navigation to each field can be accomplished using the mouse or pressing Enter. The first
seven lines of tree data entry have been completed in the display below. When plot data-entry
screens appear, the cursor is placed in the Species field for the first line of tree data. If you want to
label the plot or change the plot area from the default, use the up-arrow key to navigate to the field
you wish to access. When finished entering plot 1 data, press Esc or click the mouse outside the
window to exit and move to the next plot.
6) Repeat tree data entry (step 5)
for plots 2 and 3.
32
7) To save your work,
Click on File on main
menu bar followed by
Save. Enter file name
myfixed in the Disk
File Name field. When
completed, press
Enter to save file. The
software adds the
.inp automatically.
8) After the file is saved, the data can be
reviewed. Click on Output on the main
menu bar. Then click on Plots on the
drop-down menu to gain access to four
options under Plot Data Choices. Click
on View plot records to review the data
entered.
Note that the scroll bar along the
right edge or bottom of this and
other windows can be manipulated
with the mouse. As you scroll down
through this file you will see these
data in the format as they are
stored on disk.
33
9) Access View plot summaries from the same
drop-down menu (step 8). This will give you
four options to view the data as species by
diameter tables. Here is an example of Stem
Count per acre calculated from the data you
entered.
10) If a mistake is found after reviewing
data, click on Plot on the main menu
bar to access the Plot Choices pop-up
menu. You now can add, edit, delete,
and replace trees or plots.
11) Add more plots returns you to the Plot Parameters screen and new plots can be added in the
same manner as the original data. Type in the number of new plots; they will be added to the
originals, and the new data can be entered. Shown here is the addition of one plot. Since data for
three plots were entered earlier, the new plot is automatically given the label “Plot Number 4” at the
top of the data-entry screen.
34
12) Edit existing plot data returns to the Plot
Data screens (steps 4-5) where edits can be
made. Remember to save (step 7) any
changes that you make.
13) Delete one plot displays a new window and allows you to delete a particular plot. Plots are
numbered consecutively as the data are entered; if you choose to use the Plot description labels
(“Plot 1” was entered for the first plot), they appear beside the list of index numbers.
14) When all steps are completed,
return to Output/Plots Plot Data
Choices (Step 8). Click on Print
plot records to print a copy of
data you have entered. Next load
the file PLOT-123.INP;
this is the same data set and can
be used for comparison. Click on
File on the main menu bar
followed by Pick. Four files will
appear in the next window; three
files are pre-loaded example files
and the third will be the file
MYFIXED.INP that you saved in step 7.
Choose PLOT-123.INP and return to the
Output-Plots to print. To check your work,
compare the two files using the
Compare.exe program found in the
directory in which you installed the
program software. Execute the program
at the DOS prompt or by double-clicking on the program from Windows
Explorer. They should match exactly. The Compare.exe program will prompt you for the file names
and provide a description of the output it provides. If it finds any differences, it will provide the line
numbers for these.
35
Variable-Radius Plot Data Entry
As was done for fixed-area plots, the following steps will guide you into the plot system (steps 1-3),
through set up (4), data entry (5-6), saving your work (7), and viewing the results of your work in file
format (8) as it was saved to disk, or in summary form (9) on a per-acre basis. Steps 10-13
demonstrate how to make additions, deletions, and edits to existing plot data. Step 14 leads you
through printing your data as well as comparing your work to the variable-radius plot example data file
that should match yours exactly.
1) Locate field data sheets labeled Dorr Run Gypsy
Moth Survey in the Appendix (pages 65-78).
2) Click on Trees located on main menu bar. Next,
click on Plot data on the drop-down menu. A
warning will appear.
3) If you have data that previously were entered but not saved, this is your chance to stop and save
that data. Click on No on the warning. Click on File on the main menu bar to access the Save
option. See step 7 for details on saving data to disk. Once
you have saved your data, return to step 2. If there are no
data to save click on Yes. The Plot Choices window
appears, click on Add new plot data to gain access to
Plot Parameters.
4) Navigating on the Plot
Parameters screen is done
using the arrow keys or
the mouse; the Enter key
is used only to advance to
the next screen. Set the
Plot Type to Prism. The
cruise data were obtained
using a 10-factor prism
(the default) and consists
of 15 plots; set the Total
Number of Plots to 15.
The Maximum number of
trees in any one plot was
18, and can be found by
counting the trees on each
data sheet. As mentioned
previously, the Crown
Condition classification
used in the tally was a 5-class system, but the 7-Class system is chosen on this screen because
the 5 class shares the first five definitions of the 7-class system. Data on the crown class were
collected with the variable-radius cruise, so use the space bar to check (toggle on) the Crown
Class option. This completes the setting of plot parameters. Press Enter or Esc to bring up the first
plot screen for data entry.
36
5) Once parameters are set, the data-entry screen will appear. Navigation to each field can be
accomplished using the mouse or pressing Enter. Because two optional data fields were selected,
there are four columns for data entry. Tree Species code and DBH are always present. The first
seven lines of entry are demonstrated in the following display. The software will ignore lines that do
not have a valid species and non-zero diameter entered. Because this example consists of 15 plots
that were numbered in the field 1-7, and 9-16 (plot 8 was dropped), using the Plot Description field
to provide the field label is advised. As new Plot data screens appear, the cursor is initially placed in
the first Species field. Use the mouse or the up-arrow key to access the Plot Description field.
When finished entering plot 1 data, press Esc to move to the next plot.
6) Repeat data entry (step 5) for plots 2-7, 9-16. Press Esc or click outside the window to move to the
next plot data screen.
7) Save File
Click on File on main menu bar followed by Save
Enter file name myfile in the Disk File Name field. The software will add the .inp file
extension for you.
Press Enter to save to the file and exit the screen.
37
8) After the file is saved, the data can be
reviewed. Click on Output on the main
menu bar. Then click on Plots on the drop
down menu to gain access to four options
under Plot Data Choices. Click on View
plot records to review the data entered.
Your data should appear as in the following
display. You can scroll through the data
using the scroll bar on the right edge of the
window.
9) Access View plot summaries from
the same drop-down menu as in
step 8. This will give you four
options to view the data organized
by species and diameter. Following
is a display of Stem Count
calculated from these data. All
tables are on a per-acre basis.
38
10) If a mistake is found after reviewing
data, click on Plot data on the pulldown menu under Trees on the main
menu bar to access the Plot Choices
selection list. The first time you made
this choice, the only options were to
Add new plot data or Cancel. This list is
now expanded, allowing you to add,
edit, delete, and replace all plots.
11) Add more plots returns to the Plot Parameters screen and any number of new plots can be
added in the same manner as the original data. At this point it is possible to add fixed-area plots,
more Prism plots, or both to your data. Type in the number of new plots; they will be added to the
originals and the new data can be entered.
39
12) Edit existing plot data also returns you to the Plot
Parameter screen (step 4). After making corrections
to the design parameters, press Enter to access the
actual tree data-entry screens (step 5).
13) Delete one plot displays a
new window and allow you
to delete a particular plot by
selecting the index number
(note that in this case it
differs by one from the plot
number for plots 9-16).
14) When all steps are
completed, return to Output/
Plots Plot Data Choices
(step 8). Click on Print plot
records to print a copy of
data you have entered. Next
load the file W-A-9614.INP;
this is the same data set and
can be used for comparison.
Click on File on the main
menu bar followed by Pick.
Four files will appear in the next window; three files are pre-loaded example files and the fourth will
be myfile.inp that you created in step 7.
Choose W-A-9614.INP and print. Compare the two printouts as a check. To check your work
electronically, compare the two files using the Compare.exe program found in the directory in which
you installed the program software. Execute the program at the DOS prompt or by double-clicking
on the program from Windows Explorer. They should match exactly. The Compare.exe program will
prompt you for the file names and provide a description of the output it provides. If it finds any
differences, it will provide the line numbers for these.
Congratulations! You have completed the Plot System Tutorial.
40
Acknowledgments
We would like to thank John Juracko for his careful use of the model and for pointing out
inconsistencies in the code. Juracko also assisted on the Plot System Tutorial. We also
thank David Breakey for his suggestions regarding the use of DOS mode when problems
arise, and thank Dan Yaussy, Arlyn Perkey and Dan Twardus, USDA Forest Service, and
Dean Coble, Stephen F. Austin University, for their thoughtful reviews of this publication.
Finally, we thank the users of the first version and beta releases of Version 2 for their
feedback and assistance in making the Stand-Damage Model a more useful product.
Literature Cited
U.S. Department of Agriculture, Forest Service,
Northeastern Forest Experiment Station. 111 p.
Bailey, R.G. 1995. Description of the ecoregions of the
United States. 2nd ed. Misc. Publ. No. 1391 [rev.].
Washington, DC: U.S. Department of Agriculture, Forest
Service. 108 p.
Collingwood, G.H.; Brush, Warren D. 1978. Knowing your
trees. Washington, DC: American Forestry Association.
389 p.
Bailey, Robert G. 1998. Ecoregions map of North America:
explanatory note. Misc. Publ. 1548 Washington DC: U.S.
Department of Agriculture, Forest Service. 10 p.
Duncan, Wilbur H.; Duncan, Marion B. 1988. Trees of the
Southeastern United States. Athens, GA: University of
Georgia Press. 322 p.
Bailey, Robert G. 1997. Ecoregions map of North America.
Washington DC: U.S. Department of Agriculture, Forest
Service.
Gottschalk, Kurt W.; MacFarlane, W. Russ. 1993.
Photographic guide to crown condition of oaks: use
for gypsy moth silvicultural treatments. Gen. Tech.
Rep. NE-168. Radnor, PA: U.S. Department of Agriculture,
Forest Service, Northeastern Forest Experiment Station.
8 p.
Botkin, Daniel B. 1993. Forest dynamics: an ecological
model. New York: Oxford University Press. 309 p.
Burns, Russell M.; Honkala, Barbara H., tech. coords. 1990.
Silvics of North America: 1. Conifers. Agric. Handb. 654.
Washington DC: U.S. Department of Agriculture. 675 p.
Gottschalk, Kurt W. [in press]. Predicting potential damage
from gypsy moth outbreaks in the Ozark-Ouachita
Highlands. In: Proceedings of the symposium on
ecosystem management research in the Ouachita and
Ozark Mountains: Asheville, NC: U.S. Department of
Agriculture, Forest Service, Southern Research Station.
Burns, Russell M. ; Honkala, Barbara H., tech. coords. 1990.
Silvics of North America: 2. Hardwoods. Agric. Handb.
654. Washington DC: U.S. Department of Agriculture. 877 p.
Guldin, James M.; Thompson, Frank R.; Richards, Lynda L.;
Harper, Kyra C. [in press]. Chapter 3: Status and trends
in vegetation. In: Ozark-Ouachita Highlands Assessment:
terrestrial vegetation and wildlife. Asheville, NC: U.S.
Department of Agriculture, Forest Service, Southern
Research Station.
Colbert, J.J.; Perry, Phil; Onken, Bradley. 1997. Preparing for
the gypsy moth — design and analysis of stand
management: Dorr Run, Wayne National Forest. In:
Communicating the role of silviculture in managing the
national forests: proceedings of the national silviculture
workshop; 1997 May 19-22; Warren, PA. Gen. Tech. Rep.
NE-238. Radnor, PA: U.S. Department of Agriculture,
Forest Service, Northeastern Forest Experiment Station:
76-84.
Harlow, William M.; Harrar, Ellwood S.; White, Fred M. 1979.
Textbook of dendrology: Covering the important forest
trees of the United States and Canada. 6th ed. New
York: McGraw-Hill. 510 p.
Colbert, J.J.; Racin, George. 1995. User’s guide to the
Stand-Damage Model: a component of the Gypsy Moth
Life System Model (Version 1.1). Gen. Tech. Rep.
NE-207. Radnor, PA: U.S. Department of Agriculture,
Forest Service, Northeastern Forest Experiment Station.
38 p. [1 computer disk (3-1/2 inches,); User’s manual.]
Iverson, Louis R.; Prasad, Anantha M.; Hale, Betsy J.;
Kennedy Sutherland, Elaine. 1999. Atlas of current and
potential future distributions of common trees of the
Eastern United States. Gen. Tech. Rep. NE-265. Radnor,
PA: U.S. Department of Agriculture, Forest Service,
Northeastern Research Station. 245 p.
Colbert, J.J.; Sheehan, Katharine A. 1995. Description of the
Stand-Damage Model: part of the Gypsy Moth Life
System Model. Gen. Tech. Rep. NE-208. Radnor, PA:
Liebhold, Andrew M.; Gottschalk, Kurt W.; Muzkia,
Rose-Marie; Montgomery, Michael E.; Young, Regis;
41
O’Day, Kathleen; Kelley, Brooks. 1995. Suitability of
North American tree species to gypsy moth: a
summary of field and laboratory tests. Gen. Tech. Rep.
NE-211. Radnor, PA: U.S. Department of Agriculture,
Forest Service, Northeastern Research Station. 34 p.
Northeastern Area, State and Private Forestry. 1995. Gypsy
moth management in the United States: a cooperative
approach: Final environmental impact statement,
November 1995. Vol. I-V. Radnor, PA: Department of
Agriculture, Forest Service, Northeastern Area, State and
Private Forestry.
Little, Elbert L., Jr. 1979. Checklist of United States trees
(native and naturalized). Agric. Handb. 541. Washington
DC: U.S. Department of Agriculture. 375p.
Racin, George; Colbert, J. J. 1995. Guide to the
Stand-Damage Model interface management system.
Gen. Tech. Rep. NE-209. Radnor, PA: U.S. Department of
Agriculture, Forest Service, Northeastern Research
Station. 149 p.
Marquis, David A.; Ernst, Richard L. 1992. User’s guide to
SILVAH: stand analysis, prescription, and management
simulator program for hardwood stands of the
Alleghenies. Gen. Tech. Rep. NE-162. Radnor, PA: U.S.
Department of Agriculture, Forest Service, Northeastern
Forest Experiment Station. 124 p.
Regniere, Jacques; Bolstad, Paul. 1994. Statistical
simulation of daily air temperature patterns in eastern
North America to forecast seasonal events in insect
pest management. Environmental Entomology. 23(6):
1368-1380.
Marquis, David A.; Ernst, Richard L; Stout, Susan L. 1992.
Prescribing silvicultural treatments in hardwood
stands of the Alleghenies (revised). Gen. Tech. Rep.
NE-96. Radnor, PA: U.S. Department of Agriculture, Forest
Service, Northeastern Research Station. 101 p.
Regniere, Jacques; Lavigne, Daniel; Dickison, Robert;
Staples, Andrew. 1995. Performance analysis of
BioSIM, a seasonal pest management planning tool,
in New Brunswick in 1992 and 1993. CFS-Quebec Inf.
Rep. LAU-X-115. Quebec, PQ: Natural Resources
Canada. 28 p.
McNab, W. Henry; Avers, Peter E., comps. 1994. Ecological
subregions of the United States: section descriptions.
Admin. Publ. WO-WSA-5. Washington, DC: U.S.
Department of Agriculture, Forest Service. 267 p.
Shugart, Herman H. 1984. A theory of forest dynamics, the
ecological implications of forest succession models.
New York: Springer-Verlag. 278 p.
Miller, Howard; Lamb, Samuel. 1985. Oaks of North America.
Happy Camp, CA: Naturegraph Publishers. 327 p.
U.S. Department of Agriculture, Forest Service. 1991.
Important forest trees of the Eastern United States.
FS-466. Washington, DC: U.S. Department of Agriculture,
Forest Service. 111 p.
Northeastern Area, State and Private Forestry. 1991.
Simplified point-sample cruising. NA-UP-01-91.
Newtown Square, PA: U.S. Department of Agriculture,
Forest Service, Northeastern Area, State and Private
Forestry.
42
Appendix
Table 3.—Forest Service FIA species codes (species currently included in the
model are followed by asterisk), common names and scientific names
Survey
code
10
11
12*
15
16
17
18
19
20
21
22
40
40
41
42
43
50
51
59
60
62
63
64
65
66
67
68*
69
70
71*
72
73
74
81
90
91
92
93
94*
95*
96
97*
98
101
102
103
104
105*
106
107
108
109
110*
Common name
Scientific name
fir sp.
Pacific silver fir
balsam fir
white fir
Fraser fir
grand fir
corkbark fir
subalpine fir
California red fir
Shasta red fir
noble fir
white-cedar sp.
white-cedar sp.
Port Orford white-cedar
Alaska cedar
Atlantic white-cedar
cypress sp.
Arizona cypress
redberry juniper
juniper sp.
California juniper
alligator juniper
western juniper
Utah juniper
Rocky Mt. Juniper
southern redcedar
eastern redcedar
oneseed juniper
European larch
tamarack
subalpine larch
western larch
Japanese larch
incense cedar
spruce
Norway spruce
Brewer spruce
Engelmann spruce
white spruce
black spruce
blue spruce
red spruce
Sitka spruce
whitebark pine
bristlecone pine
knobcone pine
foxtail pine
jack pine
pinyon
sand pine
lodgepole pine
Coulter pine
shortleaf pine
Abies sp.
Abies amabilis
Abies balsamea
Abies concolor
Abies fraseri
Abies grandis
Abies lasiocarpa v. ari.
Abies lasiocarpa v. las.
Abies magnifica
Abies magnifica v. sha.
Abies procera
Chamaecyparis sp.
hamaecyparis sp.
Chamaecyparis lawsoniana
Chamaecyparis nootkatensis
Chamaecyparis thyoides
Cupressus sp.
Cupressus arizonica
Juniperus erythrocarpa
Juniperus sp.
Juniperus californica
Juniperus deppeana
Juniperus occidentalis
Juniperus osteosperma
Juniperus scopulorum
Juniperus silicicola
Juniperus virginiana
Juniperus monosperma
Larix decidua
Larix laricina
Larix lyallii
Larix occidentalis
Larix leptoleptis
Calocedrus decurrens
Picea sp.
Picea abies
Picea breweriana
Picea engelmannii
Picea glauca
Picea mariana
Picea pungens
Picea rubens
Picea sitchensis
Pinus albicaulis
Pinus aristata
Pinus attenuata
Pinus balfouriana
Pinus banksiana
Pinus edulis
Pinus clausa
Pinus contorta
Pinus coulteri
Pinus echinata
Continued
43
Table 3 continued
Survey
code
111
112
113
114
115
116
117
118
119
120
121*
122
123
124*
125*
126*
127
128
129*
130
131*
132
133
133
134
200
201
202
211
212
221
222
231
241*
242
251
260
261*
262
263
264
300
310
311
312
313
314
315
316*
317*
318*
319*
321
322
330
331
Common name
Scientific name
slash pine
Apache pine
limber pine
Mexican white pine
spruce pine
Jeffrey pine
sugar pine
Chihuahua pine
western white pine
bishop pine
longleaf pine
ponderosa pine
Table Mountain pine
Monterey pine
red pine
pitch pine
Digger pine
pond pine
eastern white pine
Scots pine
loblolly pine
Virginia pine
Austrian pine
singleleaf pinyon
border pinyon
Douglas-fir sp.
bigcone Douglas-fir
Douglas-fir
coast redwood
giant sequoia
baldcypress
pondcypress
Pacific yew
northern white-cedar
western redcedar
California torreya
hemlock sp.
eastern hemlock
Carolina hemlock
western hemlock
mountain hemlock
acacia
maple sp.
Florida maple
bigleaf maple
boxelder
black maple
striped maple
red maple
silver maple
sugar maple
mountain maple
Rocky Mountain maple
bigtooth maple
buckeye sp.
Ohio buckeye
Pinus elliottii
Pinus engelmannii
Pinus flexilis
Pinus flexilis v. ref.
Pinus glabra
Pinus jeffreyi
Pinus lambertiana
Pinus lambertiana v. Chi.
Pinus monticola
Pinus muricata
Pinus palustris
Pinus ponderosa
Pinus pungens
Pinus radiata
Pinus resinosa
Pinus rigida
Pinus sabiniana
Pinus serotina
Pinus strobus
Pinus sylvestris
Pinus taeda
Pinus virginiana
Pinus nigra
Pinus monophylla
Pinus discolor
Pseudotsuga sp.
Pseudotsuga macrocarpa
Pseudotsuga menziesii
Sequoia sempervirens
Sequoiadendron giganteum
Taxodium distichum
Taxodium distichum v. nut.
Taxus brevifolia
Thuja occidentalis
Thuja plicata
Torreya californica
Tsuga sp.
Tsuga canadensis
Tsuga caroliniana
Tsuga heterophylla
Tsuga mertensiana
Acacia sp.
Acer sp.
Acer barbatum
Acer macrophyllum
Acer negundo
Acer nigrum
Acer pensylvanicum
Acer rubrum
Acer saccharinum
Acer saccharum
Acer spicatum
Acer glabrum
Acer grandidentatum
Aesculus sp.
Aesculus glabra
Continued
44
Table 3 continued
Survey
code
332
333
340
341
350
351
352
353*
354
355
360
361
367
370
371*
372*
373*
375*
376
379*
381
391*
400*
401
402
403
404
405
407
408
409
421*
422
423
430
431
450
451
452
460
461
462
471
475
476
477
479
481
491*
492
500
510
521
531*
540
541*
Common name
Scientific name
yellow buckeye
buckeye (except 331; 332)
ailanthus sp.
tree-of-heaven
alder sp.
red alder
white alder
speckled alder
European alder
serviceberry
madrone sp.
Pacific madrone
pawpaw
birch sp.
yellow birch
sweet (black) birch
river (red) birch
paper birch
western paper birch
grey birch
chittamwood
American hornbeam
hickory
water hickory
bitternut hickory
pignut hickory
pecan
shellbark hickory
shagbark hickory
black hickory
mockernut hickory
American chestnut
Allegheny chinkapin
Ozark chinkapin
chinkapin sp.
giant chinkapin
hardy catalpa
southern catalpa
northern catalpa
hackberry sp.
sugarberry
northern hackberry
eastern redbud
curlleaf cercocarpus
alderleaf cercocarpus
hairy cercocarpus
little leaf cercocarpus
yellowwood
flowering dogwood
Pacific dogwood
hawthorn
eucalyptus
common persimmon
American beech
ash sp.
white ash
Aesculus octandra
Aesculus sp.
Ailanthus sp.
Ailanthus altissima
Alnus sp.
Alnus rubra
Alnus rhombifolia
Alnus rugosa
Alnus glutinosa
Amelanchier sp.
Arbutus sp.
Arbutus menziessii
Asimina triloba
Betula sp.
Betula alleghaniensis
Betula lenta
Betula nigra
Betula papyrifera
Betula papyrifera v. sub.
Betula populifolia
Bumelia lanuginosa
Carpinus caroliniana
Carya sp.
Carya aquatica
Carya cordiformis
Carya glabra
Carya illinoensis
Carya laciniosa
Carya ovata
Carya texana
Carya tomentosa
Castanea dentata
Castanea pumila
Castanea ozarkensis
Castanopsis sp.
Castanopsis chrysophylla
Catalpa sp.
Catalpa bignonioides
Catalpa speciosa
Celtis sp.
Celtis laevigata
Celtis occidentalis
Cercis canadensis
Cercocarpus ledifolius
Cercocarpus montanus
Cercocarpus breviflorus
Cercocarpus intricatus
Cladrastis lutea
Cornus florida
Cornus nuttallii
Crataegus sp.
Eucalyptus sp.
Diospyros virginiana
Fagus grandifolia
Fraxinus sp.
Fraxinus americana
Continued
45
Table 3 continued
Survey
code
542
543*
544*
545*
546
551
552
555
571
580
591
600
601*
602*
611*
621*
631
641
650
651
652*
653
654
660
661
680
681
682
691
692
693*
694
701*
711
712
721
730
731*
740
741*
742*
743*
744*
745
746*
747
748
749
752
755
760
761*
762*
763*
764
765
Common name
Scientific name
Oregon ash
black ash
green ash
pumpkin ash
blue ash
waterlocust
honeylocust
loblolly bay
Kentucky coffeetree
silverbell sp.
American holly
walnut sp.
butternut
black walnut
sweetgum
yellow-poplar (tuliptree)
tanoak
Osage-orange
magnolia sp.
cucumbertree
southern magnolia
sweetbay
bigleaf magnolia
crab apple
apple sp.
mulberry sp.
white mulberry
red mulberry
water tupelo
Ogeechee tupelo
black tupelo (blackgum)
swamp tupelo
eastern hophornbeam
sourwood
paulownia; empress tree
redbay
sycamore sp.
American sycamore
poplar
balsam poplar
eastern cottonwood
bigtooth aspen
swamp cottonwood
plains cottonwood
quaking aspen
black cottonwood
Fremont cottonwood
narrowleaf cottonwood
white poplar
mesquite
cherry; peach; plum sp.
pin cherry
black cherry
chokecherry
plums; cherries
Canada plum
Fraxinus latifolia
Fraxinus nigra
Fraxinus pennsylvanica
Fraxinus profunda
Fraxinus quadrangulata
Gleditsia aquatica
Gleditsia triacanthos
Gordonia lasianthus
Gymnocladus dioicus
Halesia sp.
Ilex opaca
Juglans sp.
Juglans cinerea
Juglans nigra
Liquidambar styraciflua
Liriodendron tulipifera
Lithocarpus densiflorus
Maclura pomifera
Magnolia sp.
Magnolia acuminata
Magnolia grandiflora
Magnolia virginiana
Magnolia macrophylla
Malus sp.
Malus sp.
Morus sp.
Morus alba
Morus rubra
Nyssa aquatica
Nyssa ogeche
Nyssa sylvatica
Nyssa biflora
Ostrya virginiana
Oxydendrum arboreum
Paulownia tomentosa
Persea borbonia
Platanus sp.
Platanus occidentalis
Populus sp.
Populus balsamifera
Populus deltoides
Populus grandidentata
Populus heterophylla
Populus sargentii
Populus tremuloides
Populus trichocarpa
Populus fremontii
Populus angustifolia
Populus alba
Prospopis sp.
Prunus sp.
Prunus pensylvanica
Prunus serotina
Prunus virginiana
Prunus sp.
Prunus nigra
Continued
46
Table 3 continued
Survey
code
766
800
801
802*
803
804
805
806*
807
808
809
810
811
812*
813
814
815
816
817
818
819
820*
821
822
823
824*
825
826
827
828
829
830
831
832*
833*
834
835*
836
837*
838
839
840
843
850
899
901
902
920*
921
922
923
925
931*
935*
936
945
Common name
Scientific name
American plum
oak sp. (deciduous)
coast live oak
white oak
Arizona white oak
swamp white oak
canyon live oak
scarlet oak
blue oak
Durand oak
northern pin oak
Emory oak
Engelmann oak
southern red oak
cherrybark oak
Gambel oak
Oregon white oak
bear oak
shingle oak
California red oak
turkey (scrub) oak
laurel oak
California white oak
overcup oak
bur oak
blackjack oak
swamp chestnut oak
chinkapin oak
water oak
Nuttall oak
Mexican blue oak
pin oak
willow oak
chestnut oak
northern red oak
Shumard oak
post oak
Delta post oak
black oak
live oak
interior live oak
bluejack oak
silverleaf oak
oak sp. (evergreen)
oak
black locust
New Mexico locust
willow
peachleaf willow
black willow
diamond willow
Chinese tallowtree
sassafras
American mountain-ash
European mountain-ash
saltcedar; tamarisk
Prunus americana
Quercus sp.
Quercus agrifolia
Quercus alba
Quercus arizonica
Quercus bicolor
Quercus chrysolepis
Quercus coccinea
Quercus douglasii
Quercus durandii
Quercus ellipsoidalis
Quercus emoryi
Quercus engelmannii
Quercus falcata
Quercus falcata v. pag.
Quercus gambelii
Quercus garryana
Quercus ilicifolia
Quercus imbricaria
Quercus kelloggii
Quercus laevis
Quercus laurifolia
Quercus lobata
Quercus lyrata
Quercus macrocarpa
Quercus marilandica
Quercus michauxii
Quercus muehlenbergii
Quercus nigra
Quercus nuttallii
Quercus oblongifolia
Quercus palustris
Quercus phellos
Quercus prinus
Quercus rubra
Quercus shumardii
Quercus stellata
Quercus stellata v. mis.
Quercus velutina
Quercus virginiana
Quercus wislizenii
Quercus incana
Quercus hypoleucoides
Quercus sp.
Quercus sp.
Robinia pseudoacacia
Robinia neomexicana
Salix sp.
Salix amygdaloides
Salix nigra
Salix eriocephala
Sapium sebiferum
Sassafras albidum
Sorbus americana
Sorbus aucuparia
Tamarix chinesis
Continued
47
Table 3 continued
Survey
code
Common name
Scientific name
950
951*
952
970*
971*
972*
973
974
975
976
977
980
981
981
983
984
985
990
basswood sp.
American basswood
white basswood
elm
winged elm
American elm
cedar elm
Siberian elm
slippery elm
September elm
rock elm
tung-oil-tree
sparkleberry
California laurel
chinaberry
water elm
American smoketree
tesota
Tilia sp.
Tilia americana
Tilia heterophylla
Ulmus sp.
Ulmus alata
Ulmus americana
Ulmus crassifolia
Ulmus pumila
Ulmus rubra
Ulmus serotina
Ulmus thomasii
Aleurites fordii
Vaccinium arboreum
Umbellularia californica
Melia azedarach
Planera aquatica
Cotinus obovatus
Olneya tesota
999*
unknown/not listed;
currently: Alnus crispa,
green alder
48
Table 4.—Gypsy moth suitability rankings: 1 is preferred food for gypsy moth,
2 is resistant but fed upon, 3 is immune
Scientific name
Common name
Abelia chinensis var. grandifa
Abies amabilis
Abies balsamea
Abies bifolia
Abies bracteata
Abies concolor
Abies fraseri
Abies grandis
Abies holophylla
Abies lasiocarpa
Abies lowiana
Abies magnifica
Abies procera
Acacia baileyana
Acacia farnesiana
Acacia greggii
Acacia koa
Acacia longifolia
Acacia sp.
Acacia tortuosa
Acacia wrightii
Acer barbatum
Acer campestre
Acer circinatum
Acer ginnala
Acer glabrum
Acer grandidentatum
Acer japonicum
Acer leucoderme
Acer macrophyllum
Acer negundo
Acer nigrum
Acer palmatum
Acer pensylvanicum
Acer platanoides
Acer pseudoplatanus
Acer rubrum
Acer saccharinum
Acer saccharum
Acer spicatum
Acer tataricum
Achras emarginata
Acoelorrhaphe wrightii
Adonidia merrillii
Aesculus californica
Aesculus glabra
Aesculus hippocastanum
Aesculus octandra
Aesculus pavia
Aesculus sylvatica
Ailanthus altissima
Albizia julibrissin
Aleurites fordii
Alnus maritime
Alnus oblongifolia
Alnus rhombifolia
glossy abelia
Pacific silver fir
balsam fir
Rocky Mt. alpine fir
bristlecone fir
white fir
Fraser fir
grand fir
Manchurian fir
subalpine fir
Sierra white fir
California red fir
noble fir
Bailey acacia
sweet acacia
catclaw acacia
koa acacia
Sydney golden wattle
Acacia
twisted acacia
Wright acacia
Florida maple
hedge maple
vine maple
Amur maple
Rocky Mountain maple
bigtooth maple
fullmoon maple
chalk maple
bigleaf maple
boxelder
black maple
Japanese maple
striped maple
Norway maple
sycamore maple
red maple
silver maple
sugar maple
mountain maple
Tatar maple
wild dilly
paurotis-palm
Manila palm
California buckeye
Ohio buckeye
horsechestnut
yellow buckeye
red buckeye
painted buckeye
tree-of-heaven
silk tree
tung-oil-tree
seaside alder
Arizona alder
white alder
Ranking
3
2
3
3
2
2
3
2
2
2
2
2
2
2
2
2
2
2
2
2
2
2
2
2
3
2
2
2
2
2
2
2
2
3
2
2
2
3
2
3
2
2
3
3
3
2
3
3
2
2
2
3
2
1
1
2
Continued
49
Table 4 continued
Scientific name
Common name
Alnus rubra
Alnus rugosa
Alnus serrulata
Alnus sinuate
Alnus tenuifolia
Alvaradoa amorphoides
Amelanchier alnifolia
Amelanchier arborea
Amelanchier Canadensis
Amelanchier laevis
Amelanchier sp.
Amphitecna latifolia
Amyris elemifera
Annona glabra
Aralia spinosa
Arbutus arizonica
Arbutus menziesii
Arbutus texana
Arbutus unedo
Ardisia escallonioides
Ardisia japonica
Arecastrum romanzoffianum
Asimina triloba
Avicennia germinans
Betula alba
Betula alleghaniensis
Betula lenta
Betula nigra
Betula occidentalis
Betula papyrifera
Betula pendula
Betula populifolia
Betula pumila
Betula verrucosa
Bourreria ovata
Broussonetia papyrifera
Bumelia lanuginose
Bursera simaruba
Callitris glaucophylla
Calocedrus decurrens
Calycanthus floridus
Calyptranthes pallens
Calyptranthes zuzygium
Canella winterana
Canotia holacantha
Capparis cynophallophora
Caragana arborescens
Carica papaya
Carpinus caroliniana
Carya aquatica
Carya cordiformis
Carya floridana
Carya glabra
Carya illinoensis
Carya laciniosa
Carya myristiciformis
Carya ovalis
Carya ovata
red alder
speckled alder
smooth alder
Sitka alder
thinleaf alder
Mexican alvaradoa
western serviceberry
downy serviceberry
eastern serviceberry
smooth serviceberry
serviceberry
black-calabash
torchwood
pond apple
devils-walkingstick
Arizona madrone
Pacific madrone
Texas madrone
strawberry tree
marlberry
ardisia
queen palm
pawpaw
black mangrove
cut leaved birch
yellow birch
sweet (black) birch
river (red) birch
water birch
paper birch
cut leaf weeping birch
grey birch
bog birch
European white birch
Bahama strongback
paper mulberry
chittamwood
gumbo-limbo
white cypress pine
incense cedar
hairy (Carolina) alls
pale lidflower
myrtle-of-the-river
canella
canotia
Jamaica caper
Siberian pea tree
papaya
American hornbeam
water hickory
bitternut hickory
scrub hickory
pignut hickory
pecan
shellbark hickory
nutmeg hickory
red hickory
shagbark hickory
Ranking
1
1
2
2
1
2
2
2
2
2
2
3
2
2
3
2
1
2
2
2
3
3
2
2
2
3
2
1
2
1
1
1
1
1
3
3
2
2
3
3
3
2
2
2
2
2
2
2
2
2
2
2
2
2
2
2
2
3
Continued
50
Table 4 continued
Scientific name
Common name
Carya pallida
Carya sp.
Carya texana
Carya tomentosa
Caryota urens
Castanea dentate
Castanea ozarkensis
Castanea pumila
Castanopsis chrysophylla
Casuarina equisetifolia
Casuarina stricta
Catalpa bignonioides
Catalpa speciosa
Catalpa sp.
Ceanothus arboreus
Ceanothus integerimus
Ceanothus maritimus
Ceanothus spinosus
Ceanothus sp.
Ceanothus thyrsiflorus
Cedrus atlantica
Cedrus deodara
Cedrus libani
Celtis laevigata
Celtis occidentalis
Celtis tenuifolia
Cephalanthus occidentalis
Cercidium floridum
Cercidium microphyllum
Cercis Canadensis
Cercis occidentalis
Cercocarpus betuloides
Cercocarpus breviflorus
Cercocarpus intricatus
Cercocarpus ledifolius
Cercocarpus montanus
Cereus giganteus
Chaenomeles lagenaria
Chamaecyparis lawsoniana
Chamaecyparis nootkatensis
Chamaecyparis thyoides
Chilopsis linearis
Chionanthus virginica
Chrysobalanus icaco
Chrysophyllum oliviforme
Cinnamomum camphora
Citharexylum fruticosum
Citrus aurantifolia
Citrus limon
Citrus sinensis
Cladrastis lutea
Clethra alnifolia
Clethra sp.
Cliftonia monophylla
Coccoloba diversifolia
Coccoloba uvifera
Coccothrinax argentata
Cocos nucifera
sand hickory
hickory
black hickory
mockernut hickory
wine palm
American chestnut
Ozark chinkapin
Allegheny chinkapin
giant chinkapin
horsetail-tree
coast beefwood
southern catalpa
northern catalpa
hardy catalpa
feltleaf ceanothus
deer brush
ceanothus
spiny ceanothus
Ceanothus
blueblossom
Atlas cedar
deodar cedar
Cedar of Lebanon
sugarberry
northern hackberry
dwarf hackberry
buttonbush
blue paloverde
yellow paloverde
eastern redbud
western redbud
birchleaf cercocarpus
hairy cercocarpus
little leaf cercocarp
curlleaf cercocarpus
alderleaf cercocarpus
saguaro
Japanese quince
Port Orford white-cedar
Alaska cedar
Atlantic white-cedar
desert-willow
fringetree
cocoplum
satinleaf
camphor-tree
Florida fiddlewood
lime
lemon
orange
yellowwood
sweet pepperbush
pepperbush
buckwheat tree
doveplum
seagrape
Florida silverpalm
coconut palm
Ranking
2
2
2
2
3
2
2
2
1
2
2
3
3
3
3
3
2
3
3
3
2
2
2
3
3
3
2
2
2
3
3
2
2
2
2
2
2
2
3
3
3
3
2
2
2
1
2
2
3
2
2
3
3
2
2
2
3
3
Continued
51
Table 4 continued
Scientific name
Common name
Colubrina elliptica
Conocarpus erectus
Cordia sebestena
Cornus alternifolia
Cornus drummondii
Cornus florida
Cornus nuttallii
Cornus racemosa
Cornus rugosa
Cornus sp.
Cornus stolonifera
Corylus americana
Corylus avellana
Corylus cornuta
Cotinus coggygria
Cotinus obovatus
Cowania mexicana
Crataegus berberifolia
Crataegus brachyacantha
Crataegus coccinea
Crataegus crus-galli
Crataegus douglasii
Crataegus intricata
Crataegus marshallii
Crataegus mollis
Crataegus monogyna
Crataegus opaca
Crataegus oxyacantha
Crataegus pruinosa
Crataegus saligna
Crataegus spathulata
Crataegus sp.
Cunninghamia lanceolata
Cupressocyparia leylandii
Cupressus arizonica
Cupressus bakeri
Cupressus goveniana
Cupressus guadalupensis
Cupressus macnabiana
Cupressus macrocarpa
Cupressus sargentii
Cydonia oblonga
Cyrilla racemiflora
Dalea spinosa
Diospyros texana
Diospyros virginiana
Dipholis salicifolia
Drypetes lateriflora
Elaeagnus angustifolia
Elliottia racemosa
Eriobotrya japonica
Erythrina herbacea
Eucalyptus botrioides
Eucalyptus camaldulensis
Eucalyptus camphora
Eucalyptus cinerea silver
Eucalyptus diversifolia
Eucalyptus globulus
soldierwood
button-mangrove
Geiger-tree
alternate-leaf dogwood
roughleaf dogwood
flowering dogwood
Pacific dogwood
gray dogwood
roundleaf dogwood
dogwood
red-osier dogwood
American hazelnut
European filbert
beaked hazelnut
smoketree
American smoketree
cliffrose
barberryleaf hawthorn
blueberry hawthorn
scarlet hawthorn
cockspur hawthorn
black hawthorn
Biltmore hawthorn
parsley hawthorn
downy hawthorn
oneseed hawthorn
riverflat hawthorn
English hawthorn
frosted hawthorn
willow hawthorn
littlehip hawthorn
hawthorn
blue Chinese fir
Leyland cypress
Arizona cypress
Baker cypress
Gowen cypress
Guadalupe cypress
MacNab cypress
Monterey cypress
Sargent cypress
quince
swamp cyrilla
smokethorn
Texas persimmon
common persimmon
willow bustic
Guiana plum
Russian olive
Elliottia
loquat tree
eastern coralbean
eucalyptus
redgum
eucalyptus
dollar eucalyptus
eucalyptus
bluegum eucalyptus
Ranking
2
2
3
3
3
2
3
3
3
3
3
1
1
2
1
1
2
1
1
1
1
1
1
1
1
2
1
1
1
1
1
1
3
3
3
3
3
3
3
3
3
2
2
2
3
3
2
3
3
2
2
2
2
2
2
1
2
2
Continued
52
Table 4 continued
Scientific name
Common name
Eucalyptus gunnii
Eucalyptus leucoxylon
Eucalyptus polyanthemos
Eucalyptus pulchella
Eucalyptus rudis
Eucalyptus sideroxylon
Eucalyptus sp.
Eucalyptus tereticornis
Euonymus atropurpureus
Euonymus europaeus
Euonymus japonicus
Euonymus occidentalis
Exostema caribaeum
Exothea paniculata
Fagus grandifolia
Fagus sylvatica
Fatsia japonica
Ficus aurea Florida
Ficus benjamina
Ficus carica
Ficus elastica
Ficus lyrata
Firmiana simplex
Forestiera acuminata
Fraxinus americana
Fraxinus anomala
Fraxinus caroliniana
Fraxinus cuspidata
Fraxinus excelsior
Fraxinus greggii
Fraxinus latifolia
Fraxinus nigra
Fraxinus pennsylvanica
Fraxinus profunda
Fraxinus quadrangulata
Fraxinus sp.
Fraxinus texensis
Fraxinus velutina
Garrya fremontii
Ginkgo biloba
Gleditsia aquatica
Gleditsia triacanthos
Gordonia lasianthus
Grevillea ‘noellii’
Grevillea robusta
Guaiacum sanctum
Guettarda elliptica
Guettarda scabra
Gyminda latifolia
Gymnanthes lucida
Gymnocladus dioicus
Hakea sp.
Halesia carolina
Hamamelis virginiana
Heteromeles arbutifolia
Hibiscus rosa-sinensis
Hibiscus tiliaceus
Hippomane mancinella
cider gum
white ironbark
silver dollar gum
white peppermint
desert gum
red ironbark
eucalyptus
horncap eucalyptus
eastern wahoo
European spindle tree
evergreen euonymus
western wahoo
Caribbean princewood
inkwood
American beech
European (purple) beech
Japanese aralia
strangler fig
benjamin fig
common fig
India-rubber tree
fiddle leaf fig
Chinese parasoltree
swamp-privet
white ash
singleleaf ash
Carolina ash
fragrant ash
European ash
Gregg ash
Oregon ash
black ash
green ash
pumpkin ash
blue ash
ash
Texas ash
velvet ash
silktassel
ginko
waterlocust
honeylocust
loblolly bay
Grevillea
silk-oak
roughbark lignumvitae
elliptic leaf velvetseed
roughleaf velvetseed
West Indies falsebox
oysterwood
Kentucky coffeetree
Hakea
silver bell
witch-hazel
Christmas-berry
Chinese hibiscus
sea hibiscus
manchineel
Ranking
1
2
2
2
2
2
2
2
2
2
2
2
2
2
2
2
3
2
3
2
2
2
2
3
3
3
3
3
2
3
3
3
3
3
3
3
3
3
3
3
3
3
2
3
3
2
2
2
2
3
3
2
3
1
2
2
2
3
Continued
53
Table 4 continued
Scientific name
Common name
Ilex aquifolium
Ilex cassine
Ilex coriacea
Ilex decidua
Ilex glabra
Ilex krugiana
Ilex montana
Ilex opaca
Ilex verticillata
Ilex vomitoria
Jasminum nudiflorum
Juglans californica
Juglans cinerea
Juglans hindsii
Juglans major
Juglans microcarpa
Juglans nigra
Juniperus ashei
Juniperus californica
Juniperus coahuilensis
Juniperus communis
Juniperus deppeana
Juniperus erythrocarpa
Juniperus flaccida
Juniperus monosperma
Juniperus occidentalis
Juniperus osteosperma
Juniperus pinchotii
Juniperus scopulorum
Juniperus virginiana
Krugiodendron ferreum
Laguncularia racemosa
Larix decidua
Larix laricina
Larix lyallii
Larix occidentalis
Leitneria floridana
Lindera benzoin
Liquidambar styraciflua
Liriodendron tulipifera
Lithocarpus densiflorus
Lyonia ferruginea
Lyonothamnus floribundus
Lysiloma latisiliquum
Maclura pomifera
Magnolia acuminata
Magnolia ashei
Magnolia fraseri
Magnolia grandiflora
Magnolia macrophylla
Magnolia pyramidata
Magnolia soulangeana
Magnolia tripetala
Magnolia virginiana
Malus coronaria
Malus ioensis
Malus sp.
Mastichodendrofoe tidissimum
English holly
dahoon
large gallberry
possumhaw
inkberry
tawnyberry holly
mountain winterberry
American holly
common winterberry
yaupon
winter jasmine
California walnut
butternut
Hinds walnut
Arizona walnut
little walnut
black walnut
Ashe juniper
California juniper
roseberry
common juniper
alligator juniper
redberry juniper
drooping juniper
oneseed juniper
western juniper
Utah juniper
Pinchot juniper
Rocky Mt. juniper
eastern redcedar
leadwood
white mangrove
European larch
tamarack
subalpine larch
western larch
corkwood
spicebush
sweetgum
yellow-poplar (tuliptree)
tanoak
tree lyonia
Lyontree
Bahama lysiloma
Osage-orange
cucumbertree
Ashe magnolia
Fraser magnolia
southern magnolia
bigleaf magnolia
pyramid magnolia
rustica rubra
umbrella-tree
sweetbay
sweet crab apple
prairie crab apple
crab apple
false mastic
Ranking
3
3
3
3
3
3
3
3
3
3
3
2
2
2
2
2
2
3
3
3
3
3
3
3
3
3
3
3
3
3
2
2
1
1
1
1
2
3
1
3
1
2
2
2
3
3
3
3
3
3
3
3
3
3
1
1
1
2
Continued
54
Table 4 continued
Scientific name
Common name
Melaleuca decussata
Melaleuca quinquenervia
Melia azedarach
Mespilus germanica
Metasequoia glyptostroboides
Metopium toxiferum
Morus alba
Morus alba var. tatarica
Morus microphylla
Morus nigra
Morus rubra
Myrica californica
Myrica cerifera
Nyssa aquatica
Nyssa biflora
Nyssa ogeche
Nyssa sylvatica
Olea europaea
Olneya tesota
Osmanthus americanus
Ostrya knowltonii
Ostrya virginiana
Oxydendrum arboreum
Parkinsonia aculeata
Paulownia tomentosa
Persea americana
Persea borbonia
Photinia glabra
Photinia serrulata
Photinia sp.
Picea abies
Picea breweriana
Picea engelmannii
Picea glauca
Picea glauca var. albertiana
Picea mariana
Picea polita
Picea pungens
Picea rubens
Picea sitchensis
Picea sp.
Picramnia pentandra
Pinckneya pubens
Pinus albicaulis
Pinus aristata
Pinus attenuata
Pinus balfouriana
Pinus banksiana
Pinus cembroides
Pinus clausa
Pinus contorta
Pinus coulteri
Pinus discolor
Pinus echinata
Pinus edulis
Pinus elliottii
Pinus engelmannii
Pinus flexilis
lilac melaleuca
cajeput tree
chinaberry
European medlar
dawn redwood
Florida poisontree
white mulberry
Russian mulberry
Texas mulberry
black mulberry
red mulberry
Pacific waxmyrtle
bayberry
water tupelo
swamp tupelo
Ogeeche tupelo
black tupelo (black gum)
olive
tesota
devilwood
Knowlton hophornbeam
eastern hophornbeam
sourwood
Jerusalem thorn
royal paulownia
avocado
redbay
Japanese photinia
Chinese medlar
photinia
Norway spruce
Brewer spruce
Engelmann spruce
white spruce
dwarf Alberta spruce
black spruce
tigertail spruce
blue spruce
red spruce
Sitka spruce
spruce
bitterbush
pinckneya
whitebark pine
bristlecone pine
knobcone pine
foxtail pine
jack pine
Mexican pinyon
sand pine
lodgepole pine
Coulter pine
border pinyon
shortleaf pine
pinyon
slash pine
Apache pine
limber pine
Ranking
1
2
2
2
2
1
3
2
3
3
3
2
2
3
3
3
3
3
2
3
2
1
2
2
3
2
2
2
2
3
2
2
2
2
2
2
2
2
2
2
2
2
2
2
2
2
2
2
2
2
2
2
2
2
2
2
2
2
Continued
55
Table 4 continued
Scientific name
Common name
Pinus glabra
Pinus halepensis
Pinus jeffreyi
Pinus lambertiana
Pinus longaeva
Pinus monophylla
Pinus monticola
Pinus mugo Swiss
Pinus muricata
Pinus nigra
Pinus palustris
Pinus pinea Italian
Pinus ponderosa
Pinus pungens
Pinus quadrifolia
Pinus radiata
Pinus resinosa
Pinus rigida
Pinus sabiniana
Pinus serotina
Pinus sp.
Pinus strobiformis
Pinus strobes
Pinus sylvestris
Pinus taeda
Pinus thunbergiana
Pinus torreyana
Pinus virginiana
Pinus washoensis
Piscidia piscipula
Pistacia texana
Pistacia vera
Planera aquatica
Platanus occidentalis
Platanus orientalis
Platanus racemosa
Platanus wrightii
Populus alba
Populus angustifolia
Populus balsamifera
Populus deltoides
Populus fremontii
Populus grandidentata
Populus heterophylla
Populus nigra var. italica
Populus sargentii
Populus sp.
Populus tremuloides
Populus trichocarpa
Prosopis glandulosa
Prosopis pubescens
Prunus alleghaniensis
Prunus americana
Prunus angustifolia
Prunus avium
Prunus caroliniana
Prunus cerasifera var. pissar
Prunus domestica
spruce pine
Aleppo pine
Jeffrey pine
sugar pine
intermountain bristle
singleleaf pinyon
western white pine
mountain pine
bishop pine
Austrian pine
longleaf pine
stone pine
ponderosa pine
Table Mountain pine
Parry pinyon
Monterey pine
red pine
pitch pine
Digger pine
pond pine
pine
southwestern white pine
eastern white pine
Scots pine
loblolly pine
Japanese black pine
Torrey pine
Virginia pine
Washoe pine
Florida fishpoison tree
Texas pistache
pistachio
water elm
American sycamore
Oriental planetree
California sycamore
Arizona sycamore
white poplar
narrowleaf cottonwood
balsam poplar
eastern cottonwood
Fremont cottonwood
bigtooth aspen
swamp cottonwood
Lombardy poplar
plains cottonwood
poplar
quaking aspen
black cottonwood
honey mesquite
screwbean mesquite
Allegheny plum
American plum
Chickasaw plum
sweet cherry
Carolina laurelcherry
purple leaved plum
common plum
Ranking
2
2
2
2
2
2
2
2
2
2
2
3
2
2
2
2
2
3
2
2
2
2
2
2
2
3
2
2
2
2
1
1
2
3
2
3
3
2
1
1
2
2
1
1
1
1
1
1
1
2
2
2
2
2
2
2
2
2
Continued
56
Table 4 continued
Scientific name
Common name
Prunus emarginata
Prunus fremontii
Prunus glandulosa
Prunus hortulana
Prunus japonica
Prunus laurocerasus
Prunus lyonii
Prunus maritima
Prunus mexicana
Prunus munsoniana
Prunus myrtifolia
Prunus nigra
Prunus padus
Prunus pensylvanica
Prunus persica
Prunus persica
Prunus persica
Prunus pumila
Prunus serotina
Prunus spinosa
Prunus sp.
Prunus subcordata
Prunus umbellata
Prunus virginiana
Pseudophoenix sargentii
Pseudotsuga macrocarpa
Pseudotsuga menziesii
Psidium guajava
Ptelea trifoliata
Punica granatum
Pyracantha coccinea
Pyrus angustifolia
Pyrus arbutifolia
Pyrus communis
Pyrus fusca
Pyrus malus
Quercus agrifolia
Quercus alba
Quercus arizonica
Quercus austrina
Quercus bicolor
Quercus chapmanii
Quercus chrysolepis
Quercus cinerea
Quercus coccinea
Quercus douglasii
Quercus durandii
Quercus ellipsoidalis
Quercus emoryi
Quercus engelmannii
Quercus falcate
Quercus gambelii
Quercus garryana
Quercus grisea
Quercus hemisphaerica
Quercus hypoleucoides
Quercus ilicifolia
Quercus imbricaria
bitter cherry
desert apricot
dwarf flowering almond
hortulan plum
Japanese plum
common cherry-laurel
Catalina cherry
beach plum
Mexican plum
wildgoose plum
West Indies cherry
Canada plum
European bird cherry
pin cherry
heavenly white nectar
Tilton apricot
peach
sand cherry
black cherry
sloe
cherry
Klamath plum
flatwoods plum
chokecherry
buccaneer palm
bigcone Douglas-fir
Douglas-fir
common guava
common hoptree
pomegranate
fire thorn
southern crab apple
choke berry
pear
Oregon crab apple
common apple
coast live oak
white oak
Arizona white oak
bluff oak
swamp white oak
Chapman oak
canyon live oak
bluejack oak
scarlet oak
blue oak
Durand oak
northern pin oak
Emory oak
Engelmann oak
southern red oak
Gambel oak
Oregon white oak
Arizona gray oak
Darlington oak
silverleaf oak
bear oak
shingle oak
Ranking
2
2
2
2
2
2
2
2
2
2
2
2
2
3
2
1
2
2
2
2
2
2
2
2
3
2
2
2
2
2
2
1
2
2
1
1
1
1
1
1
1
1
1
1
1
1
1
1
1
1
1
1
1
1
1
1
1
1
Continued
57
Table 4 continued
Scientific name
Common name
Quercus incana
Quercus kelloggii
Quercus laevis
Quercus laurifolia
Quercus lobata
Quercus lyrata
Quercus macrocarpa
Quercus margaretta
Quercus marilandica
Quercus michauxii
Quercus muehlenbergii
Quercus myrtifolia
Quercus nigra
Quercus nuttallii
Quercus oblongifolia
Quercus oglethorpensis
Quercus pagoda
Quercus palustris
Quercus phellos
Quercus prinus
Quercus rubra
Quercus shumardii
Quercus sp.
Quercus stellata
Quercus suber
Quercus velutina
Quercus virginiana
Quercus wislizenii
Rapanea guianensis
Reynosia septentrionalis
Rhamnus californica
Rhamnus caroliniana
Rhamnus cathartica
Rhamnus frangula
Rhamnus purshiana
Rhizophora mangle
Rhus copallina
Rhus glabra
Rhus integrifolia
Rhus typhina
Robinia neomexicana
Robinia pseudoacacia
Robinia sp.
Robinia viscosa
Rosa bracteata
Rosa eglanteria
Rosa setigera
Rosa sp.
Roystonea elata
Sabal palmetto
Salix alaxensis
Salix alba
Salix alba var. tristis
Salix amygdaloides
Salix babylonica
Salix bebbiana
Salix bonplandiana
Salix caroliniana
bluejack oak
California red oak
turkey (scrub) oak
laurel oak
California white oak
overcup oak
bur oak
sand post oak
blackjack oak
swamp chestnut oak
chinkapin oak
myrtle oak
water oak
Nuttall oak
Mexican blue oak
Oglethorpe oak
cherrybark oak
pin oak
willow oak
chestnut oak
northern red oak
Shumard oak
oak
post oak
cork oak
black oak
live oak
interior live oak
Guiana rapanea
darling plum
California buckthorn
Carolina buckthorn
European buckthorn
glossy buckthorn
cascara buckthorn
red mangrove
shining sumac
smooth sumac
lemonade berry
staghorn sumac
New Mexico locust
black locust
locust
clammy locust
Macartney rose
sweetbrier rose
climbing prairie rose
rose
Florida royalpalm
cabbage palmetto
feltleaf willow
white willow
golden weeping willow
peachleaf willow
weeping willow
Bebb willow
Bonpland willow
coastal plain willow
Ranking
1
1
1
1
1
1
1
1
1
1
1
1
1
1
1
1
1
1
1
1
1
1
1
1
1
1
1
1
2
2
3
3
3
3
2
2
1
1
2
1
3
3
2
3
2
2
2
1
3
3
1
1
1
1
2
1
1
1
Continued
58
Table 4 continued
Scientific name
Common name
Salix cordata heart
Salix discolor
Salix eriocephala
Salix exigua
Salix fragilis
Salix hookeriana
Salix laevigata
Salix lasiandra
Salix lasiolepis
Salix lucida
Salix mackenzieana
Salix nigra
Salix pentandra
Salix scouleriana
Salix sp.
Salix taxifolia
Salix viminalis
Sambucus callicarpa
Sambucus canadensis
Sapindus drummondii
Sapindus marginatus
Sapindus saponaria
Sapium sebiferum
Sassafras albidum
Schinus molle
Sequoia sempervirens
Sequoiadendron giganteum
Simarouba glauca
Sophora affinis
Sophora japonica
Sophora secundiflora
Sorbus americana
Sorbus aucuparia
Spirea bumalda
Stewartia koreana
Stewartia ovata
Swietenia mahogany
Symphori carposalbus
Symplocos tinctoria
Tamarix parviflora
Taxodium distichum
Taxus brevifolia
Taxus floridana
Thrinax microcarpa
Thrinax parviflora
Thuja occidentalis
Thuja orientalis
Thuja plicata
Tilia americana
Tilia caroliniana
Tilia cordata
Tilia europaea
Tilia floridana
Tilia heterophylla
Torreya californica
Torreya taxifolia
Toxicodendron vernix
Trema micrantha
leaved willow
pussy willow
diamond willow
sandbar willow
crack willow
Hooker willow
red willow
Pacific willow
arroyo willow
shining willow
Mackenzie willow
black willow
laurel leaved willow
Scouler willow
willow
yewleaf willow
basket willow
Pacific red elder
American elder
western soapberry
Florida soapberry
wingleaf soapberry
Chinese tallowtree
sassafras
California peppertree
coast redwood
giant sequoia
paradise-tree
Texas sophora
Japanese pagoda tree
mescalbean
merican mountain-ash
European mountain-ash
spirea
Stewartia
mountain Stewartia
West Indies mahogany
snowberry
common sweetleaf
smallflower tamerisk
baldcypress
Pacific yew
Florida yew
brittle thatchpalm
Jamaica thatchpalm
northern white-cedar
Chinese arborvitae
western redcedar
American basswood
Carolina basswood
little leaf linden
European linden
Florida basswood
white basswood
California torreya
Florida torreya
poison-sumac
Florida trema
Ranking
1
1
1
1
1
1
1
1
1
1
1
1
2
1
1
1
1
2
3
2
2
2
3
2
1
2
2
2
3
3
2
1
1
3
3
2
2
3
2
2
3
3
3
3
3
3
3
3
1
1
1
1
1
1
3
3
1
2
Continued
59
Table 4 continued
Scientific name
Common name
Tsuga canadensis
Tsuga caroliniana
Tsuga heterophylla
Tsuga mertensiana
Ulmus alata
Ulmus americana
Ulmus crassifolia
Ulmus glabra
Ulmus parvifolia
Ulmus procera
Ulmus pumila
Ulmus rubra
Ulmus serotina
Ulmus sp.
Ulmus thomasii
Umbellularia californica
Vauquelinia californica
Viburnum acerifolium
Viburnum ellipticum
Viburnum lantana
Viburnum lentago
Viburnum opulus
Viburnum prunifolium
Viburnum pubescens
Viburnum rhytidophyllum
Viburnum sp.
Viburnum tomentosum
Washingtonia filifera
Ximenia americana
Zanthoxylum americanum
Zanthoxylum clava-herculis
Zanthoxylum fagara
Zanthoxylum flavum
eastern hemlock
Carolina hemlock
western hemlock
mountain hemlock
winged elm
American elm
cedar elm
Wych elm
Chinese elm
European elm
Siberian elm
slippery elm
September elm
elm
rock elm
California laurel
Torrey vauquelinia
maple leaved arrowwood
oval leafed viburnum
wayfaring tree
nannyberry
cranberrybush
black haw
downy arrowwood
leatherleaf viburnum
viburnum
viburnum
California palm
tallowwood
common prickly-ash
Hercules club
lime prickly-ash
West Indies satinwood
Ranking
This and additional information can be found in Liebhold et al. 1995
or at our World-Wide-Web site: http://www.fsl.wvnet.edu
60
2
2
2
2
2
2
2
2
2
2
2
3
2
2
2
3
2
3
2
2
3
3
2
2
2
3
3
3
3
2
2
2
2
61
012
068
071
094
095
097
105
124
125
126
241
261
317
319
999
353
379
421
601
741
743
761
763
935
BF
ERC
EL
WS
BS
RS
JP
MOP
RP
PP
WC
EH
SIM
MM
GAL
SAL
GB
CNX
BUT
BP
BTA
PC
CC
MAS
Char.
code
3
3
1
2
2
2
2
2
2
3
3
2
3
3
3
1
1
2
2
1
1
3
2
1
Feeding
pref.
3
1
1
3
2
3
1
2
1
1
2
3
2
3
2
2
1
2
1
1
1
1
1
2
3
1
1
2
2
3
1
3
1
1
2
3
2
3
2
2
1
2
1
1
1
1
1
2
Shade tolerance
Recruit. Growth
Heat accum. range
Cold
Hot
Days-degree
700
3700
2966
10204
600
3800
600
3750
600
3800
1300
3800
1150
4000
6000
9000
2000
4100
3800
5800
1500
3700
2416
6559
2200
9000
1800
6300
540
3000
2174
5299
2800
4800
3686
8499
3200
6500
1000
4300
2100
6000
1100
6000
1700
10000
1800
4000
Growth
factor
cm/yr
102.7
88.7
86.3
91.8
32.0
50.7
142.0
250.0
156.4
86.5
35.7
86.0
164.8
72.6
143.3
196.9
119.5
195.2
192.2
232.5
176.7
227.2
233.3
155.6
inches
35
24
33
21
18
24
20
30
36
36
40
60
48
6
6
9
15
50
36
48
60
20
20
30
Diameter
(max.)
feet
75
50
100
110
90
75
100
105
100
100
80
120
130
18
12
15
30
90
100
128
92
75
45
40
Height
(max.)
years
200
250
200
200
250
400
185
100
275
200
400
600
125
25
30
30
50
200
90
150
70
30
20
30
Age
(max.)
1
1
1
1
1
2
1
1
1
2
1
2
3
2
1
1
2
3
2
2
2
2
2
2
Crown
cover
2
3
10
2
2
2
50
5
3
2
2
3
2
2
10
10
10
0
3
3
3
60
60
2
Recruitment
This table is an example of one you might build as you add new species to the model. We would like to have your input on any changes that you think should be made to default parameters for
existing species. We also would like to add any parameter sets for species that you have developed. Note that we have included a shrub species, Alnus crispa (Little 1979), that was included in
Botkin’s (1993) most recent list. This is coded 999 in the species file. Other than this species, the order of appearance in this table is the same as species will appear in the SPECIES file, ordered
by Survey Codes. Remember that only one entry of each value of a this numeric code can be used, so if you want to use 999 to designate another tree species, delete our entry in the species
files (SPECIES & SPECIES.HLP). Also, we could not locate an FIA code for Alnus rugosa, so we used 353, which we believe is an unused code (see Table 1).
Abies balsamea
Juniperus virginiana
Larix laricina
Picea glauca
Picea mariana
Picea rubens
Pinus banksiana
Pinus radiata
Pinus resinosa
Pinus rigida
Thuja occidentalis
Tsuga canadensis
Acer saccharinum
cer spicatum
Alnus crispa
Alnus rugosa
Betula populifolia
Castanea dentata
Juglans cinerea
Populus balsamifera
Populus grandidentata
Prunus pensylvanica
Prunus virginiana
Sorbus americana
balsam fir
eastern redcedar
European larch
white spruce
black spruce
red spruce
jack pine
monterey pine
red pine
pitch pine
northern white-cedar
eastern hemlock
silver maple
mountain maple
green alder
speckled alder
grey birch
American chestnut
butternut
balsam poplar
bigtooth aspen
pin cherry
choke cherry
American mt. ash
Survey
code
Scientific
name
Common
name
Table 5.—Format used in collecting data to add new species to the Stand-Damage Model
(See Editing Data, pages 10-13 for explanations of each column)
Sample Data Sheets for Fixed-Area Plot Data Entry
Plot 1.
Central Pennsylvania Risk Rating Plots Study 15 —— Stand 123
STAND
PLOT TREE
SPECIES
DBH78
VIGOR78
123
123
123
123
123
123
123
123
123
123
123
123
123
123
123
123
123
123
123
123
123
123
123
123
123
1
1
1
1
1
1
1
1
1
1
1
1
1
1
1
1
1
1
1
1
1
1
1
1
1
1
2
3
5
6
7
8
9
10
11
12
13
14
15
16
17
18
20
22
23
24
25
28
29
31
316
316
316
315
833
832
832
833
832
400
316
833
837
832
833
833
832
833
316
833
832
832
316
316
316
3.30
3.00
5.30
5.30
10.00
4.30
12.80
5.30
14.30
5.60
7.80
6.10
9.10
16.50
8.80
9.30
8.50
15.30
3.50
3.10
11.80
10.10
3.00
6.80
5.00
62
2.00
3.00
1.00
2.00
1.00
1.00
2.00
2.00
1.00
3.00
1.00
1.00
1.00
1.00
1.00
1.00
2.00
1.00
1.00
2.00
1.00
1.00
3.00
2.00
1.00
CCLASS78
5.00
5.00
4.00
4.00
3.00
5.00
3.00
4.00
3.00
5.00
4.00
4.00
3.00
3.00
3.00
3.00
4.00
3.00
5.00
5.00
3.00
3.00
5.00
3.00
4.00
Plot 2.
Central Pennsylvania Risk Rating Plots Study 15 —— Stand 123
STAND
PLOT TREE
SPECIES
DBH78
VIGOR78
123
123
123
123
123
123
123
123
123
123
123
123
123
123
123
123
123
123
123
123
123
123
123
123
123
123
123
123
123
123
123
123
123
123
123
123
123
123
123
123
123
123
2
2
2
2
2
2
2
2
2
2
2
2
2
2
2
2
2
2
2
2
2
2
2
2
2
2
2
2
2
2
2
2
2
2
2
2
2
2
2
2
2
2
1
2
3
4
5
7
8
9
10
11
13
14
15
16
17
18
19
20
21
22
23
24
25
26
27
28
29
30
31
32
33
34
39
40
41
42
43
44
45
47
48
49
832
832
832
832
832
832
833
316
832
832
316
316
837
837
931
837
832
832
832
832
316
832
833
833
833
316
931
833
833
832
832
832
832
832
316
837
372
372
931
832
832
832
4.30
5.00
6.10
6.10
5.10
7.10
8.30
3.30
5.10
4.30
3.10
4.30
7.60
7.50
3.10
5.10
6.80
8.00
4.60
4.30
4.00
9.50
6.30
7.00
5.10
3.60
3.30
12.00
8.30
5.80
6.10
5.80
8.80
6.30
5.10
8.30
8.80
4.00
3.10
9.10
7.80
6.80
63
1.00
2.00
1.00
1.00
1.00
1.00
1.00
2.00
3.00
3.00
2.00
2.00
1.00
1.00
3.00
3.00
1.00
1.00
3.00
3.00
1.00
1.00
1.00
1.00
3.00
1.00
3.00
1.00
1.00
1.00
1.00
2.00
1.00
1.00
1.00
2.00
1.00
1.00
1.00
1.00
1.00
1.00
CCLASS78
4.00
4.00
3.00
3.00
3.00
3.00
3.00
5.00
3.00
3.00
3.00
3.00
3.00
3.00
5.00
5.00
3.00
3.00
4.00
4.00
4.00
3.00
3.00
3.00
5.00
5.00
5.00
3.00
4.00
3.00
3.00
3.00
3.00
4.00
5.00
3.00
3.00
5.00
5.00
3.00
3.00
3.00
Plot 3.
Central Pennsylvania Risk Rating Plots Study 15 —— Stand 123
STAND
PLOT TREE
SPECIES
DBH78
VIGOR78
123
123
123
123
123
123
123
123
123
123
123
123
123
123
123
123
123
123
123
123
123
123
123
123
123
123
3
3
3
3
3
3
3
3
3
3
3
3
3
3
3
3
3
3
3
3
3
3
3
3
3
3
1
2
3
5
6
7
8
9
10
12
13
14
15
16
17
19
21
22
23
24
25
26
27
28
29
30
832
833
832
832
832
833
833
833
833
316
372
833
832
833
832
833
833
372
832
832
833
832
832
832
832
833
8.50
9.60
9.30
3.60
5.60
4.60
9.80
7.00
8.10
3.30
7.10
3.30
6.60
5.60
12.80
5.30
11.80
12.30
10.10
4.10
5.80
14.00
5.30
4.80
6.30
11.30
64
1.00
1.00
1.00
3.00
2.00
3.00
1.00
2.00
2.00
3.00
1.00
2.00
1.00
3.00
1.00
3.00
1.00
1.00
1.00
3.00
2.00
1.00
3.00
3.00
1.00
1.00
CCLASS78
3.00
3.00
3.00
5.00
5.00
5.00
3.00
4.00
4.00
5.00
4.00
5.00
4.00
5.00
3.00
5.00
3.00
3.00
3.00
4.00
4.00
3.00
4.00
4.00
4.00
3.00
Sample Data Sheets for Variable-Radius Plot Data Entry
Dorr Run gypsy Moth Survey -- Stand 96-14
Forest__Wayne__District_Athens_Compartment_96_____Stand__14____
Comments:
FS Type__59______________ Yr. of Origin___1903___ Plot Size_______
Aspect_______ Elevation________ Slope________ Slope Position________
Plot Number____1______Date_4/8/99_ Crew_DLF/SF__ Page ____ of ___
Crown
Total
Crown
Species Dbh
Vigor
Class
Height
Species Dbh
Vigor
Class
________ ________ ________ ________ ________ ________ ________ ________ ________
Total
Height
________
_837____ __26.2__ __1_____ __3_____ _108____ ________ ________ ________ ___________ ________
_802____ __16.3__ __1_____ __3_____ ________ ________ ________ ________ ___________ ________
_837____ __13.1__ __3_____ __4_____ ________ ________ ________ ________ ___________ ________
__318___ ___2.8__ __1_____ __5_____ ________ ________ ________ ________ ___________ ________
__806___ __15.0__ __1_____ __3_____ ________ ________ ________ ________ ___________ ________
__833___ __16.7__ __1_____ __3_____ ________ ________ ________ ________ ___________ ________
__837___ __15.1__ __1_____ __3_____ ________ ________ ________ ________ ___________ ________
__832___ __14.8__ __1_____ __4_____ ________ ________ ________ ________ ___________ ________
__806___ __16.3__ __1_____ __3_____ ________ ________ ________ ________ ___________ ________
__802___ __17.8__ __1_____ __3_____ ________ ________ ________ ________ ___________ ________
__802___ __15.9__ __1_____ __3_____ ________ ________ ________ ________ ___________ ________
__400___ __4.7___ __1_____ __5_____ ________ ________ ________ ________ ___________ ________
__316___ __10.4__ __2_____ __4_____ ________ ________ ________ ________ ___________ ________
________ ________ ________ ________ ________ ________ ________ ________ ___________ ________
________ ________ ________ ________ ________ ________ ________ ________ ___________ ________
________ ________ ________ ________ ________ ________ ________ ________ ___________ ________
65
Forest__Wayne__District_Athens_Compartment_96_____Stand__14____
Comments:
FS Type__59______________ Yr. of Origin___1903___ Plot Size_______
Aspect_______ Elevation________ Slope________ Slope Position________
Plot Number___2______ Date_4/8/99_ Crew_DLF/SF__ Page ____ of ___
Crown
Total
Crown
Species Dbh
Vigor
Class
Height
Species Dbh
Vigor
Class
________ ________ ________ ________ ________ ________ ________ ________ ________
Total
Height
________
___833__ __20____ ___1____ ___3____ ________ ________ ________ ________ ___________ ________
____833_ __14.6__ ___1____ ___3____ ________ ________ ________ ________ ___________ ________
___833__ __18.4__ ___1____ ___3____ ________ ________ ________ ________ ___________ ________
___833__ __17.6__ ___1____ ___3____ ________ ________ ________ ________ ___________ ________
___802__ __14.9__ ___1____ ___3____ ________ ________ ________ ________ ___________ ________
___802__ __20.8__ ___1____ ___3____ ________ ________ ________ ________ ___________ ________
___802__ __21.4__ ___1____ ___3____ ________ ________ ________ ________ ___________ ________
___837__ __11.9__ ___4____ ___4____ ________ ________ ________ ________ ___________ ________
___802__ __18.2__ ___1____ ___3____ ________ ________ ________ ________ ___________ ________
___833__ __21.3__ ___1____ ___3____ ________ ________ ________ ________ ___________ ________
________ ________ ________ ________ ________ ________ ________ ________ ___________ ________
________ ________ ________ ________ ________ ________ ________ ________ ___________ ________
________ ________ ________ ________ ________ ________ ________ ________ ___________ ________
________ ________ ________ ________ ________ ________ ________ ________ ___________ ________
________ ________ ________ ________ ________ ________ ________ ________ ___________ ________
________ ________ ________ ________ ________ ________ ________ ________ ___________ ________
66
Forest__Wayne__District_Athens_Compartment_96_____Stand__14____
Comments:
FS Type__59______________ Yr. of Origin___1903___ Plot Size_______
Aspect_______ Elevation________ Slope________ Slope Position________
Plot Number___3______ Date_4/8/99_ Crew_DLF/SF__ Page ____ of ___
Crown
Total
Crown
Species Dbh
Vigor
Class
Height
Species Dbh
Vigor
Class
________ ________ ________ ________ ________ ________ ________ ________ ________
Total
Height
________
__837___ __15.8__ ___1____ ____3___ ___84___ ________ ________ ________ ___________ ________
__832___ __20.7__ ___1____ ____3___ ________ ________ ________ ________ ___________ ________
__833___ __25.7__ ___1____ ____3___ ________ ________ ________ ________ ___________ ________
__316___ ___8.1__ ___1____ ____3___ ________ ________ ________ ________ ___________ ________
__802___ __25.9__ ___1____ ____3___ ________ ________ ________ ________ ___________ ________
__806___ __27.0__ ___1____ ____3___ ________ ________ ________ ________ ___________ ________
__400___ ___6.5__ ___1____ ____3___ ________ ________ ________ ________ ___________ ________
__802___ __17.2__ ___1____ ____3___ ________ ________ ________ ________ ___________ ________
__837___ __25.3__ ___1____ ____3___ ________ ________ ________ ________ ___________ ________
__602___ __11.4__ ___1____ ____3___ ________ ________ ________ ________ ___________ ________
________ ________ ________ ________ ________ ________ ________ ________ ___________ ________
________ ________ ________ ________ ________ ________ ________ ________ ___________ ________
________ ________ ________ ________ ________ ________ ________ ________ ___________ ________
________ ________ ________ ________ ________ ________ ________ ________ ___________ ________
________ ________ ________ ________ ________ ________ ________ ________ ___________ ________
________ ________ ________ ________ ________ ________ ________ ________ ___________ ________
67
Forest__Wayne__District_Athens_Compartment_96_____Stand__14____
Comments:
FS Type__59______________ Yr. of Origin___1903___ Plot Size_______
Aspect_______ Elevation________ Slope________ Slope Position________
Plot Number___4______ Date_4/8/99_ Crew_DLF/SF__ Page ____ of ___
Crown
Total
Crown
Species Dbh
Vigor
Class
Height
Species Dbh
Vigor
Class
________ ________ ________ ________ ________ ________ ________ ________ ________
Total
Height
________
__837___ __22.0__ ___2____ ___3____ ________ ________ ________ ________ ___________ ________
__802___ __20.4__ ___1____ ___3____ ________ ________ ________ ________ ___________ ________
__318___ ___5.2__ ___1____ ___5____ ________ ________ ________ ________ ___________ ________
__802___ __17.5__ ___1____ ___3____ ________ ________ ________ ________ ___________ ________
__806___ __23.7__ ___1____ ___3____ ________ ________ ________ ________ ___________ ________
__802___ __15.6__ ___1____ ___3____ ________ ________ ________ ________ ___________ ________
__833___ __20.0__ ___1____ ___3____ ________ ________ ________ ________ ___________ ________
__802___ __18.9__ ___1____ ___3____ ________ ________ ________ ________ ___________ ________
__802___ __22.3__ ___1____ ___3____ ________ ________ ________ ________ ___________ ________
__837___ __24.5__ ___1____ ___3____ ________ ________ ________ ________ ___________ ________
__802___ __23.7__ ___1____ ___3____ ________ ________ ________ ________ ___________ ________
________ ________ ________ ________ ________ ________ ________ ________ ___________ ________
________ ________ ________ ________ ________ ________ ________ ________ ___________ ________
________ ________ ________ ________ ________ ________ ________ ________ ___________ ________
________ ________ ________ ________ ________ ________ ________ ________ ___________ ________
________ ________ ________ ________ ________ ________ ________ ________ ___________ ________
68
Forest__Wayne__District_Athens_Compartment_96_____Stand__14____
Comments:
FS Type__59______________ Yr. of Origin___1903___ Plot Size_______
Aspect_______ Elevation________ Slope________ Slope Position________
Plot Number___5______ Date_4/8/99_ Crew_DLF/SF__ Page ____ of ___
Crown
Total
Crown
Species Dbh
Vigor
Class
Height
Species Dbh
Vigor
Class
________ ________ ________ ________ ________ ________ ________ ________ ________
Total
Height
________
__837___ ___21.3_ ____1___ ___3____ ________ ________ ________ ________ ___________ ________
__802___ ___13.3_ ____1___ ___3____ ________ ________ ________ ________ ___________ ________
__802___ ___28.4_ ____1___ ___3____ ________ ________ ________ ________ ___________ ________
__833___ __22.0__ ____1___ ___3____ ________ ________ ________ ________ ___________ ________
___837__ __19.9__ ___1____ ___3____ ________ ________ ________ ________ ___________ ________
___837__ __16.3__ ____1___ ___3____ ________ ________ ________ ________ ___________ ________
___806__ __19.7__ ____1___ ___3____ ________ ________ ________ ________ ___________ ________
___833__ __18.2__ ____1___ ___3____ ________ ________ ________ ________ ___________ ________
___833__ __26.4__ ____1___ ___3____ ________ ________ ________ ________ ___________ ________
___802__ ___5.4__ ____1___ ___3____ ________ ________ ________ ________ ___________ ________
___833__ __20.0__ ____1___ ___3____ ________ ________ ________ ________ ___________ ________
___802__ __14.0__ ____1___ ___3____ ________ ________ ________ ________ ___________ ________
________ ________ ________ ________ ________ ________ ________ ________ ___________ ________
________ ________ ________ ________ ________ ________ ________ ________ ___________ ________
________ ________ ________ ________ ________ ________ ________ ________ ___________ ________
________ ________ ________ ________ ________ ________ ________ ________ ___________ ________
69
Forest__Wayne__District_Athens_Compartment_96_____Stand__14____
Comments:
FS Type__59______________ Yr. of Origin___1903___ Plot Size_______
Aspect_______ Elevation________ Slope________ Slope Position________
Plot Number___6______ Date_4/8/99_ Crew_DLF/SF__ Page ____ of ___
Crown
Total
Crown
Species Dbh
Vigor
Class
Height
Species Dbh
Vigor
Class
________ ________ ________ ________ ________ ________ ________ ________ ________
Total
Height
________
___316__ ___12.6_ ___1____ ___3____ ________ ________ ________ ________ ___________ ________
___316__ ____9.0_ ___1____ ___4____ ________ ________ ________ ________ ___________ ________
___833__ __24.9__ ___1____ ___3____ ________ ________ ________ ________ ___________ ________
___802__ __19.7__ ___1____ ___3____ ________ ________ ________ ________ ___________ ________
___833__ __11.9__ ___1____ ___3____ ________ ________ ________ ________ ___________ ________
___802__ __23.5__ ___1____ ___3____ ________ ________ ________ ________ ___________ ________
___837__ __27.2__ ___1____ ___3____ ________ ________ ________ ________ ___________ ________
___802__ __18.2__ ___1____ ___3____ ________ ________ ________ ________ ___________ ________
___837__ __13.1__ ___2____ ___3____ ________ ________ ________ ________ ___________ ________
___802__ __14.8__ ___1____ ___3____ ________ ________ ________ ________ ___________ ________
___743__ __12.7__ ___1____ ___3____ ________ ________ ________ ________ ___________ ________
___802__ __19.7__ ___1____ ___3____ ________ ________ ________ ________ ___________ ________
___833__ __22.4__ ___1____ ___3____ ________ ________ ________ ________ ___________ ________
________ ________ ________ ________ ________ ________ ________ ________ ___________ ________
________ ________ ________ ________ ________ ________ ________ ________ ___________ ________
________ ________ ________ ________ ________ ________ ________ ________ ___________ ________
70
Forest__Wayne__District_Athens_Compartment_96_____Stand__14____
Comments:
FS Type__59______________ Yr. of Origin___1903___ Plot Size_______
Aspect_______ Elevation________ Slope________ Slope Position________
Plot Number___7______ Date_4/8/99_ Crew_DLF/SF__ Page ____ of ___
Crown
Total
Crown
Species Dbh
Vigor
Class
Height
Species Dbh
Vigor
Class
________ ________ ________ ________ ________ ________ ________ ________ ________
Total
Height
________
____316_ ____7.9_ ___1____ ___5____ ________ ________ ________ ________ ___________ ________
____837_ __16.9__ ___1____ ___3____ ________ ________ ________ ________ ___________ ________
___833__ __23.4__ ___1____ ___3____ ________ ________ ________ ________ ___________ ________
___806__ __20.6__ ___2____ ___3____ ________ ________ ________ ________ ___________ ________
___806__ __24.6__ ___1____ ___3____ ________ ________ ________ ________ ___________ ________
___400__ ___8.2__ ___1____ ___4____ ________ ________ ________ ________ ___________ ________
___833__ __16.3__ ___2____ ___3____ ________ ________ ________ ________ ___________ ________
___400__ __14.2__ ___1____ ___3____ ________ ________ ________ ________ ___________ ________
___802__ __18.1__ ___1____ ___3____ __97____ ________ ________ ________ ___________ ________
___316__ ___7.0__ ___1____ ___5____ ________ ________ ________ ________ ___________ ________
___743__ __14.5__ ___2____ ___3____ ________ ________ ________ ________ ___________ ________
___806__ __22.3__ ___1____ ___3____ ________ ________ ________ ________ ___________ ________
________ ________ ________ ________ ________ ________ ________ ________ ___________ ________
________ ________ ________ ________ ________ ________ ________ ________ ___________ ________
________ ________ ________ ________ ________ ________ ________ ________ ___________ ________
________ ________ ________ ________ ________ ________ ________ ________ ___________ ________
71
Forest __WAYNE___ District _Athens_ Compartment __96__ Stand _14____ Comments:
FS Type______59__________ Yr. of Origin___103____ Plot Size __F10___
Aspect_______ Elevation________ Slope________ Slope Position________
Plot Number ___9______ Date 4/8/99 Crew _BS&RY___ Page ____ of ____
Crown
Total
Crown
Species Dbh
Vigor
Class
Height
Species Dbh
Vigor
Class
________ ________ ________ ________ ________ ________ ________ ________ ________
Total
Height
________
__802___ __14.8__ ____1___ ___3____ ________ ________ ________ ________ ___________ ________
__802___ __15.6__ ____1___ ___3____ ________ ________ ________ ________ ___________ ________
__802___ __21.0__ ____1___ ___3____ ________ ________ ________ ________ ___________ ________
__802___ __15.6__ ____1___ ___3____ ________ ________ ________ ________ ___________ ________
__833___ __11.9__ ____1___ ___4____ ________ ________ ________ ________ ___________ ________
__802___ __20.9__ ____1___ ___3____ ________ ________ ________ ________ ___________ ________
__802___ __18.7__ ____1___ ___3____ ________ ________ ________ ________ ___________ ________
__833___ __16.7__ ____1___ ___3____ __105ft_
________ ________ ________ ___________ ________
__806___ __14.7__ ____1___ ___3____ ________ ________ ________ ________ ___________ ________
__802___ __16.9__ ____1___ ___3____ ________ ________ ________ ________ ___________ ________
__802___ __19.3__ ____1___ ___3____ ________ ________ ________ ________ ___________ ________
__318___ __5.2___ ____1___ ___5____ ________ ________ ________ ________ ___________ ________
__833___ __22.5__ ____1___ ___2____ ________ ________ ________ ________ ___________ ________
________ ________ _______
_______
________ ________ ________ ________ ___________ ________
________ ________ _______
_______
________ ________ ________ ________ ___________ ________
________ ________ ________ ________ ________ ________ ________ ________ ___________ ________
72
Forest __WAYNE___ District _Athens_ Compartment __96__ Stand _14____ Comments:
FS Type______59__________ Yr. of Origin___103____ Plot Size __F10___
Aspect_______ Elevation________ Slope________ Slope Position________
Plot Number __10______ Date 4/8/99 Crew _BS&RY___ Page ____ of ____
Crown
Total
Crown
Species Dbh
Vigor
Class
Height
Species Dbh
Vigor
Class
________ ________ ________ ________ ________ ________ ________ ________ ________
Total
Height
________
___837__ ___17.8_ ____1___ ___3____ ________ __318___ ___5.6__ ____1___ _____5_____ ________
___400__ ____6.6_ ____1___ ___5____ ________ __318___ ___9.6__ ____1___ _____4_____ ________
___833__ ___19.6_ ____1___ ___3____ ________ ________ ________ ________ ___________ ________
___833__ __16.5__ ____1___ ___3____ ________ ________ ________ ________ ___________ ________
___833__ __18.3__ ____1___ ___2____ ________ ________ ________ ________ ___________ ________
___837__ __20.0__ ____1___ ___3____ ________ ________ ________ ________ ___________ ________
___837__ __20.4__ ____1___ ___3____ ________ ________ ________ ________ ___________ ________
___837__ __16.8__ ____1___ ___3____ ________ ________ ________ ________ ___________ ________
___400__ ___8.1__ ____1___ ___5____ ________ ________ ________ ________ ___________ ________
___833__ __16.0__ ____1___ ___2____ ________ ________ ________ ________ ___________ ________
___833__ __18.3__ ____1___ ___2____ ________ ________ ________ ________ ___________ ________
___802__ __14.8__ ____1___ ___4____ ________ ________ ________ ________ ___________ ________
___833__ __15.8__ ____1___ ___3____ ________ ________ ________ ________ ___________ ________
___833__ __18.6__ ____1___ ___3____ ________ ________ ________ ________ ___________ ________
___802__ __12.4__ ____1___ ___3____ ________ ________ ________ ________ ___________ ________
___802__ __12.9__ ____1___ ___3____ ________ ________ ________ ________ ___________ ________
73
Forest __WAYNE___ District _Athens_ Compartment __96__ Stand _14____ Comments:
FS Type______59__________ Yr. of Origin___103____ Plot Size __F10___
Aspect_______ Elevation________ Slope________ Slope Position________
Plot Number __11______ Date 4/8/99 Crew _BS&RY___ Page ____ of ____
Crown
Total
Crown
Species Dbh
Vigor
Class
Height
Species Dbh
Vigor
Class
________ ________ ________ ________ ________ ________ ________ ________ ________
Total
Height
________
__316___ ____3.0_ ____1___ ___5____ ________ ________ ________ ________ ___________ ________
__833___ __19.4__ ____1___ ___3____ ________ ________ ________ ________ ___________ ________
__602___ __20.1__ ____1___ ___3____ ________ ________ ________ ________ ___________ ________
__802___ __15.7__ ____1___ ___3____ ________ ________ ________ ________ ___________ ________
__802___ __16.0__ ____1___ ___3____ ________ ________ ________ ________ ___________ ________
__802___ __11.4__ ____1___ ___3____ ________ ________ ________ ________ ___________ ________
__802___ __10.5__ ____1___ ___4____ ________ ________ ________ ________ ___________ ________
__802___ __20.1__ ____1___ ___3____ ________ ________ ________ ________ ___________ ________
__802___ __22.4__ ____1___ ___3____ ________ ________ ________ ________ ___________ ________
__318___ ___4.1__ ____1___ ___5____ ________ ________ ________ ________ ___________ ________
__802___ __17.4__ ____1___ ___4____ ________ ________ ________ ________ ___________ ________
__806___ __19.0__ ____1___ ___3____ ________ ________ ________ ________ ___________ ________
__802___ __17.0__ ____2___ ___3____ ________ ________ ________ ________ ___________ ________
__833___ __21.9__ ____1___ ___2____ _103 ‘__
________ ________ ________ ___________ ________
__802___ __12.7__ ____1___ ___4____ ________ ________ ________ ________ ___________ ________
__802___ __20.5__ ____1___ ___3____ ________ ________ ________ ________ ___________ ________
74
Forest __WAYNE___ District _Athens_ Compartment __96__ Stand _14____ Comments:
FS Type______59__________ Yr. of Origin___103____ Plot Size __F10___
Aspect_______ Elevation________ Slope________ Slope Position________
Plot Number __12______ Date 4/8/99 Crew _BS&RY___ Page ____ of ____
Crown
Total
Crown
Species Dbh
Vigor
Class
Height
Species Dbh
Vigor
Class
________ ________ ________ ________ ________ ________ ________ ________ ________
Total
Height
________
__318___ ___10.7_ ____1___ ___4____ ________ ________ ________ ________ ___________ ________
__318___ ____7.1_ ____1___ ___4____ ________ ________ ________ ________ ___________ ________
__802___ ___29.4_ ____1___ ___2____ ________ ________ ________ ________ ___________ ________
__802___ ___22.1_ ____1___ ___3____ ________ ________ ________ ________ ___________ ________
__802___ ___29.4_ ____1___ ___2____ ________ ________ ________ ________ ___________ ________
__318___ __10.8__ ____2___ ___4____ ________ ________ ________ ________ ___________ ________
__802___ __25.0__ ____1___ ___3____ ________ ________ ________ ________ ___________ ________
__833___ __25.4__ ____1___ ___2____ ________ ________ ________ ________ ___________ ________
__400___ __15.1__ ____1___ ___3____ ________ ________ ________ ________ ___________ ________
________ ________ ________ ________ ________ ________ ________ ________ ___________ ________
________ ________ ________ ________ ________ ________ ________ ________ ___________ ________
________ ________ ________ ________ ________ ________ ________ ________ ___________ ________
________ ________ ________ ________ ________ ________ ________ ________ ___________ ________
________ ________ ________ ________ ________ ________ ________ ________ ___________ ________
________ ________ ________ ________ ________ ________ ________ ________ ___________ ________
________ ________ ________ ________ ________ ________ ________ ________ ___________ ________
75
Forest __WAYNE___ District _Athens_ Compartment __96__ Stand _14____ Comments:
FS Type______59__________ Yr. of Origin___103____ Plot Size __F10___
Aspect_______ Elevation________ Slope________ Slope Position________
Plot Number __13______ Date 4/8/99 Crew _BS&RY___ Page ____ of ____
Crown
Total
Crown
Species Dbh
Vigor
Class
Height
Species Dbh
Vigor
Class
________ ________ ________ ________ ________ ________ ________ ________ ________
Total
Height
________
___832__ ___6.2__ ____1___ ___5____ ________ ________ ________ ________ ___________ ________
___802__ __17.6__ ____2___ ___3____ ________ ________ ________ ________ ___________ ________
___837__ __22.6__ ____1___ ___3____ ________ ________ ________ ________ ___________ ________
___832__ __22.2__ ____1___ ___2____ ________ ________ ________ ________ ___________ ________
___802__ __19.7__ ____1___ ___3____ ________ ________ ________ ________ ___________ ________
___802__ __22.2__ ____1___ ___3____ ________ ________ ________ ________ ___________ ________
___802__ __16.7__ ____2___ ___3____ ________ ________ ________ ________ ___________ ________
___802__ __18.2__ ____2___ ___3____ __110 ‘_
________ ________ ________ ___________ ________
___400__ __15.7__ ____1___ ___3____ ________ ________ ________ ________ ___________ ________
___802__ __11.2__ ____2___ ___3____ ________ ________ ________ ________ ___________ ________
___318__ ___4.6__ ____1___ ___5____ ________ ________ ________ ________ ___________ ________
___318__ ___6.6__ ____1___ ___5____ ________ ________ ________ ________ ___________ ________
___621__ __18.5__ ____1___ ___3____ ________ ________ ________ ________ ___________ ________
___832__ __17.0__ ____2___ ___4____ ________ ________ ________ ________ ___________ ________
________ ________ ________ ________ ________ ________ ________ ________ ___________ ________
________ ________ ________ ________ ________ ________ ________ ________ ___________ ________
76
Forest __WAYNE___ District _Athens_ Compartment __96__ Stand _14____ Comments:
FS Type______59__________ Yr. of Origin___103____ Plot Size __F10___
Aspect_______ Elevation________ Slope________ Slope Position________
Plot Number __14______ Date 4/8/99 Crew _BS&RY___ Page ____ of ____
Crown
Total
Crown
Species Dbh
Vigor
Class
Height
Species Dbh
Vigor
Class
________ ________ ________ ________ ________ ________ ________ ________ ________
Total
Height
________
___621__ ___3.6__ ____1___ ___5____ ________ ________ ________ ________ ___________ ________
___318__ __10.2__ ____1___ ___3____ ________ ________ ________ ________ ___________ ________
___318__ __10.1__ ____1___ ___4____ ________ ________ ________ ________ ___________ ________
___318__ __11.3__ ____1___ ___3____ ________ ________ ________ ________ ___________ ________
___318__ __11.1__ ____1___ ___3____ ________ ________ ________ ________ ___________ ________
___318__ __11.1__ ____1___ ___3____ ________ ________ ________ ________ ___________ ________
___318__ __8.6___ ____1___ ___4____ ________ ________ ________ ________ ___________ ________
___837__ __25.4__ ____1___ ___2____ ________ ________ ________ ________ ___________ ________
___837__ __22.0__ ____1___ ___4____ ________ ________ ________ ________ ___________ ________
________ ________ ________ ________ ________ ________ ________ ________ ___________ ________
________ ________ ________ ________ ________ ________ ________ ________ ___________ ________
________ ________ ________ ________ ________ ________ ________ ________ ___________ ________
________ ________ ________ ________ ________ ________ ________ ________ ___________ ________
________ ________ ________ ________ ________ ________ ________ ________ ___________ ________
________ ________ ________ ________ ________ ________ ________ ________ ___________ ________
________ ________ ________ ________ ________ ________ ________ ________ ___________ ________
77
Forest __WAYNE___ District _Athens_ Compartment __96__ Stand _14____ Comments:
FS Type______59__________ Yr. of Origin___103____ Plot Size __F10___
Aspect_______ Elevation________ Slope________ Slope Position________
Plot Number __15______ Date 4/8/99 Crew _BS&RY___ Page ____ of ____
Crown
Total
Crown
Species Dbh
Vigor
Class
Height
Species Dbh
Vigor
Class
________ ________ ________ ________ ________ ________ ________ ________ ________
Total
Height
________
___400__ ___12.3_ ____1___ ___3____ ________ ________ ________ ________ ___________ ________
___621__ ___18.6_ ____1___ ___3____ ________ ________ ________ ________ ___________ ________
___833__ ___12.8_ ____1___ ___3____ __65 ’__
________ ________ ________ ___________ ________
___400__ ___7.8__ ____1___ ___4____ ________ ________ ________ ________ ___________ ________
___711__ ____9.0_ ____1___ ___4____ ________ ________ ________ ________ ___________ ________
___802__ ___14.8_ ____1___ ___3____ ________ ________ ________ ________ ___________ ________
___802__ ____8.7_ ____1___ ___4____ ________ ________ ________ ________ ___________ ________
___999__ ____8.4_ ____2___ ___4____ ________ ________ ________ ________ ___________ ________
___999__ ___11.3_ ____2___ ___4____ ________ ________ ________ ________ ___________ ________
___806__ ___22.5_ ____2___ ___2____ ________ ________ ________ ________ ___________ ________
________ ________ ________ ________ ________ ________ ________ ________ ___________ ________
________ ________ ________ ________ ________ ________ ________ ________ ___________ ________
________ ________ ________ ________ ________ ________ ________ ________ ___________ ________
________ ________ ________ ________ ________ ________ ________ ________ ___________ ________
________ ________ ________ ________ ________ ________ ________ ________ ___________ ________
________ ________ ________ ________ ________ ________ ________ ________ ___________ ________
78
Forest __WAYNE___ District _Athens_ Compartment __96__ Stand _14____ Comments:
FS Type______59__________ Yr. of Origin___103____ Plot Size __F10___
Aspect_______ Elevation________ Slope________ Slope Position________
Plot Number __16______ Date 4/8/99 Crew _BS&RY___ Page ____ of ____
Crown
Total
Crown
Species Dbh
Vigor
Class
Height
Species Dbh
Vigor
Class
________ ________ ________ ________ ________ ________ ________ ________ ________
Total
Height
________
__621___ ___20.5_ ____1___ ___2____ ________ ________ ________ ________ ___________ ________
__693___ ____7.9_ ____1___ ___4____ ________ ________ ________ ________ ___________ ________
__693___ ____7.6_ ____1___ ___4____ ________ ________ ________ ________ ___________ ________
__802___ ____9.1_ ____2___ ___4____ ________ ________ ________ ________ ___________ ________
__743___ ___12.1_ ____2___ ___3____ ________ ________ ________ ________ ___________ ________
__837___ ___28.6_ ____3___ ___3____ ________ ________ ________ ________ ___________ ________
__837___ ___16.4_ ____1___ ___3____ ________ ________ ________ ________ ___________ ________
__693___ ____5.2_ ____3___ ___5____ ________ ________ ________ ________ ___________ ________
__621___ ___14.8_ ____1___ ___2____ ________ ________ ________ ________ ___________ ________
________ ________ ________ ________ ________ ________ ________ ________ ___________ ________
________ ________ ________ ________ ________ ________ ________ ________ ___________ ________
________ ________ ________ ________ ________ ________ ________ ________ ___________ ________
________ ________ ________ ________ ________ ________ ________ ________ ___________ ________
________ ________ ________ ________ ________ ________ ________ ________ ___________ ________
________ ________ ________ ________ ________ ________ ________ ________ ___________ ________
________ ________ ________ ________ ________ ________ ________ ________ ___________ ________
79
Colbert, J.J.; Racin, George. 2001. How to use the Stand-Damage Model:
Version 2.0. (Computer program). Gen. Tech. Rep. NE-281. Newtown Square,
PA: U.S. Department of Agriculture, Forest Service, Northeastern Research
Station. 79 p. (1 computer disk (3 ½ in.)).
The Stand-Damage Model simulates the growth of a forest stand, a spatially
homogeneous collection of trees growing on a site. The model simulates growth
from an initial inventory, user-prescribed management practices, and the effects of
gypsy moth defoliation. Here we provide installation and operating instructions for
Version 2.0.
Keywords: forest growth, simulator, gap model, gypsy moth, defoliation
Printed on Recycled Paper
Headquarters of the Northeastern Research Station is in Newtown Square,
Pennsylvania. Field laboratories are maintained at:
Amherst, Massachusetts, in cooperation with the University of Massachusetts
Burlington, Vermont, in cooperation with the University of Vermont
Delaware, Ohio
Durham, New Hampshire, in cooperation with the University of New Hampshire
Hamden, Connecticut, in cooperation with Yale University
Morgantown, West Virginia, in cooperation with West Virginia University
Parsons, West Virginia
Princeton, West Virginia
Syracuse, New York, in cooperation with the State University of New York,
College of Environmental Sciences and Forestry at Syracuse University
Warren, Pennsylvania
The U. S. Department of Agriculture (USDA) prohibits discrimination in all its programs and
activities on the basis of race, color, national origin, gender, religion, age, disability, political
beliefs, sexual orientation, and marital or family status. (Not all prohibited bases apply to all
programs.) Persons with disabilities who require alternative means for communication of
program information (Braille, large print, audiotape, etc.) should contact the USDA's TARGET
Center at (202)720-2600 (voice and TDD).
To file a complaint of discrimination, write USDA, Director, Office of Civil Rights, Room 326-W,
Whitten Building, 14th and Independence Avenue SW, Washington, DC 20250-9410, or call
(202)720-5964 (voice and TDD). USDA is an equal opportunity provider and employer.
“Ca
ough Resea
“Carr ing for the Land and Se
Serr ving People Thr
Through
Researr ch”


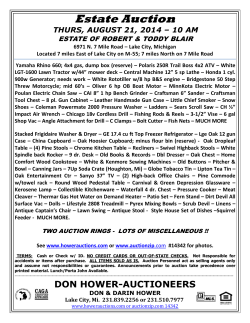


© Copyright 2026