
Recommendations of the European Association of Echocardiography different modalities for different purposes
RECOMMENDATIONS
European Journal of Echocardiography (2011) 12, 339–353
doi:10.1093/ejechocard/jer051
Recommendations of the European Association
of Echocardiography
How to use echo-Doppler in clinical trials:
different modalities for different purposes
Maurizio Galderisi 1*, Michael Y. Henein 2, Jan D’hooge 3, Rosa Sicari 4,
Luigi P. Badano 5, Jose` Luis Zamorano 6, and Jos R.T.C. Roelandt 7, on behalf of the
European Association of Echocardiography
1
Received 3 February 2010; accepted after revision 12 April 2011
The European Association of Echocardiography (EAE) has developed the present recommendations to assist clinical researchers in the
design, implementation, and conduction of echocardiographic protocols for clinical trials and to guarantee their quality. Clinical trials
should be designed and conducted based on the knowledge of the pathophysiology of the clinical condition studied, the technical characteristics of the echo-Doppler modalities, and the variability of the tested parameters. These procedures are important to choose the most
reliable and reproducible techniques and parameters. Quality assurance must be guaranteed by adequate training of peripheral site operators
to obtain optimal echo-Doppler data and by using a core laboratory for accurate and reproducible data analysis.
----------------------------------------------------------------------------------------------------------------------------------------------------------Keywords
Echocardiography † Clinical trials † Cardiac chambers † Cardiac haemodynamics † Native valves †
Prosthetic valves † Quality control
Introduction
Echocardiography is widely used in clinical trials to identify epidemiological features, elucidate pathophysiological mechanisms and
to assess treatment effectiveness. It is important, therefore, to
select the adequate echo-Doppler modality and the parameters
to answer the specific clinical questions for which a clinical trial
is designed and conducted. In 2004, the American Society of Echocardiography (ASE) proposed recommendations for the appropriate use of echocardiography in clinical trials.1 This document was
followed by a joint effort between the ASE and the European
Association of Echocardiography (EAE) to standardize the use of
echo-Doppler for cardiac chamber quantification,2,3 and heart
valve function.4 – 6 The present document aims at providing recommendations regarding the use of standard and advanced echoDoppler modalities and helping trial designers, epidemiologists, and
clinicians to select the most appropriate modality and parameters
to achieve a significant result.
Principles and general remarks
Echocardiography offers several imaging modalities and measurements which can be used in clinical trials. Accuracy (validation
against autopsy and/or reference techniques), reliability in the clinical setting, reproducibility, and prognostic value of a given parameter are the characteristics that must be taken into account
when the specific end-points of the clinical trial are formulated.
In addition, the level of clinical relevance of the chosen echoDoppler parameter should always be considered. In particular,
the variability of changes of a given measurement, even irrespective
of the statistical significance of the average values, should be carefully taken into account. For instance, the clinical relevance of
* Corresponding author. Tel: +39 81 7462145; fax: +39 81 5466152, Email: [email protected]
External Reviewers: Eric Boersma, Department of Cardiology, Erasmus MC, Rotterdam, The Netherlands; Aldo Pietro Maggioni, ANMCO Research Center, Firenze, Italy.
Published on behalf of the European Society of Cardiology. All rights reserved. & The Author 2011. For permissions please email: [email protected]
Downloaded from ejechocard.oxfordjournals.org by guest on May 25, 2011
Echocardiography Laboratory, Cardioangiology with CCU, Department of Clinical and Experimental Medicine, Federico II University Hospital of Naples, Block 1, Via S. Pansini 5,
80131 Naples, Italy; 2Umea University, Sweden; 3University of Leuven, Belgium; 4CNR Pisa, Italy; 5University of Padua, Italy; 6University Clinic San Carlos, Madrid, Spain; and 7Erasmus
University, Rotterdam, the Netherlands
340
ejection fraction (EF) changes after a treatment intervention should
be analysed considering much more the measurement standard
deviations (SDs) than the mere statistical significance of these
changes. A significant change of 1–1.5 points in an average EF
should not be overemphasized when the inter- and intra-observer
variability is higher than 10%.
The recording of echo-Doppler imaging as well as the performance of all the standard measurements obtained with the various
ultrasound modalities [M-mode, two-dimensional (2D), and
Doppler] shall be performed following recognized rules and conventions.3,7 The determination of all the standard echo-Doppler
measurements should be the result of averaging measurements
of at least three heart beats in patients with sinus rhythm and of
averaging measurements derived from 10 cardiac cycles (alternatively, from three non-consecutive beats with cycle lengths
within 10% and 20% of the average heart rate) in patients with
atrial fibrillation (AF).3,7 In order to minimize the variability of
measurements, the use of the same instrumentation is recommended for repeated assessment over time.
There are basically two types of clinical trials in which echocardiography is used. In one type of studies echo-Doppler is used to
identify phenotypes/features in order to define a certain study
population (on the basis of echo-Doppler parameters). The
other type of trial involves echo-Doppler measurements [e.g.
chamber volumes, Left ventricular (LV) mass] as primary or secondary endpoints for efficacy and safety purposes. While echoDoppler parameters are considered acceptable as a proof of
concept of treatment in phase II trials, the use of echo-Doppler
measures as primary endpoints in phase III studies (for drug registration) remains controversial. Indeed, in this particular case it is
necessary to show that a given echo-Doppler parameter is a real
surrogate of clinical events. In this view, the prognostic value is
not sufficient but should be combined with the demonstration
that modifications of the echo-Doppler measurements correspond
(better if proportionally) to changes in outcome events. At
present, regulatory authorities do not consider echo-Doppler parameters as endpoints in pivotal trials designed to prove efficacy of
a drug in several clinical situations such as ischaemic and nonischaemic heart failure, and systemic arterial hypertension.
However, the role of echocardiography in clinical trials has been
changing in the last decade for two main reasons:
† The accuracy of echo-Doppler modalities and measurements
does not refer to autopsy data anymore, but to cardiac magnetic
resonance (CMR). This is now considered the reference
method of non-invasive cardiac imaging. In interventional trials,
CMR allows to reduce the sample size of the study population
because of the smaller variability of its measurements.
† New echo technologies, mainly three-dimensional echocardiography (3DE) and speckle-tracking echocardiography (STE),
have become available and are competitive with CMR in accuracy while being less expensive and more widely available.
Application of echocardiography in trials designed to define a given
study population has remained unchanged over the years. When
using echo-Doppler parameters as inclusion criteria they can be
checked peripherally but an echo core laboratory (ECL) should
be preferred. New ultrasound technologies may provide a better
quantitative approach, especially in trials using parameters as endpoints, and in some cases are mandatory, such as the measurement
of LV volumes by 3DE. However, these new tools may have a high
variability and a core laboratory should always be implemented in
order to reduce it.
Quantification of cardiac
chambers: recommendations for
strategies and measurements to
increase reproducibility
The quantification of cardiac chamber geometry and function3 is
the most frequent application of echo-Doppler in a clinical trial.1
The ASE and EAE have reviewed the technical aspects of acquisition and measurements of cardiac chamber by echo-Doppler
and established normal reference values.3,8
Left ventricular structure and function
LV diameters, wall thickness, and volumes
LV diameters, volumes, and wall thickness have physiopathological, clinical, and prognostic values. LV diameters (at enddiastole and end-systole) and wall thickness (at end-diastole) can
be obtained from correctly aligned M-mode (better temporal
resolution) or direct 2DE (better spatial orientation).3
M-mode-derived LV diameters allow to estimate accurately the
size in ventricles with symmetric geometry and contraction [e.g.
arterial hypertension, aortic stenosis (AS)] and have good reproducibility.9 Comparison of controls and patients in epidemiological
studies often requires the use of gender-specific cut-off values,
and normalization for body surface area (BSA, m2) or height (m),
in order to define normality and the degree of deviation from it.3
The calculation of LV volumes is preferable for the determination
of LV size and becomes imperative in patients with distorted ventricles and/or wall motion abnormalities [coronary artery disease
(CAD) and/or acute myocardial infarction (AMI)].3 Among the
various algorithms used to calculate LV volumes from 2D tomographic views, the biplane method of summation of disks is the
most accurate in abnormally shaped ventricles.3 When compared
with CMR, 2DE LV volumes show underestimation10 and a
higher inter-study variability which is statistically significant for LV
end-systolic volume (13.7–20.3 vs. 4.4 –9.2%, P , 0.001).11 Consequently, a larger study population samples (55–93% larger than
using CMR) is needed to demonstrate significant changes in LV
size. In patients with suboptimal image cavity delineation, contrast
agents can be used intravenously to enhance border delineation,
which increases accuracy and reproducibility of LV volumes.12,13
Semi-automated detection of the LV endocardial borders surface
using 3DE data sets of the left ventricle (Figure 1) is now available
Downloaded from ejechocard.oxfordjournals.org by guest on May 25, 2011
Use of echo-Doppler in clinical
trials: different modalities for
different purposes
M. Galderisi et al.
Echocardiography in clinical trials
341
Figure 1 3DE measurement LV volumes using a semi-automatic endocardial detection algorithm. LV endocardial surface is detected both in
to obtain rapid and accurate volume measurement.14 Test–retest
variability by a separate operator has shown lower underestimation of LV volumes by 3DE than by 2DE when CMR is the reference technique.15,16 Further concordance of 3DE-derived
volumes vs. CMR can be obtained by tracing the endocardium
so that it includes trabeculae in the LV cavity.16
LV mass
LV mass has been calculated by echocardiography in epidemiological studies and treatment trials dealing with systemic arterial hypertension. LV hypertrophy is an independent predictor of morbidity
and mortality in the general population and changes of LV mass
induced by anti-hypertensive treatments have been extensively
studied. While LV mass measurements (indexed for BSA or
height) identify LV hypertrophy, relative wall thickness categorizes
LV geometry (concentric or eccentric).3
All LV mass calculations/measurements (M-mode, 2DE, 3DE)
are based upon the subtraction of LV cavity volume from the
volume enclosed by the LV epicardium (’shell’ volume) to obtain
myocardial volume, which is then multiplied by myocardium
specific weight (1.05 g/mL). LV mass calculations can be made
using linear primary measurements from 2DE-guided M-mode or
direct 2DE views. The ASE formula earlier proposed for estimation
of LV mass3 is considered appropriate for evaluating patients with
normal LV geometry but its accuracy is suboptimal [standard error
of estimate (SEE) from 29 to 97 g, 95% confidence interval (CI) 57
to 190 g] in comparison with post-mortem LV mass.17 This calculation has also a large inter-observer variability (SEE, from 28 to
41 g; 95% CI, 55 to 80 g)17 and a poor inter-study (test –retest)
reproducibility, with SDs of the difference between successive
measurements from 22 to 40 g (95% CI, 45–78 g).17 However,
in the RES trial (Reliability of M-mode Echocardiographic
Studies) (from 16 centres with good expertise for quantitative
echo), the probability of proving a true change in LV mass over
time for a single-reader difference was a change .18% of the
initial value (90% interval of agreement of test–retest
between-observer variability ¼ 226 to 30 g).18 By using anatomically corrected 2DE linear measurements, the reproducibility of LV
mass was similar in the ECL of the multicentre PRESERVE (Prospective Randomized Study Evaluating Regression of Ventricular
Enlargement) trial: between-study LV mass change of +35 g
(18% of the baseline value) and 17 g, to have a likelihood of
being true change .95 and .80%, respectively.9
The 2DE method of LV mass calculation is based on the truncated ellipsoid model and area-length formula,3 relying on myocardial area measurements (¼total area 2 cavity area) at the
mid-papillary levels and excluding the papillary muscles in the
endocardial tracing. It has been validated against post-mortem
measurement. Accuracy (SEE ¼ 31–39 g) and reproducibility are
slightly better than calculation derived from linear measurements.
The calculation of LV mass from 3DE removes geometric
assumptions regarding LV shape and reduces errors due to foreshortened views19,20 (Figure 2). 3DE-derived LV mass has been validated against post-mortem measurement (concordance ¼ 0.92)
and CMR (concordance ¼ 0.91).21 A much lower LV mass underestimation vs. CMR has been found using 3DE rather than
2DE.14,21 The very good reproducibility of LV mass with 3DE
(intra-observer variability ¼ 7–12.5%)20,21 could significantly
reduce sample size to assess LV mass changes when compared
with M-mode/and 2DE and become competitive with CMR.
LV global and regional systolic function
LV global function
The LVEF is the most widely used parameter to assess outcome in
epidemiological studies on heart failure, valvular heart diseases, and
CAD, and to test treatment effects on cardiac function. The
Downloaded from ejechocard.oxfordjournals.org by guest on May 25, 2011
longitudinal and in transversal planes of the left ventricle in order to develop a dynamic model of the left ventricle that is independent of geometrical assumptions about its shape. Quantitative analysis panel and volume-time plot are provided on the right.
342
M. Galderisi et al.
Figure 2 LV mass is measured with 3D by subtracting the LV endocardial volume from the LV epicardial volume (right panel). The myocardial
volume that is obtained (left panel in green) is then multiplied by 1.05 g/mL (myocardial specific weight) to obtain LV mass.
LV regional function
The assessment of regional wall function is often performed by
visual, semiquantitative analysis (scoring) of both inward endocardial motion and myocardial thickening.3 A 17-segment model of
the left ventricle has been proposed by the American Heart
Association in order to obtain a standardized myocardial segmentation and nomenclature for tomographic imaging of the heart that
is shared by all imaging modalities (nuclear cardiology, CMR,
cardiac computed tomography, positron emission tomography,
and coronary angiography). LV segments are identified according
to internal anatomical landmarks of the left ventricle, in the
standard parasternal (long-axis and short-axis at the mitral, papillary, and apical levels), apical (5-, 4-, 3-, and 2-chamber), and subcostal (long-axis and short-axis) views. Each segment can be
visualized in more than a single echocardiographic section and
from different approaches for a more reliable and complete evaluation of wall motion. As a rule, segmental wall motion can be definitely assessed when the endocardial contour is clearly visualized
for at least 50% of its length. The 17-segment model meets the
basic requirements of any reasonable segmentation: it is simple
enough to be employed in practice; it has an anatomical basis; segments can be easily identified on the basis of obvious echocardiographic landmarks; there is good correspondence with the
distribution of coronary arteries; the model has stood the test of
multicentre studies.27 Accuracy and reproducibility of a wall
motion score analysis are dependent on the reader’s experience.
Attempts to quantify segmental LV function have been unsuccessful so far. 2D STE-derived strain rate imaging is very promising28
because of its technical advantages (absence of tethering effects
of adjacent myocardial segments, no angle dependence when compared with TVI). However, experience with this technique is still
limited.
How to increase accuracy of LV measurements
Performance recommendations
In order to increase accuracy and reproducibility of 2DE-derived
LV volume measurements, LV cavity foreshortening must be
avoided by reducing the difference of the LV long axes length in
four- and two-chamber views to ,10%. LV cavity should be
acquired at the lowest possible depth in order to display it on
the screen as large as possible and the same field depth should
be kept for both four- and two-chamber apical views. Larger
than necessary sector width should be avoided in order to preserve spatial resolution.3 In the case of suboptimal visualization
of endocardial borders of more than two LV segments, an i.v. contrast agent can be used to improve endocardial border visualization.12,13 When using 3DE full-volume, consecutive four-beat
ECG-gated subvolumes must be acquired during apnoea and
care should be taken to encompass the entire LV cavity in the
digital data set without artefacts. After the 3D acquisition, nine-
Downloaded from ejechocard.oxfordjournals.org by guest on May 25, 2011
reproducibility of 2DE-derived EF has been tested and both +7%
of inter-observer variability22 and +5% of test–retest reliability17
have been reported. Despite the better accuracy of measurement
of LV end-systolic and end-diastolic volumes by 3DE, there is no
additional value in calculating EF by 3DE because of the constant
underestimation of echo-derived LV end-diastolic and end-systolic
volumes when compared with CMR.14,15
In patients with LV concentric geometry, calculation of mid-wall
fractional shortening, obtainable by mathematical model from LV
diameters and wall thickness at end-diastole and end-systole, has
shown prognostic power and can be used to detect alterations
of LV systolic function which precede the reduction in EF.23
LV longitudinal systolic function is an important component of
LV pump function because it contributes to 60% of the stroke
volume24 and its decrease often precedes EF impairment. LV longitudinal systolic function can be quantified by either measuring systolic excursion of the mitral annulus using M-mode or, more
simply, myocardial systolic velocity of the mitral annulus (septal,
lateral, or average) with pulsed tissue velocity imaging (TVI).25 Agespecific reference values for mitral annulus TVI have been generated.26 Longitudinal deformation imaging derived by 2D STE is a
more reproducible technique to assess LV longitudinal function,
in particular in round-shaped left ventricles where the correct
alignment of the Doppler beam to obtain TVI is difficult.
However, at present reference values for LV longitudinal systolic
function by STE are not available from population studies.
343
Echocardiography in clinical trials
slice display mode is mandatory to ensure optimal imaging of the
entire LV endocardium at each short-axis level and lack of stitching
artefacts.
When performing TVI the longitudinal excursion of the LV wall
must be aligned with the Doppler beam. TVI sample volume
(,5 mm) must be positioned at 1 cm away from the septal or
lateral insertion sites of the mitral leaflets or 1 cm away within
interventricular septum and/or lateral wall myocardium and
adjusted to cover the longitudinal excursion of the mitral
annulus in both systole and diastole. Both gains and filter settings
should be set low. All TVI recordings should be obtained at
sweep speed of 50–100 mm/s, in order to improve temporal resolution and the reproducibility of time interval measurements.
Right ventricular structure and function
Right ventricular (RV) function is an important independent predictor of mortality in heart failure, pulmonary arterial hypertension
(PAH), and several systemic diseases involving the heart. Because
of the complex morphology of the right ventricle no single echo
view or imaging plane will provide enough information to adequately evaluate RV structure and function by M-mode or 2DE.8
RV free wall thickness can be measured in subcostal four-chamber
view. All the methods attempted to estimate RV size (diameters,
areas, and volumes) are unreliable.8,29
Tricuspid annular plane systolic excursion (TAPSE), earlier proposed as an accurate index of RV global systolic function, takes into
account that RV shortening occurs mainly along its longitudinal
axis. TAPSE has been validated against RV EF obtained by radionuclide angiography. It has an important prognostic role in population studies30 and its use in clinical trials can be suggested.
However, TAPSE does not accurately assess changes in RV systolic
function after cardiac surgery. The absence of a post-operative
decrease in 3DE-derived RV EF supports in fact the hypothesis
that geometrical rather than functional RV changes explain
reduction in TAPSE under these circumstances.31 RV longitudinal
function can be quantified also using 2D STE-derived strain or by
simple pulsed TVI which allows measuring myocardial systolic velocity (s’) at the lateral tricuspid annulus.32 Age-specific reference
How to increase reproducibility of RV measurement
Performance recommendations
When acquiring images for measuring RV wall thickness care must
be taken to reduce the gain in order to blunt the signal of the tricuspid tendinous chords and avoid overestimation. M-mode tracings for TAPSE and TVI of tricuspid annulus should be obtained
from the apical approach during held end-expiration. Care shall
be taken to align M-mode or TVI beam along the direction of tricuspid annulus motion.3,8 TVI sample volume should be positioned
at 1 cm from the insertion site of the tricuspid leaflets or 1 cm
away within RV lateral wall and adjusted to cover the longitudinal
excursion of the tricuspid annulus both in systole and diastole.
When acquiring full-volume RV data sets for 3DE quantification
a modified apical approach should be used and consecutive fourbeat ECG-gated subvolumes acquired during breathholding. Care
should be taken for positioning the right ventricle in the centre
of the image sector with optimal visualization of all RV walls and
outflow tract throughout the cardiac cycle. Harmonic imaging
with adjustment of gain, frequency, depth, and sector size for adequate temporal resolution (.20 volumes/s) should be used for
image optimization. Respiratory manoeuvers may be helpful to
improve endocardial border visualization. 2D RV multiplane
display and 3D RV transversal plane during acquisition and nineslice display after acquisition can be used for quality check.
Reading recommendations
RV free wall thickness should be measured at the tricuspid valve
tendinous chords, where variability is lower.3 When measuring
TAPSE, M-mode should be preferred because of higher temporal
resolution.3 The inclusion of RV outflow tract in the data set is
critical for 3DE measurement of RV volumes. When available,
the sensitivity setting of the semiautomated endocardial border
identification software should be set at 0 in order to allow the software to include trabeculae within RV cavity volume.
Left atrial size and function
The left atrium produces neuro-hormones and exerts three
important haemodynamic functions: contractile (15 –30% of LV
filling), reservoir [collection of pulmonary venous flow (PVF)
during ventricular systole] and conduit (blood flow from the left
atrium to the ventricle during early diastole). Left atrial (LA)
dilation occurs in response to impaired LV filling and as a consequence of mitral valve (MV) disease, LV hypertrophy, AF. In all
these conditions, LA volume is a possible surrogate study endpoint
in a clinical trial. The prognostic role of LA volume has also been
Downloaded from ejechocard.oxfordjournals.org by guest on May 25, 2011
Reading recommendations
In order to calculate LV mass by using M-mode or 2DE, the
measurement of chamber dimensions and wall thicknesses by
using direct 2DE measurements in the parasternal long-axis view
must be preferred. This method prevents incorrect alignment of
the M-mode cursor which should be perpendicular to both the
septum and LV posterior wall.3 Novel, rapid 3DE LV analysis can
be performed by analytic software which provides automatic
slicing of LV full-volume data set, manual alignment of the LV
central longitudinal axis, LV reference point identification, automated identification of endocardial borders at both end-diastole
and end-systole and final data set display. Systematic border verification and manual correction of automated or semiautomated
border detection are often required and recommended to
increase accuracy of 3DE-derived LV volume measurements.16
Manual tracing of the endocardial border should be performed
outwards the black –white interface in order to include endocardial trabeculations.15
values of RV TVI have been generated33 and its prognostic value
has been demonstrated.34 Recently, semi-automated detection of
the RV endocardial surface and volume measurements from 3DE
has been validated against CMR,35 and has been found to be accurate and reproducible for assessing RV EF.36 This is due to the
inclusion of significant important volumes of the RV inflow and
outflow tracts, which are missed by 2DE measurements.29 The
possibility to assess RV volumes and EF by 3DE could potentially
stimulate clinical research about the prognostic role of the right
ventricle in several heart diseases and the effects of treatments
on RV structure and function.
344
well demonstrated.37 In patients in sinus rhythm, with no history of
atrial arrhythmias or heart valve disease, LA volume reflects LV
diastolic function and LA pressure.37
LA volume
LA size changes occur in all directions and, similarly to the left ventricle, a single dimension (i.e. LA antero-posterior diameter),
despite being used for a long time and provided of a prognostic
value, is not an accurate representation of actual LA size.3 The
2DE calculation of LA volume reflects better LA remodelling and
has been validated against cine-computerized tomography.3 LA
maximal volume (at LV end-systole) can be measured by using
either the area-length or the disc summation method, without significant difference between the two methods.3 Reference values of
LA volume and cut-off values to categorize LA enlargement (mild,
moderate, severe) have been established.3 Although 2D-derived
LA volumes show a systematic underestimation vs. 3DE,38,39 and
CMR40 they have satisfactory intra- and inter-observer variability
(mean difference +SD ¼ 6 + 6 mL and 8 + 8 mL, respectively)41
and can be used in clinical trials.
Reading recommendations
When performing LA planimetry for LA volume calculation, the
confluences of the pulmonary veins and LA appendage must be
excluded from the LA cavity, and the mitral plane drawn as a
straight line connecting lateral and septal sides of the mitral
annulus.
fibres] but all the attempts to accurately measure it by echocardiography have been disappointing.42
Both colour TVI and 2D STE measures of myocardial deformation provide relatively load-independent indices of LV contractility.43,44 However, colour TVI-derived strain rate imaging is
limited by its angle dependency, whereas 2D STE is
angle-independent and enables the estimation of longitudinal,
radial, and circumferential percent deformation (strain, %) and
deformation rate (strain rate, s21) as well as of LV twisting. Both
global longitudinal and circumferential strain have been validated
against cardiac CMR in selected populations44 and are highly feasible and reproducible.45 Global circumferential strain is a powerful
predictor of cardiac events and provides prognostic information
additional to EF in acute heart failure.46 Strain rate appears to be
the most robust parameter of myocardial contractility (due to its
strong relationship with invasive myocardial elastance)47 but is
less reliable and reproducible than strain, whose afterload dependency has been conversely demonstrated.48 Global longitudinal
strain is a more robust parameters than radial and circumferential
strain when different cardiac ultrasound systems are used for
examination.49 The use of STE (in particular longitudinal strain)
could be encouraged in clinical trials.
Performance recommendations
Optimal performance of 2DE STE requires the recording of three
consecutive cardiac cycles of good quality, at high frame rate
(40– 80 frames/s) without dual focusing.
Reading recommendations
The off-line assessment of 2D strain is semi-automatic, but when
automated tracking does not fit with the visual impression of
wall motion, the endocardial borders tracing must be manually
adjusted. Most of the wall thickness must be incorporated in the
region of interest while avoiding to include the epicardium. Endsystole is defined by the aortic valve closure in the apical long-axis
view, and therefore this view has always to be analysed first.
Diastolic function and LV filling pressure
Quantification of cardiac
haemodynamics:
recommendations for
measurements and strategies to
increase reproducibility
Contractility and afterload
Global LV pump function results from the interaction of myocardial contractility, preload (end-diastolic myocardial fibre length),
heart rate, and afterload. The ejection phase indices (EF, stroke
volume, cardiac output) cannot determine the relative contribution of each of these variables to LV function. Load-dependency
of these parameters may induce inaccurate estimation of intrinsic
contractility. The most physiological measurement of LV afterload
is end-systolic stress (ESS) [longitudinal (meridional) ESS for longitudinal endocardial fibres and circumferential ESS for mid-wall
A comprehensive evaluation of LV diastolic function cannot be
performed solely based on Doppler-derived transmitral inflow patterns (E and A peak velocity, E/A ratio, E velocity deceleration
time), which are sensitive to loading conditions.50 This precludes
the distinction between normal and pseudonormal patterns resulting from elevated LV filling pressure (LVFP).50 In the clinical setting,
the non-invasive estimation of increased LVFP can be done in
different ways. They include: the Valsalva manoeuver applied to
transmitral filling (E/A ratio fall ≥50%); the combination of LV
filling with PVF (pulmonary vein atrial reverse velocity duration –
transmitral A duration [Ar–A duration] ≥30 ms); the combination
of LV filling with colour M-mode-derived velocity flow propagation
[(Vp) (E/Vp ratio) ≥2.5]7 or with pulsed TVI-derived early diastolic
velocity (e’) of the mitral annulus (E/e’ ratio).7 The E/e’ ratio ≥15 if
using e’ of septal site of the mitral annulus or ≥13 if using average
values of septal and lateral site indicates accurately increased
LVFP.7,51 Since LA volume reflects the cumulative effect of LVFP
over time,7 the detection of LA dilation (LA volume ≥34 mL/m2)
Downloaded from ejechocard.oxfordjournals.org by guest on May 25, 2011
How to increase accuracy and reproducibility of LA
measurement
Performance recommendations
While recording apical views for computing LA volume, care
should be taken to maximize base and length of the LA cavity
and to avoid cavity foreshortening. In order to check the accuracy
of recording, the difference of the two lengths (from the mid-line
of the plane of mitral annulus to the opposite superior part of the
LA cavity) in apical four-chamber and two-chamber views should
be ,5 mm.
M. Galderisi et al.
Echocardiography in clinical trials
allows to make a diagnosis when E/e’ ratio falls within the grey
zone (range ¼ 8– 15 when using average e’).
Feasibility of Doppler measurements
Excellent-quality transmitral flow patterns can be recorded in most
patients (94% feasibility), Valsalva manoeuver can be adequately
performed in 61% of patients,51 PVF signals in 73% of patients,
and pulsed TVI in 97% of the patients.51
How to increase reproducibility of Doppler indices of LV
diastolic function
Performance recommendations
The pulsed Doppler sample volume of LV transmitral inflow should
be placed at the tips of mitral leaflets where the velocity amplitude
is maximal.
Reading recommendations
Care is needed when measuring E velocity deceleration time in
patients with sinus tachycardia (overlapping of E and A velocity),
by prolonging the slope of E velocity into the A waveform to baseline. For the assessment of global LV diastolic function, it is recommended to measure pulsed TVI signal at both septal and
lateral sites of the mitral annulus and possibly use average values
of e’ velocity to calculate E/e’ ratio.
Pulmonary arterial pressure and right
atrial pressure
Pulmonary arterial pressure reflects underlying pulmonary vascular
disease or the response of the pulmonary vascular tree to elevated
pressures in the left heart (e.g. left heart failure, valvular heart diseases). Echo-Doppler is commonly used for assessment of pulmonary arterial pressure and it is sufficiently sensitive to clinical
changes. Of course, standardization is needed to include Dopplerecho measurements as endpoints in clinical trials on PAH.59
Estimation of right-sided pressures
In the absence of pulmonary valvular stenosis, the Doppler estimation of pulmonary arterial systolic pressures (PAPs) has gained
importance over standard right-heart catheterization. PAPs can
be derived from continuous wave (CW) Doppler sampling of tricuspid regurgitation (TR) jet, using the modified Bernoulli
equation: PAPs ¼ 4 V2TR + RAP in which VTR, peak velocity of TR
jet obtained by CW Doppler and RAP, mean right atrial pressure.60
RAP can be estimated by recording the diameter of the inferior
vena cava while the patient performs a ‘sniff’ according to standardized methods.60 The non-invasive estimation of PAPs has been
validated against right-heart catheterization, has a recognized prognostic value in various cardiac diseases, and has been applied to
assess drug’s effects in randomized, placebo-controlled trials. The
feasibility of this method is limited in certain settings (only 30%
success rate in obstructive pulmonary disease).60 RV outflow
tract velocity systolic time intervals do not provide a reliable
alternative since their 95% CI of the estimated PAPs are too
wide to be recommended.60 A further method utilizes the duration
of TVI-derived tricuspid annular relaxation time which, normally
absent, progressively increases with increasing PAPs61,62 (values
≥40 ms have a negative predictive value for PAH ¼ 100%62).
This method is feasible in all patients and its use can be considered
suitable for clinical trials when TR is not detectable or spectral
Doppler cannot be interpreted adequately.
How to increase the accuracy of estimation of right-sided
pressures
Performance recommendations
When recording colour-guided CW Doppler of TR, the apical
four-chamber view should be optimized in order to obtain the
best alignment of the Doppler beam to the regurgitant jet direction
and avoid underestimation of the peak velocity systolic gradient.
Contrast agents can be used to enhance TR signal when it is
faint. Correct alignment of Doppler beam is also needed when
recording TVI of the tricuspid annulus. All Doppler recordings,
including TVI, should be obtained at held end-expiration.
Reading recommendations
When measuring CW Doppler-derived TR signal, only welldefined envelopes should be used for quantifying the regurgitation
peak velocity.
Quantification of native and
prosthetic valves:
recommendations for
measurements and strategies to
increase reproducibility
Recommendations for the use of echo-Doppler to assess valve
disease have been proposed by ASE and EAE4 – 6,63,64. Morphological characteristics (leaflet thickness and mobility, subvalvular apparatus status, presence and extent of calcifications) are
semi-quantitatively analysed and their use cannot be recommended in clinical trials unless for a screening of a study
group. Endpoints including changes in LV volumes and mass, EF,
and Doppler-derived diastolic indices are suitable for trials studying
patients in pre- to post-operative periods or during follow-up.
Heart rate and blood pressure at the time of the echo examination
Downloaded from ejechocard.oxfordjournals.org by guest on May 25, 2011
Reproducibility of Doppler measurements
The intra- and inter-observer reproducibility of transmitral
Doppler is excellent in both cohorts52,53 and population-based
samples,54 and better for flow velocities (intra- and inter-observer
correlations ≥0.89) than for time intervals (inter-observer
correlations ¼ 0.59–0.96).54 Test–retest (biological) reproducibility, including pulsed TVI, is equally good in single centre (80% CI of
absolute between-study differences ranged from 20.11 to +0.19
for E/A ratio at tips of MV)52 and in multicentre settings.53 The
observer reproducibility (limits of agreement: +11 to + 45%)55
and the test–retest reproducibility of PVF (intra- and interobserver repeatability coefficients of Ar–A duration ¼ 50 and
57 ms, respectively)56 are not good enough for being used in clinical trials. The feasibility and reproducibility of E/e’ ratio should
direct the choice of this index in estimating LVFP in clinical trials.
Age-specific normal values of pulsed TVI have been generated26
and E/e’ ratio is a powerful predictor of survival.57,58
345
346
must be recorded because they may influence the parameters of
severity of valve stenosis and regurgitation. In general, it is important to recommend main criteria for severity of valve disease which
can become selection criteria in some clinical trials and/or endpoints (¼ reduction in severity degree) for trialists. The consistency of the different echo-Doppler parameters for quantifying
the degree of valve regurgitation and stenosis varies with the
type of lesion.
Native valves
Reproducibility
The PISA method is relatively independent of the operator experience and acceptably reproducible: intra-observer variability of PISA
radius ¼ 0.2 + 13.5% (2.8 + 13.3%), inter-observer variability ¼
0.1 + 13.8% (1.7 + 18.0%) for an aliasing velocity of
27 –29 cm/s (41–43 cm/s).65 Changes ≥2.7 mm of PISA radius
would have to occur to achieve 95% CI of a true change in MR
severity.65 Vena contracta has a good reproducibility, which can
be further improved by 3DE colour Doppler.66
Mitral valve stenosis
2D planimetry of the mitral orifice has a very good correlation with
anatomical mitral volume flow (MVA).4 Its feasibility is, however,
limited in the presence of a poor acoustic window and/or distortion of the MV. The latter may be obviated by 3DE-guided MV
orifice transverse plane recordings.4 The overall assessment of
mitral stenosis [by transesophageal echocardiography (TEE)
when needed] should include components of MV apparatus
(Wilkins or Cormier scores). Among functional indices,4 PISA
(MVA/CW Doppler-derived maximum velocity of diastolic flow)
has limited accuracy because of difficult measurement of the convergence hemisphere. CW Doppler-derived pressure half time
(PHT) time interval (ms) occurring between maximal early diastolic gradient and time point when the gradient is half of initial
value (MVA ¼ 220/PHT)—does not require assumptions about
inlet geometry and flow rate, is easily performable, correlates
well with invasive MVA but is influenced by confounders (early
diastolic mitral pressure gradient, LA compliance, LV diastolic function). Continuity equation cannot be used in case of AF or concomitant aortic regurgitation (AR) or MR. CW Doppler-derived
transmitral pressure gradient, simple and reliable, has good correlation with invasive measurements but is limited by factors influencing transmitral flow rate (heart rate, cardiac output, associated
MR). The ideal approach for clinical trials is to integrate planimetry
(better by 3DE) with functional parameters. Further measurements include LA volume, systolic pulmonary pressure, RV function, and degree of functional TR.
Reproducibility
The reproducibility of MVA planimetry, low by 2DE, is greatly
improved by 3DE, which allows adequate MV reconstruction in
the majority of the patients (from 70 to 78% in relation with the
quality of the acoustic window) because of improved alignment
with the orifice and its perpendicular orientation to the mitral stenosis funnel.67 PHT has high variability, particularly when gradient
and compliance are influenced by important and abrupt changes in
transvalvular flow (after balloon commissurotomy, in concomitance with AR). The reproducibility of continuity equation is hampered by the number of measurements increasing the impact of
errors.
Aortic valve regurgitation
The quantification of AR remains challenging.5 Colour flow jet size is
unreliable. Vena contracta (severe AR ¼ width .6 mm) is simple
and highly feasible but limited in the presence of multiple jets or
jets with irregular shapes. EROA (severe AR ¼ EROA ≥0.4 cm2
and regurgitant volume ≥60 mL) by PISA has lower feasibility
than in MR due to difficult measurement of flow convergence
radius. PHT of AR by CW Doppler (severe AR ¼ PHT ,200 ms)
has limited accuracy because of the impact of confounding
factors such as degree of LV diastolic pressure and chronic LV
adaptation to volume overload. The best choice can be obtained
by combining multiple Doppler methods, particularly when the
jet is eccentric.68 Additional evaluation of LV size and function
can be used because it help to stratify the prognosis.
Reproducibility
The continuous change of the area during diastole and eccentric
jets can increase the variability of colour Doppler-based measurements of AR. Also the technical setting of the machines (affecting
the jet area and thickness of vena contracta) is an important source
of variability and it should be noted to be kept constant in serial
studies.
Aortic valve stenosis
Aortic valve area (AVA) planimetry with 2DE is often unreliable or
inaccurate (calcification shadows and reverberation limit the orifice
identification). Doppler is therefore the standard mean to assess
AS severity. Doppler parameters include jet peak velocity, mean
transaortic gradient, and effective AVA calculated using the continuity equation.4 AS jet velocity across the valve (severe AS ¼ peak
jet velocity .4 m/s) and mean transaortic pressure gradient
(severe AS ≥ 40 mmHg) are accurate but dependent on the
flow through the valve. In studies comparing native aortic valve
velocities with valve prostheses, peak velocities should be the preferred option. AVA by continuity equation requires three measurements: AS jet velocity time integral (VTI) by CW Doppler,
Downloaded from ejechocard.oxfordjournals.org by guest on May 25, 2011
Mitral regurgitation
Several methods are used to assess mitral regurgitation (MR)
severity.6,64 Vena Contracta (severe MR ¼ width ≥7 mm) is accurate and reproducible for central and eccentric jets although it
changes with haemodynamics. Effective regurgitant orifice area
(EROA) (severe MR ≥0.4 cm2) calculated by the PISA method is
reliable although subject to geometric complexities of the regurgitant orifice (more accurate for central jets and for circular orifices).
Regurgitant volume and regurgitant fraction (a regurgitant volume of
40 mL is consistent with a regurgitant fraction of 40% and with a
regurgitant area of 40 mm2) are limited by the degree of LA
pressure and the jet direction (eccentric jets tend to appear
smaller than central jets). The ideal approach is to integrate multiple parameters. Quantitation of LA volume should also be
obtained in order to provide clues to MR severity and determine
necessity and timing of surgery.
M. Galderisi et al.
347
Echocardiography in clinical trials
LV outflow tract (LVOT) diameter for calculation of a crosssectional area, which is assumed to be circular, and LVOT time velocity integral of systolic velocity recorded with PW Doppler. The
use of continuity equation should be recommended since it is clinically validated, reliable for decision-making and much more predictive of outcome than the anatomic AVA. Additional, prognostically
validated, parameters include extent of leaflet calcification,4,69 rate
of increase in transaortic velocity and of decrease of AVA over
time,69 LV end-systolic diameter, and degree of LV hypertrophy.4
When compared with invasively determined AVA, AVA calculated
by including 3DE stroke volume in continuity equation is more
accurate and reproducible than the conventional continuity
equation based on measurement of LVOT diameter.70
Reproducibility
The reproducibility of continuity equation is limited because of the
variability of its three components. AS jet and velocity time integral
have a very low intra- and inter-observer variability (3 –4%),
while the measurement variability for LVOT diameter is 5–8%, a
range that, when squared for the calculation of cross-sectional
area, becomes the greatest potential source of error.4
Reading recommendations
When measuring CW Doppler-derived velocities, only welldefined envelopes should be used for quantifying velocities.
LVOT diameter should be measured at early systole by the
Prosthetic valves
In addition to thorough 2DE assessment, Doppler is the only suitable technique for providing objective and reproducible measurements of prosthetic valves haemodynamics.71 The general
principles for evaluating prosthetic valve function are similar to
those of native valve stenosis. All valve prostheses are more or
less inherently stenotic and higher velocities and pressure gradients
are recorded when compared with native valves.71 All mechanical
valves have a functional mild leakage to avoid thrombosis and
occluder stuck. Colour Doppler may show the regurgitant jet
but has limited accuracy for quantifying it. Therefore, CW
Doppler, combined with other markers, e.g. LV volumes and function, should be the right choice to assess the severity of regurgitation. TEE is frequently needed for assessing prosthetic valves,
particularly mitral prostheses.71
Similar to native valves, the parameters recommended for an
aortic prosthesis include mean transvalvular gradient, peak transvalvular velocity, peak LV outflow velocity and their ratio
(¼Doppler velocity index), and the effective orifice area (EOA)
derived by the continuity equation as well as the presence and
severity of prosthetic and para-prosthetic regurgitations.71 The
estimation of the pressure gradient always requires the application
of the complete Bernoulli equation since the valve has no restrictive orifice and trans-prosthetic velocity is not so high as in native
AS.71
The parameters recommended for mitral prostheses are peak
transvalvular velocity, velocity-time integral of transvalvular velocity,
mean transvalvular gradient, and the extent of prosthetic/paraprosthetic regurgitations.71 Calculation of EOA by PHT is not valid
in normofunctioning mitral prostheses because the orifice is no
longer stenotic and PHT depends on heart rate, stroke volume, LV
and LA compliance, and initial LA pressure. In clinical trials on prosthetic valves additional echo endpoints should include changes in LV
mass, systolic, and diastolic function.71
How to increase the reproducibility of measurements of
prosthetic valve function
The same recommendations for native valve assessment are valid
for prosthetic valves. Multiple probe angulations and the use of
off-axis views may be needed for optimal imaging and Doppler
recording. To avoid under- or over-estimation of haemodynamic
changes in serial examinations, heart rate, and cardiac rhythm
have to be recorded, in particular for mitral and tricuspid prostheses, as the mean gradient is dependent on the diastolic filling
period. The use of the same echo machine for serial studies is
needed to assess haemodynamic changes of prostethic valves
over time.
Quality control in clinical trials
Echo-Doppler parameters, which are accurate and reproducible,
can be considered to support or refute the hypothesis/objective
for which a trial has been designed. This also allows to reduce
the sample size needed of patients included in trial.
Downloaded from ejechocard.oxfordjournals.org by guest on May 25, 2011
How to increase the reproducibility of echo-Doppler
measurements of valvular diseases
Performance recommendations
Colour flow of valve regurgitation must be recorded by high resolution, zoomed view of supravalvular region for visualizing the
three components of regurgitant jets: flow convergence, vena contracta, and jet regurgitant area. The vena contracta must be imaged
for the largest obtainable proximal jet size and the operator should
search in multiple planes perpendicular to the commissural line. To
estimate the extent of regurgitant jets, the colour scale shall be set
at 50 –60 cm/s or at the highest limit allowed by the machine and
the colour gain set step by step just below the threshold of colour
noise artefacts. In the PISA method, the aliasing velocity has to be
set between 15 and 40 cm/s. To obtain accurate transvalvular gradients, great care should be put to align the Doppler sound beam
as parallel as possible to the flow (guided by both 2DE image and
sound). To avoid underestimation of measured velocities, multiple
approaches should be routinely attempted (apical, right parasternal, and suprasternal) to ensure recording of the maximal AS jet
velocity. LVOT view has to be recorded in the zoom mode, avoiding foreshortening of the structure. LVOT velocity tracing should
be recorded immediately below the aortic annulus by adjusting
the ultrasound beam and choosing the acoustic window that provides the highest velocity signal.4 The 2DE recordings for valve planimetry should be obtained from zoomed images using cine-loop
mode, in order to select the proper timing in the cardiac cycle
and better delineate valve orifice and leaflet tips. The gain setting
should be adjusted to visualize the whole contour of the valve
orifice in order to reduce technique variability. In serial studies,
the same machine and main machine settings should be maintained.
leading edge to leading edge method3 at the hinge point of
aortic cusps.
348
Quality control is of paramount importance to reduce variability
among laboratories and operators and must be run by using appropriate procedures for data acquisition, storage, and interpretation.
Several approaches involving investigators/operators equipment
and training can be used. The role of ECLs is very important in
controlling the quality and hence limiting the inter- and
intra-observer variability of peripheral centres involved in the
study. Table 1 summarizes the 10 main points to ensure quality
control in clinical trials.
Step 1: Definition of the imaging protocol
Table 1 Top-ten procedures recommended from
EAE for quality control of clinical trials.
1. To choose the ECLs on the basis of the head and team experience in
both ultrasound technique and clinical trial planning and
performance
2. To involve the head and the ECLs in the study design
3. To standardize ‘hands on’ training of echocardiographers either
onsite or at centralized meeting before starting the clinical trial
4. To monitor echocardiographers of the peripheral sites for technical
quality (acquisition, storage, and processing) of their echo studies
5. To overview quality of the study acquisition at peripheral sites with
the head of the core laboratory
6. To minimize the number of readers in ECLs in order to improve
reproducibility of measurements
7. To check the reader variability of ECLs by periodical joint reading
sessions with the head
8. To maintain an optimal level of communication between ECLs and
peripheral sites throughout the time course of the study
9. To maintain an optimal level of communication between ECLs and
both study sponsor and steering committee throughout the time
course of the study
10. To involve head and investigators of both ECLs and peripheral sites
in data analysis, presentation, and publication
ECLs, Echocardiographic core laboratories.
patient and study costs; (ii) it will prevent unreliable measurements
from being entered in the central database of the study, thereby
preserving the value of the entire study.
Step 2: Quality assurance
Quality assurance (QA) is needed to minimize the imaging acquisition or reading variability existing in any trial using echo. Adherence to an accurate QA plan will reduce the amount of missing
data and provides confidence in the final results of a given clinical
trial. QA should be carried out at two levels: (i) at the clinical peripheral sites where data are collected; (ii) at the ECLs where data
are analysed.
The selection of peripheral centres is important and could be
also performed on the basis of EAE accreditation standards.72
Each peripheral centre should follow the recommended standard operational procedures in terms of data imaging acquisition
(modalities and operational modes, scanner settings, data sets to
be recorded), data storage (data format, procedure set to transfer recordings and data to the ECLs), and data processing (software tools used to extract any given measurement and
parameter). After case registration in the database, a studyspecific ID should be generated in order to anonymize the
images (de-identification procedure). For this anonymization,
dedicated software should be developed implementing basic
standard DICOM operations.
The imaging study protocol might contain centre-specific items
since some aspects may depend on local logistics or technology
and specify the minimum requirements for the echo machines
used for the trial. Yearly evaluation of electronic calibration of
the machines and transducer decay should be performed since it
may be sources of measurement errors.
The ECLs should verify the data obtained in the peripheral
centres in terms of data format, completeness, adherence to the
acquisition protocol, and data quality. All data will be subsequently
analysed and recommendations will be made to the peripheral
centres on how their acquisitions might be optimized. If such recommendations have to be made, a new round of data acquisition/
analysis will be started until the final formal approval by ECLs. The
facilities of ECLs will also need validation to guarantee appropriate
extraction of echo parameters and data sent from the different
centres should be analysed three times in order to determine
the reproducibility of the measurement. The values obtained by
this procedure will be compared with what has been reported in
the specific literature. If reproducibility is significantly lower from
previously published values, the reasons for discrepancies should
be sought (e.g. use of different software tools, different acquisition
protocols, different reading procedure, insufficient training of the
analyser), and solved.
Step 3: Echo core laboratories
implementation
ECLs distribution and implementation is critical for the use of
echocardiography in clinical trials. Figure 3 summarizes the ECLs
based system for the QA process. The role of ECLs is highly variable in relation to the specific use of echocardiography in a trial,
mainly depending on whether the echo-Doppler data will
Downloaded from ejechocard.oxfordjournals.org by guest on May 25, 2011
Echo-Doppler parameters to be included in a study protocol will
be chosen taking into account their accuracy (mainly by validation
with a reference imaging modality such as CMR), reliability,
reading variability (intra- and inter-observer), biological variability
(day-to-day or test–retest) and instrumentation variability
(machine-to-machine).
Strict criteria for echo imaging acquisition (e.g. echo views,
machine settings), review and storage (e.g. CD-ROM or DVD,
non-DICOM format) at the participating peripheral centres, data
preparation and collection, labelling, and missing data documentation should be clearly stated by the ECLs in an image review
chart in order to ensure standardization and followed by each peripheral centre participating in the study.
Before starting the trial, it is important to validate the quality of
recordings obtained by each peripheral centre. This is fundamental
for the following reasons: (i) it will spare researchers from collecting data that cannot be utilized properly due to poor image quality
or improper data acquisition, adding an unnecessary burden to
M. Galderisi et al.
349
Echocardiography in clinical trials
The personnel of the ECLs should include a head, assisted by a
project leader able to ensure reading quality, by a team of readers,
and operators who are responsible for the data handling and
whenever possible, of biostatistics (employed on sample size calculation, statistical methods, and analyses). All personnel should have
considerable experience in research projects. Both the head and
the project leader are expected to interact closely with the
sponsor and other collaborators such as the steering committee
and data coordinators of peripheral centres involved in the trial.
While general features of ECLs need to be guaranteed, the structural organization of each core laboratory should be maximally
flexible, depending on the specific characteristics of the clinical
trial.
ECLs should be available in showing its own work efficiency,
including procedure, processes, equipment and calibration of echocardiographic instrumentation, staff member training and accuracy
of echo-Doppler measurement and data interpretation, according
to recently published ASE recommendations.74
Figure 3 Structure and workflow of ECLs based quality assurance system.
Figure 4 describes the flow diagram to select the optimal echoDoppler modality and measurement for a specific trial. Table 2
summarizes the main characteristics (validation, feasibility, reproducibility, prognostic value) of the main echo-Doppler parameters
and Table 3 describes the primary and secondary echo-Doppler
EAE recommended endpoints for specific clinical trials.
Arterial hypertension
Studies on regression of LV hypertrophy should involve echo laboratories that are very confident with 3DE. When compared with
2DE, 3DE calculation of LV mass has similar reproducibility to
CMR and can be used to reduce sample size and trial cost. The
assessment of LV diastolic function in hypertensive trials should
involve at least the combination of parameters of LV filling
pattern (E/A ratio and E velocity deceleration time), pulsed TVIderived measurements of the mitral annulus, and LA volume
calculation.
Heart failure
Over the past 30 years, ultrasound imaging has been used for participant selection in several multicenter trials, reduced EF and LV
enlargement being the primary entry criteria to assess subsequent
outcome. However, only few studies have evaluated LV remodelling during the follow-up period. Based on modern knowledge of
echo-Doppler indices, clinical trials dealing with heart failure
should combine LV volume and EF calculation with the quantification of more subtle parameters, e.g. pulsed TVI-derived systolic
velocities of the mitral annulus or 2D STE-derived longitudinal
strain. In recent years some trials have also used echocardiography
to assess patients with heart failure with preserved (¼normal) EF.
These patients can have some degree of LV diastolic dysfunction.
When planning studies on heart failure with preserved EF,
normal EF should be appropriately classified (values at least
Downloaded from ejechocard.oxfordjournals.org by guest on May 25, 2011
contribute or not to a primary or secondary efficacy or safety endpoint. In any case, the core laboratory will have the responsibility
of establishing the imaging protocol and standardizing image acquisition processes and analysis (e.g. definition of suboptimal or
unreadable echo imaging, choice of measurements and parameters,
decisions regarding number of cardiac cycles to be averaged for
measurements) by a proper review chart, organizing and performing education and training programmes of both echocardiographers of the peripheral centres involved in the data acquisition
and internal readers of the same core laboratory, as well as managing images and data. It is important for the ECLs to interact with
the trial leadership and steering committee and to be fully involved
in the study design, in order to optimize technical advantages and
limits of a given tool and/or parameter and participate in the choice
of the most appropriate and reproducible measurements, in the
selection of patients and eligibility criteria for study entry, in the
sample size calculations and in the type of blinding (e.g. site,
time) if any. The ECLs should encourage and assist transmissions
of studies and monitor potential deficiencies in data acquisition
and analysis.
The main goal of ECLs is to ensure the best data accuracy by reducing measurement variability. This will prevent any limit resulting
from the reading in peripheral centres, and in particular due to insufficient expertise in that required for a specific trial. In this view, the
central reading of ECLs should involve a practical minimum number
of readers with excellent experience, unlike in the peripheral
centres where the readers are multiple and can have unverified
experience. To further minimize reader variability, inter-reader
variability of ECLs should be monitored inside periodically.
Obviously, the ECLs cannot eradicate all the sources of variability
but it can ensure that acquisition and measurement errors are controlled and do not occur randomly.73 ECLs will also control and
guarantee the data protection in the peripheral centres.
Application of echocardiography
in clinical trials: recommendations
for appropriate use
350
M. Galderisi et al.
Table 2 Characteristics of the main echo and Doppler measurements to be taken into account for their use in clinical
trials according to the body of evidence of current literature
Measurement
Accuracy
Feasibility
Reproducibility
Prognostic value
...............................................................................................................................................................................
2D/M-mode LV diameters
Fair
Good
Excellent
Fair
2D LV volumes
3D LV volumes
Poor
Excellent
Good
Good
Good
Good
Good
Not demonstrated
M-mode LV mass
Poor
Fair
Poor
Excellent
3D LV mass
2D EF
Excellent
Good
Fair
Good
Excellent
Good
Not demonstrated
Excellent
3D EF
Excellent
Good
Excellent
Not demonstrated
TAPSE
2D LA volume
Good
Fair
Good
Good
Good
Good
Good
Good
E velocity DT
Good
Good
Good
Good
E/Ea ratio
PAPs
Good
Good
Excellent
Fair
Good
Good
Good
Good
MR ERO (PISA)
Fair
Fair
Fair
Good
MR V. contracta
2D MVA
Fair
Poor
Fair
Poor
Fair
Poor
Not demonstrated
Not demonstrated
3D MVA
Good
Fair
Good
Not demonstrated
MS PHT
2D AVA
Good
Poor
Good
Poor
Good
Poor
Not demonstrated
Not demonstrated
AS continuity equation
Good
Fair
Fair
Good
A, transmitral A velocity; AS, aortic stenosis; AVA, aortic valve area; DT, deceleration time; EF, ejection fraction; LA, left atrial; LV, left ventricular; MR, mitral regurgitation; MS,
mitral stenosis; MVA, mitral valve area; PAPS, pulmonary arterial systolic pressure; PHT, pressure half time; PISA, proximal isovelocity surface area; TAPSE, tricuspid annular plane
systolic excursion.
.50%) and serial assessment of Doppler diastolic indices (including at least pulsed TVI of the mitral annulus in order to obtain a
non-invasive estimation of LVFP) identified as possible endpoints.
Myocardial infarction
Based on the recognized prognostic value of post-AMI LV remodelling, several clinical trials have assessed the ability of drug categories
Downloaded from ejechocard.oxfordjournals.org by guest on May 25, 2011
Figure 4 Flow diagram regarding the optimal echo tool and parameters for a specific clinical trial.
351
Echocardiography in clinical trials
Table 3 Doppler echocardiographic variables and indices suggested as possible primary and secondary echo endpoints
suggested from EAE in specific settings of clinical trials
Disease
Primary echo endpoints
Secondary echo endpoints
Arterial hypertension
Systolic heart failure
LV mass
2D/3D LVEF, DT, PAPs
RWT, MFS, E/e’ ratio, LA volume, GLS
E/e’ ratio, MR severity, TAPSE
...............................................................................................................................................................................
Heart failure with normal EF
E/e’ ratio, LA volume
GLS, PAPs
Acute myocardial infarction
Atrial fibrillation and stroke
2D/3D LVEF, DT, E/e’ ratio, GLS
E/e’ ratio, LA volume
LA volume, TAPSE, 3D RVEF
LAA flow velocities, MR severity
Cardiac toxicity of chemotherapy
2D/3D LVEF, E/e’ ratio, GLS
TAPSE, 3D RVEF
2D, two-dimensional; 3D, three-dimensional; DT, deceleration time of E velocity; E/e’ ratio, ratio of transmitral E velocity to tissue Doppler-derived early diastolic velocity of the
mitral annulus; GLS, global longitudinal strain by speckle-tracking echocardiography; LA, left atrial; LAA, left atrial appendage; LV, left ventricular; LVEF, LV ejection fraction; MFS,
mid-wall fractional shortening; MR, mitral regurgitation; PAPs, pulmonary arterial systolic pressure; RV, right ventricular; RWT, relative wall thickness; RVEF, right ventricular EF;
TAPSE, tricuspid annular plane systolic excursion.
Atrial fibrillation and stroke
Based on epidemiological evidence that LA enlargement is an independent predictor of AF and stroke, clinical trials dealing with these issues
should provide accurate estimation of LA volume and Dopplerderived diastolic indices. Causes of embolic stroke include nonvalvular AF, LV dysfunction, rheumatic valvular disease, prosthetic
valves, and patent foramen ovale, all conditions in which echocardiography is diagnostic. In several stroke and AF trials, TEE plays a pivotal
role in detecting LA appendage thrombi and low flow velocities
(,20 cm/s), and/or spontaneous echo contrast. Peripheral centres
and ECLs should aim to reduce variability in the detection of source
of emboli (differentiation of appendage thrombus from artefacts
such as sludge, pectinate muscles, and pulmonary vein limbs).
Cardiac toxicity of chemotherapy
Acute and late cardiac toxicity of chemotherapy is diagnosed and
monitored by echocardiography. Most oncological trials use the
sole EF determination as an entry criterion as well as a follow-up
marker for explaining cardiac symptoms and signs. Prospective
trials should include more comprehensive assessment of LV function (e.g. by using STE and/or TVI), Doppler-derived diastolic function, valve dysfunction, and pericardial diseases.
Conclusions
Echocardiography is a valuable tool for assessing disease effects and
treatment outcome on cardiac structure and function in clinical
trials. However, since it is an operator-dependent technique,
difference in variability of measurements may lead to collection of
inaccurate data. To prevent this, clinical trials should be designed
and developed on the basis of a thorough knowledge of
physio-pathological, prognostic, and technical characteristics of
echo-Doppler techniques and parameters, choosing the most
performable and reproducible. QA should be guaranteed and
implemented by adequate training processes of peripheral centres
and appropriate interpretation of data, by a central core laboratory.
Conflict of interest: L.P.B. has received research grants from GE.
J.D. has received research grants from GE, Siemens, Visual Sonics,
Epsilon Imaging. No conflict of interest to be declared by the other
authors.
References
1. Gottdiener JS, Bednarz J, Devereux R, Gardin J, Klein A, Manning WJ et al. American Society of Echocardiography. American Society of Echocardiography recommendations for use of echocardiography in clinical trials. J Am Soc
Echocardiogr 2004;17:1086 – 119.
2. Evangelista A, Flachskampf F, Lancellotti P, Badano L, Aguilar R, Monaghan M et al.
European Association of Echocardiography. European Association of Echocardiography recommendations for standardization of performance, digital storage and
reporting of echocardiographic studies. Eur J Echocardiogr 2008;9:438 –48.
3. Lang RM, Bierig M, Devereux RB, Flachskampf FA, Foster E, Pellikka PA et al.
American Society of Echocardiography’s Nomenclature and Standards Committee; Task Force on Chamber Quantification; American College of Cardiology
Echocardiography Committee; American Heart Association; European Association of Echocardiography, European Society of Cardiology. Recommendations
for chamber quantification. Eur J Echocardiogr 2006;7:79–108.
4. Baumgartner H, Hung J, Bermejo J, Chambers JB, Evangelista A, Griffin BP et al.
American Society of Echocardiography; European Association of Echocardiography. Echocardiographic assessment of valve stenosis: EAE/ASE recommendations
for clinical practice. Eur J Echocardiogr 2009;10:1– 25.
5. Lancellotti P, Tribouilloy C, Hagendorff A, Moura L, Popescu BA, Agricola E et al.
European Association of Echocardiography. European Association of Echocardiography recommendations for the assessment of valvular regurgitation. Part 1:
aortic and pulmonary regurgitation (native valve disease). Eur J Echocardiogr
2010;11:223 –44.
6. Lancellotti P, Tribouilloy C, Hagendorff A, Moura L, Popescu BA, Agricola E et al.
European Association of Echocardiography. European Association of Echocardiography recommendations for the assessment of valvular regurgitation. Part 2:
mitral and tricuspid regurgitation (native valve disease). Eur J Echocardiogr 2010;
11:307–32.
7. Nagueh SF, Appleton CP, Gillebert TC, Marino PN, Oh JK, Smiseth OA et al. Recommendations for the evaluation of left ventricular diastolic function by echocardiography. Eur J Echocardiogr 2009;10:165 –93.
Downloaded from ejechocard.oxfordjournals.org by guest on May 25, 2011
to reverse this remodelling and improve short- and long-term
outcome. Again, only few of these studies have evaluated the
changes of echo-Doppler parameters over time. Current AMI
trials should require sequential quantitation of EF, LV, and LA
volumes, LV sphericity (sphericity index), functional MR, Doppler
diastolic indices including at least transmitral E velocity deceleration
time, pulsed TVI of the mitral annulus and PAPs. Global longitudinal
strain, whose prognostic value has been recently shown in patients
with AMI,75 can be appropriately proposed in clinical trials. Stress
echo, whose EAE recommendations have recently been published,76
can be used in trials involving AMI and CAD.
352
27. Cerqueira MD, Weissman NJ, Dilsizian V, Jacobs AK, Kaul S, Laskey WK et al.
American Heart Association writing group on myocardial segmentation and registration for cardiac imaging. Standardized myocardial segmentation and nomenclature for tomographic imaging of the heart: a statement for healthcare
professionals from the Cardiac Imaging Committee of the Council on Clinical
Cardiology of the American Heart Association. J Nucl Cardiol 2002;9:240–5.
28. Choi JO, Cho SW, Song YB, Cho SJ, Song BG, Lee SC et al. Longitudinal 2D strain
at rest predicts the presence of left main and three vessel coronary artery disease
in patients without regional wall motion abnormality. Eur J Echocardiogr 2009;10:
695 –701.
29. Horton KD, Meece RW, Hill JC. Assessment of the right ventricle by echocardiography: a primer for cardiac sonographers. J Am Soc Echocardiogr 2009;22:776 –92.
30. Ghio S, Recusani F, Klersy C, Sebastiani R, Laudisa ML, Campana C et al. Prognostic usefulness of the tricuspid annular plane systolic excursion in patients with
congestive heart failure secondary to idiopathic or ischemic dilated cardiomyopathy. Am J Cardiol 2000;85:837 –42.
31. Tamborini G, Muratori M, Brusoni D, Celeste F, Maffessanti F, Caiani EG et al. Is
right ventricular systolic function reduced after cardiac surgery? A two- and
three-dimensional echocardiographic study. Eur J Echocardiogr 2009;10:630 –4.
32. Meluzı´n J, Spinarova´ L, Bakala J, Toman J, Krejcı´ J, Hude P et al. Pulsed Doppler
tissue imaging of the velocity of tricuspid annular systolic motion; a new, rapid,
and non-invasive method of evaluating right ventricular systolic function. Eur
Heart J 2001;22:340 –8.
33. Innelli P, Esposito R, Olibet M, Nistri S, Galderisi M. The impact of ageing on right
ventricular longitudinal function in healthy subjects: a pulsed tissue Doppler study.
Eur J Echocardiogr 2009;10:491 –8.
34. Meluzı´n J, Spinarova´ L, Dusek L, Toman J, Hude P, Krejcı´ J. Prognostic importance
of the right ventricular function assessed by Doppler tissue imaging. Eur J Echocardiogr 2003;4:262 –71.
35. Niemann PS, Pinho L, Balbach T, Galuschky C, Blankenhagen M, Silberbach M
et al. Anatomically oriented right ventricular volume measurements with
dynamic three-dimensional echocardiography validated by 3-Tesla magnetic resonance imaging. J Am Coll Cardiol 2007;50:1668 –76.
36. Lu X, Nadvoretskiy V, Bu L, Stolpen A, Ayres N, Pignatelli RH et al. Accuracy and
reproducibility of real-time three-dimensional echocardiography for assessment
of right ventricular volumes and ejection fraction in children. J Am Soc Echocardiogr
2008;21:84– 9.
37. Tsang TS, Abhayaratna WP, Barnes ME, Miyasaka Y, Gersh BJ, Bailey KR et al. Prediction of cardiovascular outcomes with left atrial size: is volume superior to area
or diameter? J Am Coll Cardiol 2006;47:1018 –23.
38. Maddukuri PV, Vieira ML, De Castro S, Maron MS, Kuvin JT, Patel AR et al. What
is the best approach for the assessment of left atrial size? Comparison of various
uni-dimensional and two-dimensional parameters with three-dimensional echocardiographically determined left atrial volume. J Am Soc Echocardiogr 2006;19:
1026 –32.
39. Jenkins C, Bricknell K, Marwick TH. Use of real-time three-dimensional echocardiography to measure left atrial volume: comparison with other echocardiographic techniques. J Am Soc Echocardiogr 2005;18:991 –7.
40. Keller AM, Gopal AS, King DL. Left and right atrial volume by freehand threedimensional echocardiography: in vivo validation using magnetic resonance
imaging. Eur J Echocardiogr 2000;1:55–65.
41. Lester SJ, Ryan EW, Schiller NB, Foster E. Best method in clinical practice and in
research studies to determine left atrial size. Am J Cardiol 1999;84:829 –32.
42. Bombardini T. Myocardial contractility in the echo lab: molecular, cellular and
pathophysiological basis. Cardiovasc Ultrasound 2005;3:27.
43. Edvardsen T, Gerber BL, Garot J, Bluemke DA, Lima JA, Smiseth OA. Quantitative
assessment of intrinsic regional myocardial deformation by Doppler strain rate
echocardiography in humans: validation against three-dimensional tagged magnetic resonance imaging. Circulation 2002;106:50 –6.
44. Brown J, Jenkins C, Marwick TH. Use of myocardial strain to assess global left
ventricular function: a comparison with cardiac magnetic resonance and
3-dimensional echocardiography. Am Heart J 2009;157:102.e1 –5.
45. Sjøli B, Ørn S, Grenne B, Ihlen H, Edvardsen T, Brunvand H. Diagnostic capability
and reproducibility of strain by Doppler and by speckle tracking in patients with
acute myocardial infarction. JACC Cardiovasc Imaging 2009;2:24 –33.
46. Cho GY, Marwick TH, Kim HS, Kim MK, Hong KS, Oh JD. Global 2-dimensional
strain as a new prognosticator in patients with heart failure. J Am Coll Cardiol 2009;
54:618 – 24.
47. Greenberg NL, Firstenberg MS, Castro PL, Main M, Travaglini A, Odabashian JA.
Doppler-derived myocardial systolic strain rate is a strong index of left ventricular
contractility. Circulation 2002;105:99 –105.
48. Lancellotti P, Donal E, Magne J, O’Connor K, Moonen ML, Cosyns B et al. Impact
of left ventricular afterload on left ventricular function in asymptomatic severe
aortic stenosis: a two-dimensional speckle-tracking study. Eur J Echocardiogr
2010 Mar 4 [Epub ahead of print].
Downloaded from ejechocard.oxfordjournals.org by guest on May 25, 2011
8. Rudski LG, Lai WW, Afilalo J, Hua L, Handschumacher MD, Chandrasekaran K
et al. Guidelines for the echocardiographic assessment of the right heart in
adults: a report from the American Society of Echocardiography endorsed by
the European Association of Echocardiography, a registered branch of the European Society of Cardiology, and the Canadian Society of Echocardiography. J Am
Soc Echocardiogr 2010;23:685 –713.
9. Palmieri V, Dahlo¨f B, De Quattro V, Sharpe N, Bella JN, de Simone G et al.
Reliability of echocardiographic assessment of left ventricular structure and function: the PRESERVE study. Prospective Randomized Study Evaluating Regression
of Ventricular Enlargement. J Am Coll Cardiol 1999;34:1625 –32.
10. Gardner BI, Bingham SE, Allen MR, Blatter DD, Anderson JL. Cardiac magnetic
resonance versus transthoracic echocardiography for the assessment of cardiac
volumes and regional function after myocardial infarction: an intrasubject comparison using simultaneous intrasubject recordings. Cardiovasc Ultrasound 2009;
7:38.
11. Grothues F, Smith GC, Moon JC, Bellenger NG, Collins P, Klein HU et al. Comparison of inter-study reproducibility of cardiovascular magnetic resonance with
two-dimensional echocardiography in normal subjects and in patients with
heart failure or left ventricular hypertrophy. Am J Cardiol 2002;90:29–34.
12. Malm S, Frigstad S, Sagberg E, Larsson H, Skjaerpe T. Accurate and reproducible
measurement of left ventricular volume and ejection fraction by contrast echocardiography: a comparison with magnetic resonance imaging. J Am Coll Cardiol
2004;44:1030 – 5.
13. Senior R, Becher H, Monaghan M, Agati L, Zamorano J, Vanoverschelde JL et al.
Contrast echocardiography: evidence-based recommendations by European
Association of Echocardiography. Eur Heart J 2009;10:194 –212.
14. Jenkins C, Bricknell K, Hanekom L, Marwick TH. Reproducibility and accuracy of
echocardiographic measurements of left ventricular parameters using real-time
three-dimensional echocardiography. J Am Coll Cardiol 2004;44:878 –86.
15. Mor-Avi V, Jenkins C, Ku¨hl HP, Nesser HJ, Marwick T, Franke A et al. Real-time
3-dimensional echocardiographic quantification of left ventricular volumes: multicenter study for validation with magnetic resonance imaging and investigation of
sources of error. JACC Cardiovasc Imaging 2008;1:413 – 23.
16. Muraru D, Badano L, Piccoli G, Gianfagna P, Del Mestre L, Ermacora D et al. Validation of a novel automated border-detection algorithm for rapid and accurate
quantitation of left ventricular volumes based on three-dimensional echocardiography. Eur J Echocardiogr 2010 Jan 6 [Epub ahead of print].
17. Gottdiener JS, Livengood SV, Meyer PS, Chase GA. Should echocardiography be
performed to assess effects of antihypertensive therapy? Test-retest reliability of
echocardiography for measurement of left ventricular mass and function. J Am Coll
Cardiol 1995;25:424 –30.
18. de Simone G, Muiesan ML, Ganau A, Longhini C, Verdecchia P, Palmieri V et al.
Reliability and limitations of echocardiographic measurement of left ventricular
mass for risk stratification and follow-up in single patients: the RES trial.
Working Group on Heart and Hypertension of the Italian Society of Hypertension. Reliability of M-mode Echocardiographic Studies. J Hypertens 1999;17:
1955 –63.
19. Mor-Avi V, Sugeng L, Weinert L, MacEneaney P, Caiani EG, Koch R et al. Fast
measurement of left ventricular mass with real-time three-dimensional echocardiography: comparison with magnetic resonance imaging. Circulation 2004;110:
1814 –8.
20. Caiani EG, Corsi C, Sugeng L, MacEneaney P, Weinert L, Mor-Avi V et al.
Improved quantification of left ventricular mass based on endocardial and epicardial surface detection with real time three dimensional echocardiography. Heart
2006;92:213 –9.
21. van den Bosch AE, Robbers-Visser D, Krenning BJ, McGhie JS, Helbing WA,
Meijboom FJ et al. Comparison of real-time three-dimensional echocardiography
to magnetic resonance imaging for assessment of left ventricular mass. Am J
Cardiol 2006;97:113 –7.
22. Himelman RB, Cassidy MM, Landzberg JS, Schiller NB. Reproducibility of quantitative two-dimensional echocardiography. Am Heart J 1988;115:425 –31.
23. de Simone G, Devereux RB, Koren MJ, Mensah GA, Casale PN, Laragh JH.
Midwall left ventricular mechanics. An independent predictor of cardiovascular
risk in arterial hypertension. Circulation 1996;93:259 – 65.
24. Carlsson M, Ugander M, Mose´n H, Buhre T, Arheden H. Atrioventricular plane
displacement is the major contributor to left ventricular pumping in healthy
adults, athletes, and patients with dilated cardiomyopathy. Am J Physiol Heart
Circ Physiol 2007;292:H1452 – 9.
25. Zaca` V, Ballo P, Galderisi M, Mondillo S. Echocardiography in the assessment of
left ventricular longitudinal systolic function: current methodology and clinical
applications. Heart Fail Rev 2010;23:37.
26. Innelli P, Sanchez R, Marra F, Esposito R, Galderisi M. The impact of aging on left
ventricular longitudinal function in healthy subjects: a pulsed tissue Doppler study.
Eur J Echocardiogr 2008;9:241 – 9.
M. Galderisi et al.
353
Echocardiography in clinical trials
64.
65.
66.
67.
68.
69.
70.
71.
72.
73.
74.
75.
76.
Angiography and Interventions, and Society of Thoracic Surgeons. J Am Coll
Cardiol 2008;52:e1 –142.
Zoghbi WA, Enriquez-Sarano M, Foster E, Grayburn PA, Kraft CD, Levine RA
et al. American Society of Echocardiography. Recommendations for evaluation
of the severity of native valvular regurgitation with two-dimensional and
Doppler echocardiography. J Am Soc Echocardiogr 2003;16:777 –802.
Grossmann G, Hoffmeister A, Imhof A, Giesler M, Hombach V, Spiess J. Reproducibility of the proximal flow convergence method in mitral and tricuspid regurgitation. Am Heart J 2004;147:721 – 8.
Little SH, Pirat B, Kumar R, Igo SR, McCulloch M, Hartley CJ et al. Threedimensional color Doppler echocardiography for direct measurement of vena
contracta area in mitral regurgitation: in vitro validation and clinical experience.
JACC Cardiovasc Imaging 2008;1:695 – 704.
Sugeng L, Coon P, Weinert L, Jolly N, Lammertin G, Bednarz JE, Thiele K et al.
Use of real-time 3-dimensional transthoracic echocardiography in the evaluation
of mitral valve disease. J Am Soc Echocardiogr 2006;19:413 – 21.
Evangelista A, del Castillo HG, Calvo F, Permanyer-Miralda G, Brotons C, Angel J
et al. Strategy for optimal aortic regurgitation quantification by Doppler echocardiography: agreement among different methods. Am Heart J 2000;139:773 –81.
Rosenhek R, Binter T, Porenta G, Lang I, Christ G, Schemper M et al. Predictors of
outcome in severe, asymptomatic aortic valve stenosis. N Engl J Med 2000;343:
611 –7.
Gutie´rrez-Chico JL, Zamorano JL, Prieto-Moriche E, Herna´ndez-Antolı´n RA,
Bravo-Amaro M, Pe´rez de Isla L et al. Real-time three-dimensional echocardiography in aortic stenosis: a novel, simple, and reliable method to improve accuracy in
area calculation. Eur Heart J 2008;29:1296 –306.
Zoghbi WA, Chambers JB, Dumesnil JG, Foster E, Gottdiener JS, Grayburn PA
et al. American Society of Echocardiography’s Guidelines and Standards Committee. Task Force on Prosthetic Valves; American College of Cardiology Cardiovascular Imaging Committee; Cardiac Imaging Committee of the American Heart
Association; European Association of Echocardiography; European Society of
Cardiology; Japanese Society of Echocardiography; Canadian Society of Echocardiography; American College of Cardiology Foundation; American Heart Association; European Association of Echocardiography; European Society of
Cardiology; Japanese Society of Echocardiography; Canadian Society of Echocardiography. J Am Soc Echocardiogr 2009;22:975 – 1014.
Popescu BA, Andrade MJ, Badano LP, Fox KF, Flachskampf FA, Lancellotti P et al.
European Association of Echocardiography recommendations for training, competence, and quality improvement in echocardiography. Eur J Echocardiogr 2009;
10:893–905.
Oh JK. Is core laboratory essential for using echocardiography in clinical trials?
Controlled vs random error. Eur J Echocardiogr 2002;3:245–7.
Douglas PS, De Cara JM, Devereux RB, Duckworth S, Gardin JM, Jaber WA et al.
Echocardiographic imaging in clinical trials: American Society of Echocardiography
standards for echocardiography core laboratories: endorsed by the American
College of Cardiology Foundation. J Am Soc Echocardiogr 2009;22:755 –65.
Park YH, Kang SJ, Song JK, Lee EY, Song JM, Kang DH et al. Prognostic value of
longitudinal strain after primary reperfusion therapy in patients with anterior-wall
acute myocardial infarction. J Am Soc Echocardiogr 2008;21:262 –7.
Sicari R, Nihoyannopoulos P, Evangelista A, Kasprzak J, Lancellotti P,
Poldermans D et al. European Association of Echocardiography. Stress Echocardiography Expert Consensus Statement—Executive Summary: European Association of Echocardiography (EAE) (a registered branch of the ESC). Eur Heart J
2009;30:278 –89.
Downloaded from ejechocard.oxfordjournals.org by guest on May 25, 2011
49. Manovel A, Dawson D, Smith B, Nihoyannopoulos P. Assessment of left ventricular function by different speckle-tracking software. Eur J Echocardiogr 2010
Feb 27. [Epub ahead of print].
50. Lester SJ, Tajik AJ, Nishimura RA, Oh JK, Khanderia BJ. Unlocking the mysteries of
diastolic function. Deciphering the Rosetta stone 10 years later. J Am Coll Cardiol
2008;51:679 –89.
51. Ommen SR, Nishimura RA, Appleton CP, Miller FA, Oh JK, Redfield MM et al.
Clinical utility of Doppler echocardiography and tissue Doppler imaging in the
estimation of left ventricular filling pressures: A comparative simultaneous
Doppler-catheterization study. Circulation 2000;102:1788 –94.
52. Palmieri V, Arezzi E, Sabatella M, Celentano A. Interstudy reproducibility of parameters of left ventricular diastolic function: a Doppler echocardiography study.
J Am Soc Echocardiogr 2003;16:1128 –35.
53. Palmieri V, Innocenti F, Pini R, Celentano A. Reproducibility of Doppler echocardiographic assessment of left ventricular diastolic function in multicenter setting.
J Am Soc Echocardiogr 2005;18:99 –106.
54. Galderisi M, Benjamin EJ, Evans JC, D’Agostino RB, Fuller DL, Lehman B et al.
Intra- and inter-observer reproducibility of Doppler-assessed indexes of left ventricular diastolic function in a population-based study (the Framingham Heart
Study). Am J Cardiol 1992;70:1341 –6.
55. Hole T, Urheim S, Skjaerpe T. Intra- and inter-observer reproducibility of transthoracic pulmonary venous Doppler flow indices after acute myocardial infarction. Eur J Echocardiogr 2002;3:32–8.
56. Steen T, Voss BM, Ihlen H. Repeatability of measurements of pulmonary venous
flow indices. Int J Cardiol 1994;47:169 –175.
57. Hillis GS, Møller JE, Pellikka PA, Gersh BJ, Wright RS, Ommen SR et al. Noninvasive estimation of left ventricular filling pressure by E/e’ is a powerful predictor of
survival after acute myocardial infarction. J Am Coll Cardiol 2004;43:360–7.
58. Olson JM, Samad BA, Alam M. Prognostic value of pulse-wave tissue Doppler parameters in patients with systolic heart failure. Am J Cardiol 2008;102:722 –5.
59. McLaughlin VV, Badesch DB, Delcroix M, Fleming TR, Gaine SP, Galie` N et al. End
points and clinical trial design in pulmonary arterial hypertension. J Am Coll Cardiol
2009;54(Suppl. 1):S97 –107.
60. Quin˜ones MA, Otto CM, Stoddard M, Waggoner A, Zoghbi WA. Doppler
Quantification Task Force of the Nomenclature and Standards Committee of
the American Society of Echocardiography. Recommendations for quantification
of Doppler echocardiography: a report from the Doppler Quantification Task
Force of the Nomenclature and Standards Committee of the American Society
of Echocardiography. J Am Soc Echocardiogr 2002;15:167 –84.
61. Caso P, Galderisi M, Cicala S, Cioppa C, D’Andrea A, Lagioia G et al. Association
between myocardial right ventricular relaxation time and pulmonary arterial
pressure in chronic obstructive lung disease: analysis by pulsed Doppler tissue
imaging. J Am Soc Echocardiogr 2001;14:970 –7.
62. Bre´chot N, Gambotti L, Lafitte S, Roudaut R. Usefulness of right ventricular isovolumic relaxation time in predicting systolic pulmonary artery pressure. Eur J
Echocardiogr 2008;9:547–54.
63. Bonow RO, Carabello BA, Chatterjee K, de Leon AC Jr, Faxon DP, Freed MD
et al. American College of Cardiology/American Heart Association Task Force
on Practice Guidelines. 2008 focused update incorporated into the ACC/AHA
2006 guidelines for the management of patients with valvular heart disease: a
report of the American College of Cardiology/American Heart Association
Task Force on Practice Guidelines (Writing Committee to revise the 1998 guidelines for the management of patients with valvular heart disease). Endorsed by the
Society of Cardiovascular Anesthesiologists, Society for Cardiovascular


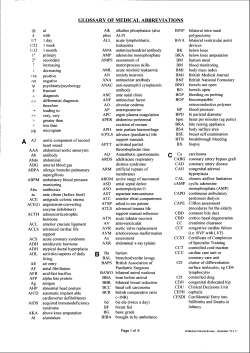


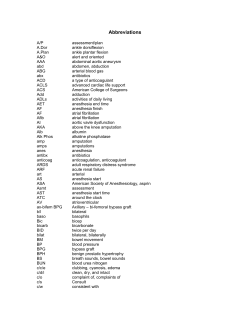
© Copyright 2026