
HOW TO USE THIS BOOK 1
HOW TO USE THIS BOOK
(FOLLOW THE FLOWCHART SHOWN ON THE NEXT PAGE)
1
Study Chapters 1 - 7, holding periodic name-in-the-hat group meetings.
When reading the text, reflect on each sentence. Reflect on the concepts.
2
Be sure that all senior management has taken the 24-hour “Management
for Results” course offered by the Instituto de Desenvolvimento
Gerencial.
3
Set up a Management Improvement Plan that corresponds to the
“PUTTING THE HOUSE IN ORDER” phase. Adopt an 8 - month time frame.
4
Begin work. During this time reconvene your name-in-the-hat group and
study again chapters 1 - 7. When the ideas are applied in practice, the
level of understanding improves considerably. See for yourself.
5
After 8 months resume the study of the book. Together with your namein-the-hat group study up to Chapter 13.
6
Set up a new Management Improvement Plan that corresponds to the
“ADJUSTING THE MACHINE” phase. Adopt a 16 - month time frame.
7
Begin work. Reconvene your name-in-the-hat group as in item 4.
8
At the end of the 16 months get back to your name-in-the-hat group and
go through to the end of the book. I can guarantee you that by that time
your management may already be classified as "World Class."
1
UNDERSTAND
YOUR WORK
2
6
5
4
3
7
MANAGE TO
IMPROVE RESULTS
MANAGE TO
SUSTAIN RESULTS
MONITOR
RESULTS
ELIMINATE
ABNORMALITIES
STANDARDIZE
PUTTING THE
HOUSE IN ORDER
2ND PHASE
“PUTTING THE HOUSE
IN ORDER”
1ST PHASE
“UNDERSTANDING
YOUR WORK”
9
8
IMPROVE
IMPROVE
MAINTENANCE
PRACTICE PROBLEM
SOLVING
12
10
IMPROVE
MONITORING
13
11
“ADJUSTING THE MACHINE”
3RD PHASE
HUMAN
RESOURCES
ASSURE
QUALITY
(EACH RECTANGLE CORRESPONDS TO A CHAPTER OF THIS BOOK)
FLOWCHART FOR “THE ROAD TOWARDS EXCELLENCE”
4TH PHASE
14
FUTURE
“ON THE ROAD TO THE
FUTURE”
OPERATIONAL
OPERATION
SUPERVISION
MANAGEMENT
C
A
C
A
D
S
D
P
Figure 1.1: Functions of people within an organization and its relation to the method.
FUNCTIONS
MANAGERIAL
DIRECTION
SITUATION
OPERATION
SUPERVISION
MANAGEMENT
DIRECTION
FUNCTIONS
MANAGERIAL
OPERATIONAL
* Follows the Standard Operational Procedures.
* Promotes the training of the operation
function
* Checks wether the operation function is
following standard operational procedures.
* Promotes the training of the supervision
function.
* Attains GOALS (PDCA).
* Establishes GOALS that guarantee the survival
of the company through the use of a strategic
plan. Deploy these goals.
NORMAL
* Reports abnormalities.
* Every six months draws up a status report for
senior management.
* Eliminates chronic abnormalities by attacking their
root causes (PDCA).
* Periodically reviews abnormalities to detect chronic
abnormalities (Pareto Analysis).
* Checks abnormalities daily at the site of their
occurrence, working in a complementary manner
with supervision.
* Records abnormalities and reports them to the
managerial function.
* Conducts abnormality analysis, attacking the
inmediate causes (for example, was the standard
observed?).
* Understands status report management.
* Establishes GOALS to correct the current situation.
OCCURRENCE OF ABNOMALITIES
Table 1.1: Type of Work Carried Out Through Each Function(2), (3).
TYPE
TOP MANAGEMENT
TOP DOWN
MANAGEMENT
Figure 2.1: Division of Management.
- IMPORTANT RELATIONSHIP
ROUTINE
MANAGEMENT
MANAGEMENT
BY POLICY
MODE
CROSSFUNCTIONAL
MANAGEMENT
HOW ARE MY RESULTS?
HOW DO THEY COMPARE WITH THE
GOALS?
HOW DO THEY COMPARE WITH THE
BENCHMARKS?
CONTROL ITEMS:
ACTING ON THE PROCESS (MEANS)
TO SUSTAIN AND IMPROVE
RESULTS.
CORRETIVE ACTION:
D
C
MORALE: MOTIVATION, UNITY,
PARTICIPATION, FRIENDSHIP, LEARNING, GROWTH,
ENVIRONMENTAL PROTECTION.
5S: PARSIMONY, ORGANIZATION, CLEANLINESS,
DISCIPLINE, PURITY OF INTENTIONS, AND JUSTICE.
EXECUTION: DISCIPLINED WORK
ACCORDING TO STANDARD OPERATIONAL
PROCEDURES.
Figure 2.2: Daily Work Routine Management Mentality.
P
A
COMPLIANCE WITH STANDARDS
- SYSTEM STANDARD
- PROCESS TECHNICAL STANDARD
- STANDARD OPERATIONAL PROCEDURE
METHOD:
THE COMPETITION AND IN A MORE
ECONOMICAL MANNER”.
GOAL: ”TO SATISFY PEOPLE BETTER THAN
A
5S
DEFINITION OF
FLOWCHARTS
ABNORMALITY
REPORT
PDCA
TRAINING
A PRIORITY
PROBLEM
IDENTIFICATION
OF CHRONIC
ABNORMALITIES
+
STANDARD OPERATIONAL PROCEDURE
(On-the-job training)
PROCESS TECHNICAL STANDARD
OR SYSTEM STANDARD
PROCESS EVALUATION
(Dispersion evaluation)
PROCESS
IMPROVEMENT
(Dispersion reduction)
CORRECTIVE
ACTION
TWO EASY
PROBLEMS
RESEARCH OF
BENCHMARK
VALUES
DEFINITION OF
PRIORITY
CONTROL ITEMS
ACTION PLAN
FULL UTILIZATION
OF PDCA
C D
A S
FULL
UTILIZATION
OF SDCA
QUALITY
ASSURANCE
(Reliability)
PRODUCTIVITY
GAINS
C D
A P
IDENTIFICATION OF
PRIORITY PROBLEMS
GRAPHS
CONTROL ITEMS
TABLE
Figure 2.3: Basic Outline for the Improvement of Daily Work Routine Management.
STANDARDIZATION
C
B
ELIMINATION
OF
ABNORMALITIES
D
ORGANIZATION
OF YOUR
MANAGEMENT
DESCRIPTION
OF BUSINESS
GOAL
IDENTIFICATION
5S
DAILY WORK
ROUTINE
MANAGEMENT
Figure 2.4: Exemplary Daily Work Routine Management.
Exemplary
Daily Work Routine Management
HUMANISM
METHOD
Receive an IMPROVEMENT GOAL from your
director or establish your own goal (quality,
cost, customer service, morale, and safety).
Establish a control item.
Gather information (Facts and Data)
P
Carry out an analysis
(What are the causes that keep us from reaching the goal?)
MANAGERIAL ACTION PLAN
(Countermeasures against the causes)
You and your team carry out the ACTION PLAN.
D
Check whether all actions were executed.
500
CONTROL
ITEM
475
BETTER
455
* GOAL (425)
400
Time
(380) BENCHMARK
Company Y, Inc.
C
If your PLAN produced no results, go further in gathering
data and in the analysis.
If your PLAN was successful, STANDARDIZE.
Train the workers and conclude.
Figure 3.1: Method for Attaining Goals.
A
Table 3.1: How to Set Up Your First Action Plan.
1
Receive the IMPROVEMENT GOAL from your director, or establish one
yourself. Collect all the information you can on the subject.
Call on everyone (engineers, technicians, supervisors, workers, other
2 managers, technicians from supplying companies, consultants, etc) that you
feel can contribute; those who “are on top of the subject.” This is a process of
knowledge collection.
3 Hold a meeting, visiting, if possible, the location where the subject occurs.
Have available: plenty of flip-chart paper, masking tape, magic markers of
several colors, “post-it” notes, etc.
4 At the meeting, state first your long-range goal (one in which you surpass the
best in the world). Then, state the goal to be reached within one year at the
most. Clearly explain how much the company will earn per year after it reaches
the goal. Put all this on flip-chart paper affixed to the wall. Print in very large,
colored letters to help people remember. Discuss these numbers with the
people in the meeting. How many families could be supported with the saving
from this waste reduction?
5 Define the group’s problem. Write: OUR PROBLEM IS TOO MANY INVOICING
ERRORS (for example).
6 Now ask the group: WHY DO WE HAVE SO MANY INVOICING ERRORS? (for
example). At this point you have two alternatives: either you can distribute
post-it note paper and have each one write down a cause of the problem or
simply say what he or she thinks is the cause of the problem. The leader of
the meeting writes down each cause on the flip-chart sheets affixed to the
wall of the room. Do not forget to ask why? a number of times.
7 Having finished the “cause harvesting” activity, attempt to simplify the
causes by combining similar ones and eliminating those considered
unimportant by the group. If necessary, the group may vote. Analyze the
consistency of the causes during the cleanup process.
(a) What is the impact of the elimination of each cause on the desired result (goal)?
(b) Is it within my authority to act on this cause?
8 Now, for EACH CAUSE that remains after the cleanup process, discus with the
group one or more COUNTERMEASURES. Write on the flip-chart sheets only
those countermeasures that are agreed upon by all. Place these
countermeasures in the 5W 1H format. Presto! You have an ACTION PLAN, as
shown in Table 3.2.
06/30
Paul
3. Train personnel
In this column
place a name, and
not a group or an
acronym. It must be
the name of the
person in charge
08/31
John
2. Change the guides
In this column
place the
countermeasures
that came out of
brainstorming
(See Table 3.1)
08/31
(WHEN)
TIME
Mike
PERSON
RESPONSIBLE
(WHO)
1. Level the base of
the equipment
(WHAT)
COUNTERMEASURES
To prevent
stoppages
To train them in
new procedures
Rolling
mill
Training
center and
work area
In these five columns
you place the
complementary data
as shown above
To prevent sleeve
breakage
Rolling
mill
* Do not leave out this
WHY column. People
want to know why they
must do something
Use recently updated Standard
Operational Procedures RC-0-1-98
and RC-0-1-99.
Take advantage of the shutdown of
the rolling mill and change any guides
that are worn.
Disassemble the main roller, remove it
with the overhead derrick and raise
base B2 by 2cm with drilled steel plates
in order to make room for the regulating
screw.
PROCEDURE
(HOW)
JUSTIFICATION*
(WHY)
(WHERE)
LOCATION
Table 3.2: Example of an ACTION PLAN (5W 1H).
OPERATIONS
Product
Merchandise
or Service
Figure 4.1: Distinction between PROCESS and OPERATION.
PROCESS
STEEL
REFINED
FURNACE
PREPARED
TRANSPORT
SCRAP
PREPARED
PROCESS
FLOWCHART
16
8
4
8
Assembly
Casting
Operation
Refining
Operation
C
A
C
B
A
4
Booth Operation
Platform
Operation
A
6
C
4
Adjustment
Crane Operation
C
4
Priority level
of the task
Prepare the
Tower
OPERATIONS
Number of
people assigned
to the task
6
3
5
4
2
1
8
7
Standardization “Putting the House
order
in Order” phase
Priority for the
Table 4.1: Priorization for Standardization (this table is a simulation and does not depict an actual case.
It merely serves as an instructive example).
Customer
Product
Process
Engineering Engineering
PRODUCTION
Manager
Supervisor
Operator
Needs
Product
specification
and design
Process
specification
Standard
operational
procedure
Trains the
supervisor
Trains the
operator and
checks
compliance
with standard
Implements
quality
assurance
complying
with standard
Idea for new
standard
operational
procedure
Approves
Approves
Figure 4.2: Process of Establishing and Modifying a Standard Operational Procedure.
STANDARD RESTAURANT
INC.
STANDARD
OPERATIONAL
PROCEDURE
Standard: RP-C-03
Established: 03.24.94
Revised: 04.08.1994
NAME OF PROCEDURE: Coffee Preparation
WORKER RESPONSIBLE: Kitchen Assistant
Revision Number: First
MATERIAL REQUIRED
KETTLE
1
FILTER HOLDER
GROUND COFFEE
-
CONNECTOR
COFFEE MEASURER
1
STANDARD CUP
THERMOS BOTTLE
1
HEAT-RESISTANT GLOVE
PAPER FILTER
-
CRITICAL ACTIVITIES
01 - CHECK HOW MANY PEOPLE WILL DRINK COFFEE.
02 - PLACE WATER TO BOIL IN KETTLE (1 STANDARD CUP/PERSON).
03 - PLACE GROUND COFFEE IN PAPER FILTER (1 COFFEE MEASURE/PERSON).
04 - WASH THE THERMOS BOTTLE.
05 - PLACE FILTER ON TOP OF THERMOS BOTTLE, USING CONNECTOR.
06 - WHEN THE WATER BEGINS TO BOIL, POUR A LITTLE OVER THE GROUND COFFEE TO MOISTEN IT
THOROUGHLY.
07 - AFTER 30 SECONDS, POUR THE REST OF THE WATER IN THE FILTER.
08 - WHEN ALL THE WATER HAS PERCOLATED, REMOVE FILTER AND CLOSE THE THERMOS BOTTLE.
HANDLING OF MATERIAL
01 - AFTER EACH BREWING, WASH ALL EQUIPMENT, DRY AND STORE.
02 - GROUND COFFEE SHOULD ALWAYS BE KEPT IN A CLOSED CONTAINER.
EXPECTED RESULTS
01 - COFFEE AVAILABLE IS ALWAYS FRESH (MAXIMUM OF ONE HOUR AFTER BREWING).
02 - COFFEE AT CORRECT STRENGTH (NEITHER TOO WEAK NOR TOO STRONG).
CORRECTIVE ACTIONS
IN CASE THERE ARE COMPLAINTS THAT THE COFFEE IS TOO WEAK OR TOO STRONG, CHECK TO
SEE IF THE CORRECT AMOUNT OF WATER AND THE CORRECT AMOUNT OF GROUND COFFEE WAS
USED, OR IF THERE WAS A CHANGE IN THE QUALITY OF THE GROUND COFFEE. IF IN DOUBT,
CONSULT THE SUPERVISOR.
APPROVED:
WORKER
WORKER
WORKER
SUPERVISOR
MANAGER
Figure 4.3: Example of a Standard Operational Procedure - SOP(6).
6
4
1
NAME OF
OPERATION
5
2
3
AIR PRESSURE OF
PNEUMATIC
SCREWDRIVER
NOTE
TIGHTENING THE
SMALL SCREWS
CRITICAL ACTIVITY 3
TIGHTENING THE
LARGE SCREWS
CRITICAL ACTIVITY 2
PLACING OF REAR
COVER IN GROOVES
CRITICAL ACTIVITY 1
IMPORTANT
POINTS
4
5
2
2
3
6
2
AUTHORIZED BY:
3 kg/cm - 4kg/cm
1
FINAL ASSEMBLY
NAME OF PROCESS:
Figure 4.4: Example of a Standard Operational Procedure (Illustrated).
ASSEMBLY OF REAR COVER
STANDARD OPERATIONAL PROCEDURE
CHECKED BY:
FRONT VIEW
PREPARED BY:
João
Praxedes
Teles
Fiuza
Antenor
Pereira
Manoel
Vargas
Dornelles
Souza
Augusto
Workers
Section:
Months
Company X, Inc.
X
X
J
X
X
M
X
X
A
X
X
M
X
J
X
X
J
X
X
A
Figure 5.1: Model for an Operational Task Diagnosis Plan.
X
X
F
MONTHS
Supervisor:
S
X
X
OPERATIONAL TASK DIAGNOSIS PLAN
X
X
O
X
X
N
X
D
Read
Worker
Supervisor
NO
Read
Section Chief
OBSERVATION: Not following operational procedure
is an “abnormality” (work nonconformity) and
should be treated by means of an “abnormalities
analysis” (why wasn’t the procedure followed?)
5. Recommendations for changing the standard
(see Figure 5.4). Etc.
4. Accident risks of the task
3. Operator difficulties in observing standards
2. Training given during evaluation
1. Additional training needs
Write down observations here regarding:
OBSERVATIONS
Figure 5.2: Supervisor Evaluation Report Model.
Read
8. When all the water has gone through the filter,
remove the filter and close the thermos bottle
5. Place filter on top of thermos bottle using
connector
6. When the water begins to boil, pour a little
over the ground coffee to moisten it
thoroughly
7. After 30 seconds, pour the rest of the water
into filter
2. Place water to boil in kettle
(1 standard cup per person)
3. Place ground coffee in filter
(one coffee measure per person)
4. Wash thermos bottle
YES
Date: July 21, 2011
Operational Procedure: RP-C-03
OPERATIONAL TASK DIAGNOSIS PLAN
Supervisor: Manuel Antônio Souza
Task: Preparation of coffee
1. Check how many people will drink coffee
CRITICAL STEPS
Section: Food Service
Worker: Augusto
Company X, Inc.
REPORTS
OCCURRENCE OF
ABNORMALITY
WORKER
WHY?
TRAINING?
“FOOLPROOF”?
NO
PROCESS ENGINEERING
STAFF
PDCA
SOLVES THE PROBLEM BY ACTING ON THE ROOT CAUSE
ESTABLISHES PRIORITIES, CHECKING, THROUGH PARETO ANALYSIS, WHICH CHRONIC
ABNORMALITIES ARE THE MOST FREQUENT
REVIEWS AND COMPLETES
THE ABNORMALITY REPORTS
ON A DAILY BASIS
MANAGER
Figure 5.3: Flowchart of a Process for Addressing Abnormalities.
MAKES ABNORMALITY
REPORT
ACTS UPON
IMMEDIATE CAUSE
CONDUCT ABNORMALITY
ANALYSIS AT SITE
YES
CHECKS COMPLIANCE
WITH STANDARDS
AUTHORIZES REMOVAL
OF SYMPTOM
SUPERVISOR
Occurrence of the abnormality
Remove symptom
Investigate the cause
1
Is there
a standard
procedure?
Prepare a standard operational
procedure and make sure that all
operators are trained in it.
No
Yes
Is the
standard
procedure
appropriate
?
No
The operators
have difficulty in
understanding it
It is not in a
usable form
Yes
2
Rewrite the
standard to conform
to the current work
method
No
The operators
do not understand
the standard
Was
the standard
operational
procedure being
followed
?
The operators are
not trained so as to
be able to follow
the standard
6
5
Train the operators
in the standard
Offer technical
training to the
operators or reassign
them in other work
It is not practical
or does not
produce good
results
4
3
Rewrite the standard
using diagrams and
figures for easy
understanding
Take another look
at the standard
from a technical
perspective
Yes
The operators
do not feel the
need to
follow the standard
7
Instruct and orient
the operators to
follow the standard
Work conditions
are inadequate
8
Easy to make error
using procedure, or
complicated
equipment
9
Improve work
conditions
Improve work
methods,
introducing foolproof mechanisms
Figure 5.4: Countermeasures for Preventing the Recurrence of Abnormalities,
according to Hosotani(7).
Table 5.1: Supervisor Training in standard operational procedures.
1
Show the supervisor how to perform the task
according to the standard operational procedure.
2
Explain to him or her why the standard
operational procedure should be followed.
3
Let him or her do it as instructed.
4
Repeat it until he or she is able to do it alone.
5
Now evaluate whether the supervisor is ready to
teach the operator.
NO
YES
6
Certify the supervisor in the task.
Observation: Note that this sequence is the basis for operational
training on any hierarchical level. For example: a
sales manager should be trained in how to make a
sales forecast precisely as shown here.
92
Production
Losses
in 1993.
(tons/day)
0
420
93
240
J
F
M A M
100
J
S
D
300
O N
Losses
from
Stops
A
Losses
from
Defects
Decline
in
Rhythm
J
*
120
200
80
40
20
Losses from
Unforeseen
Breakage
200
80
Losses from
Tool
Replacement
100
20
Losses from
Intermittent
Stops
65
10
4
20
ce
1
Losses from
Breakage in
the Roller
120
sc
G
u
id
re e
w
Losses from
Scrap
100
ive
Losses from
Production
Start
50
30
20
50
5
6
20
Losses in
Roller
Lines
3
rs
19
Figure 5.5: Pareto Analysis in Preparation for the Current Situation Report (simulation).
Sto
ps
De
fec
ts
D
Sp eclin
ee e
d in
U
Br nfor
ea es
ka ee
g n
To e
Re ol
pla
c
em
en
t
n
Ro
lle
r
Ro
l
l
e
rL
ine
Cy
R lin
e
pla der
ce
G me
Re uide nt
p
lac
em
G
Sc
rap
Pr
Sta odu
rt ctio
In
L ter
o
sse mitt
en
s
t
D
Sp eclin
ee e
d in
na
Fu
r
en
t
uid
eb
r
ea
ka
ge
Po
w
e
r lo
ss
Lu
b
r
ica
tio
n
GOAL
(380)
rs
Dr
Cr
ac
ks
Production
Losses in 500
tons/day
he
Ot
ng
BETTER
m
Sc
ali
Ha
rd
n
ar
ing
kle
s
en
Di
es
s
Re
s
r
p
W
ar
sio
n
Ot
h
Be
ce
ne
Tu
r
W
rin
ist
an
he
M
ing
60
4
2
11
15
gs
Ot
ot
or
s
rs
he
Ot
er
s
rin
Be
a
1000
le
Ax
5
n=5
50
UCL = 45,69
40
X
LC = 29.86
30
20
LCL = 14,03
60
R
UCL = 58,04
40
20
x
xx x x
x
x
x
x
5
x
x
x
x
x x
x
x
x x x x
x
x
LC = 27.44
x
x
10
15
20
25
Control Card X - R
Figure 6.1: Control Card (UCL = Upper Control Limit; LCL = Lower Control Limit).
24
6
18
Hour of the day
12
24
LSL (15)
USL (25)
(20)
Value sought
(Standard goal)
Figure 6.2: Sequential Graph (USL = Upper Specification Limit; LSL = Lower Specification Limit).
0
5
Time
necessary to
make up a 15
hotel room,
in minutes 10
20
25
LSL
140
USL
160
180
Figure 6.3: Histogram (USL = Upper Specification Limit; LSL = Lower Specification Limit).
Energy Consumption
ICNº IC-R-93-01-14
Dimension: Cost
400
500
00
475
01
455
F
M
A
M
J
02
J
A
S
O
Figure 6.4: Sequential Graph of a Cost Control Item.
J
N
D
*
(380)
BENCHMARK
COMPANY Y, INC.
GOAL (425)
BETTER
Front Office: ________________ Management: ____________ Control: Monthly
XX Company, Inc.
(kWh/t)
PROCESS
RAW
MATERIALS
EQUIPMENT
RESULTS
450
INFORMATION
n=2
LSC = 449,79
LC = 406,31
X 400
LIC = 362,84
350
100
LSC = 75,55
ENVIRONMENTAL
CONDITIONS
50
PEOPLE
PROCEDURES
LC = 23,13
R
0
1
2
3
4
9
10 11 12
Operators conforming to SOPs
MAINTAIN
DIAGNOSIS/
TREATMENT
(SUPERVISOR)
ABNORMALITY REPORT
(OPERATOR)
- 5 SENSES REMOVAL OF SYMPTOM
(OPERATOR/SUPERVISOR)
COUNTERMEASURES
AGAINST
IMMEDIATE CAUSES
day
YES
OK
?
NO
SPECIAL
CAUSE
?
COMMON
(CHRONIC)
ABNORMALITY ANALYSIS
(SUPERVISOR)
ABNORMALITY REPORT
(SUPERVISOR)
ADDITIONAL
COUNTER MEASURES
(MANAGER)
DAILY REVIEW
(MANAGER)
The person responsible for the ACTION is indicated in parentheses.
Figure 7.1: “Basic Process Control” for sustaining results.
(This figure is shown complete in Figure 10.5)
SUPPLIERS
PROCEDURES
EQUIPMENT
PEOPLE
INFORMATION
CHECK
ITEMS
CONTROL
ITEMS
(ENDS)
RESULTS
RESPONSIBILITY
CUSTOMERS
EMPLOYEES
STOCKHOLDERS
NEIGHBORS
OBJECTIVE
PEOPLE´S
SATISFACTION
TOTAL QUALITY
GOALS
Figure 8.1: Basic Features of the Managerial Process.
YOUR MANAGERIAL AREA
(MEANS)
ENVIRONMENTHAL
CONDITIONS
RAW
MATERIALS
AUTHORITY
Table 8.1: How to Improve Your Daily Work Routine Management.
1
Make a description of your business (See Table 8.2).
2
Define your priority products (the one which takes most
time, the one which presents most problems, etc).
3
Make a flowchart of each process, always beginning with
the highest priority (or most critical) product (See Annex
C and item 4.1).
4
Promote the standardization of priority tasks (See items 4.2
and 4.3).
5
Define the control items (See item 8.6).
- for each product of your business (quality, cost, delivery, and
safety),
- for the people who work in your business (morale and safety).
6
Define the goals for each control item, consulting the
customers for each product and the needs of the company
(See item 8.9).
7
Establish your benchmark values as you go along (See
item 8.9).
8
Draw graphs for your control items (See Figures 6.1, 6.2,
6.3, and 6.4). Standardize your graphs.
9
Standardize each process (See Figures 10.1 and 10.2).
10
Manage. Attain the goals (See Annex A).
- for standard goals use SDCA (See Figure 10.5).
- for improvement goals use PDCA (See Annex E).
Table 8.2: How to Describe Your Business
1
Hold a meeting with your fellow workers.
Provide flip-chart paper and magic markers.
2
On the flip-chart, draw a square in the middle and write
in it the name of your sector (for example: finance,
shipping, refining, etc)
(See Figure 8.2).
3
Below, write how many people work in your business
(list only those who are under your authority).
List also important equipment used in your business.
4
On the right-hand side of the square, design a tree-branch
diagram and begin listing the products of your business
(See item 8.5).
5
List the customers for each product.
6
Now, on the left-hand side of the square make another
tree-branch diagram and list the products you receive
from suppliers.
7
Define the suppliers of each product.
8
OK. You have just defined your business.
OBSERVATION: Hang the flip-chart paper with the description of
your business on the wall and let your fellow workers think about it.
They may want to contribute additional information. When it seems
complete, write it up neatly and place the scheme on a board so that
it is very clear what your business is.
PRODUCTION/
DISTRIBUTION GRID
PRODUCT SUPPLY
ORDER
WAGON PROJECT
FEEDBACK
- 5 COMPUTERS
- 2 TERMINALS
- 4 PRINTERS
- 8 TELEPHONES
- 6 CALCULATORS
- FAX AND XEROX MACHINES
EQUIPMENTS
- HUGO - MANAGER
- MARX - PROJECT DRAFT
- FORTUNATO - DISTRIBUTION/RECEPTION DESK
- JOSÉ DOMINGOS PRICES
- BERNARDO - PURCHASE
- ELIANE - DISTRIB./RECEP. DESK
- WALTER - DISTRIB./RECEP. DESK
- ALESSANDRO - DISTRIB./RECEP. DESK
- SAULO - DISTRIB./RECEP. DESK
- VAGNER - DISTRIB./RECEP. DESK
- 2 TRAINEES - TO BE DEFINED
PEOPLE
- ENSURE THAT PRODUCTION AND
DISTRIBUTION ARE ACCORDING
TO COMPANY POLICIES AND
COMPATIBLE WITH THE
REQUIREMENTS OF THE UNIT
MISSION
PCPD
PLANNING AND
CONTROL OF PRODUCTION
AND DISTRIBUTION
BUSINESS
BUSINESS
BOTTLE LOAN
AUTHORIZED
RECEPTION FOR REINFORCEMENT
PRODUCTS AUTHORIZED
FORECAST FIGURES FOR
SALES CALCULATED
PRODUCTS DISTRIBUTED
CHECK FOR ENTERED BOTTLES
DELIVERED
STOCK ROTATION DONE
BOTTLING LINE SUPPLIED
PRICE TABLES ASSESSED
PRICE TABLE ISSUED
PRODUCTION SUPPLIED WITH KELLCOLOID/
INFUSION EARTH
PRODUCTION SUPPLIEDX WITH INPUTS/
CORKS/PET/ CARDBOARD TRAY/LABLE
PRODUCTION SUPPLIED WITH
BOTTLES/BOTTLERS
BOTTLING/MANUFACTURE
PROJECT
PRODUCT
- COMMERCIAL D.
- COMMERCIAL D.
- FINANCE D.
- COMMERCIAL D.
- FINANCE D.
- COMMERCIAL D.
- INDUSTRIAL DIR.
- INDUSTRIAL D.
- GENERAL M.
- COMMERCIAL D.
- GENERAL M.
- INDUSTRIAL D.
- GENERAL M.
- INDUSTRIAL D.
- GENERAL M.
- INDUSTRIAL D.
- GENERAL M.
- INDUSTRIAL D.
CLIENTS
Figure 8.2: Description of the “Production and Distribution Planning and Control” Business of Company S.
LOGISTICS M.
SHIPPING COMPANY
ES. COMMERCIAL D.
CVRD
RESALES
SHIPPING COMPANIES
PRICE TABLE
REQUEST FOR THE LOAN OF
BOTTLES
COMMERCIAL D.
OTHER UNITS
REQUEST FOR PRODUCT
REINFORCEMENT
REMOVAL SCHEDULE
LEGISLATION
PRICE POLICY
COMMERCIAL D.
COMMERCIAL Ds.
/ UNITS
COMMERCIAL D.
MARKETING BOARD
FINANCE BOARD
FINANCE BOARD
MARKETING BOARD
TOP MANAGEMENT
INDUSTRIAL D.
ORDERS
INPUT AND PACKAGE
CONSUMPTION
STANDARDS
INDUSTRIAL D.
INPUTS
PRODUCTION CAPACITY/
(BOT. + MANUF.)
SUPPLIERS
Personnel
Environmental
Procedures
conditions
PEOPLE
PRODUCTS
OF EMPLOYEES
OF NEIGHBORS
OF CUSTOMERS
RIGHT TIME
RIGHT QUANTITY
CARACTERISTICS THAT MEASURE
EVERYONE’S SATISFACTION
MORALE
SAFETY
DELIVERY
RIGHT PLACE
COST (COST, PRICE, PROFIT, MARGIN)
INSTRINSIC QUALITY
Figure 8.3: Origin and Coverage of Your Control Items.
Information
Equipment
Raw
materials
Imagine yourself president
of this “small company”
Table 8.3: Method for Determining Control Items in Daily Work Routine
Management at all Hierarchical Levels.
(See Figure 8.4)
1
Get together your staff and immediate co-workers.
2
Ask: “What are our products?” (”What do we do here?”). Anything
that is done to meet someone’s needs (or as a result of this) is a
product (goods and services).
3
Who are the (internal and external) customers for each product?
What are our customers’ needs? Ask each one in person.
4
Quality Control Items: How can we measure quality (meeting the
needs of our customers) of each of our products? Are our customers
satisfied? What is the number of complaints? What is the rate of
rejects?
5
Cost Control Items: What is the cost sheet for each product? (Make
one yourself, even if in approximate figures. Do not wait for the Costs
Department, nor should you be afraid of committing errors). What is
the unit cost of the product?
6
Delivery Control Items: What percentage of each product delivery
fails to meet deadlines? What is the percentage of deliveries to the
wrong address? What is the percentage of deliveries of the wrong
quantity? Etc.
7
Morale Control Items: What is the turnover in our team? What is the
absentee rate? What is the number of shop steward complaints?
What is the number of health unit visits? What is the number of
suggestions? Etc.
8
Safety Control Items: What is the number of accidents in our team?
How serious are they? What is the number of accidents among our
customers because of the use of our product? Etc.
Company
Manufacture
Equipment and
Services Made
Available
Affects final consumer
Manufacture
Manufacture/
Sales
Production
Planned
Production
Supplied
(Dir./ Indir. Mat.)
External
Clients
Products
delivered to
clients
Obeying Restrictions
from Manufacture
Quantity/Deadline
Quality (Released)
Cost
Quantity/Deadline
Quality (Released)
Supply Flexibility
Low Acquisition Cost
Stocks
Quantity
Models
Deadline
Deadline
Product as ordered
Quantity (volume) of Correct Billing
Product Integrity
Cost of Deliveries
Needs
Variation in equipment and service
costs
Number of missing items
Value of Total Stock
Number of raw materials (items)
missing in production
Number of MNC - material nonconformity
Evolution in raw material costs
Evolution in indirect material costs
Planned x actual production at closure
. Quantity
. Model
Number of orders not delivered to
clients on schedule
Orders x billing portfolio
Total Lead Time
Amount of divergence between orders
& deliveries in relation to:
. Product as ordered
. Quantity (volume)
. Product Integrity
. Billing
Costs of Order Deliveries
Control Item
Figure 8.4: Example of a sequence for defining the Control Items of a Logistics Director.
Logistics
Mission
Clients
Products
SALES
PRODUCT
(OR
FUNCTION)
ETC.
MARKET
SHARE OF
PRODUCT “X”
CONTROL
ITEM
PORCENTAGE
OF SALES
OVER TOTAL
SALES OF A
SIMILAR
PRODUCT
UNIT OF
MEASUREMENT
A
PRIORITY
(A, B, C)
WHEN TO ACT
CONTROL
ONCE A MONTH ALWAYS WHEN
LESS THAN 50%
FREQUENCY
Table 8.4: Example of a Control Items Table.
CALL A
MEETING OF
MANAGERS,
SALES PEOPLE
OF THE AREA
AND OF
TECHNICAL
ASSISTANCE.
DETERMINE
CAUSES AND
TAKE ACTION.
HOW TO ACT
METHOD
NUMBER OF
COMPLAINTS
PER MONTH
0
10
20
95
M J J A S O N D
Figure 8.5: Practical Rule for setting up Goals.
94
*
“THEORETICALLY ATTAINABLE VALUE”
IN THIS CASE IS ZERO
Goal Line
J F M A M J J A S O N D J F M A
AVERAGE
VALUE (16)
BETTER
GOAL
(8)
DEFECT RATE (%)
(Percentage in
weight of
defective
material over
total produced)
YOUR PROCESS
92
93
94
J F M J J A S O N D
Figure 8.6: Definition of a “Problem”.
1,0
2,0
3,0
4,0
RESULTS
*
GOAL
PROBLEM
FOR 1994
TOTAL
PROBLEM
Table 9.1: Simplified Method for Identifying Bad Results in Your
Management Area.
1 Call in your staff and immediate co-workers and make a short presentation of
the theme: “What comprises a problem”.
2 Give a piece of paper to each of the participants and ask them to list the main
problems in your managerial area.
3 Collect the opinions and screen the problems, examining each problem with
everyone present. Select those that are “undesirable results” (the excluded
suggestions should be kept for future action).
4 If the group so wishes, distribute more paper and have the participants list
additional problems.
5 Classify the problems (“undesirable results”) into controllable (those over
which it is possible to “exercise control” within the managerial area itself)
and not controllable.
6 Among the controllable problems, select those that can be most easily
solved in the short term (around 3 months) and use PDCA to solve them. This
is equivalent to on-the-job training in the PDCA method.
7 The problems that depend for their solution on other managerial units
should be treated within a crossfunctional relationship.
8 When problems brought up are vital for the company and their solution
depends on the organization, the board should set up a committee and a
crossfunctional work group to solve them.
N
Y
8
7
CONCLUSION
STANDARDIZATION
WAS RECURRENCE PREVENTION
EFFECTIVE?
CHECKING
6
?
EXECUTION
ACTION PLAN
4
5
ANALYSIS OF THE PROCESS
ANALYSIS OF THE PHENOMENON
2
3
IDENTIFICATION OF PROBLEM
PHASE
1
FLOW
CHART
* For more details on this method see Annex E.
A
C
D
P
PDCA
OBJECTIVE
Go over the solving process for future work.
To caution against problem recurrence.
To verify that recurrence prevention was effective.
To eliminate the root causes.
To conceive a plan for each small problem in order to
eliminate the root causes.
To discover the root causes of each small problem.
To investigate the specific characteristics of the problem with
an open mind and from several points of view. To break down
a bigger problem into smaller problems.
To clearly define the problem and recognize its importance.
Table 9.2: Problem-Solving Method.
A
C
D
P
N
Y
3
Standardize (adopt that which was successful)
Conclude
7
8
Level the base
of the equipment
Augusto
Gerson
Responsible
WHO
0
1
5/20/94
4/15/94
Time
WHEN
91
Bar rolling
Location
WHERE
Goal
0,6
To prevent
sleeve
breakage
Reason
WHY
Procedure
HOW
This is an important part
of any action plan
93
*
Problem
Present Situation
This action plan should be discussed
and approved by the department
head (it may involve investment). There is
one Action Plan for each small problem.
92
Eliminate that which does not work and go back to
phase 2 until you are able to reach the GOAL.
EVERY SUCH RETURN IS A PDCA ROUND.
Every PDCA round is a new action plan, a new
Three-Generation Report.
3 Regulate injectors
2 Change rollers
1
Countermeasure
WHAT
PLANNING PHASE
(This may take a
number of months
or be done at one
meeting, depending
on the complexity
of the problem)
Figure 9.1: Managerial Action Using PDCA.
Checking of the “Control Item”
“Check the progress of your control item”
Check the execution of the plan
PLAN EXECUTION
“Set of countermeasures”- 5W 1H
ACTION PLAN
6
5
4
Analysis (search for causes by your team)
(5 whys)
2
Causes
Observation (using data). Break down the
problem into smaller ones.
Small
Problem
Identification of the problem
“Difference Between Goal and
Current Situation”
1
Defect
index %
2
CONTROL ITEM
1
What has been planned
PAST
2
What was done
PRESENT
3
The results
PRESENT
4
Problem points
PRESENT
5
Proposal (plan)
to resolve problem
points
FUTURE
6 CHECK
5 EXECUTE
4 ACTION PLAN
D
E
What you
wanted to do
PLANNED
7 Standardize
C
A
Poor Result (“Bad News”)
Good Result
B
A
RESULTS
Why was it not possible to carry
out the production in the open 6t
vacuum tank?
3 NEW ANALYSIS
4
S
R
What was
bad? Why?
PROBLEM
POINTS
PROPOSAL
V
X
T
U
NEW
ACTION
PLAN
What should
be done
about the
poor results
SECTOR: Refined Product Sector
Show in graph from,
quantitatively, the good
and poor results
(merits and demerits)
8 CONCLUDE
What you
did
EXECUTED
THREE GENERATION REPORT
CONTROL ITEM: Production in t/d.
PROBLEM: Low production level.
Figure 9.2: Stages in Setting up a Three-Generation Report, showing the solution of a problem
through several PDCA rounds.
C
D
P
WHY
PRODUCTION
LEVEL IS LOW
3 ANALYZE
2 OBSERVE
1 IDENTIFY THE PROBLEM
1. Conducted
successfully.
2. Transport time
reduced.
3. Maintained at the
end of the period.
4. Analysis done.
5. Flowchart time
reduced from the
total lead time.
6. Run time reduced.
2. Rationalize the
transport of raw
liquid.
3. Maintain the charge
volume constant.
4. Identify bottleneck in
the flowchart.
5. Carry out logical
solutions for the
bottleneck.
6. Analyze the efficiency
of 6 t tank (open and
vacuum).
EXECUTED
1. Carry out production
experiments with a
6t tank (open and
vacuum).
PLANNED
(Month)
2 4 6 8 10 12
2.000
1.000
0
2.000
1.000
0
Graph of the evolution
of volume of
production in a 6 t tank
open and vacuum
(Month)
Graph of the evolution
of volume of
production of other
machines
(bottlenecks)
(Month)
2 4 6 8 10 12
3.000
3.000
2 4 6 8 10 12
4.000
4.000
Control graph of
index achieved with
planned charge
(Month)
2 4 6 8 10 12
Objective: 3,678t/year
Actual result: 4,419t/year
Achieved: 114,0%
0
100
98
102
(%)
Objective: 100%/year
Actual result: 100,3%/year
Achieved: 100,3%
Objective: 2,060t/year
Actual result: 1,450t/year
Achieved: 70,4%
Graph of the
evolution of
production volume
0
2.000
4.000
6.000
Objective: 5,936t/year
Actual result: 5.870t/year
Achieved: 98,9%
RESULTS
3. The Rinse Shampoo production
was less than the forecast for
the year. (Of 219 t planned for
RGSA, RGSB, RPGA and RPGB,
6 t were produced).
2. The product that should be
produced with a 6 t mixer was
produced in lots with 1 t mixer.
(RPTD 18.5%, PETK 0.5).
1. Until June, production was not
possible using the 6 t mixer
owing to problems of drop in
RPTD viscosity. (Of 260 t, only
4% were produced).
Reasons for not achieving
production in the open 6t
vacuum tank.
PROBLEM POINTS
THREE-GENERATION REPORT
SECTOR: Refined Material Production
DATE: 09/30/92
Table 9.3: Three-Generation Report.
CONTROL ITEM: Production in t/day
GOAL: Raise production volume to levels indicated
PROBLEM: Low Production Volume
(ton)
precision of sales
forecast. (Other
divisions).
Resp.: Sales Division
Deadline: Annual
meeting 12/12/92.
. Necessary to raise the
combined production
with the lot volume.
Resp.: John
Deadline: 11/30/92
. If possible, resort to
of the emulsion lot,
confirmation of the
items to ensure quality
is necessary.
Resp.: Edward
Deadline: 11/15/92
. To increase the volume
PROPOSAL
Upper
Management
DIVISION
Reports,
Documents or
Division Department Section Staff and
Standards
Manager Manager
Manager Supervision
• Basic Standard
Managerial
Theory
Corporation Analysis
Managerial Resources Analysis
External Factors Analysis
P
• Medium Term
Planning Standard
Establishment of Basic
Work and Organizational
Goals
• List of Shared
Functions
Deployment of Goals and
Work Functions
NEGOTIATION: Checking of the Compatibility
Between the Work Designation and the
Organization
NEGOTIATION: Adjustment of Goals,
Production, and Control Items.
• Control Cards
• Company’s
Standardization
Manual
Work Standardization
P-D-C-A
CHECK
C
• Standard process
Flowchart
EXECUTION
D
Monthly
Report
Monthly
Report
• Abnormality
Report
Monthly
Report
Top Management
Diagnosis
(monthly) (A)
• Business Report
• Diagnosis A
Report
Top Management Diagnosis
(occasional) (B)
A
• Organization
Chart
• Control Items
Table
Reconsideration of Annual Activities
Status Report
• Diagnosis B
Report
• List of Vital
Problems
Figure 10.1: Example of a Managerial Standard (Daily Work Routine
Management System).
INGOT
CASTING
PLATFORM
OPERATOR
TOWER
OPERATOR
CONTROL
PANEL
OPERATOR
INJECTION
STANDARD
BS-5201
BETWEEN
1570 and 1600ºC
BETWEEN
2 and 3 m/min
CARBON
IN LADLE
CASTING
TEMPERATURE
CASTING
SPEED
BETWEEN
0,45 - 0,56%
100%
(ABSENCE
OF
BLISTERS,
CRACKS
AND FAULTS
CARBON
CONTENT
SURFACE
QUALITY
SHIFT
FOREMAN
SHIFT
FOREMAN
SHIFT
FOREMAN
LEADER
WHAT MUST BE DONE BY
THE OPERATOR UPON FINDING
AN ABNORMALITY
PO-583
CONTINUOUS
RECORD
AM-031
VELOCITY
GAUGE
CORRECTION
STANDARD
BS-6881
RUN
SHEET
THERMOCOUPLE
AX-32
CORRECTION
STANDARD
BS-7318
RUN
SHEET
RUN
SHEET
LEADER
LEADER
CORRECTION
STANDARD
BS-7318
CORRECTION
STANDARD
BS-7318
WHO TO
SEEK OUT
WHAT TO
DO
CORRECTIVE
ACTION
X-RAYS
FLOW
METER
AS-536
RUN
SHEET
PRESSURE
GAUGE
AS-432
HOW TO MEASURE AND REGISTER
CONTROL PARAMETERS
ALL RUNS
ALL RUNS
ALL RUNS
RUN
SHEET
RECORD
TIMER
MEASURING
INSTRUMENT
Figure 10.2: Example of a Process Technical Standard.
WHAT MUST BE ADJUSTED
BY THE OPERATORS
ALL RUNS
BLOW
OPERATOR
BETWEEN
1 and 1,5 Nm3/t
DISCHARGE
WHAT MUST BE ENSURED
BY THE OPERATIONS
ALL RUNS
BLOW
OPERATOR
BETWEEN 2
and 2,5 atm.
BLOW
PRESSURE
ALL RUNS
BLOW
OPERATOR
BETWEEN 2,5
and 3 min.
ARGON
BLOW TIME
MEASUREMENT
(TIME/FREQ)
COMPOSITION
AND
TEMPERATURE
VARIATIONS
DURING
THE RUN
LESS THAN
3%
PERSON
RESPONSIBLE
HOMOGENEITY
STANDARD
VALUE
CHECKING METHOD
WHO WHEN WHERE HOW
CONTROL
PARAMETER
LADLE
METALURGY
WHAT
CONTROL
LEVEL
VALUE
ASSURED
QUALITY
CHARACTERISTIC
NAME OF
OPERATION
PROCESS
FLOWCHART
PROCESS
QUALITY
ASSURANCE
PROCESS ANALYSIS RESULTS ARE PLACED HERE
(THEY ARE A COMPANY SECRET)
Flowchart
Name
PROCESS
QUALITY
ASSURANCE
CONTROL
LEVEL
CHECKING METHOD
CORRECTIVE
ACTION
The lines of this document are
related to standard operational
procedures.
Indicate here what the operator should do
upon perceiving an abnormality.
Specify here who should carry out the
measurement, the frequency of the
measurement, the instrument, and the
way the form is to be filled out.
The operator “adjusts” these variables so
that they conform to the standards set up
by engineering.
MEANS
Figure 10.3: How to Use a Process Technical Standard.
The operator may measure and even plot these
variables on a graph, but only the supervisor
may take corrective action in case of abnormalities.
Control charts are utilized with these variables,
if needed.
The flowchart goes here,
as determined in item 3.1.
The results of the
process analysis
conducted during
the development of a
new product or
optimization of an
existing product
are placed in the two
columns shown.
QUALITY
CHARACTERISTICS
END
FLOWCHART
20 ± 0,1 mm
40 - 60
HARDNESS
DIAMETER
SURFACE
QUALITY
HEAT
TREATMENT
BENDING
19,9
45
99
20,1 mm
55 HR
1,02
1,35
0,65
Cpk
THE RESULTS OF THE QUALITY
CHARACTERISTICS
EVALUATION ARE PLACED HERE
101 mm
HISTOGRAM
EVALUATION OF OPERATION RESULTS
Figure 10.4: Suggested Model for a Process Evaluation Report.
THIS PART COMES FROM THE
PROCESS TECHNICAL
STANDARD (” QC PROCESS CHART”)
100 ± 1 mm
LENGTH
CUT
45 - 55 HR
VALUE
ESTABLISHED BY
ENGINEERING
QUALITY
CHARACTERISTICS
QUALITY ASSURANCE
NAME OF
OPERATION
PROCESS
RESULT
PROCESS
RAW
MATERIALS
EQUIPMENT
RESULTS
450
INFORMATION
n=2
LSC = 449,79
LC = 406,31
X 400
LIC = 362,84
350
100
LSC = 75,55
ENVIRONMENTAL
CONDITIONS
50
PEOPLE
LC = 23,13
PROCEDURES
R
0
Compliance with operational procedures
by workers
1
2
3
4
9 10 11 12
MAINTAIN
DIAGNOSIS/
TRAINING
(Supervisor)
ABNORMALITY REPORT
(Operator)
5 Senses
SPECIAL
REMOVAL OF SYMPTOM
(Operator/Supervisor)
COUNTERMEASURES
AGAINST IMMEDIATE
CAUSES
YES
Day
OK
?
NO
CAUSE
?
COMMON
(CHRONIC)
ABNORMALITY ANALYSIS
(Supervisor)
ABNORMALITY REPORT
(Supervisor)
ADDITIONAL
COUNTERMEASURES
(Manager)
DAILY REVIEW
(Manager)
PERIODIC REVIEW
(Pareto Analysis)
Identification of Chronic
Abnormalities
(Manager)
COUNTERMEASURES
AGAINST
ROOT CAUSES
TREATMENT OF CHRONIC
PROBLEMS
(Manager)
A P
Problem-Solving
C D
Method
(“QC Story”)
6-MONTHLY STATUS REPORT
(All Managerial Levels)
(Part of Policy
Deployment)
STUDY OF STATUS REPORTS
AND SETTING OF ANNUAL
POLICIES FOR REDUCING
ABNORMALITIES
(Top Management)
The person responsible for the ACTION is indicated in parentheses.
Figure 10.5: Advanced Process Control
(This figure complements Figure 7.1).
People
Environmental
Conditions
Procedures
Information
6 Procedures should be standardized
and the work should be in accordance
with the standards.
The detailed flowchart of the
process is of fundamental
importance for assuring quality.
Product
7 The product should meet
specifications, and have maximum
economically viable reliability.
Inspection procedures should be
audited.
3 Measuring instruments should
be checked regularly for accuracy.
This measurement should be audited.
Figure 11.1: Overview of the Process Quality Assurance.
5 People should be trained
and this training should
be audited.
Equipment
Interruptions cause
variations and defects.
The machinery should not
stop. Maintenance for
maximum reliability and
availability. Maintenance
should be audited.
Raw
materials
4 Environmental conditions
should be specified: dust,
temperature, humidity, etc.
1 The quality systems
of suppliers should
be audited.
2
(A)
LSL
USL
LSL
USL
Nonconformity
High Dispersion
Low Dispersion
USL = Lower Specification Limit
USL = Upper Specification Limit
(B)
Temperature
Hardness
Time
Figure 11.2: Concept of Dispersion.
P
D
A
C
(Compliance with standards)
IMPLEMENTATION OF
QUALITY ASSURANCE
- Process Technical Standard or
System Standard
- Standard Operational Procedures
QUALITY ASSURANCE
PROJECT
Figure 11.3: Relationships Among Planning, Execution, and Auditing Functions in Quality Assurance.
QUALITY AUDIT
(Internal or external)
(Checking compliance with
standards)
QUALITY CHECK
CORRECTIVE ACTIONS
FOR THE PLANNING,
EXECUTION, AND
AUDITING PROCESSES
Customers
CARRYING
OUT
QUALITY
QUALITY
PLANNING
THE CONCEPT OF QUALITY
ASSURANCE
A P
C D
P
A
ENGINEERING
SPECIFICATION
OF MATERIALS
PROCESS
DESIGN
PRODUCT
DESIGN
CUSTOMER
NEEDS
STANDARDS
DAILY WORK ROUTINE MANAGEMENT
D
A
SUPPLIERS
CUSTOMERS
COMPLIANCE WITH STANDARDS
AUDIT OF
SUPPLIERS’
QUALITY
CONTROL SYSTEM
PROCESS
AUDIT
PRODUCT
AUDIT
“QUALITY
ASSURANCE”
C
CUSTOMER
COMPLAINTS
AND CLAIMS
NONCONFORMITY
REPORT
Figure 11.4: Arrangement of the Various Activities that Ensure Quality
for Customers.
INTERNAL AUDIT OF STANDARD
OPERATIONAL PROCEDURE (SOP)
COMPANY B
AUDITOR
AUDITEE
POSITION
JOHN SMITH
WILLIAM WALKER
FURNACE OPERATOR
LOCATION: FURNACE PLATAFORM
DATE: 03/16/93 AUDIT Nº 32
S.O.P.: PLACE LADLE ON SUPPORT
QUESTIONNAIRE:
1
2
3
4
5
6
-
IS THE S.O.P. IN THE AREA?
DOES THE S.O.P. HAVE ANY CHECK LIST FOR QUICK CONSULTATION?
DOES THE OPERATOR HAVE QUICK ACCESS TO THE S.O.P. FOR CONSULTING?
IS THE LATEST VERSION OF THE S.O.P. AVAILABLE IN THE WORK AREA?
ARE THE REVISED ITEMS CLEAR TO THE OPERATOR?
ARE THE CONDITIONS REQUIRED BY THE S.O.P. MET IN TERMS OF:
6.1 - MACHINES, EQUIPMENT
6.2 - AREA CONDITIONS
6.3 - SAFETY
6.4 - RAW MATERIALS
6.5 - OTHERS (________)?
7 - IN ACCORDANCE WITH THE S.O.P., ARE THE MAIN ITEMS BEING FOLLOWED IN TERMS OF:
7.1 - LOCATION FOR SIGNS
( ) YES (x) NO 7.6 - _____________________________
7.2 - USE OF EPI’S? __________ (x) YES ( ) NO 7.7 - _____________________________
7.3 - _______________________ ( ) YES ( ) NO 7.8 - _____________________________
7.4 - _______________________ ( ) YES ( ) NO 7.9 - _____________________________
7.5 - _______________________ ( ) YES ( ) NO 7.10 - _____________________________
(x) YES
(x) YES
(x) YES
(x) YES
(x) YES
(
(
(
(
(
) NO
) NO
) NO
) NO
) NO
(x) YES
(x) YES
(x) YES
( ) YES
( ) YES
(
(
(
(
(
) NO
) NO
) NO
) NO
) NO
(
(
(
(
(
(
(
(
(
(
) NO
) NO
) NO
) NO
) NO
) YES
) YES
) YES
) YES
) YES
IN CASE AN ESTABLISHED ITEM IS NOT BEING FOLLOWED, DESCRIBE THE REASON
________________________________________________________________________________
________________________________________________________________________________
________________________________________________________________________________
WHAT ALTERNATIVE IS SUGGESTED BY THE OPERATOR?
________________________________________________________________________________
________________________________________________________________________________
________________________________________________________________________________
8 - DOES THE S.O.P. SPECIFY A CORRECTIVE ACTION WHEN THE ITEM IS NOT FOLLOWED?
9 - ARE SUPERVISORY PERSONNEL ADVISED OF THE CORRECTIVE ACTION?
10 - DOES THE OPERATOR REQUIRE RETRAINING?
11 - GENERAL CONDITIONS FOR CARRYING OUT THE S.O.P. ACCORDING TO THE AUDIT
( ) BAD
(x) YES ( ) NO
(x) YES ( ) NO
( ) YES (x) NO
( ) AVERAGE (x) GOOD
(x) YES ( ) NO
12 - DOES THE S.O.P. REQUIRE REVIEW?
WHY? ____________________________________________________________________________
____________________________________________________________________________
____________________________________________________________________________
____________________________________________________________________________
OBSERVATIONS: ________________________________________________________________________________________
______________________________________________________________________________________________________
______________________________________________________________________________________________________
______________________________________________________________________________________________________
Figure 11.5: Example of a Standard Operational Procedure Audit Report.
FOLLOW-UP METHOD
CONTROL
ITEMS OF
THE CHIEF
Reduce to 10
cases/year
CHART
AND
HIST.
Get to 100% within
specifications
Tensile strength
Number of client
complaints
QUALITY
COST
SOUZA
TELLES
TRAJANO
TELLES
AGUIAR
B
A
C
C
B
TIMETABLE
20 b /
min
0.1%
Coil loading
rate
Scrap
rate
Low relationship
Lack of relationship
Medium relationship
Strong (direct) relationship
CAPTION:
94%
JANUARY
50%
NOVEMBER
Availability of the
roller
SEPTEMBER
OCTOBER
Production losses
from broken bearings
CHECK
ITEMS
OF THE
CHIEF
GOALS
Figure 12.1: Process of deployment of the policies and their introduction into the annual action plan
from the first managerial level.
ANNUAL
ACTION PLAN
OF THE FIRST
MANAGERIAL
LEVEL
4. Reduce losses from
cracks
5. Reduce package
losses
2. Reduce bearing
breakage
3. Increase coil loading
rhythm
1. Reduce roller stops
PROJECTS
GOALS
OF THE
CHIEF
PRIORITY
ANNUAL GOALS OF THE
FIRST MANAGERIAL LEVEL
RESPONSIBLE
METHOD FOR
REACHING THESE
GOALS
MAY
ANNUAL GOALS OF
THE MANAGERS
APRIL
METHOD FOR
REACHING THESE
GOALS
FEBRUARY
MARCH
ANNUAL GOALS OF
THE DIRECTORS
JUNE
METHOD FOR
REACHING THESE
GOALS
JULY
AUGUST
ANNUAL GOALS OF
THE CEO
DECEMBER
TRACKING METHOD
SUPERVISOR’S
CONTROL
ITEMS
5. Reduce packaging
losses
4. Reduce crack losses
1. Reduce rolling-mill
stoppage
2. Reduce sleeve
breakage
3. Increase spool
exchange speed
AND
HIST.
GRAPH.
SOUZA
TELLES
TRAJANO
TELLES
AGUIAR
PRIORITY
B
A
C
C
B
50%
20 b /
min
0,1%
Production losses
by sleeve breakage
Spool charge rate
Waste rate
No relation
Weak realtion
Average relation
Very strong relation (Direct)
KEY:
94%
NOVERMBER
DECEMBER
Rolling-mill
availability
SUPERVISOR’S
CHECK ITEMS
CRONOGRAMA
Figure 12.2 : Annual Action Plan of a Basic Managerial Unit.
GRAPH
Number of customer
complains
PROJECTS
COST
JANUARY
FEBRUARY
MARCH
APRIL
MAY
JUNE
JULY
AUGUST
QUALITY
SEPTEMBER
OCTOBER
SUPERVISOR’S
GOALS
PERSON
RESPONSABILE
ACTION PLAN OF THE FIRST MANAGERIAL LEVEL
Reduce to
10 cases/year
Attain 100% of
specifications
Tensile strength
GOALS
FIRST
MANAGERIAL
LEVEL
SENIOR
MANAGER
DIRECTOR
PRESIDENT
ANNUAL
ACTION PLAN
A P
C D
PROJECT B GOALS
Figure 12.3: Annual Policy Deployment.
FIRST
MANAGERIAL
LEVEL POLICY
A P
C D
PROJECT A GOALS
SENIOR MANAGER’S
POLICY
DIRECTOR’S
POLICY
PRESIDENT’S
POLICY
ACTION PLAN
PROJECT B
ACTION PLAN
PROJECT A
SUPERVISORS
WORKERS
SUPERVISORS
SUPERVISORS
TECHNICAL
SUPPORT
FIRST MANAGERIAL
LEVEL
SUGGESTIONS
SYSTEM
A P
C D
Figure 13.1: Continuous Improvement Activities carried out in the Basic Managerial Units.
QUALITY
CONTROL
CIRCLES
A P
C D
ATTAIN
MANAGERIAL
GOALS
A P
C D
...
HUMAN NEEDS
BASIC NEEDS OF HUMAN
BEINGS
SIMULTANEITY
OF NEEDS
SELF-REALIZATION
Realization of your own potential,
self-development, creativity,
self-expression
SELF-REALIZATION
EGO OR ESTEEM
Self-confidence, independence,
reputation, etc.
SECURITY
Protection for yourself and
your family.
Stability at home and at work.
PHYSIOLOGICAL
Survival, food, clothing, and
shelter.
HUMAN GROWTH
SENSE OF BELONGING
Feelings of being accepted,
friendship, association, feeling of
belonging to the group.
EGO OR ESTEEM
SENSE OF
BELONGING
SECURITY
PHYSIOLOGICAL
Figure 13.2: Basic human needs, whose satisfaction are preconditions
for motivation.
MEANS
WASTE
WASTE
MEANS
MEANS
INCONSISTENCY
GOAL
GOAL
GOAL
"END”
PRODUCT
MEANS
INSUFFICIENCY
INSUFFICIENCY
Figure 14.1: The Concept of the Three Sources of Losses.
GOAL
INCONSISTENCY
PROCEDURES
ENVIRONMENTAL
CONDITIONS
PEOPLE
"MEANS”
INFORMATION
EQUIPMENT
RAW
MATERIAL
PROCESS
GOAL
ORIGIN OF
PROBLEMS
P R O C E S S
HUMAN
RESOURCES
RAW
MATERIALS
EQUIPMENT
utilized?
- Are the machines and tools being well-
- Is there any idle equipment?
layout?
- Is there any waste due to inadequate
- Is the equipment being underutilized?
- Is there corrosion prevention?
project?
- Is there any waste due to the process
- Is there energy waste?
- Is the rate of rejection high?
where cheaper ones might suffice?
- Are expensive raw materials being used
- Are yields low?
right time?
- Are the right tools in the right place at the
- Is there waste due to bad planning?
- Is there any movement wasted?
- Is there any job that does not add value?
WASTE
reasonable way or in a wasteful way?
- Is there any equipment being used in a
machines well balanced?
- Are the production capacities of the several
- Do the products have uneven finishing?
supervision?
- Are the machines getting enough
used for high-precision tasks?
- Are there low-precision machines being
from use above their capacity?
- Is the life of the machines being harmed
suppliers?
- Is there any insufficiency in items from
- Is there any insufficiency due to project?
- Are there any irregularities in the properties
of the materials?
- Is the strength enough for ensuring safety?
end of the job?
- Are there people who get too tired at the
machines and is being done manually?
- Is there any job that could be done by
- Is the quality of the materials uniform?
- Are people too busy at certain times and
having nothing to do at other times?
- Is there a good mix of experienced and
inexperienced staff members?
- Are there enough people to face the work
- Are there areas where people are
exhausted, and other areas where there is
nothing to do?
load?
INSUFFICIENCY
INCONSISTENCY
Table 14.1: The Technique of the Three Sources of Losses
MARKET RESEARCH
Identification of
consumer needs
A product that is better,
cheaper, and delivered more
quickly than the competitor’s
Product
- Better
- Cheaper
Design of new
product
Survival
- Safer
- Faster Delivery
- Easier Maintenance
Design of new
process
Definition
Satisfied
customer
Process
- Easier
- Better
- With less dispersion
- Cheaper
Production
- Faster
- Safer
Technical
assistance
Figure 14.2: Concept of Survival According to Miyauchi(12).
3
4
Improve the current way of working (KAIZEN)
Operate ever more efficiently a process that has
waste built into its design.
3
4
A P
C D
Eliminate waste contained in the design itself of
a previous process.
Promote drastic changes in the way of working
(INNOVATION)
Seek the ideal way of working (new process)
Reject the current way of working (process)
DRASTIC
IMPROVEMENTS
Figure 14.3: Comparison between “Successive Improvements” and “Drastic Improvements”.
2
Analyze the current way of working (process)
2
1
Accept the current way of working (process)
A P
C D
1
SUCCESSIVE
IMPROVEMENTS
CONTINUOUS IMPROVEMENT
ACTION
PLAN
DEFINE
GOALS
ACT IN THE PROCESS
ACCORDING TO
THE RESULTS
A P
C D
CHECK THE
EFECTS OF
THE WORK
DONE
DETERMINE
THE METHODS
TO REACH THE
GOALS
EDUCATE
AND TRAIN
EXECUTE
WORK
CHECK
Figure A.1: PDCA - Process Control Method.
DO
MANAGEMENT TO SUSTAIN RESULTS
STANDARD GOAL
S
1
STANDARD GOAL:
Standard Quality, Standard Cost, etc.
2
STANDARD OPERATIONAL PROCEDURE (S.O.P):
S.O.P. to attain the standard goals.
D
3
DO:
Comply with the S.O.P.
4
CHECK:
Confirm the effectiveness of the S.O.P.
SUSTAIN
450
n=2
UCL = 449,79
LC = 406,31
X 400
LCL = 362,84
C
350
100
UCL = 75,55
50
YES
EFECTIVE
?
NO
A
5
LC = 23,13
R
0
1
2
3
4
9 10 11 12
Day
CORRECTIVE ACTION:
Removal of the symptom.
Act on the cause.
Figure A.2: Detailed PDCA to Sustain Results.
MANAGEMENT TO IMPROVE
IMPROVEMENT GOAL
P
1
PROBLEM:
Identification of the problem.
2
PHENOMENON ANALYSIS:
Break down the problem in smaller problems.
3
PROCESS ANALYSIS:
Detection of main causes of each smaller problems.
4
D
ACTION PLAN:
Countermeasures against main causes of each
smaller problem.
5
DO:
Execute the “Action Plan”.
6
CHECK:
Confirm the Action’s Effectiveness.
C
BETTER
NO
EFECTIVE
?
Number of
complaints per
month
*
GOAL
YES
92
A
93
J
94
D
7
STANDARDIZATION:
Definitive elimination of causes.
8
CONCLUSION:
Review of activities and planning for future tasks.
Figure A.3: Detailed PDCA for Improvement.
A S
C D
PRODUCTS
STANDARDIZATION
A P
C D
ANNUAL
GOALS
MAINTAINS
IMPROVES
Figure A.4: PDCA applied with the goals of maintaining and improving.
CORRECTIVE
ACTION
PERIODIC
REVIEW OF
PRIORITY
CHRONIC
PROBLEMS
PRIORITY
CHRONIC
PROBLEMS
ANNUAL POLICIES OF TOP MANAGEMENT
(KAIZEN)
"EXISTING PROCESS”
TIME
C D
A P
"EXISTING PROCESS”
INNOVATION
(KAIKAKU)
"NEW PROCESS”
C D
A P
Figure A.5: Combination of Cycles for Sustaining and for Improving which make up Continuous Improvement.
LEVEL OF
RESULT
C D
A S
CONCEPT OF CONTINUOUS IMPROVEMENT
CONTROL
SHIFT ABNORMALITY
ANALYSIS REPORT
COMPANY B
SHIFT: 3
CREW
NUMBER: ___/___
DATE: 03/15/12
BRIEF DESCRIPTION OF ABNORMALITY/COMPLAINT:
Run with % of carbon above that intended.
DESIRED RESULT:
Carbon percentage = 0.093%.
RESULT OBTAINED:
Carbon percentage = 0.120%
DIFFERENCE:
Excess carbon percentage = 0.027%
BRAINSTORMING (POSSIBLE CAUSES):
Error in calculating amount added, lack of stop control in standard operational procedure.
Operator’s carelessness.
MOST PROBABLE CAUSES:
Machine
Labor
Environment
Operator’s carelessness
in regard to graphite
residue in cannon
Lack of stop
control in standard
operational procedure
Run with a high
percentage of carbon
Method
Raw material
ROOT CAUSE(S):
- Lack of stop control in standard operational procedure.
- Operator’s carelessness in regard to possible graphite residue in the cannon.
ACTION PLAN
WHAT
WHO
HOW (WHEN APPLICABLE)
WHEN
1 - Introduce stop control
(item 2) into the standard
procedure
Jason
Revising present standard
Immediately
2 - Make sure that the cannon
is empty
Furnace
operator
Injecting nitrogen into cannon
until it is thoroughly clean
When recarburizing
the runs
3 - Limit carbon content range
to 0.085-0.105%
Cid
Sending note to quality
assurance department
Immediate
4
6
Section:
Shift:
OP Number:
Control
Shift abnormality
analysis report
COMPANY "E"
2
1
Nº:
____/____
3
Date:____/____/____
C.C.:
7
Crew:
8
Description of OP:
Machine/Line:
Operator:
9
Detected by:
5
10
11
12
13
Time:
Investigation of Causes:
Raw material
Equipment
Information
14
15
16
Abnormality
20
17
18
19
Environmental
Conditions
Personnel
Procedures
Why did the abnormality occur?
Probable cause:
21
22
Action Plan
What to do
23
Who
How to do it
When
24
25
26
Additional Information:
27
Supervisor’s comments:
28
29
Supervisor’s signature
ABNORMALITY ANALYSIS REPORT
COMPANY "C"
Unit:
Shift:
CORPORTATE
Date:
03/15/12
ONE SHIFT ONLY
Management Area/Department
Department/Sector:
FINANCIAL MANAGEMENT
BILLINGS CREDIT
1. IDENTIFICATION
Abnormality:
Unwarranted collection
Removal of Symptom:
Approval letter written for notary. Certification of no payment requested.
Fact communicated to SCI and SERASA.
Time:
Location:
Operator:
2. OBSERVATION
Billings
Type:
Customer’s complaint
Symptom:
Protest
Negative File
CUSTOMER
BANK
- Direct payment
NOTARY
- Didn’t honor
instruction
3. ANALYSIS
- Payment after due
date
- Did not recognize
collection
- Didn’t honor instruction
- Did not instruct
notary
UNJUSTIFIED
COLLECTION
- Did not issue
instructions
BILLINGS
- Delay in delivering
invoice
- Delay in delivering
- Error due date
merchandise
INVOICING
LACK OF STANDARD
PROCEDURE
TRANSPORT
Department Chief (Name/Signature):
(What was done)
1 - Devise a procedure for
writing off settled duplicates
2 - Train team
3 - Follow-up
03/31/12
04/08/12
4.3. Date Limit (When)
(What was observed after the action)
Moacir
Moacir/Cláudia
Cláudia
6. CHECK
4. ACTION PLAN - 5W 1H
5. ACTION
4.2. Person in charge
(Who)
9. GAINS (US$)
Manager/Department Chief Foreman (Name/Signature):
(Should the standard
be changed?)
4.4. Observation (How/Why/Where)
7. STANDARDIZATION
4.1. Action (What to do)
8. CONCLUSION
PROCESS ABNORMALITY REPORT
Occurrence of the
abnormalities
COMPANY X, INC.
Name of the
Machine
ENT-86814
Control Chart
Number
Name of the
Process
Pre-Test
Lot Number
Quality
Characteristic
Electrical behavior
(oscillation)
Operator
Inspector
Date and Time of
Occurrence
20-2-Tuu-A3-2
February 15
5:00 p.m
Akemi Yoshikawa
3% stratification on the control chart, showing errors in electrical
3,0
oscillation chart in pre-test
UCL = 1,12
Detected by
LM = 0,3
Tabuchi
Investigation of the
Cause
In the past, the position of the cam was determined in relation to the groove on
the axle shaft (that is, by dimension C). To improve efficiency, the welding guide
for the cam was determined by dimension B.
Owing to burrs and other irregularities at the
Cam
Rotor
Dimension B
Weld
axle end of the rotor axle, this increased the
Dimension C
variation in dimension C, causing obstruction
Burr
of the chassis by the cam and altering
Interference
electrical oscillation.
Chassi
1
2
Dimension A
It is desirable to use the current guide to guard against future increases in
production.
When welding a floor spring, check to see if
the cam is interfering with the chassis.
During the rotor assembly process, correct
the cam of the rotor axle welding the guide.
3
Connection with pertinent
departments
When
?
Who
?
When
?
When
?
When
?
February 16
Tabuchi
Day/Month
Day/Month
When
?
Emergency Action
February 17
The investigation requires
that the case be sent to the
technical department.
(UTU - 014)
1
2
Who
?
Tabuchi
When?
February 17
Checked
by?
Tokuno
Actions to prevent
recurrence
Prevention of recurrence
During the rotor assembly process, control the axle by cam dimension
(dimension B) with an X - R control chart (after February 17)
Confirmation of the
efect of the action
to prevent
recurrence
Emergency
action
Investigation of the causes
9 10 11 14 15
After changing Dimension A, no electrical oscillation error occurred.
As the control chart for electrical oscillation errors continued to show zero
defects, it was discontinued.
When
?
March 8
The X - R control chart for the dimension of the weld of the rotor/cam was also
discontinued.
Who
?
Tokuno
Change in the dimensions of the part where the chassis enters in contact
with the cam (Dimension A) from 5.5 to 6.5 mm.
To be kept on file for 3 years
Format Number TG-Q001
Regulation Division
MP Warehouse, Production Section,
Assembly Crew UHF
When
?
February 28
Who
?
Confirmation
of details
of the action
Tokuno
Aoki
Checking
Section
Chief
Supervisor
Leader
Aoki
Tokuno
Tabuchi
* According to an original of Kaoru Ishikawa in Introduction to Quality Control, p.299.
Abnormality Report Model(13).
~
~
Shipment
Packaging
Packaging Process
Finishing Process
PROCESS
PRODUCTION
BOARD
CIRCUIT
PRINTED
TOTAL PROCESS
Figure C.1: Difference Between Flowchart and Macro Flowchart(18).
Complete inspection of product
Flux coating
Corrosion prevention
Water wash
Degreasing and dust removal
Inspection of process
Printing Process
MACRO FLOWCHART
FLOWCHART
Circuit board cutting
GROUPED PROCESS
SINGLE PROCESS
Table C.1: Flowchart Symbols
Symbol
Meaning
Meeting
or
Action
Checking
Request by
board
Partnerships
Constitution
Merge
Incorporation
Transformation
Alteration
COMPANY “C”
Documents prepared
for commerce board
federal treasury
Payment
documents
provided
Documents sent
to commerce
board
Documents received
from commerce
board
INC
Documents prepared
for publishing
Payment
made
IOSEC sent
for publishing
DOE publications
received
LTD.
INC.
LTD.
Documents for
federal treasury
prepared
Payment
bill provided
Document to state
treasury sent
Document from
state treasury
received
Charter
provided
Documents
distributed and
original filed
END
Table C.2: Simplified Conventions for Flowcharts.
Work
a
Operation that causes changes in the form and
properties of materials, components, or product.
Transport
Operation that causes changes in the position of
raw materials, components, or products.
1/2 to 1/3 of a
Planned
stock
Unplanned
stock
Quantity
inspection
Quality
inspection
Operation of stocking up raw materials, materials,
components, or products according to a plan.
State of congestion of raw materials, supplies,
components, or products, contrary to plan.
Operation to obtain the difference of results, using
as a reference the quantity of raw materials,
materials, components and products.
Operation for judging the conformity of a lot or
good quality of a part, testing the quality
characteristics of the raw material, supplies,
components, or product and comparing the results
with a reference.
* See the book Padronização de Empresas, p.93, for more details.
Flowchart conventions may also be combined if operations occur
simultaneously.
Table C.2: Continuation.
Composite
Symbol
Meaning
While the main focus of inspection is quality,
quantity inspection is also carried out.
While the main focus of inspection is quantity,
quality inspection is also carried out.
While the main focus is on doing the work,
quantity inspection is also carried out.
While the main focus is on doing the work,
transport is also being attended to.
Shield
Legs
Shield
Armature
Inductor
Axle
Ventilator
Clamp
A
Clamp
B
Perforation
and contraction
of the area
Work on
external
diameter
st
Perforation
Dimensions
and return
Dimensions
and return
~
~
Folding
1st package/time
1 winding/time
Winding
Perforation
st
1 part/time
Drillingand
contraction
of the area
Initial
work
Drilling
1st part/time
Final
work
Drilling
Armature
Dimensions
and return
Dimensions
and return
Hole of
class
Drilling
Drilling
Dimensions
For 1 motor
a time
Armature
Rotor
1st part/turn
Quantity
dimensions
Dimensions
Clamp
B
Grinding
Clamp
A
240 parts/
time
Output
dimensions
240 parts/
time
~
Pre-treatment
~
4 parts
Weld
Pre-treatment
15 parts/
pallet
4 parts/
hanger
Shield
legs
Insertion of
bearing
Painting
240 parts/
each time
Voltage
polarity
Loading
24 parts/
pallet
~
=
Shield
50 parts/
pallet
Nest
Axle
=
Insertion of
axle
Reception
inspection
1 part/time
Cover
Work on
external
diameter
240 parts/
time
Finish
Weld
15 parts/
pallet
Coupling
Screws
Remove from
box
Washers
Remove from
box
Dimensions
of connection
Balancing
15 parts/
pallet
Rotor
Assembling
Nuts
24 parts/
pallet
Rolling
24 parts/
pallet
Rolling Insertion
Remove from
box
Assembling
1 part
Clamp B
Inductor Inductor
Shield
Ventilator
Test of characteristic value
1 part
Bearing
Box for
Packaging
Painting
1 part
# of final inspection completion
Axle
Clamp
120 motors/a time
Monophase Induction Motor
Rotor
Example of a Process Flowchart.
Shield Leg
Table D.1: Method for Receiving a Consultant.
P
D
1
Clearly establish your GOAL and discuss it with the
CONSULTANT´S TEAM (if there is a contract, put this in).
2
Gather information on the subject.
3
Set up a team mixing your people with the consultants
and conduct an analysis by asking “What have been the
causes that have kept us from achieving our goal up until
now? (See table 3.1)
4
This mixed team must then, set up an Action Plan,
which consists of COUNTERMEASURES against the
causes (See Tables 3.1 and 3.2).
5
Execute.
6
C
NO
SUCCESS
YES
A
Check. Make a Three-Generation Report (See Table
9.3). Discuss the report with the CONSULTANTS and
ask for advice:
(a) Is the plan lacking something?
(b) Why wasn’t the goal achieved?
(c) What should be the next steps?
The CONSULTANTS should go over steps 3 and 4
with you and your team until the goal is attained.
7
Standardize.
8
Conclude the project.
A
C
D
P
PDCA
N
Phenomenon Analysis
2
8
7
Conclusion
Standardization
(Was prevention of
recurrence effective?)
To recapitulate the entire problem - solving process for
future work.
To prevent recurrence of the problem.
To check if the action was effective.
Checking
6
?
To eliminate the root causes.
Execution
To conceive an action plan for each smaller problem to
eliminate the root causes.
Action Plan
4
5
To detect the root causes of each smaller problem.
Process Analysis
To break down the problem into smaller problems.
To define the problem clearly and recognize its importance.
OBJECTIVE
3
Y
Problem identification
PHASE
1
FLOWCHART
Table E.1: Problem-Solving Method - QC STORY.
Tracing history
of the problem
1
2
5
4
3
Selecting the
problem
Assigning
responsibilities
Doing a
Pareto analysis
Showing current
losses and
viable gains
Tasks
Flow
F
B
A
M
IJKL
EFGH
M A
F
E
J
J
A
J
I
S
O
Better
Assignment of responsibilities
ABCD
Pareto
analysis
J
Present
Always use historical data
Propose a deadline for solving the problem.
Appoint the person or group that will be in charge. Designate the group
leader.
A Pareto analysis makes it possible to prioritize topics and to establish
viable numerical goals. Subtopics may also be established if necessary.
Note: Do not look for causes here; only undesirable results. Causes will
be sought in phase 3.
What is it possible to gain?
What is being lost?
How does it occur?
What is the frequency of the problem?
A problem is the undesirable result of a job (be sure the problem chosen
is the most important, based on facts and data). For example: loss of
production owing to equipment stoppage, overdue payments,
percentage of defective parts, etc.
Area’s general policy
(Quality, delivery, cost, morale,
safety)
Graphs
Photographs
Observations
Tools Utilized
Phase 1 - Problem Identification
Losses
3
2
1
Flow
Timetable,
budget and goal
Discovery of the
characteristics of the
problem by means of
observation on site
Important
recommendation:
the more time you
spend here, the
easier it will be
to solve the
problem. Don’t skip
this part!
Discovery of the
characteristics of the
problem by means of
the gathering of data.
Break down the
problem into smaller
problems.
Tasks
IJKL
EFGH
F
E
PHASE
Analysis
Action Plan
Execution
Check
Standardization
Conclusion
1
2
3
4
Go to the place where the
problem occurred
ABCD
B
A
5
J
I
6
7
8
PRIORITIZING
Choose the most important themes
and go back
PARETO CHARTS
CHECK LIST
STRATIFICATION
PARETO ANALYSIS
Tools
Employed
Make a timetable as a reference. This timetable should be updated for each phase.
Make a budget.
Define a goal to be reached.
Should not be done in the office, but at the site of the event itself for the gathering
of supplementary information that cannot be obtained in the form of numerical data.
Use a video camera and photographs.
Observe the problem from several angles (stratification):
a. Time - Are the results different in the morning, in the afternoon, in the evening,
on Mondays, on holidays, etc.?
b. Place - Are the results different in different parts of a part (defects at the top,
at the base, on the sides)? In different places (accidents in corners, in the
middle of the streets, on sidewalks), etc.?
c. Type - Are the results different depending on product, the raw material, the
material used?
d. Symptom - Are the results different whether the defects are cavities or
porosity, whether absenteism is due to absence or sick leave,
whether the stop is due to the burning-up of a motor or mechanical failure,
etc.?
It will also be necessary to investigate specific aspects, such as air moisture,
room temperature, gauge instrument conditions, standard reliability, training,
who is the operator, which team worked, what are the weather conditions, etc.
"5W1H" - Ask the questions: what, who, when, where, why and how to gather data.
Build several Pareto charts according to the groups defined in stratification.
Set up a goal and an action plan for each smaller problem.
Observations
Phase 2 - Phenomenon Analysis
No
No
Yes
?
?
Did you confirm
a most probable
cause?
3
Consistency test
of root cause
Analysis of most
probable causes
(hypothesis
verification)
Yes
1
Screening of most
probable causes
Definition of
contributing
causes
(for each smaller
problem)
2
Tasks
Flow
B
D
F
B C D
F
A
10
20
A
Is there technical evidence that it is
possible to prevent recurrence?
Would recurrence prevention generate
undesirable defects?
A
100%
Collection of new data about the most
probable causes, using a check list.
Analyze collected data.
Testing of the causes.
E
C
If recurrence prevention is technically impossible, or if it can produce
undesirable effects (scrapping, high cost, rework, complexities, etc.), it
may be that the determined cause is not the root cause but rather an effect
of it. Consider the cause as a new problem and ask again “why” and go back
to the beginning of the flow of this process.
Based on the results of the experiments, you will confirm or not confirm
the existence of a relationship between the problem (effect) and the most
probable causes (hypothesis).
Visit the locations where hypotheses apply, collect information.
Stratify the hypotheses, collect data using the check list as an aid. Use
Pareto to prioritize, a relational diagram to test the correlation between
the hypotheses and the effect. Use a histogram to evaluate the dispersion
and graphs to check trends.
Test the hypotheses through experiments.
More probable causes: the number of causes listed in the previous task must be
reduced by elimination of the less-probable causes. Based on data collected
during the observation process, take advantage also of suggestions based on
the experience of the group and hierarchical seniors; also, based upon
information collected during observation, prioritize the most probable causes.
Be careful with “cross” effects: problems that result from two or more factors
simultaneously. Pay special attention to these.
Identification through cause and effect
diagram
A
F
Setting up a work group: involve all those who can contribute to the
identification of the causes. Meetings should be participatory.
Cause-and-effect diagram: write down the largest possible number of
causes. Set up a cause-and-effect relation between the causes listed.
Construct the cause-and-effect diagram placing the more generally based
causes on the larger branches, and secondary and tertiary causes, etc., on
the smaller branches.
Observations
Brainstorming and cause and effect
diagram
Question: Why does the problem occur?
Tools Utilized
Phase 3 - Process Analysis
2
1
2
Designing
of an action
strategy
1
Carrying out
the action
Training
Designing of
an action plan
for recurrence
prevention and
revision of the
timetable and
final budget
Tasks
Flow
NEI
WHAT
STANDARD
AXLE
FLOOR
PIN
Plan and timetable
Training techniques
!
Dissemination of plan to everyone
Participatory meetings
!
EDU
TO CHANGE
TO CHANGE
!
!
RUI
WHO
ELI
TO CLEAN
TASK
TO MEASURE
Observations
Define what is to be done (What)
Define when it is to be done (When)
Define who will do it (Who)
Define where it will be done (Where)
Clarify why it is being done (Why). Detail or delegate the
detailing of how it will be done (How)
! Determine the goal to be attained and quantify it ($, tons,
defects, etc.).
! Determine the control items and the check items of the various
levels involved.
!
!
!
!
!
! Make sure that actions are being taken on the root causes and
not on their effects.
! Make sure that the actions proposed do not produce secondary
effects; if these do occur, take action against them.
! Propose diferent solutions, analyze the effectiveness and cost of
each; choose the best.
!
!
During execution, physically check on location whether actions
are being carried out.
All actions and the good and bad results should be recorded in a
form, on the date when they were taken.
! Check which actions require the active cooperation of all. Give
special attention to these actions.
! Clearly present the tasks and the reason for them.
! Be sure that everyone understands and agrees with the measures
proposed.
Phase 5 - Execution
ow?
Who? H hy?
?W
Where hat?
W
When?
"5W1H", timetable, costs
Discussion with group involved
Discussion with group
involved
Tools Utilized
Phase 4 - Action Plan
Checking whether
the problem
persists
2
3
N
Y
?
Listing secondary
effects
1
Was recurrence
prevention
effective?
Comparing
results
4
Tasks
Flow
A
BEFORE
C
E
A
D
Analyze
C
E
BEFORE
MONTHS
Checking
Better
LIC
LC
LSC
AFTER
A S O N D
Action
J F M A M J J
D
B
$
Question: Was the root cause
effectively identified and recurrence
effectively prevented?
B
AFTER
l
l
l
l
l
l
l
l
Utilize the information previously obtained for making the
decision.
If the solution was faulty, go back to phase 2 (Phenomenon
Analysis).
When the results of the action are not as satisfactory as
expected, check whether all the planned actions were
implemented according to plan.
When the undesirable effects persist, even after the
recurrence prevention action, this means that the solution
presented was faulty.
Any alteration in the system may entail positive or negative
secondary effects.
Data used should be collected both before and after action
to prevent recurrence, to check the effectiveness of the
action and the degree of reduction of the undesirable
results.
Comparison formats should be the same before and after
the action is taken.
Convert and compare the effects, also in monetary terms.
Check if all actions were implemented.
Pareto, control charts, histograms.
l
Observations
Phase 6 - Checking
Tools Utilized
Defects
Communication
Education and
training
1
2
3
4
Development
or alteration of
standard
Monitoring
utilization
of the standard
Tasks
Flow
A P
C D
· System for checking observance of standard.
· Meetings and lectures.
· Training manuals.
· On-the-job training.
· Communiques, newsletters, meetings, etc.
· Set up the new operational procedure or revise
the old one using 5W1H.
· Whenever possible, incorporate a foolproof
mechanism.
Tools Utilized
Observations
· Avoid the reappearance of an already solved problem because of laxity
in complying with standards:
· Set up a periodic check system;
· The supervisor should periodically observe his subordinates to ensure
compliance with standard operational procedures.
· Make sure that the new standards or the changes in existing
standards are passed on to all those involved.
· Do not communicate solely through documents. The reasons for
changes must be explained, and the important features and changes
made clear.
· Make sure that employees are able to execute the standard
operational procedure.
· Provide on-the-job, on-site-training.
· Provide documents at the location where they are needed and in the
form necessary.
· Avoid possible confusion: set up the beginning date for new systems
and the areas to be impacted, so that the standard may be applied at
all necessary locations, at the same time and by all involved.
· Make clear in the operational procedure “what”, “who”, “when”,
“where”, “how”, and principally, “why”, as regards activities that
should really be included or altered in the existing standards.
· Check if the instructions, decisions, and procedures contained in
process 5 should be changed before being standardized, based on
results obtained in phase 6.
· Use your creativity to ensure that problems will not recur. If possible,
incorporate foolproof mechanisms into the standard, so that the
work can be done without error by any worker.
Phase 7 - Standardization
Tasks
Listing of
remaining
problems
Planning for
attacking
remaining
problems
Reflection
Flow
1
2
3
More
complete
check sheets
Analyze the stages of the problem solving method regarding the
following aspects:
1. Timetable - were there significant delays or too generous
deadlines? Why?
2. Was elaboration of the cause-and-effect diagram superficial?
This would be an indicator of the degree of maturity of the team
involved. The more complete the diagram the more able the
team.
3. Was there group participation? Was this the best group to solve
this problem? Were the meetings productive? What could be
improved?
4. Did the meetings occur without problems: absenteeism,
disputes, imposing of ideas?
5. Was the assignment of tasks well done?
6. Did the group gain knowledge?
7. Did the group improve the problem solving technique? Did it use
all the techniques?
· Careful reflection on the problem
solving activities themselves.
Improve the
timetable
Improve
cause and effect
diagram
· Re-evaluate pending items, organizing them for a future
application of the problem-solving method.
· If there are problems connected with the very way the
problem solving was approached, this can become a subject
for future projects.
nonproductive. The ideal situation practically never exists; limit,
therefore, activities when the original time limit has been
reached.
· List those things that were accomplished and those that were not.
· You should also show results that are above expectations; they are
important indicators for increasing efficiency in future work.
· Spending a very long period of time on seeking perfection may be
Observations
· Application of problem solving
method to problems which are
important.
· Analysis of results.
· Graphic representations.
Tools Utilized
Phase 8 - Conclusion
Processes
Secondary
classification
Secondary
pressure
Painting of
base
Carbon
impregnation
Carbon
impregnation
Surface
treatment
Inspection
upon
receipt
Sample
Control
Item
Zeta
Micro
meter
Visual
Measurement
instrument
Thermal
resistance
Resistance to
solvents
Resistance to
vibration
Useful life of
charge
External
dimensions
Solderability
Eletrical
resistance
Thermal
impact
By
lot
Paint
preparation
by lot
By
lot
Test
Gravitometer
Standard
meter
Vacuum
meter
Thermocouple
CR-AC
Figure F.1: Example of a Process Technical Standard.
Resistance
of lid
Specific
weight
Membrane
resistance
By
carbon
impregTemperature
nated
lot
Degree of
vacuum
By
Concentration
measurer
of liquid:
treated
Chronotime
lot
External
appearance By road
lot
External
dimensions
Standard
operational
procedure
RZ-11-08
IP-20-43
RP-00-33
RP-00-11
RP-00-22
Card
record
Card
record
Continuous
record
Continuous
record
X-R
X-R
Record
Main process
Processing of
raw materials
Control item checking method
- Low Correlation
- Medium Correlation
- High Correlation
Production
Monthly department
Monthly
Correlation with quality
assurance items
Monthly Engineering
department
Monthly
Flowchart
Responsible
party
Superv.
Superv.
Superv.
Superv.
Superv.
Superv.
Monthly Management
Monthly
Name of raw
materials
Pig Iron Area
Maintenance
Department
Pig Iron
Technology
Department
Pig Iron
Production
Department
Sinter Production
Department
Andrade Mine
Production
Department
Pig Iron Production
Management
Steel Area
Maintenance
Department
UGB
Steel Production
Department
Steel Production
Management
Client Technical
Support
Department
Technology and
Process Automation
Department
Utility
Department
Sabará Steel Mill
Production
Management
Supply
Department
Logistics and
Production Planning
Department
Programming,
Logistics and
Supply
Management
Maintenance
Engineering
Department
Maintenance, Utilities
and Environment
Engineering
Management
Metallurgy and
Quality Assurance
Department
Technical
Management
Finance
Support
Figure G.1: Plant organization chart.
Rolled Steel Area
Maintenance
Department
02 Rolled Steel
Production
Department
01 Rolled Steel
Production
Department
Rolled Steel
Production
Management
General Management
João Monlevade Steel Mill
Logistics, Utility
and Supply
Department
Department of
Production for
Civil Construction
Rod
Department
Human Resources
and Total Quality
Management
Picture G.1: Heads and staff of steelmaking shop.
From left to right: Vidigal, Joaquim, André Fernando, Anísio, Júlio, Marco Antônio.
*SOBREMETAL
AFIN
GRHQ
DEUT
DLPP
DTAP
*DMAC
*MAGNESITA
Supplier Development
Plan (P.D.F)
DSUM
*DGUS
GCIM
DMGQ
Suppliers
2 - Mixers
2 - Converters
1 - Pot Grate Furnace
1 - Continuous Ingot Casting
Machine
1 - Neutral gas
blowing-in station
6 - Traveler Crane
11 - Steel / Pig Iron Ladles
13 - Distributor
Equipment
XYZ
People
Ensure that the physical
plan for the production of
billets is followed within
the scheduled budget and
with the specified quality
characteristics for each
steel, and avoiding an
impact to the environment and
the health of the staff.
Mission
Production of
Billets
Business
Business
• GGJM
• GPGU
• AFIN
• GRHQ
• DMGQ
• GPLA
• Roller 2
• Roller 1
• Production
scheduling
Clients
*Suppliers synthetically appraised (Vendor Rating).
Information
• 155X155 mm
• 9 a 12.20 m
• Chemical analysis
according to Belgo’s
steel table
Billets
Products
Figure G.2: Definition of the BMU Business (Steel Production Department - DPAC).
• Metallics Transportation
• Metallic Cutting
• Metalic Residue Treatment
Refractories
Maintenance Services
• Corrective
• Preventive
• Predictive
Production Program
Automation System
• Power
• Fluids
• Treated Water
• Total Quality Consultancy
• Safety Consultancy
• HR Management
• Instrument Gage Service
Financial Support
• Assemb. VG. Distributors
• Sulfur print
Molten pig iron
Scrap
Chemical analysis
• Ferroalloys
• Fluxing agents
• Miscellaneous inputs
Inputs
TECHNICAL STANDARD
GGJM - GPAC - DPAC
Page: 01/02
Rev.: 01
Code: SEP280
Date: 11/21/01
CASTING OF XYZ AND ABC STEELS AT MLC
1 - Objetive
This standard sets the casting procedures to ensure the specified quality characteristics required during the
application of the following steels: XYZ and ABC
2 - Responsible
Supervisor or monitor
Activitities
Tolerance
What to do
Why?
1 - Empty ladle time
Standard SEP XYZ
Act according to the
standard
Stability of temperature
in the distributor
2 - Wait time at the tower
Maximum X minutes
Divide MLC
Get a free opening
3 - Open ladle drawer valve
Free
As O2
Cast normally
Mark in the running record
Act according to the
standard
Prevent internal defect
4 - Ladle plate valve
condition
5 - Closing of the drawer
valve during ladle
replacement
(Amepa = X%)
Amepa system on
automatic with an X%
sensitivity
Visually assess the passage
of slag to the distributor and
Prevent internal defect
register on the running
record
6 - Steel covering at the
distributor
Utilize proper thermal
insulation
Fully cover the steel
surface on the distributor
Prevent thermal losses
7 - Weight of steel on the
distributor
³ Y tons
Note on the running record
Prevent internal defect
8 - Steel remaining in
the distributor
³ X tons
< X ton, increase X meters
in the final billet length
Prevent internal defect
9 - Number of sequential
runs
Maximum = X runs or
Y minutes
Stop casting the sequence
Prevent excessive wearing
of the refractories
10 - Temperature
Standard SEP XYZ or
supervisory
11 - Centralization of the
submerged valve
Aligned to the mold
12 - Submerged valve
immersion depth
(15 cm)
X to Y cm
Standard SEP XYZ
Above tolerance record
on the running record
Work on the vertical/
transverse settings
Adjust distributor height
Ensure a free opening
Prevent surface defect
Prevent internal defect
Prevent wearing of the
submerse valve and internal
defect
Record of Alterations
What changed
Minimum billet length
Why?
Who
When
Alteration in the AP XX process
ABC
11/21/2001
CDC.: 004/04-08; 011/05-06-10
Prepared by:
ABC
Checkd by:
XYZ
Figure G.3: Product/Service Specifications.
Approved by:
KZY
Budget
Reduce 10% in relation to 2000
65%
Zero Infraction record
Operational Cash Flow
Complaints
Corporate Climate
Environment
Figure G.4: Goals of the Management of Long Products - 2001.
Budget
Goals
Operational Profit
Control Items
Environment
(Infraction Record)
Organizational Climate
Client Complaints
Operational Cash Flow
(Ebtida)
Operational Profits
Control Items for the
Management of Long Products
Figure G.5: Deployment of Control Items - 2001.
Number of Environmental Anomalies
Zero infractions recorded
Zero
Improve 10% in relation to the last survey
Organizational Climate
Number of Accidents
Reduce 10% in relation to 2000
External Market Complaints about Steel Cord
Reduce 10% in relation to 2000
Reduce 10% in relation to the budget
General managerial expenses
Client Complaints
Goal Plan: reduce 7% in relation to the budget
Cost of wire rod
Reduce 10% in relation to 2000
Goal Plan: increase 4% in relation to the budget
Production of wire rods
Storehouse Stock
Goal
Control Items for the
Monlevade Steel Mill
Reduce 7% in relation to the budget
Reduce 10% in relation to 2000
Reduce 10% in relation to the budget
Reduce 10% in relation to 2000
Reduce 10% in relation to 2000
Improve 10% in relation to the last survey
Zero
Cost of Wire Rods
Storehouse Stock
DGA
Client Complaints
External Market Complaints about Steel Cord
Organizational Climate
Number of Accidents
Figure G.6: Goals of the João Monlevade General Management - 2001.
Number of Environmental Abnormalities (Infractions recorded) Zero infractions recorded
Increase 4% in relation to the budget
Goals
Production of Wire Rods
Control Items
Cost of
Billet
Cost of Wire
Rod
- Cost of Ferroalloy
- Cost of Refractories
- Yield
- Cons. of Fluxing Agents
- Cons. of Power
Additional Cost
of Billet
Department
Head
Daily
Running
Casting Yield
Reblowing Rate
Running
Running
Sequence
Every 3 days
Mg O in Slag
Slag Splash
Sequential Runs
Electrode Consumption
Running
Running
Steel Mill Yield
Fe O in Slag
Frequency
Control Item
Supervisor / Operator
Steel Mill Department
Figure G.7: Deployment of Control Items from the Manager to the Operator.
Steel Mill
Management
General
Management
kg/t
Nº
%
%
%
%
%
%
-
0.02
0.04
0.06
0.08
0.10
0.12
0.14
0.16
0.18
Apr
Goal
June
Oct
Sep
Benchmark
Nov
July
Figure G.8: Monthly Follow-Up Chart.
Done
Aug
May
March
Feb
Jan
2000
0.20
Control Item: Bore Rate
Managerial Unit: DPAC - Steel Production Dept. - Monlevade
Responsible: Renato Borges de Moura
2001
Dec
1999
0.01
0.04
0.02
0.06
0.02
0.06
0.04
June
July
August
September
October
November
December
0.08
0.08
0.08
0.08
0.12
0.12
0.12
0.12
0.18
0.02
May
0.15
1999
0.10
April
0.15
0.15
0.11
March
0.15
2000
0.13
February
0.15
0.06
0.12
January
Goal
2001
Actual
Month
Measurement Unit: %
Benchmark: 0.01
Annual Goal: 0.10
Picture G.2: Visual Management Room - Monlevade Steel Mill.
Page: 01/01
Rev.: 07
Date: 03/18/2002
SYSTEM STANDARD
Usina de Monlevade
PREVENTIVE MAINTENANCE
PDCA
Phase
Round
P
People Involved/Responsibility
Management Record
Where When
Material
Coordenator Supervisor Operational
1
JO surveys
generated by
the system
STE 079
SAP
(W004)
2
JO inspection
programs
STE 079
SAP
(W007)
3
Print service
JO
STE 079
SAP
(W019)
4
Deliver Jos to
operationals
5
Prepare the
tools
6
Move to
the area
7
Request client
autorization
8
D
Clients
SEM 036
OS’S
Authorize
the
inspection
DRI 254
Consignment
Map
DRI 254
Consignment
Map
OS’S e
SEN 036
Job
Order
9
Inspect
equipment
10
Note down the
results of the
inspection
OS’S
Job
Order
11
Communicate
with client (end
of inspection)
DRI 254
Consignment
Map
Deliver JO to
Supervisor
12
13
Create JO rec.
Maint. Prog. for
equipt. With
answer of bad
condition code
SET 079
14
Close JOs for
the coordinator
SET 045
15
Deliver JOs to
coordinator
C
16
A
17
Prepated by:
Check and take
any measures
necessary
SAP
(AC05A,
W010)
Job
Order
Wait for
Scheduled
Maintenance
Checked by:
Approved by:
Figure G.9: System Managerial Standard.
Desulfurized molten
pig iron
Transportation of the
hot-metal transfer car
Tilting of the
hot-metal transfer car
Slag
scraped
Thermal and chemical
sampling
Yes
LD?
Pig iron tumbled
into converter
No
Pig iron tumbled
into mixer
Transport the
ladle
Mixer covered
Combustion in the
mixers controlled
Control the stock and
moving of molten
pig iron
Figure G.10: Flowchart for the Molten Pig Iron Reception and Storage Process.
Flow
X
Internal and
surface defects
Internal defects
Surface defects
Surface defects
Billet cutting
Sulfur print
Transportation of the
billet to the yard
Casting
X
X
X
X
X
Internal and
surface defects
Internal defects
X Ton
Weight of steel
on distributor
X
Internal defects
Tapping of steel from
the distributor to
the molds
>X%
Free opening
rate
Y Rate
Internal defects
NA
When
Every run
Visual
Crack
pattern
X veins per
run
Ingotman
Ingotman
Ruler
Probe
Not applicable
SEP XXX
SEP XXX
Inspection
Report
SEP XXX
SEP XXX
SEP XXX
SEP XXX
MLC
Report
Supervisor of
MLC
Supervisor of
MLC
MLC
Report
Supervisor of
MLC
SEP XXX
Tachogenerator Supervisor of
MLC
Flux valves
SEP XXX
Supervisor of
MLC
Whole sequence
Every run
Every run
SEP XXX
Supervisor of
MLC
Larry car
scale
Immersion
pyrometer
SEP XXX
SEP XXX
What to do
Supervisor
Supervisor
Supervisor
Supervisor
Supervisor
Supervisor
Supervisor
Supervisor
Supervisor
Supervisor
Supervisor
Who to
look for
Corrective Action
Ladle area
repoirt
Supervisor at
ladle furnace
Record
How
Page: 01/01
Rev.: 12
Date: 03/12/1999
Not applicable
Immersion
pyrometer
Gage
instrument
Gauge
instrument
Ingotman
Automated
system
Ingotman
Every run
Every run
Ingotman
Supervisor
X per run
Every run
Every run
Every run
Ingotman
Ingotman
Ingotman
Ingotman
Person
Measurement
Responsible (hour/freq.)
Who
Check Method
Figure G.11: Process Technical Standard.
Visual standard
X
X
Intial and final
billets
Standard
X
X
Level
variation
Flow powder
X
X m/min
Speed
Spray
program
X
Temperature
X
Tapping of steel from
the ladle to the
distribuitor
Temperature
X Rate
Internal and
surface defects
Placement of ladles in
the MLC tower
Standard
value
Value
ensured
Control
Parameter
Control
Level
Quality
characteristics
Quality
Ensured
Process Name
Process
GGJM / GPAC / DPAC
PROCESS TECHNICAL STANDARD
Process: Continuous Casting
Desulfurized molten
pig iron
Transportation of the
hot-metal transfer car
Tilting of the
hot-metal transfer car
Slag
scraped
CRITICAL
TASK
Thermal and chemical
sampling
Yes
LD?
Pig iron tumbled
into converter
No
Pig iron tumbled
into mixer
Transport the
ladle
Mixer covered
Combustion in the
mixers controlled
Control the stock and
moving of molten
pig iron
Figure G.12: Critical Process Flowchart.
Page.: 01/01
Rev.: 04
Code: SFT089
Date: 09/17/1999
STANDARD OPERATIONAL
PROCEDURE
GGJM - GPAC - DPAC
CHANGE THE METAL NOTCH WITH A DRILL
Responsibles: LD Monitor, Furnaceman and Maintenance Mechanic
1 - Furnace stop
1 - Raise the Gradall to the plataform by means of the traveler crane.
2 - Clean furnace rim and metal notch flange with Gradall.
3 - Clean the notch internally using oxygen.
4 - Lower the Gradall using the traveler.
2 - Notch drilling
1 - Raise the drill to the platform by means of the traveler crane.
2 - Tilt the furnace to the sampling side and position at the proper angle.
3 - Center the drill facing the furnace.
4 - Couple the drill to the notch flange.
5 - Drill the metal notch.
6 - Uncouple the drill.
7 - Transport the drill to designated place.
3 - Change the metal notch
flange
1 - Assemble the scaffold facing the furnace.
2 - Cut the screws fixing the flange and remove it.
3 - Mount the clevis onto the proper flanged pipes and fix it.
4 - Weld the flanged pipe with the clevis to the flange to be mounted.
5 - Screw up the flange with the clevis to the furnace.
6 - Disassemble the scaffold.
4 - Filling the notch with
paste
1 - Tilt the furnace to the tapping side and position it at the desired angle.
2 - Fill the projection machine with enough of the desired concrete.
3 - Position the projection lance facing the furnace.
4 - Regulate the projection machine with pressure of x kgf/cm2.
5 - Project the concrete until the notch is filled up.
6 - Pull the hoses back and store them.
7 - Clean the area.
8 - After finishing the projection wait X min and release the furnace for loading.
4 - Safety, health and
the environment
1 - PPE must be worn. Boots with steel tips, leggins, safety goggles, helmet,
scrape glove, ear mufflers.
2 - Residues generated should be collected as instructed onto collecting containers.
3 - Do not walk and/or stay under suspended loads.
CDC.: 010 - 03/14
Prepared by:
Checked by:
Approved by:
José Geraldo Silva
Geraldo José dos Santos
Marco Antônio Macedo Bosco
Figure G.13: Standard Operational Procedure.
Picture G.3: Training and Critical standards - DPAC.
From left to right: Gilvânio, Edmar, Ronildo, Júlio, Maurilo, Wilson, César.
Picture G.4: Motivational Lectures - DPAC.
Renato
Renato
Helvio
Helvio
Júlio
Distributor preparation practice
Coupling practice
Metallic load preparation
Converter heating procedure
Ladle furnace wire injection procedure
J F M A M J J A S O N D
Figure G.14: Standard Auditing and Training (DPAC).
Renato
Júlio
Steel treatment in ladle
Steel casting in protected jet
Helvio
Tapping operation
TREIN.
Helvio
AUDIT.
Converter blowing operation
STANDARD
IMPROVE
MAINTAIN
Training and
Execution
Manager to
operator
Annual Action Plan (Matrix)
Control
Items
Standards
Execution of
the plan
“5S” Program
A S
C D
Norm
Auditing
Follow-Up
Charts
Visual
Management
Anomaly
Analysis
Project
Auditing
Critical Analysis
Meeting
A P
C D
CEDAC - Participation
of operators in the
projects
Figure G.15: Management Model - PDCA/SDCA.
SHAKEDOWN
Three Generation
Report
Projects
Goals
0.00
Average 00
0
98
197
295
394
492
590
689
787
886
984
Feb
Scrap
465
Aug
July
June
May
Apr
Oct
Nov
Reclassification
77.5
Dec
Sep
0
7.75
15.5
23.25
31
38,75
46,5
54,25
62
69,75
77,5
0
44
88
VGDIST
56.6
26
RM
IN
40,1
A P
C D
AL
20,5
CU
25.4
IB
16
CE
PIG
4
Reclassification
10.1
4.8
AO
1.1
EV
3.6 3.5 3.2 2.7 1.4 1.3 1.3 0.4 0.2 0.2
Deviation
AG
26.2
48.647.9
39.631.2 27
24 22.5 21.5
16.616.1 12 10.810.3
9.9
85.5
A P
C D
TI
Figure G.16: Identification and Prioritizing of Problems at DPAC.
Deviation
441,2
Bad Quality Index
132
176
220
264
308
652
AE
440
EP
IN
396
VGDIST
1.00
RO
RO
0
STL
1.1
60.3
TI
46.5
96.2
TU
93
A P
C D
PA
139.5
153,2
NB
186
AG
2.00
Average 01
A P
C D
DTA
232.5
AL
2,53
AQ
Tons/month
Tons/month
Tonelada/mês
A P
C D
CE
279
JUN
2.7
VA
325.5
OC
3.00
AO
Scrap
EXT
Average 99
Tons/Mmnth
VARVEL
372
PS
465
VIN
418.5
SG
Bad Quality Index
DTB
2,8
GF
4.00
MR
March
Jan
Suggestions: 174
Ideas implemented: 56
Participants: 69
Raw material
Inadequate sand quality
Dropping of slag in the
drawer valve before
tapping
Excessive time between
sand insertion and
tapping
Machine
Deviation
of reclassification
due to opening
Figure G.17: Plan for Attacking Prioritized Problems.
Cost of improvements: R$ 12,000
Annual Gain: R$ 46,000
Excessive hold time
of the ladle in the tower
Ladle stays too long
in Heater
Insufficient amount
of sand in the valve
Burst of metallic
body of the porous plug
Method
Cause and Effect Diagram
During the deployment of GPAC policies the shakedown done for the quality dimension showed that one of the
characteristics affecting billet deviation and reclassification was the opening of the drawer valve of the ladle with oxygen.
So the CEDAC (cause-and-effect diagram with addition of cards) project was launched.
Choice of Theme (justification):
Reduction of Deviation and Reclassification by
Opening - DPAC
0
50
100
150
Fev
Mar
Abr
Mai
Jun
Ago
Month
Jul
Before
Set
After
Out Nov
Dez
Actual
Goal
Conclusions:
- The actions implemented so far have reduced by 40%
the amount of deviation and reclassification of billets by
opening with oxygen, thus reaching the result expected.
- The high level of participation of the staff is acknowledge.
174 cards for possible cause and possible solution were
presented.
Proposed actions:
- Review ladle cycle standard
- Develop a more resilient metallic carcass
- Ensure that the duct is clean
- Have a meeting with supplier and improve quality of sand
used
- Create a standard for laddle heating time
- Increase amount of sand according to the lifespan of
the ladle
- Avoid anticipating runs for mlc tower
T
200
250
300
350
Results:
Leader: Fernando Marques Moraes
Start: 08/21/00
End: 11/31/00
Vladimir
Vladimir
Vladimir
Vladimir
Renato
Vladimir
Vidigal
Vladimir
Vidigal
Vladimir
Vidigal
Determine procedures for finding the points of potential delay
in Scheduled Maintenances.
Prepare blocks for potential delays in Scheduled
Maintenances.
Take over the coordination of the shift’s operation staff.
Implement assessment meeting with all coordinators during
maintenance.
Attribute scores to VENDOR RATING of the Steel Mill and the
companies in the P.P.’s assessment meeting.
Assess 5S, efficiency of consignation, release of consignation
and general safety aspects.
Prepare Abnormality Analysis for possible delays.
2
3
4
5
6
7
8
Status
Figure G.18: UGB - DPAC Action Plan.
Delayed
Vladimir
Vidigal
Include coordinator procedure in the scheduled maintenance
preparation meeting
1
Concluded
Who
To do
N
Optimization of Schedule Stops
J
S O N D
In progress and on schedule
When (2001)
F M A M J J A
2
1
12
6
3
4
4
2
2
0
10
20
30
40
50
60
70
80
90
100
Project for improving the refractories
of the distributor
Resp.: Renato Deadline: 12/31/01
4 Distributor Refractory Restriction
defect and FP steel car
Review inspection and maintenance plans.
Resp.: Frank Deadline: 11/30/01
3 Car distributors electromechanical
Review Castability project
Resp.: Júlio Maria Deadline: 12/31/01
2 Castability
Negotiate with programming
the minimum number of sequential runs.
Resp.: Vidigal Deadline: 12/31/01
Propositions
Date: 11/12/2001
1 Schedule
Figure G.19: Three-Generation Report.
0
10
20
30
40
50
54
Program
60
Castability
70
Pareto for Causes - October
Eletromec.
Defect
80
Done - 8.2 runs/sequence
Problem - 0.3 runs/sequence
Distributor Ref.
Restriction
Goal - 8.5 runs/sequence
Done/Result
Obstruction
Planned
Control Item: Number of Sequential Runs
Problem: Result from October 2001 below goal
Managerial Unit: GPAC
Responsible: Wéllerson Júlio Ribeiro
THREE-GENERATION REPORT - MANAGERIAL
Others
Control
Items
Steel Cord 2nd Blowing
Automation Project
Convert. Vessel and
Ladle Project
Free Opening Project
Ladle Tower Project
Eletromag. Agitator Project
(M-EMS)
Billet Dresser Project
Billet Scrap Reduction
Project
Safety Annual
Project - GPAC
Steel Mill 5S Project
Pig Iron - Billet Chain
Production Minimum Cost Project
Specific Consumption Project
Billet Production Project
Improve
10% in rel.
to last survey
Organizational
climate
XXX kg/t
Specific
Consumption
JF, Vitória and
Piracicaba
Budg. Average
Pig-Iron Billet
Chain
Min. Cost
According to
Budget
Billet
Cost
According to
Budget
Billet
Production
Marco Antônio/Roberto
Roberto
Roberto
Augusto/Roberto
Zero accidents including
service providers
100% schedule fulfilled
100% schedule fulfilled
Free opening index > 90%
Caption:
Augusto/Roberto
Project may affect the goal
Project affects the goal
Project strongly affects the goal
100% schedule fulfilled
Marco Antônio
Marco Antônio
Marco Antônio
Reduce index to 0.50%
100% Steel Cord with
automatic blowing
100% Steel Cord with
automatic blowing
Marco Antônio/Roberto
Marco Antônio
Marco Antônio
Wéllerson
Reponsible
MLC Standard
Increase billet production
capacity
Enable for specific
consumption
JF, Vitória and Piracicaba
Budget Average
Project Goal
Figure G.20: Annual Action Plan of Steel Production Management.
Bad Quality
Index
Projects
Reduce 5%
in relation to
2001
Reach
200ppm last
Quarter
Drilling
Index
Goals
Zero
Number of
accidents
General Management of João Monlevade Steel Mill
Zer
(infraction
record)
# of Environmental
anomalies
Frame G.1: Criteria for Abnormality Analysis.
Accidental stops above 30 minutes
Line scrap
More than 5 rollers deviated
Any job or equipment accident (or quasi accident) that takes place
Rolling
Casting machine stoppage above 30 min
Quasi accident and actual accident with staff or equipment
Any billet scrap
Opening with oxygen
Drilling
Steel Mill
Run delays above 20 minutes
Load stops above 20 minutes
Percentage of S in pig iron > 0.010%
Any job accident or accident with equipment that takes place
Blast Furnace
GGJM - GPAC - DPAC
Shift
1
2
Code:
ABNORMALITY REPORT
Crew
3
1
2
3
Date:
4
5
01/31/2002
Participants
Adaílton, Ronaldo, Márcio Miranda, Antônio, Altair, João Bosco and Lucas Motta.
Abnormality
Stop of the V6 at the junction of 1015L with P926A due to obstruction after casting ~3m.
Operational Procedures
SLT 001
Was the Operational Procedure followed?
YES
NO
Note
-
Ladle No. 3-49 runs.
Deficiency of heating of valve V6.
There was an interruption during translation of car II for tapping of V3.
The ladle was opened with oxygen (by inserting the tube 2X)
Union time was 11 minutes.
Placement of the long tube without the distributor being 100% full.
Non observance of heating deficiency in V6 during distributor heating.
Abrupt fall of level and position of the drawer valve without a successful intervention by the ingotman.
Due to the freezing of the parameters this item could not help us in analyzing the abnormality.
- There is no obstruction tendency alarm in the PCIM.
- Reduction was actuated but without success.
Brainstorming
Non observance of the deficiency in
heating of valve V6
Placement of long tube without the
distributor being 100% full
Opening with oxygen
Deficiency in
V6 heating
Obstruction of
vein 6 at the junction
Coupling time
of 11 minutes.
Refractory breakage in vein 6
valve
Mention the abnormality: Stop in V6 at the junction of 1015L with P926A due to obstruction after casting ~3m.
Why did it happen? Non observance in the deficiency of valve V6 heating.
Why did it happen? Standard SLT001 (inspection every 15 minutes after air opening) was not followed.
Action Plan/Standardization
What?
Recycle ingotmen in standard SLT001 - activity number 3
(distributor heating)
Recycle ingotmen in standard SLT001 - activity number 10
(MLC startup)
Who?
When?
Adaílton
01/31/2002 - OK!
Adaílton
01/31/2002 - OK!
Final Assessment:
A general maintenance of the preheating station of the distributors is scheduled, which will contribute for
solving the heating problem.
Figure G.21: Example of Abnormality Analysis report.


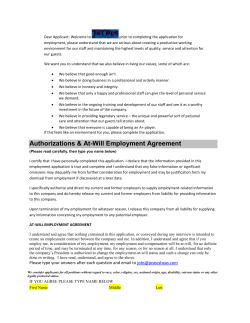

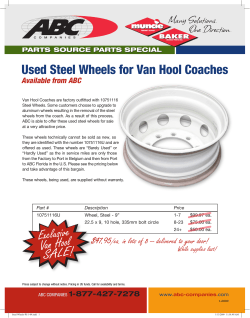

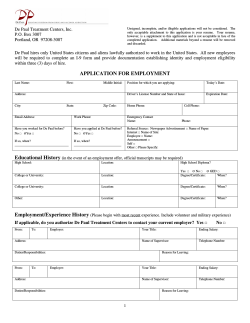
© Copyright 2026