
How To Produce Almost Perfect RTF Output Ins & Outs NESUG 2006
NESUG 2006
Ins & Outs
How To Produce Almost Perfect RTF Output
Suzanne M. Dorinski, US Census Bureau, Washington, DC
ABSTRACT
The Census Bureau performs an annual data collection for the National Center for Education Statistics. As part of the file
documentation, the Census Bureau produces output that shows the imputation flag distribution for more than 140 variables.
Census also produces a summary table that shows the minimum, maximum, and mean value for each continuous variable,
along with the number of records that have a value greater than or equal to zero, the number of records with missing values,
and the number of records with “not applicable” values.
The output can be easily produced as RTF (Rich Text Format), but we need to use many little tricks to produce beautiful
Microsoft Word output. The little tricks include modifying the PRINTER style, modifying the one way frequency table template,
using ODS RTF TEXT= statements with RTF control words, using inline formatting on the footnote statement, and applying
style definitions to PROC PRINT to produce RTF output that almost exactly meets the publication style. Setting up the SAS®
code only needs to be done one time, thus eliminating a lot of manual formatting in Microsoft Word.
INTRODUCTION
SAS® ODS RTF output has been available since version 8.1. With each new release of SAS, there are more ways to
automatically customize the RTF output within SAS, which eliminates more and more of the manual formatting in Microsoft
Word.
The little tricks to produce beautiful Microsoft Word output are especially helpful for reports that are generated repeatedly over
time. This paper brings together some of the little tricks all in one place, using SAS 9.1.3.
THE DATA USED IN THIS PAPER
The Census Bureau collects revenue and expenditure data from each state education agency for the National Public
Education Financial Survey (NPEFS) each year. The National Center for Education Statistics (NCES) is the agency that
sponsors the data collection. The revenue and expenditure data covers pre-kindergarten through grade 12. Each year, NCES
publishes a report based on the data and makes the dataset available to the public. This paper uses the Excel file for the
Fiscal Year (FY) 2002 NPEFS, which is available at http://www.nces.ed.gov/ccd/stfis.asp.
NCES also publishes documentation for each file. The FY 2002 NPEFS file documentation is available at
http://nces.ed.gov/ccd/pdf/stfis02gen1c.pdf. The report based on the data is “Revenues and Expenditures for Public
Elementary and Secondary Education: School Year 2001-02”, which is available at
http://nces.ed.gov/pubsearch/pubsinfo.asp?pubid=2004341.
The data is edited. Missing data are imputed. Appendix G of the file documentation has two tables. Table G-1 shows the
frequencies of the imputation flags for each item on the survey, while Table G-2 shows the minimum, maximum, and mean
value for each item on the survey, along with a count of the number of missing values and the number of “not applicable”
values.
We can use PROC FREQ to produce the frequencies of the imputation flags for each item on the survey. In the Excel
spreadsheet, if the item is missing, it has the value –1, and if the item is not applicable, it has the value –2. We can use a
macro to recode the negative values to special missing values and set dummy indicator variables. Then PROC MEANS can
calculate the minimum, maximum, and mean value for each item on the survey. Another PROC MEANS can count the
number of missing or not applicable values for each item on the survey. The relevant information is stored in a data set, and
PROC PRINT produces the report.
HOW TO FORMAT THE OUTPUT IN TABLE G-1
The first page of Table G-1 from the NPEFS file documentation is shown on the next page. There are several titles, then a
section of text that defines the imputation flag values, followed by the PROC FREQ output. The variable labels above each
table in the PROC FREQ output are in bold.
BOLD THE VARIABLE LABELS ABOVE EACH PROC FREQ TABLE
We can use the PRINTER style to format the output, but the PRINTER style defines the heading font as bold, which will make
the second row of each table (variable, Frequency, Percent, Cumulative Frequency, and Cumulative Percent) bold also. To
make only the variable label appear in bold, we modify the PRINTER style to take the bold out of the heading font. To make
the variable label bold, we modify the Base.Freq.OneWayFreqs template to apply the bold font to h1.
1
NESUG 2006
Ins & Outs
This is the first page of Table G-1 from the NPEFS file documentation.
2
NESUG 2006
Ins & Outs
SPECIFY ONLY ONE DECIMAL PLACE FOR THE PERCENTAGES
The flag frequency tables show the percentage and cumulative percentage with one decimal place. PROC FREQ shows two
decimals by default. We can apply number formats to the variables in the modified Base.Freq.OneWayFreqs template.
MAKE THE PROC FREQ TABLES HAVE UNIFORM WIDTH
Each column in the PROC FREQ tables will be as wide as the widest cell in that column. The column showing the survey item
flag will vary in width from table to table because the item flag names are different lengths, and we are using a proportional
font. The shortest item flag name has only 3 characters, while the longest item flag has 8 characters. To make the survey
item flag the same width across tables, we apply the cellwidth style to Fvariable in the modified Base.Freq.OneWayFreqs
template.
SHOW LINE ONLY UNDER ROW 2 OF PROC FREQ OUTPUT
The table style in the Printer template controls what kind of lines are in the PROC FREQ tables. Specify rules=groups and
frame=void to get only a line under the second row of each table.
THE MODIFIED BASE.FREQ.ONEWAYFREQS TEMPLATE
The modified template for the PROC FREQ is shown below.
ODS PATH WORK.TEMPLAT(UPDATE) SASHELP.Tmplmst(READ);
proc template;
edit Base.Freq.OneWayFreqs;
edit h1;
style={font_weight=bold}; * make label above each table appear in bold font ;
end;
edit FVariable;
style={cellwidth=1in}; * make all variable columns have same width in output ;
end;
edit Frequency;
format=10.;
end;
edit Percent;
format=10.1;
* want only one decimal place displayed ;
end;
edit CumPercent;
format=10.1;
end;
edit CumFrequency;
format=10.;
end;
end;
run;
THE MODIFIED PRINTER STYLE TEMPLATE
The modified printer style template is shown below.
proc template;
define style styles.newprinter;
parent=styles.printer;
replace color_list
"Colors used in the default style" /
'link'= blue
'bgH'= white
/* default is graybb */
'fg' = black
'bg' = white;
replace fonts /
'TitleFont2' = ("Times Roman",12pt,Bold Italic)
'TitleFont' = ("Times Roman",12pt,Bold ) /* default is 13 pt bold italic */
'StrongFont' = ("Times Roman",10pt,Bold)
'EmphasisFont' = ("Times Roman",10pt,Italic)
'FixedEmphasisFont' = ("Courier",9pt,Italic)
'FixedStrongFont' = ("Courier",9pt,Bold)
'FixedHeadingFont' = ("Courier",9pt,Bold)
'BatchFixedFont' = ("SAS Monospace, Courier",6.7pt)
'FixedFont' = ("Courier",9pt)
'headingEmphasisFont' = ("Times Roman",12pt,Bold Italic) /* default is 11 pt*/
3
NESUG 2006
Ins & Outs
'headingFont' = ("Times Roman",10pt) /* default is 11 pt bold */
'docFont' = ("Times Roman",10pt) ;
style body from document /
leftmargin=1in
rightmargin=1in
topmargin=0.6in
/* guess on top and bottom margin from NCES PDF */
bottommargin=0.4in;
style rowheader from rowheader /
background=_undef_
font=fonts('docFont');
style table from table /
rules=groups
/* only line in each table is below header */
frame=void
cellpadding=1pt
/* minimize space inside cells */
outputwidth=100%;
/* outputwidth=100% forces all tables to use entire width of page */
style UserText from UserText
"Controls the TEXT= style" /
outputwidth=100%
/* forces all ODS RTF TEXT= boxes to use entire width of page */
protectspecialchars=off;
style systemtitle from systemtitle /
protectspecialchars=off;
/* allow me to insert RTF control words */
end;
run;
HOW TO PRODUCE THE EM DASH AND EN DASH IN TITLES
The dash between the words “G.” and “Value” is an em dash, while the dash between “2001” and “02” is an en dash. To
produce these special dashes, we need to use inline formatting in the title statements. The em dash is produced using the
\emdash control word, while the en dash is produced using the \endash control word. The title statements look like this:
title "Appendix G.\emdash Value Distribution and Field Frequencies";
title2 "\b0 Revised File";
title3 "\line \ql ^S={font_size=10pt}Table G-1. Frequencies of imputation flags, state
finance survey: 2001\endash 02\emdash Continued";
We use the word Continued in title3 because pages 2 through the end of the output need to show that word in the title.
OTHER SPECIAL RTF CONTROL WORDS
The \line shown in title3 above is the RTF control word that moves the text to the next line. \ql causes the text to be leftjustified.
The titles will be in Times Roman 12 pt bold because of the TitleFont specification in the modified printer style template. If we
need to turn off the bold on one of the title lines, we can use \b0 to do that, as shown in the title2 statement above.
HOW TO GET THE IMPUTATION FLAG DEFINITIONS INTO THE OUTPUT
We use ODS RTF TEXT= to put the phrase Imputation Flags into the output. The \qc control word centers the text, the \b
control word puts the text in bold, while the \ul control word underlines the text, as shown below.
ODS RTF TEXT="\qc \b \ul Imputation Flags";
We use a data step to set up the imputation flag definitions, and then apply style elements to the PROC PRINT to format the
text.
data flags;
length letter $ 1 sign $ 1 descrip $ 54;
input letter sign descrip $54.;
cards;
R = As reported by the state
A = Adjustment
I = Imputed based on a method other than prior year's data
T = Total based on sum of internal or external detail
C = Combined with data provided elsewhere by the state
;
4
NESUG 2006
Ins & Outs
run;
* need to have footnotes on the proc print to get footnotes to show on first page! ;
proc print data=flags noobs
style(report)={rules=none}
/* no lines in the table */
style(header)={foreground=white /* foreground=white means labels won't be visible */
cellheight=0.1pt};
/* cellheight making header row very tiny */
var letter sign / style(data)={just=c};
var descrip;
footnote1 "^S={just=l font_weight=medium font_size=10pt}See notes at end of table.";
footnote3 "^S={just=c font_weight=medium font_face=arial font_size=8.5pt}{G}^{thispage}";
run;
ODS RTF sectiondata="\sbknone";
* want proc freq to start in same section as flag definitions ;
HOW TO FORMAT THE FOOTNOTES
The footnotes are 12pt Times Roman by default, due to the TitleFont specification in the modified Printer style template. The
^S={ } are the styles applied in the footnote statement, which override the TitleFont specification. The ^ was defined as the
ODS escape character, so SAS knows that a style is being applied. Footnote1 will be Times Roman 10 pt, not bolded, and left
justified. Footnote3 will be Arial 8.5pt, not bolded, and centered. The footnotes are shown in the imputation flag definitions
PROC PRINT so that they will show up on the first page of the output, and each succeeding page.
THE PROC FREQ OUTPUT
Assuming that the data set contains only the imputation flags, the PROC FREQ output is easy to produce with the text shown
below.
ODS RTF TEXT="\line";
proc freq data=doc_output;
tables _all_ ;
run;
The ODS RTF TEXT= statement inserts a blank line between the imputation flag definitions and the first table of the PROC
FREQ output. All the formatting we needed to do is taken care of in the modified Base.Freq.OneWayFreqs template and the
modified PRINTER style template.
NOTES FOR THE LAST PAGE OF TABLE G-1
The last page of Table G-1 needs notes at the end of the table to show the source of the data. We can insert these notes with
several ODS RTF TEXT= statements, as shown below.
ODS RTF TEXT="\line \line";
ODS RTF TEXT="\ql ^S={font_size=11pt}Source: Data reported by states to U.S. Department
of Education, National Center for Education";
ODS RTF TEXT="\ql ^S={font_size=11pt}Statistics, Common Core of Data (CCD), National
Public Education Finance Survey";
ODS RTF TEXT="\ql ^S={font_size=11pt}(NPEFS) FY 2002, (stfis021c).";
ANYTHING WE STILL NEED TO MANUALLY EDIT IN WORD FOR TABLE G-1?
Unfortunately, yes. The Table G-1 title should not say “Continued” on the very first page, and “See notes at end of table”
should not appear on the very last page of Table G-1. The user can delete the “Continued” in the header on the first page,
and the “See notes at end of table” in the footer on the last page. Each PROC FREQ table is in a separate section, so the
headers and footers in the RTF are independent of one another.
5
NESUG 2006
Ins & Outs
This is the first page of Table G-1 from SAS 9.1.3, before deleting the word “Continued”.
6
NESUG 2006
Ins & Outs
HOW TO FORMAT THE OUTPUT IN TABLE G-2
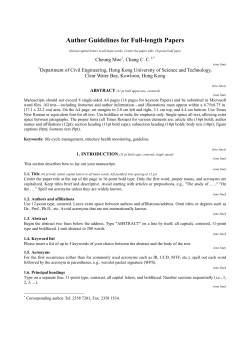
The first page of Table G-2 from the NPEFS file documentation is shown on the next page.
The relevant data is calculated by a macro and stored in a dataset. PROC PRINT produces the report. We can use the same
modified PRINTER style template, with some slight changes. The output for Table G-2 is wider, so we set the left and right
margins to 0.5 inches.
The code below shows the style applied to the PROC PRINT to bold the header of the table. The title statements, footnote
statements, and ODS RTF TEXT= statements are similar those discussed for Table G-1.
The ^{thispage} will show 1 on the first page of this output, but when this output is inserted after the Table G-1 output, the page
number will be continued from the page numbering of Table G-1. When both tables are added to the body of another
document, the user will have to manually reset the page number to start at 1 for the first page of Table G-1. I still haven’t
figured out how to set this properly in SAS. If anybody knows how to do it, please let me know!
If you do the PROC PRINT on all 143 variables, the output is in just one section, which means that the user won’t be able to
easily change the header on the first page and the footer on the last page. One admittedly clunky way to sort of fix this is to do
the PROC PRINT on the number of observations that will fit on a page. I was getting 47 observations per page, so the first
PROC PRINT is for firstobs=1 to obs=47, the second PROC PRINT is for firstobs=48 to obs=94, the third PROC PRINT is for
firstobs=95 to obs=141, and the last PROC PRINT is for firstobs=142 to obs=143. The last PROC PRINT has
style(report)={frame=hsides} to get the lines above and below the table.
ODS ESCAPECHAR='^';
options center;
proc print data=min_max_summary_report(firstobs=1 obs=47) label noobs
style(header)={font_weight=bold}
style(report)={frame=above};
title "Appendix G.\emdash Value Distribution and Field Frequencies";
title2 "\b0 Revised File";
title3 "^S={font_size=10pt}\line \ql Table G-2. Minimum, maximum, and mean values for
continuous variables, state finance survey: 2001\endash 02 \emdash Continued";
var field description / style(header)={just=l};
var count min max mean missing_sum na_sum / style(header)={just=r};
format min max max mean comma20.1;
label field='Variable'
description='Label'
count='N'
min='Minimum'
max='Maximum'
mean='Mean'
missing_sum='-1'
na_sum='-2'
;
footnote1 "^S={just=l font_weight=medium font_size=9pt}See notes at end of table.";
footnote3 "^S={just=c font_weight=medium font_face=arial font_size=8.5pt}G-^{thispage}";
run;
*/ [3 other proc prints need to occur here to get complete report]
*/
ODS RTF TEXT="\line";
ODS RTF TEXT="\ql \ul Note:";
ODS RTF TEXT="\ql -1 = 'Missing'";
ODS RTF TEXT="\ql -2 = 'Not Applicable'";
ODS RTF TEXT="\ql Source: Data reported by states to the U.S. Department of Education,
National Center for Education Statistics, Common Core of Data";
ODS RTF TEXT="\ql (CCD), National Public Education Finance Survey (NPEFS) FY 2002,
(stfis021c).";
7
NESUG 2006
Ins & Outs
This is the first page of Table G-2 from the NPEFS file documentation.
8
NESUG 2006
Ins & Outs
This is the first page of Table G-2 from SAS 9.1.3, before deleting the word “Continued”.
9
NESUG 2006
Ins & Outs
ANYTHING WE STILL NEED TO MANUALLY EDIT IN WORD FOR TABLE G-2?
Unfortunately, yes, just like Table G-1. The Table G-2 title should not say “Continued” on the very first page, and “See notes at
end of table” should not appear on the very last page of Table G-2. The user can delete the “Continued” in the header on the
first page, and the “See notes at end of table” in the footer on the last page. Each PROC PRINT table is in a separate section,
so the headers and footers in the RTF are independent of one another.
CONCLUSION
By using a variety of techniques, we can produce almost perfect RTF output, which requires very little manual editing in Word.
Output that needs to be produced on a regular basis can be automated in SAS.
REFERENCES
Haworth, Lauren. 2006. “PROC TEMPLATE: The Basics”. Proceedings of the Thirty-First Annual SAS Users Group
International Conference. San Francisco, CA. Available at http://www2.sas.com/proceedings/sugi31/112-31.pdf.
Haworth, Lauren. 2004. “SAS with Style: Creating your own ODS Style Template for RTF Output”, Proceedings of the
Twenty-Ninth Annual SAS Users Group International Conference. Montreal, Quebec. Available at
http://www2.sas.com/proceedings/sugi29/125-29.pdf.
Haworth, Lauren E. Output Delivery System: The Basics, Cary, NC: SAS Institute Inc, 2001.
McNeill, Sandy. 2001. “Changes & Enhancements for ODS by Example (through Version 8.2)”, Proceedings of the TwentySixth Annual SAS Users Group Conference. Long Beach, CA. Available at
http://www2.sas.com/proceedings/sugi26/p002-26.pdf.
Documentation of the RTF Specification:
http://msdn.microsoft.com/library/default.asp?url=/library/en-us/dnrtfspec/html/rtfspec.asp
ACKNOWLEDGMENTS
Thanks to Freda Spence and Mary Church for giving me the idea for this paper. Thanks to Kevin Smith and Kathryn
McLawhorn of SAS Institute for answering questions on how to bold the labels on the PROC FREQ output but have the
Frequency label show up in regular font. Thanks to Richard Sigman for showing me how to use call symput. Thanks to Carma
Hogue, Rita Petroni, Kathy McDonald-Johnson, and Chris Boniface for their helpful comments on this paper.
DISCLAIMER
This report is released to inform interested parties of research and to encourage discussion. The views expressed on
technical issues are those of the author and not necessarily those of the U.S. Census Bureau.
CONTACT INFORMATION
Your comments and questions are valued and encouraged. Contact the author at:
Suzanne M. Dorinski
U.S. Census Bureau
Economic Statistical Methods and Programming Division
Washington, DC 20233-6200
Work Phone:
E-mail:
301-763-4869
[email protected]
SAS and all other SAS Institute Inc. product or service names are registered trademarks or trademarks of SAS Institute Inc. in
the USA and other countries. ® indicates USA registration.
Other brand and product names are trademarks of their respective companies.
10
NESUG 2006
Ins & Outs
APPENDIX A: COMPLETE CODE FOR TABLE G-1 OUTPUT
dm 'cle log; cle out';
*************************************************************;
* this is field_frequencies_in_RTF.sas
*;
*
*;
* Use SAS ODS to put field frequency output into RTF.
*;
*
*;
* Suzanne M. Dorinski
6/4/06
*;
*
*;
* This program written for SAS 9.1.3
*;
*************************************************************;
ODS ESCAPECHAR='^';
* escape character for ODS formatting ;
title;
* clear out previous title and footnote statements ;
footnote;
ODS LISTING CLOSE;
* do not show output in listing window ;
ODS PATH WORK.TEMPLAT(UPDATE) SASHELP.Tmplmst(READ);
proc template;
edit Base.Freq.OneWayFreqs;
edit h1;
style={font_weight=bold}; * make label above each table appear in bold font ;
end;
edit FVariable;
style={cellwidth=1in}; * make all variable columns have same width in output ;
end;
edit Frequency;
format=10.;
end;
edit Percent;
format=10.1;
* want only one decimal place displayed ;
end;
edit CumPercent;
format=10.1;
end;
edit CumFrequency;
format=10.;
end;
end;
run;
proc template;
define style styles.newprinter;
parent=styles.printer;
replace color_list
"Colors used in the default style" /
'link'= blue
'bgH'= white
/* default is graybb */
'fg' = black
'bg' = white;
replace fonts /
'TitleFont2' = ("Times Roman",12pt,Bold Italic)
'TitleFont' = ("Times Roman",12pt,Bold ) /* default is 13 pt bold italic */
'StrongFont' = ("Times Roman",10pt,Bold)
11
NESUG 2006
Ins & Outs
style
style
style
style
style
'EmphasisFont' = ("Times Roman",10pt,Italic)
'FixedEmphasisFont' = ("Courier",9pt,Italic)
'FixedStrongFont' = ("Courier",9pt,Bold)
'FixedHeadingFont' = ("Courier",9pt,Bold)
'BatchFixedFont' = ("SAS Monospace, Courier",6.7pt)
'FixedFont' = ("Courier",9pt)
'headingEmphasisFont' = ("Times Roman",12pt,Bold Italic)
/* default is 11 pt */
'headingFont' = ("Times Roman",10pt) /* default is 11 pt bold */
'docFont' = ("Times Roman",10pt) ;
body from document /
leftmargin=1in
rightmargin=1in
topmargin=0.6in
/* guess on top and bottom margin from NCES PDF */
bottommargin=0.4in;
rowheader from rowheader /
background=_undef_
font=fonts('docFont');
table from table /
rules=groups
/* only line in each table is below header */
frame=void
cellpadding=1pt
/* minimize space inside cells */
outputwidth=100%;
/* outputwidth=100% forces all tables to use entire width of page */
UserText from UserText
"Controls the TEXT= style" /
outputwidth=100%
/* forces all ODS RTF TEXT= boxes to use entire width of page */
protectspecialchars=off;
systemtitle from systemtitle /
protectspecialchars=off;
/* allow me to insert RTF control words */
end;
run;
ODS RTF
FILE='C:\Documents and Settings\My Documents\NESUG 2006 paper\field_frequencies.rtf'
STYLE=newprinter;
ODS RESULTS OFF;
* do not open up Word viewer in SAS session ;
PROC IMPORT OUT= flag_data_to_be_summarized
DATAFILE=
"C:\Documents and Settings\My Documents\NESUG 2006 paper\stfis021c.xls"
DBMS=EXCEL REPLACE;
RANGE='E61:EQ117';
GETNAMES=YES;
RUN;
* note that complete label statement is NOT shown below ;
data doc_output;
set flag_data_to_be_summarized;
label
iR1A
=
'iR1A - Local Revenue
iR1B
=
'iR1B - Local Revenue
iR1C
=
'iR1C - Local Revenue
iR1D
=
'iR1D - Local Revenue
iR1E
=
'iR1E - Local Revenue
iR1F
=
'iR1F - Local Revenue
Property Tax'
Non Property Tax'
Local Government Property Tax'
Local Government Non Property Tax'
Individual Tuition'
Tuition From Local Education Agency'
12
NESUG 2006
iTX12
=
iNCE13
=
iMEMBR01 =
;
run;
Ins & Outs
'iTX12 - Total Exclusions'
'iNCE13 - Net Current Expenditures'
'iMEMBR01 - Student Membership'
ODS NOPROCTITLE;
* suppress "The FREQ Procedure" in the RTF output ;
* \emdash adds em dash to RTF, while \endash adds en dash to RTF ;
title "Appendix G.\emdash Value Distribution and Field Frequencies";
title2 "\b0 Revised File";
title3 "\line \ql ^S={font_size=10pt}Table G-1. Frequencies of imputation flags, state
finance survey: 2001\endash 02\emdash Continued";
options nodate nonumber CENTER;
ODS RTF TEXT="\qc \b \ul Imputation Flags";
/* \qc specifies text is centered */
/* \b specifies text is bolded */
/* \ul specifies text is underlined */
data flags;
length letter $ 1 sign $ 1 descrip $ 54;
input letter sign descrip $54.;
cards;
R = As reported by the state
A = Adjustment
I = Imputed based on a method other than prior year's data
T = Total based on sum of internal or external detail
C = Combined with data provided elsewhere by the state
;
run;
* need to have footnotes on the proc print to get footnotes to show on first page! ;
proc print data=flags noobs
style(report)={rules=none}
/* no lines in the table */
style(header)={foreground=white
/* foreground=white means labels won't be
visible */
cellheight=0.1pt};
/* cellheight makes header row very tiny */
var letter sign / style(data)={just=c};
var descrip;
footnote1 "^S={just=l font_weight=medium font_size=10pt}See notes at end of table.";
footnote3 "^S={just=c font_weight=medium font_face=arial font_size=8.5pt}{G}^{thispage}";
run;
ODS RTF sectiondata="\sbknone"; * want proc freq to start in same section as flag
definitions ;
ODS RTF TEXT="\line";
proc freq data=doc_output;
tables _all_ ;
run;
ODS RTF TEXT="\line \line";
ODS RTF TEXT="\ql ^S={font_size=11pt}Source: Data reported by states to U.S. Department
of Education, National Center for Education";
ODS RTF TEXT="\ql ^S={font_size=11pt}Statistics, Common Core of Data (CCD), National
13
NESUG 2006
Ins & Outs
Public Education Finance Survey";
ODS RTF TEXT="\ql ^S={font_size=11pt}(NPEFS) FY 2002, (stfis021c).";
ODS RTF CLOSE;
* now get rid of style template that was created in this program ;
proc template;
delete Base.Freq.OneWayFreqs;
delete styles.newprinter;
run;
* now open the listing window again ;
ODS LISTING;
14
NESUG 2006
Ins & Outs
APPENDIX B: COMPLETE CODE FOR TABLE G-2 OUTPUT
dm 'cle log; cle out';
********************************************************************;
* this is value_distribution_in_RTF.sas
*;
*
*;
* Use SAS ODS to put value distribution output into RTF.
*;
*
*;
* Suzanne M. Dorinski
6/4/06
*;
*
*;
* program written in SAS 9.1.3
*;
********************************************************************;
options mprint nodate nonumber nosymbolgen;
PROC IMPORT OUT= data_to_be_summarized
DATAFILE=
"C:\Documents and Settings\My Documents\NESUG 2006 paper\stfis021c.xls"
DBMS=EXCEL REPLACE;
RANGE='E1:EQ57';
GETNAMES=YES;
RUN;
* want to make sure variables in table are in same order as shown
* in Excel spreadsheet ;
proc sql;
create table variable_list as
select name, varnum
from sashelp.vcolumn
where libname='WORK' and
memname='DATA_TO_BE_SUMMARIZED';
quit;
proc sort data=variable_list;
by name;
run;
* note that complete descriptive_text data set is NOT shown below ;
data descriptive_text;
input name $ description $60. ;
cards;
R1A
LOCAL REV PROPERTY TAX
R1B
LOCAL REV NON PROPERTY TAX
R1C
LOCAL REV LOC GOVT PROP TAX
R1D
LOCAL REV LOC GOVT NON PROP TAX
R1E
LOCAL REV INDIVID TUITION
R1F
LOCAL REV TUITION FR LEA'S
A14B
ADA (NCES DEFINITION)
PPE15
PER PUPIL EXPENDITURES
MEMBR01
TOTAL STUDENTS
;
run;
proc sort data=descriptive_text;
by name;
run;
15
NESUG 2006
Ins & Outs
* add descriptions to variable_list data set;
data variable_list;
merge variable_list(in=l)
descriptive_text;
by name;
if l;
run;
proc sort data=variable_list;
by varnum;
run;
/* how many numeric variables are in the report?
/* in the min_max macro.
need the count for the do loop */
*/
proc sql noprint;
select count(*)
into :numobs
from variable_list;
quit;
%macro min_max;
/*
/*
/*
/*
/*
/*
min_max macro handles one numeric variable at a time.
the macro counts the number of records with nonnegative
values, calculates the minimum, maximum, and mean values,
and also counts the number of records with –1 values or
-2 values. the results are appended to the
min_max_summary_report data set.
*/
*/
*/
*/
*/
*/
%do i=1 %to &numobs;
data _null_;
/* this data step gets the numeric variable’s name and description */
obsnum=&i;
set variable_list point=obsnum;
if _error_ then abort;
call symputx('field',name);
call symputx('description',description);
stop;
run;
/*
/*
/*
/*
the data step below is recoding the negative values so that the minimum and mean
values are handled correctly by PROC MEANS. the data step is also creating two
indicator variables which will be used by another PROC MEANS to count the number
of records with missing or “not applicable” values.
data &field;
set data_to_be_summarized(keep=&field);
if &field=-1 then
do;
&field=.M;
&field._missing=1;
end;
if &field=-2 then
do;
&field=.N;
&field._na=1;
end;
run;
16
*/
*/
*/
*/
NESUG 2006
Ins & Outs
proc means data=&field n min max mean noprint;
var &field;
output out=&field._summary
n=count
min=min
max=max
mean=mean;
run;
data &field._summary;
length field $ 8;
set &field._summary(drop=_type_ _freq_);
field="&field";
run;
proc means data=&field sum noprint;
var &field._missing &field._na;
output out=&field._negative
sum=missing_sum
na_sum;
run;
data &field._negative;
length field $ 8;
set &field._negative(drop=_type_ _freq_);
field="&field";
run;
/* the data step below is combining the results from the first and second PROC MEANS */
data &field._report;
length description $ 40;
merge &field._summary
&field._negative;
by field;
description="&description";
if missing_sum=. then missing_sum=0;
if na_sum=. then na_sum=0;
run;
proc append base=min_max_summary_report data=&field._report;
run;
proc datasets nolist;
delete &field &field._summary &field._negative &field._report;
quit;
%end;
%mend min_max;
%min_max
ODS PATH WORK.TEMPLAT(UPDATE) SASHELP.Tmplmst(READ);
proc template;
define style styles.newprinter;
parent=styles.printer;
replace color_list
"Colors used in the default style" /
17
NESUG 2006
Ins & Outs
'link'= blue
'bgH'= white /* bgH was graybb */
'fg' = black
'bg' = white;
replace fonts /
'TitleFont2' = ("Times Roman",12pt,Bold Italic)
'TitleFont' = ("Times Roman",12pt,Bold )
/* default is 13pt bold italic */
'StrongFont' = ("Times Roman",12pt,Bold)
/* default is 10 pt */
'EmphasisFont' = ("Times Roman",10pt,Italic)
'FixedEmphasisFont' = ("Courier",9pt,Italic)
'FixedStrongFont' = ("Courier",9pt,Bold)
'FixedHeadingFont' = ("Courier",9pt,Bold)
'BatchFixedFont' = ("SAS Monospace, Courier",6.7pt)
'FixedFont' = ("Courier",9pt)
'headingEmphasisFont' = ("Times Roman",12pt,Bold Italic)
/* default is 11 pt */
'headingFont' = ("Times Roman",10pt)
/* default is 11 pt bold */
'docFont' = ("Times Roman",9pt); /* default is 10 pt */
style body from document /
leftmargin=0.5in
rightmargin=0.5in
topmargin=0.6in /* guess top and bottom margin from NCES PDF */
bottommargin=0.4in;
style rowheader from rowheader /
background=_undef_
font=fonts('docFont');
style table from table /
rules=groups
/* only line inside table is below header */
frame=void
cellpadding=1pt
/* minimize space inside cells */
outputwidth=100%;
/* outputwidth=100% forces all tables to use entire width of page */
style UserText from UserText
"Controls the TEXT= style" /
outputwidth=100%
/* force ODS RTF TEXT= cells to use entire width of page */
protectspecialchars=off;
style systemtitle from systemtitle /
protectspecialchars=off;
/* allow me to insert RTF control words */
end;
run;
ODS RTF
FILE="C:\Documents and Settings\My Documents\NESUG 2006 paper\value_distribution.rtf"
STYLE=newprinter;
ODS RESULTS OFF;
* do not open Word viewer in SAS session ;
ODS ESCAPECHAR='^';
options center;
proc print data=min_max_summary_report(firstobs=1 obs=47) label noobs
style(header)={font_weight=bold}
style(report)={frame=above};
title "Appendix G.\emdash Value Distribution and Field Frequencies";
18
NESUG 2006
Ins & Outs
title2 "\b0 Revised File";
title3 "^S={font_size=10pt}\line \ql Table G-2. Minimum, maximum, and mean values for
continuous variables, state finance survey: 2001\endash 02 \emdash Continued";
var field description / style(header)={just=l};
var count min max mean missing_sum na_sum / style(header)={just=r};
format min max max mean comma20.1;
label field='Variable'
description='Label'
count='N'
min='Minimum'
max='Maximum'
mean='Mean'
missing_sum='-1'
na_sum='-2';
;
footnote1 "^S={just=l font_weight=medium font_size=9pt}See notes at end of table.";
footnote3 "^S={just=c font_weight=medium font_face=arial font_size=8.5pt}G-^{thispage}";
run;
proc print data=min_max_summary_report(firstobs=48 obs=94) label noobs
style(header)={font_weight=bold}
style(report)={frame=above}; /* line above table only */
var field description / style(header)={just=l};
var count min max mean missing_sum na_sum / style(header)={just=r};
format min max max mean comma20.1;
label field='Variable'
description='Label'
count='N'
min='Minimum'
max='Maximum'
mean='Mean'
missing_sum='-1'
na_sum='-2';
run;
proc print data=min_max_summary_report(firstobs=95 obs=141) label noobs
style(header)={font_weight=bold}
style(report)={frame=above};
var field description / style(header)={just=l};
var count min max mean missing_sum na_sum / style(header)={just=r};
format min max max mean comma20.1;
label field='Variable'
description='Label'
count='N'
min='Minimum'
max='Maximum'
mean='Mean'
missing_sum='-1'
na_sum='-2';
run;
proc print data=min_max_summary_report(firstobs=142 obs=143) label noobs
style(header)={font_weight=bold}
style(report)={frame=hsides};
/* line above and below table */
var field description / style(header)={just=l};
var count min max mean missing_sum na_sum / style(header)={just=r};
format min max max mean comma20.1;
label field='Variable'
description='Label'
count='N'
min='Minimum'
max='Maximum'
19
NESUG 2006
Ins & Outs
mean='Mean'
missing_sum='-1'
na_sum='-2';
run;
ODS RTF TEXT="\line";
ODS RTF TEXT="\ql \ul Note:";
ODS RTF TEXT="\ql -1 = 'Missing'";
ODS RTF TEXT="\ql -2 = 'Not Applicable'";
ODS RTF TEXT="\ql Source: Data reported by states to the U.S. Department of Education,
National Center for Education Statistics, Common Core of Data";
ODS RTF TEXT="\ql (CCD), National Public Education Finance Survey (NPEFS) FY 2002,
(stfis021c).";
ODS RTF CLOSE;
proc datasets nolist;
delete min_max_summary_report;
run;
proc template;
delete styles.newprinter;
run;
20


© Copyright 2026