
The Battle for Brains: How to Attract Talent Preliminary Draft! Abstract
Preliminary Draft!
The Battle for Brains: How to Attract Talent
By
Simone Bertoli, Herbert Brücker, Giovanni Facchini, Anna Maria Mayda and Giovanni Peri
Abstract
This study examines the causes and consequences of highly skilled migration from a receiving
country perspective, and it contributes to a better understanding of skill-selective immigration
policies. About 20 million highly skilled immigrants resided in OECD countries at the beginning of this
decade, corresponding to 11 per cent of the highly skilled population there. Only few Englishspeaking OECD countries (i.e. the US, Canada and Australia) absorb the overwhelming share of these
highly skilled migrants at present, while most other OECD countries are net senders of highly
educated individuals. Political economy forces can explain why only few OECD countries are currently
adopting immigration policies which systematically select highly skilled immigrants. At the same
time, OECD governments are increasingly realizing the desirability of skill selective immigration
policies from the point of view of aggregate welfare, so that relevant policy changes towards the
mobility of talented workers may occur in the near future.
Our empirical analysis of the determinants of highly skilled immigration shows that the wage
premium for highly skilled workers and skill-selective immigration policies are the main forces which
determine the immigration of foreign talents. Increasing the wage premium for education by US $
10,000 increases the share of the highly skilled in the immigrant population between 20 and 40 per
cent relative to its initial value. The generosity of the welfare benefits and a high level of labour
market protection tend to reduce the share of highly skilled in the immigrant population, while high
R&D spending tends to increase it.
Based on a cross-country analysis in 14 OECD countries we find that total immigration, on average, is
associated with increasing employment of natives and increasing investment in the short- and in the
long-run, thereby broadening the productive base of the receiving country. However, it leaves total
factor productivity and average wages unchanged. Increasing the share of highly skilled workers in
the immigrant workforce is associated with additional beneficial effects on employment and capital,
but does not affect productivity. Moreover, we find that total immigration can have negative effects
on native employment in the short-run if immigrants come to the receiving countries during an
economic downturn. However, the positive effects of increasing the share of the highly skilled among
foreign workers are not affected, even in the short-run, by the ups and downs of the business cycle.
Next we address the puzzle that only a few countries currently opt for a skill-selective immigration
policy, notwithstanding the large overall gains from highly skilled immigration. We start by
examining the drivers of individual attitudes towards highly skilled immigration. We find that more
educated natives are less likely to favour highly skilled immigration, while richer people are more
likely to do so. While the former finding can be explained by the labour market effects of highly
skilled immigration, the latter is consistent with the impact of migration on the welfare state under
the tax adjustment model. Moreover, our analysis of how individual attitudes translate into
immigration policies suggests that a pressure group framework can better explain actual policy
outcomes than a median voter model.
Finally, by analyzing the potential outcomes of an intensified contest for talent we find that the
competition for highly skilled labour may undermine the incentives of sending country governments
to invest in education, which in turn reduces the global pool of talent. As a consequence,
coordination among destination counties is desirable in order to limit adverse unintended sideeffects that might reduce the otherwise large welfare gains from an increased international mobility
of talented workers.
1
Contents
1
2
3
4
5
6
7
8
9
2.1
2.2
2.3
2.4
2.5
2.6
3.1
3.2
3.3
3.4
3.5
3.6
4.1
4.2
4.3
4.4
5.1
5.2
5.3
5.4
5.5
6.1
6.2
6.3
6.4
6.5
7.1
7.2
7.3
7.4
Introduction ............................................................................................................................... 2
Selecting the highly skilled – an overview on current policy approaches ............................... 6
A classification of skill selective immigration policies ........................................................... 6
Skill-selective immigration policies in traditional immigration countries ............................. 7
Skill-selective immigration policies at the EU level.............................................................. 11
Skill-selective immigration policies in a group of EU member countries ............................ 12
Policies to attract high skilled immigrants: evidence based on UN data............................. 14
Conclusions .......................................................................................................................... 15
Stylised Facts and Trends......................................................................................................... 17
High skilled immigrants in the OECD ................................................................................... 17
How large is the pool of high skilled labour?....................................................................... 27
Looking at the top of the skill distribution........................................................................... 28
The competition for foreign students.................................................................................. 34
Can highly skilled immigrants transfer their human capital into host labour markets? ..... 36
Conclusions .......................................................................................................................... 40
The determinants of highly skilled migration: Evidence from OECD countries 1980 - 2005. 43
A simple model .................................................................................................................... 44
Data...................................................................................................................................... 47
Regression results ................................................................................................................ 54
Discussion and conclusions.................................................................................................. 61
The effects of immigration and the brain gain on growth, investment and employment:
Evidence from the OECD 1980 - 2005...................................................................................... 67
A production function framework ....................................................................................... 68
Data on employment, capital Intensity and productivity .................................................... 70
The effects of immigration and brain gain........................................................................... 71
The effects of immigration and brain gain in bad economic times ..................................... 77
Conclusions .......................................................................................................................... 79
The political economy of skilled immigration......................................................................... 82
The elements of a political economy model of immigration policy .................................... 82
Understanding individual attitudes towards skilled migrants ............................................. 84
From individual preferences to immigration policy............................................................. 97
Empirical assessment......................................................................................................... 101
Conclusions ........................................................................................................................ 107
Is the “battle for brains” a zero-sum game?......................................................................... 117
The impact of the Battle for Brains on human capital formation...................................... 118
A simple model of the Battle for Brains............................................................................. 121
Discussion of the results .................................................................................................... 124
Conclusions ........................................................................................................................ 125
Conclusions ............................................................................................................................ 127
References.............................................................................................................................. 131
2
“I want to emphasize that to address the shortage of scientists and
engineers, we must do both – reform our education system and our
immigration policies. If we don't, American companies simply will not
have the talent they need to innovate and compete.”
Bill Gates, Testimony at the U.S. House of Representatives
Committee on Science and Technology on March 12, 2008
1
Introduction
International migration into the developed countries of the OECD and other high-income
destinations in the Gulf region has increased during the last decades. About 20 million immigrants
with tertiary education resided in the OECD at the beginning of this decade, representing about 11
per cent of the total highly skilled population living there. Although highly skilled workers are more
internationally mobile than less skilled ones (OECD, 2008), skilled migration is still a small
phenomenon compared to other facets of globalisation. Essentially, as it has been suggested by
many authors, what we are experiencing is a wave of globalisation that includes ‘everything but
labour’ (Freeman, 2006; Pritchett, 2006). Still, there is a substantial heterogeneity in the distribution
of foreign talents across high income countries. In fact, English speaking destinations, and especially
those which have pursued an active skill-selective immigration policy like Australia, Canada and New
Zealand, display substantially higher shares of foreign skilled workers than all other OECD
destinations do, while many other OECD countries experience the emigration of substantial numbers
of highly skilled individuals.
At the same time, OECD governments are increasingly realizing the economic rationale for adopting
skill selective immigration policies. Highly qualified migrants can bring valuable skills which are in
short supply, new entrepreneurial spirit, and they can also be a booster to local welfare systems etc.
Thus, more and more countries are redesigning their immigration systems to make them more skillselective. The recent introduction in the United Kingdom of a point based system is just an example,
and the discussion on the EU “Blue Card” initiative is another. Still, in many destinations countries
domestic pressure groups have been very successful in limiting the inflow of foreign skilled workers
(Facchini, Mayda and Mishra, 2008). As a result, while a “Battle for Brains” is unfolding, we are only
at its beginning.
There are good reasons to believe that the contest for talent will intensify during the next few
decades. Skill biased technological change and, perhaps to a lesser extent, the growing specialisation
of developed countries in human capital-intensive activities as a result of globalisation will raise the
demand for highly skilled labour. Large and persisting earnings differentials and declining transport
and communication costs are likely to result in growing migration flows between rich and poor
countries, even if the current financial crisis may lead to a reduction of international migration flows
in the short term. Today, about 50 per cent of the highly skilled immigrants in the OECD originate
from other OECD countries. While highly skilled in the developed world are becoming more and
more mobile, the share of foreign talents originating in OECD countries has declined over time. Thus,
it is to be expected that the majority of future highly skilled immigrants in the OECD and other
developed destinations will come from middle- and low- income countries, which are characterized
by relatively poor human capital endowments. The increasing competition for highly skilled labour
will hence affect the allocation of talent both among developed countries and also between
developed and less developed countries.
New theoretical models and richer datasets have greatly enhanced our ability to analyze the effects
of skilled migration both on destination and source countries during the last decade. As shown by
Docquier and Rapoport (2009), recent developments have mainly focused on the brain drain from
3
the sending country perspective (e.g. Mountford, 1997; Stark et al., 1997; Vidal, 1998; Beine et al.,
2001). The effects of skilled immigration in receiving countries and the competition of different
destinations for highly qualified immigrants have received less attention in the academic literature,
even though several important issues have started to be analyzed. As an example, several studies
have examined the impact of immigrants by different skill levels on wages (e.g. Borjas, 2003;
Ottaviano and Peri, 2006) and unemployment (e.g. Brücker and Jahn, 2008; D’Amuri, Ottaviano and
Peri, 2008), or the different implications of highly and less skilled immigration on the welfare state
(e.g. Boeri, Hanson and McCormick, 2002; Bonin, Raffelhüschen and Walliser, 2000). Moreover,
several studies by international organisations have documented the scale of highly skilled
immigration, and the evolution of several policy issues (e.g. OECD, 2006; Kuptsch and Pang, 2006).
Finally, other recent contributions have described the phenomenon of highly skilled emigration and
immigration in individual countries of the OECD (e.g. Becker, Ichino and Peri, 2004; Saint-Paul, 2004;
Hunt, 2009). Nevertheless, a comprehensive analysis of high skilled migration and the forthcoming
contest for skill – which takes into account the interaction between immigration policies and
potential outcomes – is still missing.1
The purpose of this study is to examine the causes and consequences of skilled migration from the
point of view of the receiving country. In particular we plan to address the following questions:
•
•
•
•
•
•
•
How do skill-selective immigration policies in the receiving countries look like? Which
strategies are pursued to attract highly skilled immigrants? Which have been the main policy
changes during the last decade?
What are the main features of highly skilled immigration into developed countries? Which
countries and regions tend to gain and which countries tend to lose human capital through
the international mobility of high skilled individuals?
Which economic, legal and institutional factors determine the migration of highly skilled
individuals?
What is the impact of the immigration of highly skilled workers on output, capital
accumulation, total factor productivity and employment compared to the average impact of
immigration?
Do receiving countries also benefit from the immigration of the highly skilled workers in an
economic downturn?
Why do so few countries adopt policies to attract highly skilled immigrants, given that the
overall economic effects are beneficial? Can political economy forces help explaining this
apparent puzzle?
Finally – as more and more destination countries are implementing skill selective policies –
what will be the welfare effects of the contest for talents among destination countries? Will
aggressive skill-selective immigration policies reduce the global pool of highly skilled labour?
Is there a need for policy coordination among the recipients to avoid an unintended “tragedy
of the commons”?
Our argument is developed as follows. We start with a description of skill-selective immigration
policies and of the main trends of highly skilled migration, which lays out the background for further
analyses. Chapter 2 outlines the different approaches to select highly skilled immigrants in the main
destination countries of the OECD and sketches the major shifts in policies, which have taken place
1
One interesting recent contribution in this area is the forthcoming volume by Bhagwati and Hanson (2009).
4
during the last decade. We also discuss the approach of the EU to enter the contest for talents,
particularly the “blue card” proposal of the European Commission.
Chapter 3 provides an overview of highly skilled migration into OECD countries. Using recently
collected data on the number of immigrants with tertiary education in the OECD, we describe the
main trends in the immigration of highly skilled individuals from the receiving country perspective.
Furthermore, the use of census data for selected OECD countries allows us to look at patterns of
immigration at the very top of the skill distribution. We then analyse the development in the global
pool of highly skilled individuals in origin countries. Our data enable us to assess which OECD
economies tend to gain and which tend to lose human capital through the migration of highly skilled
individuals. Moreover, we address specific issues such as the international mobility of students,
which plays a growing role in the mobility of foreign talents. Finally, we discuss the extent to which
highly skilled immigrants are able to employ their human capital in host country labour markets.
Building on this descriptive analysis, Chapter 4 examines the economic, legal and institutional
determinants of highly skilled migration in detail. Drawing on Ortega and Peri (2009) and Grogger
and Hanson (2008), a scale equation and a selection equation are derived from a simple theoretical
model of the migration decision. Using a panel data set which comprises 74 sending and 14 OECD
destination countries over the 1980 to 2005 period, we explain the scale and the skill-selectivity of
immigration using a large set of variables which are derived from economic and political
considerations. Inter alia, we focus on wage levels and the wage premium for highly skilled labour,
skill-selective and other immigration policies, the generosity of welfare benefits, labour market
institutions and R&D expenditures. While there are some issues of omitted variables and reverse
causality that cannot be fully resolved with the aggregate data, the robustness of some estimates
reveals at least significant correlation of immigration flows with wage and immigration policies in the
receiving country.
Chapter 5 addresses the impact of highly educated immigrants on employment, productivity, capital
accumulation and output of the receiving countries economies. Using an aggregate production
function framework akin to growth accounting, we decompose the migration effects into a total
immigration effect and the effect of the “brain gain”, which is measured as the share of tertiary
educated individuals in the immigrant population. The empirical analysis exploits the variance in total
immigration and its skill composition in 14 OECD countries during the 1980 to 2005 for identification.
In order to isolate the supply-driven changes in total immigration flows and their skill composition we
use the push-factors identified in the analysis of the determinants of migration in Chapter 4 as
instruments. While there are still some concerns that some unobserved shocks affect push factors
and receiving countries at the same time, invalidating the instruments, we think our identification
strategy is an interesting step forward from the current literature. This analysis provides new insights
concerning both the total effect of immigration and the immigration of highly skilled individuals in
particular. Against the background of the current global downturn, we also analyse whether these
effects differ between “normal” and “bad” economic times.
The findings in Chapter 5 suggest that total immigration is beneficial for employment, capital
accumulation and total output, and that these gains increase with the share of highly skilled
individuals in the immigrant population. Nevertheless, most receiving countries restrict immigration
and are reluctant to implement immigration policies that systematically select high skilled
immigrants. Chapter 6 addresses this puzzle. Building on a political economy framework, we first
analyze the factors that affect public opinion, since the latter represents one of the main forces
driving immigration policies. Considering two main channels by which immigration of highly skilled
individuals can affect public opinion – the labour market and the welfare state channels – we
empirically examine the determinants of individual attitudes towards highly skilled immigration. In
the next step, we analyze how individual attitudes are aggregated in democratic societies. In
particular, we consider two alternative models, which capture different political forces at play: the
5
median voter model and the interest groups model. In the final step we assess the ability of the
alternative frameworks to explain actual policy outcomes both for main European destination
countries and the US.
While Chapter 6 provides a positive analysis, which helps understanding why so many countries are
still reluctant to implement skill-selective immigration policies, Chapter 7 takes a long run
perspective and addresses the possible implications of the contest for talents from a normative
perspective. Assume – the political economy forces against skilled migration notwithstanding – that
most developed countries will compete for highly skilled labour in the future. What will be the effects
of growing competition on welfare in both the destination and source countries? We address this
question in a three country setting, which takes into account the strategic interaction between
different destinations. Under the empirically backed assumption that emigration of the high skilled
undermines incentives of sending country governments to invest in education, an aggressive contest
for talent may impair the reproduction of the global pool of high skilled labour in the long run such
that, a demand for policy coordination may emerge.
Finally, Chapter 8 summarizes our main findings and draws some policy conclusions.
6
“The benefits of migration pay for its costs. The UK’s thoughtful migration
policy and flexible, efficient work permit process are significant competitive
advantages for its businesses and economy. By allowing the UK to draw
from the global talent pool, migration has contributed significantly to
London’s success as a top global financial centre, as well as making it one of
the most dynamic, culturally diverse, stimulating cities in which to live and
work.” Goldman Sachs International, 20052
2
Selecting the highly skilled – an overview on current policy approaches
Selecting migrants according to the skills needed in the labour market is becoming an increasingly
widespread practice among developed countries. These policies have a long history in traditional
immigration countries, particularly in Australia, Canada and New Zealand, and, to a lesser extent, in
the United States. Most European countries have in contrast either recruited manual workers from
abroad or have not pursued skill-selective immigration policies at all for decades. Increasing concerns
that Europe may lose the talent contest and, as a consequence, may see its long term economic
growth prospects decline, has resulted in policy reforms both at the levels of the EU and its member
states.
The goal of this chapter is to provide a brief overview of skill selective immigration policies in the
main destination countries and of the major shifts in these policies, which we have recently
observed. We proceed in the following steps: First, we outline the main approaches to select highly
skilled immigrants. Second, we describe the main features of these approaches in countries which
have a long tradition in selecting high skilled immigrants, i.e. Australia, Canada, New Zealand and the
US. Third, we describe the approach of the EU to enter the talent contest, particularly the “blue card”
proposal of the European Commission. Fourth, we discuss the changes in the immigration policies of
some of the main destination countries in the EU. Finally, we present the results of a survey of the
United Nations among governmental officials on the use of skill-selective immigration policies. This
will help us gaining a perspective on the likelihood of a shift towards skill-selective immigration
policies at the global level.
2.1
A classification of skill selective immigration policies
Countries like Australia, Canada, New Zealand and the United States employ different types of policy
tools for the selection of high skilled migrants, which can be broadly classified as “immigrant driven”
or “employer driven” (Chaloff and Lemaitre, 2009). Under the former, an immigrant is admitted in
the country without necessarily having a job offer and is selected on the basis of a set of desirable
attributes. Under the second system, an employer has to make a job offer in order for a highly skilled
worker to be admitted.
“Immigrant driven” systems typically use a “point assessment” to determine the desirability of a
foreign national. This type of framework has first been introduced in Canada in 1967, followed by
Australia in 1989 and New Zealand in 1991. More recently, the UK has introduced a similar scheme in
2001, and the blue card initiative which has been proposed by the EU Commission in 2007 also
incorporates some features of the point system (EC 2007).
Point systems are used to select individuals to be admitted in a destination country based on
characteristics that make them “desirable”. The selection is typically carried out by identifying a
“pass rate”, i.e. a minimum number of points that needs to be reached. Typically, point systems
Response to the consultation document on the introduction of the new point-based migration system in the United
Kingdom, 2005 (cited in Home Office, 2006, page 5).
2
7
attribute a substantial weight to five criteria: occupation; work experience; education; destination
country language proficiency; and age. A second set of criteria, which does not appear in all point
systems, is also relevant. This includes: employer nomination/job offer; prior work in the destination
country; education obtained in the destination country; settlement stipulations (in which part of the
destination country the immigrant plans to settle); presence of close relatives; prior earnings.
Broadly speaking, we can distinguish two different economic models that underpin the attribution of
“points” in the first set of criteria. On the one hand, we have a short term oriented framework, in
which emphasis is posed on the need to fill gaps in the destination country’s labour market. In such a
model, the applicant’s recent occupation and work experience are rewarded particularly highly. On
the other, we can identify a long term oriented framework, which is inspired by an earnings or
human capital economic model. In this context, education, age and official language proficiency are
instead the main focus.
In “employer driven” skilled immigration systems – like the US H1B visa system - employers are the
key players. They sponsor the application for the admission of a foreign worker and typically need to
carry out a “labour market” test. The purpose of the test is to establish whether the vacancy for
which an immigrant is requested cannot be filled by a local worker, and the restrictiveness of the
labour market test varies substantially across countries.
2.2
Skill-selective immigration policies in traditional immigration countries
To understand the working of the different systems in practice, it is useful to briefly review their
salient features, remembering that many actual migration systems combine elements of both
employer and immigrant driven frameworks.
Canada
The point system for the “independent” (or economic) class was introduced in Canada in 1967 and,
since then, it has been used as the core criterion to determine which individuals will gain access to
the country as skilled migrants. The economic class was expanded to include a “business” class of
immigrants in 1986, but its numeric importance has been limited and has not exceeded a few
percentage points of the total. In 2007, out of a total of 237,000 permanent admissions to the
country, approximately 98,000 individuals, or 41 per cent of the total, have been admitted under the
skilled worker program as either principal applicants or spouses and dependants (CIC 2008), down
from an average of around 50 per cent for the period 2000-2006.
The working of the system has changed substantially over time, with new criteria being introduced
and others being removed. The “pass rate” has also varied over time, ranging from 50 points (out of a
total of 100) in 1967, to 70 in 1986. The system’s evolution is illustrated in Table 2.1. In the first
twenty years since introduction, the focus was on the occupational need of the economy at any given
point in time. In 1986 for instance, up to 43 points were assigned on the basis of occupation-related
categories (experience, specific vocational preparation, occupational demand and designated
occupation), and an additional 10 points (level adjustment factor) were left to the discretion of the
Canadian authorities to account for fluctuations in labour demand. 37 points were attributed to
education, language proficiency and age, and the remaining 10 to adaptability (usually based on
labour market characteristics of the spouse). Since the 1990s the focus has changed and now Canada
implements a migration policy towards the skilled, which is no longer based on a “gap filling”
strategy, but rather an earnings/human capital perspective. As a result in 2009 education, language
proficiency and age account for up to 59 points out of a maximum available of 100. The importance
of the occupation dimension has substantially fallen and, under the current regime, only a maximum
8
of 31 points can be attributed on the basis of previous experience and arranged employment or
designated occupation.
Table 2.1
The Canadian point system
Experience
Specific vocational preparation
Occupational demand
Labour market balance
Education
Language proficiency
Age
Arranged employment or designated occupation
Personal suitability/Adaptability
Levels adjustment factor
Relative
Destination
Total
Pass mark
1967
10
15
20
10
10
10
15
5
5
100
50
1978
8
15
15
12
10
10
10
10
5
5
100
50
1986
8
15
10
12
15
10
10
10
10
100
70
Sources: Green and Green (1999) and Citizenship and Immigration Canada.
1996
9
10
21
21
13
4
17
5
100
*
2009
21
25
24
10
10
10
100
67
The main goal of the new policy is to favour the immigration of individuals that are more likely to
successfully adapt to their new country, and thus assimilate faster. In many ways the Canadian
experience with the point system is particularly interesting, as it represents the evolution from a
short run migration model, focused on contingent labour market shortages, to a long run framework
in which the focus is on adaptability of the immigrants to the destination country.
Australia
Most immigrants to Australia today enter the country under one of three categories: skilled workers,
family reunification or humanitarian. Out of the 180,000 permanent additions of migrants occurred
in 2005-06, over 50 per cent was made up by skilled workers, while only 25 per cent has received a
visa based on the family reunification program, and less than 10 per cent have been accepted as
humanitarian applicants (Linacre 2007). By comparison, in 1985 well over 50 per cent of new
permanent settlers entered through the family reunification program, and just over 10 per cent
entered through the skilled worker program.
This important change is the result of a series of initiatives introduced throughout the 1980s, which
culminated in the recommendations formulated by a government’s appointed Committee to advise
on Australia’s immigration policies in 1988, to set up a “points test”, which was first applied in 1989.
Under this regime, every year the Minister for Immigration not only sets the overall target for
permanent settlers to be admitted in the country, but it also fixes the numbers of individuals to be
allowed in for the purpose of family reunification and as skilled workers. Whenever a category
requires a “points test”, the government also announces the “pass mark”, i.e. the minimum
threshold which needs to be met for an applicant to be admitted, which is a powerful tool to control
the actual inflows.
Skilled immigrants can enter either through a “general skilled migration” scheme, or through an
“employer nominated” scheme. Under the former, individuals can apply provided that their
occupation is listed in the Skilled Occupation List (SOL) and the relevant assessing authority has
certified that they possess the required qualifications. Under the latter, an employer must have
nominated the immigrant to fill a position in an occupation that appears in the Employer Nomination
Scheme Occupation List (ENSOL). While the SOL and the ENSOL largely overlap, there are some
9
differences and, furthermore, the “pass mark” is generally lower for “employer nominated” migrants
than for “general skilled migrants”.
Table 2.2
The Australian skilled migration system, 2009
Maximum number of points
Occupation
Age
English language proficiency
Specific employment
Australian employment
Australian qualifications
Occupation in demand
Designated language
Studying and living in regional Australia
Partners skill
State/territory government nomination
General skilled immigration pass mark
Employer Nominated Scheme pass mark
60
30
25
10
10
25
20
5
5
5
25
120
100
Source: Australian Government (http://www.immi.gov.au/skilled/general-skilled-migration)
The lists are updated at high frequency, based on labour market conditions. As of 2008, health
professionals appear at the top, together with IT professionals (Commonwealth of Australia 2008).
Table 2.2 provides information on the allocation of points in 2009, together with the “pass mark” for
both the general skilled immigration scheme and the employer sponsored one. As it can be
immediately observed, the current Australian point system differs fundamentally from the Canadian
one in that it is largely driven by short term needs of the local labour market. Occupation specific
features (occupation, specific employment, Australian employment, occupation in demand) account
indeed for up to 100 points, whereas the “pass mark” for “general skilled” and “employer
nominated” immigration are 120 and 100, respectively.
New Zealand
The “point system” for the general skill category of immigrants has been introduced in New Zealand
in 1991 and, up until 2003, it has incurred in only limited changes (Table 2.3). The basic system has
been characterized by a “pass rate” whereby applicants satisfying the minimum point requirement
are allowed in the country. The main innovation in the early phase of the program – in 1995 – has
been a change in focus from qualifications as a sign of employability to a job offer, together with the
introduction of additional points for settlement factors.
A major innovation was introduced in 2003. As a result, the attribution of points to the various
criteria has changed substantially, and much greater emphasis is now posed on short term
occupation characteristics than on general educational qualification.
Importantly, initial applications (“expression of interest” in the current jargon) meeting the minimum
“pass rate” of 100 points will not automatically entitle the applicant to admission in the country, but
rather into a “pool”, in which they will remain for up to 6 months. Those ranking at the top of the
pool (in terms of points obtained) will then be “invited to apply” for residence, at a biweekly
frequency. Thus, the New Zealand system has evolved into a model where entry is granted on the
10
basis of very short-term labour market considerations, and little attention is paid to the long term
consequences of immigration policy.
Table 2.3
The New Zealand point system
Skilled employment (current NZ/offer NZ)
SE Bonus points
Relevant work experience
RWE Bonus points
Qualifications
Q Bonus points
Family ties/settlement factors
Age
Total
Pass mark
1994
2001
2009
3
5
10
10
15
12
7
10
43
20-31
9
10
46
24-25
60
35
30
40
55
30
10
30
290
100*
Sources: OECD (2003) and New Zealand Immigration Service (http://www.immigration.govt.nz/)
The United States
The United States remain one of the main destinations for skilled immigrants, even if the country has
not put in place a point system to select prospective foreign workers based on their qualifications.
Currently, the main instrument to admit skilled workers is represented by the H1B visa category,
which was introduced in the 1990 Immigration Act and is reserved for workers to be employed in a
“specialty occupation”, defined as requiring theoretical and practical application of a body of highly
specialized knowledge in a field. Under this program, 65,000 visas are issued annually,3 and the
minimum skill requirement is a bachelor’s degree. Visa requests need to be sponsored by the
prospective employer, and a Labor Condition Application needs to be submitted to insure that the
foreign workers do not displace or adversely affect wages or working conditions in the US.
The H1B visa does not fall under the “immigrant visa” category, i.e. it does not automatically result in
the conferral of a permanent resident status. At the same time, it is one of the few visa categories
allowing a worker to apply for permanent residency. The H1B visa category is a typical example of an
“employer driven” system to promote skilled immigration. Beyond the H1B visa, there are other visa
programs for highly skilled workers, reserved to intra-company transferees (L1), internationally
recognized athletes and entertainers (P), workers of extraordinary ability (O) etc. (Facchini, Mayda
and Mishra 2008).
Importantly, as it has been suggested by Beach et al. (2006), the absence of a specifically designed
point based system might play an important role in explaining the comparatively lower skill level of
immigrants in the US than in other traditional immigration countries like Canada or Australia (see
Annex Table A 2.1, column 13). Consequently, Chiswick (1983) and later Borjas (1999) and
Huntington (2004) have proposed introducing a point system to replace the current US immigration
policy based on family-reunification.
The actual number has changed several times at the end of the nineties. For more information on this, see Congressional
Research Service (2006).
3
11
2.3
Skill-selective immigration policies at the EU level
Historically, the immigration policies of the EU have been characterised by a fundamental dualism.
On the one hand, internal labour mobility is one of the fundamental freedoms of the Common
Market and, hence subject to EU level jurisdiction, while the immigration of third-country nationals
remains in the national policy domain of each individual EU member. The free movement of workers
within the Common Market is by definition not skill selective. However, the EU endorsed the mobility
of high-skilled individuals within the Common Market through its education policies an in particular
the harmonisation of study programmes under the umbrella of the “Bologna process” and the
mutual recognition of university degrees.
Regarding third-country nationals, most EU member states have mainly recruited manual workers
from abroad during the 1960s and early 1970s, and then pursued heavily restrictive immigration
policies after the first oil price shock of 1973 (Zimmermann, 1995). Concerns that the EU may fall
back in the contest for high skilled workers and that labour shortages will become widespread in the
course of demographic change have meanwhile triggered several new policy initiatives at the EU
level. At the 1999 Tampere (Finland) meeting of the European Council, the leaders of the EU set out
the elements for a common EU immigration policy. Attracting highly skilled individuals is an explicit
goal of these policies. As a consequence of this, the EU has started to interfere in immigration
policies vis-à-vis third-country citizens, although their admission in a member country continues to
remain in the domain of national policies. Several initiatives of the European Commission, namely
the failed proposal for a Council Directive on the conditions of entry and residence of third-country
nationals (EC 2001), the Green Paper on an EU approach to managed immigration (EC 2004) and the
Policy Plan on Legal Migration (EC 2005) outlined a strategy for attracting particularly skilled and
highly skilled migrants according to the economic needs of the EU and its member states. For the
selection of highly skilled immigrants, two initiatives are particularly relevant: Two directives of the
European Council regulate the admission of students (European Council 2004) and researchers
(European Council 2005) from third-countries. Both directives had to be adopted by national law in
2007 and have eased the entry of third-country nationals as students and researchers to the EU, and
facilitate their mobility across EU member states once they have been admitted by one member
country.
The EU blue card initiative
The second important initiative of the European Commission, the directive proposal COM(2007) 637
on “the conditions of entry and residence of third country nationals for the purpose of highly
qualified employment” represents the EU wide attempt at drafting a common policy for highly skilled
foreign migrants, leading to the issuance of a temporary work permit (the so-called “blue card”).
While the introduction of a point based system was explicitly considered (option C in the directory
draft), unless the points are set at the EU level, immigrants would continue to face very different
admission criteria. Setting the points at the EU level has been ruled out though, as this would violate
the subsidiarity principle.
The current proposal is limited to a common definition of the criteria to qualify for admission under
the highly skilled migration program (the existence of a work contract, professional qualifications,
and a salary above a minimum level set at the national level), and it contains a provision limiting the
access of the “blue card” holder to the receiving country’s labour market for the first two years after
arrival. More freedom of movement is contemplated after two years of residence, including the
possibility for the migrant to gain access to a second member country’s labour market. In the
directive proposal, ample margins of discretion are still retained by each member country. In
particular no coordination is envisaged as far as the actual migration quotas are concerned.
12
2.4
Skill-selective immigration policies in a group of EU member countries
Although the competencies of the EU in the area of immigration policy have steadily increased over
the past ten years, the core decisions continue to be made by national governments. Thus, to assess
the actual selectivity of immigration policy in Europe it is necessary to look at the policy changes at
the national level.
United Kingdom
The UK government published a document in 2006 (Home Office 2006), which contained the blue
print for an important overhaul of the country’s immigration policy framework. The document laid
out a new strategy, which identifies five different categories of immigrants to be admitted under a
point based system, the first two of which focus on highly skilled immigrants. Under the Tier 1
program, implemented in early 2008, highly skilled workers can apply for an entry permit, without
the need of an existing job offer. The so-called Tier 2 scheme is instead reserved to medium and
highly skilled workers, which have already received a job offer. Table 2.4 below summarizes the
current allocation of points for the Tier 1 program.
Table 2.4
The UK PBS (Tier 1)
Maximum points
Qualifications/academic
Age
Language ability
Maintenance
Recent earnings
UK labour experience
Total
30 - 50
5 - 20
10
10
5 - 45
5
140
Pass rate
95
Source: UK Border Agency (http://www.ukba.homeoffice.gov.uk)
The requirements in place are in many ways more stringent than in other points-based systems and,
if they are met, they give the applicant only a temporary admission in the country. 95 points are
required, out of which 10 must be acquired by passing a language test and another 10 are to be
obtained by the applicant proving to have enough funds available to support himself. Another 75
points need then to be acquired from four other categories: age, qualifications/academic
achievements, recent earnings and UK labour experience. One interesting and important difference
between the UK point system and the other systems which we have reviewed so far consists on its
reliance upon previous earnings as a measure of expected labour market performance of the
perspective migrant. Importantly, previous earnings are to be assessed using rates prevailing in the
country of emigration (and this will surely pose important challenges when the system will be fully
implemented).
Germany
Germany has stopped - together with many EU countries - the recruitment of third-country nationals
following the first oil price shock in 1973. As a result, family reunification, humanitarian immigration
and the immigration of ethnic Germans (so-called “Spätaussiedler”) became the main channels of
13
entry. However, immigrant workers can be admitted if employers are able to prove that the position
cannot be filled with a German or another EU citizen.
Against the background of low skill levels in the immigrant population in Germany and of an
increasing shortage of highly skilled labour, the Schröder government launched a reform with the
immigration act in 2005, which explicitly targeted highly skilled workers. The 2005 immigration act
distinguishes between two groups which are perceived as highly skilled: The first group comprises
scientists and teaching personnel with excellent qualifications (i.e. university professors), outstanding
sportsmen and artists. The second group refers to managers and specialists whose income is at least
twice the ceiling of health insurance in Germany, i.e. it is above EURO 85,000 p.a. as of 2008. Both
groups are entitled to permanent residence permits according to the immigration act. Moreover, a
residence permit is granted to individuals which are self-employed if they invest EURO 500,000 and
employ at least five persons.
In quantitative terms, this reform was a failure: Only 466 residence permits have been granted for
the two groups of highly skilled individuals in 2007, and only 115 of those have been granted to new
arrivals. Consequently, the immigration act was amended in 2008. The key change was to reduce the
income threshold for desirable occupational profiles to 65,000 Euros p.a., which is still well above the
average income level of individuals with a university degree, particularly in the age groups below 40.
Altogether, the reforms of the immigration legislation in Germany did not fundamentally change the
conditions for the entry of highly skilled individuals.
Italy
Italy has a long history as a source of emigrants, and until 1986 immigration policy has been based on
public order legislation dating back to 1931, which left many issues to administrative discretion. In
1990 the so called “Martelli” law introduced a provision for a quota system to limit the inflow of
immigrant workers from outside the EU, which did not target highly skilled workers. Actual quotas for
immigration workers were enacted only starting in 1995, setting flows at 20-30 thousand units per
year (OECD 2005). These figures were subsequently raised to 79,500 units in 2003 and to 170,000 in
2006. By 2008 the quota has been reduced to 150,000 units, and as in the recent past legislation
setting the actual limits has been introduced only very late in the fiscal year, on December 3, 2008.
The quota system is mainly employer driven, and a labour market test exists requiring the employer
to list the job vacancy through the Public Employment Service. This provision is pro-forma though, as
no application has ever been rejected due to a successful referral by the Public Employment System
(Chaloff and Lamaitre 2009). Work visas are initially for a limited period (2 years in the presence of an
open ended contract), but they can be renewed and converted into a residence permit after five
years of legal stay.
According to the 2008 legislation two broad categories of non-seasonal immigrant workers can be
identified. The first is represented by citizens of countries which already have or are about to sign an
agreement on immigration with the Italian government. Up to 44,600 workers from these countries
will be admitted in Italy, and they will face no restriction as far as their sector of employment is
concerned. The second category is represented by citizens of other countries with which Italy does
not have an agreement on immigration. Up to 105,400 foreigners will be admitted under this
grouping, but they will be allowed to work only as domestic helpers or care workers.
Thus, as of today, Italy does not have a structured policy to attract highly skilled workers from
abroad.
14
Spain
Like Italy, Spain has been for most of the past century a country of emigration (OECD 2003a). The
first piece of legislation introduced to regulate foreign immigrant flows, the Foreigners Law of 1985,
was the result of Spain’s need to adequate its policies to those of the EC bodies, rather than being a
policy response to growing immigration pressure. According to this framework – known as the
“general regime” –, the entry of a labour migrant was based on an employer request and the
admission was left essentially to administrative discretion (Bruquteas-Callejo et al. 2008). A key
discriminant was a labour market test whose criteria were only vaguely defined.
To create a new channel of legal entry, in 1993 an immigration quota was introduced for which no
individual labour market test had to be performed. The latter was replaced by the government’s
identification, on a yearly basis, of those sectors/occupations with labour shortages and by its
determination of the overall number of work permits to be issued. Between 2000 and 2004, the
Aznar government tried to make the quota system the only viable avenue of entry for migrant
workers, by substantially tightening up the requirements for the “general regime”. Furthermore, to
better assess the labour market needs the reform introduced by the Aznar government called for
employers associations, labour unions and regional governments to be involved both in the
determination of the overall number of foreign workers to be admitted, as well as in the
identification of those sectors/occupations where a labour shortage existed. The overall quota size
was kept very low though, and fluctuated between 20-40 thousand permits per year. In 2005 the
return of the Socialist party to power marked the reintroduction of the general regime, with the
purpose of allowing more flexibility for employers.
While the quota system had the potential of being used as a tool to introduce selective immigration
policies, its actual effects have been rather limited. At least during its early implementation, it has
been mainly used as a tool to regularize illegal immigrants (Bruquteas-Callejo et al. 2008). More
generally, its purpose has been defied by the sheer scale of the illegal flows. After 1985 Spain has
carried out six major regularisation processes (1986, 1991, 1996, 2000, 2001, 2005), and – as it has
been estimated by Dolado (2007) – 98 per cent of those foreigners having obtained a residence
permit in Spain did so from illegal immigration. In other words, the Spanish government policies
towards legal migrants have only played a very limited role in shaping the current composition of the
immigrant population, and thus the limited efforts put in place to develop a selective migration
policy have not been particularly effective.
Altogether, some EU member states have started to reform their immigration policies both to
increase the number of foreign workers and to attract more highly skilled workers. Nevertheless,
these reforms have been very cautious and can only be regarded as incremental steps, rather than
major shifts.
2.5
Policies to attract high skilled immigrants: evidence based on UN data
The patterns we have identified in our analysis so far are confirmed when we look at recent,
comprehensive cross-country data. Since 1974 the United Nations Department of Economic and
Social Affairs carries out a survey of government officials to elicit their views on the overall level of
immigration and to document their policies towards immigration. In 2007, a new question has been
introduced in the survey, which focuses specifically on governments’ policies towards highly skilled
workers. Table 2.5 reports summary statistics for this variable, by each country’s income level.
Officials in only five countries (Bhutan, Botswana, Jordan, Saudi Arabia and the United Arab Emirates)
report to have policies in place to reduce the arrival of highly skilled workers. On the other hand, 25
per cent of governments declare to have policies aimed at increasing the number of skilled migrants.
In the majority of countries (59 per cent of the 143 countries in the sample), the government’s goal is
15
to maintain unchanged the level of high-skilled migration. Finally, in the remaining 18 countries,
governments do not intervene with regard to highly skilled workers (or at least officials interviewed
do not know whether any policies are in place). What these summary statistics show is a strong
status quo bias. While some countries are actively engaged in increasing the flow of skilled migrants
and very few are trying to reduce their number, most governments’ policies are aimed at maintaining
constant the skilled migration flow. In other words, while the competition for talents has already
begun, it seems to be just at its early phases.
Table 2.5
Government’s policy on highly skilled immigrants by income group,
UN survey results 2007
Policy on highly skilled workers
country group
by income level
high income
upper middle income
lower middle income
lower income
Total
Lower
Maintain
Raise
No interv
Total
2
4.44
1
2.78
2
5.41
0
0
18
40
24
66.67
29
78.38
13
52
20
44.44
9
25
4
10.81
3
12
5
11.11
2
5.56
2
5.41
9
36
45
100
36
100
37
100
25
100
5
3.5
84
58.74
36
25.17
18
12.59
143
100
The table presents frequencies and row percentages by income, size of migration inflow and size of migration rate.
Policy on highly skilled workers is the government's policy on the migration of highly skilled workers. The possible
values of Policy on highly skilled workers are: The government has policies in place to lower, maintain, raise the
migration of highly skilled workers; the government does not intervene with regard to the migration of highly skilled
workers (or It is not known whether the government intervenes...). Data for migration is for 2005. The migration rate
is defined as the migration inflow divided by the population of the destination country.
Source: United Nations.
Table 2.5 shows that richer countries are more likely to have policies in place to increase the
migration of highly skilled workers. In particular, 44 per cent of high-income countries have active
skilled-migration policies, as opposed to 25 per cent of upper-middle income countries and 11 per
cent and 12 per cent of, respectively, lower-middle income and lower-income countries.
2.6
Conclusions
Altogether, we can conclude that immigration policies are characterized by a strong status quo bias
and that the battle for talent has just started. Only a few small and medium sized countries
(Australia, Canada, New Zealand) pursue a “immigrant driven” approach to select high skilled
individuals. But even in these countries no more than 40 per cent of the immigrants are selected by
human capital criteria. Still, the likelihood that family reunification will tend to reproduce the skill
structure of selected immigrants will give rise to a “multiplier” effect, through which skill selective
policies are likely to carry long lasting effects.
The main destination of immigrants in the world, the United States, regulates a part of its
immigration by an “employer driven” approach, i.e. by specific visas for occupations, which are in
16
short supply (H1B visas). However, the absence of a point system and the relatively small share of
immigrants entering on an H1B visa may explain why the average skill level of the immigrant
population in the US is well below that of Australia, Canada and New Zealand.
In Europe, most countries have not pursued a skill-selective immigration policy throughout their
history. During the last decade though we have observed incremental policy shifts both at the EU
level and at that of the member states. At the former, several action plans and the introduction of a
“blue card” initiative can be considered as attempts to attract high skilled individuals from third
countries and to facilitate the mobility of third-country nationals once they have been admitted to an
EU member state. Nevertheless, the scope of these efforts is limited, given that immigration policies
vis-à-vis third-country nationals continue to remain by and large in the national domain. At the
national level, several countries such as the UK and Germany have launched reforms of their
immigration policies aiming at attracting highly skilled individuals. While they are important steps,
they fall far short from being radical policy shifts.
17
3
Stylised Facts and Trends4
The objective of this chapter is to provide an overview on high skilled immigration into the OECD
countries. Recent progress in the collection of data on the educational attainment of migrants
facilitates the analysis of the brain gain in receiving countries. Starting with Carrington and
Detragiache (1998), Docquier and Marfouk (2006), Beine, Docquier and Rapoport (2007), Dumont
and Lemaitre (2005) and Defoort (2009) have meanwhile compiled comprehensive data sets from
population censuses on the educational level of immigrants in the OECD by country of origin, which
enables us to sketch the skill structure of the foreign-born population in the developed world. These
data sets can be linked to the skill composition of the native population in the sending countries,
which in turn allows describing the skill selectivity of migration both with respect to the population in
the receiving and in the sending countries (Section 3.1). Moreover, we can analyse the development
of the pool of high skilled labour in developed and less developed countries which forms the battle
field for the talent contest (Section 3.2).
Although the data sets described above enable us to draw a comprehensive picture on the mobility
of high skilled individuals, it has certain limitations which hamper the descriptive analysis in one way
or another. One drawback is that the definition of high skilled labour refers to tertiary educational
attainment only, which is a rather broad category covering different levels of education. We
therefore use additional information from census data on individuals with PhD degrees and
completed university degrees in order to capture the top of the skill distribution for a selected
number of countries. Moreover, we analyze how many migrants are represented in top management
and top professional occupations in receiving countries in order to get an impression whether the
battle for talent affects the recruitment of elites in the private and public sector (Section 3.3).
The admission of foreign students has become a more and more important gateway for high skilled
immigration. Many countries have eased the access of foreign students to the university system and
enhanced opportunities for working in host countries after finalisation of the studies. In the EU, the
Bologna process – among other measures – was specifically designed to encourage the cross-border
mobility of students. We therefore examine whether and to which extent the international mobility
of students has increased at different levels of tertiary education (Section 3.4).
Not all human capital acquired in the sending or receiving countries can be transferred into the host
country labour markets. Analyzing the phenomenon of the ‘brain waste’ or assimilation of highskilled foreigners is beyond the scope of this study. Instead we provide some data from the United
States and Canada on the wage levels of immigrants and natives at the top of the skill distribution as
a first indicator (Section 3.5). Section 3.6 concludes.
3.1
High skilled immigrants in the OECD
3.1.1
Data limitations
The analysis in this section is based on the data set compiled by Beine, Docquier and Rapoport
(2007), which is an updated version of the Docquier and Marfouk (2006) data set. Since the data set
is based on decennial census data, the latest information available refers to the year 2001 in most
countries and is thus a bit dated. Nevertheless, it allows drawing a first picture on the immigration of
individuals with tertiary education into the OECD.
4
We thank Paola Monti, Valentina Jung, Alexander Raatz, Markus Wilhelm and Michael Zibrowius for the
provision of data and excellent research assistance.
18
The limitations of these data sets are discussed in some detail in Box 1. One important caveat is that
they refer to the stock of immigrants which is born in another country, but provide no information
whether and to which extent the education has been acquired in home or host countries. In this
sense, it is not a measure of the brain gain, but of the educational level of the immigrant population.
Many high skilled immigrants have acquired a part of their education in their home countries and
another part, for example a university or PhD degree, in the host countries. Note that this can
nevertheless create gains for the receiving countries, since the integration in the university systems
of the host countries requires mastering the native language there and helps to acquire the country
specific human capital needed for integration into the labour market later (see Section 2.4).
Box 2.1
Data sources and problems of measuring the brain gain
There exist meanwhile several data sets on the educational attainment of immigrants in all or
selected OECD countries (Carrington and Detriagache, 1998; Docquier and Marfouk, 2005; 2006;
Docquier, Lowell, Marfouk, 2007; Beine, Docquier, Rapoport, 2007; Defoort, 2009). These data sets
usually distinguish the immigrant population of age 25 and more by its educational attainment
(tertiary, secondary, primary and less) and country of origin, which allows approximating both the
brain gain for host and the brain drain for source countries. The host country information is derived
from census data, which usually takes place in every decade. While Docquier and Marfouk (2005;
2006), Docquier, Lowell and Marfouk (2007) and Beine, Docquier and Rapoport (2007) refer to the
1990 and 2000 census, the Defoort (2009) data set provides information from 1975 to 2000 in five
year intervals, but for six OECD receiving countries only. If census information is missing, information
from labour force surveys (LFS) has been used although the source country information is less
reliable here. The information on skill levels of the population in sending countries has been taken
from the Barro and Lee (1993; 2000) data set, which, however, does not cover all source countries. In
case of missing countries, the skill distribution has been extrapolated from neighbouring countries
with the closest human development index. Wherever possible, these data sets use the concept of
country of birth for defining immigrants. However, in few cases – the most notable one is Germany –
this information is not available, such that the citizenship has been used there. See Docquier and
Marfouk (2005) and Defoort (2009) for detailed descriptions of the methodologies.
Altogether, these data sets provide rich and comprehensive information on the skill structure of
immigrants in OECD countries which can be related to the skill structure of the source country
population, which enable us to derive also information on the pool of potential brains. However,
several limitations apply: First, the skill levels of the immigrant population provide no information
whether this skill level has been acquired in the home or the host country. Beine, Docquier and
Rapoport (2007) try to circumvent this problem by providing information on the age of entry, which
demonstrates that recent arrivals have similar or high education levels compared to those which
reside already for longer periods in the host country. Nevertheless, an accurate measure for the
human capital acquired through immigration cannot be derived from macro data – this can only be
taken from individual survey data (see Rosenzweig, 2005, for a discussion). Second, the distinction
between tertiary, secondary and primary education levels is rather rough. In particular, the category
tertiary education includes individuals with practical education degrees, university degrees as well as
those on the top of the skill distribution (see UNESCO, 1997, for a description of the classification).
Moreover, since educational systems differ largely across countries, the information is not entirely
comparable. We therefore provide in the later sections of this chapter also detailed information on
the top of the skill distribution. Third, human capital acquired in other countries may be not entirely
transferable. The issue of the so-called ‘brain waste’ will therefore be discussed at the end of this
chapter. Fourth and finally, these data refer to the stock of foreign residents and provide thus no
information on return and circular migration, which is however particularly important in the case of
high skilled immigration. Again, this information can only be derived from micro data sets which
follow migrants in host and home countries over time.
19
3.1.2
The stock of high-skilled immigrants
Based on this data set, the stock of high skilled immigrants in the OECD can be estimated at about 20
million individuals in 2000/2001, where we define high skilled by tertiary educational attainment (i.e.
academic of professional diploma beyond high school degrees). More than 50 per cent of those
reside in the United States, another 22 per cent in Australia, Canada and New Zealand, i.e. the
traditional immigration countries which pursue highly selective immigration policies. About 24 per
cent reside in the EU and other Western European countries, most of those in the United Kingdom (6
per cent), Germany (5 per cent) and France (3 per cent). The Southern European countries attract
only moderate shares (Spain: 1.4 per cent, Italy: 0.7 per cent). Altogether, the English speaking
countries attract about 80 per cent of immigrants with tertiary educational attainment in the OECD
(Table 3.1).
Table 3.1
Immigrants with tertiary education in OECD countries, 2001
stock of high-skilled immigrants1
(self-)selection indicators
in per cent of
all OECD-30 host country host country
high-skilled high-skilled
immigrant
persons immigrants
population
population
skilled share of high-skilled in
immigrant population
relative to share of high-skilled in
host population2
home population3
Australia
Austria
Belgium
Canada
Czech Republic
Denmark
Finland
France
Germany
Greece
Hungary
Iceland
Ireland
Italy
Japan
Korea
Luxembourg
Mexico
Netherlands
Norway
New Zealand
Poland
Portugal
Slovakia
Spain
Sweden
Switzerland
Turkey
United Kingdom
United States
1,638,052
103,211
99,770
2,724,095
46,988
39,635
21,511
608,985
1,020,755
64,784
12,545
6,560
115,721
142,418
267,370
45,971
21,772
81,954
393,891
63,904
217,854
103,496
27,488
5,913
294,040
195,869
280,075
148,689
1,233,421
10,400,000
8.02
0.51
0.49
13.34
0.23
0.19
0.11
2.98
5.00
0.32
0.06
0.03
0.57
0.70
1.31
0.23
0.11
0.40
1.93
0.31
1.07
0.51
0.13
0.03
1.44
0.96
1.37
0.73
6.04
50.91
43.76
11.77
7.05
24.83
na
4.91
2.59
8.18
9.67
6.17
1.50
24.46
25.59
2.27
1.21
0.88
na
1.56
16.16
8.46
21.36
3.80
3.08
na
6.38
13.66
33.98
5.18
15.93
11.27
40.27
12.65
18.34
58.77
11.45
17.29
23.77
16.42
21.77
15.00
11.61
31.06
41.15
15.44
28.05
38.13
21.72
44.87
21.97
28.69
40.89
13.96
18.56
15.17
18.54
25.69
18.60
21.49
34.95
42.62
1.35
0.84
0.93
1.11
na
0.80
1.02
0.89
1.24
1.10
0.97
2.00
2.12
1.05
1.17
1.48
na
3.97
1.00
1.16
0.98
1.26
1.47
na
1.14
1.11
1.16
2.53
1.83
0.85
4.47
0.96
1.90
8.24
0.85
1.77
1.99
2.62
2.35
1.11
0.36
2.76
3.00
1.65
3.87
4.49
1.60
2.62
2.55
3.07
4.33
1.10
4.37
0.90
1.53
2.53
1.52
1.38
7.08
5.74
OECD-30
20,426,737
100.00
10.45
35.06
1.31
3.37
1) Share of high skilled individuals, i.e. individuals with attained tertiary education (ISCED 5A, 5B, 6) in 25+ aged
population.-- 2) Ratio of share of high skilled individuls in immigrant population to the share of high skilled individuals
in host country population.-- 3) Ratio of the share of high skilled individuals in immigrant population to the share high
skilled individuals in home country population weighted by the number of migrants from the respective home
country.
Sources: Data sources Beine et al. (2007), Defoort (2009); own calculations of shares and indicators.
20
Not surprisingly, the share of immigrants in the population with tertiary educational attainment is
extremely high in those countries which pursue a highly skill-selective immigration policy: The share
of foreign-born individuals in the population with tertiary education amounts to 43 per cent in
Australia, 24 per cent in Canada and 21 per cent in New Zealand. However, there are also some other
destinations which achieve large immigrant shares in their high skilled population: Switzerland (35
per cent), Iceland (25 per cent) and Ireland (25 per cent). In the US the share is at about 11 per cent
only moderate, which can be traced back inter alia to the high share of individuals with tertiary
educational attainment among the native population there. In Europe, the share of immigrants in the
high skilled population is, beyond Iceland, Ireland, and Switzerland, relatively large in the UK (16 per
cent), Sweden (14 per cent) and Austria (12 per cent), while Italy and the other Southern European
countries obtain relatively low shares.
foreign-born population (25+) with tertiary education attainment
(persons)
Figure 3.1
Foreign-born population with tertiary education attainment
in selected destination countries, 1975-2000
10,000,000
9,000,000
8,000,000
USA
7,000,000
Canada
6,000,000
Australia
5,000,000
UK
4,000,000
Germany
3,000,000
France
2,000,000
1,000,000
0
1975
1980
1985
1990
1995
2000
Sources: Data source Defoort (2009); own calculations.
The data set compiled by Defoort (2009) allows analysing the long-term trends in high skilled
migration for selected OECD countries. Note that these countries cover more than 85 per cent of the
high skilled immigrant population in the OECD.5 As Figure 3.1 shows, the stock of highly skilled
immigrants has increased in the US from 1.8 million in 1975 to 9 million in 2000 or by a factor of 5,
while the increase has been in the other traditional immigration countries (Canada, Australia) only
relatively moderate, i.e. the stock of high skilled immigrants has grown there only by a factor of 2.
The European destinations played only a negligible role in the 1970s, but the stock of high skilled has
grown by a factor of 5 there until the 2000s.
3.1.3
Are immigrants favourably skill selected?
As a first hint to the skill bias in the immigrant population we have computed the share of high skilled
individuals among the immigrant population (see the third column of Table 1). Again, this share is
Note that the Defoort (2009) data set is due to different data sources and methodologies not entirely comparable to the
Docquier, Beine and Rapoport (2007) data set employed in Table 1.
5
21
extremely high in destinations which pursue a highly skill selective immigration policy (Australia, New
Zealand, and Canada) or at least some skill selective immigration policies (US, Ireland and UK). Some
of the relatively poor destination countries in the OECD (Mexico, Korea) also achieve relatively high
shares of high skilled individuals in the immigrant population, while those shares are rather low in
the Southern European countries (Italy, Spain, Greece, and Portugal).
For describing the skill selectivity of the immigrant workforce in some further detail, we present two
selectivity indicators here. The first indicator divides the share of high skilled individuals in the
immigrant population by the share of the high skilled in the native population, i.e.
I1 =
smh
,
snh
where smh is the share of high skilled individuals in the immigrant 25+ population of the host country,
and snh the share of high skilled individuals in the native 25+ population there. This indicator provides
us a clue whether immigrants are positively selected on observable skills with respect to the host
country population.
The second indicator divides the share of the high skilled in the immigrant population by the share of
the high skilled in the sending country population and weights these shares by the share of a sending
country in the immigrant population of a certain destination, i.e.
I2 =
∑m
i=N
i =1
i
smh ,i
snh,i
,
where smh ,i is the share of high skilled individuals in the immigrant 25+ population from sending
country i, snh,i the share of high skilled individuals in the 25+ population of sending country i and mi
the share of immigrants from sending country i in the total immigrant population of the host country.
Finally, i = 1, 2 … N denotes the sending country index. Thus, the second indicator measures the skill
bias of the immigrant population relative to the home country population. In both cases an index
above 1 indicates that the immigrant population is positively selected relative to the host country or
the home country population, while an index below 1 indicates a negative selection bias.
As the last two columns of Table 1 show, we find that the share of the high skilled among the
immigrant population is higher than that of the native population of the OECD in the aggregate and
much higher than that of the native population in the sending countries. However, aggregates may
hide interesting differences across countries. We observe a positive selection bias relative to the
home country population in some but not all countries which pursue a highly selective immigration
policy (Australia, Canada), in countries which have relatively recently attracted large numbers of
immigrants (Ireland, Iceland, UK) and in some countries where the share of the high skilled is
relatively low in the native population (e.g. Germany). A negative selection bias relative to the home
population is found in some continental European countries (Austria, Belgium, France), and,
interestingly enough, in the US. In the latter case this can be traced back inter alia to the high share
of high skilled individuals in the native population.
The last column of Table 3.1 demonstrates a strong skill selection of immigrants in the OECD relative
to the home country population. On average, the share of high skilled individuals in the immigrant
population of the OECD exceeds that in the home country population by a factor of 3.4. The selection
bias is particularly high in Canada (8.2), the UK (7.1), the US (5.7) and Australia (4.5), while it is low in
some continental European countries such as Austria, Belgium, and Germany.
22
3.1.4
Is there a gender bias among high skilled immigrants?
The skill composition of the immigrant population in the OECD is extremely balanced by gender.
Among the 20.4 million immigrants with tertiary educational attainment, almost 50 per cent are
females. This holds also true for most destination countries in the OECD. Substantially larger shares
of males in the high skilled immigration population can be observed in Germany, France, Austria,
Belgium and Mexico, while Italy, Spain, the Netherlands and Japan obtain larger shares of females.
Interestingly enough, the immigrant share is somewhat higher in the high-skilled female population
of the host countries than in the high-skilled male population (Table 3.2).
Table 3.2
Immigrants with tertiary education by gender in OECD countries, 2001
female high-skilled immigrants1
persons
Australia
Austria
Belgium
Canada
Czech Republic
Denmark
Finland
France
Germany
Greece
Hungary
Iceland
Ireland
Italy
Japan
Korea
Luxembourg
Mexico
Netherlands
Norway
New Zealand
Poland
Portugal
Slovakia
Spain
Sweden
Switzerland
Turkey
United Kingdom
United States
OECD-30
in per cent of
high-skilled
immigrant
population in population in
host country host country
male high-skilled immigrants1
persons
in per cent of
high-skilled
immigrant
population in population in
host country host country
807,268
45,628
44,824
1,317,440
19,501
18,449
11,862
283,883
461,713
36,476
6,637
2,582
57,931
78,484
138,012
23,023
10,083
34,732
203,292
32,961
104,916
53,069
15,503
2,496
151,320
101,207
120,581
65,051
619,664
5,197,499
51.49
11.48
6.98
23.17
na
4.32
2.86
7.23
10.13
7.03
1.58
19.65
25.42
2.59
1.49
0.84
na
1.60
20.24
8.64
21.71
3.68
3.15
na
6.40
13.24
44.08
6.88
17.51
10.97
39.13
10.68
17.08
54.35
8.70
15.96
25.76
15.46
21.31
18.17
11.56
29.82
40.95
16.74
27.17
38.14
20.31
38.89
22.41
29.63
37.78
11.96
18.80
12.97
19.10
25.73
15.22
18.77
33.11
41.84
830,784
57,583
54,929
1,406,655
27,487
21,179
9,645
325,102
558,977
28,308
5,905
3,931
57,790
63,883
129,335
22,942
11,661
47,222
190,499
30,935
112,938
50,427
11,985
3,417
142,720
94,650
159,485
83,638
613,666
5,210,730
38.34
12.01
7.14
26.58
na
5.59
2.33
9.24
9.36
5.30
1.41
28.24
25.82
1.96
1.00
0.45
na
1.53
13.36
8.27
21.16
3.94
2.99
na
6.33
14.18
29.22
4.38
14.56
11.62
41.45
14.83
19.52
63.62
14.78
18.64
21.72
17.36
22.16
12.24
11.67
32.44
41.35
14.10
29.06
38.14
23.10
50.58
21.52
27.76
44.28
16.93
18.26
17.32
17.98
25.66
22.36
24.22
37.03
43.64
10,066,087
10.59
33.99
10,368,408
10.07
36.24
1) Share of high skilled individuals, i.e. individuals with attained tertiary education (ISCED 5A, 5B, 6)
in 25+ aged population.-Sources: Data sources Beine et al. (2007); own calculations.
23
3.1.5
Where do high skilled immigrants come from?
Almost two-fifths of the high skilled immigrants in the OECD stem from other high income countries.
Table 3 groups the source countries of high skilled immigrants in the OECD by the income level of the
home countries, and Table 4 by home country regions, using the classifications of the World
Development Indicators of the World Bank (2008).
Table 3.3
Source countries of high skilled immigrants in the OECD by income level, 2001
stock of high-skilled immigrants1
all
home
countries
home country group share by income level2
upper
lower
high
middle
middle
persons
in per cent
low
Australia
Austria
Belgium
Canada
Czech Republic
Denmark
Finland
France
Germany
Greece
Hungary
Iceland
Ireland
Italy
Japan
Korea
Luxembourg
Mexico
Netherlands
Norway
New Zealand
Poland
Portugal
Slovakia
Spain
Sweden
Switzerland
Turkey
United Kingdom
United States
1,638,052
103,211
99,770
2,724,095
46,988
39,635
21,511
608,985
1,020,755
64,784
12,545
6,560
115,721
142,418
267,370
45,971
21,772
81,954
393,891
63,904
217,854
103,496
27,488
5,913
294,040
195,869
280,075
148,689
1,233,421
10,400,000
53.85
46.14
71.72
45.17
63.92
52.98
37.48
39.65
38.72
26.88
64.78
68.95
80.81
38.19
49.67
45.63
86.93
63.75
46.82
61.07
64.54
14.02
45.36
7.14
39.02
43.48
68.51
36.94
46.21
28.67
17.57
37.40
8.58
20.01
18.78
16.14
46.37
14.73
37.05
19.07
35.22
12.37
7.27
21.56
9.80
8.39
6.44
26.44
17.16
12.04
14.33
42.44
25.80
77.41
34.17
25.73
17.42
50.68
14.06
30.29
20.87
15.40
14.23
26.66
14.23
23.92
11.29
32.39
18.10
51.78
0.00
10.19
6.98
34.20
37.39
35.08
4.81
9.24
32.01
18.71
18.03
42.70
22.27
12.68
24.96
25.89
11.00
10.84
19.30
31.11
7.72
1.06
5.46
8.16
3.07
6.96
4.87
13.23
6.14
2.26
0.00
8.49
4.94
6.06
3.14
10.90
1.82
0.58
4.00
8.18
3.10
0.84
6.57
2.78
1.85
4.91
3.08
1.54
20.43
9.93
OECD-30
20,426,737
37.72
25.69
27.40
9.20
1) Share of high skilled individuals, i.e. individuals with attained tertiary education
(ISCED 5A, 5B, 6) in 25+ aged population.-- 2) Income levels of home countries are
classfied by using the income classification of the World Development Indicators.
Sources: Data sources Beine et al. (2007), own calculations.
24
According to this classification, only 9 per cent of the high skilled immigrant population in the OECD
is born in low income countries, 27 per cent in lower middle income countries such as China and
India, 26 per cent in higher middle income countries such as Mexico, Northern Africa and Russia, and
38 per cent from high income countries in the OECD and other high income countries such as the oil
producing countries in the Middle East (Table 3.3).
Beyond the high income countries, the largest sending region for high skilled immigrants is Latin
America and the Caribbean (17 per cent), followed by East Asia and the Pacific (15 per cent) and
Eastern Europe (10 per cent). In contrast, the share of Sub-Saharan Africa is, at 4.6 per cent of all high
skilled immigrants in the OECD, negligible (Table 3.4).
Table 3.4
Source countries of high skilled immigrants in the OECD by region, 2001
stock of high-skilled immigrants
1
home country group share by region
2
high Latin America, Eastern Europe, East Asia, South Middle East, Subsaharan
3
income
Carrebean
Central Asia
Pacific Asia North Africa
Africa Unknown
in per cent of all high skilled immigrants
Australia
Austria
Belgium
Canada
Czech Republic
Denmark
Finland
France
Germany
Greece
Hungary
Iceland
Ireland
Italy
Japan
Korea
Luxembourg
Mexico
Netherlands
Norway
New Zealand
Poland
Portugal
Slovakia
Spain
Sweden
Switzerland
Turkey
United Kingdom
United States
51.95
45.32
71.75
45.22
63.28
52.74
35.89
39.66
39.70
26.89
32.48
68.93
77.95
38.27
49.39
39.97
86.69
63.38
47.25
61.10
63.76
13.51
45.37
5.74
38.22
42.61
64.98
36.56
46.22
28.56
2.17
1.22
2.51
8.97
0.58
2.74
1.53
3.77
3.36
0.76
0.00
2.20
0.41
10.51
11.56
0.00
1.57
30.45
10.04
3.36
0.62
0.00
19.45
0.63
39.65
5.30
4.34
0.00
4.80
27.20
7.00
37.13
5.76
11.45
28.49
16.54
44.22
7.77
30.70
61.32
17.66
22.47
4.18
23.41
0.45
0.00
4.95
2.72
7.94
10.66
2.63
80.86
18.52
69.53
6.36
23.37
12.26
55.95
3.06
7.70
17.11 8.39
2.62 1.30
2.76 1.40
14.99 9.48
2.93 0.54
4.59 4.12
3.19 1.64
5.48 2.66
4.42 4.22
1.26 0.88
0.00 0.00
2.00 1.33
3.84 3.18
6.28 3.66
33.60 3.58
38.51 9.12
1.42 0.38
1.08 0.44
22.60 2.10
6.72 5.98
12.07 11.26
0.93 0.00
0.91 0.93
1.71 0.63
1.54 0.65
3.33 2.51
2.73 1.77
0.28 0.42
4.44 17.29
19.32 8.85
OECD-30
37.49
17.11
10.27
15.21
8.17
4.41
9.45
8.87
5.81
2.18
14.74
5.30
28.70
15.46
6.88
0.00
1.17
1.16
12.38
0.43
0.00
2.70
1.14
6.85
7.28
1.57
1.03
1.06
1.41
9.68
17.64
5.72
4.46
4.95
4.49
4.68
0.85
6.91
4.09
0.89
3.81
3.67
11.95
2.13
1.94
0.00
1.88
5.75
5.38
0.43
0.00
1.98
0.21
3.22
4.85
6.80
0.00
13.77
0.64
1.85
3.08
2.56
0.00
19.23
3.29
4.30
2.11
0.04
0.00
1.11
0.70
4.57
0.02
0.00
0.07
49.85
0.03
3.54
0.11
0.57
12.40
0.31
0.58
0.01
0.05
1.29
3.67
0.00
19.71
2.05
2.16
5.63
2.33
0.00
0.60
6.19
4.62
0.94
1) Share of high skilled individuals, i.e. individuals with attained tertiary education (ISCED 5A, 5B, 6) in 25+ aged
population.-- 2) Regions of home countries are classified by using the definitions of the World Development Indicators
(WDI).-- 3) High income regions comprise high income OECD and other high income countries, e.g. Gulf countries.
Sources: Beine et al. (2007); own calculations.
During the last four decades, the share of high income countries as a source of high skilled
immigrants has substantially declined in the six main receiving countries of the OECD: While twothirds of the high skilled immigrants in Australia, Canada, France, Germany, the US and the UK were
born in high income countries in 1975, this share had declined to less than 40 per cent by 2000. At
the same time, the share of the low income countries has increased from 9 to 17 per cent, and that
25
of the middle income countries from 28 per cent to 44 per cent in this six destination countries (see
Figure 2). The stock of high skilled immigrants from lower middle income countries in South and East
Asia has particularly surged during the last decade.
Figure 3.2
Share of source countries in high skilled immigrant stock by income level,
1975-2000
share of source country group in stock of high skilled immigrants
70.00
60.00
50.00
high income countries
40.00
upper-middle income coountries
lower-middle income countries
30.00
low income countries
20.00
10.00
0.00
1975
1980
1985
1990
1995
2000
Sources: Data source Defoort (2009), own calculations.
3.1.6
The “battle for brains” across OECD countries: who wins, who loses?
The OECD countries are important destinations and senders for high skilled immigrants at the same
time. Table 5 calculates both the high skilled immigrant population which each country receives from
other OECD countries and the high skilled emigrant population from this country which lives in
another OECD country. Interestingly enough, only seven OECD countries are net recipients of high
skilled individuals in the OECD: the US (+3.4 millions), Australia (+708,000), Canada (+643,000),
Switzerland (+97,000), Belgium (+60,000), Sweden (+20,000) and Luxembourg (+8,000). Thus, not
only the relatively poor OECD member states like Mexico and Turkey, but also most Western
European countries are net senders of high skilled labour to other OECD countries, particularly to the
United States. In some of these cases the net losses are sizeable, e.g. in case of the United Kingdom
(-970,000), Korea (-594,000), Germany (-370,000) and Italy (-340,000). Interestingly enough, New
Zealand, a country which pursues a highly skill-selective immigration policy, and usually believed one
of the winners of the battle for brains, sends also more high skilled individuals into the OECD than it
receives from there.
Nevertheless, these losses can be compensated by the immigration of high skilled individuals from
other countries. Indeed, according to our data about 11.9 million high skilled individuals from nonOECD countries resided in the OECD in 2001. However, 9 million of these reside in the Australia,
Canada and the US, i.e. those countries which are the main net recipients of high skilled migrants in
the OECD anyway. Consequently, even if we consider the high-skilled immigrant population from
26
non-OECD countries, 17 out of 30 OECD countries send more high skilled individuals to other OECD
countries than they receive from OECD and non-OECD countries (Table 3.5).6
Table 3.5
Immigrant and emigrant population with tertiary education in OECD countries,
2001
stock of high-skilled immigrants
from OECD-30
from country
in country
in OECD-30
difference
memo item:
stock of other high-skilled
immigrants in country
Australia
Austria
Belgium
Canada
Czech Republic
Denmark
Finland
France
Germany
Greece
Hungary
Iceland
Ireland
Italy
Japan
Korea
Luxembourg
Mexico
Netherlands
Norway
New Zealand
Poland
Portugal
Slovakia
Spain
Sweden
Switzerland
Turkey
United Kingdom
United States
826,301
64,537
73,914
1,166,275
6,345
23,612
8,300
240,867
566,185
15,575
2,950
4,270
90,668
57,515
132,097
18,375
13,987
51,235
170,422
41,265
135,201
14,957
12,197
3,436
111,450
100,706
189,274
53,683
511,030
3,804,292
117,865
130,146
13,738
523,461
70,449
67,889
72,594
310,751
936,520
161,667
123,289
7,125
228,141
395,229
278,268
612,937
6,419
949,330
254,730
44,067
174,870
454,557
145,765
24,097
154,650
80,553
92,554
174,687
1,478,474
426,099
708,436
-65,609
60,176
642,814
-64,104
-44,277
-64,294
-69,884
-370,335
-146,092
-120,339
-2,855
-137,473
-337,714
-146,171
-594,562
7,568
-898,095
-84,308
-2,802
-39,669
-439,600
-133,568
-20,661
-43,200
20,153
96,720
-121,004
-967,444
3,378,193
811,751
38,674
25,856
1,557,820
40,643
16,023
13,211
368,118
454,570
49,209
9,595
2,290
25,053
84,903
135,273
27,596
7,785
30,719
223,469
22,639
82,653
88,539
15,291
2,477
182,590
95,163
90,801
95,006
722,391
6,595,708
OECD-30
8,510,921
8,510,921
0
11,915,816
1) Share of high skilled individuals, i.e. individuals with attained tertiary education
(ISCED 5A, 5B, 6) in 25+ aged population.-Sources: Data source Beine et al. (2007); own calculations.
To sum up, it is not the OECD or the high income countries as such who are the winners in the global
contest for talent: It is the United States and some English-speaking countries which pursue a highly
skill selective immigration policy such as Australia and Canada which are large net recipients of high
skilled labour, while the United Kingdom, but also some continental European countries and Korea
are the main losers. Moreover, relatively poor countries in the OECD at the periphery of the US and
the Western European core such as Mexico and Poland are important net senders of high skilled
migrants.
Unfortunately, we cannot calculate the saldo of high skilled migrants properly since data on high skilled migrants from
OECD countries residing in non-OECD countries is not available.
6
27
3.2
How large is the pool of high skilled labour?
A battle for brains can only unfold if the pool of high skilled labour is supply constrained. Again, we
define here individuals as high skilled if they have attained a tertiary education level. As Table 6
shows, the world-wide supply of individuals with tertiary education amounts to 338 millions. 191
millions or 56 per cent of those reside in high income countries, 17 per cent in upper middle income
countries, 24 per cent in lower middle income countries and 3.5 per cent in low income countries
(Table 3.6).
Table 3.6
Total population and immigrants with tertiary education by country groups, 2001
pool of high skilled 25+ population
high-skilled immigrants in OECD-30
in per cent of
thousand
global stock of
home
persons high-skilled population population
in per cent of
thousand home country stock of
persons high-skilled population
by income groups
high income countries1
upper middle income countries
lower middle income countries
low income countries
total
190,728
55,889
79,761
11,729
338,107
56.41
16.53
23.59
3.47
100.00
high income countries1
Latin America and Carrebean
Eastern Europe and Central Asia
East Asia and Pacific
South Asia
Middle East and Northern Africa
Subsaharan Africa
total
190,728
29,978
28,174
42,174
28,073
11,793
7,187
338,107
56.41
8.87
8.33
12.47
8.30
3.49
2.13
100.00
29.09
11.56
4.90
2.82
10.62
7,706
5,200
5,475
1,862
20,435
4.04
9.30
6.86
15.88
6.04
7,706
3,485
2,092
3,096
1,663
1,260
941
20,435
4.04
11.63
7.43
7.34
5.92
10.69
13.09
6.04
by region
29.09
12.05
11.37
4.23
4.31
8.41
2.96
10.62
1) High income countries comprise the high-income OECD countries and other high income countries according to the
WDI classification.
Sources: Data sources Beine et al. (2007); Defoort (2009); Barro/Lee (2000); own calculations.
This pool is increasing over time. The global number of individuals with tertiary education has
increased from 93 millions in 1975 to 319 millions in 2000 or by a factor of 3.4 in 25 years. During the
same period of time, the world population grew from 4 to 6 billion people, i.e. by a factor of 1.5. The
high skilled labour supply has grown at a factor of 2.9 less than proportional in the high income
countries during this time span. In contrast, it has grown in the lower-middle income countries by a
factor of 6.3, in the upper middle income countries by a factor of 4.5 and the low income countries
by a factor of 3.8. The growth of in the high skilled labour supply has particularly accelerated in the
lower-middle income countries during the last decade making this country group already to the
second largest source of high skilled labour in the world. It is thus reasonable to expect that the role
of the lower-middle income countries in South and East Asia as suppliers of high skilled labour will
further increase during the next decades.
Of course, only a minority of the high-skilled population is willing to migrate or has the legal,
economic and social opportunities to do so. In 2001, about 6 per cent of the individuals with tertiary
education belong to the immigrant population. The share is particularly high among the low income
countries (16 per cent) and the upper middle income countries (9 per cent), while it is rather low
among the high income countries (4 per cent) and the lower middle income countries (7 per cent)
(Table 3.6).
These rather moderate migration shares refer however to aggregates, which hide differences across
countries: There exist certain upper and lower middle income countries where the share of
28
emigrants exceeds 30 per cent of the high skilled population of the source countries, which in turn
suggests that the pool of high skilled labour is largely exploited there.
individuals with tertiary education attainment in the 25+ population
(persons)
Figure 3.3
25+ population with tertiary educational attainment, countries classified by
income, 1975 - 2000
250,000,000
200,000,000
150,000,000
high
upper-middle
lower-middle
low
100,000,000
50,000,000
0
1975
1980
1985
1990
1995
2000
Sources: Data sources Barro/Lee (2000); Defoort (2009), own calculations.
However, at the global level, the rather moderate shares of emigrants among the high skilled
population suggest that the pool of potential immigrants with tertiary education is far from
exhausted. This may be traced back to the fact that only a minority of OECD countries (Australia,
Canada, and New Zealand) actively recruits high skilled immigrants at present, while the largest
destination, the US, pursues a mixed immigration policy which grants only a limited amount of visas
for high skilled immigrants at present. It thus requires a major policy shift, e.g. an active and highly
skill selective immigration policy in the EU accompanied by a higher share of visas for high skilled in
the US such that a skill selective immigration policy meets severe supply constraints.
3.3
Looking at the top of the skill distribution
So far, our analysis suffers from the fact that we referred to the category of tertiary education only,
which covers a broad range of qualifications. This section provides a closer look at the upper end of
the skill distribution for some selected OECD countries for which the relevant information is
available.
3.3.1
High concentration of immigrants in population with academic degrees
Table 3.7 displays the number of foreigners with PhD degrees in Canada, Germany, Spain and the US.
Interestingly enough, the share of foreigners is increasing at the upper end of the skill spectrum
compared to the group which has attained tertiary education: The share of foreign-born among the
total population which has acquired a PhD amounts to 51 per cent in Canada, to 27 per cent in the
US, to 10 per cent in the Spain and to 5 per cent in Germany. The rather high shares of individuals
with a PhD among the foreign-born population which stays for less than 1 year in the host country
suggests that a substantial number of these has acquired their PhD abroad, although we have no
29
further information in the census where the PhD has been acquired. Information from selected
European countries (France, Germany, and Switzerland) suggests that one-third of the foreign-born
students are “educational inlanders” (Kuptsch, 2006).
Table 3.7
Immigrant and native population with a PhD degree, 2001
Natives
Foreign born
by year since arrival
less than 1
1 to 4
more than 4
all
persons
Canada
Germany
Spain
USA
OECD-4
51,123
397,429
143,600
1,058,671
1,650,823
52,428
20,300
16,600
390,023
479,351
n.a.
714
1,440
6,963
9,117
12,376
5,857
4,340
61,756
84,329
40,052
13,714
10,780
321,000
385,546
in per cent of 25+ population of respective group
Canada
Germany
Spain
USA
0.41
1.06
0.69
0.85
1.47
0.93
1.16
1.69
na
2.66
1.08
2.69
2.67
2.04
1.08
2.09
1.29
0.74
1.20
1.62
in per cent of total 25+ population with PhD degree
Canada
Germany
Spain
USA
OECD-4
49.37
95.14
89.64
73.08
77.50
50.63
4.86
10.36
26.92
22.50
na
0.17
0.90
0.48
0.43
11.95
1.40
2.71
4.26
3.96
38.68
3.28
6.73
22.16
18.10
Data sources: Integrated Public Use Microddata Series - International (IPUMS International), Version 4.0, Minnesota Population Centre, Minneapolis, 2008; Statistics Canada; Federal Statistical Office Germany, National Institute of Statistics
Spain, Bureau of Census, USA; own calculations.
While the structure of the foreign-born population with tertiary education in the OECD was balanced
by gender, the structure of the foreign-born population with a PhD degree is not. The share of males
with PhD degree exceeds that of females by a factor of 2.5 in the foreign-born population, while it
exceeds that in the native population by a factor of 2 (see Table 3.8).
30
Table 3.8
Immigrant and native population with a PhD degree by gender, 2001
Females
Natives
Males
Foreign born
Natives
Foreign born
33,668
283,000
87,280
693,831
1,097,779
40,269
13,714
9,440
276,650
340,073
persons
Canada
Germany
Spain
USA
OECD-4
17,455
114,429
56,320
364,840
553,043
12,160
6,571
7,120
113,373
139,224
in per cent of 25+ population of respective group
Canada
Germany
Spain
USA
0.28
0.61
0.54
0.58
0.66
0.63
1.00
0.98
2.34
1.22
1.30
2.39
2.67
2.04
1.08
2.09
in per cent of total female and male 25+ population with PhD
Canada
Germany
Spain
USA
OECD-4
58.94
94.57
88.78
76.29
79.89
41.06
5.43
11.22
23.71
20.11
45.54
95.38
90.24
71.49
76.35
54.46
4.62
9.76
28.51
23.65
Data sources: Integrated Public Use Microddata Series - International (IPUMS International), Version 4.0, Minnesota Population Centre, Minneapolis, 2008; Statistics
Canada; Federal Statistical Office Germany, National Institute of Statistics Spain;
Bureau of Census, USA; own calculations.
A larger number of OECD countries report data on the number of immigrants which have completed
university with a degree.7 Again, we see that the concentration of foreign-born is higher at the upper
end of the skill-spectrum compared to the tertiary education level. The share of foreigners in the
population with a completed university degree achieved 43 per cent in Canada, 25 per cent in the US
and 8.5 per cent in Spain in the year 2000. These shares have considerably increased over time in all
receiving countries. Moreover, the share of individuals which have completed university with a
degree is in most countries similar to that in the native population or even exceeds it, particularly in
Canada (see Table 3.9).
Note that the category of tertiary education covers also college education and technical and other
professional education levels beyond high school.
7
31
Table 3.9
Immigrant population with a completed university degree in selected OECD
countries, 1970-2005
1970
1
1980
2
1990
3
2000
4
2005
foreign born with completed university degree (persons)
Canada
France
Netherlands
Spain
UK
USA
160,000
236,720
23,281
na
na
717,051
496,000
319,620
na
27,227
na
1,636,959
772,000
599,064
na
90,082
na
3,172,215
1,310,026
na
23,281
164,820
325,300
5,868,732
na
na
na
na
na
7,699,884
foreign born in per cent of 25+ population with completed university degree
Canada
France
Netherlands
Spain
UK
USA
39.41
15.16
8.39
na
na
7.31
35.87
16.29
na
5.30
na
9.20
35.43
18.05
na
5.49
na
12.34
42.95
na
1.32
8.48
14.48
17.68
na
na
na
na
na
20.64
individuals with completed university degree in foreign-born 25+ population in per cent
Canada
France
Netherlands
Spain
UK
USA
8.09
6.79
6.24
na
na
11.92
19.72
8.77
na
10.21
na
18.72
24.93
14.17
na
19.73
13.35
22.34
34.76
na
20.61
11.43
na
25.42
na
na
na
na
na
29.44
individuals with completed university degree in native 25+ population in per cent
Canada
France
Netherlands
Spain
UK
USA
5.48
7.46
5.04
na
na
11.77
14.93
8.91
na
3.00
na
18.07
19.12
13.52
na
8.70
8.88
22.71
24.32
na
22.76
9.33
na
26.74
na
na
na
na
na
27.90
1) Canada and Netherlands 1971; France 1975.-- 2) Canada and Spain 1981; France 1982.-3) Canada, Spain and UK 1991.-- 4) Canada, Netherlands, Spain and UK 2001.
Data sources: Integrated Public Use Microddata Series - International (IPUMS International), Version 4.0, Minnesota Population Centre, Minneapolis, 2008; Statistics Canada; Federal Statistical
Office Germany; National Institute of Statistics Spain; Bureau of Census, USA; own calculations.
3.3.2
How are immigrants represented in top occupations?
The formal level of educational attainment as reported in the previous section can serve only as a
hint to the actual human capital of the immigrant population. Educational degrees may be hardly
comparable across countries and immigrants may lack complementary skills such as language or
cultural knowledge which are needed to transfer the human capital acquired abroad to labour
markets in host countries. Looking at how immigrants are represented at the top of the occupational
distribution provides therefore a good approximation to the brain gain that takes the value of the
acquired human capital for host countries’ labour markets into account. To this end, we analyse the
absolute numbers and shares of immigrants at the ISCO 1 and ISCO 2 occupation level here. ISCO 1
32
covers top management position in public administration and private businesses,8 ISCO 2 high
professionals and academics in engineering, natural sciences, social sciences, medicine, law, media,
and arts.9
Table 3.10
Immigrants in key management and high professional positions, 1970-2005
1970
1
1980
2
1990
3
2000
4
2005
foreign born in key management occupations (ISCO 1)
Canada
France
Netherlands
Spain
UK
USA
68,500
49,040
na
na
na
315,000
206,650
71,540
na
21,717
na
641,310
348,200
96,420
na
32,100
289,200
1,255,456
360,787
144,312
56,900
78,000
na
1,850,000
na
na
na
na
na
2,750,000
foreign born in high professional occupations (ISCO 2)
Canada
France
Netherlands
Spain
UK
USA
227,700
92,460
na
na
na
560,398
360,950
131,220
na
20,900
na
936,525
487,633
151,300
na
56,967
359,300
1,610,000
761,255
220,000
104,213
98,300
na
2,490,000
na
na
na
na
na
3,280,000
share of foreign born in total 25+ population in key management occupations
Canada
France
Netherlands
Spain
UK
USA
20.06
9.93
na
na
na
5.62
20.62
10.64
na
2.28
na
6.76
20.78
10.93
na
2.99
8.43
8.81
22.78
12.29
6.06
5.42
na
12.29
na
na
na
na
na
13.32
share of foreign born in total 25+ population in high professional occupations
Canada
France
Netherlands
Spain
UK
USA
24.93
10.77
na
na
na
6.33
22.74
11.11
na
3.20
na
7.30
21.13
11.28
na
4.43
10.41
9.14
23.54
12.79
8.58
5.21
na
12.39
na
na
na
na
na
13.91
1) Canada and Netherlands 1971; France 1975.-- 2) Canada and Spain 1981; France 1982.-3) Canada, Spain and UK 1991.-- 4) Canada, Netherlands, Spain and UK 2001.
Data sources: Integrated Public Use Microddata Series - International (IPUMS International), Version 4.0, Minnesota Population Centre, Minneapolis, 2008; Statistics Canada; Federal Statistical
Office Germany; National Institute of Statistics Spain; Bureau of Census, USA; own calculations.
In 2000, the share of foreign-born individuals in key management positions of the private and public
sector (ISCO 1) was 23 per cent in Canada, 12 per cent in France and the US, 6 per cent in Spain and 5
per cent in the UK. The share of foreign-born in high professional occupations was similar at the
same time: 23 per cent in Canada, 13 per cent in France, 12 per cent in the US, 9 per cent in the
Netherlands and 5 per cent in Spain. Moreover, we observe that the shares of the foreign-born
Leading positions in public administrations, ministers, members of parliament, entrepreneurs, top management positions
in private businesses, business consultants, auditors, tax consultants etc.
9
Engineers, academics in natural sciences and mathematics, social sciences, medical doctors, university and other teachers,
legal persons, journalists, artists.
8
33
population in top management and top professional occupations are considerably increasing in
almost all countries over time. Canada forms the only exception here, where the shares are
stagnating at an extremely high level (Table 3.10).
We also observe that the share of individuals in top management occupations in the private and
public sector is in the foreign population slightly below that of the native population in all countries
reported here. Similarly, the share of individuals in top professional occupations is in the foreignborn also slightly below that of the share of the native population in all countries with the exception
of Canada. However, the differences are relatively moderate (Table 3.11).
Table 3.11
Share of immigrants in key management and high professional occupations,
1970-2005
1970
1
1980
2
1990
3
2000
4
2005
share of individuals in key management occupations in 25+ foreign born population
Canada
France
Netherlands
Spain
UK
USA
3.46
1.64
na
na
na
5.24
8.21
2.05
na
8.14
na
7.34
11.24
2.65
na
7.03
11.86
8.84
9.57
3.41
4.91
5.41
na
8.00
na
na
na
na
na
9.95
share of individuals in key management occupations in 25+ native population
Canada
France
Netherlands
Spain
UK
USA
3.68
2.21
na
na
na
6.35
8.59
2.87
na
5.42
na
8.97
11.65
3.57
na
5.52
12.40
11.50
9.76
4.20
11.34
6.54
na
10.65
na
na
na
na
na
14.15
share of individuals in high professional occupations in 25+ foreign born population
Canada
France
Netherlands
Spain
UK
USA
11.52
3.08
na
na
na
9.32
14.34
3.77
na
7.82
na
10.71
15.74
4.15
na
12.48
14.74
11.33
20.20
5.20
8.99
6.82
na
10.77
na
na
na
na
na
11.87
share of individuals in high professional occupations in 25+ native population
Canada
France
Netherlands
Spain
UK
USA
9.25
3.80
na
na
na
9.94
13.24
5.00
na
3.69
na
12.06
15.97
5.42
na
6.51
12.22
14.17
19.74
6.09
14.26
8.60
na
14.20
na
na
na
na
na
16.03
1) Canada and Netherlands 1971; France 1975.-- 2) Canada and Spain 1981; France 1982.-3) Canada, Spain and UK 1991.-- 4) Canada, Netherlands, Spain and UK 2001.
Data sources: Integrated Public Use Microddata Series - International (IPUMS International), Version 4.0, Minnesota Population Centre, Minneapolis, 2008; Statistics Canada; Federal Statistical
Office Germany; National Institute of Statistics Spain; Bureau of Census, USA; own calculations.
We can thus conclude that (i) the shares of immigrants at the upper end of the skill spectrum, i.e.
among individuals with PhD or a completed university degree are in some OECD country well above
those of the native population, but that (ii) the shares of immigrants in the top management and
34
professional occupations are slightly below that of the native population. This can be interpreted as a
hint that immigrants are - even at the top of the skill spectrum - less able than natives to employ
their human capital into the labour markets of host countries. However, we also observe a
considerable convergence of the shares of immigrants in top management and professional
occupations to those of natives over time.
3.4
The competition for foreign students
Foreign students are an important source for high skilled immigration. The incentives for moving
abroad are high since studies in foreign countries are well rewarded in the labour market even if the
students return to their home countries. The receiving countries can benefit from the immigration of
foreign students by acquiring human capital which is well adapted to the host country through
language proficiency, social and cultural skills and can therefore be used productively in the labour
market (Kuptsch, 2006). Even if the receiving countries cannot completely recuperate the costs of the
studies by tuition fees, they may benefit later through the productive use of human capital in the
labour market. More and more countries have therefore facilitated the immigration of foreign
students by adjusting their immigration laws and have eased the access to labour markets in host
countries for foreign students which have completed their studies. Triggered by concerns that
Europe may fall back in the contest for talent, the EU has harmonized study programmes under the
umbrella of the Bologna process and encourages intra-European flows of students. Moreover, many
countries have increased the shares of tuition fees in funding of university studies, and many
discriminate against foreign students through higher tuition fees (e.g. Australia, Netherlands,
Switzerland and the UK). Altogether, these processes have increased incentives for host countries to
attract foreign students, even if they cannot recuperate the entire costs of their studies in the shortterm.
The available data on foreign student flows reflect these trends. Again, information on foreign
students has to be interpreted with care, since a substantial number of the foreign students have
been grown up in the host countries and are therefore “educational inlanders.” Kuptsch (2006) and
the evidence quoted there suggests that about one-third of the foreign students in UK, Switzerland,
Germany and the Netherlands has acquired their entire education in the host country.
Nevertheless, the available data suggest that the number of foreign students has increased
substantially: In advanced research programmes (ISCED 6), i.e. study programmes which are
completed with a publishable thesis or dissertation, the share of foreign students has grown in the
eight years from 1998 to 2006 from 11 per cent to 22 per cent, while the enrolment of foreigners in
all tertiary education programmes has increased from 4 per cent to 5.4 per cent during the same
period of time (Figure 3.4).
35
Figure 3.4
Participation of foreigners in tertiary education and advanced education
programmes in the OECD-27, 1998-2006
share of foreign-borns in per cent of all students
25
enrolment in advanced tertiary education programmes (ISCED 6)
20
enrolment in all tertiary education programmes (ISCED 5A, 5B, 6)
15
10
5
0
1998
1999
2000
2001
2002
2003
2004
2005
2006
Sources: OECD (2009), own calculations.
In general, it is important to note that foreign students are heavily concentrated at the upper end of
the tertiary education programmes: In 2006, the share of foreign-born individuals in the total
enrolment of practical and technical education programmes (ISCED 5B) was only 3.8 per cent, but 8.1
per cent in theoretical programmes (ISCED 5A) and 22.4 per cent in advanced research programmes
(ISCED 6). Particularly high is the foreign participation in advanced research programmes and
theoretically based programmes in Switzerland, the United Kingdom, Norway, and Luxembourg.
36
Table 3.12
Australia
Austria
Belgium
Canada
Czech Republic
Denmark
Finland
France
Germany
Greece
Hungary
Iceland
Ireland
Italy
Japan
Korea
Luxembourg
Mexico
Netherlands
Norway
New Zealand
Poland
Portugal
Slovakia
Spain
Sweden
Switzerland
Turkey
United Kingdom
6
United States
OECD-27
Foreign students by educational programme in the OECD, 2006
foreign students (persons)
foreign students in per cent of total students
total
advanced
theoretically practical and
tertiary
research
based
technical
1
2
3
4
education programmes programmes programmes
total
advanced
theoretically practical and
tertiary
research
based
technical
1
2
3
4
education programmes programmes programmes
217,055
39,329
40,607
148,164
21,395
19,123
8,955
247,510
261,363
16,558
14,491
715
na
48,766
130,124
22,260
1,137
na
35,374
67,699
14,297
11,365
17,077
1,733
51,013
41,410
39,415
19,079
418,353
572,509
11,988
3,520
2,321
13,302
1,807
912
1,663
24,997
na
414
642
19
na
1,926
12,586
2,024
na
na
na
2,278
1,127
942
1,570
77
14,783
4,414
7,626
872
40,193
78,884
192,987
35,809
24,518
134,862
19,267
15,264
7,292
196,794
248,149
14,171
13,720
691
na
45,980
88,176
14,697
na
na
35,374
47,935
12,952
10,409
15,257
1,641
27,057
36,077
25,917
17,135
318,937
396,285
12,080
na
13,768
na
347
2,947
na
25,719
13,214
1,973
129
5
na
860
29,362
5,539
na
na
na
17,486
218
14
250
15
9,173
919
5,872
1,072
59,223
na
20.87
15.54
10.30
14.60
6.34
8.35
2.90
11.24
11.42
2.54
3.30
4.55
na
2.40
3.19
0.69
42.24
na
6.10
28.47
6.66
0.53
4.65
0.88
2.85
9.80
19.23
0.81
17.91
3.31
29.66
20.93
31.02
38.26
7.98
19.20
7.51
35.80
na
1.84
8.06
12.18
na
5.03
16.78
4.66
na
na
na
42.78
22.33
2.88
7.65
0.72
19.18
20.65
44.25
2.68
42.68
26.34
22.96
16.86
13.41
13.76
6.80
7.80
2.54
12.33
12.70
3.67
3.38
4.55
na
2.33
2.90
0.74
na
na
6.18
28.35
6.24
0.50
4.45
0.89
1.84
9.47
17.04
1.05
18.44
29.41
7.60
na
6.75
na
1.09
10.33
na
4.80
3.93
0.81
0.52
1.29
na
6.18
3.03
0.47
na
na
na
27.60
11.17
0.06
5.91
0.53
3.82
4.51
16.47
0.16
11.57
na
2,526,876
230,887
1,997,353
200,185
5.42
22.42
8.12
3.75
1) All tertiary education comprises the ISCED 6, ISCED 5A and 5B level.-- 2) ISCED 6 level. Advanced research programme are
concluded with a publishable thesis or dissertation, which qualify inter alia for a faculty post or research position in the private
sector.-- 3) ISCED 5A level which comprises studies which cover also theoretical qualifications. 4) ISCED 5B level, which comprises education programmes with technical and practical occupational qualifications.-- See UN(2006) for a description of the ISCED
classification.-- 6) All tertiary 2005; advanced and theoretical programmes 2001.
Sources: OECD STAT database; own calculations of shares and indicators.
3.5
Can highly skilled immigrants transfer their human capital into host labour
markets?
The effects of the brain gain as well as the incentives for high skilled individuals to migrate depend on
whether they are able to transfer their human capital into the labour markets of host countries.
There exists a broad literature building on Chiswick (1978), Carliner (1980), Borjas (1987) Jasso and
Rosenzweig (1985; 1990) and others which examines the “assimilation” of immigrants into host
country labour markets, i.e. the age-earnings profile of immigrants relative to the native population
controlling for the year of entry and cohort effects (see Chiswick and Miller, 2007, Gang et al., 2008,
Venturini and Villosio, 2008, for recent contributions). While the overwhelming share of these
studies focuses on the returns to education in general, some of these studies directly address the
labour market performance of high skilled individuals.
These studies find that (i) high skilled immigrants have a lower probability than natives of similar
education levels to obtain high skilled jobs (see Mattoo, Neagu and Özden, 2008, for the US, Green,
1999, for Canada, Kler, 2006, for Australia), (ii) have higher unemployment risks (see Chiswick et al.,
1997, for the US, Cheung and Heath, 2007, for the UK) and (iii) receive lower wages than natives (see
Brekke and Mastekaasa, 2008, for Norway, Clark and Drinkwater, 2008, for the UK, Friedberg, 1996,
for Israel, Wadensjö, 1992, for Sweden, Ker, 2006, for Australia). Clark and Lindley (2009) however
37
find for the UK that high skilled individuals entering the country through the educational system
perform better in terms of wages and employment opportunities than natives, while immigrants
which enter the country through the labour market channel perform worse.
The evidence whether wages and other labour market outcomes of high-skilled immigrants converge
to or even overtake those of natives is mixed. Many studies find no evidence for the convergence of
wages (e.g. Brekke and Maastekaasa, 2008, Gang et al., 2008; Constant and Massey, 2003), while
others find mixed or rather weak evidence for wage convergence (Kler, 2006; Friedberg, 1996). In
contrast, the findings of Chiswick and Miller (2007) indicate that the share of immigrants which
obtain a job above their skill level is increasing with the length of staying in the host country, and
Chiswick et al. (1997) show that unemployment risks decline with the length of stay.
Recently, Hunt (2009) has examined the performance of high skilled immigrants which have
graduated in the US using the 2003 wave of the National Survey of College Graduates. Interestingly
enough, immigrants which graduated in the US have significantly higher wages than native
graduates, are more likely to start up a firm and been granted a patent, and author more academic
papers. However, these effects disappear if it is controlled for the field of study and the census
region: immigrants are overrepresented in fields with high returns in the labour market, i.e.
computer sciences and mathematics, engineering and physical sciences, and in high wage regions.
While high-skilled immigrants earn 2.9 per cent more than natives without controls, they earn 8.2
per cent less if all covariates are considered (Hunt, 2009).
An in-depth analysis of the earnings of high skilled immigrants and other aspects of their labour
market performance is beyond the scope of this study. Instead we provide here some descriptive
data on the wages of full-time employed high skilled immigrants by age groups for the US and
Canada. Figures 3.5 and 3.6 show that immigrants with a PhD degree receive similar wages as natives
in the US until the 40-44 age bracket, and higher wages in the age brackets above 44. In contrast,
foreign-born individuals in Canada receive in all age brackets lower wages than natives except for the
60 to 64 age group. Interestingly enough, foreign-born individuals in highly professional occupations
(ISCO 2) receive substantially higher wages than natives in the US (Figure 3.7). Again, the wage levels
of foreign-born in ISCO-2 occupations are in most age brackets below those of natives in Canada
(Figure 3.8). A similar picture emerges for the ISCO-1 occupations and if we distinguish the wage
patterns between males and females (not displayed here).
38
Figure 3.5
Annual wage incomes of PhD graduates in USA, 2000
90,000
Foreign-born
80,000
70,000
Natives
US Dollar
60,000
50,000
40,000
30,000
20,000
10,000
0
25 to 29
30 to 34
35 to 39
40 to 44
45 to 49
50 to 54
55 to 59
60 to 64
55 to 59
60 to 64
Age
Sources: IPUMS international, own calculations.
Figure 3.6
Annual wage incomes of PhD graduates in Canada, 2001
90,000
80,000
70,000
Natives
Canadian Dollar
60,000
Foreign-born
50,000
40,000
30,000
20,000
10,000
0
25 to 29
30 to 34
35 to 39
40 to 44
45 to 49
Age
Sources: IPUMS international, own calculations.
50 to 54
39
Figure 3.7
Annual wage incomes of high professionals (ISCO 2) in USA, 2000
70,000
Foreign-born
60,000
50,000
US Dollar
Natives
40,000
30,000
20,000
10,000
0
25 to 29
30 to 34
35 to 39
40 to 44
45 to 49
50 to 54
55 to 59
60 to 64
Age
Sources: IPUMS international, own calculations.
Figure 3.8
Annual wage incomes of high professionals (ISCO 2) in Canada, 2001
60,000
50,000
Natives
Foreign-born
Canadian Dollar
40,000
30,000
20,000
10,000
0
25 to 29
30 to 34
35 to 39
40 to 44
45 to 49
Age
Sources: IPUMS international, own calculations.
50 to 54
55 to 59
60 to 64
40
3.6
Conclusions
The descriptive analysis provided in this chapter suggests that the battle for brains has just started.
The available data with all its limitations indicates that the global pool of high skilled labour consists
of about 320 million persons, 190 millions of these residing in high income countries of the OECD and
other high income regions of the world. The stock of high-skilled immigrants in the OECD can be
estimated to be at about 20 million persons, 50 per cent of these stemming from high income
countries. Interestingly enough, only a minority of OECD countries are winners of the talent contest
in the sense that they obtain more high skilled individuals than they send abroad. While the US and
countries with a highly skill selective immigration policy (Australia, Canada) are net winners, most EU
countries are net senders even if we consider their inflows from non-OECD countries.
Data on high skilled immigration at the top of the skill distribution are scarce. The available evidence
suggests that the concentration of foreign-born individuals among the population with a PhD degree
is significantly larger than that among the population with a tertiary education degree. Moreover,
foreign students are heavily overrepresented in advanced research programmes (ISCED 6) and
theoretically based programmes (ISCED 5A).
The available data suggest that the share of individuals in top professional occupations (ISCO 2) and
top management occupations (ISCO 1) among the immigrant population is below that of natives in
selected OECD countries, but tends to converge to similar shares over time. Moreover, our
descriptive data suggest that migrants with a PhD degree and migrants in ISCO 1 and ISCO 2
occupations have similar or higher earnings than natives the same educational or occupational level
in the US, but lower ones than in Canada. Microeconometric evidence, however, suggests that
distinct differences between high skilled immigrants and natives exist in earnings and other labour
market outcomes if we control for covariates such as field of study, other human capital
characteristics and regions.
41
Annex Tables
Table A 3.1
Wage income by selected skill groups in
USA and Canada, 2000/01
US
Age
Natives
Canada
Foreigners
Natives
in US-$
Foreigners
in Canadian $
PhD
25 to 29
30 to 34
35 to 39
40 to 44
45 to 49
50 to 54
55 to 59
60 to 64
38870
49780
65090
68500
72410
75540
75980
71250
37580
50990
62650
70750
80090
81800
84800
75760
41340
38110
53030
61900
67700
69980
76560
70910
33410
36580
49930
53950
58580
64320
71950
74430
completed university degree
25 to 29
30 to 34
35 to 39
40 to 44
45 to 49
50 to 54
55 to 59
60 to 64
35200
46670
58300
61530
60260
61210
62250
57720
37630
47930
55570
57580
58620
61230
62510
57240
US figures for 2000, Canadian figures for 2001
Sources: IPUMS international, own calculations.
32090
42760
50310
53520
54020
55450
51080
44350
28730
35680
40000
41650
43780
48100
47940
46430
42
Table A 3.2
Wage income by selected occupations in
USA and Canada, 2000/01
US
Age
Natives
Canada
Foreigners
in US-$
Natives
Foreigners
in Canadian $
ISCO-01
25 to 29
30 to 34
35 to 39
40 to 44
45 to 49
50 to 54
55 to 59
60 to 64
34670
45790
56040
61290
64090
66560
65750
60350
33870
45050
55610
58800
61860
64430
64490
59020
33840
44260
52320
56500
57420
58910
52770
47880
32840
40480
45310
45780
48210
51770
50650
46800
31660
39510
44360
46380
47800
49710
47470
41570
31110
38130
41660
43180
44950
48370
49300
48370
ISCO-02
25 to 29
30 to 34
35 to 39
40 to 44
45 to 49
50 to 54
55 to 59
60 to 64
31870
39880
48160
50980
52150
53600
54500
51190
34300
44030
52700
56280
59040
64250
65640
64030
US figures for 2000, Canadian figures for 2001
Sources: IPUMS international, own calculations.
43
4
The determinants of highly skilled migration: Evidence from OECD countries 1980 2005
As shown in the previous chapter, highly educated individuals are much more internationally mobile
than the less educated. It is also the case that OECD countries have closed their labour markets
largely to foreign workers but grant many exceptions for the highly educated even if they do not
explicitly pursue a skill-selective immigration policy. This is due to a shared sentiment that highly
educated workers can contribute to the economy of the country of destination by bringing valuable
skills, stimulating investment and growth, and raising productivity. However, the determinants of
highly skilled migration are not yet well understood.
What is the impact of wage differentials on highly skilled migration flows? Do wage differentials for
the highly educated play the same role as average wage differences in stimulating highly skilled
migration? How do immigration laws as well as other laws and policy measures in OECD countries
affect immigration in general and that of the highly educated in particular? How does the wage
premium for education, taxation, welfare spending and other measures affect the skill distribution in
the immigrant population of a destination country? In summary, how do geographical, legal and
economic factors affect the scale of highly educated immigration and the skill selection of the
immigrant population?
The purpose of this chapter is to address these questions by analyzing the determinants of total
migration flows and of the skill selection of immigrants in OECD countries. A deeper understanding of
the determinants of high skilled migration and the skill selection of international migrants was for a
long time hampered by a lack of comprehensive data on the skill structure of international migrants
as well as by a lack of a systematic collection and classification of institutional variables which affect
high skilled migration, particularly of the legal framework of migration. Recent progress in the crosscountry collection of data on immigration stocks and flows which distinguish different education
levels of migrants (see the Docquier and Marfouk, 2006; and Defoort, 2009, data sets discussed in
Chapter 2) have recently facilitated such an analysis. First insights on the selection of international
migrants by skill levels are provided in recent papers by Belot and Hatton (2008), Grogger and
Hanson (2008), Brücker and Defoort (2009) and Ortega and Peri (2009).
Three aspects set this chapter apart from the recent contributions in the literature: First, we focus
particularly on the determinants of the migration of the highly skilled still in comparison with the
determinants of overall migrations. By estimating a total migration equation and then an equation
that explain the differential migration between high and low skills we can characterize more
thoroughly the effect of economic, legal and policy variables in promoting total and selective
immigration. Second, we explain total immigration and the skill selection of the immigrant
population using a rich set of economic and institutional variables such as a legal variables which
capture the main institutional features of immigration reforms, with a specific eye on high skilled
immigration, variables that capture labour market institutions and the generosity of welfare benefits,
as well as economic variables such as spending on research and development which have not yet
been considered so far. As several of these variables are very collinear we use the strategy of
including them in the regressions few at the time and keeping only those that are statistically
significant in most specifications. Third, in contrast to most other papers which employ either crosssectional data (Belot and Hatton, 2008; Grogger and Hanson, 2008) or only a small sample of
destination countries (Brücker and Defoort, 2009), we use a novel panel data set which comprises 14
destination and 74 countries of origin. This data set enables us to identify the impact of different
institutional and economic characteristics in the destination and the sending countries and to control
with a very rich set of dummies for unobservable factors which play an important role in the
estimation of macro migration equations.
44
Moreover we are interested in the differences in total immigration and its skill intensity across
receiving countries, and not so much on the volume of migrants relative to those who stay. In
particular, we intend to identify the effects of wages, laws, institutions and economic variables in the
receiving country on the total flow of immigrants and the share of tertiary educated relative to
primary educated immigrants.
Building on Ortega and Peri (2009), who in turn draw on Grogger and Hanson (2008), we employ a
simple theoretical framework which explains total migration and the selection of different skill
groups as a function of wages and of the returns to education in different locations as well as
accounting for potentially skill-specific migration costs. From this theoretical framework we derive
two empirical equations, one for the scale of total migration and one for the skill selection of the
immigrant population. Differently from Groger and Hanson (2008), however, we include in both
specifications a set of country of origin by year effects that fully absorb sending-country specific
factors, and we allow those dummies to differ by country, skill group and year. Reassured that we are
not omitting relevant sending-country variables we can study in detail the effect of receiving-country
variables on migration flows and their skill composition.
Focusing on the receiving countries, while controlling for sending country effects, we find that after
tax wages are the key determinant for the scale of high skilled immigration as well as for total
migration. The wage premium for education increases the share of high-skilled in the immigrant
population strongly and is thus the main economic factor which affects the skill composition of this
group. Similarly, changes in the immigration legislation which favours high-skilled immigrants relative
to the less educated have a positive and strongly significant impact. Generous welfare benefits and
labour market regulations, like stronger employment protection, increase the total inflow of migrants
including the high skilled, but reduce the favourable skill-selectivity of the immigrant population.
Finally, research and development expenditures have a strong positive impact on selecting the highly
educated.
The remainder of this chapter is structured as follows. First, we present a simple theoretical
framework which forms the basis for our later empirical analysis. Second, we describe the
construction of our data set and the relevant data sources and we preview very briefly some features
of the data. Third we discuss the estimation results. The final section concludes.
4.1
A simple model
High skilled migration and the selection of the migrant population with respect to their education
levels is driven by economic factors such as wage and other income differentials as well as by
institutional variables which affect the returns to migration in the receiving country and the costs to
migration. Drawing on Ortega and Peri (2009) and Grogger and Hanson (2007; 2008) we analyze
migration of high skilled here in a theoretical framework, which derives migration decisions across
multiple destinations from optimisation decisions of individuals with different education levels: they
choose a destination country in order to maximize their utility net of migration costs. From this
framework we derive two simple pseudo-gravity equations which form the basis for our empirical
analysis: First, we derive a scale equation for the total migration flows from the decision of an
average (representative) agent that maximizes his or her utility across multiple destinations. Second,
applying the same framework to two agents with different level of education, we derive a selection
equation, which explains the relative size of the immigrant flows with tertiary education to that with
primary education. The later equation enables us to analyze the impact of economic and institutional
variables on the skill selectivity of migration flows, which is the main purpose of this chapter.
45
4.1.1
The scale of total immigration flows
Consider an average agent i which lives in the origin country o ∈ O = {1,...,O} who decides whether to
stay in o or to migrate to any of d ∈ D = {1,...,D} potential destination countries. The utility from a
given destination d depends on the potential migrant's expected permanent value of labour income
in that country and on the costs associated with migrating to d. Specifically, individual i's utility (net
of costs) associated with migrating from country of origin o to country d is given by:
Uodi = δodi – νodi = f(Wd) – g(Cod) – νodi,
[1]
where δodi is a country-pair-specific term shared by all individuals migrating from the same origin to
the same destination, and νodi is individual-specific. In particular, the country-specific term is assumed
to be a function f of permanent expected earnings, Wd, of individual i in country d, and a function g
of costs of migration, Cod, which may include destination-specific terms and bilateral costs that vary
by country pair.
Equation [1] is based on the assumption that the benefits and costs of migration are separable. We
also assume that the average expected income in the country of destination wd can be approximated
by the GDP per capita in the country of destination. We explicitly allow migration costs to depend on
specific destination country factors θd (such as immigration laws), and on specific bilateral country
factors Xod (such as geographical or cultural distance).
We normalize the average expected utility from not migrating (staying in o) – f2(Wo) – to zero.
Obviously, migration costs are zero for individuals that choose to stay in the country of origin. We
also assume that f and g are increasing functions. Similar to Grogger and Hanson (2008) and Ortega
and Peri (2009), we assume that the functions f and g are (approximately) linear. Hence, we can
rewrite equation [1] as:
Uodi = f1 Wd – g1 θd – g2 Xod – νodi ,
[2]
where f1, g1 and g2 are positive constants.
The idiosyncratic term νodi captures any other individual, unobservable characteristics that are
important to migration decisions. Under the assumption that νodi is iid and that migrants choose the
alternative that maximizes their utility, νodi follows a (Weibull) extreme value distribution. The
migration problem considered resembles exactly the standard discrete choice Logit model discussed
in McFadden (1974). In particular we can identify the utility (net of costs) associated with migration
decisions from the data on the logarithm of the proportion (probability) of individuals that migrate to
each destination, or choose to stay in the country of origin. Namely,
ln sod – ln soo = f1 Wd – g1 θd – g2 Xod,
[3]
where sod = nod / (nod + Σd=1D nod) is the proportion of people born in o who migrate to d – nod – in the
total population born in o (nod + Σd=1D nod), while soo is the share of those who stay in o (noo) among
those born in o. Note that if we do not normalize the utility from staying at home to zero, we would
have instead of equation [3]
ln sod – ln soo = f1 Wd – f2 Wo – g1 θd – g2 Xod.
[3’]
Since we are interested in the role of destination country determinants, we keep our normalisation
such that the coefficient f1 measures the effect of an increase in the gap of expected wages between
the origin-destination pair of countries.
46
We substitute the definition of the shares into equation [3] and solve for ln nod, i.e. the logarithm of
the migrants which move from o to d, and note that the population which stays in the country of
origin, noo, as well as the wage in the country of origin, Wo, are constant across all destinations d. This
enables us to rearrange [3] into
ln nod = Do + f1 Wd – g1 θd – g2 Xod ,
[4]
where the Do is a constant that collects all terms that do not vary by destination d (in equation [3’]
they are f2 Wo and ln soo).
Equation [4] is the basis of our estimating equation. Assume that we observe, with some
measurement error, the share of people born in country o and residing in destination country d for a
set of countries of origin O, destinations D, and for different years t. The log of the migration flow
from o to destination d is given by
ln nodt = Dot + Dd + β1 Wdt + β2 Xod + β3 Ydt + eodt,
[5]
where the term Dot is a set of country-of-origin by time effects that absorbs all the characteristics of
each country of origin that vary over time (including wages), Dd are destination country dummies
absorbing time-invariant features of the receiving country that affect migration costs, Ydt captures
time-varying institutional and economic variables in the destination countries and eodt is a zero-mean
disturbance term. The coefficient β1 = f1 and β2 = g2. Note that we are allowing for time-invariant,
destination-specific migration costs (through dummies) as well as time-varying ones via Ydt, which
will proxy for changes in the tightness of immigration laws or in other policy variables. Finally, Xod
captures the bilateral time-invariant migration costs.
4.1.2
Selection equation
On basis of equation [5] it is straightforward to derive an equation which explains the selection of
high skilled migrants by destination countries characteristics. Consider two types of potential
migrants, highly educated ones, labelled by H, and less educated ones, labelled by L. For each type of
migrant we can derive a migration equation similar to [5]. Subtracting each side of these two
equations from each other and assuming that the receiving country fixed effects, Dd, which capture
the initial policy stance of the receiving country towards immigrants, are common to the two types of
immigrants and will thus difference out, yields:
ln nHodt – ln nLodt = D’ot + β1 (WHdt -WLdt) + β’2 Xod + β’3 Ydt + e’odt,
[6]
where the superscripts H and L refer to the characteristics of “highly” and “less” educated migrant
flows.
Equation [6], which we call the selecting equation, explains the selectivity of migrants with respect to
their skills10. More precisely equation [6] states that the logarithmic difference of high and skilled
migration flows, (ln nHodt – ln nLodt). It depends, among other things, on the difference of the wage for
highly and less skilled labour in the country of destination, (WH – WL), on the time-variant
characteristics of the immigration laws in the receiving country, on fixed bilateral migration costs,
Xod, and on a full set of origin by year dummies. We thus assume that the institutional framework for
immigrants and other institutional conditions in the destination country such as labour market
institutions or the generosity of welfare benefits as well as bilateral migration costs may affect
Grogger and Hanson (2008) call this equation “sorting” as it describes the sorting of migrants across countries, depending
on their education. They call “selection” the equation that describes the education of migrants relative to non-migrants in
countries of origin.
10
47
migration decisions of different education groups differently. By estimating how wage, institutions
and policy variables affect total immigration, on one hand, and its skill-intensity, on the other, we can
emphasize their different role and response of highly educated immigrants relatively to the rest.
4.2
Data
Estimating equations [5] and [6] requires a data set which distinguishes migration flows by skill levels.
Drawing on Ortega and Peri (2009)11 we have constructed a novel data set which comprises
migration flows for a panel of 14 receiving countries in the OECD and 74 countries over the period
1980 – 2000. We have complemented these data by a rich set of explanatory variables, which can be
classified into legal variables capturing the immigration laws at the countries of destination, wages
and other economic variables which may affect the returns to human capital in the destination
countries, and other institutional variables such as the regulation of labour markets and the
generosity of welfare benefits. We only sketch this novel data set here, for a detailed description see
Ortega and Peri (2009). A detailed appendix is available from the authors upon request.
4.2.1
Migration flows
For the calculation of the annual bilateral migration flows we used two data sets: For the years 1995
to 2005, we downloaded the flows of migrants from the International Migration Dataset (IMD)
provided by the OECD. For the period 1980 – 1995 we used a data set collected and organized by
Mayda (forthcoming), which is based on OECD data which are no longer available.12 Since the data
source and the methods of data collection are the same, we merged these two data sets which gives
a balanced and consistent panel when we select 14 OECD destination countries13 and 74 countries of
origin.
The data are based on population registers and residence permits, which can be considered as
relatively accurate measures for the legal entry of foreign nationals. While the OECD makes an effort
(especially since 1995) to maintain a consistent definition of immigrants across countries, there are
some differences between destination country definitions. An important one is that some countries
define immigrants on the basis of the place of birth and others on the basis of nationality. While this
inconsistency can make a pure cross-country comparison inaccurate, our analysis focuses on changes
within destination countries over time. Therefore it should be exempt from large mis-measurement
errors due to this classification problem.
The migration flows have then been decomposed for each bilateral pair into three groups: those with
tertiary, secondary and primary education. Since direct measures of the education level of immigrant
flows are not available, we used the Docquier et al. (2007) data set on the education levels of the
stocks of immigrants in 1990 and 2000 to construct the educational structure of migration flows by
specific bilateral pair. More specifically, we use the 1990 data for the flows prior to 1990, we
interpolated the 1990-2000 education composition of stocks and attribute them to the flows in the
intermediate years and finally we attribute the 2000 stock composition to the post 2000 flows. As the
education composition of emigrants from a specific country is relatively stable over time, and the
relatively large variance in the skill level of the immigrant population is caused by shifts in the
country of origin mix, this method should capture most of that variation from the receiving country
perspective.
We thank Francesc Ortega for allowing us to use the data.
We refer to Mayda (forthcoming) for specific descriptions of the data relative to the 1980-1995 period. The source (OECD
International Migration Data) and the definitions, however, are the same as those provided by the OECD for the statistics
relative to the 1995-2005 period. Hence, we simply merged the two series.
13
Australia, Belgium, Canada, Denmark, France, Germany, Japan, Luxembourg, Netherlands, Norway, Sweden, Switzerland,
UK and USA.
11
12
48
Figure 4.1
Annual inflows of immigrants into the OECD-14 as per cent of population,
1980-2005
.2
Yearly flow as % of population
.3
.4
.5
.6
Total of 14 OECD receiving countries
1980
1985
1990
1995
2000
2005
year
Note: The source of the immigration flow data is the OECD International Migration Database. The population
data are from the Penn World Tables.
If we look at the total immigration rates (i.e. the total annual of immigrants divided by the population
of the receiving countries) in the 14 destination countries of the OECD, two facts are evident: First,
we see the overall immigration rate in the OECD has increased substantially from about 0.25 per cent
in the early 1980s to 0.4 per cent in the 2000s, with a peak triggered by the fall of the iron curtain in
Europe and surging immigration in the US around the year 1990 (see Figure 4.1). Second, we see that
differences across destination countries matter since we observe no common trend growth of
immigration in the OECD destination countries and a lot of idiosyncratic fluctuation there (Panel A1
in the Annex).
49
Figure 4.2
Average composition of immigration flows into the OECD-14 by education, 1980-2005
.2
.3
.4
.5
.6
Immigrants to 14 OECD Countries
1980
1985
1990
1995
2000
2005
year
share of tertiary
share of primary
share of secondary
Note: The source of the immigration flow data by education group are our calculations. We impute the share of
immigrants from country o to country d by education group from the share in the stock of immigrants from
country o in country d in the closest year available. Then we aggregate the flows for all countries of origin and
obtain the composition of immigrants by education in the country of destination.
An examination of composition of immigration flows by skill level yields two main trends: First we see
a bipolar concentration of immigration at the upper and the lower end of the skill spectrum. While
both the group of individuals with tertiary and primary education count for 40 per cent of total
immigration flows, the group of secondary educated individuals only accounts for about 20 per cent.
Second, the period of fastest increase in the immigration flows (1984-1990) also corresponded to a
period of a significant increase in the share of less educated while the subsequent slow-down in
flows (1991-2000) corresponded to an increase in the share of more educated (Figure 4.2).
The significant increase of the less skilled in the period before 1990 might be traced back to the
regularisation of illegal migrants in the US in 1986, while the latter increase in the share of medium
and high skilled immigrants might be the result of the East-West migration in Europe. The individual
country trends are reported in Annex Table A 4.2. Similar to our analysis in chapter 3, we see that
Australia and Canada achieve the highest shares of high skilled immigrants, followed by the US (Table
A 4.2).
4.2.2
Immigration legislation
The second novelty in the data set used here refers to the variables which capture different features
of the immigration laws (see Ortega and Peri, 2009 for a detailed description). We use and update
two data sets here: The Mayda and Patel (2004) data set and the Social Reforms database of the
Fondazione Rodolfo DeBenedetti (FRDB) (2007). The Mayda and Patel (2004) data set documents the
main characteristics of immigration policies in several OECD countries (between 1980 and 2000) and
50
the year of changes in their legislations. The FRDB Social Reforms Database collects information
about social reforms in the EU-15 countries (except Luxembourg) over the period 1987-2005. We
merged and updated these two data sets obtaining the complete set of immigration reforms in the
period 1980-2005 relative to all the 14 OECD countries considered, for a total of more than 240 laws.
The method is described in Ortega and Peri (2009), although we use a different classification of the
laws here.
For each variable we classify the changes in the legislation beginning in the year 1980 (standardized
to 0). Depending on certain criteria, we classify each law by +1, -1 or 0 depending on whether it
contributes positively, negatively or it is neutral with respect to a certain criterion. We construct the
following five variables:
•
•
•
•
•
•
“Requirements for Entry": captures how cumbersome the visa application and entry process
are in terms of fees, time and documents and how stringent immigration quotas are.
"Requirements for Residence": measures how cumbersome the process of acquiring
permanent residence or citizenship in is in terms of fees, waiting time or degree of family
relation with a citizen.
"Restriction from Benefits": measures how restricted the access to welfare benefits which
are granted to native citizens is for immigrants and whether the access is subject to extrarequirements (such as duty of registration, or limitation of their movement) relative to
native nationals.
"Undocumented": measures how strict the laws against undocumented immigrants (such as
border control, legal rights granted to undocumented and possibility of regularisation) are.
"Asylum" measures how strict the requirements for political asylum are and how
cumbersome it is to apply for asylum.
"Pro-skilled": captures the cumulated value of all laws which favour highly educated (or
skilled) immigrants against less educated in one way or another.
The first five variables share the feature that an increase in their value increases what is considered
the "tightness" of immigration laws, presumably increasing the cost of immigration, while a decrease
in their value “relaxes" immigration laws, probably reducing immigration costs. The last variable is
calculated as the cumulative value of all one-unit increases triggered by changes in laws which affect
the skill selection of immigrants in one direction or another. An increase in this variable shifts the
immigration costs reducing them for highly educated and increasing them for less educated.
There are few laws (4 out of 240) that are less than clear in their contribution to a specific criterion or
that may change some more vague features of immigration laws (such as those stating generic
measures for promoting immigrants integration or appointing a committee to deal with some
immigration issues). In those cases we have attributed to the laws a 0 contribution to each criterion.
It is interesting to comment on a few features of the six variables capturing immigration laws. As
each variable for each country is set equal to 0 in 1980 the variable should be thought as capturing
the change in policy stance over the considered period. Hence, for instance, a country such as
Australia whose "Requirements for Entry" increased from 0 (in 1980) to 2 (as of 2005) experienced a
tightening of its entry policies while a country such as the US, whose variable "Requirements for
Entry" decreased from 0 to -2 in the same period, experienced a loosening of its entry policies.
Figure 4.3 provides an idea on the average evolution of each of the six policies over time, averaging
over the 14 OECD countries which are weighted by their population. The variables that experience
the largest change over time (positive in all cases) are Pro-Skilled, Restriction from Benefits and
Undocumented. Between 1980 and 2005 each of the considered countries enacted on average two
laws reducing the access of immigrants to benefits available to citizens and about 2.5 laws tilting the
51
preference towards skilled immigrants and against undocumented immigrants. To the contrary
Requirements for Entry, Requirements for Residence and Asylum were, overall, slightly loosened. The
most important fact, for our purposes, is the clear trend to pass immigration laws favoring educated
immigrants. Canada, Japan and Australia in the 80's and 90's lead the trend of pro-skilled
immigration reforms.
The correlation matrix between the six policy variables (reported in Table A 4.3) provides a
preliminary idea of whether these policies moved together across countries over the considered
period (positive correlation) or if they where used as substitutes of each other (negative correlation).
Interestingly, in general there is not a large positive correlation among the variables, indicating that
countries did not move uniformly to tighter policies across the board. Rather there are a couple of
negative correlations larger than 0.4 in absolute values. They indicate that countries that tightened
their Requirements for Entry, in general restricted the access of immigrants to benefits to a lower
degree. Similarly, countries that were tougher on undocumented immigrants restricted access of
immigrants to benefits to a lower degree. This could be because by tightening the entry of
documented and undocumented immigrants the receiving countries planned to accept a selected
and smaller group of immigrants (the lucky few) that than could be allowed to participate in larger
measure to the benefits allowed to the citizens.
52
Figure 4.3 Average behaviour of the Immigration laws: 14 OECD countries, population weighted
Restrictions from benefits
0
0
Average 14 OECD Countries
1
2
Average, 14 OECD Countries
.5
1
1.5
2
3
Pro-skilled
1980
1985
1990
1995
2000
2005
1980
1985
1990
year
1995
2000
2005
2000
2005
year
Requirements for residency
0
-1
Average, 14 OECD countries
-.5
0
Average, 14 OECD Countries
.5
1
1.5
.5
2
Requirements for entry
1980
1985
1990
1995
2000
2005
year
1980
1985
1990
1995
year
Asylum
-1
-1
Average, 14 OECD countries
0
1
2
Average, 14 OECD Countries
-.5
0
3
.5
Undocumented
1980
1985
1990
1995
year
2000
2005
1980
1985
1990
1995
2000
2005
year
Note: Each variable is described in the text. It is obtained by cumulating the changes with respect to
each criterion from 240 immigration laws enacted in the considered OECD countries between 1980 and
2005.
4.2.3
Wage variables
In order to implement empirically regression [5] we use the average GDP per person in the country of
destination as a measure of the average wage, Wd. However, to implement regression [6] we need a
measure of the wage in the receiving country for the representative highly educated (tertiary
schooling) and for the representative less educated (primary schooling) individual. To construct these
53
wages we proceed as follows. From the World Income Inequality Database, 2008, (V2.0)14 we obtain
the Gini coefficient for each receiving country. We select only “high quality” observations (those
ranked 1 and 2) from that data set. If there are more than one value per country and year we
average them. There are some missing years for some countries that we fill by linear interpolation.
We also use the value in the closest (latest or earliest) available year to complete the series
backwards (to 1980) and forward (to 2004). This way, the 14 receiving OECD countries have a
complete series 1980-2004. Then, using the Gini coefficient, the average GDP per person and the
assumption of log-normal distribution of income per person in each country and year, one can
calculate the income per person at any percentile of the distribution.15
We then use the Barro and Lee (2000) data set that provides the share of population, 15 years and
older, with primary, secondary and tertiary education for years 1980, 1985, 1990, 1995 and 2000. We
interpolate those data to obtain yearly shares and we extend the 2000 share to 2005. We also
assume that the income per person of people in the country correlate exactly with their education so
that the bottom part of the income distribution is occupied by individuals with primary education,
the intermediate section contains individuals with secondary education and the top part of the
income distribution contains those people with tertiary education. By doing this we identify, for each
country and year, at which percentile of the income distribution is the median primary-schooleducated and at which percentile is the median tertiary-school-educated. For instance, if the
percentage of individuals with primary, secondary and tertiary schooling in a country are 50 per cent,
30 per cent and 20 per cent we infer that the person at the 20th percentile (from the bottom) is the
median "primary educated" individual and the person at the 85th percentile of the income
distribution is the median tertiary educated.
Using the formulas to calculate the individual income at any percentile (described above) we impute
the wage of median high- and less- educated person in each receiving country and in each year.
Those wages are, respectively, WHdt and WLdt that we use in the regressions below.
We also calculate the after-tax wage income that may be a more appropriate measure of available
income (incentive to migrate) and could differ significantly across countries if the degree of
progression of the taxes with income is different across countries. To calculate after-tax wage we use
the data on the average income tax rate from the OECD Tax Database (2008). Such rates, for each
country, are relative to year 2000 and we apply them to the whole period. In particular we apply to
the median, primary-educated individual the rate for a single worker with no dependents whose
earnings are 67 per cent of the average workers' earnings. To the median tertiary-educated worker,
we apply the rate for a single worker with no dependents whose earnings are 167 per cent of the
average workers' earnings.16 While such rates do not vary over time, they capture the very different
degree of progressivity of tax systems across countries. For instance, the average rate on the highly
educated group is 35.3 per cent for the US and 53.5 per cent for Germany.
4.2.4
Other variables
For the generosity of welfare benefits we use data on welfare spending per person (in thousands of
1995 US $) obtained from Mayda (2007). These data include the welfare spending for elderly and
Available at http://www.wider.unu.edu/research/Database/en\_GB/database/.
If per capita income y in a country is distributed according to the lognormal distribution (i.e. ln (y) is distributed as N(@, @)
then the relationship between the gini coefficient G and the standard deviation of the log-normal distribution is:
σ = 2Φ −1 ((G + 1) 2) where @ is the CDF of a Standard Normal distribution (N(0,1)). Then, defining as ZX= (x) the x
percentile of the N(0,1) distribution and as y the average per capita income income, the income at the x percentile of the
14
15
distribution is given by the following formula: y X = ye (σZ X −σ / 2 ) .
16
In both cases the tax rate includes income taxes net of benefits plus the empoloyer and employee payroll taxes.
2
54
survivors (both in cash and services), the benefits for families (in cash and services), the benefits for
injury, illness and disability and the benefits related to labour market hardship (such as
unemployment benefits and active labour market policies).17
For the labour market protection in the destination countries we use two measures: The ratio of
minimum to median wage (Minimum Wages) and an index measuring the degree of employment
protection in the country (Employment Protection Laws) that combines measures of stringency of
firing laws, dismissal laws, hiring laws and unemployment benefits. That index ranges between 0
(minimal protection) and 4 (maximum protection) with a standard deviation across countries around
1. The idea is that higher values of these variables imply stronger protection and bargaining power of
employees. Both variables have several missing values and they only cover the period 1980-2000.18
The variables are from Mayda (2007) who in turn follows the definitions of Elmeskov, Martin and
Scarpertta (1998).
Finally, we consider the amount of intra-mural R&D spending per person (in thousand of 2000 US $)
in our estimates, from the OECD-STAN database.
4.3
Regression results
We expect that the effect of wages is positive on total immigration and that the wage skill premium
has a positive and significant impact on high skilled immigrants. At the same time we expect that the
variable Pro-Skilled which captures immigration laws which favor high skilled immigrants relative to
others has a positive sign, while the Welfare Generosity variable should be more important to attract
less skilled immigrants and hence can shift the selection of immigrants towards the less educated.
Similarly, protective labor market institutions should be more relevant to attract less skilled
immigrants (hence possibly increasing total inflow but worsening the selection), while R&D intensity
should increase the skill intensity of immigrants with no clear effects on total immigration. Using our
data and the empirical specifications in [5] and [6] we set to find out whether these expectations are
supported by the analysis. As we are identifying the effects of destination-country variables on
immigration flows using the variation over time only and as some of these variables moved together
or did not change much, there are some issue of collinearity and large standard error when we
include many of these variables together. Hence our strategy is to begin with the variables found to
be more relevant by the literature (wages, after tax wages, immigration laws) and then include
different sets of variables one at the time keeping those that are significant in most subsequent
specifications.
4.3.1
Wages and geography
Table 1 shows the coefficient estimates for the basic specification of the total migration equation [5]
and for the selection equation [6].
Specifications (1)-(3) in Table 1 report the estimates of the coefficients on average wages in the
destination country and on some bilateral characteristics that potentially affect migration costs.19
The dependent variable is the natural logarithm of the total annual migration flow between country
o and country d. The bilateral variables included are a Land-Border dummy, a dummy for sharing the
same official language (Language), a dummy for having had colonial relations (Colonial) and the
natural logarithm of distance between the two countries.20
17
These variables only cover the 1980-2000 period and have some missing values.
Notice the reduced number of observations in Table 4.
19
Notice that while the total immigration regression includes the 0 cells the selection regression can be estimated only
using the non-zero immigration flows. Hence columns (4)-(6) are estimated on a reduced number of observations relative
to columns (1)-(3).
20
These bilateral data are from Glick and Rose (2002).
18
55
Specifications (4)-(6) report the estimated wage coefficient for the selection equation as well as the
effect of the bilateral characteristics on selection. The dependent variable of this regression is the
logarithmic difference in the flow of immigrants with tertiary and those with primary education.
The total immigration specifications confirm the findings in Ortega and Peri (2009). The average wage
(income per person) in the destination country is a very important determinant of total migration. An
increase of the average wage difference between the destination and the sending country by US $
1,000 (in 2000 PPP) would increase the migration flow by about 6 per cent.
Table 4.1
Basic Specifications: Effects of average wage and wage premia on total immigration
and the selection of immigrants, 14 OECD receiving Countries, 1980-2005
Regression:
Total Immigration:
Selection:
dependent variable log of total
dependent variable log difference
immigrant flows
immigration tertiary-primary education
Specification:
(1)
(2)
(3)
(4)
(5)
(6)
Average
Median After-tax
Wage
After-tax
After tax wage
wage
wage
median differential
wage
differentials,
wage
differentials
country pair
dummies
WAve
0.051**
0.063**
0.06**
destination
(0.001)
(0.014)
(0.012)
WTER-WPRI
0.01**
0.025**
0.04**
destination
(0.004)
(0.005)
(0.02)
Land Border
-1.55
-1.57
-1.57
-0.04
-0.11
n.a.
(0.99)
(0.97)
(0.97)
(0.26)
(0.27)
Language
0.48
0.57
0.56
0.74**
0.77**
n.a.
(0.53)
(0.51)
(0.51)
(0.19)
(0.19)
Colonial Ties
3.80**
3.56**
3.55**
-0.86**
-0.85**
n.a.
(0.54)
(0.53)
(0.53)
(0.24)
(0.24)
ln(distance)
-2.21
-2.21**
-2.22**
0.67**
0.58**
n.a.
(0.22)
(0.21)
(0.21)
(0.07)
(0.07)
Country-pair
No
No
No
No
No
Yes
dummies
Observations
22,662
22,662
22,662
5,486
5,486
5,486
Note: Specification (1)-(3) analyze the determinants of total migration flows. The dependent variable is the log of the
bilateral flow of migrants between country i and j. Specification (4)-(6) analyze the determinants of immigrant selection
between education levels. The dependent variable is the log difference of the bilateral flows of tertiary educated and
primary educated migrants. Observations are weighted by the population of the receiving country. All regressions include a
set of (74X25) country-of-origin by year dummies. Robust standard errors clustered by country-pairs are reported in
parentheses. **,* imply significance at the 5%-, 10% level.
Among the geographic and cultural distance variables we find that colonial ties have a positive and
significant effect and log distance has a negative and significant effect on total immigration
supporting our expectations. The other two variables are not significant, confirming the findings of
Ortega and Peri (2009). The estimates obtained using average wage (1), median wage (2) or after tax
median wage (3) are rather similar and the coefficient on the wage variable in the total immigration
equation is around 0.06.
More interesting, however, for the purposes of this chapter, are the effects of the explanatory
variables on the selection of immigrants. While the wage-premium effect is significant in all
specifications, it is significantly larger when we consider after-tax wages. In the specification using
after-tax wages and controlling for a full set of country-pair dummies (specification 6) the coefficient
56
is 0.04, implying that an increase in the tertiary-primary premium by US $ 1,000 (in PPP, 2000) would
increase the difference in flows of tertiary relative to primary educated by 4 log points.
This is not a small effect. For instance, an increase in that premium by US $ 18,000 (which equals the
average increase for the destination countries between 1980 and 2000) would increase the share of
the tertiary educated (at a given share of primary educated immigrants) from 30 per cent to 50 per
cent in the total immigration flows. This corresponds to 72 per cent of the initial value.
The other specifications find a smaller effect (between 1 and 2 log points for each increase in the
skill-premium by US $ 1,000). The estimated coefficient on the wage premium is in general smaller
than the estimated wage coefficient for the total migration regression. This may be due to some
attenuation bias in the selection equation. As we are taking differences between two imputed wages
both the imputation mechanism, as well as the difference between wages, certainly add
measurement error to the wage premium. We also confirm the findings of Grogger and Hanson
(2008) that the after-tax wage differentials (specifications 5 and 6) have a more significant coefficient
than the pre-tax differential (specification 4) in explaining selection. It is also interesting to comment
on the effect of bilateral geographic and cultural characteristics on the selection equation.
The coefficients on these variables should be interpreted as the differential effect on the flow of
highly educated, relative to the flow of less educated immigrants. Hence a positive coefficient implies
an increase in the relative selection of highly educated. First, sharing the same language significantly
increases the selection of highly educated among immigrants, while the presence of colonial ties
significantly decreases it. These results make sense as highly educated immigrants are usually
employed in occupations where knowledge of the local language is important while less educated
work in more manual and physical types of jobs. Hence language differences are more costly for
highly than for less educated migrants. At the same time colonial ties may be linked to preferential
immigration policies towards less educated. Distance is positively related to selection, as on average
highly educated tend to migrate to farther countries because of their better knowledge of career
opportunities and international professional networks. Finally sharing a land border has no significant
effect on the selection of migrants.
4.3.2
Immigration Laws
In the next step we analyze the effects of different legal immigration policies on total migration and
on the selection of highly educated immigrants. Table 2 reports the estimates of the coefficients in
equation [5] and [6] once we include the six variables capturing different features of the immigration
laws. Specifications (1) and (2) include all the immigration-law variables while specifications (3) and
(4) only include those that turn out to be statistically significant. As usual in each regression (both for
total immigration and selection) we include a full set of country-of-origin by year dummies to capture
all the push-factors and their differential impact on more and less educated migrants. Looking at the
impact of laws on the total inflow of immigrants we find that most of them have the expected
qualitative effect but not all of them are significant. Requirements for entry, Requirements for
residence and Undocumented do not have much of an impact on total immigration flows (or on its
skill intensity). The first two variables capture some procedural features that may not affect much
the cost of migrating anyway. The last variable may discourage undocumented immigration. Since we
focus on legal immigration here, this variable may have little effects on documented immigration
flows.
To the contrary, a significantly negative impact is associated with Restriction from Benefits and
Asylum. These two variables may signal more substantially the policy stance of a country towards
immigration. In particular, restricting the access of benefits to immigrants and imposing some extra
requirements (of registration and limited mobility) may imply less favourable conditions for them
and long-term costs that discourage their inflow. Moreover a tough stance on political refugee
57
(asylum), as it has a large international visibility, may strongly signal the policy stance of the receiving
country on immigrants in general. The provisions restricting access of immigrants to benefits may be
more likely to affect immigrants in the low income range (primary educated). The positive and highly
significant coefficient on the Restriction from Benefits variable in the selection equation confirms this
expectation strongly. Reducing the access to benefits significantly changes the composition of
immigrants towards more tertiary educated individuals.
Table 4.2
Effect of immigration laws on total immigration and selection by education
All immigration laws
Only statistically significant laws
Dependent variable:
WAve destination
(WTER-WPRI ) destination,
after tax
Requirements for entry
(1)
Total Immigration
0.054**
(0.020)
(2)
Selection
Bilateral Controls
0.01
(0.03)
-0.04
(0.05)
-0.07**
(0.03)
-0.09**
(0.04)
-0.02
(0.02)
-0.08
(0.05)
Yes
0.015*
(0.004)
-0.01
(0.03)
-0.01
(0.03)
0.08**
(0.02)
0.02
(0.02)
-0.02
(0.02)
0.11**
(0.02)
Yes
Observations
22662
5419
Requirements for residence
Restrictions from benefits
Asylum
Undocumented
Pro-Skilled
(3)
Total Immigration
0.051**
(0.019)
(4)
Selection
-0.08**
(0.03)
-0.09**
(0.04)
0.08**
(0.03)
0.016**
(0.005)
Yes
0.12**
(0.02)
Yes
22662
5419
Note: Specification (1) and (2) analyze the determinants of total migration flows. The dependent variable is the log of the
bilateral flow of migrants between country i and j. Specification (2) and (4) analyze the determinants of immigrant selection
between education levels. The dependent variable is the log difference of the bilateral flows of tertiary educated and
primary educated migrants. The explanatory variables are lagged one year. Observations are weighted by the population of
the receiving country. All regressions include a set of (74X25) country-of-origin by year dummies. Robust standard errors
clustered by country-pairs are reported in parentheses. **,* imply significance at the 5, 10% level.
The only other immigration law that has a significant impact on the selection of immigrants is the
Pro-Skilled variable which explicitly captures immigration policies favouring immigration of highly
educated. On average, passing a Pro-Skilled law resulted in the increase of the share of highly
educated immigrants by 12 percent (for instance from 30 to 33 per cent of the total). Note that the
Pro-Skilled variable is here derived from all legal changes and covers mainly incremental changes in
the legal framework for high skilled immigrants.
Laws increasing the tightness of entry, of residence requirements, the tightness of procedures to
obtain asylum and tightness towards undocumented do not seem to have much of an effect on the
selection of immigrants. Again, those laws may be affecting procedures for immigration but not
altering the substantial cost of immigration for potential migrants. To the contrary, Restriction from
Benefits may have a strong real (and perceived) effect in discouraging less educated immigrants
hence resulting in a negative overall effect and a positive selection effect.
58
All in all, in terms of the immigration of highly educated we can say that Pro-Skilled immigration laws
seem to have a noticeable positive impact on their inflow and laws restricting the benefits of
immigrants also promote selection of highly educated. These last types of restrictions, however, also
discourage total immigration so that the actual volume of highly educated immigrants may not
increase.
Table 4.3
Effect of welfare generosity on total immigration and selection by education
WAve
destination
(WTER-WPRI )
destination,
after tax
Welfare
spending
per person
Old age
spending
per person
Unemployment/
labour market
spending
per person
Spending for
family welfare
per person
Spending for
disability per
person
Bilateral
controls
Observations
Total Welfare Spending
(1)
(2)
Total
immigration
Selection
0.09**
(0.02)
0.03**
(0.008)
0.77**
(0.26)
-0.20**
(0.08)
Controlling for
Immigration Laws
(3)
(4)
Total
immigration Selection
0.09**
(0.02)
0.02**
(0.008)
0.73**
(0.16)
Welfare Spending by
category
(5)
(6)
Total
immigration Selection
0.08*
(0.03)
0.02**
(0.007)
-0.02
(0.08)
0.98**
(0.37)
-0.67**
(0.15)
0.83*
(0.46)
-0.89**
(0.18)
-0.06
(0.34)
0.16
(0.17)
0.60
(0.68)
0.24
(0.34)
Yes
Yes
Yes
Yes
Yes
Yes
8662
5419
8662
5419
8662
5419
Note: Specifications denoted with "Total" report the effect of the variables on the log of total bilateral flows. Specifications
denoted as "Selection" report the effects of the variables on the logarithmic difference of immigrant flows of tertiary and
primary educated. Welfare spending is in 1995 PPP US dollars. The source of the data is OECD (2001). Observations are
weighted by the population of the receiving country. All regressions include a set of (74X25) country-of-origin by year
dummies. Robust standard errors clustered by country-pairs are reported in parentheses. **,* imply significance at the 5,
10% level.
59
4.3.3
Welfare generosity
A very common worry, especially in Europe where the generosity of the welfare state is larger than in
the US, is that immigrants are attracted by larger welfare transfers. Moreover, among them, less
educated immigrants should be more subject to the attraction of a generous welfare-state. We check
here whether these claims are founded.
We first enter, in equations [5] and [6], the variable "welfare spending per person" as the total of all
its component specifications (1) to (4) and then we enter separately four components, divided into
"old age benefits", "family-related benefits", "disability and injury benefits" and "labour market
related benefits". Our goal is to analyze the impact of such spending on the total immigration and on
the selection, controlling or not for immigration laws.
Column (1) and (2) identify the effect of welfare spending on total immigration (+0.77) and on the
selection (-0.20). Both effects are significant, implying that more welfare spending attracts larger
flows of immigrants and a larger share of less educated. While the effect on total flows is robust to
the inclusion of immigration laws, the selection effect is not. It disappears (coefficient of -0.02 with a
standard error of 0.08) when we control for the significant legal immigration variables. This implies
that welfare generosity is generally not associated with countries which have pro-skilled immigration
laws in place. Moreover, countries that move towards more pro-skilled immigration laws also seem
to move away from welfare generosity. When we decompose the welfare spending into its
categories we see that the unemployment/labour market spending and the old age welfare spending
are the most relevant variables for increasing immigration (as well as increasing the share of the less
educated). Protection against labour market uncertainty and for old age may thus be particularly
valuable to immigrants and may reduce some of the costs associated with residing aboard. Notice
also that the inclusion of welfare variables does not decrease (possibly it increases) the importance
of average wages in affecting total immigration and the selection of immigrants.
4.3.4
Labour market institutions
Table 4.4 presents our findings on how labour market institutions and employment protection in the
receiving country affect total immigration and its composition. We analyze the impact of labour
market protection on total immigration and on its selection by estimating the usual specifications [5]
and [6] including, alternatively, only the labour market laws (specification 1 and 2), those laws and
average welfare spending per person (specifications 3-4) and those two sets of variable plus
immigration laws (in specifications 5-6 that do not report, however, the coefficient on immigration
laws). Recall that we use two measures for labour market protection, the ratio of the minimum to
the median wage (minimum wage) and the tightness of the employment protection legislation
(employment protection laws).
Interestingly enough, the results show that stronger labour market protection (high minimum wage
and high value of the index for employment protection) are associated with lower immigration flows
when those variables are included by themselves. Employment protection laws also show a negative
impact on the selection by education, while that of the minimum wage is insignificant. Wage levels
still have the usual very significant effect. Countries that increased the protection of insiders in
labour markets (with higher minimum wage or more protective laws) are likely to provide worse
employment opportunities to immigrants than countries with less protective and more competitive
markets, hence the negative effect on total flows. At the same time, stronger employment protection
may be relatively more important for less educated, hence the negative selection effect of this
variable. The effects of labour market institutions, however, are not very robust. Including the
welfare spending as a control eliminates the effect of employment protection laws on total
immigration, while the minimum wage variable becomes positive and significant in the selection
60
equation. Controlling for immigration laws further reduces the effect of labour market institutions on
total immigration.
Table 4.4
Effect of labour market regulation on total immigration and selection by education
Labour market laws
Labour market laws and
Controlling for
welfare
immigration laws
(1)
(2)
(3)
(4)
(5)
(6)
Total
Selection
Total
Selection
Total
Selection
immigration
immigration
immigration
WAve destination
0.08**
0.09**
0.08
(0.02)
(0.02)
(0.03)
(WTER-WPRI )
0.02*
0.01
0.01
destination
(0.006)
(0.006)
(0.07)
after tax
Minimum wages
-4.33**
0.88
-3.55**
1.44**
-2.88**
1.64**
(1.09)
(0.75)
(1.10)
(0.65)
(1.40)
(0.69)
Employment
-0.36*
-0.57**
0.47
-0.55**
0.10
-0.54**
protection laws
(0.20)
(0.07)
(0.41)
(0.08)
(0.33)
(0.09)
Welfare spending
0.42
-0.08
0.41
-0.08
per person
(0.31)
(0.09)
(0.31)
(0.09)
Bilateral controls
Yes
Yes
Yes
Yes
Yes
Yes
Observations
6544
2376
6486
1689
6387
1689
Note: Specifications denoted with "Total" report the effect of the variables on the log of total bilateral flows. Specifications
denoted as "Selection" report the effects of the variables on the logarithmic difference of immigrant flows of tertiary and
primary educated. The variable "Minimum Wage" is the ration of the minimum wage to the median wage in the receiving
country for each year. The variable "Employment Protection Laws" is an index that captures the extent of Pro-employee
provisions in the labour market laws, including how hard it is to fire or dismiss a worker, how generous is the
unemployment system. The source of the data is Mayda (2007)). Observations are weighted by the population of the
receiving country. All regressions include a set of (74X25) country-of-origin by year dummies. Robust standard errors
clustered by country-pairs are reported in parentheses. **,* imply significance at the 5, 10% level.
All in all, however, we estimate a significant negative effect of minimum wage on total immigration
in all regressions and a negative selection effect of employment protection laws. The qualitative
result emerging from these coefficients is that stronger bargaining power of labour in the receiving
country discourages immigration and at the same time makes the share of less educated among
immigrants larger.
4.3.5
R&D spending
Finally, we inquire into the effect of research expenditures in the receiving country on the selection
of immigrants. As many occupations that employ highly educated workers are in the high-tech
sectors and research and development in the recent decades have produced innovations that are
"skill-biased" we expect countries with large R&D spending to produce more opportunities and
provide more jobs for highly educated immigrants. While part of the skilled-biased nature of
technology in a country is captured by the wage premium (always controlled for in the selection
equation), R&D spending may directly generate scientists and engineering type of jobs or endow
them with better conditions and resources. For instance, the world-class quality of many universities
and laboratories in the US and UK have been for a long time an extremely strong factor for attracting
international talent. R&D resources may generate incentive for talented individuals to immigrate and
create jobs that employ more of them.
61
Table 4.5
Effect of R&D intensity on total immigration and selection by education
WAve destination
(WTER-WPRI ) destination
R&D spending per person
Tightness of access to
benefits for Immigrants
Tightness of Asylum
Including R&D spending per
person
(1)
(2)
Total immigration
Selection
0.07**
(0.02)
0.03**
(0.005)
-2.43**
(0.83)
1.29**
(0.33)
Pro-Skilled preference
Bilateral Controls
Observations
Controlling for immigration laws
(5)
Total immigration
0.07**
(0.02)
(6)
Selection
-2.33**
(0.86)
-0.03
(0.04)
-0.11**
(0.04)
0.23
(0.35)
0.05
(0.04)
0.01
(0.006)
Yes
Yes
Yes
0.19**
(0.02)
Yes
20335
5320
20335
5320
Note: Specifications denoted with "Total" report the effect of the variables on the log of total bilateral flows. Specifications
denoted as "Selection" report the effects of the variables on the logarithmic difference of immigrant flows of tertiary and
primary educated. The Variable R&D spending per person is in 2000 PPP US Dollars. The source of the R&D data is OECD
STAN database Observations are weighted by the population of the receiving country. All regressions include a set of
(74X25) country-of-origin by year dummies. Robust standard errors clustered by country-pairs are reported in parentheses.
**,* imply significance at the 5, 10% level.
Hence, we include in our basic regressions the amount of intra-mural R&D spending per person (in
thousand of US $ 2,000) and we estimate its effect on total immigration and selection. Specifications
(1) and (2) of Table 4.5 show that higher R&D spending is associated with lower total immigration
and stronger selection of highly educated. The effect on selection is very large: increasing R&D per
person by US $ 100 would increase the share of immigrants with tertiary education (given the share
with primary education) by 12.9 per cent of its initial value. This effect, however, is not robust to the
inclusion of the immigration legislation. The effect of the pro-skilled immigration laws ends up
absorbing most of the effect of R&D spending per person such that the R&D variable becomes
insignificant in specification (4). This may signal that those countries with higher research spending
have also been more aggressive in pursuing Pro-skilled immigration policies, so that once we control
for the second, the first variable is not very significant. Interestingly enough, the negative effect of
R&D spending on total immigration stays significant even after controlling for immigration laws.
4.4
Discussion and conclusions
Our exploration into the determinants of the international flows of highly educated migrants has
been pursued by way of estimating a total immigration equation and a selection equation much like
Grogger and Hanson (2008). However, the panel structure of our data set and the consideration of a
rich set of explanatory variables enabled us to employ a full set of country of origin by year effects
which absorb time and sending country specific factors and to examine the factors which drive the
immigration of highly skilled individuals in more detail than the previous literature.
We find that the average after-tax wage difference between the receiving and the sending country
affects heavily the overall scale of migration, while the after-tax wage premium for the tertiary
62
educated is quantitatively the main economic determinant for the selection of highly educated
individuals. An increase of the skill premium for tertiary education by US $ 10,000 increases the share
of tertiary educated immigrants between 20 and 40 per cent of its initial value.
Moreover we find consistently that the changes in the immigration legislation which favours highskilled immigrants relative to less educated ones are among the most important and robust
correlates which affect the positive selection of immigrants. Interestingly enough, we also find that
laws limiting the access of immigrants to welfare benefits and increasing the restrictions for
residence permits or the requirements for political asylum is associated with lower immigration, in
particular of the less educated, producing a smaller total inflow of immigrants and a stronger
selection bias of the immigrant population towards the highly educated.
We then directed our attention to three types of variables that may have an important impact on the
selection of high-skilled immigrants: The generosity of welfare benefits, the degree of employment
protection and labour market regulation and the intensity of R&D spending in receiving countries. On
the one hand, we find some evidence that more generous welfare transfers increase the number of
total immigrants and increase the share of less educated among them. This would be consistent with
the idea that some of the less educated immigrants are attracted by the generous welfare transfers
of some receiving economies but the more educated are not. On the other hand, higher labour
market protection reduces immigrants overall and has only a mixed impact on immigrants selection.
Both effects, moreover, are not very robust. In particular, they tend to disappear if we include the
immigration law variables into the regressions. Finally, countries with higher R&D spending per
person attract more highly educated immigrants. Again this result is rather weak to the inclusion of
immigration laws implying that more pro-skilled immigration laws may be associated with countries
with higher R&D. Throughout the analysis, the average wage (in determining total immigration) and
the wage premium (in determining the selection) have a positive and significant effect.
Thus, we can conclude that the after-tax wage premium and immigration policies which favour the
high skilled immigrants relative to other ones seem to by strongly correlated with the share of highly
skilled individuals in the immigrant population. This turned out to be robust in many specifications of
our estimation model. Less robust are the findings with respect to the generosity of the welfare
benefits, the level of the minimum wage and of employment protection, as well as the level R&D
spending, although they seem to affect the skill-selection of the immigrant population also in the
expected ways.
Due to the aggregate and noisy nature of the data and to the possibility of omitted variable bias one
would want to interpret our results with caution. However, the wage and immigration laws effect, as
they confirm our priors and are quite robust may truly reveal a causal effect on immigration flows.
Annex Figures and Tables
Panel A4.1: Immigration Rates 1980-2005
Belgium
0 .1 .2 .3 .4 .5 .6 .7 .8 .9 1
0 .1 .2 .3 .4 .5 .6 .7 .8 .9 1
Australia
1980
1985
1990
1995
2000
2005
1980
1985
1990
year
1995
2000
2005
2000
2005
2000
2005
2000
2005
year
Gross Flows
Gross Flows
Denmark
Canada
0 .1 .2 .3 .4 .5 .6 .7 .8 .9 1
1
.8
.6
.4
.2
0
1980
1985
1990
1995
2000
1980
2005
1985
1990
year
year
1995
Gross Flows
Gross Flows
France
0 .1 .2 .3 .4 .5 .6 .7 .8 .9 1
0 .1.2.3 .4.5.6 .7 .8.9 11.11.21.31.41.5
Germany
1980
1985
1990
1995
2000
2005
1980
year
1985
1990
1995
year
Gross Flows
Gross Flows
Luxembourg
-.1 0 .1 .2 .3 .4 .5 .6 .7 .8 .9 1
0 .2 .4 .6 .8 1 1.21.41.61.8 2 2.22.42.62.8 3
Japan
1980
1985
1990
1995
2000
2005
1980
1985
1990
1995
year
year
Gross Flows
Gross Flows
64
Panel A4.1: Immigration Rates 1980-2005 (cont.)
Netherlands
0 .1 .2 .3 .4 .5 .6 .7 .8 .9 1
0 .1 .2 .3 .4 .5 .6 .7 .8 .9 1
Norway
1980
1985
1990
1995
2000
2005
1980
year
1985
1990
1995
2000
2005
2000
2005
2000
2005
year
Gross Flows
Gross Flows
Switzerland
0 .1 .2 .3 .4 .5 .6 .7 .8 .9 1
0 .2 .4 .6 .8 1 1.2 1.4 1.6 1.8 2
Sweden
1980
1985
1990
1995
2000
2005
1980
1985
1990
1995
year
year
Gross Flows
Gross Flows
0 .1 .2 .3 .4 .5 .6 .7 .8 .9 1
United States
0 .1 .2 .3 .4 .5 .6 .7 .8 .9 1
United Kingdom
1980
1985
1990
1995
2000
2005
1980
1985
1990
1995
year
year
Gross Flows
Gross Flows
65
Table A4.1
List of the countries of origin of migrants for the bilateral migration data
Countries of Origin
Algeria
Ghana
Austria
Guatemala
Australia
Nigeria
Greece
Norway
Bangladesh
Belgium
Guyana
Haiti
Peru
Philippines
Brazil
Hong Kong
Portugal
Cambodia
Iceland
Russian Federation
Chile
Iran
Somalia
Colombia
Ireland
South Korea
Bosnia-Herzegovina
Bulgaria
Canada
China
Croatia
Cuba
Cyprus
Honduras
Hungary
India
Iraq
Pakistan
Poland
Romania
Slovenia
South Africa
Italy
Spain
Japan
Suriname
Jamaica
Sri Lanka
Denmark
Kenya
Sweden
Ecuador
Lebanon
Tunisia
Ethiopia
Mexico
UK
Dominican Republic
El Salvador
Laos
Malaysia
Thailand
Turkey
Fiji
Morocco
USA
France
New Zealand
Zaire
Finland
Germany
Netherlands
Nicaragua
Vietnam
66
Table A4.2
country
Australia
Belgium
Canada
Denmark
France
Germany
Japan
Luxembourg
Netherlands
Norway
Sweden
Switzerland
UK
USA
Percentage of immigrants with tertiary education, 14 OECD Countries 1985, 1995
and 2005
1985
49%
5%
54%
12%
6%
6%
38%
21%
17%
24%
19%
16%
25%
44%
1995
52%
19%
61%
17%
21%
22%
36%
20%
17%
25%
23%
21%
35%
44%
2004
58%
23%
63%
22%
19%
29%
33%
22%
24%
29%
30%
25%
42%
44%
Note: The percentage of immigrant with at least some tertiary education is calculated by imputing to each
inflow of migrants from a specific country of origin the educational composition of the stock of migrants in the
receiving country from that country of origin. The original data on the education of the stock of immigrants in
1990 and 2000 is from Docquier (2007) and the data on the total inflow of immigrants for each origindestination pair by year are from the OECD International Migration Database.
Table A4.3
Correlation matrix for the immigration laws (14 countries, 1980-2005)
Requirements
for Residence
Restrictions
from Benefits
Undocumented
Asylum
Pro-Skilled
Requirements
for Entry
-0.15
Requirements
for Residence
-0.44
-0.06
0.29
0.24
-0.27
-0.22
0.05
-0.20
Restrictions
from Benefits
-0.43
-0.27
0.32
Undocumented
Asylum
0.13
-0.05
-0.20
Note: Each Immigration law variable is standardized to be 0 in each receiving country in 1980.
67
5
The effects of immigration and the brain gain on growth, investment and
employment: Evidence from the OECD 1980 - 2005
This chapter examines the impact of the immigration of highly educated workers on employment,
productivity and capital accumulation in the receiving economy. We adopt a strategy similar to
Ortega and Peri (2009)21 here, who use a production function framework for identifying the
migration effects in a cross-country setting. Since we are interested mainly in the impact of high
skilled immigration here, we augment their framework by considering the share of the highly
educated, besides the total flow of immigrants, as measure of brain gain in the receiving country.
We decompose the immigration effects into an effect of total immigration and an effect of the "brain
gain", measured as the share of tertiary educated among immigrants. In order to isolate supplydriven changes in total immigration flows and in their composition we use the push-factors
interacted with bilateral migration costs (both identified in the regressions of chapter 4) as
instruments. As total migration and skilled migration are very different across sending countries and
bilateral costs affect those two quite differently (for instance common language increases the skill
intensity but does not affect total flows, and distance affects negatively total migration but increases
skill selection) the predicted flows using these variables are very different between total migration
and skill-intensive one. Using these constructed (push-driven) migration flows aggregated by
receiving country in a 2SLS approach we then estimate the impact of these flows on employment,
capital, total factor productivity as well as the aggregated effect on income per capita in 14 OECD
receiving countries. As we use an instrumental variable strategy, aimed at isolating the push-driven
immigration flows, we will refer to the estimated elasticities as “effects” of immigration. Obviously
there are some caveats in our identification strategy that the reader may want to keep in mind. We
will refer to them at several points of the chapter.
Our approach is based on the idea that the aggregate production function of the receiving country
can be affected by the inflow of immigrants and by their skill composition in at least three ways. First,
immigrants increase the total labour supply and may at the same time either crowd-out some natives
or attract them into employment (if they provide jobs complementary to those of natives and
stimulate productivity and specialisation). Hence we need to estimate their total impact on
employment combining their direct contribution and the effect on native employment. Second, they
may trigger higher investment as marginal product of capital is increased due to the increase in
labour supply. Also as highly educated immigrants may work in more capital intensive sectors, or may
use capital-complementary techniques the composition of immigrants (brain gain) may have an
impact on capital accumulation and capital intensity in the short and long run. Finally, Immigrants
may either crowd some fixed factors of production and/or they may add to the varieties of ideas and
products in the receiving economy; depending on which of these effects prevail this may result in
higher or lower total factor productivity. A positive (negative) productivity effect may even manifest
itself, if labour supply responds to wages, in higher (lower) employment-rate and capital investment,
rather than higher total factor productivity (TFP). Increased productivity may attract new workers
from the total population of natives, into the labour force up to the point where wage and return to
capital are equalized to pre-migration levels. Another way of saying this is that immigrants may
contribute at the "intensive margin" affecting the productivity per unit of labour, or at the extensive
margin affecting the amount of native labour relative to population employed in production.
For this reason we analyze the impact of immigrants on labour supply, capital supply and productivity
separately and we consider the total immigration rate and the share of tertiary educated among
immigrants as joint determinants of each component.
21
We thank Francesc Ortega for allowing us access and use of the data on labour inputs, capital and productivity that are
used in the empirical analysis of this chapter.
68
To anticipate our main findings, we identify a robust and significant positive effect of highly educated
immigrants on native employment and capital accumulation, on top of the effect produced by the
total immigration rate. Confirming Ortega and Peri (2009) we find that the total inflow of immigrants
does not crowd out native employment and stimulate investment maintaining a constant capitallabour ratio even in the short-run. Moreover, the share of highly educated adds a positive
employment and capital accumulation effect. This indicates, on the one hand, that highly educated
immigrants may stimulate investment incentives of natives or induce specialisation in capital
intensive sectors. On the other hand, the stimulus to job creation may be a sign that highly educated
immigrants provide complementary production jobs to natives that attracts more of them into the
labour force. We also find that the positive effects on employment and capital from the “brain gain”
(the share of high skilled in the immigrant workforce) are stronger in the long-run than in the shortrun. It may take some time to the productive structure to adjust to the optimal specialisation
structure and to take advantage of the skills of immigrants.
Against the background of the current global downturn, we also analyse whether the effects of
migration differ in “bad” economic times (output gap below -1 per cent) relative to “good” times.
Interestingly enough, we find that the employment and investment effects of immigration have a
similar size in bad economic as in good economic times when the brain gain takes place. This
suggests that brain gain can be an effective stabilizing measure that could be used to provide some
stimulus in periods of slow demand.
Finally, in spite of some existing evidence (mainly relative to the US) that immigrants contribute
significantly to innovation and technological progress (e.g. Hunt and Gauthier-Loiselle, 2008, and
Lincoln and Kerr 2008) we do not find significant effects that immigration rates and the brain gain
contribute significantly to the aggregate TFP of the receiving country. As we stated above, however,
the employment-capital effect can be seen as a productivity effect that expand the total production
per unit of population in the country. Confirming this we find that total immigration increases GDP
per worker, and that the “brain gain” substantially contributes to increase the average gains from
immigration in the receiving country.
Our identifying strategy relies on the fact that we identify variation of skilled migration in the
receiving country, driven by sending-countries effects that are uncorrelated with receiving country
economic conditions. Shocks that affect some specific regions that include both sending and
receiving countries, and increase migration as well as employment and investment in the receiving
country may generate a positive bias in our estimates. While we have re-estimated our effects
excluding some close countries (such as US-Mexico) that may be subject to similar shocks, we could
explore the robustness of our results further.
5.1
A production function framework
In order to evaluate the impact of immigration and brain gain on the receiving economy's
employment, capital accumulation and productivity we use an aggregate production function
framework, akin to the one used in growth accounting. Suppose that total GDP in each destination
country, d, and year, t, denoted as Ydt, is produced using a labour input represented by total hours
worked, Ldt (that in turn can be decomposed into (employment)dt times (hours per worker)dt),
services of physical capital represented by Kdt and total factor productivity Adt. Using the popular
Cobb-Douglas production function yields
Ydt = Adt K dtα L1dt−α
,
[1]
69
where α is the capital income share and can be approximated for the destination countries in our
sample by 0.33. If we intend to analyze how immigration flows affects income or wages (marginal
productivity of labour) in such a framework, we need to identify first how immigration affects the
supply of each input and total factor productivity. Then we can combine the effects of immigration
using the implications of the model. Specifically, the percentage changes in total real GDP, Ydt, is
given by
∆Ydt ∆Adt
∆K dt
∆L
=
+α
+ (1 − α ) dt
Ydt
Adt
K dt
∆Ldt
[2]
The percentage change in real GDP per person in the receiving country is hence simply given by
∆Ydt Ydt − ∆Pop dt Pop dt . If we can identify the percentage changes in Adt, Kdt, and Ldt in response
to exogenous immigration and brain gain flows to the country we will be thus able to evaluate the
impact of immigration on total income, capital per worker, labour productivity and also to derive the
effects on GDP per person.
Clearly, immigration flows directly affect labour input Ldt by adding potential workers. However, the
increase in employment may be less than one-for-one if immigrants displace native workers or larger
than one if they stimulate employment in complementary jobs. There is still disagreement in the
literature about the effect of immigrants on employment. In addition, there may also be additional
effects stemming from the skill composition of immigrants. If highly educated are likely to contribute
to entrepreneurship and innovation and this increases labour demand the brain gain may also
further increase the employment opportunities of natives.
Regarding the capital input, standard neoclassical models with endogenous capital accumulation
imply that immigration-induced increases in the labour force will generate investment opportunities
and greater capital accumulation, up to the point that the marginal product of capital returns to its
pre-shock value. However, the short-run response of the capital stock to an international
immigration flow can be less than complete and it has yet to be quantified empirically. Moreover the
inflow of highly educated, if there are complementarities between high skills and investments (as in
Acemoglu, 1998), may further stimulate investments potentially increasing the capital-labour ratio of
the receiving economy.
Concerning TFP, on the one hand immigrants and particularly highly educated ones may promote
specialisation/complementarities (Ottaviano and Peri 2008) which increase the set of productive
skills (Peri and Sparber, 2009) and increase competition in the labour markets, generating efficiency
gains that increase TFP. On the other hand, it is also possible that immigration induces crowding of
some fixed factors (such as space and land) or the adoption of less "productive", unskilled-intensive
technologies (as in Lewis 2005) that would lead to reductions in the measured TFP. Let us emphasize
that each of the above channels may have an impact on employment rates, instead of TFP, if people
respond to higher wages by joining (and leaving) the labour force.
Ultimately, it is an empirical question whether an immigration shock increases, decreases or does not
affect employment, capital intensity and TFP. Let us denote by (∆ Fdt/Popdt) the immigration rate in
destination country d and year t, namely the change in the foreign-born population Fdt over the year t
(immigration flows to country d in year t) relative to the total population of country d at the
beginning of year t (Popdt). This is the measure of total immigration intensity. Let us also denote with
hFdt the share of tertiary educated individuals in the immigrant population of country d in year t. That
is our measure of the “brain gain” in country d, which is sometimes also referred to as the skillintensity of immigrants.
70
Based on these definitions, we estimate the following regressions for identifying the effects of total
immigration and the brain gain:
∆X dt
∆Fdt
= Dt + γ X
+ β X hFdt + edt ,
X dt
Pop dt
[3]
where the variable X is a place-holder that will be, alternatively, total hours worked (Ldt),
employment, services of physical capital (Kdt) and total factor productivity (Adt). We also analyze
directly the effect of (∆ Fdt/Popdt) and hFdt on capital per worker (that affects wages) and on output
per person (that is affected by all terms in the decomposition plus population growth). The term Dt
captures a set of year fixed effects that absorb common movements in productivity and inputs across
countries in each year.
In order to assure that the estimated coefficients γX and βX identify the causal effect of immigration
and brain gain on the domestic variables we will instrument the total immigration flows and the
share of tertiary educated in the immigrant population with the sum of bilateral flows to that country
as predicted by the pseudo-gravity model which we have presented in Chapter 3 thereby excluding
all variables relative to the destination country.
Essentially we predict the flows of immigrants and their share of tertiary educated for each bilateral
relation using only the components included in the gravity regression that vary by country of origin
and time interacted with the fixed bilateral migration costs. We then sum those predicted flows for
all countries of origin and the same destination country. Similarly we average the predicted shares of
tertiary educated from all countries of origin into the same destination country. The exact procedure
to construct the instruments is described in section 5.3.2 below.
5.2
Data on employment, capital Intensity and productivity
The data on income and factors of production stem mostly from OECD data sets. Specifically, GDP
data is from the OECD Productivity data set, and employment and hours worked are from the OECDSTAN database. The data cover the whole period 1980-2005 for the 14 countries in our sample22. The
capital services data are also from the OECD Productivity data set, extended using measures of
investment rates from the Penn World Tables (version 6.2) to cover the 25 years and 14 countries
considered. The conceptually preferred measure of capital that we use is the services of the capital
stock that contribute to current production. Those are calculated by constructing separately each
type of capital (six or seven, depending on the country), accumulating past investments and adjusting
older units so that they provide fewer services than newer ones (efficiency weighting) and
accounting for the productive life of each type of capital (retirement pattern). We then aggregate
across all types of capital using the relative productivity of each type to obtain the stock of
productive capital. The capital services data reported by the OECD is a rate of utilisation of the stock
of productive capital and it is interpreted as the flow of capital services that went into production
during that period. We need to do some further imputations and interpolations/extensions in order
to cover all our countries for the full 1980-2005 period. Those are described in detail in Ortega and
Peri (2009).
Equipped with a full panel for real GDP and labour and capital inputs, we compute total factor
productivity as a Solow residual, imposing a labour share of 0.66 and using total hours worked and
22
These data are the same as those used in Ortega and Peri (2009) and they are described there in greater detail.
71
capital services as the inputs into production23. Annex Table A 5.1 reports annualized growth rates of
these variables for three sub-periods: the 1980s, the 1990s, and 2000-2005. Three features stand
out. First, there is a noticeable slowdown in economic growth between 1980 and 2005 for our
sample of OECD countries. In the three sub-periods real GDP grew annually by 2.72 per cent, 2.62 per
cent, and 1.98 per cent, respectively. The slowdown is also noticeable in terms of lower employment
growth (from 0.68 per cent to 0.34 per cent), lower capital growth (from 3.43 per cent to 3.11 per
cent), and lower TFP growth (from 1.14 per cent to 0.73 per cent). Note also the large cross-sectional
dispersion. Secondly, average employment growth was substantially higher than average growth in
total hours worked between 1980 and 2005. That is, hours per worker on average fell during the
period. Finally, capital intensity on average increased substantially over the period. The average
annual growth in capital services (in real terms) was roughly three times as large as the annual
growth rate in employment.
5.3
The effects of immigration and brain gain
5.3.1
OLS estimates
Table 5.1 presents the estimates, using least squares methods, of the coefficients γX and βX from
equation (3). The dependent variables are, in row order, the inputs to production (total hours
worked L, employment, and capital K ), capital per worker, total factor productivity (A), and GDP per
person. Notice that not all the estimated coefficients are independent of each other due to the
relationship between inputs and output provided by the production function. Hence, for instance,
the estimated coefficients on (Δ capital per worker/capital per worker) in the fourth row should be
equal to the difference between the coefficients on ΔK/K and the one on (ΔEmployment/
Employment).
Since we regress the percentage change of the dependent variable on the inflow of immigrants as a
percentage of the initial population, and on the share of highly educated the quantitative
interpretation of the coefficients is straightforward. The coefficient γX captures the elasticity of each
variable to immigration as per cent of population. Hence a value of 1 for change in employment
imply that one percent increase in population due to immigrants provide 1 per cent extra
employment. This would mean that immigrants have an employment rate similar to natives and do
not crowd out natives in employment. A value smaller than one would imply that immigrant displace
some native workers from the labour force. To the contrary, a value larger than one would imply that
immigrants attract some native workers into the labour force. The coefficient βX captures the extraeffect of tertiary educated for given total inflow of immigrants. An increase of the share of tertiary
educated by 1 per cent would affect the change in the dependent variable X by βX per cent.
The different columns in Table 5.1 correspond to different samples and specifications. The estimates
of γX are reported in the columns denoted as "immigration rates" while the estimates of βX are
reported under the columns denoted as "share of tertiary educated". Specification (1) is the basic
one and it estimates equation (3) on 25 yearly changes (1980-2005) for 14 OECD countries.
The method of estimation is OLS with year fixed effects (since the variables are already in changes we
do not include country-level effects). The standard errors in parentheses are heteroscedasticity
robust and clustered by country. Specification (2) omits the US, which is one of the most studied
cases and by far the largest country of destination of immigrants. We intend to show that the rest of
23
The OECD Productivity data set features an analogous measure of TFP for some countries covering part of our period of
interest. Our own measure is very strongly correlated with theirs. We run a regression of growth rates of the two measures
and find that the estimated coefficient is 0.92 and the standard error is 0.018.
72
the sample does not behave too differently from the US. Specification (3) includes only the more
recent years (1990-2005) for which the most accurate migration data from the OECD are available.
While there is significant potential for endogeneity in these OLS specifications, as capital and
productivity are determinants of wages (and income per person) and that is in turn a determinant of
immigration rates, let us begin from these simple OLS estimates and comment on some robust and
clear correlations that emerge from Table 1. We will deal with the issue of endogeneity in the section
4.4.2 below. First, the coefficients γX on total inputs (ΔL/L, ΔEmployment/Employment and ΔK/K) are
all close to or larger than one. At the same time the coefficients βX on the share of highly educated
immigrants for the same dependent variables are all significantly positive. This suggests that the
receiving economy is able to employ all new arrivals (within the year of arrival) without crowding out
native workers and that capital accumulation is stimulated accordingly to maintain a constant capitallabour ratio. In fact, combining the larger than one response to immigrant flow and the positive
response to share of immigrants we can say that increasing the number of highly educated
immigrants, keeping the other groups of immigrants constant, would increase employment by more
than the direct contribution of those workers, implying the creation of new jobs.
At the same time this would stimulate the investment in physical capital creating new investment
opportunities for the natives and maintaining capital intensity constant or slightly increased.
Investments (or capital inflows) adjust to the larger potential worker pool and to its higher skills
(brain gain) in just one year, effectively leaving unchanged the capital-labour ratio. Second, capital
per worker and total factor productivity are not significantly affected by total immigration or by the
share of highly educated. These estimates suggest that immigrants in general, and highly educated in
particular, stimulate the receiving economy in its employment rate and total investments without
altering much productivity and capital per worker.
These effects, combined together, imply that a larger inflow of immigrants, or a selection of more
highly educated immigrants for given total flows, are associated with larger employment,
proportionally larger total capital, and unchanged or slightly higher capital intensity and unchanged
TFP. These effects together would imply unchanged wages for native workers and higher
employment rates of natives. This results, in fact in a positive contribution (although not significant in
the OLS specification) of immigration and brain gain to GDP per person in the receiving country.
These correlations also hold when we consider the estimates in specification 2, without the US or
when we restrict the analysis to the more recent period 1990-2005 (in specification 3). In fact the
coefficients on all the variables are rather stable across specifications. Immigration and brain gain
seem to have a positive "extensive" effect increasing employment and capital stock of natives and no
negative "intensive" effect on productivity, capital per worker and hence wages.
5.3.2
Instrumental variables and 2SLS estimates
The most significant limitation of the estimates presented in Table 5.1 is that immigration flows and
immigrants' selection are endogenous to the productivity and factors of the receiving country. In
fact, we have shown in Chapter 4 above that immigration flows respond vigorously to changes in the
wage difference between origin and destination. Moreover the inflow of highly educated responds to
the increase in the skill premium in the receiving country. Employment, capital and TFP are the
determinants of those wages hence we cannot consider immigration (or the share of highly educated
immigrants) as exogenous to them. However, the framework developed in the last chapter, in which
we analyze the migration flows and the brain flows across countries provides a framework to
separate sending- and receiving- country determinants of the international migration flows as well as
the contribution of bilateral migration costs. Hence that framework also lends us a solution to the
problem of endogeneity of migrant flows. In particular, consider the bilateral regression models used
in the previous chapter. The basic model to analyze total immigration is as equation [5] in chapter 4:
73
ln nodt = Dot + Dd + β1 Wdt-1 + Xod + β3 Ydt + eodt,
[4]
where the dependent variable is the logarithm of the total bilateral migration flows from country o
to country d in year t, Wdt-1is the destination country average wage in period t-1 and Ydt captures the
other receiving-country determinants of migration flows (mainly the immigration laws). The countryof-origin by year fixed effects, Dot capture any economic, demographic and cost determinant of
migration out of country o which varies over time t. That set of dummies captures all the so called
"push-factors" of immigration that do not depend on specific destination countries but only on
conditions in the countries of origin. As long as one country of origin does not have all (or most) of its
emigrant go to the same country of destination we can consider these terms as exogenous to the
economic conditions of each destination country. The country-pairs fixed effects Xod, on the other
hand, capture the fixed bilateral costs of migrating from o to d. They mostly reflect geographic
factors and the existence of historical networks which provide information and ease the adjustment
of immigrants to the destination country.
Table 5.1
Impact of yearly immigrant flows and share of highly educated immigrants: Yearly
changes, OLS estimates
Explanatory
variable:
∆ L/L
∆ Employment/
Employment
∆ K/K
∆ Capital per
Worker/
Capital per
Worker
∆ A/A
∆ GDP per
Person/
GDP per person
Observations
(1)
basic OLS
1980-2004
Immigration
Share of
rate
tertiary
educated
1.03**
0.03**
(0.17)
(0.006)
1.07**
0.02**
(0.24)
(0.006)
0.91**
0.04**
(0.31)
(0.01)
-0.16
0.01
(0.20)
(0.01)
-0.06
(0.30)
0.59
(0.41)
(2)
Without US
Immigration
rate
(3)
1990-2004
Immigration
rate
1.08**
(0.15)
1.10**
(0.17)
0.96**
(0.30)
-0.14
(0.20)
Share of
tertiary
educated
0.03**
(0.06)
0.02**
(0.005)
0.03**
(0.01)
0.01
(0.01)
1.11**
(0.18)
1.18**
(0.25)
1.14**
(0.35)
-0.03
(0.21)
Share of
tertiary
educated
0.02**
(0.01)
0.02**
(0.01)
0.03**
(0.01)
0.01
(0.01)
-0.06
(0.30)
0.62
(0.40)
0.01
(0.01)
0.003
(0.01)
-0.29
(0.25)
0.43
(0.31)
0.002
(0.009)
0.002
(0.007)
0.01
(0.08)
0.01
(0.01)
336
322
210
Note: The dependent variable in each regression is described in the first cell of the row and the explanatory variables are
the immigration rate and the share of highly educated. The method of estimation is Least Squares. Each regression
includes year fixed effects. Specification (1) uses all the country-year observations, specification (2) omits the US data,
specification (4) uses only observations from the 1990-2004 period. The standard errors in parentheses are
heteroscedasticity robust and clustered by country. **,* imply significance at the 5, 10 per cent level.
We can use a similar model, relative to highly educated migrants, to analyze their migration flows,
namely:
ln nHodt t = DHot + β1 WHdt + XHod + β’3 Ydt + e’odt,
[5]
74
Once we have estimated equations [4)] and [5] we use the estimates of Dot + Xod and DHot + XHod ()to
predict the log of annual, total bilateral flows of immigrants and the log annual flows of highly
educated immigrants, respectively. These predictions relative to log-flows are transformed in
prediction on total immigration rates from each country and in predicted shares of highly educated
from each country. Adding the predicted immigration rates from each country of origin and
averaging the predicted shares of highly educated from each country of origin (weighted by the total
immigration flow) we calculate the imputed immigration rate and the imputed share of highly
educated immigrants for each of the 14 destination countries in each year. These imputed
immigration rates and imputed shares are what we use as instruments for the actual immigration
rates24. While we use the same explanatory in the bilateral equation for total and highly educated
migrants the estimates of bilateral costs and of country of origin effects are very different. This is due
to the fact that some countries have much larger overall migration than others but also much smaller
share of highly educated than others. Also the bilateral costs estimates are very different as distance,
language, colonial ties and other fixed factors affect skilled and unskilled migration very differently.
This is what allows us to identify different instruments (and effects) for total immigration and highly
skilled immigration25.
Table 5.2
Dependent
variable
Predicted
Value from
Push_factors
F-Test
Partial RSquare
Observations
First stage of the 2SLS: Power of the instruments
(1)
(2)
basic OLS
Without US
Immigration
rate
Immigration
rate
0.66**
(0.04)
Share of
tertiary
educated
1.03
(0.09)
234
0.43
336
(3)
1990-2004
Immigration
rate
0.66**
(0.04)
Share of
tertiary
educated
1.01**
(0.11)
0.62**
(0.04)
Share of
tertiary
educated
1.07**
(0.10)
83
231
83.6
178
110
0.85
0.44
0.84
0.52
0.83
322
210
Note: The dependent variable in all first stage regressions is the immigration rate measured as gross immigration flows
relative to initial population. The explanatory variable (instrument) is the predicted immigration rate using the estimated
values of Dot and Dod from the empirical equation (14). All regressions include year fixed effects. Specification (1) includes
all countries and all years 1980-2004, specification (2) omits the US, specification (3) includes only the nine Continental
European Countries (not the UK) and specification (4) considers only observations relative to the period 1990-2005. In
parentheses below the coefficient estimates we report heteroscedasticity robust standard errors clustered by country.
Below the F-statistics we report the probability of rejecting the inclusion of the instruments in the first stage. **,* imply
significance at the 5, 10 per cent level. The third row reports the partial R-square that measures the share of variance of
the dependent variable accounted for by the instrument.
Table 5.2 shows the statistics for the first stage regressions using the predicted immigration rated
based on predicted flows from (4) to predict actual immigration rates and the predicted share of
highly educated based on the estimates estimated from (5) to predict the actual shares of highly
educated immigrants. We report some measures of the significance of the instruments (F-test and
24
One further source of error in proxying the actual immigration rates and actual share of tertiary educated is that in the
bilateral regression we only have 74 countries of origin (the most important ones) and add the predicted flows from those.
The immigration rates, instead, measure the total immigration flows from those countries plus any other country in the
world.
25
Also as the instrumental variables are constructed we should bootstrap the standard error in the second stage. We did
not do that yet, however as the first stage is very strong we do not think this would make a large differences.
75
partial R-square) using the whole sample (specification 1) or using the sample that omits the US
(specification 2), or only including the more recent period, whose data are more reliable
(specification 3).
In each case the coefficient on each of the two constructed instruments is positive and very
significant. The partial R-squared of the instrument for immigration rates is around 0.41 while the
partial R-squared for the imputed share of highly educated is 0.85. Each regression includes time
fixed effects. The F-statistics of significance of the instrument are all above 80. Thus, the instruments
are quite powerful. In particular they are powerful in predicting the share of highly educated which
implies that the sending-country characteristics and the sending-countries year to year shocks are
very important in determining the selection of emigrants across skills. Possibly highly educated
emigrants are even more sensitive than less educated ones to sending country conditions. They may
respond to crisis in the country of origin by leaving it to a larger extent than less educated can.
An example of a push-factor that affects migration differently across skills and across receiving
countries is the increase in income of the Chinese upper class during the 90's. This generated a
higher propensity of Chinese, mainly those highly educated, to migrate (large estimates of Dot and
even larger of DHot) This would likely imply larger immigration to Australia and the US , both closer to
China and with larger old-time Chinese immigrant communities (quantified in larger Xod and
XHod)than, say, France or Switzerland. Also the differential effect on skilled immigration would be
greater than on total immigration (hence the differentiation between the two).
Table 5.3 shows the 2SLS estimates of the effect of immigration on inputs, productivity and income
per person. The specifications and the dependent variables in each row of Table 5.3 are exactly as
those in Table 5.1. Most of the estimates are also consistent qualitatively with (and not too different
quantitatively from) those obtained using OLS estimation methods in Table 5.1. In particular, the
effect of immigration on total labour supply, employment and capital services are now always larger
than one (and in some cases significantly larger than one from a statistical point of view) and the
extra-contribution of the highly educated is always significantly larger than 0.
This suggests again no crowding out of natives from existing jobs, but rather some stimulating effect
of immigrants on native employment, enhanced by the presence of highly educated among them, so
that the share of highly educated, for given flows, has a positive effect on the employment and
capital accumulation of natives. The capital stock adjusts to immigrants and to the extra-employment
effect on natives within one year, so that the change in the capital labour ratio (ΔCapital per
worker/Capital per Worker) is never significantly different from zero and the point estimate of its
effect is actually positive.
Again, there seems to be no significant effect of immigrants and of brain gain on the productivity
changes (ΔA/A) of the receiving country. As noted above, however, the positive employment and
capital accumulation effects may derive from a positive productivity effect of immigrants that
stimulates employment and investments. This is confirmed by the fact that the 2SLS estimates of the
effects of immigration rates plus brain gain on GDP per person (last row) are always positive and
often significant. Our estimates are robust to the choice of countries in the sample (specification 2
omits the US,) and to the choice of the period (specification 4 considers only 1990-2005).
76
Table 5.3
Impact of yearly immigrant flows and share of highly educated immigrants:
Yearly changes, 2SLS Estimates
(1)
(2)
(3)
basic 2SLS
Without US
1990-2005
Explanatory
Immigration
Share of
Immigration
Share of
Immigration Share of
variable:
rate
tertiary
rate
tertiary
rate
tertiary
educated
educated
educated
∆ L/L
1.03**
0.03*
1.01**
0.03**
1.00**
0.02
(0.11)
(0.01)
(0.12)
(0.01)
(0.10)
(0.012)
∆ Employment/
1.23**
0.03**
1.25**
0.02**
1.27**
0.01
Employment
(0.14)
(0.008)
(0.14)
(0.01)
(0.14)
(0.01)
∆ K/K
1.42**
0.04**
1.43**
0.04**
1.46**
0.04**
(0.24)
(0.02)
(0.25)
(0.02)
(0.23)
(0017)
∆ Capital per
0.15
0.02
0.18
0.02
0.19
0.024
Worker/
(0.16)
(0.016)
(0.16)
(0.02)
(0.16)
(0.018)
Capital per
Worker
∆ A/A
-0.11
0.01
-0.09
0.01
-0.16
0.01
(0.13)
(0.01)
(0.12)
(0.01)
(0.13)
(0.01)
∆ GDP per
0.60**
0.01
0.60**
0.01
0.53**
0.01
Person/
(0.16)
(0.01)
(0.16)
(0.01)
(0.14)
(0.01)
GDP per person
Observations
336
322
210
Note: The dependent variable in each regression is described in the first cell of the row and the explanatory variables are
the immigration rate and the share of highly educated. The method of estimation is 2SLS using the predicted flow of
immigrants and the predicted share of tertiary educated from the gravity push factors in the total immigration and
selection equation as instruments. Each regression uses yearly differences by country and includes year fixed effects.
Specification (1) uses all the country-year observations, specification (2) omits the US data, specification and (3) uses only
observations from the 1990-2005 period. The standard errors in parentheses are heteroscedasticity robust and clustered
by country. **,* imply significance at the 5, 10 per cent level.
All in all, the results of Table 5.3 confirm the correlations obtained with the OLS estimates of Table
5.1. Immigrant flows predicted using country-of-origin yearly effects and interacted with bilateral
geographic factors increase the employment and labour supply in the receiving country more than
one-for-one. On top of this average effect, a higher share of highly educated immigrants provides an
extra-stimulus to total employment of natives. Also immigration and brain gain induce increases in
the stock of capital (through capital inflows or domestic investment) that, even within one year,
allow the capital-labour ratio (and therefore the wage and return to capital) to maintain its preimmigration level. Thus, immigration and brain gain lead to an increase in the overall size of the
economy (employment and capital increase more than proportionally and, if the share of highly
educated is higher, the effect is even stronger) without significant changes in total factor productivity
and constant (or mildly increasing) capital intensity and hence stable (or slightly increasing) wages.
There is also some evidence of a positive effect on output per person driven by the higher
employment rates of natives as consequence of the employment-creation effects of immigrants.
As a further check that our short-run estimates are not driven by some bias arising from serial
correlation in the data, and also to obtain the long-run response of the variables to immigration and
brain gain we have re-estimated the responses of hours worked, employment, capital, TFP and
income per person to immigration and brain gain over 5-year changes (rather than yearly changes).
Table 5.4 reports the estimated coefficients from the usual three specifications. Interestingly, the
coefficients γX on labour adjustment (ΔL/L) and capital adjustment (ΔK/K) are still close to one but a
bit smaller than for the short-run, while the extra-effect of highly educated βX on those variables are
larger (two to three times) than in the short run. In the long run the employment-stimulating and
77
capital-stimulating effect of highly skilled immigrants seems larger than in the short-run. If such
positive effect derives from increased specialisation and adjustment of the productive structure in
order to take advantage of the skills of immigrants, it makes sense that it takes some times before
the full effect is manifested. The effects on productivity (ΔA/A), and on the capital-labour ratio are all
still insignificant, hence average wages should not be much affected by immigration in the long-run
either. However the positive effect on employment and capital together with no effect on wages
implies also in the long run an increase in the GDP per person, combining the effect of total
immigration and brain gain in the receiving country (last row of Table 5.3).
Table 5.4
5 year differences 2SLS estimates, instruments: gravity push factors only
Explanatory
variable:
∆ L/L
∆ Employment/
Employment
∆ K/K
∆ Capital per
worker/
Capital per
worker
4A/A
∆ GDP per
person/
GDP per person
Observations
(1)
basic OLS
Immigration Share of
rate
tertiary
educated
0.99**
0.13**
(0.11)
(0.04)
1.14**
0.07**
(0.12)
(0.04)
1.25**
0.17**
(0.19)
(0.07)
0.11
0.09
(0.13)
(0.08)
-0.18
(0.11)
0.49**
(0.12)
0.01
(0.04)
0.01
(0.03)
70
(2) 5Without US
Immigration
Share of
rate
tertiary
educated
0.99**
0.13**
(0.12)
(0.04)
1.14**
0.07
(0.14)
(0.05)
1.31**
0.17**
(0.21)
(0.08)
0.17
0.10
(0.14)
(0.10)
-0.19
(0.11)
0.47**
(0.12)
(3)
1990-2005
Immigration Share of
rate
tertiary
educated
1.01**
0.12**
(0.12)
(0.04)
1.15**
0.08*
(0.13)
(0.04)
1.29**
0.18**
(0.20)
(0.08)
0.13
0.10
(0.14)
(0.09)
-0.02
(0.04)
0.04
(0.04)
65
-0.20
(0.11)
0.47*
(0.12)
0.02
(0.04)
0.03
(0.04)
42
Note: Each cell shows the coefficient from a different regression with the dependent variable described in the first cell of
the row and the explanatory variable equal to the total flow of immigrants as a share of the initial population of the
receiving country. The method of estimation is 2SLS using the predicted flow of immigrants from the gravity push factors
as instruments. Each regression uses changes over five years between 1980 and 2005 and includes period fixed effects.
The standard errors in parentheses are heteroscedasticity robust and clustered by country. **,* imply significance at the 5,
10 per cent level.
5.4
The effects of immigration and brain gain in bad economic times
The results of Table 5.3 show that, on average, push-driven immigration triggers a one-for-one
increase in total labour supply (hours worked) and in the capital stock, leaving the capital-labour
ratio unchanged even in the short run. At the same time skill intensity of this inflow adds an extra
positive effect to total employment and capital accumulation also leaving unchanged productivity
and capital-employment ratios. But do the short-run effects of immigration and/or the extra effect of
brain gain vary depending on the business cycle in the receiving country? In particular, what is the
response of capital and labour to an immigration shock and to its skill intensity during "bad economic
times"? When the demand is weak, that is, does employment expand so as to employ all of the
newly arrived workers and does capital adjust in response to the skill intensity of immigrants or is
there more displacement?
78
Table 5.5
Impact of immigration in Normal and Bad economic times: Period 1980-2005
2SLS estimates, instruments: gravity push factors only
Specification:
Basic 2SLS
Explanatory
variable:
∆ L/L
∆ Employment/
Employment
∆ K/K
∆ Capital per
Worker/
Capital per
Worker
∆ A/A
∆ GDP per
Person/
GDP per person
Observations
Normal Times
Output gap>-1 per cent
Immigration
Share of tertiary
rate
educated
1.60**
0.04**
(0.23)
(0.01)
1.55**
0.03**
(0.19)
(0.01)
1.55**
0.05**
(0.32)
(0.02)
-0.01
0.016
(0.22)
(0.017)
-0.11
(0.10)
1.02**
(0.19)
Bad Times:
Output gap<-1 per cent
Immigration
Share of tertiary
rate
educated
0.72
0.027**
(0.14)
(0.012)
1.20**
0.01
(0.11)
(0.01)
1.42**
0.03**
(0.20)
(0.01)
0.22
0.022*
(0.17)
(0.12)
0.007
(0.008)
0.01
(0.008)
-0.16
(0.22)
0.33**
(0.15)
0.016
(0.02)
0.002
(0.008)
336
Note: The coefficients in each row are from the same regression. The explanatory variables are the immigration rates and
the share of highly educated among immigrants interacted with a dummy equal to one, when output gap is larger than -1
per cent (normal times) or to one when the output gap is smaller than -1 per cent (bad times) The dependent variable is
described in the first cell of the row. The estimated Specification includes time fixed effects in each regression. The
method of estimation is 2SLS using the predicted flow of immigrants and the share of tertiary educated from the gravity
push factors as instruments, as described in the text. The standard errors in parentheses are heteroscedasticity robust and
clustered by country. **,* imply significance at the 5, 10 per cent level.
This section attempts to estimate the effects of immigration shocks, allowing for differences in the
estimates of γX and βX between "bad economic times" and normal periods for the receiving country.
Specifically, we shall say that a country in a given year is in "bad economic times" if its output gap is
below -1 per cent. The output gap, as defined by the OECD in the Economic Outlook, is the difference
between actual Gross Domestic Product (GDP) and potential GDP as a per cent of potential GDP.
Data on the output gap for the 14 countries over the period 1980-2005 are available from the OECDSTAN database. When actual output is below potential output, the output gap is negative. According
to our definition, the OECD economies have been in "bad economic times" during 36 per cent of the
period between 1980 and 200526. When an economy is not in bad times we shall say it is in "normal
times".
We proceed to estimate a regression model analogous to (3) but allow the coefficients γX and βX to
take on different values in bad and in normal times. We do this by splitting the explanatory variables
(immigration rates and share of highly educated) by interacting them, alternatively with one dummy
that is equal to one when the country is in “bad economic times” and with another dummy that is
equal to one when the country is in normal economic times. Table 5 reports our findings for the basic
specification using 2SLS as method of estimation and the same instruments as in Table 5.4, also
interacted with dummies to specialize them to bad and normal times. The two columns on the left
correspond to the IV estimates of γX and βX, the effects of total immigration and of its skill intensity,
26
That is in 133 observations out of 336.
79
during normal times. The two columns on the right correspond to the estimates of the same
parameters, but during "bad economic times".
Three results emerge consistently from Table 5.5. First, the response to total immigration flows of
total labour used in production (hours worked) is much lower in bad times (0.7) than in normal times
(1.6) and also the response of the stock of capital is larger in normal times (1.55) than in bad
economic times (1.20). In comparison, TFP is unaffected by total immigration, both in bad and in
normal times.
Second, the positive extra-effect of skill-intensity of migrants on employment, hours worked and
capital is present and significant both in bad and normal times and only a bit smaller in bad times.
Interestingly enough, the incentive effect of highly educated immigrants on capital accumulation
during bad times is large enough that they have a significantly positive effect on capital per worker in
bad (but not in normal) times.
Third, the effects on total factor productivity are not significant while the effect of total immigration
for given composition on output per person is much larger in good times (due to the large impact on
employment and capital) thank in bad times.
5.5
Conclusions
There is some anecdotal evidence that highly educated immigrants are beneficial to their destination
country. As all highly skilled workers they may have high average productivity, they may be selected
among the highly motivated and productive and they usually specialize in science and technology
that are good for economic productivity. So far, however, nobody has produced any quantification of
how large is their effect at the country level, whether it takes the form of increased TFP, larger
employment opportunities for natives, or more capital investment opportunities. This chapter,
building on the estimates of the determinants of immigration, has attempted to provide a new
framework for identifying these effects. In particular, we have considered the effects of the “brain
gain”, measured as the share of the high skilled among the immigrants, in estimating these effects.
This way we can distinguish general effects of immigration and the specific contribution of its skill
intensity.
Four of our findings are important to highlight: First, total immigration is not associated with lower
employment of native workers; rather it produces some positive effect on native employment. A
larger share of skilled immigrants substantially strengthens the positive employment effect. This can
be due to the fact that immigrants with high education provide services and jobs that complement
those of natives. Alternatively immigration may increase the efficiency of specialisation in
production, thereby increasing the productivity which generates higher incentives for native workers
to participate in the labour force.
Second, higher employment due to immigration is accompanied by a more than proportional
increase in capital stock, already in the short-run. Even this effect on capital accumulation is
enhanced by the share of highly skilled. Thus, more workers stimulate more firms and/or more
investment, such that the capital per worker on average remains constant or increases slightly.
80
Third, immigrants and their skill intensity do not affect much the total factor productivity of the
receiving economy. The positive productive effect, however, is manifested in employing more of the
native population whose employment rate increases. Such effect is noticeable in the positive effect
of immigrants on GDP per person.
Finally, we find that immigration has a different impact in ”normal” and in “bad” economic times.
While total immigration triggers a more than proportional increase in hours worked and employment
in normal times, the working hours and employment increases less than the increase in labour supply
triggered by immigration in bad economic times. In contrast, the impact of high skilled immigrants is
not affected by the business cycle, which suggests that high skilled immigration can stabilize demand
and production also in bad economic times.
Altogether, we can conclude that empirical evidence associates immigration with positive
employment and investment effects for natives and that there is no evidence of an effect on TFP.
81
Annex Table
Table A 5.1
Annualized growth rates of inputs, productivity and output
Variable
Observations
Real GDP
Total Hours worked
Employment
Capital Services
Total Factor Productivity
14
14
14
14
14
Real GDP
Total Hours worked
Employment
Capital Services
Total Factor Productivity
14
14
14
14
14
Real GDP
Total Hours worked
Employment
Capital Services
Total Factor Productivity
14
14
14
14
14
Mean
1980-1990
2.72
0.68
1.07
3.43
1.14
1990-2000
2.62
0.58
0.92
3.75
1.01
2000-2005
1.98
0.34
0.73
3.11
0.73
Std. Dev.
Min
Max
0.79
0.84
0.63
1.04
0.71
1.99
-0.50
0.18
2.25
-0.25
4.83
1.78
1.88
5.59
2.50
1.02
0.96
0.97
1.05
0.65
1.06
-0.92
-0.67
2.06
-0.56
4.91
2.77
3.40
6.12
2.38
0.86
0.84
0.97
1.26
0.54
0.60
-0.93
-0.41
1.37
0.17
3.65
1.96
3.08
6.02
1.79
Note: The data were constructed by the authors using the OECD-STAN data set and the PWT 6.2 data as
sources.
82
6
The political economy of skilled immigration
As we have seen in Chapter 5, skilled migrants are likely to increase the receiving country’s income
through higher output, investment and employment. Moreover, the contribution of immigrants to
the fiscal balance of the welfare state improves with their skill level (e.g. Boeri, Hanson and
McCormick, 2002; Bonin, Raffelhüschen and Walliser, 2000). At the same time, as we have
documented in Chapter 2, only few countries have devised policies aimed at selecting immigrants on
the basis of their skills. How can this puzzle be explained? In this chapter we will argue that political
economy forces play a key role in shaping actual policies and, in particular, that pressure groups are
likely to be key drivers of observed outcomes.
To carry out our analysis, we start by outlining the basic elements of a political economy model of
immigration policy (section 6.1). Public opinion represents one of the main elements of this
framework. We next analyze the drivers of individual attitudes towards skilled immigration (section
6.2), looking at the question from two different perspectives. First, we study how preferences
towards overall immigration change, depending on the relative skill composition of the native vs.
immigrant population (section 6.2.1). Second, more directly, we turn to consider the drivers of
attitudes towards skilled immigration (section 6.2.2). In our empirical analysis we focus on two main
economic channels through which immigration can affect natives, i.e. the labour market and the
welfare state channels. Interestingly, we find that both play a statistically significant and
economically relevant role. Our results are consistent with the factor proportions analysis model of
the labour market and with a model of a redistributive welfare state in which taxes adjust following
the arrival of migrants.
Our next step is to consider, from a theoretical point of view, how individual preferences can be
aggregated into policy outcomes in a democratic society. In particular, we illustrate the working of a
simple median voter model and of a framework in which policy outcomes are instead the result of
lobbying efforts by organized groups (section 6.3). Finally, we take the two models to the data to
assess their ability to explain the actual policy outcomes. Our evidence suggests that a simple median
voter model is not consistent with skilled migration policies in the main destination (European)
countries. On the other hand, we provide evidence for the United States pointing out that interestgroups dynamics may instead play a very important role.
6.1
The elements of a political economy model of immigration policy
A useful conceptual scheme to analyze the skilled migration-policy formation process - which is
based on Rodrik (1995)27 - is illustrated in Figure 6.1. The basic idea is that the formulation of
migration policy involves at least four elements. First, policy making necessarily needs to take into
account voters’ individual preferences, and how these preferences are shaped by the inflow of
foreign workers. Both economic and non-economic factors are likely to play a role in shaping public
opinion. The second step is to map these preferences into an aggregate policy demand. Various
channels have been suggested in the literature, ranging from majority voting, to pressure groups and
grass-roots movements. On the supply side of migration policies, we need to identify the
policymakers’ preferences and the details of the institutional setting in which policies are decided.
27
Rodrik (1995) uses the conceptual scheme in Figure 1 to analyze trade policy outcomes.
83
Figure 6.1
Determination of immigration policy
voters’ preferences on
immigration policy
(A)
pressure groups,
political parties,
grass-roots movements
(B)
„demand side“
of immigration
policy
Immigration policy outcomes
policymaker preferences
(C)
institutional structure
of government
(D)
„supply side“
of immigration
policy
A substantial body of literature has studied the impact of both economic and non economic factors
on individual attitudes towards immigrants. The overall message from these studies is that, whereas
non economic drivers have an important and independent effect on individual preferences,
economic characteristics of the respondents systematically shape attitudes towards international
labour mobility.
The early contributions have mainly focused on individual countries like the United States (Citrin et
al. 1997, Espenshade and Hempstead 1996, Kessler 2001, Scheve and Slaughter 2001, Hainmueller
and Hiscox 2007) and the United Kingdom (Dustmann and Preston 2001, 2004, 2007). More recently,
cross country studies have taken advantage of newly available social surveys which cover large
samples of both advanced and developing countries (Chiswick and Hatton 2003, Mayda 2006,
O’Rourke and Sinnott 2005, Facchini and Mayda 2008, 2009a, 2009b, Mayda 2008).
Individual preferences are aggregated into political demands through the working of majority voting,
grass-root movements, political parties and/or interest groups (box B in Figure 6.1). This process of
aggregation is clearly affected by how severe the collective action problem is for certain groups,
which in turn is a function of several factors, for example the geographic concentration of members
of a group. On the supply side of migration policy, government preferences play an important role
(box C). Do officials only care about aggregate welfare, i.e. do they just wish to maximize society’s
well being? Or rather, do they only care about being re-elected? Are their choices driven by
ideological considerations? Do they care more about the demands of specific groups within society –
i.e. do they intend to use migration policy as a tool to transfer resources to a specific group?
Finally, the institutional structure of the government, i.e. whether for instance the electoral system is
proportional, or more specifically which body is in charge of setting migration policy, plays an
important role (box D).
84
The latter three dimensions of the policy making process (boxes B, C and D) are modelled together by
the existing literature, and the detail to which they are analyzed varies substantially. While quite a bit
of attention has been devoted to the process through which individual preferences are aggregated,
the policymakers preferences are typically modelled in a very reduced-form fashion, and almost no
attention is paid to the details of the institutional setting in which migration policy is set. This is an
important shortcoming, as destination countries vary substantially in the features of their political
institutions.
6.2
Understanding individual attitudes towards skilled migrants
Individual attitudes towards skilled migrants are affected by a number of factors, both economic and
non-economic ones. We assume that voters are characterized by self-interest maximizing behaviour.
This implies that, in forming their opinion, voters will consider the impact of skilled migration on their
individual utility. Since the economic impact of skilled migration tends to be uneven across the
population, the main economic drivers of individual attitudes are associated with the incomedistribution effects of skilled migration. Finally, voters’ perception of skilled migration from a noneconomic point of view is related to political, cultural and security issues.
The income-distribution effects of skilled migration can take place through three main channels, i.e.
the labour market, the welfare state and the price channels. Assume that skilled and unskilled labour
is combined to produce one good according to a constant returns to scale production function
(factor-proportions-analysis model). Theory predicts that, through the labour market channel, the
income-distribution effects of migration depend on the skill composition of migrants relative to
natives in the destination country. If immigrants are on average more skilled than natives, through
the labour-market channel they will hurt skilled natives and benefit unskilled ones, as their arrival
will induce a decrease in the skilled wage and an increase in the unskilled wage. On the other hand, if
immigrants are on average less skilled than natives, the income-distribution effects of migration
through the labour market are reversed, i.e. skilled workers end up benefiting from migration, while
unskilled workers are on the losing end. Thus, if we want to empirically test these predictions using
data on public opinion towards overall migration, we need to assume that voters are aware of the
skill level of migrants who arrive to their country. In that case, we expect to find the following
patterns: if a country receives skilled immigrants, pro-migration attitudes should be negatively
correlated with voters’ individual skill while, if a country receives unskilled immigrants, pro-migration
attitudes should be positively correlated with voters’ individual skill. Using data on public opinion
towards specifically skilled migrants, we expect to find, in every country, a negative relationship
between voters’ individual skill and attitudes in favour of skilled migration.
The main OECD destination countries of immigrant flows are characterized by large welfare states
(Boeri, Hanson and McCormick 2002), in which the public sector redistributes a substantial fraction
of national income across individuals. In these contexts, immigration has a non-negligible impact on
public finances, since foreign workers both contribute to and benefit from the welfare state. The
aggregate net effect of immigration on the welfare state is either positive or negative, depending on
the socio-economic characteristics of immigrants relative to natives. Besides the aggregate effect,
the arrival of immigrants also implies income-distribution effects through the welfare-state channel.
These effects are crucial to understand public opinion on migration.
To understand the income-distribution effects, consider a simple redistributive system, in which all
income is taxed at the same rate, and all individuals in the economy, i.e. both natives and
immigrants, are entitled to receive an equal lump sum per capita benefit. By construction, this simple
welfare system redistributes resources from high-income to low-income individuals. Assume that
immigration can affect the working of this system in two extreme directions. On the one hand,
migration can bring about changes in the tax rate, while per capita benefits are kept constant (tax
85
adjustment model). On the other, the per capita benefits can adjust while tax rates are unchanged
(benefit adjustment model).
If immigration is skilled, under both policy scenarios, all natives are likely to benefit from the
presence of foreign workers, due to a positive welfare spillover. On the other hand, if migration is
unskilled, all natives are negatively affected, through a welfare-state leakage effect. However, the
extent to which natives benefit (suffer) from skilled (unskilled) migration through the welfare state
channel differs according to each voter’s income level. That is, there will be income distribution
effects. These income distribution effects will depend on the adjustment mechanism of the welfare
state to migration.
Figure 6.2 illustrates what happens under the tax adjustment model. In the two panels, we plot the
correlation between an individual’s pre-tax income and pro-migration attitudes. Under the tax
adjustment model, if immigration is skilled compared to the native population (left panel), all
individuals benefit from the inflow of foreign workers (the line is in the positive hortant), since the
government will be able to lower the tax rate (while keeping the level of per capita benefits
unchanged). However, the reduction in the tax rate will benefit rich individuals to a greater extent
than poor ones, since tax payments represent a larger fraction of rich voters’ net income. If
immigration is on the other hand unskilled, all individual are worse off (the line is in the negative
hortant in the right panel), since the tax rate needs to increase to keep the level of per capita
benefits unchanged. Richer individuals are those more negatively affected, since the burden of
financing the welfare state falls disproportionately more on richer members of society. To
summarize, under the tax adjustment model, any change in tax rates (either negative or positive,
depending on the skill mix of migrants) will have a bigger impact on high-income individuals.
Figure 6.2
The tax adjustment model
Figure 6.3 illustrates instead the working of the benefit adjustment model, under which the welfare
state adjusts with changes in per capita benefits, while tax rates are kept constant. Also in this case,
as it can be seen from the left panel, an inflow of skilled immigrants benefits all individuals, while an
inflow of unskilled immigrants worsens the position of all voters. Under the benefit adjustment
model, an inflow of immigrants will have a more pronounced effect (either positive or negative,
depending on the skill mix of migrants) on those individuals that are at the receiving end of the
welfare system, i.e. low-income individuals. The reason is that the per capita benefit represents a
larger fraction of a poor individual’s net income, thus changes in per capita benefits affect this
86
income category more strongly. In particular, if a country receives skilled migrants, the per capita
benefit will increase, therefore all natives will benefit, but poor ones more so than rich ones. On the
other hand, a country receiving unskilled migrants will be forced to reduce per capita benefits, thus
hurting everybody, but again low-income voters to a greater extent than high-income ones.
Let us turn now to the implications of the theoretical model for our empirical analysis, starting with
the tax adjustment model. Using data on public opinion towards overall migration and assuming that
voters are aware of the skill level of migrants to their country, we expect to find that, if migration is
skilled, attitudes towards immigration are positively correlated with voters’ individual income (left
panel of Figure 6.2). The opposite is true if immigration is unskilled, in which case attitudes towards
immigration should be negatively correlated with voters’ individual income (right panel of Figure
6.2). Under the benefit adjustment model, we should find that if immigration is skilled, individual
attitudes are negatively correlated with individual income (left panel of Figure 6.3). On the other
hand, if immigration is unskilled, individual attitudes are positively correlated with individual income
(right panel of Figure 6.3). Using instead data on attitudes towards skilled migration, we should find
in every country a positive correlation between these attitudes and individual income under the tax
adjustment model and a negative correlation under the benefit adjustment model.
Figure 6.3
The benefit adjustment model
Let us turn now to the implications of the theoretical model for our empirical analysis, starting with
the tax adjustment model. Using data on public opinion towards overall migration, we expect to find
that, if migration is skilled, attitudes towards immigration are positively correlated with voters’
individual income. The opposite is true if immigration is unskilled, in which case attitudes towards
immigration should be negatively correlated with voters’ individual income. Under the benefit
adjustment model, we should find that if immigration is skilled, individual attitudes are negatively
correlated with individual income. On the other hand, if immigration is unskilled, individual attitudes
are positively correlated with individual income. Using instead data on attitudes towards skilled
migration, we should find in every country a positive correlation between these attitudes and
individual income under the tax adjustment model and a negative correlation under the benefit
adjustment model.
See Table 6.1 for a summary of the labour-market and welfare-state determinants of individual
attitudes towards skilled (and unskilled) migration. Box 1 develops a formal model of individual
attitudes towards immigration.
87
Table 6.1
Correlations between pro-immigration attitudes and, respectively,
skill and income through the labour-market and the welfare-state channels
Relative skill composition
skilled immigration
Channel
Labour Market
Correlation b/w Attitudes & Skill
Negative
Correlation b/w Attitudes & Income
Welfare State
Tax
Benefit
Adjustment Adjustment
Model
Model
Positive
Negative
unskilled immigration
Labour Market
Positive
Welfare State
Tax
Benefit
Adjustment Adjustment
Model
Model
Negative
Positive
88
Box 1
A model of individual attitudes towards immigration
To study the effect of immigration on individual attitudes we use a simplified version of the model
developed in Facchini and Mayda (2009a). This framework will allow us to identify three channels
through which migration can have an impact on individual attitudes: the labour market channel, the
welfare state channel and the efficiency channel.
In a small open economy, two production factors, skilled ( L S ) and unskilled labour ( LU ) are
combined using a constant returns to scale technology F ( L S , LU ) to produce a single output Y. The
economy is populated by a set N of natives (indexed by n) and a set M of immigrants (indexed by m).
Each native is endowed with one unit of labour, either skilled or unskilled, and with an amount
{
}
e n ∈ e L , e H of the output good, where e H > e L . Immigrants supply instead only one unit of
skilled or unskilled labour. The total endowment of the numeraire good in the economy is thus equal
to ∑ e n = E . The total supply of each skill is given instead by L j = φ j N + ϕ j M with j ∈ {U , S },
n
where φ j and ϕ j are respectively the share of workers with skill profile j in the native and immigrant
populations. The key variable to assess the effects of migration on individual attitudes is the migrants
to native ratio π = M N , which is assumed to be equal to zero in the initial equilibrium.
Furthermore, we will hold the number of natives constant throughout the analysis. Setting the price
of output equal to one, let wU and wS be, respectively, the unskilled and skilled wage, with
w S > wU . Domestic equilibrium is characterized by the solution of the following system of
equations:
1 = c( wU , w S )
∂c( wU , w S )
LU = Y
∂wU
∂c( wU , w S )
LS = Y
∂w S
(1’)
(2’)
(3’)
where c( wU , w S ) is the unit production cost and equation (1’) is the zero profit condition, while
equations (2’) and (3’) are the factor markets clearing conditions.
The presence of a redistributive welfare state in the host country is modelled by introducing an
egalitarian income tax τ levied on all sources of income, the revenues of which are lump sum rebated
to all residents through a per capita transfer b. The government budget constraint is thus given by:
(4’)
Notice that individuals take as given the initial size of the welfare state (τ and b), i.e. we do not
develop a political economy model of the extent of redistribution carried out within society. This
implies that our analysis can be considered as a short run view of the consequences of immigration.
In the presence of a welfare state, the well being of a native n of skill level j is a function of her
income net of taxes/transfers, which is given by:
τ (wU LU + w S L S + E ) = b( N + M )
I nj = (1 − τ )G nj + b
where G nj = w j + e n . The effect of migration on her net income can thus be measured by
(5’)
89
Iˆ nj
dπ
=
(1 − τ ) w j
I nj
wˆ j
dπ −
τG nj
bˆ
τˆ
b
dπ + dπ
I nj
(6’)
I nj
where Iˆ nj = dI nj I nj etc. Thus, immigration will have an effect on the net income of a native
through three channels. The first term on the right hand side of equation (6’) represents the labour
market channel, while the second and third terms capture the welfare-state channel. In particular,
the second term represents the effect of migration through the adjustment of the tax level, and the
third term captures instead the effect of immigration through adjustments in the government’s
transfer to residents.
How will different native individuals react to an inflow of foreign workers? First of all, domestic
workers might face competition in the host country’s labour market. It is easy to show that an
wˆ
unskilled native will see his wage decrease as a result of immigration ( U < 0) if and only if
dπ
immigrants are relatively less skilled than natives. The opposite is true for skilled immigration. Thus,
through the labour market, we expect skilled (unskilled) natives to be in favour of (against)
immigration in countries where immigrants are unskilled compared to the native population. Viceversa, in countries where immigrants are skilled compared to the natives, we expect unskilled
(skilled) natives to be in favour of (against) immigration.
To gain some intuition for the importance of the type of welfare state response to immigration in
shaping individual attitudes, we consider a simplified setting in which one of two possible
adjustments occur. In the first, which we label the tax adjustment model, per capita benefits are held
constant (thus the third term in equation (6’) equals zero), while the tax rate reacts to maintain the
government budget in equilibrium. In the second, which we label the benefit adjustment model, tax
rates are held constant (thus the second term in equation (6’) equals zero) and the benefit level
instead adjusts to restore the government budget’s equilibrium.
Totally differentiating equation (4’), holding the benefit level constant (tax adjustment model), we
ˆ j and thus the effect of immigration on the tax level is given
obtain that dπ = τˆ + ∑ η j Lˆ j + ∑ η j w
by
j
j
(φ − ηU )(βU − 1) + η E (1 −ψ U ) − η wˆ j
τˆ
= U
∑ j
dπ
(1 − φU )
1 − φU
dπ
j
(7’)
where (φU − ηU ) >0 is the difference between the share of the unskilled in the initial population
( φU ) and their share in the initial GDP (ηU ), ψ U is the share of unskilled in the immigrant
population, βU = ψ U φU and η E is the share of the initial endowment in total domestic income. If
η E =0, and ignoring for now the effects of immigration through the labour market channel, it is easy
to see that if immigration is low (high) skilled, i.e. if β U > 1 ( β U < 1 ), immigration will lead to an
increase (decrease) in the overall tax rates in order to keep the per capita benefit constant. To assess
the effect of immigration on an individual characterized by a pre tax income level G, we need to
substitute equation (7’) in equation (6’) and obtain
90
Iˆ
Gτ
τˆ
=−
dπ
b + G (1 − τ ) dπ
(8’)
From here we can easily see that under the tax adjustment model, an inflow of skilled immigrants
τˆ
< 0 ) is more desirable for an individual the higher is her pre-tax income. To the
dπ
τˆ
contrary, an inflow of unskilled immigrants (implying that
> 0 ) is more desirable for an individual
dπ
(implying that
the lower is her pre-tax income (see Figure 6.2). The intuition for this result is that, if the demogrant
is held fixed, the cost of an inflow of unskilled immigrants (higher tax rate) will fall disproportionately
more on higher income natives. Analogously, in the presence of skilled immigration, the higher
income natives will be the largest beneficiaries, as they will enjoy a disproportionately larger
decrease in their net tax burden due to the decrease in the tax rate.
If we turn now to the benefit adjustment model, totally differentiating equation (4’) and holding the
tax rate constant, we can show that the effect of an immigrant inflow on the per capita benefit is
given by
(φ − ηU )(1 − βU ) + η E (1 −ψ U ) − η wˆ j
bˆ
= U
∑ j
1 − φU
dπ
(1 − φU )
dπ
j
(9’)
bˆ
Iˆ
dπ
=
dπ b + G (1 − τ )
(10’)
Once again, assuming η E =0, and ignoring the labour market channel, it is easy to see that an inflow
of unskilled (skilled) immigrants will lead to a decrease (increase) in the per capita benefit level. To
assess the effect of immigration on an individual of pre tax income G under these hypotheses we
need to substitute equation (9’) in (6’) and obtain
b
From here it is easy to show that, under the benefit adjustment model, an inflow of skilled
immigrants is more desirable for an individual the lower is her pre-tax income. To the contrary, an
inflow of unskilled immigrants is more desirable for an individual the higher is her pre-tax income (see
Figure 6.3). To understand this result, notice that the reduction in the demogrant brought about by
unskilled immigration will carry a larger impact on the individuals with a smaller income. If
immigration is instead skilled, the resulting increase in the demogrant will disproportionately benefit
lower-income individuals. The reason is that the transfer represents a larger fraction of a low-income
person’s net income.
Notice that under both welfare-state scenarios, unless the skill composition of the migrant and native
populations is identical, the effects of migration on the two dimensions of the welfare state are
mediated by a third channel, the efficiency channel that affects the size of the tax base. At the
margin, labour is paid the value of its marginal product, so an infinitesimal inflow of immigrants will
leave the total remuneration of the existing labour force unchanged ( ∑ η j
j
wˆ j
dπ
= 0) and have no
effect on the redistribution carried out by the welfare state. On the other hand, if the inflow of
immigrants is large, the total remuneration of existing workers will increase ( ∑ η j
j
wˆ j
∆π
> 0) , and
relax the government budget constraint (these are the gains from migration pointed out first by
Berry and Soligo (1969)).
91
The third economic channel through which attitudes towards skilled migrants are affected is price
changes. This channel is absent if we assume that the destination country is a small open economy
which produces only internationally traded goods, in which case all goods prices are fixed, thus
immigration does not alter them (see for example the model in Box 1). If, on the other hand, the
country is a large open economy and/or produces a non-traded good or service, then the arrival of
immigrants will affect prices. This price effect is going to be homogenous across the population if
preferences are homothetic and identical across individuals. In this case, there will be no income
distribution effects through the price channel. In a more general model, individuals belonging to
different income groups might be characterized by different consumption baskets, in which case
heterogeneous agents might have different preferences over immigration because of price effects.
The empirical evidence on the price impact of migration is scarce and, for the most part, focuses on
unskilled migration (see, for example, Cortes 2008 and Frattini 2008). To the best of our knowledge,
there is no work in the literature focusing on the price effects of skilled migration. The latter ones,
however, are likely to exist and be substantial. For example, most likely skilled migrants (for example,
university professors and doctors) have had an effect on prices of services such as higher education
and health in countries like the United Kingdom and the United States.
Finally, besides the labour market, welfare state and price channels, there is a fourth economic
determinant of individual attitudes, i.e. efficiency considerations. If the inflow of immigrants is non
marginal, there will be aggregate gains from skilled migration, as pointed out by Berry and Soligo
(1969) and Borjas (1999). This aggregate “migration surplus” will relax the government budget
constraint and increase the tax base. Thus all natives should be in favour of skilled immigration
through the efficiency channel because they will end up paying a lower tax rate and/or receiving a
higher per capita benefit. In the standard migration model, the migration surplus is related to labourmarket complementarity effects. However, we can broaden the interpretation of this aggregate
effect by considering other types of gains – for example, the benefit of skilled migration through its
impact on productivity (see Chapter 5) and innovation activity. In relation to the latter effect, Kerr
and Lincoln (2008) evaluate the impact of high-skilled immigrants on US technology formation. The
paper finds evidence of a positive effect of higher admission levels of high-skilled immigrants on total
invention, primarily through the direct contributions of ethnic inventors. The effect of skilled
migration on innovation activity is likely to be taken in great consideration by public opinion –
especially in countries at the frontier of technological research, such as the U.S. – as evidenced by the
media coverage of this topic (see, for instance, Economist, March 7, 2009).
To conclude, there are a number of economic channels through which public opinion on skilled
migration is affected. All of them, except the labour-market channel, will imply a favourable attitude
towards skilled migrants, to a greater or smaller extent for different types of individuals. Through the
labour-market channel, skilled migration is likely to be opposed by native skilled workers. Whether
the labour-market channel has a substantial effect will depend on how vocal skilled native workers
are in the immigration policy process.
From a non-economic point of view, public opinion on skilled migration is shaped by political, cultural
and security issues. Political considerations imply that skilled natives should favour skilled migrants –
since their arrival will increase the likelihood that the median voter is skilled – while unskilled natives
should oppose them (see Ortega 2005)28. From a cultural point of view, both skilled and unskilled
natives should welcome inflows of educated migrants, who are likely to culturally enrich the
destination country, with small or no assimilation costs. Finally, from a security point of view, we do
not expect public opinion to be concerned about skilled migration. Thus, our overall conclusion of
this analysis is that attitudes towards skilled migration should be overwhelmingly favourable.
The underlying assumption is that immigrants’ children (or immigrants themseleves) can become citizens and vote – this
is true in jus soli countries – and skill levels are persistent across generations.
28
92
Table 6.2
Economic and non-economic determinants of attitudes (ISSP 1995 and 2003)
Ordered probit
with country dummies
1
2
3
4
Dependent variable
age
-0.0037
-0.0037
-0.003
-0.0032
male
-0.0217
-0.0249
-0.0372
citizen
-0.3082
-0.3051
parents' foreign citizenship
0.2568
0.2534
0.0010**
0.0257
education (years of education)
education*gdp
log of real income
log of real income*gdp
pro-immig crime
pro-immig culture
pro-immig economy
upper social class
trade union member
political affiliation
with the right
religious
0.0972**
0.0470**
0.0587
0.0081**
0.0339
0.0158*
0.0010**
0.0261
0.0958**
0.0471**
1995
3'
4'
5'
-0.0009
-0.0019
-0.0018
-0.0209
-0.0534
0.021
0.0166
0.0046
0.0227
0.0172
-0.2147
-0.1555
-0.3632
-0.1908
-0.1898
-0.2114
-0.207
-0.2987
0.2385
0.1334
0.229
0.2542
0.2552
0.2532
0.0279
0.0992*
0.0010**
0.0272
0.1042
0.0011**
0.0329
0.1325**
0.0011
0.0206
0.0646**
0.0461**
0.0425**
0.0619**
0.0196**
0.1193**
0.1270*
0.1566**
0.0048**
0.0129*
0.0158**
0.2780**
0.8295+
0.0598
0.0084**
0.0121**
0.3679*
0.3939**
0.0379+
2003
-0.0008
0.0539
-0.0715
Pro Immig Opinion
2'
-0.0008
-0.5207
0.7311
1'
-0.0039
0.0009**
-0.4627
0.0824**
5
1.2235
-0.1212
0.0405**
-0.269
0.0315
1.4351
-0.1443
0.0285**
0.5855
-0.696
0.0768
1.5677
-0.1557
0.0855+
0.0565
0.0517
0.0180**
0.0011
0.0201
0.0649**
0.0201**
0.0013
0.0229
0.0800**
0.0241**
0.0013
0.0222
0.0967*
0.1297
0.0247**
-0.2225
-0.6969
-0.4899
0.0279
0.074
0.0511
1.7827
2.0632
-0.1665
-0.1973
0.0581**
0.2674**
0.0060**
0.0262**
0.3292
0.8200*
-0.0841
0.0143
0.0335
0.0804*
0.2613+
0.0255*
1.0329*
0.1005*
0.5739
0.0568**
0.0355**
0.0545**
0.0435**
0.0575**
0.0250**
0.5811
0.0011
0.0266
0.1266*
0.219
0.0314**
-0.8082
0.2874**
0.0843
0.0282**
2.0485
1.1140+
-0.1922
0.1081+
0.6369
0.5747
0.569
0.0546
0.0180**
0.0324
0.0105**
0.018
-0.0516
-0.1409
-0.1911
0.0317
0.0462**
0.0378
0.0122**
0.0236*
0.0329**
0.029
0.0057**
Observations
14659
14659
13045
13045
6043
23801
23801
17943
17943
10956
Pseudo R-squared
0.07
0.07
0.07
0.15
0.07
0.06
0.06
0.06
0.14
0.07
Data source: 1995 and 2003 ISSP National Identity Module. The table reports coefficient estimates for ordered probit regressions (the cut-off points are not
shown). Robust standard errors, clustered by country, are presented under each coefficient. + significant at 10%; * significant at 5%; ** significant at 1%. All
regressions control for country fixed effects. Regressions (3)-(5) and (3')-(5') are restricted to countries with well-developed Western-style welfare states.
gdp is the log of per capita GDP in 1995 and 2003, PPP (current international dollars).
6.2.1
Empirical evidence on individual attitudes towards migration (ISSP data sets) 29
In this section we use data on preferences towards overall immigration and draw implications
regarding attitudes towards skilled migrants. We use the 1995 and 2003 National Identity modules of
the International Social Survey Programme (ISSP) data set. Regressions (1)-(5), Table 6.2 present the
results based on the 1995 ISSP National Identity module, while regressions (1’)-(5’) show the results
based on the 2003 ISSP National Identity module. We present the estimates of the coefficients of
ordered probit models which control for country fixed effects – to account for unobserved, additive,
country-specific effects – and have standard errors clustered by country – to account for
heteroscedasticity and correlation of individual observations within a country. Finally, in both sets of
regressions, the dependent variable is Pro Immig Opinion which ranges between 1 and 5 and is
higher the more pro-migration the individual is.30 See Annex Tables A6.1 and A6.2 for summary
statistics of Pro Immig Opinion and other variables used in the empirical analysis.
The analysis in this section draws on Facchini and Mayda (2008).
In particular, to construct the variable Pro Immig Opinion, we use respondents’ answers in the two rounds of the ISSP
survey to the following question: “There are different opinions about immigrants from other countries living in
(respondent’s country). By “immigrants” we mean people who come to settle in (respondent’s country). Do you think the
number of immigrants to (respondent’s country) nowadays should be: (1) reduced a lot, (2) reduced a little, (3) remain the
same as it is, (4) increased a little, or (5) increased a lot”? The survey format also allows for “can’t choose” and “not
available” responses which we treat as missing values and thus exclude from the sample in our specifications. To investigate
whether omitting missing values results in a selection bias, we also estimate a Heckman selection model and confirm the
robustness of the results in Table 6.2 (see Appendix A3 and A4).
29
30
93
Our general finding in Table 6.2 is that a key driver of attitudes towards migration is the skill
composition of migrants relative to natives. In particular, we find evidence that migrants’ skill
composition plays a key role in shaping the (perceived) income-distribution effects of migration,
through the labour market and the welfare state channels. In what follows, we describe the results of
Table 6.2 in more detail. As pointed out by the theoretical model, the two key individual-level
variables for the income-distribution effects are the level of education – which captures the impact
of labour-market effects on attitudes – and the level of income – which captures the effect of
welfare-state considerations on attitudes. The two variables are clearly correlated, since welleducated individuals tend to have higher incomes. This implies that it is problematic to analyze the
two channels independently from each other since the exclusion of one of the two variables would
produce an omitted variable bias in the estimation of the impact of the other variable. On the other
hand, while education and income are positively and significantly correlated, they are far from being
perfectly collinear31, which makes it possible to analyze them together. Thus, in the following
regressions, we introduce education and log of real income together in the same specification. In
regressions (1) and (1’), we constrain the coefficients on the two individual-level variables to be the
same across countries. We find that both variables have a positive and significant impact on promigration attitudes, both in 1995 and 2003.
Regressions (2)-(5) and (2’)-(5’) are more closely related to the theoretical model, which suggests
that the impact of education and income should be country-specific. In particular, the theoretical
model implies that the effect of individual skill and income should be a function of the relative skill
composition of natives to immigrants. Thus, we build the empirical (ordered probit) specification
around the following latent regression:
*
yic
= β1agei + β 2 malei + β 3educi + β 4 educi ⋅ RSC c + β 5 income + β 6 incomei ⋅ RSC c + ... + ε
*
The probabilities of the five ordered categories in the ordered probit model are based on y ic
, which
is unobserved. From theory we expect to find that the impact of education on pro-immigration
preferences is negative in countries that receive skilled immigrants ( β 3 < 0 ) and positive in
countries that receive unskilled immigrants ( β 4 > 0 ). Furthermore, if the tax adjustment model
holds, the effect of individual income should be positive in countries that receive skilled immigrants
( β 5 > 0 ) and negative in countries that receive unskilled immigrants ( β 6 < 0 ). On the other hand, if
the benefit adjustment model holds, the effect of individual income should be negative in countries
that receive skilled immigrants ( β 5 < 0 ) and positive in countries that receive unskilled immigrants
( β 6 > 0 ).
Since the relative skill composition of natives to immigrants is not available for many countries in our
samples, we use a proxy for it, namely the per capita GDP level in the same year. There are both
theoretical and empirical reasons for using this proxy. In the standard international migration model
with no productivity differences across countries, rich countries have a higher supply of skilled to
unskilled labour than poor countries, therefore lower skilled wages and higher unskilled wages. This
creates an incentive for unskilled migrants to move from low to high per capita GDP countries, while
skilled migrants will tend to move in the opposite direction. Therefore, this simple model predicts
that the relative skill composition of natives to immigrants is high in rich countries and low in poor
countries. To take into account the fact that, in reality, there exist productivity differences across
countries, we also provide empirical evidence that per capita GDP levels are positively associated
In the 1995 ISSP data set, the correlation is 0.25 (significant at the 1% level), while in the 2003 ISSP data set it is 0.38
(significant at the 1% level).
31
94
with the relative skill mix of natives to immigrants for all countries for which data is available. Figure
A6.1 and A6.2 illustrate this relationship for 1995 and 2003, respectively.
Once we account for cross-country heterogeneity in terms of the impact of individual-level variables,
we find that individual skill affects migration preferences as predicted by the theoretical model
(regressions (2) and (2’)). Consistent with the labour-market channel, education has a negative
impact on pro-migration attitudes in countries that receive skilled migrants on average, relative to
natives (low per capita GDP countries) and a positive impact in countries that receive unskilled
migrants on average, relative to natives (high per capita GDP countries). These results hold using
both the 1995 and 2003 data sets. In addition, these findings are consistent with the evidence in the
existing literature.
In an early influential study using the 1992 US National Election Study, Scheve and Slaughter (2001)
find that, in the United States – where immigrants are on average less skilled than natives – unskilled
workers are more likely to oppose immigrants, relative to skilled workers. Using the 1995 round of
the ISSP data set and the 1995-1997 round of the World Value Survey, Mayda (2006) provides strong
evidence that individual skill is positively correlated with pro-immigration attitudes in countries
where immigrants are on average unskilled, while it is negatively correlated with pro immigration
attitudes in countries where migrants are on average skilled, relative to the native population.32
O’Rourke and Sinnott (2005) find similar results.
We next analyze the role played by public finance considerations. Regressions (2) and (2’) are based
on the full sample of countries of each data set. Thus, it is not surprising that we do not find strong
evidence for the welfare-state channel. However, once we restrict the sample to countries with welldeveloped Western-style welfare states (regressions (3)-(5) and (3’)-(5’)), we find estimates which
are in line with the welfare-state predictions of the theoretical model, in particular in the case of the
tax adjustment model. Individual income has a positive impact on pro-migration attitudes in
countries that receive skilled migrants on average (low per capita GDP countries) and a negative
impact on pro-migration attitudes in countries that receive unskilled migrants on average (high per
capita GDP countries). These results are robust to controlling for the labour-market channel and hold
using both the 1995 and 2003 data sets. Thus, these estimates strongly confirm the findings of the
existing literature. Using U.S. data, Hanson, Scheve and Slaughter (2007) and Hanson (2005) find that
the negative relationship between education and anti-immigrant preferences – driven by the labour
market – becomes smaller in absolute value and sometimes positive in states with high exposure to
immigrant fiscal pressure. Using the 1995 ISSP data set, Facchini and Mayda (2009a) find that, in
countries where immigrants are unskilled relative to natives, individual income is negatively
correlated with pro-immigration preferences, while the correlation changes sign in destinations
characterized by skilled migration. See also Dustmann and Preston (2006, 2007) for the role played
by welfare-state drivers relative to other economic and non-economic drivers of attitudes.
Regressions (4) and (4’) show that these results are also robust to controlling for pro-immig crime,
pro-immig culture, and pro-immig economy, which measure the perceived impact of migration (by
the respondent) from respectively a crime, a cultural and a nation-wide economic point of view
(these three variables are higher the more positive the attitude of the individual towards migration
along that particular dimension). Finally, in columns (5) and (5’), we control for additional socioeconomic/ideological background variables – i.e. upper social class, trade union member, political
affiliation with the right and religious – and find very similar results. Thus, our findings on the labourmarket and welfare-state channels are not qualitatively affected by the introduction of noneconomic controls.
To conclude, and focusing specifically on skilled migration, the findings in Table 6.2 show that skilled
migration produces pronounced income-distribution effects. Interestingly, since the data are
32
See also Facchini and Mayda (2008).
95
consistent with the tax adjustment model, the income distribution effects implied by the welfarestate channel work in the opposite direction relative to the labour market. In particular, individual
skill and income have opposite effects on individual attitudes towards immigrants. Since education
and income tend to be positively associated, the labour market and welfare state channels partially
offset each other. For example, the very same skilled and high-income professional in Ireland may
feel ambivalent regarding the arrival of skilled immigrants since he might benefit with them from a
welfare-state point of view – through reductions in his tax burden – but be hurt by them through
labour-market substitution effects.
6.2.2
Empirical evidence on individual attitudes towards skilled migration (ESS)
In this section we analyze, more specifically, the determinants of individual attitudes towards skilled
migration. We use the 2002-2003 round of the European Social Survey (ESS), which covers a different
sample of countries than the ISSP data set and was run in a different period of time.33 The
immigration question we examine in the ESS data set is more specific than the one contained in the
ISSP survey, as it asks directly about skilled migration. To the best of our knowledge, this paper is the
first one to carry out an analysis of this question and, therefore, to provide direct evidence on the
determinants of attitudes towards skilled migration in a large cross-section of countries.34
In particular, in the ESS data set, respondents are asked whether they think it is important for
immigrants to have good educational qualifications. We construct the variable pro-skilled-migration,
which ranges between 0 and 10 and it is higher the more the individual favours skilled migration.
Summary statistics of pro-skilled-migration and the other ESS variables included in the regressions
are presented in Tables 6.3 and 6.4. The summary statistics provide information also on the per
capita GDP of the destination country (in 2002, PPP-adjusted), which come from the World
Development Indicators data set, and on the relative skill ratio of natives to immigrants, which uses
2002-2003 data on native and immigrant populations by level of education (lower secondary
education, upper secondary, tertiary) from Table I.12 in SOPEMI (2005).
Table 6.3
Summary statistics of individual-level variables (ESS)
Variable
pro-skilled-migration
year of birth
male
citizen
education (highest level attained)
real income
Obs
30975
30975
30975
30975
30975
30975
Mean
6.2273
1955
0.4831
1.0382
2.9868
2.8151
Std. Dev.
2.7452
17.5685
0.4997
0.1917
1.4918
1.7838
Min
0
1893
0
1
0
0.1111
Max
10
1988
1
2
6
12
The summary statistics show that public opinion on average supports skilled migration, but mildly so.
In the overall sample, the average of the pro-skilled-migration variable is 6.23. There exists variation
across countries but it is not substantial. All countries have average values of pro-skilled-migration
which range between 4.6 (corresponding to Sweden) and 7.7 (corresponding to Greece) and median
values which range between 5 (corresponding to Sweden and Norway) and 8 (corresponding to
Greece and Israel). Therefore, in all countries, and on average across countries, the mean and
median are greater or equal to the middle value of the variable (5), which ranges between 0 and 10.
For more information on the construction of the survey, see Jovell et al (2003). The data is made available by the
Norwegian Social Science Data Services.
34
The only other paper we could find which investigates the determinants of attitudes towards, specifically, skilled migrants
is Hainmueller and Hiscox (2008), which uses survey data for the United States only. This paper provides evidence which is
not consistent with labour-market and welfare-state predictions.
33
96
Table 6.4
Summary statistics of individual-level variables by country and of
country-level variables (ESS)
country
Austria
Belgium
Czech Republic
Denmark
Finland
France
Germany
Greece
Hungary
Ireland
Israel
Italy
Luxembourg
Netherlands
Norway
Portugal
Slovenia
Spain
Sweden
Switzerland
United Kingdom
pro-skilled- pro-skilledmigration
migration
(mean)
(median)
6.641365
7
6.097203
7
6.381974
7
6.243116
7
6.335023
7
6.21119
7
6.721546
7
7.738864
8
6.823139
7
6.11385
7
6.908894
8
5.841424
6
6.485214
7
5.592118
6
5.150543
5
5.975758
6
6.306743
7
6.135576
7
4.618788
5
6.218572
7
6.287578
7
education
3.348189
3.055944
3.111588
3.287962
2.971847
3.039401
3.373154
2.199889
2.289609
2.806338
3.502169
2.317152
2.742607
3.042857
3.51164
1.686869
3.378289
2.097859
3.090661
3.334807
3.055587
real income
3.013095
2.780771
1.816185
3.563468
3.211368
2.345164
3.216287
2.107014
1.068756
1.907975
1.975383
2.274649
3.338771
3.402215
3.769239
2.042577
1.525227
2.140123
3.293816
4.539899
3.754944
per capita
gdp
29014.66
27459.14
16556.42
28956.7
26018.38
26612.92
25545.68
18834.2
14159.44
35652.91
22002.85
25554.43
59976.5
29550.49
34750.03
18398.29
18017.7
22444.72
26468.27
31019.92
27175.5
relative skill
composition
(2002-2003)
3.141503
1.804188
2.641453
1.163756
1.244552
3.508463
5.656399
0.8265503
0.6697858
0.4042847
.
.
2.054675
1.65946
1.422166
0.3274704
.
0.5475358
1.415028
5.193212
2.038001
Summary statistics in these tables are based on the same observations as in regression 3, Table 6.5. These summary
statistics do not use design and population size weights. Pro-skilled-migration ranges between 0 and 10 and it is higher
the more the individual thinks that it is important for immigrants to have good educational qualifications. education
(highest level attained) goes from 0 to 6 (not completed primary education; primary or first stage of basic; lower
secondary or second stage of basic; upper secondary; post secondary, non-tertiary; first stage of tertiary; second stage of
tertiary). Real income is household's total net income (expressed on a scale from 1 to 12) divided by the number of
household members. Per capita GDP in 2002 (PPP, constant 2000 international $) is from the World Bank. The relative
skill composition (RSC) is the ratio of skilled to unskilled labour in the native relative to the immigrant populations. For
both natives and immigrants, the ratio of skilled to unskilled labour is measured as the ratio of the number of individuals
with upper secondary or tertiary education to the number of individuals with lower secondary education. The RSC uses
data on the stock of immigrants and natives in 2002-2003 (OECD 2005).
Using pro-skilled-migration as the dependent variable, we estimate ordered probit models which
include, as regressors, country dummy variables and have robust standard errors clustered by
country.35 We find evidence which is remarkably consistent with the predictions of the theoretical
model and with our findings in the previous section. Table 6.5 presents the results of our estimation.
First, the higher the education level attained by the respondent, the lower is the probability that he
favours good educational qualifications of immigrants. This result suggests that skilled natives feel
threatened by the labour-market competition of skilled migrants. At the same time, the higher the
level of income of the respondent the higher is the probability that he supports skilled migration. This
result is consistent with the tax adjustment mechanism of the welfare state model. In particular,
skilled migration is likely to represent a net contribution for the destination country’s welfare state.
The reduction in tax rates implied by the arrival of highly-qualified foreign workers benefits both
poor and rich respondents, but the rich to a greater extent than the poor.
Table 6.5
35
Determinants of individual attitudes towards skilled migration (ESS)
As recommended in the ESS website, our estimation uses both design and population size weights.
97
Ordered probit with country dummies
Dependent variable
year of birth
male
citizen
education (highest level attained)
1
-0.0067
0.0011**
0.0396
0.0119**
0.0376
0.0589
real income
trade union member
2
3
pro-skilled-migration
-0.0057
-0.0054
0.0013**
0.0014**
0.0499
0.0294
0.0116**
0.0137*
0.0364
0.021
0.0657
0.0663
-0.0603
-0.0714
0.0133**
0.0143**
0.0084
0.0037*
rural (area of residence)
political affiliation with the right
religious
concerned about security
importance of traditions and customs
Observations
Pseudo R-squared
39035
0.01
38785
0.01
30975
0.01
4
-0.0047
0.0011**
0.0681
0.0143**
-0.0062
0.052
-0.0613
0.0174**
0.0145
0.0069*
-0.0321
0.0166+
0.0096
0.0162
0.0515
0.0109**
-0.0037
0.0031
0.0991
0.0091**
0.0353
0.0056**
25378
0.02
The table reports coefficient estimates for ordered probit regressions (the cutoff values are not shown). Robust standard
errors, clustered by country, are presented under each coefficient. As recommended in the ESS website, our estimation
uses both design and population size weights. + significant at 10%; * significant at 5%; ** significant at 1%. All regressions in
this table control for country fixed effects. Pro-skilled-migration ranges between 0 and 10 and it is higher the more the
individual thinks that it is important for immigrants to have good educational qualifications. education (highest level
attained) goes from 0 to 6 (not completed primary education; primary or first stage of basic; lower secondary or second
stage of basic; upper secondary; post secondary, non-tertiary; first stage of tertiary; second stage of tertiary). Real income is
household's total net income (expressed on a scale from 1 to 12) divided by the number of household members.
We also find that older respondents (i.e., respondents with a less recent year of birth), males and
individuals affiliated with the political right are more likely to favour good educational qualifications
for immigrants. On the other hand, surprisingly, trade union members are less likely to support
skilled migration. In addition, consistent with the discussion on the non-economic determinants,
individuals who are concerned about security and those who value traditions and customs,
respectively, are in favour of skilled migration.
6.3
From individual preferences to immigration policy
In this section and the next, we describe how individual attitudes translate into migration policy
outcomes. We first adopt a median-voter framework and, next, we analyze the interest-groups
model.
6.3.1
The median voter model
What is the migration policy chosen by a pure democracy? The median-voter approach – pioneered
by Benhabib (1996) – considers the human capital requirements that are imposed on potential
98
immigrants by an income-maximizing community under majority voting.36 In Box 2 we use a similar
median-voter framework and, focusing on the labor-market channel, we develop a theoretical
model, which gives predictions in terms of the levels of skilled and unskilled migration. In our model,
skilled and unskilled labour is combined to produce one single output good. As we show, if the
median voter is unskilled, he will choose to admit an immigrant population which is skilled compared
to natives. On the other hand, if the median voter is skilled, he will choose to admit an immigrant
population, which is unskilled compared to natives. More in general, the median-voter model
predicts that policies are driven by public opinion, a summary measure of which is the opinion of the
median voter. This is the prediction we bring to the data.
6.3.2
The pressure group model
While the median voter model is a useful framework to understand the process of aggregation of
individual preferences into migration policy, it is hardly able to capture the complexity of the political
process in modern democratic societies, in particular when it comes to shaping policies towards the
highly skilled. As a matter of fact, there is substantial anecdotal evidence suggesting that interest
groups – on behalf of specific subsets of society – have been actively involved in shaping policies
towards immigration. In the United States, professional associations representing highly-qualified
native workers have played an important role in limiting the inflows of foreign skilled migrants. For
example, recently the Institute of Electrical and Electronics Engineers (IEEE) has been active in
demanding a reduction in both the number of H1B visas for highly skilled professionals, and L1 visas
for highly skilled intra-company transferees37. Similarly, as documented in a recent study by Glied
and Sarkar (2009) on the role of professional associations in shaping immigration policy, “…the
profession of medicine exerts a significant influence on the rate of skilled migration of foreign
physicians.”
At the same time, there is ample evidence on the efforts of pro-immigrant lobbies – representing the
business sector – in shaping migration policy. For example, during the boom of the late nineties,
Silicon Valley entrepreneurs trooped in front of Congress asking for an increase in the number of H1B
visas for highly skilled professionals, and warning of a looming Y2K disaster if the large number of
foreign engineers and computer scientists they requested was not allowed to enter the country
(Goldsborough 2000). Interestingly, this pattern is common across many destination countries. For
instance, in August 2006, at the peak of the debate in the UK on whether to put a cap on migration
from Bulgaria and Romania once the two countries became members of the European Union, the
Business for New Europe group (BNE) issued a statement saying that “...the UK should continue with
its open door policy.” The heads of the supermarket chain Sainsburys and the head of the European
division of the investment bank Merrill Lynch were among the signatories of the statement.
To formally study the role played by pressure groups in shaping policy towards international factor
mobility, Facchini and Willmann (2005) develop a simple theoretical model, which is based upon the
menu auction framework pioneered by Bernheim and Whinston (1986). In their setting, policy is
determined as the result of the interaction between organized groups representing production
factors, who maximize the net welfare of their members, and an elected politician who – in
determining policy – trades off aggregate welfare vis-à-vis political contributions. Using a one-good
multiple factors framework, Facchini and Willmann (2005) find that policies depend on both whether
a production factor is represented or not by a lobby and on the degree of substitutability/
complementarity between domestic and imported factors. In particular, the paper shows that a nonorganized factor will not be able to influence the policy determination process. Secondly, an
Ortega (2005) extends this model to a dynamic setting. For a survey of the literature on the political economy of
migration policy, see Facchini (2004), while for a review of the literature that looks at the welfare-state dimension, see
Krieger (2005).
37
See www.ieee.org.
36
99
organized factor will instead be effective in reducing the inflows of a substitute factor and in
increasing the inflows of a complement factor. Thus, this model is able to rationalize both the intense
lobbying activities recently carried out by doctors and healthcare providers in the United States –
which resulted in the introduction of the new H1C visa category in 1999 for foreign nurses – and the
fierce opposition of professional associations representing local nurses. The working of the median
voter and interest groups models is summarized in Box 2.
Box 2: The political economy of international factor mobility
We outline here two simple models that can be used to understand the political economy of
international factor mobility. Consider a small open economy, where GDP is produced using two
factors: skilled ( LS ) and unskilled labour ( LU ), according to a production technology Y=F ( LS , LU ) .
Production factors can relocate to the country from the rest of the world, but their flows are
controlled by policies implemented by the national government. To take into account potential
crowding effects, we assume that the production function exhibits decreasing returns to scale in the
mobile factors. As a result, profits (π) are strictly positive in equilibrium. The country is populated by
a continuum of agents and the total size of the population is normalized to one. Each agent in the
interval [0,1] is indexed by i, and the domestic supply of each (mobile) factor is inelastic and equal to
(lS , lU ) . For simplicity, we choose GDP as the numeraire, normalize international factor prices by
setting them equal to 1 and assume the profits generated in the economy to be lump sum equally
distributed among all citizens. Domestic factor prices are represented by ω = (ω S , ωU ) . We model
restrictions to the relocation of production factors across countries as a quota, accompanied by a tax
levied on the relocating factor. As a result, the relocating factor retains a share of the surplus
associated with the relocation, while the remainder is captured by the host country’s government in
the form of additional tax revenues which are lump sum rebated to the domestic population.
A median voter model
Let λi, j be the fraction of factor j ∈ ( s, u ) supplied by agent i, with ∫ λi , j di = 1 , for all j.
Furthermore, assume that each agent is endowed with an identical amount of time, that must be
allocated to the supply of the two factors, that is λi , j = 1 + (1 − λi , j ' ) for all i ∈ [0,1], j ≠ j ' . As a
result, the total endowment of the two factors in the economy is the same.
Let m j be the quantity of factor j imported (exported, if negative) by the country and let γ j be the
share of the rent on factor j captured by the government and assume that the revenues from the
policy are lump sum rebated to all citizens. The utility function of citizen i is then represented by
ui (ω ) = ∑ λij l jω j + ∑ γ jT j + π
j
(11’)
j
The first term captures factor income, the second represent the revenues of the policy
( T j = (ω j − 1)m j ) that are lump sum rebated to the agents and the third term captures the profits –
which can also be interpreted as the return to an immobile factor. Assuming that the production
function is separable in each input,38 let q j = φ j ω j be the quota implemented by the government
( )
( )
on the inflow of factor j, with φ ' j ω j < 0 . Given our assumptions, φ j can be inverted, and we can
( )
express ω j = φ j−1 q j . This means that a more restrictive quota leads to a higher domestic factor
This is a technical assumption we need to address the multidimensionality of the voting problem. See Helpman (1997)
and Facchini and Testa (2006) for a discussion.
38
100
return. Let λmj be the share of the factor owned by the median voter. Assuming ui (ω ) to be strictly
concave, we can derive the policy that maximizes the well being of the median voter, which is given
by:
( )
φ −1 q j − 1 =
[
1
L j (1 − γ j ) − (λmj − γ j )l j
γ jm j '
]
(12’)
To gain some intuition for this result, let us focus on the case in which rent capturing by the host
country’s government is complete, i.e. γ j =1. Equation (12’) then simplifies to:
φ −1 (q j ) − 1 = −
1
(λmj − 1)l j
mj'
(13’)
The left hand side of (13’) describes the amount of protection granted to the domestic factor in
terms of the difference between the return prevailing on the domestic market and the return
fetched by the factor on the international market. Obviously, the higher is the quota, the smaller is
the amount of protection granted to the factor. Notice also that − 1 / m j ' is positive, as the import
demand is a decreasing function of the factor price. If the median voter owns more than the average
share of the population of factor j, i.e. if λmj − 1 > 0 , then factor j will be protected, i.e. the imports
of the factor will be limited by a quota that leads the domestic price to be higher than the price
prevailing on international factor markets. At the same time, this implies that factor j’ imports will be
subsidized. In other words, if the median voter is more unskilled than average, he will be both in
favor of admitting skilled migrants and of restricting entry of unskilled migrants, that is, he will be in
favor of a migration inflow which is skilled compared to the native population. The protection
received by the factor is increasing with the importance of the factor ( l j ), while it is decreasing with
the size of the distortion induced by protection, which is captured by the sensitivity of the import
demand to price variations ( m 'j ).
A Lobbying model
Consider now an alternative framework, which is a simplified version of the model developed in
Facchini and Willmann (2005). Here the policy choice, rather than the result of direct democracy, is
modelled as the outcome of the interaction between organized pressure groups and an elected
politician. Assume that a subset Λ of the production factors is organized and lobbies an elected
politician to shape policy towards factor movements. The game is modelled as a menu auction,
where in the first stage organized groups offer the elected official contributions Ci (ω ) that depend
on the entire vector of domestic factor prices, while in the second stage the government chooses the
policy to be implemented and receives the lobby’s payments.
Each organized group maximizes the total income of its members, net of the contributions paid to
the politician. Denoting by α j the share of the population that owns factor j, the gross payoff
received by each factor, lobbying or not, is given by:
g j (ω ) = ω j l j + α j [π + ∑ γ j T j ] ,
(14’)
j
The government trades off aggregate welfare vis-à-vis political contribution and thus maximizes:
W (ω ) = a ∑ g j (ω ) + ∑ C j (ω ) ,
j∈J
j∈Λ
(15’)
101
where a is the weight attached to aggregate welfare. Solving the game, we can show that the
interaction between the organized groups and the government results in a policy towards factor
mobility that takes the following form:
φ −j 1 (q j ) − 1 = −
(I − α Λ )li
− (1 − γ i )(Li − li )
∑ F ji i
γ j i∈I a + α Λ
1
(16’)
To gain more intuition, let us assume once again that rent capturing is complete, i.e. γ j =1 and that
factors are neither complements nor substitute, i.e. that F ji = 0 . Equation (16’) then becomes:
I j − αΛ l j / mj
⋅
a + αΛ ε j
φ j−1 (q j ) − 1 =
(17’)
where I j is an indicator that is equal to one if the factor is organized, and zero otherwise, α Λ is the
share of the population that is engaged in lobbying activities, and ε j is the import demand elasticity.
Factor j thus receives positive protection, i.e. there is a positive differential between the domestic
factor return and the international price as long as it is actively represented by a lobby. As in the
median voter setup, protection is a function of the relevance of the factor for the domestic economy.
In particular, protection is positively correlated with the number of native workers if such workers
are politically organized. The opposite is true if native workers are not politically organized. Finally,
protection is decreasing with the distortion introduced by the policy. What happens if we consider
the more general situation in which production factors can be complements or substitutes? If factor i
and j are complements then F ji > 0 , while if they are substitutes then F ji < 0 . From the first term
in equation (16’) we can then see that, if the two factors are complements, the lobbying efforts of
factor i will have a detrimental effect on the protection granted to factor j (and the more so, the
higher the number of native workers who own factor i), and the opposite is true if the two are
substitutes.
6.4
Empirical assessment
In this section we first investigate whether voters’ attitudes towards skilled migration are consistent
with skill-selective migration policies, if preferences are aggregated through a simple majority-voting
mechanism. We next turn to analyzing the role played by interest-groups dynamics.
6.4.1
From preferences to policies: Does the median voter rule?
In this section, we analyze the variation across countries in skilled migration policies, as a function of
the opinion of the median voter and, in general, public opinion towards skilled migration. In Figure
6.4, we correlate the policy on highly skilled workers in each country in 2007 – from the United
Nations data set – with the opinion on skilled immigration of the median voter in that country in
2002-2003 (we use the variable pro-skilled-migration (median) from the ESS data set, see Table 6.6).
In Figure 6.5, we consider the impact on the 2007 skill-selective policy in each country of average
attitudes towards skilled migration in that country in 2002-2003 (we use the variable pro-skilledmigration (mean) from the ESS data set, see Table 6.6). Both figures show no correlation between
public opinion and policies.
102
Figure 6.4
The impact of individual attitudes towards skilled immigrants (2002-2003)
on skilled-migration policies (2007)
highskillworkersRECw_oMV
policy on highly skilled workers, 2007
3
fitted policy on highly skilled
NOR
NLD
DNK
GER
CHE
GBR
CZE
FRA
FIN
IRL
SWE
PRT
SVN
AUT
BEL
ESP
ISR
5
6
7
8
2.5
2
median pro-skilled-migration
It is interesting to compare Figures 6.4 and 6.5 to the evidence provided in Facchini and Mayda
(2009b) in relation to overall migration policies. That paper constructs very similar figures using
information on policies and public opinion towards overall migration. It shows that overall migration
policies are positively correlated with the opinion of the median voter and, in general, public opinion
towards overall migration across countries. Thus, the median voter model appears to work much
better in explaining overall migration policies as compared to skill-selective migration policies.
Figure 6.5
The impact of individual attitudes towards skilled immigrants (2002-2003) on
skilled-migration policies (2007)
fitted policy on highly skilled
highskillworkersRECw_oMV
NOR
policy on highly skilled workers, 2007
3
NLD
IRL CHE
DNK
FRA
GBR
CZE
FIN
GER
2.5
SWE
2
4
PRT
ESP
BEL
5
6
average pro-skilled-migration
SVN
AUTISR
7
103
Table 6.6 provides additional evidence on the importance of public opinion in shaping policies
towards skilled migrants. To facilitate the interpretation of the statistics, we order countries by
increasing values of pro-skilled-migration (mean), which appears in the first column of the table. In
the second and third columns, respectively, we show the median value of pro-skilled-migration and a
summary measure of policy on highly skilled workers. Out of the top five countries where public
opinion is most in favour of good educational qualifications of immigrants (Slovenia, Austria,
Germany, Israel and Hungary), no one has actually policies in place to raise the migration of highly
skilled workers. Only Germany implemented some incremental policy changes in this direction. On
the other hand, among the three countries whose voters are least concerned about the skill
composition of migrants (Sweden, Norway, and the Netherlands), two of them (Norway and the
Netherlands) have skill-selective policies in place (according to the United Nations data).
The evidence in Figures 6.4 and 6.5 and Table 6.6 is only anecdotal, for a number of reasons: for
example, it is based on a small number of countries, which are the only ones with data on both public
opinion and policies; it does not take into account Canada, Australia and New Zealand, which have
been actively engaged in skill-selective policies. However, this evidence provides very little support
for a median-voter explanation of policies towards skilled migration.
Table 6.6
Does the median voter rule?
pro-skilled-migration pro-skilled-migration
(mean)
(median)
Sweden
Norway
Netherlands
Italy
Portugal
Spain
Ireland
Belgium
Switzerland
Denmark
Luxembourg
France
United Kingdom
Finland
Czech Republic
Slovenia
Austria
Germany
Israel
Hungary
6.4.2
4.6269
5.1477
5.6520
5.7260
6.0586
6.0938
6.1062
6.1169
6.2178
6.2653
6.2751
6.2903
6.3077
6.3266
6.3285
6.3300
6.6670
6.7234
6.7531
6.8384
5
5
6
6
6
7
7
7
7
7
7
7
7
7
7
7
7
7
8
7
Policy on highly
skilled workers
Maintain
Raise
Raise
No intervention
Maintain
Maintain
Raise
Maintain
Raise
Raise
Raise
Raise
Raise
Raise
Maintain
Maintain
Raise
Maintain
No intervention
The pressure group model at work: Evidence from the H1B visa program
An interesting context to empirically assess the role played by lobbying groups in the shaping of
immigration policy towards highly skilled workers is represented by the H1B visa program in the
United States. As we have discussed in Chapter 2, the H1B visa program in its current form has been
introduced in the Immigration Act of 1990. Under the original legislation, the number of visas to be
104
issued was capped at 65,000 per year, but this has been subsequently increased to 115,000 in 1998
and again to 195,000 in 2000, and reverted back in 2004 to 90,000. How are the visas allocated
among different sectors of the economy?
Following the introduction of the Lobbying Disclosure Act of 1995, lobbying organisations have been
required to provide a substantial amount of information on their activities. Starting from 1996, all
lobbyists must file reports to the Secretary of the Senate's Office of Public Records (SOPR) and the
Clerk of the House of Representatives which list the name of each client (firm or professional
association/union) and the total income they have received from them to lobby on their behalf. At
the same time, all firms with in-house lobbying departments are required to file similar reports
stating the total dollar amount they have spent in lobbying. Importantly, legislation requires the
disclosure not only of the dollar amounts actually received/spent, but also of the issues for which
lobbying is carried out. Immigration (IMM) is one of the issues for which lobbying is carried out. The
reports filed by two major US academic institutions, the University of California system and Harvard
University, and by Microsoft Corporation are reported in Annex Figures A6.3, A6.4 and A6.5,
respectively. 39
Figure 6.6
Top 10 Spenders for Immigration, 2001-2005
1600
1400
thousands of US-$
1200
1000
800
600
400
200
0
lt u
ic u
gA r
fi
O f
m
ce
re
d
an
en s
hi
ac
m
co
u
an
ts
u c
or d
rv
se
se s
de p
t
in
us
e la
su b
dn r
o
a
ne
od
lla
Fo
ci s e
M
r m
te
pu
s
ic e
A
ir
tra
po
ns
rta
t io
n
ne
h o
le e p
T
ra
le g
Te
ph
it a
sp
H o
ls
t io
ca
dE u
l
n a
ee
g in
En
rv
se
s
ic e
d
an
nr i g
m
co
te
pu
r
rv
se
s
ic e
Between January and March 2008, the UC system spent US $ 270,000 in lobbying, while Harvard’s
total spending amounted to US $ 235,000 for the period April–June of the same year. For both
institutions, lobbying on immigration is an important issue: the UC system lists explicitly H1B visa
issues as the specific item of interest, while Harvard refers more generally to “student, scholar visa
issues”. In its report, Microsoft lists immigration as a general issue and, among the specific issues,
H1B visas and L1 visas.
Data on lobbying expenditures has been systematically collected by the Center for Responsive
Politics in Washington DC, and has been used in a recent paper by Facchini, Mayda and Mishra (2008)
to analyze the effect of immigration lobbying on the allocation of work and related visas across
We only show two pages of each report, i.e. the first page with information about the client and its total amount of
lobbying expenditures and the page related to migration.
39
105
sectors of the economy. Figures 6.6 and 6.7 – taken from Facchini, Mayda and Mishra (2008) –
illustrate respectively the top ten sectors by spending on immigration issues, and the top ten work
visa-receivers. Interestingly, human capital intensive sectors, like “educational services” and
“engineering and computer services” appear at the very top of both distributions.
Figure 6.7
Top 10 Sectors with the Highest Number of Visas, 2001 - 2005
300
thousands of US-$
250
200
150
100
50
s
re
m
co
la
ic e
n a
ls
er
v
M
is c
el
la
En
gi
n
ee
rin
g a
n d
re
n a
la
nd
t io
p u
te
d
te
m
an
d
Ed
u c
a
r s
er
v
ic e
s
A g
r ic
ul
tu
s
ic e
se
ot
io
n
rv
Fo
re
re
pi
ct
u
v is
io
n
rs
ne
o u
s p
ro
fe
ss
io
Th
ea
te
b r
o
ad
ca
st
in
g a
nd
te
rta
le
in
m
ic e
ne
o u
se
n t
e
u s
se
rv
M
is c
el
la
re
e lf
a
W
R a
d i
o
M
ed
ic a
la
n d
ot
h
an
d
re
lig
io
er
he
al
th
se
rv
ic e
s
s
en
t
s
st
ry
0
Drawing from Facchini, Mayda and Mishra (2008), in the next figures we focus on highly skilled
workers – in particular, those admitted to the US under the H1B visa program – and investigate the
role of business lobbying groups and professional associations/trade unions in shaping the allocation
of H1B visas across sectors. We expect that – in a given industry – the former will lobby to increase
the number of H1B visas, as skilled labour complements capital, while the latter will lobby in the
opposite direction, as foreign qualified workers compete with members of professional associations
and unions.
Figure 6.8 shows that sectors in which employers spend more on migration lobbying tend to have a
higher number of H1B visas as a share of total employment. On the other hand, Figure 6.9 suggests
that sectors in which labour unions and professional associations are more active – as measured by
sectoral membership rates40 – tend to see a lower number of highly skilled foreign workers
employed. The evidence highlighted in the figures finds further support in the regressions reported in
Table 6.7, which control for a series of sector-specific drivers of immigration – both demand-side
factors and supply-side factors. Interestingly, the relationships between interest groups activity and
the number of H1B visas are not only statistically significant, but also quantitatively important. 41 The
estimated effects imply that an increase by 10 per cent in firms’ lobbying on migration is associated
with an increase by 1.8 per cent in the number of H1B visas per native worker allocated to that
particular sector. Similarly, a one percentage point increase in union membership – for example,
moving from 10 to 11 percentage points, which amounts to a 10 per cent increase in the union
membership rate – reduces it by 3.6 percent.
40
41
For details on the variable definitions etc, see Facchini, Mayda and Mishra (2008).
These results are also robust to addressing endogeneity and reverse causality issues using an IV strategy.
106
Figure 6.8
388
898
-4
426
-6
579
-8
806
627
598
848
637
-10
647
526
468
696
616
317 626
698
697
656
849
658596
659
527
679
657
636
687
686
699
689
387
899 347
357
807
487
348399 726
588467 226
448 367
206
888
488
477669
546
356
879
868 617
859
489
857 377 418
869
836
216
386
716808
376
417
326
408
469
606586
556
319
236318
856 567609
478
316
607 358
116 407
378
308
746
337618
456
309
587
476
409 817
858105 668619 688
126 608
896
816
246
916416
336
536
667 419
338458
516
457
346
406
646
306
307
826
846
-12
Number of H1B visas as a ratio of natives (in logs)
-2
Scatter Plot - Lobbying Expenditures for Immigration and Number of H1B Visas
578
936
-10
-5
0
5
Lobbying expenditures for immigration as a ratio of natives (in logs)
(mean) lgh1b
Figure 6.9
Fitted values
388
898
-4
426
579
-10
-8
-6
387
899
347
357
807
726
487
348
588
467 399
806449
226
627
367
436
448 379
206 888 598
848
488 568
477
669
546
356
437
459 869 857
879
868836
468
617
489
429 466
377
216
418
386 859
716
696808
417
326
616
586 376
469
606
556
319 408
567
236
318
736
856
626
358 446
607
609
116478
618
637
378 337 316 597
308
746
407 317
439
456
309
698
697
587
476
656
409
438
849
608
817
858
619
658
688
668
596
659
105
126
527
896
679
657
816
416
336
536
916
647
419 246636
667
338
687
516
458
686689
699
457
346
526
406
646
306
578
826
307
846
936
-12
Number of H1B visas as a ratio of natives (in logs)
-2
Scatter Plot - Membership Rates in Unions & Employee Professional
Associations and Number of H1B Visas
506
906
0
.2
.4
.6
Union membership rates
(mean) lgh1b
Fitted values
.8
107
6.5
Conclusions
To conclude, we find that attitudes towards skilled migrants are consistent with the predictions of
economic models. More educated natives are less likely to favour high educational qualifications of
migrants across several countries – consistent with the labour-market channel – while richer
individuals are more likely to – consistent with the welfare-state channel under the tax adjustment
model. In addition, we do not find evidence consistent with the median voter model, which suggests
that public opinion does not play a key role in shaping policies towards skilled migration. On the
other hand, we show that interest groups are actively engaged and effective in affecting policies
towards skilled migrants. Our results are not surprising. While public opinion has a perception of the
effect of skilled migration which is “correct” – i.e., consistent with what economic models predict – it
appears to count less in shaping policies towards skilled migration than in affecting the overall
number of migrants (see Facchini and Mayda 2009b). Instead, interest groups representing specific
segments of society (firms who benefit from and professional native workers who are hurt by the
arrival of qualified foreign workers) appear to play a much more active role in this policy dimension.
Does our analysis explain the strong status quo bias discussed in Chapter 2 – i.e., the slow progress
towards skill-selective immigration policies in several OECD destination countries? Our answer is yes,
but only in part. On the one hand, we do find evidence of one important source of opposition to the
arrival of foreign talents. Skilled native workers – organized in interest groups, i.e. professional
associations/unions – are vocal and effective in reducing the number of visas for skilled migrants in
one of the most important destinations of migration flows, the United States, according to our
analysis. However, our results show that also pro-skilled migration interest groups – i.e., groups that
lobby on behalf of business owners – are powerful in shaping (increasing) the number of skilled
immigrants in the United States. Therefore, how do we explain the status quo bias in skill-selective
immigration policies?
One possibility is that, while the two groups – in favour and against skilled migration – are both
effective, the impact of pro-skilled migration interest groups on long-term reforms of the migration
system might be hindered by lack of consensus on how best to proceed. For example, in the United
States, the establishment of a point system has been slowed by opposition of business groups who
do not want to lose flexibility in hiring skilled migrants, which would happen given the bureaucracy of
a point system.
Another explanation is that, although public opinion does not appear to have an important effect on
the skill bias of migration policies, the opposite is true as regards policies that affect the overall
number of migrants. In other words, policymakers do take public opinion into account as they
formulate policies regarding the overall number of immigrants (see Facchini and Mayda 2009b).
Therefore, policymakers might be reluctant to encourage increases in the number of skilled migrants
since, to the extent that a given number of unskilled migrants will come no matter what (for
example, as illegals or through family reunification), this will imply increases in the total number of
migrants, to which public opinion is opposed.
Alternatively, we can assume that policymakers are in control of the number of both skilled and
unskilled migrants who arrive to their country. In that case, given that public opinion is willing to
absorb only a limited total number of immigrants, there exists a trade off between the number of
skilled migrants and the number of unskilled migrants admitted by policymakers. In that case, what
counts is the relative power of industries which favour skilled versus unskilled migration.
Policymakers may not be willing to disappoint powerful sectors – such as agriculture, construction,
textile and apparel – which rely on large numbers of unskilled migrants.
108
What do we expect looking forward? Our guess is that more and more countries will try to
implement skill-selective immigration policies. The reason is that, notwithstanding the opposition of
some skilled native workers and the difficulty of reaching a consensus on the best way to set up a
skill-selective immigration policy, the gains are too big to be forgone.
We know that, from the point of view of each destination country, there are large gains from setting
up a skill-selective migration policy (see Chapter 5). In the next chapter, we ask whether there are
also some unintended side-effects from these policy changes.
Annex Tables and Figures
Table A6.1
Summary Statistics of Individual Attitudes towards Immigration (ISSP 1995) and
country-level variables
24.72
17.19
20.58
25.75
22.37
23.77
24.19
13.56
30.31
21.82
20.05
30.99
31.65
29.26
27.14
17.53
22.15
24.51
29.92
26.64
29.25
25.19
24.59
37.74
9.77
32.89
21.14
17.37
25.89
13.51
55.35
19.87
35.03
17.19
30.79
24.06
27.32
25.63
19.91
22.28
24.3
31.76
45.49
21.88
21.83
26.27
2.93
2.17
12.17
1.9
1.74
2.8
0.71
15.6
2.56
10.11
0.26
4.42
8.59
5.7
7.2
4.13
3.99
1.81
1.35
6.39
4.13
4.58
4.82
0.81
1.54
5.99
0.27
0.54
1.06
0.71
2.24
0.82
2.95
0.13
0.68
2.22
1.21
3.77
1.82
1.46
0.65
0.39
1.07
2.11
2.14
1.60
missing values
(6)
increased a
little (4)
28.36
32.58
16.48
39.75
48.07
40.1
55.95
6.63
41.76
13.38
49.74
26.37
26.79
29.53
31.91
25.92
16.08
30.22
29.92
8.77
35.66
29.69
29.60
increased a lot
(5)
remain the
same as it is
(3)
Austria
Bulgaria
Canada
Czech Republic
Germany
Great Britain
Hungary
Ireland
Italy
Japan
Latvia
Netherlands
New Zealand
Norway
Philippines
Poland
Russia
Slovak Republic
Slovenia
Spain
Sweden
USA
Overall
reduced a
little (2)
Country
reduced a lot
(1)
Pro Immig Opinion
5.45
36.74
11.9
11.2
9.9
6.38
4.94
6.62
4.67
16.72
12.63
6.75
6.68
6.98
4.36
30.68
34.05
18.51
6.66
11.64
6.97
16.57
13.12
average
Pro
Immig
Opinion
(7)
2.19
1.78
2.67
1.84
1.72
1.94
1.59
2.93
1.85
2.61
1.64
2.16
2.23
2.14
2.20
2.11
2.28
2.00
2.06
2.60
2.01
2.09
2.13
median average
average
Pro
Proeduc
Immig
Immig
years
Opinion Dummy
(10)
(8)
(9)
2
1
3
2
1
2
1
3
2
3
1
2
2
2
2
2
2
2
2
3
2
2
2
3.95
5.87
20.61
2.44
2.54
4.13
1.48
19.10
3.55
15.68
0.45
5.47
11.59
7.43
11.47
8.58
8.25
3.02
1.86
8.44
6.71
8.05
7.39
median
educ
years
(11)
10.36
9
14.76
12.91
10.92
11.32
10.49
12.25
11.03
11.87
11.61
12.69
14.31
12.66
9.39
10.29
11.19
11.84
10.68
10.13
11.41
13.43
11.68
15
12
10
11
11
12
12
12
11
12
14
12
10
10
11
12
11
9
11
13
12
relative
per
skill mix
net
capita (natives migration
GDP (12) vs. imm) 2000 (14)
(13)
22090
5609
23085
12426
21479
19465
9315
17264
20513
23212
4919
20812
17706
24694
3519
6606
7093
8487
12978
15163
20031
27395
15630
2.53
1.67
4.09
2.25
0.40
0.64
2.69
0.47
1.34
1.79
0.0011
-0.0012
0.0048
0.0010
0.0028
0.0019
0.0020
0.0047
0.0021
0.0004
-0.0047
0.0020
0.0010
0.0030
-0.0024
-0.0004
0.0032
0.0003
0.0008
0.0033
0.0014
0.0044
0.0014
Data source: 1995 ISSP National Identity Module. The survey sample excludes non-citizens. Pro Immig Opinion uses answers to the immigration question ("Do you think
the number of immigrants to (R's country) nowadays should be ...": reduced a lot, reduced a little, remain the same as it is, increased a little, increased a lot) and ranges
from 1 (reduced a lot) to 5 (increased a lot). Pro-Immig Dummy equals one if Pro Immig Opinion is equal to 4 or 5, zero if Pro Immig Opinion is equal to 1, 2 or 3. Both
variables exclude missing values. net migration is equal to the net migration inflow, divided by the destination country's population, in 2000 (source: United Nations). All
other variables are for the year 1995.
109
Table A6.2
Summary Statistics of Individual Attitudes towards Immigration (ISSP 2003) and
country-level variables
34.71
29.94
20.11
34.51
29.23
4.76
35.93
36.97
22.30
19.39
14.81
27.23
30.73
26.68
28.58
30.01
23.86
25.28
19.28
37.67
28.97
39.10
10.26
25.15
43.34
34.52
35.66
26.95
45.64
18.01
46.41
28.66
42.18
27.32
15.81
5.25
2.26
19.92
4.84
2.38
7.87
18.70
4.09
2.79
3.41
1.67
7.32
12.10
8.44
1.51
2.47
10.70
5.01
11.50
3.52
2.38
1.64
7.14
2.48
17.57
5.80
8.05
5.11
3.33
12.80
5.47
3.95
6.63
5.72
1.03
0.85
5.99
1.61
2.38
1.21
3.02
2.20
0.90
1.76
0.39
1.06
13.92
2.36
0.63
0.95
3.06
1.13
5.58
1.72
0.59
1.68
2.09
0.37
5.32
2.44
2.27
0.32
1.09
5.89
3.34
2.81
2.48
missing
values (6)
19.65
26.75
18.89
18.65
37.23
30.95
21.63
15.61
21.38
23.66
22.68
30.56
28.81
16.49
22.32
24.09
26.95
27.62
29.80
19.58
20.67
35.01
25.14
15.58
32.05
23.35
35.16
27.30
27.02
31.76
20.35
28.74
28.38
23.78
increased a
lot (5)
16.79
32.72
16.17
10.21
22.78
26.19
25.87
15.83
35.37
44.29
50.88
34.38
27.65
26.68
20.15
26.36
37.84
26.81
36.37
17.92
19.42
19.09
39.01
26.37
16.71
9.13
13.20
25.55
16.91
34.34
6.17
23.70
20.04
23.88
increased a
little (4)
reduced a
little (2)
Australia
Austria
Bulgaria
Canada
Chile
Czech Republic
Denmark
Finland
France
Germany
Great Britain
Hungary
Ireland
Israel
Japan
Latvia
Netherlands
New Zealand
Norway
Philippines
Poland
Portugal
Russia
Slovak Republic
Slovenia
South Korea
Spain
Sweden
Switzerland
Taiwan
Uruguay
USA
Venezuela
Overall
remain the
same as it
is (3)
Country
reduced a
lot (1)
Pro Immig Opinion
7.32
4.31
41.72
10.72
4.31
33.34
7.49
9.87
14.66
8.97
6.46
5.77
4.43
4.13
18.15
17.40
7.93
6.53
8.41
7.75
25.70
3.83
22.27
23.67
5.05
10.11
7.74
9.88
5.00
11.47
8.38
10.09
2.64
15.91
relative
average
median
average
average
median
per capita skill mix
Pro Immig Pro Immig Pro-Immig educ years educ years
GDP (12) (natives vs.
Opinion (7) Opinion (8) Dummy (9)
(10)
(11)
imm) (13)
2.72
2.11
2.19
2.92
2.22
1.86
2.32
2.75
2.02
1.82
1.74
1.97
2.22
2.69
2.40
2.10
1.93
2.31
1.96
2.64
2.29
2.28
1.74
2.25
2.34
2.85
2.45
2.27
2.42
1.93
2.91
2.29
2.40
2.29
3
2
2
3
2
2
2
3
2
2
1
2
2
3
2
2
2
2
2
3
2
2
1
2
2
3
2
2
3
2
3
2
3
2
23.23
6.56
5.32
29.02
6.74
7.14
9.81
24.10
7.37
4.06
5.53
2.18
8.77
27.14
13.19
2.60
3.72
14.72
6.71
18.52
7.06
3.09
4.27
12.09
3.00
25.47
8.93
11.46
5.71
4.99
20.40
9.80
6.95
10.84
13.06
11.08
11.11
13.46
10.71
13.15
13.18
11.98
13.68
10.68
11.78
10.74
12.92
13.41
12.03
12.69
13.59
13.28
13.45
9.66
10.82
8.12
11.59
13.51
11.20
12.30
10.00
12.10
11.36
11.30
9.12
13.88
13
10
11
13
12
12
13
12
13
11
11
11
13
12
12
12
13
13
13
10
10
6
12
13
11
12
10
12
10
12
9
14
11.89
12
31268
30851
7620
30433
10298
17891
31074
29215
29500
27612
30171
15728
34742
23062
27710
10666
31728
23528
37561
4519
12277
19879
8902
13550
19448
19317
24556
29341
33080
20701
8276
37545
5040
22336
0.60
3.14
1.01
2.64
1.16
1.24
3.51
5.66
2.04
0.67
0.40
1.66
1.42
0.33
0.95
0.55
1.42
5.19
4.44
2.00
Data source: 2003 ISSP National Identity Module. The survey sample excludes non-citizens. Pro Immig Opinion uses answers to the immigration question ("Do you
think the number of immigrants to (R's country) should be ...": reduced a lot, reduced a little, remain the same as it is, increased a little, increased a lot) and
ranges from 1 (reduced a lot) to 5 (increased a lot). Pro-Immig Dummy equals one if Pro Immig Opinion is equal to 4 or 5, zero if Pro Immig Opinion is equal to 1,
2 or 3. Both variables exclude missing values. All variables are for 2003.
110
Table A6.3
Heckman selection model - ISSP 1995
Linear regression with country FE
Dependent variable
Method
age
male
citizen
parents' foreign citizenship
education (years of education)
education*gdp
log of real income
log of real income*gdp
inverse Mills' ratio
Probit with country FE
Dependent variable
age
male
citizen
parents' foreign citizenship
education (years of education)
education*gdp
log of real income
log of real income*gdp
trade select
1
2
OLS
-0.0029
0.0005**
-0.0188
0.0159
-0.2603
0.0588**
0.2242
0.0200**
0.0499
0.0025**
OLS
-0.0029
0.0005**
-0.021
0.0158
-0.2571
0.0587**
0.2205
0.0199**
-0.4135
0.0493**
0.0479
0.0051**
0.59
0.2415*
-0.0578
0.0249*
0.0272
0.0128*
Selection equation
3
1'
2'
3'
Pro Immig Opinion
OLS
Heckman Heckman
Heckman
-0.0024
-0.0029
-0.0029
-0.0024
0.0005**
0.0005**
0.0005**
0.0005**
-0.0311
-0.0189
-0.0207
-0.0331
0.0168+
0.0166
0.0166
0.0180+
-0.1953
-0.2606
-0.256
-0.2004
0.0683**
0.0625**
0.0625**
0.0700**
0.2099
0.2242
0.2204
0.2106
0.0206**
0.0200**
0.0200**
0.0207**
-0.4948
0.0499
-0.4128
-0.5014
0.0816**
0.0026**
0.0512**
0.0841**
0.0562
0.0479
0.0569
0.0083**
0.0053**
0.0086**
0.9813
0.0272
0.5884
0.9929
0.4256*
0.0132*
0.2436*
0.4269*
-0.0973
-0.0576
-0.0986
0.0432*
0.0252*
0.0434*
-0.0015
0.0068
-0.0554
0.1396
0.14
0.1736
1'
2'
Immig Select
0.0019
0.0019
0.0009*
0.0009*
0.1043
0.1081
0.0285**
0.0286**
0.4257
0.4281
0.0920**
0.0922**
-0.0341
-0.031
0.0356
0.0357
-0.0108
0.3277
0.0045*
0.0754**
-0.0354
0.0079**
0.0687
-0.8834
0.0221**
0.3581*
0.0992
0.0373**
0.7817
0.7776
0.0535**
0.0536**
16542
16542
3'
0.0022
0.0010*
0.1263
0.0323**
0.2801
0.1105*
-0.044
0.0372
0.3742
0.1422**
-0.04
0.0145**
-0.6732
0.7294
0.078
0.074
0.712
0.0603**
14304
Observations
14659
14659
13045
R-squared
0.17
0.18
0.18
Standard errors in parentheses. Constants not shown. + sign at 10%; * sign at 5%; ** sign at 1%. Regressions (3) and
(3') are restricted to countries with well-developed Western-style welfare states.
111
Table A6.4
Heckman selection model - ISSP 2003
Linear regression with country FE
Dependent variable
Method
age
male
citizen
parents' foreign citizenship
education (years of education)
education*gdp
log of real income
log of real income*gdp
inverse Mills' ratio
Probit with country FE
Dependent variable
age
male
citizen
parents' foreign citizenship
education (years of education)
education*gdp
log of real income
log of real income*gdp
trade select
1
2
OLS
-0.0006
0.0004
0.0233
0.0134+
-0.1746
0.0483**
0.2402
0.0141**
0.0519
0.0020**
OLS
-0.0006
0.0004
0.0195
0.0134
-0.1733
0.0482**
0.2405
0.0141**
-0.1989
0.0372**
0.0251
0.0037**
-0.0633
0.1512
0.0116
0.0152
0.0471
0.0090**
Selection equation
3
1'
Pro Immig Opinion
OLS Heckman
-0.0007
-0.0005
0.0005
0.0004
0.008
0.0246
0.0153
0.0142+
-0.1954
-0.1722
0.0544**
0.0492**
0.2366
0.2395
0.0156**
0.0143**
-0.6183
0.0519
0.0996**
0.0020**
0.0658
0.0097**
1.5134
0.0476
0.4620**
0.0092**
-0.1411
0.0450**
0.0352
0.143
2'
3'
Heckman
-0.0006
0.0004
0.0199
0.0143
-0.1725
0.0491**
0.2403
0.0143**
-0.1975
0.0410**
0.025
0.0041**
-0.065
0.1524
0.0118
0.0153
0.0122
0.1444
Heckman
-0.0006
0.0005
0.012
0.0167
-0.1902
0.0551**
0.2344
0.0160**
-0.6088
0.1009**
0.0648
0.0099**
1.5028
0.4624**
-0.1399
0.0450**
0.1084
0.18
2'
Immig Select
0.0038
0.0038
0.0008**
0.0008**
0.1214
0.1259
0.0238**
0.0239**
0.2038
0.1959
0.0756**
0.0758**
-0.0776
-0.0772
0.0252**
0.0252**
-0.0089
0.4205
0.0036*
0.0615**
-0.0432
0.0062**
0.0486
-0.5007
0.0160**
0.2575+
0.0548
0.0259*
0.6899
0.6746
0.0449**
0.0451**
26382
26382
3'
1'
0.0052
0.0009**
0.1431
0.0289**
0.1569
0.0893+
-0.0854
0.0280**
0.2843
0.1821
-0.0297
0.0178+
-0.2821
0.8097
0.0331
0.0788
0.6539
0.0537**
19487
Observations
23801
23801
17943
R-squared
0.15
0.16
0.15
Standard errors in parentheses. Constants not shown. + sign at 10%; * sign at 5%; ** sign at 1%. Regressions (3) and
(3') are restricted to countries with well-developed Western-style welfare states.
112
Figure A6.1
Per capita GDP and skill composition of natives relative to immigrants, 1995
relative skill composition of natives to immigrants in 1995
Fitted values
GER
4
FRA
3
NLD
AUT
GBR
2
DNK
FIN
BEL
CAN
SWE
1
ITA
ESP
IRL
PRT
0
12500
Figure A6.2
14000
15500
17000
18500
20000
GDP per capita in 1995, PPP
21500
23000
24500
Per capita GDP and skill composition of natives relative to immigrants, 2003
relative skill composition of natives to immigrants in 2003
Fitted values
6
GER
CHE
USA
4
FRA
AUT
CZE
GBR
2
NLD
SWE
FIN DNK
CAN
SVK
HUN
NOR
AUS
ESP
IRL
PRT
0
8500
12500
16500
20500
24500
GDP per capita in 2003, PPP
28500
32500
36500
113
Figure A6.3
Sample Lobbying Report - Harvard University
114
Figure A6.4
Sample Lobbying Report - University of California
115
Figure A6.5
Sample Lobbying Report - Microsoft Corporation
116
Figure A6.5 (cont.)
Sample Lobbying Report - Microsoft Corporation
117
7
Is the “battle for brains” a zero-sum game?
The Battle for Brains has just begun as the previous sections have made clear. In the past, mainly
traditional immigration countries such as Australia, Canada, New Zealand and, to a lesser extent, the
United States have successfully pursued immigration policies which tried to select highly skilled
immigrants. The resistance of organised interest groups against skilled immigration notwithstanding,
there are several reasons why these policies will not remain uncontested in the future. Skill-biased
technological change and the increasing specialisation of developed countries in human capital
intensive activities will further increase the demand for highly skilled labour, while demographic
change and ageing will reduce labour supply in developed countries. The benefits on economic
growth and technological progress from an increase in the supply of high skilled labour through
immigration are therefore high, as Section 4 has demonstrated. As a consequence of all this, it is
likely that countries which have been receiving so far only a small share of high skilled migrants will
open their borders to high skilled immigrants. Many EU countries, which have attracted a
disproportionately high share of unskilled migrants during the last decades, have already started to
reverse this trend by moderate policy shifts (e.g. the United Kingdom and the Czech Republic). The
Blue Card proposal by the European Commission is another example of a move in this direction.
These policy changes have already triggered some concerns in the United States that the country
may lag behind in the competition to attract “the best and the brightest”.42 These concerns reflect
the idea that skilled migration is not just demand-driven, but relevant supply constraints might play a
role as well. This conception is reinforced by a significant shift in the competition for talents:
destination countries no longer rely exclusively on easing immigration restrictions, but actively
provide incentives such as tax breaks to attract talented immigrants (Abella, 2006). Altogether, it
becomes more and more likely that a substantial shift towards skill-selective immigration policies will
take place in many destination countries during the next decades, which could structurally change
the competition for talent.
The previous sections have discussed the benefits of high skilled immigration and which institutional,
economic and social characteristics of a country shape its capacity to attract highly skilled
immigrants. In this section we try to contribute to an understanding of how this capacity is
influenced by the policies pursued in other destination countries, as the existing analyses have not
focused on the strategic interactions among the contenders in the Battle for Brains.
To begin with, past policies pursued by other destination countries influence the current ability of
latecomers in the global competition for talent, such as the European countries, to attract skilled
migrants. Migration processes have a substantial inertial character, as new migrants tend to select
the destinations where there is already a well-established migrant community. This entails that
latecomers need to overcome the initial advantage that traditional immigration countries have
because of the larger size of the networks of talented migrants. While this factor is certainly relevant
to shape the outcomes of the Battle for Brains in the short-run, a more interesting question relates
to how the long-run outcome of this contest for one country is influenced by the policies
implemented by the other contenders. We need to understand whether a systemic shift towards
skill-selective immigration policies can be matched by a systemic improvement in the skill-mix of the
immigrant population across destinations. Or, to put it differently, does the Battle for Brains really
need to produce losers among destination countries?
At first sight, one could argue that this contest is not a zero-sum game, as the reservoir of talented
would-be migrants that destination countries can draw from is still large. Moreover, the recent
literature on the so-called beneficial brain drain suggests that the adoption of skill-selective
immigration policies can actually increase the size of the pool of talented workers in migrant-sending
countries.
42
Craig Barnett, A Talent Contest We’re Losing, The Washington Post, December, 23, 2007.
118
Still, these arguments are based on the presumption that the changes in migration policies are just
marginal, and that migrant sending countries are just passive by-standers in the Battle for Brains, and
do not react to the competition to attract their talents. This seems – to say the least - unlikely, as
skilled migration can produce significant economic and social effects upon the origin countries, and
even more so if the competition among the countries of destination becomes tougher, as the
proposed European Blue Card suggests that will be the case. The reactions of migrant-sending
countries can have far-reaching consequences for the outcomes of the Battle for Brains for
destination countries. Specifically, the competition for talent may affect incentives or capabilities of
governments in sending countries to invest in education and, hence, adversely affect the future size
of the pool of talented would-be migrants. While a single destination country would have incentives
to internalise potential spillover effects of its immigration policies on the human capital formation, a
group of competing destinations has not. Consequently, the non-coordinated policy equilibrium may
result in a shrinking pool of talent similar to the famous tragedy of the commons (Hardin, 1968).
In the remainder of this section we first discuss the relationship between skill-selective immigration
policies and endogenous skill formation, which gives rise to a potential policy trade-off. Second, we
present a simple game which features the Battle for Brains in a three-country setting with two
destinations and a single sending country. Third, we discuss the outcomes of the model and its
relevance for immigration policies in destination countries, particularly regarding its implications for
coordinating immigration policies across destinations in the future.
7.1
The impact of the Battle for Brains on human capital formation
As a first step, it is important to acknowledge that the Battle for Brains is not a zero-sum game,
because countries do not compete over a given pool of would-be talented migrants. The policies that
they adopt can have a significant impact on the size of the pool, as a key factor that shapes the
outcomes of the Battle for Brains for destination countries is represented by the process of
endogenous skill formation in the origin countries.
7.1.1
How do migration opportunities affect the pool of talented would-be migrants?
The recent literature on the so-called beneficial brain drain in the sending countries highlights the
fact that the option to migrate can induce additional human capital investment.43 This literature
identifies two main channels by which the option to migrate can affect human capital formation: the
first goes through the differences in the returns to human capital in destination and sending
countries, as “higher prospective returns to skills in a foreign country impinge on skill acquisition
decisions at home” (Stark et al., 1997). More specifically, the prospect to migrate increases the
incentives to invest in education once the countries of destination are characterized by a greater
dispersion of wages across skill groups (Beine et al., 2001). In the converse - and more empirically
relevant - case, a lower skill premium at destination would reduce the incentives to invest in
education if destination countries adopt a general immigration policy (see Egger and Felbermayr,
2007; Bertoli and Brücker, 2008).
Skill-selective immigration policies represent the second channel through which the prospect to
migrate can improve the incentives to invest in education in the migrant-sending country, as agents
are induced to invest in education “in order to be eligible for emigration” (Mountford, 1997). As Stark
and Wang (2002) argue, in both cases the prospect to migrate acts like a public subsidy which
increases the level of education that is chosen by domestic agents. Thus, according to the theories of
the beneficial brain drain, the choice of one country to compete more actively for skilled migrants
yields ambiguous effects on other countries: on the one hand, a negative effect results from a
43
This literature is discussed in detail by the contribution of Frédéric Docquier and Hillel Rapoport to this conference.
119
greater draw from the pool of would-be talented migrants, while on the other hand a possible
positive effect emerges from the increase in the size of the pool itself.
Still, as we mentioned in the introduction, we need not to forget that skill-selective immigration
policies can influence the process of endogenous skill formation in the migrant-sending countries not
only via the lottery ticket effect described by Mountford (1997). For instance, the emigration of
talented workers might hinder the education of the children left behind, as it deprives them from a
crucial input in the process of skill acquisition, namely parental care and supervision. Moreover, the
migration of a specific group of skilled workers, such as medical doctors, could also hinder the ability
of a country to form the next generation of workers, as it reduces the existing set of individuals with
the required training abilities. Third, and perhaps most importantly, the emigration of highly skilled
individuals may erode the fiscal basis and the incentives for public investment in education. This
channel is analyzed here in further detail.
7.1.2
Does labour mobility undermine public spending in education?
The impact of the high-skilled emigration on the fiscal balance in the sending countries has been
already discussed in detail in the traditional brain drain literature. Nevertheless, the empirical
evidence is scarce. Based on conservative assumptions, Desai et al. (2009) have recently provided
evidence that the fiscal cost – due to the loss of income taxes - of the emigration of skilled workers
from India to the United States amount to 2.5 percent of total fiscal revenues. The analysis by Desai
et al. (2009) does not account for other relevant effects of skilled migration – such as increasing
trade flows, incoming foreign direct investments or technological transfers – that can have a positive
impact on the fiscal balance. Thus, it is probably fair to say that the net impact of skilled migration
upon the fiscal revenues of the origin country needs not to jeopardize its ability to finance the
educational system.
What is more worrisome for the countries which aim at attracting talented migrants is that an
increased international mobility of skilled workers might undermine the incentives of governments
to subsidize education. The rationale for public subsidies in higher education is derived from the
positive externalities that it generates. While these externalities prevent the market from producing
the socially efficient level of private investment in education, a government can achieve the socially
desirable outcome through an appropriately designed system of subsidies and taxes. The
international mobility of skilled workers can however reduce the incentives to do so, since it “implies
far-reaching changes in the geographic incidence of the costs and benefits of publicly-funded higher
education” (Justman and Thisse, 1997). A country does not internalize the positive externalities that
materialize outside its borders, and it finds it harder to recover a relevant part of the educational
subsidies it has provided through taxation.
There exist several models in the theoretical literature which underpin this argument. Justman and
Thisse (1997) demonstrate in a two-country game that the equilibrium level of public investment in
education is decreasing in the size of labour mobility between the two countries, as mobility drives a
wedge between the country where education is publicly funded and the country where it produces
its positive externalities. Similarly, Demange et al. (2008) show in a model which considers also
private investment in education that the share of tuition fees in the total funding of higher education
is increasing with international labour mobility. The rationale for this prediction is that the
government has an incentive to free-ride on educational investments that are funded by other
countries which in turn allows reducing taxes and increasing the net income of domestically
employed workers.
These models rely on the assumption that the destination and sending countries are identical.
However, the share of skilled migrants moving from low to high income countries has been growing
over time, as Figure 3.2 shows, and such a tendency would be strengthened by a shift towards the
120
adoption of skill selective immigration policies in the countries of destination. The effects of the
mobility of skilled labor from poor to rich countries have been modeled in an overlapping generation
framework by Docquier et al. (2008), where the rationale for subsidizing human capital investment is
represented by positive intergenerational externalities connected to education, as a higher skill level
of a given generation raises both the incomes of the next generation and the productivity of its
educational investments. They find that a government which maximizes the utility of the staying
population in the sending countries will reduce subsidies in higher education with an increasing share
of high skilled emigration. Moreover, Docquier et al. (2008) predict that these reduced subsidies
more than offset the higher incentives for private investments in education which result from an
increasing opportunity to migrate, such that the overall share of the higher educated individuals in
the population declines.
7.1.3
Is there evidence that labour mobility reduces investment in education?
Thus, all these models predict that a higher level in the mobility of skilled labour reduces public
spending in education and the share of individuals which invest in high-skilled education in the
sending countries. There exists empirical evidence that these effects can be relevant. Connell et al.
(2007) show that the training costs of all the Ghanaian doctors which moved to the United Kingdom
amount to £35 million, while Mackintosh et al. (2006) demonstrate that the Ghanaian doctors that
registered between 1998 and 2003 alone produced an estimated saving in training costs for the
United Kingdom equal to £64.5 million. Mackintosh et al. (2006) conclude that this represents a
“perverse subsidy flowing from poor to rich.” These income transfers from poor to rich countries are
the rationale behind the proposal of Jagdish Bhagwati that the countries of origin should tax the
income of skilled migrants (Bhagwati and Dellafar, 1973; Bhagwati, 1979).
Moreover, there is evidence that the share of tuition fees and other sources of private funding is
increasing with the level of labour mobility, supporting the predictions by Demange et al. (2008) and
Docquier et al. (2008). Johnstone (2004) finds evidence that there is “worldwide trend toward
greater cost-sharing” in higher education, i.e. that the share of public spending is reduced and a
larger share of the burden is shifted towards the students.44 Along the same line, Bray (2000) argues
that “it seems probable that present trends of cost sharing will continue”. The observation of a
progressive public disengagement in the financing of the education system is in line with the
prediction that increasing mobility of high skilled labour reduces public funding of education.
Docquier et al. (2008) have directly estimated whether public subsidies in higher education decline
with a higher level of labour mobility. The find a statistically significant negative elasticity of -0.2, i.e.
the level of public spending declines by 0.2 per cent if the share of skilled emigrants in the population
of the sending country increases by 1 per cent.
Altogether, we can conclude that a higher level of skilled labour mobility which might by triggered by
a tougher Battle for Brains is likely to reduce public spending in education in the countries of origin,
and, as consequence of this, and it may decrease the share of individuals which invest in education
there. Any policy which assesses the outcomes of the contest for talent has to consider therefore
these implications on the sending countries, since they affect the size of the pool of skilled labour
which forms the source of potential migration. This explains why the attempt of gaining a deeper
understanding of the outcomes of the Battle for Brains for the destination countries would be
misleading if it focuses on destination countries alone.
The greater cost-sharing can be implemented through: the introduction of tuition fees; their marked increase; the
creation of a so-called dual tuition fee track, where a system where education is freely provided to state-sponsored
students is matched by a system where students are requested to pay tuition fees; the increase in user charges, such as
those related to housing; a reduction in the number of grants and scholarships; a reduction of the concessional terms at
which student loans are extended; the reduction in the size of the public education system in favor of privately-run and
financed institutions (Johnstone, 2004).
44
121
7.2
A simple model of the Battle for Brains
The simple model we present here tries to contribute to a better understanding of the outcomes of
the Battle for Brains by addressing the implications of skill-selective immigration policies in threecountry framework with two competing destinations and one sending country. Following the
literature on the beneficial brain drain, we assume that human capital formation is endogenous, i.e.
that rational agents invest in education depending on the benefits and costs of human capital
investment. Governments of the destination countries affect the outcomes of the game by deciding
on the immigration quota, and the government of the sending country by deciding on subsidies for
education. Human capital endowments in the receiving country are treated as given for the sake of
analytical convenience, although it would be straightforward to consider education subsidies and
private education decisions in the destination countries as well.
The technical framework of the non-cooperative game which is employed here builds on Stark and
Wang (2002) as well as on the theoretical analysis of the impact of migration on education presented
in Docquier et al. (2008). The latter model however does not focus on destination countries and
relies on different assumptions as far as the migrant sending country is concerned.
The three countries are populated by a continuum of identical one-period lived agents, which
maximize a utility function which is linear in income.45 The government of the destination country
maximizes through the choice of the education subsidy the utility of the representative native, i.e.
the utility of the emigrants enters the social utility function. Moreover, we assume that the
government is able to levy lump-sum taxes only after migration has occurred, so that the educational
subsidies produce a leakage of fiscal resources towards the countries of destination.46
The destination countries are assumed to be identical, and characterized by a technological
superiority with respect to the sending country, such that incomes for any level of human capital - as
well as the private return to human capital - are higher at the destinations than in the country of
origin. The demand for immigration, which is expressed through the setting of immigration quotas,
stems from the same motivation that underlies the educational subsidies, namely a positive
intra-generational externality in the labour market. A higher average endowment of human capital
increases the level of wages. While a country benefits from attracting immigrants which have a
higher human capital than natives do, we assume that it also suffers a cost, which is increasing in the
immigration quota.47
The game predicts that the Battle for Brains shares some similarities with the tragedy of the
commons: an increased demand for talented migrants from a country of destination leads to a
reduction in the average level of human capital of the migrants to both destinations, suggesting that
there are substantial strategic interactions in the setting of immigration quotas.
The model
We consider two destination countries – country a and country b – which compete for highly skilled
migrants from a third country, country c. The gross earnings of an individual depend on the average
Note that this entails that we analyze the impact of the Battle for Brains on the average human capital of the migrants,
rather than on the dimension of the pool of talented would-be migrants.
46
These assumptions differ from Docquier et al. (2008) who assume that the government in the migrant-sending country
maximizes the total utility of the non migrants, and that education is financed by lump-sum taxes levied before emigration
takes place.
47
The existence of such a cost can be easily inferred from the widespread resistance opposed to a greater openness
towards talented immigrants.
45
122
level of human capital per worker in the country where he is employed, hj (with j = a, b, c), and the
individual human capital endowment h. Namely, the gross earnings are equal to:
[1]
(
)
fj ( h ) = β j ln (1 + h ) + γ j ln 1 + h j , j = a, b, c.
Because of a technological superiority, the private and return to education is higher in the two
destination countries than it is in country c, and that gross incomes are lower in is in country c for any
level of individual human capital h.
The educational policies of country a and b are regarded as exogenously given, and this entails that
the level of education optimally chosen by the natives in country a and b, which we denote as han and
hbn is independent on the immigration policy, as the function f is additively separable in its two
arguments. Natives in country c face a private cost of education which is given by:
[2]
g ( h ) = (1 − s) λ h
where s is the share of the cost λ which is covered by a public subsidy, which the government
finances through a lump-sum tax t that is levied upon domestically employed workers. The
governments of country a and b determines its immigration policy, through an immigration quota qj,
so to maximize the representative native’s utility, which is given by his income minus a social cost
due to immigration, that we denote as m(qj). The optimal immigration quota is implicitly identified
by:
[3]
γj
j
∂h j
1 + h ∂q
j
=
( ) , where h
∂m q j
∂q
j
j
=
h jn + q j hcn
1 + qj
, j = a,b.
The natives in country c chose their level of human capital so to maximize their expected earnings,
which depend upon the probability p to migrate to one of the two destinations,48 net of the
educational costs. The utility-maximizing choice of h by a native is thus given by:
[4]
hc* =
pβ a + (1 − p ) βc
(1 − s ) λ
−1
For a given level of the subsidy s, Eq. [4] shows that the level of education hc* is increasing in the
probability to migrate p, as the private return to education in the countries of destination, βa=βb, is
higher than the private return to education in country c, βc. As the government correctly anticipates
the immigration quotas that will be set by country a and b in equilibrium, the level of the lump-sum
tax t that balances the fiscal budget is given by:
[5]
t=s
λ hc*
1− p
The government determines the level of the subsidy s in order to maximize the expected utility of
natives. The maximisation under Eqs. [4]-[5] determines the optimal level of the subsidy, s*:49
For the sake of notational simplicity, we assume that the population of country c is twice as large as the population of
a
b
country a and b, so that p=q +q .
49
Note that we have derived the optimal level of the subsidy under the assumption that the government of country c
regards the average level of human capital at destination as given; this assumption can be fully justified by observing that
this behaviour would arise in equilibrium once we generalize the model to n identical source countries, but even in this
simple setting the removal of this assumption would not affect the predictions of the model.
48
123
[6]
s* =
(1 − p) γ c
pβa + (1 − p ) ( βc + γ c )
The optimal level of the subsidy s* is decreasing in the probability of migration p, although the
domestic social return to education is unchanged. The optimal subsidy decreases in p as a higher
probability to migrate raises the expected private return to education, thus lowering the need to
subsidize educational investment. Moreover, each native faces a probability p not to benefit from the
domestic positive externalities due to education, and this further reduces the incentives to devote
public funds to subsidize education.50
We thus have that an increase in the immigration quotas set by countries a and b determines two
contrasting effects on the decision to invest in human capital in country c, as it increases both the
expected private return to education and its private marginal cost, via the reduction in the public
subsidy. Inserting Eq. [6] in Eq. [5], we obtain the equilibrium level of h in country c, once the
government has adjusted the educational subsidy: 51
[7]
hceq =
p βa + (1 − p ) ( βc + γ c )
λ
−1.
Figure 7.1 Private marginal cost and marginal benefit from education for p2>p1, with β c+ γc >β a
MC(p2)
MC(p1)
MB(p2)
MB(p1)
c
hc(p2) h (p1)
hc
Figure 7.1 depicts the private marginal benefit from education and its private marginal cost for two
different levels of the probability to migrate, p2 > p1, that is drawn under the assumption that the
marginal social return to education in country c exceeds the marginal private return to education in
country a and b. The private marginal benefit, which is reported on the vertical axis, is declining in
the level of education h, which is reported on the horizontal axis, while the private marginal cost is
constant in h. As Figure 6.1 shows, this condition entails that the equilibrium level of education of the
natives in country c is decreasing in the probability of migration p, as the increase in the cost of
Note that this effect would be magnified if we relaxed the assumption that the utility function is linear in income; a
concave utility function would give rise to a larger depressing effect of the probability to migrate upon the educational
subsidy, as a lower subsidy would reduce the income transfer – via the tax system – from non migrants to migrants.
51
Note that this result is robust to the introduction of a Bhagwati tax on skilled migrants, or assuming – as in Docquier et al.
(2008) – that taxes are levied before migration occurs; given the linearity of the utility function, being able to recover the
educational subsidy through lump-sum taxation on actual migrants would not alter the results of the model.
50
124
education more than offsets the increase in the expected return to education: thus hc(p2) falls short
of hc(p1).
7.3
Discussion of the results
Thus, the main theoretical prediction of our game depends on the relationship between the social
return to education in country c is higher than the private return to education that migrants enjoy in
the countries of destination. This asymmetry, as we compare social with private returns, is due to the
fact that the government in country c does not internalize the positive externalities connected to the
education of its own citizens which are employed in either country a or b. Although migration does
not reduce the social return to education in the migrant-sending country, this is not anymore what
drives the determination of the public educational policies, which conversely reflect the probability
that native workers will employ their education elsewhere.
The central theoretical prediction of the game is that an increased mobility of talented workers
reduce public subsidies to education to such an extent that the average level of education of the
migrants falls. This result resembles the one that is obtained by Docquier et al. (2008), but there are
relevant differences in how these similar predictions are generated. The social utility function chosen
by Docquier et al. (2008) implies that migrants do pay taxes, but have no saying in the determination
of public policies, as the government maximizes a Benthamite utility function which sums the
incomes of non migrant natives alone. These two assumptions jointly play a key role in determining
the central prediction of the model: if the government maximized the average rather than the total
utility of the stayers, then it would reduce the educational subsidy so to keep the educational level
unchanged in the face of an increased probability to migrate.52
Social welfare is independent on the size of the non migrant population in the game that we
proposed, and would-be migrants’ own preferences do influence the formation of public policies.
This latter assumption seems sensible in the context of an increased international mobility of
talented workers. For instance, in the Philippines - the developing country with the greatest number
of migrants with a tertiary education in 2000 (Docquier and Marfouk, 2006) - “the response of the
domestic educational and training system to meet international demand has been quite impressive”
(Alburo and Abella, 2002). The positive externalities due to human capital formation are not eroded
by an increasing migration of talented workers and remain substantial in developing countries, while
what is eroded in the public willingness to subsidize its creation, which no longer respond solely to
domestic factors.
The outcome of the Battle for Brains is inefficient for the countries of destination, as Eq. [7] shows:
an uncoordinated determination of the immigration quotas - that characterizes the Nash equilibrium
of the game - does not incorporate the negative externality that a country of destination imposes on
the other one, via the reduction in the human capital of the migrants.53 The three-country game that
we proposed suggests that the Battle for Brains is not a zero-sum game, so that welfare gains for the
countries of destination could be obtained through a coordinated approach to the determination of
immigration quotas. Thus, the model predicts that the Battle for Brains has a feature that resembles
the so-called tragedy of the commons (Hardin, 1968), as the countries of destination do not have
proper incentives to preserve the pool of talented would-be migrants that they wish to attract.
This would happen as there is no leakage of fiscal resources towards the country of destination of the migrants; the
concern for the size of the non migrant population which is embodied in the Benthamite social welfare function conversely
determines a reduction in the domestic social return to education when the probability to migrate increases, and it thus
leads to a further reduction in the educational subsidy.
53
It can be easily demonstrated that the outcome of an unrestrained competition to attract the best and the brightest is
beneficial for country c though it is not ex post welfare-reducing for the stayers.
52
125
The three-country static game that we analyzed predicts a monotonic relationship between the
quotas for skilled migrants set by the countries of destination and the level of education of the
migrants. If the social returns to education in the origin countries exceed the private return to
education at destination, which can be plausibly be regarded as the empirically relevant case, then a
higher demand for skilled migrants gives rise to a decline in the average human capital of the
migrants, due to the induced increase in cost-sharing. Still, as Johnstone (2004) recalls, cost-sharing
in education remains a contentious topic, and the attempts to reduce the public subsidies to the
educational system are almost invariably matched by a fierce social opposition. This entails that
government may not be willing to pay the political cost connected to an increased cost-sharing, and
keep the subsidies unaltered in the face of a marginal change in the probability that its skilled
workers have to migrate.54 If this happens, then an increase in the demand for skilled migrants would
determine an increase in the educational level of the migrants, as the private marginal cost of
education would remain unchanged.
But, as the introduction to this section argued, the Battle for Brains has just begun, and it is most
likely to intensify substantially in the near future, as the political support to a greater openness to
skilled migration gains momentum. This entails that the increase in the demand for skilled workers
on the side of destination countries cannot be expected to be just marginal. Such a structural change
– as the one entailed by the proposed introduction of the European Blue Card – would create strong
incentives for the governments in the countries of origin to overcome the political and social
opposition to an increased cost-sharing, thus producing the negative relationship between the
demand for talented migrants and the educational level of the migrants.
Thus, although the game that we proposed is admittedly simple, we maintain that its basic structure
allows describing a feature of the Battle for Brains that is most likely to occur as the competition to
attract talented workers becomes harsher. One could argue that the theoretical predictions of the
game can be sensitive to its partial-equilibrium nature. An increased mobility of talented workers
would increase the skill premium in the migrant-sending countries,55 and the stimulus to investment
flows and technology transfer that skilled migration determines – as the other part of this report
argues - could further increase the incentives to invest in education. While a specular argument
applies to the effect of migration in the countries of destination,56 we have to say that the empirical
relevance of the theoretical predictions of the model could be reduced by the relevant confounding
factors such as a skill-biased technological change which boost the incentives to invest in human
capital formation.
7.4
Conclusions
Australia, Canada and New Zealand - the three countries which have so far succeeded in attracting
talented migrants – have a total population that falls short of 100 million, while the European Union,
the most influential latecomer in this contest, has a population of approximately 500 million. This
entails that the possible effects of an increased European demand for talented workers can hardly be
inferred from what current data say, as the global competition for talent is undergoing a structural
transformation which will reshape its salient traits and likely outcomes.
A recent paper by Razin et al. (2009) on the relationship between the welfare state and immigration
quotes a famous sentence by Milton Friedman, who used to say that “it’s just obvious that you can’t
have free immigration and a welfare state”. Contenders in the Battle for Brains should probably be
aware that a similar argument could relate free emigration and educational subsidies. An attempt to
Similarly, one could assume that the government has just a positive probability to gain a political support to implement
an increase in cost-sharing.
55
See Mishra (2007) for an analysis of the impact of migration on source-country wages.
56
Borjas (2006) demonstrates that a 10 percent immigration-induced increase in the number of Ph.D. graduates in a given
field in the United States reduces the earnings by an estimated 3-4 percent.
54
126
draw on talented immigrants to satisfy the domestic demand for labour – possibly matched by a
reduction in the public investments in education – could be short-sighted. Origin countries are not
passive by-standers in the current global contest to attract the best and the brightest, and they could
dismiss the role of “emigration nurseries” that form talented workers to fill in foreign jobs, a role that
is depicted by Kuptsch and Fong (2006) as a possible outcome of the Battle for Brains.
The Philippines currently represent the greatest nursery for talented migrants, and it has to be noted
that the Philippines have pursued, since the 1960s, “the limitation of capacity in the low or tuition
free public sector together with the encouragement (and frequently a public subsidisation) of a
tuition-dependent private higher education sector” (Johnstone, 2004); in 1995, 794 out of 1,090
institutions providing higher education in the Philippines were privately run (Bray, 2000). Is the fact
that the Philippines have simultaneously experienced an increase in cost-sharing in education and a
rise in skilled migration an argument that challenges the empirical relevance of the theoretical
predictions that we presented in this section? Not quite, actually. It is not cost-sharing per se that
drives the predictions of the model, but rather its increase in response of a higher international
mobility of skilled labour. Interestingly enough, the public disengagement from the educational
sector is still progressing: the public financing of the Filipino educational sector fell from 3.5 to 2.5
percent of the gross domestic product between 2000 and 2005, and the public financing of the
tertiary education decreased from 0.5 to 0.3 percent over the same period, according to the
UNESCO.
The countries which are engaging themselves in the global contest to attract talented workers should
consider the consequences on the size of the pool of talented would-be migrants of the policy
changes that they may induce. As this contest has just begun, there is only a limited understanding of
its far-reaching consequences, but the possibility that the Battle for Brains could have worrying
similarities with the tragedy of the commons should not be neglected, and the gains from
coordination could therefore be significant.
127
8
Conclusions
In this study we have analyzed the “battle for brains” from different perspectives which all relate to
the side of the receiving countries. We have first outlined the descriptive evidence on the changes in
immigration policies and on the main trends in highly skilled immigration, and then analysed the
determinants of highly skilled immigration and their effects on receiving country economies. Building
on this analysis of the determinants and the effects of the brain gain, we have addressed the
implications for immigration policies from two different angles: First, we have tried to explain from a
positive perspective the puzzle that arises as still so many countries are reluctant to open their
borders for highly skilled immigrants. Second, we have analyzed what might happen if all developed
countries consequently enter the talent contest from a normative perspective.
The “battle for brains” has just started
The main finding from the descriptive analysis of the immigration policies which are currently in
place is that the “battle for brains” has just started: While a small number of destination countries
with a limited population size have pursued an immigration policy which selects highly skilled
individuals by human capital criteria, the main destination of migrants in the world, the United
States, selects only a relative small proportion of its immigrants by skills following an “employer
driven” approach. In contrast, most destinations in Europe have not yet adopted an immigration
policy which tempts to increase the number of immigrants consequently. Instead we find
incremental policy changes in the direction of more skill-selective immigration policies. Proposals
such as the “blue card” from the European Commission and evidence from the intentions of
governmental officials suggest, however, that even in Europe most destination countries will move
towards more skill selective immigration policies in the future.
The brain gain concentrates on few countries with skill selective immigration polices
Current trends in the migration of highly skilled workers reflect these trends in migration policies.
About 20 million immigrants with tertiary education degrees reside in the OECD, which corresponds
to a share of 11 per cent of the total population with a tertiary education there. 50 per cent of those
stem from OECD countries. However, most OECD countries are net senders of highly skilled
individuals, even if we consider the influx from non-OECD countries. The main winners are the United
States, Canada and Australia, i.e. English speaking countries which pursue either consequently or at
least partially a skill selective immigration policy, and some countries in Europe with a very high
income in Europe (Luxembourg, Switzerland).
The global pool of highly educated individuals is increasing over time. The total number of individuals
with tertiary education has increased by a factor of 3.5 over the last 25 years, while the world
population has grown by a factor of 1.5. Although the majority of the these highly skilled individuals
still lives in high income countries, the global pool of highly skilled labour tends to increase
substantially in middle income countries, particularly in Asia. Consequently, the share of these
regions as a source of highly skilled immigrants tends to increase rapidly.
The concentration of immigrants at the top of skill distribution, i.e. among those with a PhD degree
or at least a university degree, is even higher than the concentration of immigrants at the level of a
tertiary education degree. This picture is confirmed by our analysis of the enrolment of foreign
students. Enrolment rates of foreign students are particularly high in research oriented (ISCED 6) and
theoretically oriented education programmes (ISCED 5A). Moreover, we find that immigrants have
meanwhile achieved high shares in top management occupations (ISCO 1) and top professional
occupations (ISCO 2), although these shares are slightly below those of the foreigner shares among
the highly skilled population. Finally, the available evidence from the literature suggests that
128
immigrants at the top of the skill distribution receive lower wages than natives of the same skill level
if we control for the field of study.
The wage premium for education and skill-selective immigration policies drive the brain gain
International migration and the skill-bias in the migrant population are driven by both economic
incentives and immigration policies. Our detailed analysis of the determinants of overall immigration
and of the brain gain finds, not surprisingly, that the average after-tax wage difference is the main
factor which determines the scale of overall migration, while the premium in post-tax wages for
highly skilled labour is the main economic determinant for the selection of highly skilled individuals.
Increasing the skill premium for the high skilled by US $ 10,000 increases the share of the highly
skilled in the immigrant population by 20 to 40 per cent. Incremental changes in the immigration
legislation which favour highly skilled immigrants relative to less educated ones are also among the
most important and robust determinants for the positive selection of immigrants. We also find that
laws limiting the access of immigrants to welfare benefits and increasing the restrictions for
residence permits or the requirements for political asylum discourage immigration, in particular of
the less educated, producing a smaller total inflow of immigrants and a stronger selection bias of the
immigrant population towards the highly educated. Finally, the generosity of welfare benefits and
the level of employment protection seem to reduce the share of high-skilled in the immigrant
population, although this affect disappears if we control for immigration policies in our regressions.
Similarly, R&D spending has a positive impact on high skilled immigration, but this affects again
disappears if we control for immigration policies. Altogether, we can conclude that both economic
incentives and skill-selective immigration policies can explain cross-country differences in the share
of high-skilled immigrants.
Immigration and the brain gain is beneficial for receiving economies
Building on the analysis of the determinants of immigration and the brain gain, we have examined
the impact of immigration on employment, capital accumulation, productivity and output, thereby
distinguishing the effect of total immigration from that of the brain gain, the latter measured as the
share of highly skilled individuals in the immigrant population. While some issues of endogeneity and
omitted variables remain, our findings suggest that total immigration is beneficial for aggregate
employment and capital accumulation and does neither crowd out native employment nor reduce
the capital output ratio in the short- or in the long run. The share of highly educated has an
additional positive and significant effect on employment and physical capital accumulation possibly
because highly educated immigrants are complementary to natives and work in occupations that are
capital intensive. We do not find a significant correlation between the total immigration or the brain
gain with total factor productivity of the receiving economy.
Altogether, total immigration has two effects on the receiving economy: First, it stimulates
employment of natives and total investment thereby broadening the productive base of the receiving
country, and, second, it keeps the worker’s productivity unchanged. Moreover the skill intensity of
immigrants has an additional positive contribution to the first effect and leaves the second
unchanged.
How do immigration and the brain gain affect economies in the downturn of the business cycle?
Against the background of the global downturn, we have analyzed whether immigration has a
different impact in “normal” and in “bad” economic times, where we define “bad” economic times as
a situation where the output gap exceeds a threshold level of minus 1 per cent. Indeed, we find that
the employment impact of total immigration is much larger in good economic times and falls short of
its average impact in bad economic times. Thus, it is likely that new immigrants increase
unemployment and reduce the participation in the labour force in receiving countries in an economic
129
downturn. However, the coefficients for the skill selectivity remain stable in bad economic times,
such that we conclude that at a given immigration rate a higher share of highly skilled in the
immigrant population can contribute to stabilize demand and output in a downturn of the business
cycle.
Why do skill-selective immigration policies not find more support?
Altogether, we can conclude that overall effects of immigration are positive and that the immigration
of high skilled individuals substantially increases the beneficial effects of immigration. Nevertheless,
most destination countries have opted for a restrictive immigration policy and do not consequently
pursue policies which tempt to select highly skilled immigrants. This study has addressed this puzzle
by combining theoretical considerations with empirical evidence on the attitudes of individuals on
highly skilled immigration.
In the first step we have examined the factors which may affect the attitude of individuals towards
skilled immigration considering the labour market channel and welfare state channel. Accounting for
cross-country heterogeneity we find that education has a negative impact on pro-migration attitudes
in countries where the share of skilled individuals is higher in the immigrant population compared to
the native population (i.e. low per capita GDP countries) and a positive impact in countries where the
share of unskilled individuals is higher in the immigrant relative to the native population (high per
capita GDP countries). The second important finding is that in countries with a developed welfare
state, individual income has a positive impact on pro-migration attitudes in countries where the
share of skilled individuals is higher in the immigrant population than in the native population (and a
negative impact on pro-migration attitudes in the converse case.
In the second step we have considered two alternative ways to map individual preferences into
policy outcomes: the median voter and the organized pressure group approach. Although based on a
small sample of countries, we find no correlation between the attitudes of the median voter and
actual policy outcomes. Out of the top five destinations where public opinion is most in favour of
good educational qualifications of immigrants (Slovenia, Austria, Germany, Israel and Hungary), no
country actually has a policy in place to raise the fraction of highly skilled immigrant workers. Only
Germany implemented some incremental policy reforms in this direction. On the other hand, among
the three countries whose voters are least concerned about the skill composition of migrants
(Sweden, Norway, and the Netherlands), two of them (Norway and the Netherlands) have skillselective policies in place. In contrast, we find a strong correlation between the number of H1B visas
in the US which are granted to highly skilled immigrants and interest group activity.
Will the policy equilibrium shift towards more skill-selective immigration policies?
What do we expect looking forward? Based on our analysis, we expect that more and more countries
will try to implement skill-selective immigration policies. The simple reason is that the gains from
such policies are too big to be forgone and that they will further increase in the course of skill biased
technological change, the specialisation of high income countries on human capital intensive
activities and ageing. We thus expect that the balance between interest groups which favour and
reject highly skilled immigration will shift towards the former group, notwithstanding the organised
opposition of highly skilled workers. The incremental policy changes towards more skill-selective
immigration policies which can be observed in many OECD countries support this view.
The “tragedy of the commons” and the demand for policy coordination
At the present stage, the efforts of destination countries to attract the highly skilled from less
developed sending countries are not large enough to affect other destinations seriously. However, if
the competition for talent unfolds, immigration policies in individual countries may have effects on
130
other destinations. We have analyzed the implications of a talent contest in a three country
framework with endogenous human capital investment. It can be shown that the emigration of the
highly skilled reduces the incentives to invest in human capital in the sending country and also the
investment of individual agents in education. While in a two-country setting the receiving would
internalize these spill-over effects, a “tragedy of the commons” problem emerges if we consider a
“battle for brains” between competing destinations in a non-cooperative game. Thus, our findings
suggest that there is need for policy coordination among receiving countries in order to prevent that
the global pool of highly skilled labour shrinks, and they also suggest that to substitute domestic
public expenditures in education with a greater openness to talented immigrants may be
short-sighted. This is only one example which demonstrates that the talent contest may have
unintended side effects, and it is crucial that – at a time when substantial policy shifts may be under
way – destination countries do not overlook these effects which could otherwise reduce the large
gains from an increased international mobility of talented labour.
131
9
References
Abella, M., 2006, “Global competition for skilled workers and consequences.” In: Competing for
Global Talent, C. Kuptsch and P. E. Fong (eds.), ILO, pp. 11-32.
Acemoglu, D., 1998, "Why Do New Technologies Complement Skills? Directed Technical Change and
Wage Inequality", Quarterly Journal of Economics, 113, pp. 1055-1090.
Alburo, F. A., Abella, D. A., 2002, “Skilled Labour Migration from Developing Countries: Study on the
Philippines.” International Migration Papers No. 51, International Labour Office, Geneva.
Barro, R.J., and J.-W. Lee (2000) “International Data on Educational Attainment: Updates and
Implications” Centre for International Development Working Paper 42, Harvard University.
Beach C., A.G. Green and C. Worswick (2006) “Impacts of the point system and immigration policy
levers on skill characteristics of Canadian immigrants” Queen’s Economics Department
Working paper 1115.
Becker, S., A. Ichino and G. Peri (2004), “How large is the Brain Drain from Italy?”,Giornali degli
Economisti e Annali di Economie, 63(1), pp. 1-32.
Beine, M., F. Docquier, and H. Rapoport (2001): “Brain drain and economic growth: theory and
evidence," Journal of Development Economics, 64(1), pp. 275-289.
Beine, M., F. Docquier, and H. Rapoport (2007): “Measuring international skilled migration: new
estimates controlling for age of entry” World Bank Economic Review.
Belot, M., and T. Hatton (2008), “Immigrant Selection in the OECD”, CEPR Working Paper 6675.
Benhabib, J. 1996. “On the Political Economy of Immigration” Economic European Review, 40, pp.
1737-1743.
Bernheim, B.D. and M.D. Whinston. 1986. “Menu auctions, resource allocation, and economic
influence” Quarterly Journal of Economics, 101, pp. 1-31.
Bertoli, S., H. Brücker, 2008, “Extending the case for a beneficial brain drain.” Department of
Economics working paper No. 14/2008, University of Florence.
Bhagwati, J.N., 1979, “International migration of the highly skilled: economics, ethics and taxes.”
Third World Quarterly, 1, pp. 17-30.
Bhagwati, J. N., and K. Hamada (1974): “The Brain Drain, International Integration of Markets for
Professional and Unemployment: A Theoretical Analysis" Journal of Development Economics,
1(1), 19-24.
Bhagwati, J. N. and G. Hanson (2009), Skilled Immigration Today: Problems, Prospects, and Policies,
Oxford University Press.
Bhagwati, J.N., Dellafar, W. 1973, “The brain drain and income taxation.” World Development, 1, pp.
94-100.
Bhagwati, J.N., Wilson, J. (eds.), 1989, “Income Taxation and International Mobility.” MIT Press,
Cambridge.
Boeri, T., G. Hanson and B. McCormick. 2002. “Immigration Policy and the Welfare State”, Oxford:
Oxford University Press.
Bonin, H., B. Raffelhüschen and J. Walliser (2000): “Can immigration alleviate the demographic
burden?”, FinanzArchiv, 57, pp. 1-21.
Borjas, G. J. (1987): “Self-Selection and the Earnings of Immigrants," The American Economic Review,
77(4), pp. 531-553.
132
Borjas, G.J. (1978): “The Effect of Americanization of the Earnings of Foreign-Born Men”, Journal of
Political Economy, 86, pp. 897-921.
Borjas, G.J. (1991): “Immigration and Self-Selection," in Immigration, Trade, and the Labor Market,
ed. by J. Abowd, and R. Freeman. University of Chicago Press.
Borjas, G. J. 1999. “Heaven’s Door: Immigration Policy and the American Economy.” Princeton, N.J.:
Princeton University Press.
Borjas, G. J., 2004, “Do Foreign Students Crowd Out Native Students from Graduate Programs?”
NBER Working Paper No. 10349.
Borjas, G. J., 2006, “Immigration in High-Skill Labor Markets: The Impact of Foreign Students on the
Earnings of Doctorates.” NBER Working Paper No. 12085.
Bray, M., 2000, “Financing Higher Education: Patterns, Trends and Options.” Prospects, 30, pp. 332348.
Briggs, V. M. 2001. “Immigration and American Unionism” Ithaca, NY, Cornell University Press.
Brücker, H. and C. Defoort (2009), “Inequality and the Self-selection of Migrants: Theory and New
Evidence”, International Journal of Manpower, forthcoming 2009.
Brücker, H., and E. Jahn (2008), “Migration and the Wage-Setting Curve: Reassessing the Labor
Market Effects of Migration”, ASB Working Paper 08-04, Aarhus School of Business.
Bruquetas-Callejo M, B. Garces-Mascarenas, R. Moren-Alegret, R. Penninx and E. Ruiz-Vieytez (2008)
“Immigration and integration policy making in Spain” IMISCOE Working Paper 21.
Carliner, G. (1980): “Wages, Earnings, and the Hours of First, Second and Third Generation American
Males”, Economic Inquiry, 18, pp. 18-102.
Carrington, W., and E. Detragiache (1998): “How big is the brain drain?," IMF Working paper
WP/98/102.
Chaloff J. and G. Lemaitre (2009) “Managing highly skilled labour migration: A comparative analysis
of migration policies and challenges in OECD countries” OECD social, employment and
migration working papers 79.
Chiswick B.R. (1983) “An alternative approach to immigration policy: Rationing by skill” Population
Research and Policy Review, 2, pp. 21-33.
Chiswick, B. R. (1999): “Are immigrants favorably self-selected?," American Economic Review Papers and Proceedings, 98(2), pp. 897-921.
Chiswick, B. R., and T. J. Hatton. 2003. “International Migration and the Integration of Labour
Markets.” Chapter 3 in Globalization in Historical Perspective, eds. M. D. Bordo, A. M. Taylor,
and J. G. Williamson. Chicago: University of Chicago Press, pp. 65-119.
Chiswick, B.R., and P.W. Miller (2007), “The International Transferability of Immigrant’s Human
Capital Skills”, IZA Discussion Paper 2670.
Chiswick, B.R., Y. Cohen and Z. Zach (1997), “The Labor Market Status of Immigrants: Effects of the
Unemployment Rate at Arrival and Duration of Evidence”, Industrial and Labor Relations
Review, 50(2), pp. 289-303.
Citizenship and Immigration Canada (2008) “Facts and figures: Immigration Overview” CIC, Ottawa.
Citrin, J., D. Green, C. Muste, and C. Wong 1997. “Public Opinion toward Immigration Reform: The
Role of Economic Motivation.”, The Journal of Politics, 59, pp. 858-881.
Clark, K., and J. Lindley (2009), “Immigrant assimilation pre and post labour market entry: evidence
from the UK Labour Force Survey”, Journal of Population Economics, 22, pp. 175-198.
133
Clark, K., and S. Drinkwater (2008), “The labour market performance of recent immigrants”, Oxford
Review of Economic Policy, 24(3), pp. 495-516.
Congressional Research Service (2006) “H1B visas: legislative history, trends over time and pathways
to permanent residence” mimeo.
Connell, J., Zurn, P., Stilwell, B., Awases, M., Braichet, J.-M., 2007, “Sub-Saharan Africa: Beyond the
health worker migration crisis?”, Social Science and Medicine, 64, pp. 1876-91.
Cortes, P. 2008. “The Effect of Low-skilled Immigration on U.S. Prices: Evidence from CPI Data.”
Journal of Political Economy, 116, pp. 381-422.
D'Amuri, F., G.I.P. Ottaviano and G. Peri (2008), “The Labor Market Impact of Immigration in Western
Germany in the 1990's”, National Bureau of Economic Research, Inc.
Defoort, C. (2009): “Tendances de long terme des migrations internationales : Analyse partir des 6
principaux pays receveurs," Population, 2, (forthcoming).
Demange, G., Fenge, R., Uebelmess, S., 2008, “Financing Higher Education and Labor Mobility.”
CESifo Working Paper No. 2363, Bonn.
Desai, M. A., Kapur, D., McHale, J., Rogers, K., 2009, “The fiscal impact of high-skilled emigration:
Flows of Indians to the U.S.” Journal of Development Economics, 88, pp. 32-44.
Docquier, F., and A. Marfouk (2006): “International migration by educational attainment, 1990-2000
(Release 1.1)," in International Migration, Remittances and Development, by C. Özden and M.
Schiff (eds.), McMillan and Palgrave: N.Y.
Docquier, F., Faye, O., Pestieau, P. 2008, “Is migration a good substitute for education subsidies?”
Journal of Development Economics, 86, pp. 263-276.
Docquier, F., and H. Rapoport (2009), “Can we also gain from brain drain?”, Report for the
Fondazione Rodolfo DeBenedetti (forthcoming).
Dolado J.J. (2007) “The Spanish approach to immigration” VOX Eu June 29, 2007.
Dumont, J.-D. and G. Lemaitre (2005), “Counting immigrants and expatriates in OECD countries : a
new perspective”, Directorate for Employment Labour and Social Affairs, OECD, Paris.
Dustmann, C., and I. Preston. 2001. “Attitudes to Ethnic Minorities, Ethnic Context, and Location
Decisions.” Economic Journal, 111(470), pp. 353-373.
Dustmann, C., and I. Preston. 2004. “Is Immigration Good or Bad for the Economy? Analysis of
Attitudinal Responses.” CReAM Discussion Paper no. 06/04. London: Centre for Research and
Analysis of Migration, University College London.
Dustmann, C., and I. Preston. 2007. “Racial and economic factors in attitudes to immigration”, The
B.E. Journal of Economic Analysis & Policy, 7(1), (Advances), Article 62.
Egger, H., G. Felbermayr, 2007, “Endogenous skill formation and the source country effects of
international labor market integration.” CESifo Working Paper No. 2018, Munich.
Elmeskov J., Martin J.P. and Scarpetta S. (1998) “Key Lessons for Labor Market reforms: Evidence
from OECD Countries Experiences” Swedish Economic Policy Review, 5(2), Autumn 1998.
Espenshade, T. J. and K. Hempstead. 1996. “Contemporary American Attitudes toward U.S.
Immigration.” International Migration Review, 30, pp. 535-570.
European Commission (2001), Proposal for a Council Directive on the conditions of entry and
residence of third-country nationals for the purpose of paid employment and self-employed
economic activities, EC COM 2001/0386.
European Commission (2004), Green Paper on an EU approach to managing economic migration, EC
COM 2004/0811, Brussels.
134
European Commission (2005), Communication from the Commission - Policy Plan on Legal Migration,
COM 2005, 0669.
European Commission (2007), Green Paper on an EU approach to managing economic migration, EC
COM 2004/0811, Brussels.
European Council (2004) Council Directive 2004/114/EC of 13 December 2004 on the conditions of
admission of third-country nationals for the purposes of studies, pupil exchange,
unremunerated training or voluntary service, Brussels.
European Council (2005), Council Directive 2005/71/EC of 12 October 2005 on a specific procedure
for admitting third-country nationals for the purposes of scientific research, Brussels.
Facchini G., A.M. Mayda and P. Mishra (2008) “Do interest groups affect US immigration policy?”
CEPR WP 6898.
Facchini, G. and A.M. Mayda. 2009a. “Does the Welfare State Affect Individual Attitudes towards
Immigrants? Evidence across Countries” Review of Economics and Statistics, forthcoming.
Facchini, G. and A.M. Mayda. 2009b. “The Political Economy of Immigration Policy,” Background
paper for the 2009 United Nations Human Development Report.
Facchini, G. and C. Testa. 2008. “Who is against a common market?” Journal of the European
Economic Association, forthcoming.
Facchini, G., A.M Mayda and P. Mishra. 2008. “Do interest groups affect US immigration policy?”
CEPR WP 6898.
Facchini, G., and A.M. Mayda. 2008. “From individual attitudes towards migrants to migration policy
outcomes: Theory and evidence” Economic Policy 56, pp. 651-713.
Facchini, G., and G. Willmann. 2005. “The Political Economy of International Factor Mobility.” Journal
of International Economics, 67, pp. 201-219.
Fondazione
Rodolfo
DeBenedetti
(2007)
http://www.frdb.org/documentazione/scheda.php.
"Social
reform
database"
Frattini, T. 2008. “Immigration and prices in the UK.” Mimeo, UCL.
Freeman R. 2006. “People flows in globalization” Journal of Economic Perspectives 20, pp. 145-170.
Freeman, G., 1992. “Migration Policy and Politics in the Receiving States.” International Migration
Review, 26, pp. 1144-1167.
Freeman, G., 1995. “Modes of Immigration Politics in Liberal Democratic States,” International
Migration Review, 29, pp. 881–902.
Friedberg, R. (1996), You Can’t Take it With You? Immigrant Assimilation and the Portability of
Human Capital, NBER Working Paper 5837.
Glick, Reuven and Andrew Rose (2002) 'Does a Currency Union Affect Trade? The Time-Series
Evidence",European Economic Review, 46(6), pp. 1125-1151.
Glied, S. and D. Sarkar. 2009. “The role of professional societies in regulating entry of skilled
immigrants: The American Medical Association” in J. Bhagwati and G. H. Hanson (Eds.),
Skilled migration: Problems, Prospects, and Policies. Oxford and New York: Oxford University
Press, forthcoming.
Goldin, C. 1994. “The Political Economy of Immigration Restriction in the United States 1890-1921.”
In The Regulated Economy: A Historical Approach to Political Economy, eds. C. Goldin and G.
D. Lipecap. Chicago: University of Chicago Press, pp. 223-257.
Goldsborough, J., 2000. “Out-of-control immigration” Foreign Affairs 79, pp. 89-101.
135
Green, A.G. and D.A.Green. 1999. ““The Economic Goals of Canada's Immigration Policy, Past and
Present”, Canadian Public Policy, 25, pp. 425-451.
Green, D.A. (1999): “Immigrant Occupational Attainment: Assimilation and Mobility over Time”,
Journal of Labour Economics, 17(1), pp. 49-79.
Grogger, J., and G. H. Hanson (2008): Income Maximization and the Selection and Sorting of
International Migrants, NBER Working Paper 13821.
Hainmueller, J. and M. J. Hiscox. 2007. “Educated Preferences: Explaining Individual Attitudes toward
Immigration in Europe,” International Organization, 61, pp. 399-442.
Hainmueller, J. and M. J. Hiscox. 2008. “Attitudes Towards Highly Skilled and Low Skilled Immigration:
Evidence from a Survey Experiment.” mimeo, Harvard University.
Hanson G.H., K.Scheve and M. Slaughter. 2009. “Individual Preferences over High-Skilled Immigration
in the United States” in Jagdish Bhagwati and Gordon Hanson, eds., Skilled Immigration
Today: Problems, Prospects, and Policies, Oxford and New York: Oxford University Press,
forthcoming.
Hanson, G., and A. Spilimbergo. 2001. "Political Economy, Sectoral Shocks, and Border Enforcement,"
Canadian Journal of Economics, 34, pp. 612-638.
Hanson, G., Scheve, K. and Slaughter, M. 2007. “Public Finance and Individual Preferences over
Globalization Strategies” Economics and Politics, 19, pp. 1-33.
Hardin, G., 1968, “The Tragedy of the Commons.” Science, 162, pp. 1243-1248.
Home Office (2006) “A point based system: Making migration work for Britain” HMSO, London.
Hunt, J., and M. Gauthier-Lauselle (2008), “How Much Does Immigration Boost Innovation?” NBER
Working Paper 14312.
Huntington, S. (2004) “The Hispanic Challenge.” Foreign Policy, March-April 30-45.
Jasso, G., and M.R. Rosenzweig (1985): “How Well Do Immigrants Do? Vintage Effects, Emigration
Selectivity, and Occupational Mobility of Immigrants”, University of Minnesota, Mimeo.
Jasso, G., and M.R. Rosenzweig (1986): “Family Reunification and the Immigration Multiplier: U.S.
Immigration Law, Origin Country Conditions, and the Reproduction of Immigrants,”
Demography, 23, pp. 291-311.
Johnstone, D. B., 2004, “The economics and politics of cost sharing in higher education: comparative
perspectives.” Economics of Education Review, 23, pp. 403-410.
Joppke, L. 1998. “Why Liberal States Accept Unwanted Immigration.” World Politics, 50, pp. 266-293.
Justman, M., Thisse, J.-F., 1997, Implications of the mobility of skilled labor force for local public
funding of higher education. Economics Letters, 55, pp. 409-412.
Kerr, W., and W. F. Lincoln (2008), “The Supply-Side of Innovation: H1B Visa reform and US Ethnic
Invention” mimeo, Harvard Business School.
Kessler, A. 2001. “Immigration, Economic Insecurity, and the “Ambivalent” American Public.” CCIS
Working Paper no. 41. San Diego: The Center for Comparative Immigration Studies,
University of California, San Diego.
Kler, P. (2006), “Graduate Overeducation and its Effects among Recently Arrived Immigrants to
Australia: A Longitudinal Survey”, International Migration, 44(5), pp. 93-127.
Kuptsch, C. (2006): “Students and talent flow – the case of Europe: From Castle to harbour?”, in:
Kuptsch, C., and E.F. Pang (eds.), Competing for Global Talent, ILO, Geneva.
Kuptsch, C., Fong, P. E., 2006, “Competing for Global Talent”, ILO.
136
Linacre S. (2007) “Migration: permanent additions to Australia’s population” Australian Bureau of
Statistics, Canberra.
Linacre S. 2007. “Migration: permanent additions to Australia’s population.” Australian Bureau of
Statistics, Canberra.
Mackintosh, M., Mensah, K., Henry, L., Rowson, M., 2006, “Aid, restitution and international fiscal
redistribution in health care: implications of health professionals’ migration.” Journal of
International Development, 18, pp. 757-770.
Mattoo, A., I.C. Neagu and C. Özden (2008), “Brain waste? Educated immigrants in the US labor
market”, Journal of Development Economics, 87, pp. 255-269.
Mayda, A. M. 2006. “Who Is Against Immigration? A Cross Country Investigation of Individual
Attitudes towards Immigrants.” Review of Economics and Statistics, 88, pp. 510-530.
Mayda, A. M. 2008. “Why are people more pro-trade than pro-migration?” Economics Letters, 101,
pp. 160-163.
Mayda, A. M., and D. Rodrik. 2005. “Why are Some People (and Countries) More Protectionist than
Others?” European Economic Review, 49, pp. 1393-1691.
Mayda, Anna Maria (2007) "International Migration Flows: An Analysis of the forces and Constraints
at Work" Manuscript Georgetown University.
Mayda, Anna Maria and Krishna Patel (2004) "OECD Countries Migration Policy Changes" available at
http://www9.georgetown.edu/faculty/amm223/papers.htm.
McFadden, Daniel (1974), “Conditional Logit Analysis of Qualitative Choice Behavior" in P. Zarembka
Eds. Frontiers in Econometrics, New York Acedemic press.
Mishra, P., 2007, “Emigration and wages in source country: Evidence from Mexico.” Journal of
Development Economics, 82, pp. 180-99.
Money, J. 1997. “No Vacancy: The Political Geography of Immigration Control in Advanced Industrial
Countries.” International Organization 51, pp. 685-720.
Mountford, A., 1997, “Can a brain drain be good for growth in the source economy?” Journal of
Development Economics, 53, pp. 287-303.
O’Rourke, K. H., and R. Sinnott. 2005. “The Determinants of Individual Attitudes Towards
Immigration.” European Journal of Political Economy, 22, pp. 838–861.
OCED (2003) New Zealand: Economic Survey Paris, OECD
OECD (2003a) Spain: Economic survey Paris, OECD.
OECD (2005) Italy: Economic survey Paris, OECD.
OECD Tax Database (2008) available at http://www.oecd.org/document.
Ortega, F. 2005. “Immigration Quotas and Skill Upgrading.” Journal of Public Economics, 89, pp.
1841-1863.
Ortega, F., and G. Peri (2009), “The Causes and Effects of International Migrations: Evidence from
OECD Countries 1980-2005”NBER Working Paper 14833, April 2009.
Ottaviano, G.I.P., and G. Peri (2008), “Immigration and National Wages: Clarifying the Theory and the
Empirics” NBER Working Paper 14188, July 2008.
Peri, G. ,and C. Sparber (2009), “Task Specialization, Immigration and Wages”, American Economic
Journal: Empirical Economics, Forthcoming, July, 2009.
Pritchett, L. 2006., “Let Their People Come: Breaking the Gridlock on Global Labor Mobility.” Centre
for Global Development, Washington, D.C.
137
Razin, A., Sadka, E., Suwankiri, B., 2009, “Migration and the Welfare State: Dynamic PoliticalEconomy Theory.” National Bureau of Economic Research Working Paper 14784.
Rodrik, D. 1995. “Political Economy of Trade Policy.” Chapter 28 in The Handbook of International
Economics, vol. 3, eds. G. Grossman and K. Rogoff. Amsterdam: North-Holland, pp. 14571494.
Rosenzweig, M.R. (2005), “Consequences of Migration for Developing Countries”, Paper prepared for
the United Nations Expert Group Meeting on International Migration and Development,
Population Division, July 6-8, new York.
Saint-Paul, G. (2004), “The Brain Drain: Some Evidence from European Expatriates in the US”, CEPR
Discussion Paper 4680.
Scheve, K., and M. Slaughter. 2001, “Labour Market Competition and Individual Preferences Over
Immigration Policy.” Review of Economics and Statistics, 83, pp. 133-145.
Stark, O., Helmenstein, C., Prskawetz, A., 1997, “A brain gain with a brain drain.” Economics Letters,
55, pp. 227-234.
Stark, O., Wang, Y., 2002, “Inducing human capital formation: migration as a substitute for
subsidies.” Journal of Public Economics, 86, pp. 29-46.
UNESCO (1997), ISCED 1997, Standard Classification of Education, Paris.
United Nations World Population Policies, United Nations, New York, various issues.
United Nations, World Population Policies, United Nations, New York, various issues.
Venturini, A., and C. Villosio (2008): “Labour-market assimilation of foreign workers in Italy”, Oxford
Review of Economic Policy, 2(3), pp. 517-541.
World Bank (2008): World Development Indicators. World Bank, Washington, DC.
Zimmermann, K.F. (1995), “Tackling the European Migration Problem”, Journal of Economic
Perspectives, 9, pp. 45-62.


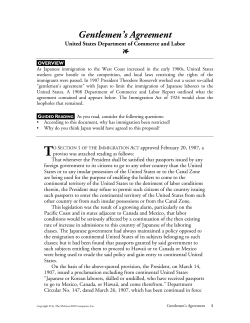


© Copyright 2026