
Saving Energy and Money: HOW TO START, EXPAND, OR REFINE MOU PROGRAMS, A Guide to Best Practices for Energy Efficiency in Locally Governed Electric Service
Saving Energy and Money: HOW TO START, EXPAND, OR REFINE MOU PROGRAMS, A Guide to Best Practices for Energy Efficiency in Locally Governed Electric Service Areas in the State Submitted to Texas State Energy Conservation Office Submitted By: Nexant, Inc. 1331 Lamar Street, Suite 1575 Houston, Texas 77010 October 31, 2011 Table of Contents Section 1 1.1 Research Findings ............................................................................................................ 2 1.1.1 Best Practices Research ........................................................................................... 2 1.1.2 Research on Municipally Owned Utilities’ Local Conditions ................................... 3 1.2 Energy Efficiency Planning Guide .................................................................................... 4 1.3 Acknowledgements ......................................................................................................... 4 Section 2 Introduction ....................................................................................................... 5 2.1 Literature Review ............................................................................................................ 6 2.2 Background ...................................................................................................................... 7 2.2.1 Objectives and Overview of the Project .................................................................. 7 2.2.2 Energy Efficiency in a National Context ................................................................... 9 2.2.3 Energy Efficiency in Texas ...................................................................................... 12 2.3 The Energy Industry and Municipally Owned Utilities in Texas .................................... 14 2.3.1 Overview of the Electric Industry in Texas ............................................................ 14 2.3.2 Municipally Owned Utilities in Texas .................................................................... 15 2.4 How the Guide is Organized .......................................................................................... 16 Section 3 3.1 Methodology.................................................................................................... 18 Stakeholder Engagement Process ................................................................................. 19 3.1.1 Initial Outreach and Participant Recruitment ....................................................... 19 3.1.2 Brainstorming Session ........................................................................................... 20 3.1.3 Structured Interviews and Detailed Program Information Collection .................. 21 3.2 Best Practice Program Benchmarking ........................................................................... 22 Section 4 4.1 Analysis and Results ......................................................................................... 24 Overview of Texas’ Municipally Owned Utilities ........................................................... 24 4.1.1 Large Municipally Owned Utilities ......................................................................... 24 4.1.2 Small and Mid‐sized Municipally Owned Utilities ................................................. 27 4.2 Best Practice Program Benchmarking ........................................................................... 38 4.2.1 Development of Program Database ...................................................................... 38 4.2.2 Program Categories and Benchmarking Metrics ................................................... 40 4.3 Level One Analysis – Program Performance Review ..................................................... 42 4.3.1 4.4 – Executive Summary ............................................................................................ 1 Summary of Best Practice Programs by Program Category .................................. 45 Level Two Analysis – Program Process Review ............................................................. 48 4.4.1 Cross‐cutting Program Best Practices .................................................................... 49 4.4.2 Implementation‐Level Best Practices by Program Category ................................. 56 i Saving Energy and Money: HOW TO START, EXPAND, OR REFINE MOU PROGRAMS, A Guide to Best Practices for Energy Efficiency in Locally Governed Electric Service Areas in the State Submitted to Texas State Energy Conservation Office Submitted By: Nexant, Inc. 1331 Lamar Street, Suite 1575 Houston, Texas 77010 October 31, 2011 Table of Contents 4.5 Applying Best Practice Programs and Features to Local Conditions ............................. 68 Section 5 5.1 Energy Efficiency Plan ....................................................................................... 76 Energy Efficiency Program Concepts ............................................................................. 76 5.1.1 Residential Program Concepts .............................................................................. 78 5.1.2 Commercial Program Concepts ........................................................................... 137 5.2 Key Preliminary Considerations ................................................................................... 171 5.3 Developing Budgets ..................................................................................................... 172 5.3.1 Program Development and Administration ........................................................ 172 5.3.2 Program Marketing and Trade Ally Activities ...................................................... 173 5.3.3 Customer Incentives and Technical Studies ........................................................ 173 5.3.4 Program Implementation .................................................................................... 173 5.3.5 Evaluation, Measurement, and Verification ........................................................ 173 5.4 Evaluation, Measurement, and Verification ................................................................ 173 5.4.1 Impact Evaluation ................................................................................................ 174 5.4.2 Process Evaluation ............................................................................................... 176 5.4.3 Sampling and Uncertainty Protocol ..................................................................... 177 5.5 Program Cost‐effective Analysis and Utility Level Rate Impact Analysis .................... 179 5.5.1 Program Cost‐effective Analysis .......................................................................... 179 5.5.2 Utility Level Rate Impact Analysis ........................................................................ 180 5.6 Energy Independence and Security Act ....................................................................... 181 5.7 Building Codes ............................................................................................................. 182 5.8 Collaborative Utility Model ......................................................................................... 184 5.8.1 Case Study: Texas IOU Collaboration – EUMMOT ............................................... 184 5.8.2 Case Study: Colorado IOU Collaboration – Excess Is Out .................................... 185 5.9 Financing Sources, Utility Resources, Tools, and Available Incentives ....................... 186 5.9.1 Grants .................................................................................................................. 186 5.9.2 Bonds and Loans .................................................................................................. 187 5.9.3 Municipal Budget Allocation ............................................................................... 188 5.9.4 Service Charges on Utility Bills ............................................................................ 188 5.9.5 Technical Assistance ............................................................................................ 189 Section 6 Conclusions and Final Remarks ....................................................................... 192 Appendix A. Project Introductory Letter to Texas MOUs .................................................... 193 Appendix B. Texas MOUs Phone Interview Guide ............................................................... 199 Appendix C. Program Benchmarking Database ................................................................... 208 – ii Table of Contents Appendix D. Best Practice Program Summaries .................................................................. 261 Appendix E. References ..................................................................................................... 292 Appendix F. Acronyms ....................................................................................................... 298 List of Tables TABLE 1. HIGH LEVEL MUNICIPALLY OWNED UTILITY RESEARCH FINDINGS .................................................... 3 TABLE 2. LIST OF UTILITY RESPONDENTS ................................................................................................ 20 TABLE 3. AUSTIN ENERGY 2008 RESIDENTIAL PROGRAM RESULTS ............................................................. 25 TABLE 4. AUSTIN ENERGY 2008 COMMERCIAL PROGRAM RESULTS ........................................................... 25 TABLE 5. AUSTIN ENERGY 2008 GREEN BUILDING PROGRAMS RESULTS ..................................................... 26 TABLE 6. CPS ENERGY 2010 RESIDENTIAL PROGRAM RESULTS ................................................................. 26 TABLE 7. CPS ENERGY 2010 NONRESIDENTIAL PROGRAM RESULTS ........................................................... 27 TABLE 8. CPS ENERGY 2010 DR PROGRAM RESULTS .............................................................................. 27 TABLE 9. TEXAS MUNICIPALLY OWNED UTILITY OPERATIONAL AND MARKET CHARACTERISTICS ...................... 28 TABLE 10. PROGRAM PERFORMANCE DATA METRICS .............................................................................. 40 TABLE 11. ENERGY EFFICIENCY PROGRAM CATEGORY .............................................................................. 40 TABLE 12. BENCHMARKING METRICS .................................................................................................... 41 TABLE 13. EQUIPMENT REBATE BEST PRACTICE PROGRAMS ..................................................................... 45 TABLE 14. APPLIANCE RECYCLING BEST PRACTICE PROGRAMS .................................................................. 46 TABLE 15. AUDIT AND DIRECT INSTALLATION BEST PRACTICE PROGRAMS ................................................... 46 TABLE 16. EDUCATION AND BEHAVIOR BEST PRACTICE PROGRAMS ........................................................... 47 TABLE 17. NEW CONSTRUCTION BEST PRACTICE PROGRAMS .................................................................... 47 TABLE 18. INNOVATIVE FINANCING BEST PRACTICE PROGRAMS ................................................................ 48 TABLE 19. DEMAND RESPONSE BEST PRACTICE PROGRAMS ...................................................................... 48 TABLE 20. BEST PRACTICES IN PROGRAM DESIGN ................................................................................... 49 TABLE 21. BEST PRACTICES IN PROGRAM MANAGEMENT ......................................................................... 51 TABLE 22. BEST PRACTICES IN PROGRAM IMPLEMENTATION ..................................................................... 53 TABLE 23. BEST PRACTICES IN PROGRAM EVALUATION ............................................................................ 55 TABLE 24. LEVEL TWO ANALYSIS BENCHMARKING METRICS...................................................................... 56 TABLE 25 . ENERGY EFFICIENCY PROGRAMS MATCHED TO MOU MARKET CONDITIONS ................................ 69 TABLE 26. ENERGY EFFICIENCY BEST PRACTICES MATCHED TO MOU MARKET CONDITIONS .......................... 71 TABLE 27. RESIDENTIAL EQUIPMENT REBATE PROGRAM .......................................................................... 80 TABLE 28. RESIDENTIAL LIGHTING PROGRAM ......................................................................................... 87 TABLE 29. RESIDENTIAL REFRIGERATOR RECYCLING PROGRAM .................................................................. 94 TABLE 30. RESIDENTIAL AUDIT AND WEATHERIZATION PROGRAM ............................................................. 99 TABLE 31. ENERGY EFFICIENCY EDUCATION .......................................................................................... 108 TABLE 32. RESIDENTIAL NEW CONSTRUCTION PROGRAM ....................................................................... 116 TABLE 33. ON‐BILL FINANCING PROGRAM ........................................................................................... 123 TABLE 34. RESIDENTIAL DEMAND RESPONSE PROGRAM ......................................................................... 131 TABLE 35. COMMERCIAL PRESCRIPTIVE REBATE PROGRAM ..................................................................... 139 TABLE 36. SMALL COMMERCIAL AUDIT AND DIRECT INSTALLATION PROGRAM .......................................... 148 TABLE 37. COMMERCIAL NEW CONSTRUCTION PROGRAM ..................................................................... 157 TABLE 38. COMMERCIAL AND INDUSTRIAL CUSTOM EFFICIENCY PROGRAM ............................................... 163 TABLE 39. MEASUREMENT AND VERIFICATION ACTIVITIES BY MEASURE TYPE ............................................ 175 TABLE 40. SURVEY OPTIONS .............................................................................................................. 178 – iii Table of Contents List of Figures FIGURE 1. STATES WITH ENERGY EFFICIENCY RESOURCE STANDARDS IN THE UNITED STATES .......................... 11 FIGURE 2. TOTAL ENERGY SAVINGS BY INVESTOR‐OWNED UTILITIES ........................................................... 12 FIGURE 3. FLOW OF ELECTRICITY FROM GENERATION TO CUSTOMER .......................................................... 14 FIGURE 4. ERCOT REGION AND MUNICIPALLY OWNED UTILITY TERRITORY OVERLAY ................................... 15 FIGURE 5. MOU BEST PRACTICE STUDY PARALLEL RESEARCH TRACKS ........................................................ 19 FIGURE 6. BRAINSTORMING WEBINAR OBJECTIVES .................................................................................. 21 FIGURE 7. PARTICIPATING MUNICIPALLY OWNED UTILITIES BY CUSTOMER BASE (IN THOUSANDS) .................. 28 FIGURE 8. DISTRIBUTION OF TOTAL ELECTRICITY SOLD (KWH) BY MARKET SECTOR ....................................... 29 FIGURE 9. EXISTING ENERGY EFFICIENCY PROGRAMS BY MARKET SECTOR ................................................... 30 FIGURE 10. EXISTING MUNICIPALLY OWNED UTILITY RESIDENTIAL PROGRAMS BY PROGRAM TYPE ................. 30 FIGURE 11. EXISTING MUNICIPALLY OWNED UTILITY COMMERCIAL AND INDUSTRIAL PROGRAMS ................... 31 FIGURE 12. EXISTING INDUSTRIAL SECTOR ENERGY EFFICIENCY PROGRAMS BY PROGRAM TYPE ...................... 31 FIGURE 13. PROGRAM BUDGETING AND PROGRAM MANAGEMENT STRUCTURE .......................................... 32 FIGURE 14. RESIDENTIAL SAVINGS OPPORTUNITIES BY MEASURE............................................................... 33 FIGURE 15. SMALL/MEDIUM COMMERCIAL SAVINGS OPPORTUNITIES BY MEASURE ..................................... 34 FIGURE 16. INDUSTRIAL/LARGE COMMERCIAL SECTOR SAVINGS OPPORTUNITIES BY MEASURE ...................... 34 FIGURE 17. OPERATIONAL CONSTRAINTS ON ABILITY TO OFFER ENERGY EFFICIENCY PROGRAMS .................... 36 FIGURE 18. COMMON BARRIERS TO CUSTOMER PARTICIPATION ................................................................ 37 FIGURE 19. PRIORITIES OR MOTIVATIONS FOR ENERGY EFFICIENCY PROGRAMS ........................................... 38 FIGURE 20. EM&V PROTOCOL DIAGRAM ............................................................................................ 174 FIGURE 21. REQUIRED PROTOCOLS FOR IMPACT EVALUATIONS ............................................................... 175 – iv Section 1 Executive Summary The Texas State Energy Conservation Office (SECO), in partnership with the Texas Public Power Association (TPPA) present this Guide titled “Saving Energy and Money: HOW TO START, EXPAND, OR REFINE MOU PROGRAMS, A Guide to Best Practices for Energy Efficiency in Locally Governed Electric Services Areas in the State” (the Guide). The Guide was developed by the consulting team consisting of Nexant and The Cadmus Group, Inc. (the Project Team) with funding provided by the U.S. Department of Energy (DOE). Its objective, in part, is to serve as a resource to support SECO’s commitment to reach 1 percent annual electricity savings statewide. Energy efficiency has been long recognized and accepted as a resource that, when balanced with new generation and other supply options, contributes to the country’s growing electricity needs. Utilities across the country are utilizing energy efficiency in their resource portfolios by offering programs to help reduce demand. Texas municipally‐owned utilities (MOUs) are at the precipice of the efficiency movement. While regulated utilities have had to experiment with alternative program strategies in their efforts to meet increasingly aggressive targets and to coalesce around new market players, MOUs stand to benefit from their lessons learned. TPPA represents 72 cities that own and operate their own electric utility systems, several electric cooperatives (TPPA associate members), river authorities, and joint action electric agencies in Texas. MOUs provide electric service to over 3 million Texans, or nearly 15 percent of the state’s retail electric customers. Only a few of the 72 MOUs in Texas currently offer energy efficiency programs. Thus, MOUs are perfectly positioned to learn from investor‐owned utilities’ (IOUs’) experience and introduce new programs that benefit from measured program success factors. This Guide is the result of extensive research, interviews, data collection, and analysis and was developed to promote the implementation of energy efficiency programs by Texas’ MOUs. This Guide serves as a resource to not only increase the understanding of best practices utilized by successful energy efficiency programs across the country, but also a plan to support MOUs implementing energy efficiency programs that will ultimately result in energy and electric bill savings for their customers. To support MOUs with the implementation of their own energy efficiency programs, this Guide leverages the lessons learned from energy efficiency programs operating across the country in an effort to: Identify energy efficiency best practices and disseminate them among locally owned electric providers so that decision makers can assess, select, and implement the policies and programs that align best with local conditions and constraints. Engage MOUs as they expand or refine current energy efficiency programs, implement new energy efficiency programs based on proven best practices, and incorporate successful program initiatives and cost saving measures. A Best Practices Guide for Energy Efficiency in Municipally‐Owned Services Areas 1 | P a g e 1.1 Research Findings The best practices outlined in this Guide are gleaned from existing energy efficiency programs identified by the Project Team as “successful.” Program success was defined on a number of metrics including cost‐effectiveness, market penetration, innovation, and other factors. This Guide is unique among other best practices studies because the Project Team cross‐ referenced best practices with the local conditions in MOU service territories. The Project Team conducted extensive outreach to MOUs to understand the local barriers, issues, and needs associated with energy efficiency programs. This cross‐referencing ensures that the best practices defined in the Guide are applicable to the communities using this Guide. The Project Team developed a research plan that consisted of two parallel tracks of research: a stakeholder engagement process that provided insights on MOUs local conditions, and a best practices study. 1.1.1 Best Practices Research The Team conducted a quantitative screening of 400 identified programs aimed at narrowing the list down to only those that achieved the best performance in several areas. To best accommodate this process, the Project Team selected benchmarking metrics appropriate for each of seven program categories, including: Equipment Rebates Appliance Recycling Audit and/or Direct Install Education and Behavior Impact New Construction Innovative Financing Demand Response (DR) Within each of these categories, the Project Team further broke program types down by target sector and subcategories in order to most effectively compare quantitative metrics and key best practice attributes. As a result of this process, the team identified 58 best practice programs for further investigation. In the level two analyses, the Project Team conducted a qualitative review to gain insights into how the identified best practice programs achieved exceptional results. The Project Team assessed each program in detail and analyzed individual program attributes to identify best practice characteristics that differentiated the successful programs. This review entailed two evaluations of program best practices: Cross‐cutting program best practices. The Project Team looked at each identified best practice program, as well as our accumulated literature review findings to assess best practice program features that are common across all program categories. These cross‐ cutting program best practices ensure effective program delivery and management, a high level of quality and customer satisfaction, and the achievement of strong participation and cost‐effective energy savings results. Through this process, the Project A Best Practices Guide for Energy Efficiency in Municipally‐Owned Services Areas 2 | P a g e Team identified cross‐cutting program best practices in four categories: (1) program design, (2) program management, (3) program implementation, and (4) evaluation. 1.1.2 Implementation level best practices by program category. To facilitate the Program Team’s review of the 58 identified best practice programs, the Project Team sought to answer several researchable questions pertinent to meeting qualitative criteria related to: (1) market impacts, (2) customer service and satisfaction, (3) operations and delivery, (4) innovation, (5) transferability and scalability, and (6) overcoming barriers. These factors also helped the Team cross‐reference best practice attributes with Texas market conditions and identify those attributes that are transferable to Texas MOUs’ Long‐Term Energy Efficiency Plan. Research on Municipally Owned Utilities’ Local Conditions This project attracted participation from a wide range of small to mid‐sized MOUs representing considerable variation in conditions that affect energy efficiency program planning. The Project Team used a series of MOU engagement tactics, including a brainstorming session, data request, and structured interviews to gather information about local market conditions for energy efficiency programs in each participating MOU’s service territory. Our investigation included factors such as MOUs’ existing operational structures, customer behavior and decision‐making trends, local delivery capacity, regional codes, technology adoption, energy efficiency potential in MOUs’ territories (at the measure level if applicable secondary data were available) and interest in energy efficiency programs. Our investigation found that the MOUs participating in the process represent a wide range of communities, but many have significant commonalities in terms of customer makeup and types of efficiency programs currently offered. Table 1 summarizes high level findings on commonalities averaged across all participant MOUs. Table 1. High Level Municipally Owned Utility Research Findings Category Customer distribution Electricity sales by sector Existing Efficiency programs Delivery approach Target sector Predominant program type Residential Commercial Industrial Budgeting and management Efficiency Potential Residential Commercial Industrial Research Findings 84% residential; 14% commercial‐industrial 46% residential; 39% commercial; 15% industrial 85% deliver programs with in‐house staff 53% residential; 36% commercial; 11% industrial wide variety including lighting, heating, ventilation, and air conditioning (HVAC), renewable, weatherization, audits, appliance recycling, etc. 30% lighting; 26% renewable; 15% audits, etc. 38% lighting; 38% renewable; 13% comprehensive Heavily in‐house budgeting and management structures High: cooling, building shell, lighting Moderate: kitchen appliances, renewable energy High: lighting, building shell, HVAC Moderate: controls, operation and maintenance (O&M) Moderate: O&M, lighting, HVAC, controls, motors A Best Practices Guide for Energy Efficiency in Municipally‐Owned Services Areas 3 | P a g e Category Biggest barriers Operational Customer Priorities and goals 1.2 Research Findings funding, interest among decision makers and community equipment cost, split incentives, lack of awareness of value of efficiency measures and of programs high savings at a low cost, reducing peak load, good public relations value, educating community and market transformation, avoiding rate increases Energy Efficiency Planning Guide The Project Team utilized its research to develop an energy efficiency planning guide for MOUs in Texas that leverages best practices gleaned from existing energy efficiency programs deemed successful through our research combined with the Team’s extensive outreach to MOUs to understand the local barriers, issues, and needs associated with energy efficiency programs. This cross‐referencing ensures that the best practices defined in the Guide are applicable to the communities using this Guide. The Guide also seeks to engage MOUs to expand, refine, or implement energy efficiency programs in their service areas. This Guide contains a Long Term Energy Efficiency Plan that will make it easy for MOUs to select programs that could be most readily implemented in their territories. The plan includes several programs concepts that define broad parameters for full development and implementation, including: Program description and objectives Infrastructure and staffing Customer targets and eligibility Implementation Program barriers and mitigation strategies Marketing and outreach Measures and incentive levels Measuring savings Best practices and innovations Finally, the Project Team will assist in the full development and implementation of selected energy efficiency programs for a few of the MOUs. Using the findings from the Guide and the resources in the plan, the Project Team will work with each participating MOU to implement programs in its service territory. 1.3 Acknowledgements This Guide was developed with extensive support from SECO’s staff and the TPPA. The Best Practices Project Team would like to gratefully acknowledge Dub Taylor from SECO, Mark Zion, and Wendell Bell from TPPA and Johanna Zetterberg from DOE for their leadership. The Project Team also thanks the representatives from all of the Texas MOUs who provided the Project Team with valuable insights about their service territories to help direct the results of our work, particularly Vicki Reim and Lisa Lemons. The Project Team is especially indebted to Pam Groce, who worked with us every step of the way, for her generous contributions. A Best Practices Guide for Energy Efficiency in Municipally‐Owned Services Areas 4 | P a g e Section 2 Introduction SECO, in partnership with TPPA are proud to present this Guide titled “Saving Energy and Money: HOW TO START, EXPAND, OR REFINE MOU PROGRAMS, A Guide to Best Practices for Energy Efficiency in Locally Governed Electric Services Areas in the State” (the Guide). The Guide was developed with funding provided by the DOE. It is the result of extensive research, interviews, data collection, and analysis and was developed to promote the implementation of energy efficiency programs by Texas’ MOUs. This Guide serves as a resource to not only understand the best practices utilized by successful energy efficiency programs across the country, but also a plan to support MOUs implementing energy efficiency programs that will ultimately result in energy and electric bill savings for their customers. Energy efficiency is a resource that can be balanced with new generation and other supply options to help meet Texas’ growing electricity needs. IOUs and some of the larger MOUs in Texas and throughout the United States are incorporating energy efficiency by offering programs to help reduce demand, as a part of a diverse resource portfolio. To help increase the implementation of energy efficiency programs in smaller to mid‐sized MOUs in Texas, in January 2011, SECO issued a request for proposals (RFPs) to review, identify, and analyze existing, successful energy efficiency programs at the local level and develop, with guidance from SECO and project stakeholders, a Guide to Best Practices for Energy Efficiency in MOU service areas. SECO stipulated that “this Guide will include existing energy efficiency best practices that are offered by a variety of utility programs, including a thorough discussion of the benefits and barriers of each best practice identified and how the savings are calculated and realized. This Guide will also include implementation strategies, new policies, and detailed implementation programs that align best practices with local conditions and constraints.” Nexant, Inc., along with subcontractor The Cadmus Group, Inc. (the Project Team), was awarded the project in May 2011. The Project Team implemented a strategy to create the Guide that included the following steps: Preparing a robust research methodology that: ensures a technically sound analytical framework, is consistent with Texas policy objectives, fosters collaboration among core stakeholders and industry partners, identifies technical criteria and success factors to guide the selection of program design elements most suitable for Texas MOUs, and ensures a comprehensive examination of current efficiency program best practices Implementing and managing the Guide to address in detail the best programs, and present the results in accessible formats to meet Guide users’ needs Creating a Long Term Cost‐effective Energy Efficiency Plan that includes program concepts appropriate for implementation by MOUs that account for regional policy, climate, and market conditions. A Best Practices Guide for Energy Efficiency in Municipally‐Owned Services Areas 5 | P a g e 2.1 Literature Review One of the first tasks the Project Team undertook to develop this Guide was a comprehensive literature review. This literature review helped lay the groundwork for the Project Team to identify successful energy efficiency programs and the factors that made them successful, and also to understand the specific market conditions in Texas. This literature review focused on three areas of research: best practices; energy efficiency programs and projects; and Texas market and utility environment. The documents for the research came from three main sources: Research papers and articles Project Team work Utility reports and public findings. Research Papers and Articles Utilities and other institutions have offered energy efficiency programs for over 30 years. These programs have evolved from classroom education and simple discounts on energy‐efficient products to complicated custom savings programs with detailed reporting requirements and savings targets. As these energy efficiency programs have evolved and improved, a number of organizations have completed studies on a wide range of issues surrounding their implementation and delivery. Common areas of research include cost‐effectiveness, energy savings, program design, best practices, etc. The Project Team reviewed research papers from some of the following organizations: American Council for An Energy‐efficient Economy (ACEEE) American Public Power Association (APPA) California State Public Utility Commissions Colorado Governor’s Energy Office Energy Trust of Oregon Local Governments for Sustainability (ICLEI) International Energy Agency Pew Center on Global Climate Change Southwest Energy Efficiency Project Texas SECO DOE U.S. Environmental Protection Agency (EPA) U.S. Energy Information Administration (EIA) Project Team Work The Project Team has completed work for utilities and governments across the country and has been designing, implementing, and evaluating publicly funded energy efficiency programs for more than 20 years. Project Team staff have led the design and administration of programs within Texas for CenterPoint Energy, CPS Energy, Oncor Electric Delivery, Entergy, and AEP, as well as numerous utilities throughout North America. Our staff has successfully completed several investigations comparable in magnitude and complexity to this study. This extensive A Best Practices Guide for Energy Efficiency in Municipally‐Owned Services Areas 6 | P a g e experience and accumulated knowledge based on potential studies, implementation manuals, program plans, and evaluation reports guided our research. Utility Reports and Public Findings Utilities are often required to submit reports, results, and findings from their energy efficiency programs as part of their regulatory requirements. In Texas, the Public Utility Commission of Texas (PUCT) filed Substantive Rule §25.181 that requires IOUs to file an Energy Efficiency Plan and Report (EEPR) on a yearly basis. The EEPR details the utility's future plans for energy efficiency and reports on the most recent year's actual achievements. Nine medium to large MOUs (500,000 kilowatt hour (kWh) energy consumption annually) have also voluntarily submitted reports on energy efficiency programs they offer in their service territories. The Project Team had a good understanding of and access to these reports and consequently established a good foundation of knowledge of the successful energy efficiency programs in the state. Detailed references for literature the Project Team reviewed are provided in Appendix G. 2.2 Background 2.2.1 Objectives and Overview of the Project According to the National Action Plan for Energy Efficiency, “Improving the energy efficiency of our homes, businesses, schools, governments, and industries—that consume more than 70 percent of the natural gas and electricity in the country—is one of the most cost‐effective ways to address the following challenges: Energy demand continuing to grow despite historically high energy prices Concerns over energy security and independence Air pollution Climate change Energy efficiency has been long recognized and accepted as a resource that, when balanced with new generation and other supply options, contributes to the country’s growing electricity needs. Utilities across the country are utilizing energy efficiency in their resource portfolios by offering programs to help reduce demand. In addition, the institutional setting for energy efficiency programs has moved beyond the domain of regulated utilities and now includes third‐ party implementers and public agencies. The infusion of federal funding geared toward stimulating energy efficiency along with an increasingly savvy and energy‐aware marketplace has resulted in a trend toward innovative program concepts and delivery mechanisms. Yet program designers do not necessarily have the benefits of decades of experience and continued refinements associated with utility program planners and administrators. Increased market awareness of energy issues and technologies coupled with the use of information technology (IT) to support program deployment are changing the ways programs are implemented and customers respond. IT‐based program components such as remote customer/utility information exchange, online incentive applications, and automated rebate processing are increasingly common. Successful outreach is moving toward the use of social media and community networks. Free‐market players with innovative business models may A Best Practices Guide for Energy Efficiency in Municipally‐Owned Services Areas 7 | P a g e complement – or compete with – traditional program delivery strategies. Such trends are introducing both new opportunities and potential pitfalls for utility programs. Texas MOUs are at the precipice of this innovation movement. While regulated utilities have had to experiment with alternative program strategies in their efforts to meet increasingly aggressive targets and to coalesce around new market players, MOUs stand to benefit from their lessons learned. TPPA represents 72 cities that own and operate their own electric utility systems, several electric cooperatives (TPPA associate members), river authorities, and small, joint action electric agencies in Texas. MOUs provide electric service to over three million Texans, or nearly 15 percent of the state’s retail electric customers. Only a few of the 72 MOUs in Texas currently offer energy efficiency programs, while the nine IOUs offer a total of 98 programs. Thus MOUs are perfectly positioned to learn from the IOUs’ experience and introduce new programs that benefit from identified program success factors. To support MOUs with the implementation of their own energy efficiency programs to reach the goal of 1 percent energy savings, this Guide leverages the lessons learned from energy efficiency programs operating across the country in an effort to: Identify energy efficiency best practices and disseminate them among locally‐owned electric providers so that decision makers can assess, select, and implement the policies and programs that align best with local conditions and constraints. Engage MOUs to expand or refine current energy efficiency programs, implement new energy efficiency programs based on proven best practices, and incorporate successful program initiatives and cost‐saving measures. The best practices outlined in this Guide are gleaned from existing energy efficiency programs identified by the Project Team as “successful.” Program success was defined based on a number of metrics including cost‐effectiveness, market penetration, innovation, and other factors. These metrics are outlined in more detail in Section 4. This Guide is unique among other best practices studies because the Project Team cross‐ referenced best practices with local conditions in MOU service territories. The Project Team created and implemented a stakeholder engagement plan that outlined our strategy for working with MOUs to understand barriers, issues and needs in their local communities. This ensures that the identified best practices are applicable to the communities using this Guide. The Guide seeks to engage MOUs to expand, refine, or implement energy efficiency programs in their service areas. The included Long Term Energy Efficiency Plan is a resource for MOUs to select programs that could be readily implemented in their territories. The Plan includes program concepts that define broad parameters for implementation, including: Program description and objectives Infrastructure and staffing Customer targets and eligibility Implementation Program barriers and mitigation strategies Marketing and outreach Measures and incentive levels A Best Practices Guide for Energy Efficiency in Municipally‐Owned Services Areas 8 | P a g e Measuring savings Best practices and innovations Finally, the Project Team will assist in the development and implementation of selected energy efficiency programs for a few MOUs. Using the findings from the Guide and the resources in the Plan, the Project Team will work with the MOUs to implement programs in their service territories. Key Stakeholders A few key stakeholders were critical to development of this Guide: a) DOE DOE provided funding for the Guide through a grant to SECO and TPPA. The DOE is hoping to use this Guide as a resource for MOUs across the country to encourage the implementation of energy efficiency programs in MOU service areas. b) SECO SECO provides information and resources to Texas residents and businesses on how to reduce energy costs and maximize energy efficiency. SECO partners with Texas consumers, businesses, educators and local governments to offer these programs across the state. This Guide is one strategy SECO is utilizing to help encourage and promote energy efficiency programs. SECO established a goal of achieving a 1 percent annual electricity savings from its efforts. c) TPPA Formed in 1978, TPPA represents the interests of public power providers in the state of Texas, including MOUs. TPPA provides resources through which members may extend their influence on public policy matters affecting the public power industry. TPPA understands MOUs’ issues, barriers, and concerns regarding energy efficiency and plays a key role in ensuring the Guide matches the interests of its members. Area of Focus This Guide presents best practices and implementation strategies for small to mid‐sized Texas MOUs, or those that have customer bases of less than 100,000 customers. Two MOUs in Texas exceed this size: Austin Energy (AE) and CPS Energy in San Antonio. These two utilities have already developed and implemented a number of energy efficiency programs and are considered ahead of the curve compared to the small and mid‐sized MOUs. While this guide can be utilized by AE and CPS Energy, their larger role in this study was to share program lessons that serve as examples of best practices in the state. 2.2.2 Energy Efficiency in a National Context The energy industry plays a critical role in the economies of Texas, the U.S, and the world. The strength of our economy depends in large part on the availability of affordable and reliable energy. Yet increasing demand for energy from homes and businesses is driving electricity prices higher throughout much of the United States. According to DOE, energy consumption in the A Best Practices Guide for Energy Efficiency in Municipally‐Owned Services Areas 9 | P a g e United States is predicted to increase by more than one third by 2025, with electric power increasing 40 percent during that time period. The US EIA reports that the average retail price of electricity for all sectors has increased from 6.74 cents/kWh in 1998 to 9.82 cents/kWh in 2009 (an increase of 46 percent)1. This growth threatens to strain not only existing utility infrastructure and domestic supplies needed to provide this energy, but also the pocketbooks of American consumers and businesses. Energy efficiency programs are one set of tools utilities deploy to meet this growing challenge. Energy efficiency first took hold in the U.S. utility industry after the 1973 oil embargo, when Congress enacted federal policies aimed at efficiency, including the Energy Policy & Conservation Act of 1975 (that first established appliance efficiency standards). While utilities in the past simply met demand growth with increased production, the 1970s and 1980s saw the emergence of demand‐side management (DSM) programs and the “least‐cost” or integrated resource planning model utilities use today. Utilities’ experience with DSM as a cost‐effective alternative to generation increased their understanding of the benefits of efficiency, such as: Lower energy bills for businesses and households and greater customer satisfaction Environmental benefits such as cleaner air Utilities’ ability to expand capacity at a lower cost compared to building new generation Reduced strain on transmission lines Modularity and ease of deployment Economic development from a growing workforce needed to deliver efficiency programs Energy security from protecting domestic supplies and reducing the need for energy imports In light of these benefits, several states have passed energy efficiency resource standards (EERS) that usually require investor‐owned and large utilities to achieve a specific target for reduced energy consumption. According to the DOE, 20 states have EERS (five states have non‐mandated goals) as of September 20112. Figure 1 below shows the distribution of states with an EERS or goal. 1 EIA Website: http://www.eia.gov/cneaf/electricity/epa/epaxlfile7_4.pdf. September 2011. DSIRE Database website: http://www.dsireusa.org/summarymaps/index.cfm?ee=1&RE=1. September 2011 2 A Best Practices Guide for Energy Efficiency in Municipally‐Owned Services Areas 10 | P a g e Figure 1. States with Energy Efficiency Resource Standards in the United States Efficiency activity is not limited to IOUs. Even though few MOUs are subject to EERS, and few have rate mechanisms such as decoupling (which some IOUs have used to break the link between sales and revenue), many still offer DSM programs. APPA reported, in a 2010 survey, that of over 2,000 community‐owned utilities serving 45 million Americans, that 68 percent were offering some form of DSM program3. Indeed, utilities are finding that efficiency goals are easily attainable. A July 2007 report on DSM program results across the United States found that IOUs not only met, but exceeded, their mandated savings every year from 2003 to 2006 (see Figure 2)4. Further, it should be noted that each additional megawatt hours (MWh) of energy saved becomes more difficult to achieve as the baseline improves. 3 Effect of Energy efficiency programs on Electric Utility Revenue Requirements. American Public Power Association. 2009 4 Energy Efficiency Accomplishments of Texas Investor Owned Utilities. Frontier Associates LLC. June 16, 2008. A Best Practices Guide for Energy Efficiency in Municipally‐Owned Services Areas 11 | P a g e Figure 2. Total Energy Savings by Investor‐owned Utilities Despite this progress, considerable energy efficiency potential remains. The National Action Plan for Energy Efficiency of 2006 noted that available efficiency resources may be able to meet 50 percent or more of expected U.S. load growth through 2025, resulting in $100 billion energy bill savings, $500 billion in net savings, and substantial greenhouse gas (GHG) emissions reductions. The convergence of increasing energy demand, state mandates, and easy deployment has resulted in dramatically increased spending on efficiency programs in recent years. According to the EIA, between 1998 and 2009, utilities spent about $15 billion on efficiency programs, saving almost 700,000,000 MWh during that time. Thirty years of energy efficiency efforts have had a significant effect on the U.S. economy. According to the 2008 Energy Report by the Texas Comptroller of Public Accounts, “The U.S. economy is significantly more energy‐efficient than it was in the mid‐1970s. The amount of energy needed to produce one dollar’s worth of goods fell by 50 between 1970 and 2003.”5 2.2.3 Energy Efficiency in Texas With abundant oil, natural gas, and wind resources, Texas has long been recognized as an energy production state. Today, Texas leads the nation in wind‐powered energy generation with 10,135 megawatts (MWs) of installed wind capacity as of 2010 (which represent nearly 25 percent of U.S. capacity)6. Texas also has a large population, heavy industrial base, and hot climate, making it also among the nation’s largest energy consumers. According to the EIA, Texas leads the nation in total energy consumption and ranks 6th in the nation in total energy consumption per capita, with 456 million BTUs/capita. The EIA also estimated that Texans spent an average of $4,651 on energy in 2009 (which is $1,190 above the national average)7. Texas has made great strides in recent years with energy efficiency and has significant potential to do more in the years ahead. Recognizing the need to develop a more energy‐efficient economy, Texas was the nation’s first state to establish EERS (which does not apply to MOUs). 5 The Energy Report. Texas Comptroller of Public Accounts. May 2008 American Wind Energy Association. http://www.awea.org/. September 2011 7 U.S. Energy Information Agency. http://www.eia.gov/state/state‐energy‐profiles.cfm?sid=TX. September 2011 6 A Best Practices Guide for Energy Efficiency in Municipally‐Owned Services Areas 12 | P a g e Senate Bill 7 (S.B. 7), set a goal at the time of 10 percent of an electric utility’s annual demand growth be met by efficiency programs by 2004. Texas utilities easily reached this goal. In fact, The Energy Report of 2008 by the Texas Comptroller of Public Accounts reported, “Even in the first year of the program (2000), EERS generated reported savings 11 percent above the goal.”8 Recognizing the ease with which these programs could produce tangible savings, the Texas Legislature has twice passed increases to the efficiency standard stipulating that 20 percent (H.B. 3693) and then 30 percent (S.B. 1125) of demand be met by efficiency programs by 2009 and 2013, respectively. While these goals do not directly impact cooperative and municipal utilities, some of the lessons learned and best practices from large IOU programs are can help provide a roadmap for smaller utilities. This is, in part, the goal of this report. It is important to note that the state law requiring IOUs to offer certain energy efficiency programs also directs the PUC to ensure timely and reasonable cost recovery for utility expenditures made to satisfy the goal. (PURA Sec. 39.905 (b)) Costs for IOU energy efficiency programs are significant. In 2009, for example, expenditures totaled approximately $105.8 million. (Energy Efficiency Accomplishments of Texas Investor Owned Utilities. EUMMOT. 2009) State law also provides for the establishment of an energy efficiency cost recovery factor (EECRF) to collect the incremental amount of energy efficiency revenue requirement not included in base rates. Thus, IOU customers must pay a state‐mandated energy efficiency fee as a line item on their electric bills, plus an additional amount mandatorily included in their base electric rates. So far, utilities have had great success meeting their targets. According to a 2009 report commissioned by the Electric Utility Marketing Managers of Texas (EUMMOT), “The nine Texas investor‐owned utilities exceeded the legislature’s statewide goals for the seventh straight year for energy efficiency. The utilities exceeded their 2009 demand reduction goal of 132 MW by 82 percent, achieving 240 MW of demand reduction. Furthermore, 559.8 gigwatt hours (GWh) of energy savings were achieved, effectively reducing nitrogen oxide (NOx) emissions by 827,409 pounds for the year.”9 Yet more can be done. In 2007, the ACEEE conducted a potentials study for the state of Texas and found that, “In the immediate and long‐term future, energy efficiency, DR, and onsite renewable energy resources can meet the growing demand for electricity in Texas.”10 ACEEE found that Texas could significantly and cost‐effectively increase its energy resources through efficiency. As successful as the Texas IOU programs have been overall, geographic coverage is inconsistent, reflecting the availability of energy service providers. A 2006 report to the PUC by Summit Blue Consulting and Quantec noted that this “has resulted in more remote areas having no coverage while metro areas are served multiple times across program years11.” In recognition of this issue, the PUC requires utilities to include in their Energy Efficiency Plan and Report “a list of any counties that in the prior year were under‐served by the energy efficiency program.” (PUC 8 The Energy Report. Texas Comptroller of Public Accounts. May 2008 Energy Efficiency Accomplishment of Texas Investor Owned Utilities. EUMMOT. 2009. 9 10 Potential for EE/RE to Meet Texas’s Growing Energy Demands. ACEEE, Report Number E073 March 2007. 11 Summit Blue Consulting et al (2006) Independent Audit of Texas Energy Efficiency Programs in 2003 and 2004 Report Available at http://www.puc.state.tx.us/industry/projects/rules/38578/EEP_Audit_Rpt_03‐04.pdf A Best Practices Guide for Energy Efficiency in Municipally‐Owned Services Areas 13 | P a g e Substantive Rule 25.181(m)(2)(T)) In 2011, the Texas Legislature also acknowledged that energy service providers tend to be concentrated in the major urban areas when it added a provision allowing a utility to provide programs directly to customers in a rural area if it can demonstrate that its program requirements cannot be met through competitive energy service providers. (Senate Bill 1125) 2.3 The Energy Industry and Municipally Owned Utilities in Texas 2.3.1 Overview of the Electric Industry in Texas The structure of the electric supply industry in Texas varies based on geographic location; however, the process of delivering electricity is consistent across the state. Large‐scale generating sources such as natural gas plants or wind farms are connected to transformers that increase voltage and then transport the electricity along transmission lines. Substations then decrease the voltage to a level that can be distributed and sold to residential, commercial, and industrial customers. Figure 3 illustrates the flow of energy from generation to end use. Source: Tri‐State Generation & Transmission Figure 3. Flow of Electricity from Generation to Customer Several regulatory authorities oversee to the energy industry: the Federal Energy Regulatory Commission (FERC), the North American Electric Reliability Corporation (NERC), the Electric Reliability Council of Texas (ERCOT), and the PUCT, among others. These agencies exist to protect consumers and ensure that energy is being provided in a reliable and affordable manner. Most people are unaware of the complex energy landscape that exists to generate, transmit, and distribute electricity to their homes or businesses. Electricity in Texas is delivered to end users via one of three types of utilities (also known as retail electric providers): 1) an IOU, 2) a cooperative utility, or 3) an MOU. IOUs are private shareholder‐owned companies that must abide by PUCT oversight. Electric cooperatives are private, nonprofit utilities owned by the people they serve, typically in rural areas. MOUs are also publicly owned. River authorities are also common in Texas; they manage water resources and produce electricity from dams, but do not deliver end‐use power. A Best Practices Guide for Energy Efficiency in Municipally‐Owned Services Areas 14 | P a g e ERCOT manages the flow of electric power to 23 million Texans ‐ representing 85 percent of the state's electric load and 75 percent of the Texas land area. As shown in Figure 4, the majority of Texas MOUs are located within the ERCOT territory. Figure 4. ERCOT Region and Municipally Owned Utility Territory Overlay In the ERCOT region, IOUs are deregulated, meaning utility functions are “unbundled” into the three segments: wholesale generation, transmission/distribution, and retail, so that different companies provide each service (deregulation does not apply to MOUs). Most IOUs in Texas operate in a retail competition environment. However, outside of the ERCOT region, traditional vertically‐integrated utilities provide bundled generation, transmission, and distribution. All MOUs have the option to operate in a vertically‐integrated manner, though many purchase power and then distribute it to their customers. 2.3.2 Municipally Owned Utilities in Texas While municipal utilities can be vertically integrated with generating resources (even in the ERCOT region), typically their primary roles include distributing power to customers, maintaining distribution lines, metering customer energy usage, and billing. Since few MOU activities are regulated by the PUCT, local governing boards within each service territory provide oversight. Governing boards may be city councils or community boards. This structure gives MOUs the unique advantage of being self‐governed by their citizens and the responsibility for setting customer rates. Additionally, MOUs are not bound by the same EERS that IOUs must abide by. That is, MOUs are not mandated to meet 30 percent of their forecasted growth in demand from energy efficiency programs. While IOUs’ primary goal is to earn a return for their shareholders, MOUs operate as non‐ profits. This means that after the MOU covers the cost of providing electric service, additional revenue is reinvested in the community in a variety of ways. With respect to energy efficiency programs, this difference can allow MOUs to create energy savings at a lower cost/kWh. A Best Practices Guide for Energy Efficiency in Municipally‐Owned Services Areas 15 | P a g e There are 72 MOUs in Texas that, together, serve 4 million Texans (1.6 million meters), accounting for 15 percent of Texas’ retail electric customers. The MOUs are incredibly diverse in terms of the number of customers they serve. CPS Energy in San Antonio, for example, is the largest MOU, serving approximately 700,000 customers. According to EIA, CPS Energy ranks as the 4th largest retail electricity provider (REP) in Texas; on the other end of the spectrum, the City of Goldsmith serves a population of 300. Eight Texas MOUs are among the 100 largest public power utilities in the nation. 2.4 How the Guide is Organized The Best Practices Guide for Locally Governed Electric Service Areas is presented in two distinct sections. The first, which includes Sections 1 through 4, reports the Project Team’s findings regarding best practice programs around the country and best practice attributes that contribute to program success. Additionally, this section presents our research on Texas’ market conditions and key considerations for MOUs interested in implementing energy efficiency programs. The second, presented as Section 5, represents the Long‐Term Energy Efficiency Plan. It incorporates several recommended programs for consideration by the Texas MOUs, as well as a discussion of key considerations for MOUs embarking on new energy efficiency programs, and cross‐cutting best practice attributes that should be common to all energy efficiency program efforts. To aid MOUs in selecting, designing, developing, and implementing energy efficiency programs, our recommendations include summaries of the critical operating characteristics and design criteria that should be considered in the program development process. In many cases the Project Team has provided alternative design and implementation strategies as well as examples for consideration; however, ultimately MOUs will need to carefully consider their own market needs, opportunities and barriers, delivery capacity, and resources to select the best programs and an implementation path that best meets their needs. Each program recommendation also includes an extensive list of program best practices and innovations. Recognizing that it may be impossible to implement every best practice identified in the course of this study, MOUs should examine these best practices and strive to implement those that are most feasible and appear most advantageous for ensuring program success. Structure of the Best Practices Guide The remainder of this guide includes the following key elements to inform Texas MOUs’ energy efficiency program development and implementation. Section 3: Methodology. This section provides a detailed explanation of the research and analysis methodology the Project Team used to identify best practice programs and apply them to MOU conditions in Texas. Section 4: Analysis and Results. Section 4 outlines the results of the Project Team’s research and analysis, including findings from the best practice program screening as well as our research into Texas MOUs’ market characteristics. This section offers detailed information on the current state of the art energy efficiency program design and on the identified best practice attributes inherent to seven categories of programs. Section 5: Energy Efficiency Plan. Section 6 provides recommendations for programs that were identified as candidates for implementation by Texas MOUs. These A Best Practices Guide for Energy Efficiency in Municipally‐Owned Services Areas 16 | P a g e recommendations were informed by our research findings and include specific best practices to support robust program design. Additionally, the section includes guidelines and information that MOUs should consider as part of their overall energy efficiency program planning process. Section 6: Conclusions and Final Remarks. Section 6 includes a brief summary of how MOUs can use this Guide as a tool to aid program decision making and next steps. A Best Practices Guide for Energy Efficiency in Municipally‐Owned Services Areas 17 | P a g e Section 3 Methodology The Project Team developed a research plan that consisted of two parallel tracks of research: a stakeholder engagement process that provided insights on MOUs local conditions, and a best practices study. The stakeholder engagement process solicited involvement from the Texas MOUs most interested in the development and implementation of this Guide. The process was designed to investigate the following factors: General information about MOUs’ operational structure Utility experience with energy efficiency programs and interest in future programs Customer behavior and decision‐making trends, local delivery capacity (i.e., existence of sufficient equipment dealers, installation contractors, and other program vendors to support program implementation) and local market potential for various technologies in each sector Barriers and constraints to implementing energy efficiency programs The best practices study was guided by a detailed analytical framework that allowed the Project Team to evaluate the vast amount of collected data associated with resource acquisition and energy efficiency programs. The analytical framework, instrumental to the project’s success, was developed to serve as a roadmap to identify program performance metrics that ultimately define “best practices” attributes key to successful energy efficiency programs. The framework had to support the Project Team to make meaningful comparisons of programs and program components. This required a painstaking process of normalizing data based on market segments, program type, design characteristics, administrative approach, and implementation strategy. To facilitate subsequent inter‐program and intra‐program analyses of performance, the Project Team developed two tiers of metrics. Quantitative metrics allowed the Team to narrow the field of best practice programs, and qualitative metrics served to identify program features that reflected SECO objectives (e.g., cost‐effective energy savings, addressing market barriers, administrative efficiency, etc.). These metrics further facilitated an “apples‐to‐apples” comparison of data within benchmarking datasets and allowed the Project Team to identify obvious program differences. The four main steps to the stakeholder engagement process and correlated tasks in the best practices study are outlined in Figure 5 and explained further in Sections 3.1 and 3.2 below. A Best Practices Guide for Energy Efficiency in Municipally‐Owned Services Areas 18 | P a g e SECO Approved Study RFP Participation Recruitment Kick off meeting Introductory survey Secondary Research Best Practices studies and paper Texas IOU and Large MOUs EE Programs Other related studies Develop Program Database Brainstorming Webinar Existing programs Knowledge/experience sharing Lessons learned ID and select programs ~400 Collect quantitative program data based on benchmarking metrics Level One Screening Refine Program Database ID and select programs ~ 58 In‐depth Telephone Interviews Interests , needs, barriers, and priorities Rate structure Market characteristics Delivery capacity Data Analysis Qualitative synthesis by components /category Specific cases by components /category Level Two Screening User Needs Assessment Program theory and design Program management Program implementation Best Practices Report Best practices characteristics tailored to Texas MOUs List of Programs including detailed components and budget plan Fund and Implement Pilot EE Programs Initiate and Assist in energy efficiency pilot programs Figure 5. MOU Best Practice Study Parallel Research Tracks 3.1 Stakeholder Engagement Process 3.1.1 Initial Outreach and Participant Recruitment The initial step in stakeholder engagement was to introduce the project to the Texas MOUs. The Project Team, working with TPPA, drafted an introductory letter (see Appendix A), to serve three main purposes: Introduce the Project Team to the MOUs Announce the official kick‐off of the project and key dates for participation. Request the MOUs’ participation in the project and set the foundation for future stakeholder engagement. Initial outreach materials were segmented according to two groups of MOUs, based on their annual electricity sales. The Project Team and TPPA drafted two different letters to introduce the project and describe the objectives of the Guide. A Best Practices Guide for Energy Efficiency in Municipally‐Owned Services Areas 19 | P a g e Small to medium‐sized MOUs (less than 500,000 MWh) – The initial letter to the smaller MOUs included a brief survey with answers to frequently asked questions (FAQs) regarding the project. This survey sought to gather a few key pieces of data from as many MOUs as possible to help the Project Team understand the status of energy efficiency programs for the smaller MOUs. Medium to large‐sized MOUs (more than 500,000 MWh) – Utilities falling in this group are required to report to the State of Texas annually on their local energy efficiency programs, due to new legislation (Senate Bill (SB)‐924) enacted in April 2011. The introductory letter to this group requested an updated annual report on existing and planned energy efficiency programs. The Project Team received 22 completed surveys. Table 2 lists the utilities that participated. Table 2. List of Utility Respondents Utility Participants in the Study Weatherford Municipal Utility Kerrville Public Utility Board (KPUB) Floresville Electric Light & Power System (FELPS) City of San Marcos Georgetown Utility System (GUS) Brownsville Public Utilities Board (BPUB) Garland Power & Light (GP&L) College Station Utilities Lubbock Power and Light (LP&L) New Braunfels Utilities (NBU) Bryan Texas Utilities (BTU) Denton Municipal Electric (DME) City of Moulton City of Yoakum City of Seguin Robstown Utility System GEUS City of Bowie City of Boerne City of Floydada Austin Energy (AE) CPS Energy 3.1.2 Brainstorming Session Once MOU participants were identified, the Project Team hosted a brainstorming session to launch the study process. The brainstorming session was an opportunity for the Project Team to provide details on the research methodology and project goals, and discuss with the MOU participants the local conditions in their service territories. A Best Practices Guide for Energy Efficiency in Municipally‐Owned Services Areas 20 | P a g e This session was offered as a webinar at two different times of the day on June 28th, 2011, to reach as many MOU participants as possible. Figure 6 outlines the webinar objectives. Figure 6. Brainstorming Webinar Objectives The brainstorming webinar allowed the Project Team to provide a deeper level of project information beyond the introductory letter. It also helped develop the framework for a core group of utilities who would participate in the process. The Project Team posed a series of questions to participants in the brainstorming session to gather information about the MOUs’ service territories. These questions included the following: What types of energy efficiency program/offerings have been successful in your territory? Who manages or would manage energy efficiency programs in your territory? What are the barriers to implementing energy efficiency in your territory? What types of customer sectors/segments should we focus on for your territory? What types of programs should we focus on for your territory? What types of measures should we focus on for your territory? Which of the identified cost‐effectiveness tests are the most relevant for your utility? 3.1.3 Structured Interviews and Detailed Program Information Collection In order to gain a higher‐level understanding of the individual MOU conditions, the Project Team conducted a data gathering process consisting of written data requests and structured, in‐depth, interviews with the MOUs that volunteered to participate. MOU data collection was implemented in two stages. First, the Project Team submitted written data requests to each participating MOU to gather quantitative information related to customer characteristics, consumption and demand, and existing program offerings. To supplement this A Best Practices Guide for Energy Efficiency in Municipally‐Owned Services Areas 21 | P a g e data, the Project Team conducted phone interview with representatives from each of the 20 Texas MOUs who volunteered to participate in this research study. The Team used a structured interview instrument based on information obtained during the webinar and initial survey to guide the interviews. The final data request and interview guide are provided in Appendix B. 3.2 Best Practice Program Benchmarking As discussed previously, the Project Team developed an analytical framework to guide its research on best practice programs around the United States. The analytical research framework to identify and categorize best practices followed the step‐by‐step approach shown in Figure 5 and described in greater detail below. The overarching methodology for identifying and categorizing best practices approaches for Texas MOUs followed this step‐by‐step approach. Step 1 – The Project Team started by identifying approximately 400 programs across North America and categorizing them based on sector and program type. The list included best practice programs identified by ACEEE and other energy organizations and programs that the Project Team has identified as successful through our previous evaluation and planning work. Step 2 – The Project Team identified a range of metrics to compare programs within sectors and categories to determine those that qualify as best practice programs. The metrics best suited for program comparisons varied within and among program categories and sectors. For each metric, the Project Team defined critical analysis data to facilitate an equitable comparison of programs. Step 3 – The Project Team developed a spreadsheet database (see Appendix C) using the identified analysis data to define data entry fields. The database broke down programs into primary categories, such as “audit/direct install” and “equipment rebate,” to facilitate a comparison of like programs determined to be most appropriate for MOUs. The Project Team populated the analysis tool with commonly available program planning and impact evaluation data (e.g., energy and demand savings and cost‐effectiveness). Step 4 – Level 1 Screening. The Project Team identified sets of screening criteria appropriate for each applicable program category that allowed us to identify those programs in the database that performed well in specific best practice attributes for each category. The initial screen used collected data to analyze and benchmark programs based on the quantitative performance metrics for each specific program category and allowed the Project Team to narrow the list to those that had achieved a high level of performance. Step 5 – Level 2 Screening. Programs that passed the initial analysis and screening went through a secondary review, based on qualitative metrics. The level 2 screening helped the Project Team identify a list of candidate programs for more detailed study and for cross‐referencing against regional conditions. The Project Team reviewed program materials and available process evaluation reports and where necessary, interviewed program managers to determine specific best‐practice attributes that contributed to the programs’ success. A Best Practices Guide for Energy Efficiency in Municipally‐Owned Services Areas 22 | P a g e Once this data screening process was complete, the Project Team applied specific best practice program attributes to the collected program data. A cross‐correlation of the attributes (independent variables) gave the Project Team a better understanding of which attributes have the most influence that may be most appropriate for the Texas MOU marketplace, and how to best group and apply the collected data to useful program recommendations. A Best Practices Guide for Energy Efficiency in Municipally‐Owned Services Areas 23 | P a g e Section 4 Analysis and Results As discussed earlier, in order to determine energy efficiency program best practice attributes most appropriate for replication by the MOUs, the Project Team conducted research to gain a thorough understanding of both best practice energy efficiency programs around the country and the local and regional market conditions among the MOUs. This section includes details on the Project Team’s analytical processes and results. 4.1 Overview of Texas’ Municipally Owned Utilities While some best practice attributes may prove highly successful under certain market conditions, they may not necessarily apply to Texas’ MOU environment. Different MOUs in Texas have different energy efficiency programs and needs. The state’s two largest MOUs offer mature efficiency programs, while some mid‐sized Texas MOUs are looking to expand or refine existing energy efficiency programs, and other mid‐sized and smaller MOUs are just getting started. As part of the stakeholder engagement process, the Project Team collected data and conducted interviews with a subset of Texas MOUs and analyzed the results to discern market characteristics and important considerations for energy efficiency programs. 4.1.1 Large Municipally Owned Utilities The two largest MOUs in Texas, AE in Austin and CPS Energy in San Antonio, both have robust energy efficiency programs and staff to manage them, and therefore served as a program model rather than the target population for the Guide. 4.1.1.1 Austin Energy Austin Energy (AE) serves 400,000 customers in Austin and the surrounding areas. AE initiated energy efficiency programs in 1982 and its DSM portfolio remains among the most comprehensive in the nation today. With the help of these energy efficiency programs, AE has saved more electricity than the annual output of a 500 megawatt power plant. AE’s Power Saver and Green Building programs help maximize energy resources by creating opportunities for customers to lower their electric bills while increasing comfort and satisfaction. Higher efficiency lowers costs to AE and its customers while reducing power plant emissions and promoting economic development in the Austin area. Investment in high efficiency equipment and services provide economic benefits through increased employment in the local energy efficiency industry. Energy bill savings augment customers’ disposable incomes, which in turn, increases spending in the local economy. AE’s diverse mix of residential efficiency, commercial energy management, and green building programs also have achieved substantial reductions in peak electric demand, leading to all‐time record reductions in both energy usage and power plant emissions. From October 2007 through September 2008, AE achieved 64.1 MW of demand reduction and a 132,000 MWh energy reduction. Table 3 through Table 5 show AE’s participation, demand savings, and energy savings achieved through energy efficiency in 2008. A Best Practices Guide for Energy Efficiency in Municipally‐Owned Services Areas 24 | P a g e Table 3. Austin Energy 2008 Residential Program Results Program Appliance Efficiency Program Home Performance Energy Star – Rebate Home Performance Energy Star – Loan Free Weatherization Multifamily Program Clothes Washer Rebate Duct Leaks Sealing/Diagnosis Refrigerator Recycling Power Partner Cycle Saver Compact Fluorescent Lamps (CFLs) Residential Subtotal # of Projects 3,093 2,223 213 505 21,814 813 231 4,114 9,934 1,237 0 44,177 Energy Savings (kWh) 3,782,000 421,000 4,390,000 552,000 23,847,000 234,000 Peak Demand Savings (kW) 2,930 4,020 380 480 4,610 40 3,235,000 97,000 7,000 6,244,000 42,810,000 1,210 9,800 800 990 253,000 Table 4. Austin Energy 2008 Commercial Program Results Program Commercial Rebate Commercial AEP Small Business Municipal Municipal Power Partner Commercial Power Partner Load Coop Engineering Support Commercial Smart Vendor Muni. Vend & Monitor Misers Discontinued Programs Subtotal Commercial # of Projects 351 0 264 129 0 1,331 29 3 420 0 0 2,527 Energy Savings (kWh) 42,783,000 0 2,414,000 383,000 14,000 19,000 492,000 0 0 1,238,000 0 47,343,000 Peak Demand Savings (kW) 12,800 0 1,100 130 1,430 1,250 2,160 70 730 0 19,700 12,800 A Best Practices Guide for Energy Efficiency in Municipally‐Owned Services Areas 25 | P a g e Table 5. Austin Energy 2008 Green Building Programs Results Program Residential Ratings Residential Energy Code Multifamily Energy Code Multifamily Ton Reduction Commercial Ratings Commercial Energy Code Subtotal Green Building # of Projects 1,021 2,941 4,805 0 0 0 8,767 Energy Peak Demand Savings Savings (kWh) (kW) 1,529,000 850 7,914,000 4,860 4,627,000 2,170 0 1,300 13,377,000 4,770 14,590,000 5,210 42,039,000 19,200 4.1.1.2 CPS Energy CPS Energy of San Antonio, Texas, is the nation’s largest municipally‐owned energy company to provide both natural gas and electrical services. In 2008, the CPS Energy Board of Trustees adopted a portfolio of energy efficiency programs known as “Save for Tomorrow Energy Plan” (STEP). The goal of these programs is to save 771 MW between 2009 and 2020 with an allocated budget of approximately $849 million. STEP offers a wide variety of incentive programs to its 1.2 million electric and gas customers. The programs are broken into three main categories: residential energy efficiency programs, nonresidential energy efficiency programs, and DR programs. The 2010 net energy and demand savings along with the number of projects per program are shown in Table 6 below for the residential program offerings. The largest savings, for both energy and demand, were achieved through the Residential HVAC Program. Table 6. CPS Energy 2010 Residential Program Results Program CFL Home Efficiency Air Flow Performance Residential HVAC Solar Photovoltaic (PV) & Water Heater New Homes Construction Refrigerator Recycling Wash Right Residential Subtotal Peak # of Energy Demand Projects Savings (kWh) Savings (kW) 452,693 9,969,578 993 2,923 2,321,792 944 366 505,483 281 12,647 12,437,505 3,634 197 1,729,383 1,090 677 4,406,780 745 1,380 859,811 91 8,620 1,145,856 478 479,503 33,376,189 8,257 Table 7 shows non‐residential program results for 2010. The Large Commercial Lighting Program achieved the highest savings of the nonresidential programs. A Best Practices Guide for Energy Efficiency in Municipally‐Owned Services Areas 26 | P a g e Table 7. CPS Energy 2010 Nonresidential Program Results Program Large Commercial Lighting Small Commercial Lighting Com. HVAC Motors Roof Coating Window Film Restaurant Equipment Lean Clean Energy New Construction Custom Non‐Residential Subtotal # of Energy Projects Savings (kWh) 137 16,421,243 14 99,640 130 6,142,509 10 179,793 27 181,405 2 144,700 13 19,969 4 595,441 1 58,636 7 823,731 345 24,667,067 Peak Demand Savings (kW) 3,203 20 2,537 62 123 42 2 68 42 115 6,215 Table 8 lists CPS Energy’s 2010 results for its DR Programs. Table 8. CPS Energy 2010 DR Program Results Program Peak Saver Commercial and Industrial (C&I) DR DR Subtotal 4.1.2 # of Energy Savings Peak Demand Customers (kWh) Savings (kW) 43,174 460,676 17,785 51 1,283,346 45,028 43,225 1,744,022 62,813 Small and Mid‐sized Municipally Owned Utilities This project attracted participation from a wide range of MOUs representing considerable variation in conditions that affect energy efficiency program planning. Our investigation included factors such as MOUs’ existing operational structures, customer behavior and decision‐ making trends, local delivery capacity, regional codes, technology adoption, energy efficiency potential in MOUs’ territories (at the measure level, if applicable secondary data were available) and interest in energy efficiency programs. Our investigation found that the MOUs participating in the process represent a wide range of communities, but many have significant commonalities in terms of customer makeup and types of efficiency programs currently offered. 4.1.2.1 Operating and Market Conditions Initial phone interview questions were designed to gain an understanding of Texas MOUs’ basic operating structure, size, and electric usage trends in the past 5 years. Our findings indicated that the residential sector dominates MOU customer bases, with approximately 84 percent residential customers and 16 percent nonresidential customers. The majority of MOUs have seen their populations increase over the past 5 years, which has translated into increased electric demand requirements for most. However, despite increasing demand requirements, few MOUs have faced problems meeting peak demand. Finally, while 55 percent of MOUs have increased their electricity rates in the past 5 years, 5 percent have reduced rates, and among the A Best Practices Guide for Energy Efficiency in Municipally‐Owned Services Areas 27 | P a g e remaining 40 percent, rates have remained flat. Table 9, Figure 7 and Figure 8 provide information on MOUs’ operating and market characteristics. Table 9. Texas Municipally Owned Utility Operational and Market Characteristics Customer Size MOU Staff Size 1,100‐100,000 total Total employees range from 5 ‐ 300 84% Res 16% Com/Ind 1‐3 employees dedicated to energy efficiency (includes both FTE and part‐ time employees (PTEs)) Program Delivery Approach 85% in house 5% 3rd party 10% both Population Trends 70% w/ increasing trend 30% w/ flat trend Electric Demand Trends 70% w/ increasing trend 30% w/ flat trend Utility Rate Trends 55% w/ increasing trend 5% w/ decreasing 40% w/ no trend change Power Supply Sources 20% own 75% purchase 5% both Marketing Efforts Methods to reach community members include bill stuffers, media events, social/public events, newspapers advertisements. No MOUs reported problems reaching their communities. 21.0 8.1 13.4 3.0 0.7 4.4 29.0 21.6 13.0 25.2 71.9 14.0 1.3 67.9 43.8 409.3 4.8 3.0 44.0 47.2 35.7 701.3 Figure 7. Participating Municipally Owned Utilities by Customer Base (in thousands) Although small to mid‐sized Texas MOUs predominantly serve residential customers (in terms of number of customers), electricity sales are more evenly distributed among customer sectors. Nearly half of MOUs’ total electricity sales (46 percent) are to residential sector customers followed by commercial customers (39 percent). MOUs in Texas generally have few industrial customers and their sales to that sector represent only about 15 percent of total electricity sales. Due to the smaller industrial customer base, this sector may not offer significant energy saving opportunities for most MOUs. A Best Practices Guide for Energy Efficiency in Municipally‐Owned Services Areas 28 | P a g e 15% kWh Sales Residential 46% kWh Sales 39% kWh Sales Commercial Industrial Figure 8. Distribution of Total Electricity Sold (kWh) by Market Sector These findings were consistent with the results of our brainstorming discussion with MOUs that indicated they were most interested in residential type programs. 4.1.2.2 Local Market Conditions and Efficiency Program Background Overall, the 22 participating MOUs indicated they currently offer a total of 129 energy efficiency programs. The programs ranged from energy audits to rebates for energy efficiency equipment. Figure 9 through Figure 12 summarize the energy efficiency programs currently being offered by Texas MOUs. Key program components including market sector focus, measure qualification, program budgets, and implementation strategies are summarized below. The comprehensive programs offered in each sector include those that offer incentives for a wide range of measures including lighting, HVAC, insulation, building shell, solar systems, thermostats, motor replacement, etc. Existing Energy Efficiency Programs by Market Sector Among existing MOU energy efficiency programs, some offer services or incentives to customers in multiple market sectors. For the purposes of this study, the Project Team categorized these as individual programs for each customer sector targeted. Figure 9 shows a breakdown of current energy efficiency programs by customer sector. Nearly 53 percent of MOUs’ programs are residential/residential low income whereas 36 percent are commercial and 11 percent are industrial. A Best Practices Guide for Energy Efficiency in Municipally‐Owned Services Areas 29 | P a g e Residential 11% Residential Low Income 50% Commercial 36% Industrial 3% Figure 9. Existing Energy Efficiency Programs by Market Sector The Project Team’s analysis of the most common types of energy efficiency programs indicated a healthy mix of residential programs currently offered by Texas MOUs. Figure 10 shows the mix of residential sector programs. Of 39 programs offered, the majority are geared towards energy‐ efficient lighting and HVAC, followed by renewable energy and weatherization. It is worth noting that a significant number of MOUs provide incentive programs to promote renewable energy technologies, which are not generally considered a cost‐effective resource when compared to energy efficiency. Lighting 8% 18% HVAC 10% Renewables 8% 8% Weatherization Energy Audits Tree Power 8% 21% 13% 8% Appliance Rebate Comprehensive Education/Thermostat Figure 10. Existing Municipally Owned Utility Residential Programs by Program Type MOUs currently offer a total of 27 programs in the commercial sector. As shown in Figure 11, most target energy‐efficient lighting and renewable energy technologies. A smaller proportion A Best Practices Guide for Energy Efficiency in Municipally‐Owned Services Areas 30 | P a g e offer energy audits and education. The “other” category includes low‐interest financing, reflective roof, and tree giveaway programs. Lighting 15% 7% 30% Renewables Energy Audits 7% Education 15% 26% Comprehensive Other Figure 11. Existing Municipally Owned Utility Commercial and Industrial Programs Of the MOUs’ total eight industrial sector programs, the majority promote energy‐efficient lighting and renewable energy. Reflective roof coating is represented in the “other” program category. The analysis suggests very few MOUs offer energy efficiency programs for the industrial sector since most MOUs have few or no industrial customers. 13% 13% 38% Lighting Renewable 38% Figure 12. Existing Industrial Sector Energy Efficiency Programs by Program Type A Best Practices Guide for Energy Efficiency in Municipally‐Owned Services Areas 31 | P a g e 4.1.2.3 Energy Efficiency Program Budgeting and Management Structure The Project Team found that, in most cases, a designated utility board or City Council reviews and approves energy efficiency programs recommended by staff. Few MOUs establish savings goals for their energy efficiency programs or measure energy savings; those that do typically rely on random field inspections and billing analysis to estimate savings. Most MOUs manually document program data rather than using information tracking systems, and most do not calculate the cost‐effectiveness of their energy efficiency programs. The MOUs that participated in phone interviews indicated their current energy efficiency programs are well‐received by community members and their Board/City Council governing bodies. However, they also indicated a general lack of interest in increasing electric rates to fund future energy efficiency programs. Figure 13 shows the MOUs’ typical budgeting and management structure governing energy efficiency programs. Ninety‐eight percent of the MOUs interviewed fund their programs with internal budgets and manage their programs with in‐house staff rather than hiring third‐party consultants or contractors. 120% 100% 80% 60% 98% 98% Yes Yes 40% 20% 2% 0% Budget Internally 2% In‐House Management Figure 13. Program Budgeting and Program Management Structure 4.1.2.4 Efficiency Potential The Project Team asked a series of interview questions aimed at identifying the Texas MOUs’ perceived savings potentials in each market segment, including residential, small C&I/large commercial. Participants were asked to rate the savings potentials of a list of common utility program electric efficiency measures or technologies from low to significant, where “low opportunity” equaled a score of 1, “moderate opportunity” scored a 2, and “significant opportunity” was given a score of 3. Analysis results based on the ratings are shown in the bar charts below. The charts display different energy efficiency technologies on the horizontal axis, the scale on the left hand side A Best Practices Guide for Energy Efficiency in Municipally‐Owned Services Areas 32 | P a g e shows the number of MOUs whose responses were recorded for this analysis, and the scale on the right displays the average score each technology achieved. Three bar colors differentiate “low opportunity” (green), “moderate opportunity” (red) and “significant opportunity” (blue), respectively. The total average score is indicated next to each technology. The Project Team’s analysis used an average score of 2.0 as the cutoff to indicate sufficient potential to justify a concerted effort in energy efficiency program strategies. Technologies that scored a 2.0 or less were considered to offer a relatively low opportunity for energy savings. As shown in Figure 14, most MOUs rate the following measures as having moderate to significant energy savings potential in the residential sector: Cooling Building shell Lighting Low income weatherization Kitchen appliances Figure 14. Residential Savings Opportunities by Measure MOUs rated lighting, HVAC, and building shell measures as offering moderate to significant efficiency opportunities in the small/medium commercial sector (see Figure 15): The responses indicate that the remaining measures offer low to moderate opportunities in the small/medium commercial sector. While these technologies may not offer significant enough opportunities to justify targeted program offerings, MOUs with larger opportunities in their territories might consider providing incentives through a custom incentive program. A Best Practices Guide for Energy Efficiency in Municipally‐Owned Services Areas 33 | P a g e Figure 15. Small/Medium Commercial Savings Opportunities by Measure As shown in Figure 16, the majority of MOUs rated efficiency potential for all of the technologies in the large C&I sector as low or moderate opportunities. MOUs with significant industrial customer bases might consider offering a custom incentive program. Figure 16. Industrial/Large Commercial Sector Savings Opportunities by Measure A Best Practices Guide for Energy Efficiency in Municipally‐Owned Services Areas 34 | P a g e 4.1.2.5 Future Programs In order to better understand the opportunities for future program offerings, the Project Team asked MOU participants a series of questions aimed at capturing relevant information on local market conditions. The results of these inquiries are described below. Barriers and Constraints In both the brainstorming discussion and interviews, the Project Team asked the Texas MOUs to rate their internal/operational constraints or barriers, and priorities for implementing energy efficiency programs, as well as perceived customer barriers to participating in programs. In both cases, MOUs indicated similar operational constraints and customer barriers associated with availability of funding and lack of awareness about energy efficiency programs and benefits. These findings are consistent with common utility barriers around the country. In interviews, the MOUs were given a list of common constraints or barriers to implementing energy efficiency programs and asked to rate each as “not problematic,” which was scored as a 1; “slightly problematic,” which was scored as a 2; and “significant issue,” which was scored as a 3. The bar charts in this section display the analysis results. The charts display constraints, implementation barriers, and motivations or priorities on the horizontal axis; the left axis shows the number of MOUs whose responses were recorded for this analysis, and the scale on the right side displays the average score for each category. As in the previous section, different colors designate low (green), medium (red) and significant (blue) issues or priorities, respectively. The analysis of interview responses, shown in Figure 17, indicated that MOUs’ most common constraints to implementing energy efficiency programs are consistent with those identified in brainstorming discussions: Lack of available budget or knowledge of how to set up funding mechanisms for energy efficiency programs. Lack of staff resources, and to a lesser extent, local skilled contractors. The analysis also indicated a high level of interest in energy efficiency programs among customers and utility decision makers. A Best Practices Guide for Energy Efficiency in Municipally‐Owned Services Areas 35 | P a g e Figure 17. Operational Constraints on Ability to Offer Energy Efficiency Programs As shown in Figure 18, the most common barriers to customer participation in energy efficiency programs are the following: Lack of awareness about energy efficiency programs among community members. Lack of awareness about environmental issues among community members. High upfront cost for energy‐efficient equipment. Lack of interest among customers due to limited understanding of the long‐term value of energy‐efficient technologies. High incidences of split incentives due to large percentage of rental properties. A Best Practices Guide for Energy Efficiency in Municipally‐Owned Services Areas 36 | P a g e Figure 18. Common Barriers to Customer Participation Priorities & goals Finally, the Project Team asked MOUs about their priorities for implementing energy efficiency programs in their territories and the goals they would most like to achieve through such programs. MOU responses (shown in Figure 19) indicated that the most common priorities for energy efficiency programs are: Achieving high savings from energy efficiency programs at a low cost. Reducing peak load. Generating good public relations value. Educating community members and facilitating market transformation, causing the community to adopt energy efficiency measures. Implementing energy efficiency programs without increasing customer electricity rates. A Best Practices Guide for Energy Efficiency in Municipally‐Owned Services Areas 37 | P a g e Figure 19. Priorities or Motivations for Energy Efficiency Programs 4.2 Best Practice Program Benchmarking The Project Team’s analytical framework served as a basis for analyzing and benchmarking best practice programs for the study. The analysis and results are discussed in greater detail below. 4.2.1 Development of Program Database The Project Team developed a spreadsheet database to allow for comparative analysis of program metrics. The Project Team conducted an extensive literature review to compile a preliminary list of programs to populate the database. In total, the Project Team identified over 400 energy efficiency programs through the resources described in the following paragraphs. Nationwide Recognized Exemplary Programs The Project Team leveraged energy efficiency best‐practices studies within the industry. The following studies provided a vast resource of programs that had already been identified as exemplary programs. The ACEEE report ‐ Compendium of Champions: Chronicling Exemplary Energy Efficiency Programs from Across the United States. (u081) The ACEEE report ‐ Meeting Essential Needs: The Results of a National Search for Exemplary Utility‐Funded Low‐Income Energy Efficiency Programs (u053) The ACEEE report ‐ States Stepping Forward: Best Practices for State‐Led Energy Efficiency Programs (E106) The Consortium for Energy Efficiency (CEE) report – Residential HVAC Programs National Summary (Res_HVAC_PS05) A Best Practices Guide for Energy Efficiency in Municipally‐Owned Services Areas 38 | P a g e National Energy Efficiency Best Practices Guide Texas Utility Programs Texas IOUs, CPS Energy, and AE have implemented energy efficiency programs for years and accumulated valuable experiences on program design, program management, program monitoring and verification, and long‐term cost‐effectiveness. Since these utilities all share a Texas customer base and similar market potentials, climate conditions, and other market characteristics, their energy efficiency programs are valuable model programs for Texas MOUs. Other Programs Selected The Project Team identified additional energy efficiency programs across the nation through both primary and secondary research, including: The Rapid Deployment Energy Efficiency (RDEE) Toolkit Energy Efficiency in California’s Public Power Sector status report of 2009 and 2010 2009 Rocky Mountain Power DSM Annual Report – Idaho and Wyoming 2009 Colorado Utilities Report Seattle City Light ‐ Energy Conservation Accomplishments: 1977‐2006 Focus on Energy 2007 annual report, Wisconsin’s statewide energy efficiency and renewable energy initiative 2010 Alliant Energy annual report 2009 Efficiency Vermont annual report Energy efficiency programs managed and evaluated by the Project Team After compiling the list of energy efficiency programs, the Project Team collected the data elements including, but not limited to, those listed in Table 10. The Project Team’s approach relied on secondary research including searches of public utility commission filings, published reports, papers, program administrator databases, and Internet sites. The Project Team also drew on our experience and collected resources based on designing, implementing, and evaluating energy efficiency programs in more than 30 North American states. A Best Practices Guide for Energy Efficiency in Municipally‐Owned Services Areas 39 | P a g e Table 10. Program Performance Data Metrics Program Performance Data Utility Sales and Revenue by Sector Definition These data provide an overview of the service territory characteristics and allowed normalization of data from programs in different territories with different characteristics. Gross Energy Savings and Generally the expected energy and/or demand savings are Gross Capacity Savings the drivers behind a program; therefore, these are key measures of the program’s impact and success. Net Energy Savings and Net The net savings take into account naturally occurring market Capacity Savings adoption and provide some context for the current market conditions in the program territory. Spending by Cost Category Spending data, combined with energy or capacity savings Where Available and Overall data, is a measure of the program’s efficiency. Cost‐effectiveness Test Results These data weigh the program’s benefits and costs and provide a measure of the program’s cost‐effectiveness. 4.2.2 Program Categories and Benchmarking Metrics To ensure an “apples‐to‐apples” comparison of programs, the Project Team had to identify and collect comparative data on key program components critical to the benchmarking process and to informing recommendations for MOUs. The data had to allow for a reasonable comparison of market segment divisions and program components such as design, administrative approach, and implementation strategy. Therefore, the Project Team grouped the initial list of 400 energy efficiency programs into program categories and some sub‐categories as a function of target market, incentive structure, delivery approach, and other possible dimensions. Program categories are described below. Table 11. Energy Efficiency Program Category Program Category Appliance Recycling Audit and/or Direct Install Direct Response Education and Behavior Impact Definition Program is designed to take inefficient appliances out of circulation by offering free or rebated recycling services. Program provides field inspections or audits of homes or businesses to identify energy efficiency opportunities and/or provides direct installation of low cost measures in the target customer sites. Building tune‐up and retrofit commissioning programs are included in this category. Program is designed to reduce peak load from the power grid, either through behavior change, a load control mechanism, or execution of a previously agreed upon load‐cutting measure. Program is focused on educational components (e.g., behavior change). While some education programs may include low cost measures (e.g., efficiency kits), education is the primary program feature. A Best Practices Guide for Energy Efficiency in Municipally‐Owned Services Areas 40 | P a g e Program Category Equipment Rebates Innovative Financing New Construction Definition The program offers cash incentives (prescriptive or custom) to offset the capital cost of energy‐efficient equipment (e.g., HVAC, lighting, motors). Renewable technology programs (solar, wind, etc.) are included in this category. Program provides innovative financing to fund energy‐efficient improvements (e.g., on‐bill financing (OBF)). Program offers incentives to building owners or design teams for more energy‐efficient home/building construction. The analytical framework provided the basis for developing quantifiable performance‐ benchmarking metrics to facilitate subsequent inter‐program and intra‐program analyses of performance, as well as readily searchable information fields. Primary metrics included indicators that reflected SECO objectives (e.g., cost‐effective energy savings, addressing market barriers, administrative efficiency). Secondary metrics included indicators of program components that may not apply to all programs (e.g., innovative outreach for “hard to reach” (HTR) market segments, success in achieving synergies with other programs). These metrics further facilitated an “apples‐to‐apples” comparison of data within benchmarking datasets and allowed the Project Team to identify obvious program differences. Where appropriate and available, the secondary metrics included information listed in Table 12. Table 12. Benchmarking Metrics Benchmarking Metrics Dollars spent per gross kWh saved Dollars spent per gross kW saved Dollars spent per net kWh saved Dollars spent per net kW saved Cost per participant or measure Definition The total program budget divided by the annual energy savings provided a normalized value that was compared to the unit cost of energy saved for different programs. The total program budget divided by the net energy savings was compared to dollars per gross energy savings. Comparing these metrics across programs revealed differences in markets between territories. The total program budget divided by the net energy savings was compared to dollars per gross energy savings. Comparing these metrics across programs revealed differences in markets between territories. The total program budget divided by the net demand savings was compared to dollars per gross demand savings. Comparing the gross and net savings metrics revealed differences in markets between territories. The total program cost per participant was used to compare costs across programs with similar measures. This metric was reviewed alongside the budget breakdown for each program to provide context around the results. For example, did a program have a higher cost per participant because the utility spent more on marketing or because the incentives were higher? A Best Practices Guide for Energy Efficiency in Municipally‐Owned Services Areas 41 | P a g e Benchmarking Metrics Incentive costs as a % of total budget Marketing costs as a % of total budget Cost‐effectiveness 4.3 Definition The percent of the total program budget spent on incentives was compared across programs with similar measures. Additional information about the incentive budget per year and incentives paid per year were noted when available (e.g., was participation in a program limited because of incentive budget?). The percent of the program budget dedicated to marketing was analyzed in conjunction with program participation metrics to determine which programs were successful with their marketing efforts. The program cost‐effectiveness was compared, to the extent possible, using available data on cost‐effectiveness tests for each program. Level One Analysis – Program Performance Review Through the level one analysis, the Project Team conducted a quantitative screening of programs aimed at narrowing the list of 400 programs down to only those that achieved the best performance in several areas. To best accommodate this process, the Project Team selected benchmarking metrics appropriate for each program category (as described below). In some cases, program categories may contain multiple program delivery sub‐categories. The Project Team sought to compare programs within each category and to ensure a good cross‐ section of program types to serve as models for further research and screening. Equipment Rebate Program This program category is the most common and thus the database has the most of these types of programs; they cover the residential, commercial, and industrial market sectors. The programs were divided into four subcategories based on the incentive type in each market sector. Prescriptive rebate and dealer spiff programs offer a fixed incentive rebate for pre‐ approved energy efficiency measures (e.g., clothes washers receive a $100 rebate, dishwashers $50). The dealer spiff program pays the incentives directly to a manufacturer, vendors, installers, dealers, or other trade allies, and the program offers as a way to encourage trade allies to promote the utility program to their customers and are sometimes offered in conjunction with a customer. Rebate Dollars spent/gross kWh saved and dollars spent/participant were used to screen the programs. Custom rebate incentives are based on the kW and/or kWh savings performance of the installed measure(s) or a percentage of the customer’s investment. Dollars spent/gross kWh and dollars spent/participant were good indicators of program efficiency. Whole building programs are based on the whole house or commercial building achieving a specific level of efficiency, or a percentage of the building’s efficiency performance. Dollars spent/gross kWh was used to screen the programs. A Best Practices Guide for Energy Efficiency in Municipally‐Owned Services Areas 42 | P a g e Upstream programs provide incentives to a manufacturer or dealer and the end user simply pays a lower price for that measure than they would have paid without the incentive. The programs were compared based on cost/kWh saved. Appliance Recycling Program Programs in this category take inefficient appliances out of circulation by offering incentives coupled with free recycling services for customers. All programs in this category are in the residential sector. Dollars spent/gross kWh saved and program cost/participant are used as the screening criteria. Audit and/or Direct Install Program The programs in this category inspect a home or business to identify energy efficiency opportunities and/or directly install measures or services. Within this broad category, programs represent several delivery subcategories: Energy audits with or without direct installation of energy efficiency measures. Because energy audits alone do not generate energy savings, different utilities combine audit programs with various measure installation approaches to achieve cost‐ effectiveness, making it difficult to compare programs. Thus, the dollars/gross kWh saved metric is less meaningful in this subcategory. In this case, greater emphasis is placed on total participants as an indicator of the program’s ability to reach a broad audience and cost/participant or gross kWh/participant as a proxy for the rate of measure uptake. Low income weatherization. Low income programs typically offer free energy efficiency measures to income qualified participants. Nearly all low income programs are modeled after the federal Low‐Income Energy Assistance Program and utility funding is frequently combined with other sources of funding to create a comprehensive measure package for end users. Dollars spent/gross kWh saved and dollars spent/participant are good indicators of program administrative efficiency. Number of participants and gross kWh saved/participant is used to screen the programs for implementer/installer effectiveness. Multifamily audits. The best practices database includes both low‐income and non‐low‐ income multifamily audit and direct install programs. Multifamily facilities are traditionally underserved by utility programs because they are often complicated and expensive to implement. However, based on the Project Team’s research, several Texas MOU territories include significant potential for savings in the multifamily sector. Our analysis of these programs looked at total participants, cost/kWh saved and cost/participant to determine their overall ability to in achieve cost‐effective energy savings. Because a purely quantitative screening within these categories can be difficult, the Project Team also considered program innovation factors based on the collected program information. Education and Behavior Impact Program A Best Practices Guide for Energy Efficiency in Municipally‐Owned Services Areas 43 | P a g e The programs falling in this category are focused on educating end users on energy‐efficient behaviors and practices. While some education programs may include low‐cost measures (e.g., efficiency kits), education is the primary program feature. The programs in the education and behavior category cannot be screened quantitatively because: Savings are not in consistent units and are measured differently between programs. Many of the programs do not have enough data. There are several different types of programs that fall under the broad definition of education and behavior, with a range of different operating strategies. The variety of programs is too different to be effectively compared. The programs with complete data are divided into subcategories, first based on sector, and then on program type. There are four predominant types of education programs: C&I facility manager training, residential home energy reports (i.e., the OPower model), energy kits that come with either in‐person or written educational materials, and school‐based programs aimed at educating school‐aged children. The programs are compared qualitatively within these subcategories, starting with notes in the database and further reviewing reports to gather more information as needed to identify model programs. New Construction Program New construction programs fall into two categories: energy efficiency codes and standards and traditional new construction programs that offer incentives to the building owner or design team for home/building construction that exceeds the efficiency standards of local energy codes. Very few utilities have the bandwidth to affect efficiency codes and standards, but because municipal utilities in Texas are in a unique position to influence local building codes, the Project Team provided insights on local efforts to enact new building regulations to achieve a higher level of efficiency in new construction, although it did not include this program category in its benchmarking process. For traditional new construction programs, savings/participant and cost/participant were used as the primary screening criteria. Additionally, given the depressed new construction market over the last 2‐3 years, the Project Team looked for any programs that achieved particularly good participation results during this time, as an indicator that they mitigated the economic barrier new construction programs currently face. Innovative Financing Program The programs in this category provide innovative financing to fund energy efficiency improvements. Savings/participant was the primary criteria for the initial screening. However, because utility financing programs are evolving rapidly and a broad range of innovative program designs have recently emerged, the Project Team sought input from its internal financing experts to help identify newer programs and recent innovations that are achieving success, particularly in a municipal utility environment. The Project Team used this expertise to help identify model programs and best practice program attributes that were well suited to Texas MOUs. A Best Practices Guide for Energy Efficiency in Municipally‐Owned Services Areas 44 | P a g e Demand Response Program This type of program is based on reducing peak load, either through behavior change, a load control mechanism, or execution of a load‐cutting measure. The DR programs cover residential, commercial, and industrial sectors. In each market sector, dollars spent/gross kW saved and dollars spent/participant were used to screen programs. The level one screening allowed the Project Team to narrow the list of programs in the database down to 58 programs, distributed across the program categories, that achieved the highest performance results based on metrics defined for each category. 4.3.1 Summary of Best Practice Programs by Program Category The programs that scored highest in the Project Team’s level one screening analysis for each program category are identified in the tables below. These programs, selected from the 400 evaluated in the Project Team’s analysis, achieved the highest results in the mix of performance metrics used to indicate program success in that category. Program summaries are provided in Appendix B. Table 13 through Table 19 list the best practice programs by program category. Table 13. Equipment Rebate Best Practice Programs Target Sector Residential State MI Program Year 2009 Residential MI 2009 Residential ID 2009 Residential Prescriptive Rebates High Efficiency Appliance Rebate Program Residential IA 2010 Residential CA 2006 Residential Standard Offer Program (SOP) Residential TX 2010 Entergy Texas Inc. Residential SOP Residential TX 2009 SCE; PG&E; San Diego Gas & Electric California Statewide Multifamily Energy Efficiency Rebate Program (MEERP) Heating & Cooling Efficiency Program Residential Energy‐efficient Lighting Residential CA 2006 Residential ID 2009 Residential NV 2009 Utility DTE Energy DTE Energy Idaho Power Alliant Energy – Iowa Southern California Edison (SCE); Pacific Gas & Electric (PG&E); San Diego Gas & Electric AEP Texas Central Company Idaho Power Nevada Power Company Program Name Residential and Small Business ENERGY STAR® Products Program Residential Multifamily Program Energy‐efficient Lighting A Best Practices Guide for Energy Efficiency in Municipally‐Owned Services Areas 45 | P a g e PG&E Program Name Upstream Lighting Program Target Sector Residential State CA Seattle City Light $mart Business Program Commercial WA Program Year 2000‐ 2006 2006 Xcel Energy Southwestern Public Service Co CenterPoint Energy Houston Electric, LLC Lighting Efficiency Small Commercial SOP C&I Commercial MN TX 2002‐06 2010 Large Commercial SOP Commercial TX 2010 Alliant Energy – Iowa Idaho Power Custom Rebates Easy Upgrades Commercial Commercial IA ID 2010 2009 Efficiency New Brunswick Bright Ideas Commercial Lighting C&I NB Canada 2007 Utility Table 14. Appliance Recycling Best Practice Programs Utility Program Name Target Sector State Alliant Energy Residential Direct Load Control Residential IA Program Year 2010 Nevada Power Company Air Conditioning Load Management Program (DR Program) Residential NV 2009 Idaho Power Oncor Electric Delivery Company FlexPeak Management Commercial Load Management SOP C&I Commercial ID TX 2009 2010 Table 15. Audit and Direct Installation Best Practice Programs Utility Program Name Target Sector State Program Year NYSERDA Residential Audit and Weatherization Program Residential MN 2009 National Grid Retired Engineers Technical Assistance Program (TAP) C&I AK 2004‐2008 Focus on Energy Home$ense Program Residential NY 1992‐2005 Idaho Power Assisted Multifamily Building Program (AMP) Residential VT 2000‐2005 AE Multifamily Low Income Program Residential CT 1997‐2002 Alliant Energy Energy Opportunities Program C&I NY 2007 Xcel Energy Flexible TAP C&I MA 2004‐2007 NYSERDA Whole Building Assessment/ Benchmarking C&I WI 2006 A Best Practices Guide for Energy Efficiency in Municipally‐Owned Services Areas 46 | P a g e Utility Program Name Target Sector State Program Year National Grid Apartment and Condominium Efficiency Services Residential ID 2008‐2009 Focus on Energy Weatherization Assistance for Qualified Customers Residential TX 2009 Idaho Power Free Weatherization Residential IA 2010 AE Home Energy Audit & Insulation Residential MN 2010 CenterPoint Energy Retro‐Commission (RCx) Program Commercial TX 2010 Alliant Energy Energy Lighting Efficiency Program Commercial MN 2003 Table 16. Education and Behavior Best Practice Programs Utility Program Name Target Sector Residential State ID Program Year 2009 Idaho Power Residential Energy Efficiency Education Initiative AE Residential Online Energy Analysis Residential TX 2010 Northwest Energy Efficiency Alliance Energy Star Homes Residential WA 2009 City of Ames Electric Power Watch Services Residential IA NA City of Waverly House of Green Residential IA 2006 City of Westerville Electric Division EnergySmart Westerville Residential OH NA Table 17. New Construction Best Practice Programs Utility Program Name Target Sector Residential State Colorado Governor's Energy Office Colorado ENERGY STAR® New Homes Program We Energies Energy Incentives from We Energies C&I New Construction Program Commercial WI 2008 San Diego Gas & Electric Company Sustainable Communities Program Commercial CA 2004‐2008 National Grid Advanced Buildings Program Commercial RI 2007 Long Island Power Authority (LIPA) Commercial New Construction Program Commercial NY 2006‐2007 A Best Practices Guide for Energy Efficiency in Municipally‐Owned Services Areas CO Program Year 2009 47 | P a g e Utility Program Name Target Sector State Program Year Alliant Energy – Iowa New Home Construction Residential IA 2010 CenterPoint Energy Houston Electric, LLC ENERGY STAR® Market Transformation Program (MTP) Residential TX 2010 Table 18. Innovative Financing Best Practice Programs Utility Program Name Target Sector State Program Year Alliant Energy Performance Contracting Commercial/ Industrial IA 2001‐2011 AE Home Performance with ENERGY STAR® (HPwES) Loans Help My House Pilot Program How$mart Residential TX 2010‐2011 Residential SC 2006‐2007 Residential/Small KS Commercial 2007‐2011 Electric Cooperatives of South Carolina (ECSC) Midwest Energy Manitoba Hydro Power Smart Residential Loan Residential Canada 2001‐2011 Table 19. Demand Response Best Practice Programs Utility Alliant Energy – Iowa Residential Direct Load Control Residential IA Program Year 2010 Nevada Power Company Air Conditioning Load Management Program Residential NV 2009 Idaho Power FlexPeak Management ID 2009 Oncor Electric Delivery Company, LLC Commercial Load Management SOP Commercial/ Industrial Commercial TX 2010 4.4 Program Name Target Sector State Level Two Analysis – Program Process Review In the level two analyses, the Project Team conducted a qualitative review to gain insights into how the identified best practice programs achieved exceptional results. The Project Team assessed each program in detail and analyzed individual program attributes to identify best practice characteristics that differentiated the successful programs. This review entailed two evaluations of program best practices: Cross‐cutting program best practices. These program features ensure effective program delivery and management, a high level of quality and customer satisfaction, and the achievement of strong participation and cost‐effective energy savings results. A Best Practices Guide for Energy Efficiency in Municipally‐Owned Services Areas 48 | P a g e 4.4.1 Implementation level best practices by program category. Best practices program attributes relevant to specific energy efficiency program categories. Cross‐cutting Program Best Practices The Project Team looked at each identified best practice program, as well as our accumulated literature review findings to assess best practice program features that are common across all program categories. These cross‐cutting program best practices ensure effective program delivery and management, a high level of quality and customer satisfaction, and the achievement of strong participation and cost‐effective energy savings results. Through this process, the Project Team identified cross‐cutting program best practices in four categories: (1) program design, (2) program management, (3) program implementation, and (4) evaluation. The Project Team leveraged best practices research sponsored by the California Best Practices Advisory Committee, a consortium of energy industry professionals, to help identify high‐level best practices that cut across the vast array of utility energy efficiency program types. Under each best practice category, the Project Team identified key best practices that utilities should incorporate into their program delivery strategies to ensure high quality and high‐ performing programs. The Project Team reviewed the identified best practice programs against the high level attributes defined by the California Best Practices Advisory Committee and against its research on market conditions among the Texas MOUs to determine which best practices would be most useful to the MOUs to address their identified internal delivery constraints, participation barriers, and programmatic priorities. Table 20 through Table 23 show the identified cross‐cutting best practices in each category. Program Design Program design is critical to initiating a successful energy efficiency program. Good program design begins with clear program objectives and thorough understanding of market conditions. In other words, the design should translate energy efficiency program objectives into activities that appeal to customers and will work in the market. The design should articulate individual program components that will result in meeting the defined objectives. Program design elements should account for potential market barriers, include strategies to overcome them, articulate the steps involved in delivery, delineate management responsibilities and structures, and include details on individual measure savings, participation, and cost‐effectiveness. Table 20. Best Practices in Program Design Best Practice Develop a well‐designed and complete program plan Link strategic approach and targets to policy objectives and constraints Rationale Consider all market actors in the program design, including the program administrator, trade allies, and the customers. Predetermine the program elements that may deter customer participation. Program strategic approach and target should be linked to policy objectives and constraints to help ensure the strategic and tactical approaches will lead to the desired results. A Best Practices Guide for Energy Efficiency in Municipally‐Owned Services Areas 49 | P a g e Best Practice Rationale Apply a well‐articulated theory or Having defined program theory and logic can help define program logic program goals, identify any gaps in program focus or effort, and bolster the justification for the program to decision makers. They can also provide a valuable resource to program administrator and trade allies in terms of clarifying and validating the program objectives and protocols. Apply the stated theory to the Articulating a program theory and basing program tactics on program tactics the program theory assures that programs are fundable, feasible, and capable of being evaluated. Leverage national programs to Work with national efforts (e.g., CEE Tied products and EPA increase the availability of ENERGY STAR®) to increase the availability of energy‐ energy‐efficient products and efficient equipment and leverage a common brand for expand marketing reach customers and trade allies to associate with high‐value energy savings. Research the market and Exhaustive market research can inform the program design understand the local market to align program goals with the interest of market players. condition The program should recognize and apply lessons learned from programs offered by other utilities and in other areas. Always pre‐test the market Using a pilot model to offer the program at a small scale is a cost‐effective method to determine whether any program components need to be revised. Develop verification processes The verification process should be considered at the design during the design phase phase to avoid inconsistencies and last‐minute changes. Involve stakeholders, including Including multiple stakeholders will bolster the plan’s those who could benefit from the credibility, produce programs that reflect local market program, trade allies, and conditions, and improve deliverability from the perspective regulators / policy makers. of a range of sometimes divergent viewpoints. A well thought‐out plan will contribute to smooth program implementation. Get stakeholder buy‐in through communication and collaboration. Ensure both societal and non‐ People often neglect the non‐energy benefits when energy benefits are included in evaluating cost‐effectiveness. To gain support for programs, cost‐effectiveness calculations include societal and non‐energy benefits in cost‐ effectiveness calculations. These benefits and the related program goals should be clearly stated in program plans. Incorporate customers’ and trade Engage customers and stakeholders in the program design allies’ feedback into the program process to provide input and feedback on program design structures and strategies. Program Management Program management can be further divided into sub‐components of project management, reporting and tracking, and quality control. Project Management. The success of an energy efficiency program depends not only on how well the program is designed but also on how efficiently and effectively the program is managed. A well‐managed program has clearly defined responsibilities and A Best Practices Guide for Energy Efficiency in Municipally‐Owned Services Areas 50 | P a g e expectations for the program management team, contractors, and trade allies, as well as customers. Project Reporting and Tracking. To measure the success and effectiveness of energy efficiency programs, the sponsoring utility needs to carefully track participant and site information, equipment replaced and installed, contractor/vendor/installer information, and other data. These data are used to measure the program against goals and report to utility management and municipal oversight committees. A user‐friendly electronic tracking and reporting system is invaluable to facilitate measurement and reporting. Quality Control. Each program should have a customized quality assurance and quality control approach based on best practices for that type of program. Quality control often includes some mix of data reviews; a random sample of site visits to ensure the integrity of measures and trade ally installations; other evaluations to assess the quality of program delivery, accuracy, and comprehensiveness of the collected project data; and process evaluations to assess customer satisfaction, market impacts, and the utility’s reputation. A good quality control approach can also help recruit participants, while reducing free riders and outliers. Table 21. Best Practices in Program Management Best Practice Regularly check program progress to ensure the program is on the right track Utilize electronic work flow management and web‐based communications Work with cities and community‐ based organizations to promote energy efficiency Rationale By monitoring the program continuously the utility can make adjustments to address needs as they arise. Publishing program information and applications on the web can increase efficiency, reduce administrative costs, and facilitate electronic tracking of program documents. Partnerships can offer marketing leverage, credibility, and economies of scale, and can be used to promote programs, create education opportunities, demonstrate products, and sign customers up for programs. Maintain flexibility to respond to Markets can change rapidly. Energy efficiency programs changing market conditions need to be flexible enough to respond to market needs. Foster good relationships with Trade ally promotion is more effective than mass marketing trade allies. Promote energy at generating project leads. Utilities that foster good efficiency in trade ally association relationships with trade ally communities have the most trainings, annual meetings, etc. success in terms of program participation. Maintain program stability and A stable and consistent program offering will allow consistency; especially in customers to plan for efficiency investments and give trade nonresidential programs allies assurances that the program will be available over the long term. Ensure program data accuracy Program results can be easily distorted by inconsistent, through rigorous quality control inaccurate, or incomplete data. To ensure the credibility of program results, verify data integrity through a rigorous quality control process. A Best Practices Guide for Energy Efficiency in Municipally‐Owned Services Areas 51 | P a g e Best Practice Maintain regular, open communications with related program staff, contractors, and trade allies Rationale Ongoing, consistent communications between and among all staff supporting a program helps to maintain consistency, allow for adequate planning, address unexpected events efficiently, and reduce the risk of problems due to lack of coordination. Verify quality on all customer‐ Program delivery contractors and trade allies should be facing program support staff required to undergo checks on both skills/competency and personal integrity before interacting with customers to avoid shoddy workmanship or poor customer satisfaction results. Offer ongoing technical training To ensure measure installers are up to date on current to contractors and trade allies installation protocols, provide technical training, at no cost, for participating contractors and trade allies Use competitive procurement for For programs that use outside support staff for measure all third‐party program support installation, administrative processing, turnkey delivery, or other functions, use a competitive procurement process to ensure the best quality contractor at the lowest cost as well as to avoid conflicts with regulators, customers, and other trade allies and contractors. Develop program manuals to Program manuals ensure all participants fully understand define program rules, their roles and expectations and clearly articulate program procedures, and responsibilities rules and processes. Program Implementation Program implementation is further disaggregated into market outreach; participation process; and installation, measurement, and verification. Market Outreach. Effective program marketing is one of the key elements of best practices. Each program should have a semi‐customized marketing plan that clearly articulates marketing channels, tactics, messaging, and target audience and also incorporates a diverse range of outreach strategies to increase the program’s reach. Participation Process. Using a standardized, simple, straightforward, and user‐friendly program participation process is an important best practice to encourage participation. Providing customer technical and/or program assistance can also contribute to an effective participation process. Installation, Measurement, and Verification. The installation process should be guided by sound program design and quality control protocols. Measurement and verification (M&V) are also important features of an effective program process. M&V protocols should be custom‐designed for the specific program features and integrated with the installation and quality assurance process to ensure accurate savings and incentive payment (if any). A Best Practices Guide for Energy Efficiency in Municipally‐Owned Services Areas 52 | P a g e Table 22. Best Practices in Program Implementation Best Practice Make the program participation process easy Rationale A streamlined program participation process will help reduce unnecessary work for the program administrator and increase customer satisfaction. Offering rebates for less common measures can increase energy savings for the program overall. Provide a range of measures and services, including those less likely to be installed. Use a whole‐building approach to Approaching the building as a system may achieve greater achieve maximum energy savings depth of energy savings but can dramatically increase the program’s resource requirements. If this approach is adopted, additional time and budget may be required to integrate building systems, model interactions, and install measures. Tie incentives to building Custom incentives provide more flexibility than prescriptive performance incentives and can result in significant energy savings when applied to large C&I facilities with complex building systems and process measures. Promote a life cycle cost/benefit Quantify the program benefits using return on investment perspective to encourage (ROI), health, and productivity. A clear presentation of this participation. information can be persuasive. Allow customers to submit Complicated application processes are a barrier to some program applications online or at programs. Offering assistance at events or providing simple outreach events online forms makes the application process simple. Promote messages that equate Marketing messages should increase customer awareness efficiency upgrades with home of the value of investments in residential energy efficiency improvement and prompt them to act. Messages that appeal to homeowner’s desire to improve property value and comfort are effective. Make program participation part Promote energy efficiency as part of a home improvement of a routine transaction routine, such as purchasing energy‐efficient light bulbs or annual winterizing. Use the program brand to Brands help capture the market value of energy efficiency differentiate energy‐efficient and serve as a recognition mechanism for homeowners homes from conventional homes. interested in the status efficiency gives their homes. Cooperate with contractors to get One‐on‐one and word of mouth promotion is the most the message out effective marketing and outreach strategy; and contractors, equipment dealers, and installers acting as program partners can serve as highly effective program ambassadors. Use door‐to‐door marketing by a Face‐to‐face marketing is an extremely effective marketing turnkey vendor to achieve a high strategy and using a vendor that provides turnkey services penetration rate can simplify program delivery. Understand customer needs. Sell The program proponents must understand the customer's customer benefits first, then needs first and then articulate the program benefits in a energy efficiency language the customer understands and finds compelling. A Best Practices Guide for Energy Efficiency in Municipally‐Owned Services Areas 53 | P a g e Best Practice Showcase properties that have completed program upgrades Rationale Identifying and promoting properties with completed program upgrades can not only provide recognition to past participants (which in turn can compel them to “tell a friend”) it also helps potential customers understand and “visualize” the benefits of energy efficiency upgrades. Stimulate behavior change Provide customers with the tools to stimulate key behavior changes, such as free CFLs or discounted programmable thermostats. This creates longer‐term savings opportunities. Use multilingual marketing Multilingual marketing materials will help the utility reach a materials broader range of potential participants. Provides customers with options Allowing customers to choose between incentives or for incentives or low interest financing, or better, offering both incentives and financing, financing gives them greater control over their choices and can significantly offset the first cost barrier. Support retailer involvement in Provide retailers with point‐of‐purchase (POP) marketing promoting appliance rebates materials, in store applications, training, and other tools to encourage and support store staff promoting the program. Offer instant rebates at the time Instant rebates make customer participation easier than of purchases traditional mail‐in‐rebates. Co‐market programs Customers making one efficiency upgrade are often likely to do even more. Use customer interactions in programs as opportunities to promote other energy efficiency or DR opportunities. Provide program marketing New residents are potential program participants. Provide materials to each customer on an energy efficiency materials to every customer on a regular annual basis basis. This will help keep program opportunities at “top of mind” so that customers will recall the program when they are most in need of the efficiency product or service the program offers. Offer zero‐percent or low‐cost Zero‐percent or low‐cost financing, with convenient terms financing to offset high capital and short repayment periods, can improve customer cost of energy‐efficient acceptance rates by overcoming the high capital cost of equipment energy efficient equipment. Offer OBF to overcome the split OBF allows customers to pay for measures over time using incentive barrier the utility bill as the vehicle for repaying the loan. The payments are transferred to new tenants when the property changes hands. Program Evaluation Program evaluations typically fall into two categories: process and impact evaluations. Process evaluations typically use surveys, interviews, focus groups, and/or site visits to assess the program’s performance from a process standpoint. Impact evaluations rely on quantitative data collection to assess to what degree the program has met its savings, participation and other A Best Practices Guide for Energy Efficiency in Municipally‐Owned Services Areas 54 | P a g e quantifiable goals. Impact evaluations typically use measured data, engineering reviews, and/or mathematic models to calculate savings. Table 23. Best Practices in Program Evaluation Best Practice Regularly check program progress to ensure it is on the right track Develop inspection and verification processes during the design phase Evaluate the program data annually and address the high priority issues. Perform market assessments and impact evaluation regularly though not necessarily annually Estimate free ridership and spillover Evaluation metrics should correspond to program goals Choose an experienced evaluator with an understanding of the market context in which a program operates Incorporate evaluation recommendations into the program Use PUCT‐approved baseline documents to determine appropriate energy impact and incremental cost benchmarks Conduct customer satisfaction surveys to get feedback from customers. Show survey results to the public. Develop a baseline document that provides guidelines for benchmarking energy impacts and incremental cost calculations Rationale Monitor the program continuously and adjust it if any needs come up. The verification process should be considered at the design phase to avoid inconsistencies and last‐minute process changes. Routine verification and tracking of related data is important to ensure accurate calculation of energy savings associated with each measure as well as customer satisfaction. Review the program tracking database annually to ensure the database calculates program impacts accurately. To address market changes, evaluate, and track long term market effects. Market impact evaluations should occur concurrently with program changes. Evaluations that include net‐to‐gross and spillover modules can help utilities confirm savings results and understand the sources of program delivery issues. Efforts to reduce free ridership will ensure the program generates savings for the utility without paying for unnecessary measures. The evaluation should assess the program progress against the predetermined goals, so evaluation metrics should be designed accordingly. The program evaluator needs to fully understand the program dynamics. Clear communication between implementation staff and the evaluator is very important. To the extent possible, all evaluation recommendations and lessons learned should be used to improve the program performance. Use PUCT baseline to ensure the measure saving calculation is correct and easy to follow. Customer surveys can provide valuable suggestions to improve program processes. Sharing survey results can help spread the program’s message and convince more people of the benefits of the program. Establishing appropriate baselines for calculating energy saving will help ensure the accuracy of energy savings calculations. A baseline document can also help program staff determine project impacts with greater certainty. A Best Practices Guide for Energy Efficiency in Municipally‐Owned Services Areas 55 | P a g e 4.4.1.1 Level Two Benchmarking Metrics To facilitate the Program Team’s review of the 58 identified best practice programs, the Project Team sought to answer several researchable questions pertinent to meeting the qualitative criteria above. These factors also helped the Project Team cross‐reference best practice attributes with Texas market conditions and identify those attributes that are transferable to Texas MOUs’ Long‐Term Energy Efficiency Plan. The Project Team used the benchmarking metrics and researchable questions listed in Table 24 below to assess each program’s success in achieving the qualitative criteria. Table 24. Level Two Analysis Benchmarking Metrics Benchmarking Metrics Market impact Customer service and satisfaction Operations and delivery Innovation Transferability and scalability Overcoming barriers 4.4.2 Researchable Questions How has the program impacted the market? Has the program achieved an unusually high level of participation or market penetration? Has the program instigated an increase in skilled technicians in the region to facilitate delivery? Qualitative measure of customer satisfaction and program delivery success. What key implementation factors contribute to program success? Are the program’s operational requirements consistent with the MOUs’ capacity to deliver them? Is there something unique about the program that differentiates it and perhaps makes it more successful or effective than other similar programs? Can the program be replicated for a municipal utility? Does the program overcome market barriers in certain customer sectors or segments to achieve good penetration where other programs have failed? Does the program overcome barriers common among Texas MOUs? Implementation‐Level Best Practices by Program Category In addition to identifying cross‐cutting operational and management best practices, the Project Team sought to drill down to implementation‐level best practices appropriate for specific program types that would be appropriate given MOUs’ market and operating characteristics and that would help drive strong program results. Specifically, the Project Team wanted to identify best practice attributes that would: Support high quality programs at a lower average delivery cost by leveraging external resources and economies of scale where available Be relatively simple to implement and limit utility staff resource requirements Be relatively simple to participate in and help overcome customer barriers Generate strong participation and savings results Continue and enhance MOUs’ strong local relationships and records of customer service A Best Practices Guide for Energy Efficiency in Municipally‐Owned Services Areas 56 | P a g e Educate customers so that energy efficiency becomes a key factor in their purchasing decisions To identify implementation‐level best practices for specific program types, the Project Team conducted general research on each of the seven identified program categories to determine best practice program attributes considered to be key to program success. The Project Team’s research into the programs that scored highest in the level 1 screening helped inform this research, as did the Project Team’s extensive experience designing, supporting, and evaluating utility energy efficiency programs around the country. Each summary below highlights the important features and practices that the Project Team identified for each program category. 4.4.2.1 Equipment Rebate Programs Equipment rebate programs provide incentives to customers who purchase and install qualified energy‐efficient equipment. The Project Team evaluated equipment rebate programs that use four primary incentive structures: prescriptive rebates, custom incentives, upstream buy‐downs, and dealer spiffs. Prescriptive Rebates Prescriptive rebates have been mainstays of utility energy efficiency program offerings for decades and continue to generate high energy savings at the lowest administrative and delivery costs for many utilities. One of the primary reasons prescriptive programs are so popular is that they are straightforward to deliver and simple to participate in. The rebate/incentive is typically structured as a fixed amount for pre‐approved measures or services. Custom Incentives Custom incentive programs are often incorporated into utility DSM portfolios, specifically targeting large C&I customers. Custom programs use a performance‐based incentive structure that provides customers with a calculated rebate amount based on either their total investment or on their kWh savings for installing single measures or for installing larger, more comprehensive projects. Because custom projects are often large, complicated, and entail significant documentation requirements, best practice custom programs typically provide some level of technical support integrated with the installation incentive to help customers pay for the cost of facility audits or project engineering. Upstream Buy‐down Upstream buy‐down programs provide the utility incentive directly to the manufacturer so that customers purchasing the measure receive the incentive at the time of purchase and no further action is required on their part. Upstream programs have become an extremely popular and effective mechanism for delivering residential lighting programs. Upstream lighting programs achieve energy savings at a very low cost and can provide a substantial proportion of a utility’s energy savings requirements. One disadvantage to upstream programs is that customers often do not realize the measure has been discounted nor do they generally associate a discount with the utility. However, this disadvantage is outweighed by the enormous savings potential and low cost provided by this delivery mechanism. A Best Practices Guide for Energy Efficiency in Municipally‐Owned Services Areas 57 | P a g e Dealer Spiffs Dealer spiffs are incentives to a manufacturer or vendor. Best practice programs in the equipment rebate category recognize that external vendors, installers, dealers, or other trade allies represent a utility’s most valuable and most effective program marketing tool. Dealer spiffs are offered as a way to encourage trade allies to promote the utility program to their customers and are sometimes offered in conjunction with a customer rebate. For example, when an HVAC contractor up‐sells his customer to a higher efficiency new central air conditioning system, the utility provides a small incentive to the contractor in addition to the customer’s larger prescriptive rebate. This model works well in areas where utility DSM programs are new and trade allies may not understand the benefits of selling higher efficiency equipment. Regardless of the incentive structure, equipment rebate programs benefit from incorporating some of the following best practices. Maintain program design flexibility and make changes in the program design to accommodate market trends, unanticipated bottlenecks or barriers, customer barriers or other factors as they come up. The program offers benefits to, and fosters good relationships with, the trade allies such as equipment dealers, installers, and contractors, and regards them as significant partners. Benefits may include technical or program training, co‐branding or other marketing support, ongoing technical support and incentives. Program marketing and outreach includes: Collateral such as program brochures, flyers, and FAQs Community partnerships and outreach to customers, trade allies, new home builders, advocacy groups, local government agencies, and nonprofit organizations. A program website that details customer and measure eligibility, incentives, participation procedures, and application forms. Community‐based and social marketing such as attending community events, hosting community workshops or meetings, sponsoring local activities, and engaging in online social marketing through social media such as Facebook, Twitter, and LinkedIn. Participation in industry‐related meeting and events, workshops, and other technology or trade ally‐focused activities. Key account managers and business consultants are given targets and incentives to actively promote the program to mid‐sized and large C&I accounts. Program applications capture all data necessary to evaluate energy savings performance in a simple, easy‐to‐use format. A Best Practices Guide for Energy Efficiency in Municipally‐Owned Services Areas 58 | P a g e Provide customers with several application mechanisms such as mail‐in rebates, online rebate applications and submittals, or instant rebates that are immediately credited to customers at the time of purchase. Set incentives at levels appropriate to encourage high participation among the target population, achieve penetration in HTR markets, and maintain cost‐effectiveness. Provide technical assistance to customers and trade allies to support compliance with program protocols; accurate reporting; and thorough, high‐quality energy audits and technical studies that capture deep energy savings opportunities. Perform installation inspections to ensure quality of work is maintained throughout the program. Conduct process evaluations to uncover barriers, bottlenecks, and potential program enhancements. Evaluate program cost‐effectiveness periodically to ensure program goals are met. 4.4.2.2 Appliance Recycling Appliance recycling programs are designed to help residential customers reduce their energy consumption by removing an existing, inefficient appliance when they purchase a new one or choose to eliminate a second unit, and disposing of the unit in an environmentally responsible manner. Best practice appliance recycling programs provide multiple benefits to customers, typically including: Free pickup and hauling of unwanted appliances Financial incentives for the removal of appliances Safe disposal of all potentially harmful materials in appliances Energy savings Appliance recycling programs primarily target refrigerators; however, many programs also offer recycling services for stand‐alone freezers and room A/Cs. Because recycling appliances requires considerable infrastructure needs and specific expertise associated with safe handling and disposal of potentially toxic materials, as well as staff dedicated to pick up and hauling, utilities by‐and‐large use third‐party implementation contractors to deliver their programs. There are two major appliance recycling contractors serving U.S. utilities: JACO Environmental (http://jacoinc.net/) and ARCA Incorporated (http://www.arcainc.com/). Both companies use similar delivery and operating strategies but are able to customize individual programs based on the utility’s specific needs. Best practices for appliance recycling programs include: Marketing through bill inserts and mass media advertising. Creating retail partnerships to promote recycling at the time customers are purchasing a new appliance. Many utilities leverage these partnerships to provide in‐store POP materials and program information, train store employees, and allow customers to schedule their appliance recycling pick‐up at the time the new unit is delivered. A Best Practices Guide for Energy Efficiency in Municipally‐Owned Services Areas 59 | P a g e Co‐promote the appliance recycling program message with other utility, state, or federal incentive programs targeting high‐efficiency new appliances, other energy efficiency measures, and DR. Cross‐promote the recycling program to customers who have received a rebate on a new appliance. Offer online appointment scheduling, pick‐up on Saturday, and strive to pick up units within one week of scheduling the appointment. Conduct random inspections of recycling services contractors to ensure program compliance. Active involvement from the program administrator and ongoing communication with the implementation contractor. Conduct customer surveys to ensure that units were picked up as reported by the program implementer, incentive was received, and pick‐up personnel were professional and courteous. Surveys also help to ascertain customer satisfaction. 4.4.2.3 Audit and Direct Installation Audit programs vary in their scope and application, but in general the objective of an audit is to evaluate energy consumption to determine ways in which energy can be conserved. Utility‐ sponsored energy audit programs can target both residential and commercial sector customers. Some programs aim to merely educate and inform customers. Others are more comprehensive in scope, designed to not only inform but to help customers implement the recommended energy efficiency measures. In many cases, utility‐sponsored energy audit programs include a direct installation mechanism, whereby the auditor installs measures in the home or business at the time of the audit. This approach generates instant energy savings and can help foster good will with the customer. Residential program measures may include but are not limited to lighting, HVAC, appliances, low‐flow shower heads and aerators, and building shell measures. Business measures may add refrigeration, motors, compressed air, and technical assistance services that may include, but are not limited to, training, energy modeling, and design. It is important to remember that an audit in and of itself does not generate energy savings. It merely serves to educate and inform, paving the way for a more tactical approach to improving the energy efficiency of a home or business. Successful audit programs however, find a way to move the customer from awareness to action. Best practice programs include tactics that result in actual measure installation: replacing, retrofitting, and/or improving existing equipment and controls. Program sponsors use a variety of approaches to achieve this goal, including: Direct installation Generating instantaneous results that include calculated energy consumption metrics and customized efficiency recommendations with calculated energy savings and ROI information Capturing customer’s written commitment to proceed with recommended measure installation, through a work order or bid documents Coupling audits with rebates and incentives to reduce cost barriers A Best Practices Guide for Energy Efficiency in Municipally‐Owned Services Areas 60 | P a g e Conducting follow up after the audit to enquire when customers intend to make recommended improvements and to support a continuous improvement process, through surveys, email, telephone, or through the contractor Providing information about energy efficiency and conservation in general, to encourage customer’s ongoing attention to energy‐efficient behaviors and decision making It should be noted that the audit and direct installation program category also includes low‐ income weatherization, which, while technically entailing residential energy efficiency assessments and comprehensive direct installation mechanisms, are not subject to the same barriers and delivery constraints as a traditional audit program, since they are typically 1) comprehensive, whole home solutions; 2) entail no out–of‐pocket costs for qualifying customers to install recommended measures; and 3) are typically implemented through a central, statewide entity adept at reaching customers and leveraging energy savings to their full extent. The programs identified through the Project Team’s research are all successful audit/direct install programs from across the country that employ various approaches to derive energy savings. The programs utilize many of the same best practices and were chosen to help inform MOUs looking to develop new audit/direct install programs in Texas. The best practice characteristics from these programs should be considered when developing or looking to improve existing audit programs. The best practice characteristics include: Program theory and design is well documented and amenable to replication. The cost to implement the program is beneficial in comparison to the actual energy savings (kWh/therms) generated by the program. Program demonstrated the ability to deliver immediate and long‐term energy savings as well as health and safety benefits. Program delivers high quality of services to their customers and quality control/verification plays an important role in program success. Each of the identified programs are well thought out and managed. and practice consistent, accurate reporting and tracking. In addition, regular program evaluations inform program managers on how they may improve the program and recommendations are incorporated into program design. These characteristics have helped each of the programs below provide consistent, measurable, environmental and human health benefits and should serve as good examples for Texas MOUs. 4.4.2.4 Education and Behavior There are many different types of programs and initiatives used to educate consumers on energy‐efficient behaviors and practices. Educational programs differ in cost, administration, and implementation, but all have similar goals. Program types range from community demonstration projects, home energy reports, energy kits, events, online tools, technical and facilities training, and outreach programs (school‐based or workplace). All are meant to help change individual’ patterns of energy use and encourage ongoing, consistent energy‐efficient behaviors (e.g., turning off lights when leaving a room, adjusting the thermostat, etc.) and consideration of energy efficiency options in purchasing decisions and lifestyle choices to create a lasting effect. A Best Practices Guide for Energy Efficiency in Municipally‐Owned Services Areas 61 | P a g e The Project Team reviewed six educational programs including mass media/broad‐based campaigns, online analysis tools, online energy management, proven EPA‐backed programs, community engagement, and school‐based programs. All of these programs worked well in markets where they were deployed. One of the most important things a utility implementing new education and behavior programs can do is conduct thorough due diligence. Utility staff should carefully consider their target market to identify the barriers necessary to overcome. Set objectives and metrics for success in the beginning and check them throughout the implementation phase. Understand the target audience and develop appropriate messages to help meet the program’s goals. Strategies for reaching audiences vary, but messaging and targeting play major roles. Best practices for education and behavior programs include: Messaging Use positive, fact‐based, credible communications to overcome perception barriers about energy efficiency. Ensure the educational messages are audience‐specific and include a call‐to‐action. Help consumers understand that energy savings equals money saved. Use messaging that addresses barriers while raising awareness of the program’s attributes and benefits. Speak to customers on their own terms using regional mindsets and terminology. Targeting Conduct consumer surveys to identify key attitudes, barriers, and preferences among the target population. Leverage available market intelligence to identify audiences most likely to act, and design marketing strategies based on their needs, preferences, attitudes, and behaviors. Engage early adopters/prospects and move on to less‐disposed audiences, using each captured group as a platform for normative messaging to engage next group. Maintain focus on the end goal. Build momentum to create a bandwagon effect. A phased approach sometimes works best. Tactics Use normative messaging that conveys energy efficiency as a social norm (e.g., “all of your neighbors have participated in the energy challenge, why haven’t you?”) to encourage customers to participate in a program or adopt the desired energy efficiency practice or behavior. Encourage customers to commit or pledge to take action. Pledges have been shown to be a powerful social driver; research shows that once a person makes a commitment, especially publicly, he or she is much more likely to follow through than if he had not made a formal agreement. A Best Practices Guide for Energy Efficiency in Municipally‐Owned Services Areas 62 | P a g e Offer recognition for participants’ contribution. Recognizing residents who demonstrate the desired behavior (i.e., participating in the program) can be a key motivating factor in getting those customers to share their experience with others, which reinforces normative messaging and creates a powerful word‐of‐mouth continuum. Educational programs continue to evolve rapidly as technology and markets transform. For instance, many utilities have begun implementing smart grid technology, but consumers don’t understand what it is or how it works, and so far, have very little interest in it. Smart grid technologies, unlike other products, like cell phones, iPods, and global positioning system (GPS) units do not have mass appeal. To capitalize on smart grid’s full potential, consumers must be informed about its uses, and convinced that using it will offer benefits that outweigh the cost of participating. Educators and marketers need to be careful to select educational campaigns that both promote widespread technology awareness and understanding, but also convey the benefits of its use. 4.4.2.5 New Construction The best practices in new construction programs have proven to be effective in creating a more energy‐efficient new building stock, showcasing new technologies, and supporting the adoption of more energy‐efficient building practices throughout a region. The key elements of the best practice programs are training, technical assistance, and financial incentives, regardless of whether the program is commercial or residential. In addition, many of the programs are built on a national model, allowing program sponsors to leverage the national program’s economies of scale and expertise, and apply their own limited resources more effectively. Among the programs identified as best practice examples in the Project Team’s research, incentives are the most prominent component. The incentives offered were based on three different models: 1) prescriptive, 2) performance based, and 3) capital cost offset. Prescriptive incentives offer predetermined incentives for the installation of prequalified equipment or design strategies. Performance‐based incentives are typically determined based on the project’s projected energy savings, a Home Energy Rating System (HERS) rating in residential projects, or the estimated savings resulting from a specific higher efficiency measure installed. Capital cost offset incentives are designed to encourage projects to implement more aggressive energy‐efficient strategies by providing financial support to offset higher initial capital costs. In addition, most of the programs included a tiered incentive structure. A tiered structure provides programs with two advantages. It can effectively support wide scale adoption of nonstandard, higher efficiency, and more expensive strategies. In addition, it builds flexibility into the program to allow program designers to easily phase out technologies or efficiency targets as they become standard practice. Training and technical assistance were also key in the best practice programs. Depending on the program goals, some include technical assistance for design teams to create showcase projects that highlight what is possible. Others provide industry training on the construction of high performance buildings to facilitate the adoption of better building practices across the board. A Best Practices Guide for Energy Efficiency in Municipally‐Owned Services Areas 63 | P a g e Many of the programs leveraged existing national programs (ENERGY STAR®, Advanced BuildingTM Guidelines, and LEED®). Because these programs have already developed sound concepts, technical rigor, and administration processes, program administrators can focus their resources on other aspects of the program. In addition, the association with a recognized national program can lend credibility to homebuilders and homeowners as well as immediate market recognition. Some of the practices in national programs can be easily implemented as a stand‐alone program, such as an ENERGY STAR® Home program. Some utilities, however, use national programs as one element of a suite of offerings, as Arizona Public Service’s (APS’s) ENERGY STAR® + Solar Homes ‐ Builder Incentives program does, building on the utility’s existing ENERGY STAR® Homes Program. In some cases, such as the State of Colorado Governor’s Energy Office’s ENERGY STAR® New Homes Program, a state‐sponsored entity creates economies of scale across regions, to support local and regional initiatives. 4.4.2.6 Innovative Financing The upfront cost of energy upgrades is a major obstacle for many property owners who might otherwise make improvements. Financing can offer an attractive solution to this problem. If financing is properly structured, monthly loan payments are smaller than the savings produced by the installed efficiency upgrades, generating positive cash flow for the property owner even before the financing is paid off. Structuring the financing to minimize the payment size is a practice common to all financing programs. It is accomplished via two variables: Low Interest Rates. While a zero percent rate might provide an incentive to action, rates of up to 7 or 8 percent are generally considered acceptable. The interest rate is often determined by a financing program’s cost of capital, so finding a low‐cost source of capital, or a partner willing to subsidize a lower interest rate, can be a major focus of program development. Long Loan Terms. The loan term has a larger impact on the payment size than the interest rate. For small projects and improvements that pay for themselves quickly, terms of 3 to 5 years are common. For larger projects involving deeper retrofits, terms of 10 to 20 years are more desirable. Other best practices of a financing program may include: Broad Eligibility. While homeowners and businesses with excellent credit may be able to secure financing on their own, the recession and widespread loss of property value are preventing many from qualifying for loans. A common utility program goal is to offer financing to average customers who are unable to obtain financing in the current economic environment. Off‐Balance‐Sheet Financing. Many businesses, and even some homeowners, are reluctant to use their limited borrowing capacity for projects that are not critical to their plans. Certain financing programs, such as tariff‐based OBF, can address this concern. Midwest Energy’s How$mart program, identified as a best practice program, is a good example. Solving the “Split Incentive” Problem. In tenant‐occupied properties, where the tenant pays the utility bill, landlords have little incentive to pay for improvements that will only A Best Practices Guide for Energy Efficiency in Municipally‐Owned Services Areas 64 | P a g e result in savings for the tenant. Similarly, tenants are usually reluctant to pay for improvements to a property they do not own. OBF solves this problem by putting both the savings and the monthly loan payment on the same bill. Financing programs continue to evolve rapidly as utilities and other stakeholders try different combinations of target markets, capital sources, loan security, credit enhancement, and more to find the right program model to fit their customers’ needs and internal operating conditions. However, some common themes seem to be emerging: Third‐Party Lending. Many utilities have been uncomfortable with financing programs that put them in the role of lender. Most new financing programs are designed to create and leverage relationships with lenders that are responsible for providing the capital, originating and servicing the loans, etc. AE’s HPwES loan program is a good example of this. OBF. This finance model is gaining momentum as more states, communities, and utilities are recognizing its unique advantages in terms of off‐balance sheet financing and overcoming the split incentive barrier. Performance Contracting. For the commercial sector, performance contracting can offer an inexpensive option to encourage and support energy efficiency improvements. The Alliant Energy program is an example. Financing will remain an evolving opportunity for utilities and communities in the foreseeable future. Smaller utilities and public utilities, like IOUs, are beginning to explore innovative financing program models, and both state and national efforts are beginning to emerge in support of these programs. For instance, federal legislation has been re‐introduced this year that would enable the U.S. Department of Agriculture to loan low‐interest money to rural electric co‐ops that could be used in turn to make low‐interest loans to customers (www.govtrack.us/congress/bill.xpd?bill=s112‐1000). The legislation would expand on existing programs that may already be of interest to rural co‐ops (www.rurdev.usda.gov/RD_Loans.html; www.rurdev.usda.gov/UEP_HomePage.html). A good resource for information and new developments regarding financing programs can be found at the DOE Solution Center (http://www1.eere.energy.gov/wip/solutioncenter/). 4.4.2.7 Demand Response DR programs help to reduce upward pressure on rates for all customers, whether they are participants in the programs or not, by lowering peak demand and minimizing high capacity costs during peak demand periods. The Project Team’s research looked at DR programs in both the residential and commercial sectors. Residential DR programs can be subdivided into two categories: direct load control (DLC) and pricing‐based programs. DLC programs have been in existence for nearly 30 years. Pricing programs are much newer. Interval metering has been a limiting factor to their widespread use; utilities cannot utilize time‐varying rates if they can’t measure energy consumption over specific time periods. With the advent of advance metering infrastructure (AMI) and smart grid, utilities are beginning to gain that ability. With regard to residential DR program best practices, DLC’s longevity in the market and record of successfully curtailing large quantities of residential DR load gives it a leg up in terms market A Best Practices Guide for Energy Efficiency in Municipally‐Owned Services Areas 65 | P a g e acceptance and accumulated learning. However it is important to note that because pricing programs are still relatively new, their history of specific best practices is less robust than that of DLC programs, not because they do not exist, but because the market hasn’t yet had time to fully test the approach. Residential DLC programs generally use DLC technologies to reduce system peak demand by controlling central A/Cs. These programs offer customer incentives in return for their permission to cycle their equipment off for brief increments (typically 15 minutes of every half‐hour) during peak demand periods. Customers rarely notice a difference in the comfort of their homes, applying for the program is simple, and once they agree to participate, DLC programs require little to no effort on the customer’s part. Residential pricing programs vary the per kWh rate that customers pay for electricity. Rates during peak demand periods are higher than those during off peak periods. In time‐of‐use (TOU) programs rates vary during specific hours of the day, but generally do so in the same manner on a daily basis. In dynamic pricing programs, the per‐kWh price will vary not only during the day, but also from day to day as DR events are called. Pricing programs can vary tremendously from utility to utility, and experimental evaluation is generally the most appropriate way to ensure that the correct pricing structure is in place for a specific utility’s customers. A major difference between traditional DLC programs and pricing programs is that DLC programs primarily use control switches installed on central air conditioning systems, while newer pricing programs use smart thermostats. Benefits of using smart thermostats include potential for energy efficiency savings (in addition to demand reduction), greater customer acceptance, an added marketing incentive, increased program flexibility, and improved customer awareness. Many customers feel that smart thermostats allow them to retain control of their own homes. Gaining customer acceptance for DLC switches has been challenging in some programs because customers view them as giving the utility control over their A/Cs. Some customers may find a smart thermostat combined with a pricing program a more attractive alternative. Some drawbacks of smart thermostats include a slightly higher installation cost, increased potential for device trouble shooting, and the challenge of gaining access to a customer’s home. Best practices for residential DR programs include: Provide each new participant with detailed program materials that explain the program, why it is necessary, what the alternatives are (e.g., higher rates, building more power plants, etc.) and offer tips to help consumers manage peak demand voluntarily (e.g., doing laundry at night). Utilities should also use this opportunity to provide materials on energy efficiency program opportunities. Use a combination of marketing methods and utilize multiple messages that appeal to financial, environmental, community, and reliability motivators. Provide customers with an opportunity to choose between DR programs (DLC or AMI), but make sure that the decision‐making process is not too cumbersome. Distribute or support technologies that make participation in DR easy for the customer. Automated control, either through DLC or pricing programs, can ensure that customers continue to participate. A Best Practices Guide for Energy Efficiency in Municipally‐Owned Services Areas 66 | P a g e Encourage customers to utilize DR on multiple appliances to gain additional benefits. Traditional DLC programs can be used to control central A/Cs and electric water heaters. With a smart grid system, the DR opportunities grow to include those and other appliances in the home, such as lighting, clothes washers and dishwashers, electric dryers, refrigerators, and other plug loads. Adopt a regular schedule to test appliance cycling devices in the service territory and replace any that are missing or not functioning. Traditionally this can be a time‐ consuming process as each installation must be field verified. However with a smart grid system the devices can be tested remotely. Offer a large enough participation incentive to gain customers’ interest; continue to provide an incentive each year the customer participates. Conduct customer satisfaction surveys to gather information on program barriers and bottlenecks and solicit feedback from customers. Provide annual feedback to customers describing the system‐wide benefits of the program and thank them for making a difference. Commercial and industrial sector DR programs, often referred to as load curtailment programs, are generally more complicated, customer‐specific, and flexible than residential programs. In the best practice programs that the Project Team identified, incentives were paid to aggregators who work with the utility to identify peak reduction opportunities, and who worked with C&I facilities to help them reduce peak demand during curtailment events. Customers can use a variety of load curtailment strategies such as peak shaving, load shifting, and alternative on‐site generation during peak events. Utilities often provide additional incentives, such as technical support and installation of on‐site energy management system software that allows customers to monitor their electric loads, track and manage their energy consumption and costs, and communicate more easily with the utility. Best practices for nonresidential curtailment include: Provide customers with no‐cost, flexible, and intuitive tools that include a sophisticated optimization engine. These software‐based tools can be utilized for planning and analyzing the peak load impacts of DR resources for both long‐term and short‐term optimization. Provide customers with the flexibility to curtail load in whatever way is most cost‐ effective and feasible for them. When alternative generation is allowed, require that on‐site generation equipment meet all applicable environmental and interconnection standards. Conduct program operation tests prior to the start of the curtailment season to ensure communications, implementation, and tracking systems perform correctly. Strive to notify customers of curtailment events 24 hours in advance and never give less than a 2 hour notice of curtailment events. Use monitoring software to monitor load levels in near real‐time during curtailment events and follow‐up immediately with customers that do not perform as expected. Maintain consistent, open communications with implementers and customers. A Best Practices Guide for Energy Efficiency in Municipally‐Owned Services Areas 67 | P a g e Program implementers or key account managers provide technical support to help customers identify their load reduction potential and advise them on curtailment strategies. Conduct customer satisfaction surveys to identify program barriers and bottlenecks and get feedback from customers. 4.5 Applying Best Practice Programs and Features to Local Conditions After the program performance (level one) and process review (level two) screens, the Project Team was able to identify a set of best practice energy efficiency programs and program attributes that contributed to high quality and high‐performing programs. However, the best practice programs and best practice attributes suitable for one specific utility’s service territory do not necessarily apply to another utility. The study team found that significant variability among utilities in terms of their specific market and operating environments make a “one‐size‐ fits‐all” program design inappropriate. Important differences in utility conditions included: Customer sector breakdown Experience designing, managing, implementing, and evaluating efficiency programs Funding resources Utility infrastructure and delivery capacity Existing market conditions and trends Regulation and policy support of energy efficiency concepts Availability of skilled trade allies or contractors that stock and install qualifying measures Customer awareness of energy efficiency impacts and benefits Community’s reception level to energy efficiency programs Given this variability, an important outcome of this Guide was to tailor the best practices to the market conditions among Texas MOUs, based on their identified internal delivery constraints, participation barriers, and programmatic priorities. 4.5.1.1 Program Attributes Matched to Local Market Variables The Project Team further cross‐referenced specific best practice attributes in terms of their ability to address various market barriers, utility constraints, and decision‐making trends among the participant MOUs. The Project Team’s statistical analysis of MOU interview responses, feedback, and market data allowed us to identify the most prominent operating conditions and market characteristics, efficiency potential, barriers and constraints, and priorities and goals within the MOUs’ territories. Based on our understanding of these local factors, the Project Team identified specific programs best suited to Texas MOUs. Table 25 on the following page displays the results of this cross‐referencing process. Further, the Project Team evaluated specific best practice program attributes that were found to be key factors in program success against the findings from our research on MOUs’ local markets and internal program delivery practices, constraints and goals. The Project Team recommends MOUs carefully consider the identified specific program in the development of their energy efficiency programs. Table 26 displays the recommended program attributes. A Best Practices Guide for Energy Efficiency in Municipally‐Owned Services Areas 68 | P a g e Best Practices Program type Equipment Rebates Lighting Appliance Recycling Audit and Direct Installation Education and Behavior New Construction OBF DR X X X X X X X X X X X X X X X X X X A Best Practices Guide for Energy Efficiency in Municipally‐Owned Services Areas X X X X X X X X X X X X X X X X X X X X X X 69 | P a g e No rate increases Educate community X Reduce peak load Barriers and Constraints High savings‐to‐cost ratio Split incentives High upfront cost of equipment Lack of awareness Efficiency Potential Lack of staff resources Lack of funding resources X Commercial HVAC Kitchen appliances Lighting Building shell Market Characteristics Residential cooling New construction growth X Significant industrial demand X Significant commercial demand Operating Conditions Significant small commercial sector Significant residential sector Limited experience with Energy Efficiency programs Collaborative model X Demand constraints Limited Energy Efficiency staff resources In house delivery & management Market Sector Residential Table 25 . Energy Efficiency Programs Matched to MOU Market Conditions Priorities and Goals X X X Best Practices Program type Equipment Rebates Small Commercial Audit/Direct Install New Construction Custom Incentives X X Significant industrial demand New construction growth Significant commercial demand X X X X X X X X A Best Practices Guide for Energy Efficiency in Municipally‐Owned Services Areas X X X X X X Educate community No rate increases X Reduce peak load Barriers and Constraints High savings‐to‐cost ratio Split incentives X High upfront cost of equipment Efficiency Potential Lack of staff resources Lack of awareness X Lack of funding resources Commercial HVAC Kitchen appliances Lighting Building shell Market Characteristics Residential cooling Operating Conditions Significant small commercial sector Significant residential sector Limited experience with Energy Efficiency programs Collaborative model X Demand constraints Limited Energy Efficiency staff resources In house delivery & management Market Sector Commercial Priorities and Goals X 70 | P a g e Table 26. Energy Efficiency Best Practices Matched to MOU Market Conditions X X X X X X X X X A Best Practices Guide for Energy Efficiency in Municipally‐Owned Services Areas X X X X X X X X X X X X X X X No rate increases Educate community Reduce peak load X Lack of directions Understand long term value Split incentives X Few dealers offering high efficiency products High upfront cost of equipment High savings‐to‐cost ratio X Participation time‐ consuming X Lack of skilled contractors X Qualified vendors X Qualifying measures Priority and Goals Environment awareness Lack of staff resources X Lack of awareness Customer Participation Barriers Lack of decision maker support Apply a well‐articulated theory or program logic to program tactics. Develop a well‐ designed and complete program plan. Conduct market research on customer demographics to guide effective marketing strategies. Pre‐test the market, stimulate key behavior changes, and maintain flexibility to respond to changing market conditions. Involve stakeholders, trade allies, and regulators/policy makers in program design. Leverage national efforts (e.g., CEE, EPA) to increase the availability of energy‐efficient products. Maintain program stability and consistency in all sectors. Leverage efforts of other programs to promote program benefits, including ENERGY STAR® appliances and homes. Use POP marketing and door‐to‐door canvassing to increase penetration rates. Lack of knowledge Best Practice List Lack of funding resources Utility Constraints X X X X X X X X X X 71 | P a g e X X X X X X X X X A Best Practices Guide for Energy Efficiency in Municipally‐Owned Services Areas Lack of directions High savings‐to‐cost ratio Reduce peak load Educate community No rate increases X X X Participation time‐ consuming Understand long term value X X Lack of skilled contractors Qualified vendors Qualifying measures Priority and Goals Environment awareness X Split incentives Customer Participation Barriers Few dealers offering high efficiency products High upfront cost of equipment Lack of staff resources Lack of awareness Lack of decision maker support Understand customer needs. Sell customer benefits first, then energy efficiency. Offer the program participants a bill guarantee. Combine mass marketing for the full portfolio of programs. Work with cities and community‐based organizations to promote energy efficiency. Promote energy efficiency in trade ally association trainings, annual meetings, etc. Showcase properties that have completed program upgrades. Screen and train contractors. Make sure project inspectors have the training and experience required for the task. Write measure specifications using “contractor‐ friendly” language and train contractors on expectations. Leverage utility credibility to help contractors and vendors sell the program. Require contractors to follow‐up with customers. Provide technical and sales support for program contractors. Lack of knowledge Best Practice List Lack of funding resources Utility Constraints X X X X X X X X X X 72 | P a g e Keep program funds available throughout the program year. Use a simple participation process for vendors. Minimize documentation requirements and issue rebates in shortest possible time. Offer zero‐percent or low‐interest financing, or high incentive levels to offset high capital cost of energy‐efficient equipment and achieve high penetration rates. Develop guidelines for determining the appropriate baseline for energy impact and incremental cost calculations. Periodically assess the program to reduce free ridership through market studies and consumer surveys. X X X X X X A Best Practices Guide for Energy Efficiency in Municipally‐Owned Services Areas X X X X X X X X X X X No rate increases Educate community Reduce peak load High savings‐to‐cost ratio Lack of directions Priority and Goals Participation time‐ consuming X Lack of skilled contractors X Qualified vendors Qualifying measures Environment awareness Understand long term value Split incentives Customer Participation Barriers Few dealers offering high efficiency products High upfront cost of equipment Lack of awareness Lack of staff resources Lack of decision maker support Keep track of vendor activity. Inspect the first several jobs submitted by new contractors. Rely on third‐party contractor for quality control. Work with retailers to ensure energy‐efficient products are stocked and advertised and that POP materials are accurate and clear. Offer incentives to upstream retailers. Lack of knowledge Best Practice List Lack of funding resources Utility Constraints X X X X X X X 73 | P a g e Use an information management system with web interface capabilities for data entry and automated reporting. Regularly check program progress and make sure the program is on the right track. Ensure data accuracy with rigorous quality control. Help customers submit program applications through outreach events, workshops, and online tools Participation time‐ consuming Lack of directions High savings‐to‐cost ratio Reduce peak load Educate community No rate increases Lack of skilled contractors Qualified vendors X Qualifying measures X X X X X X X X X A Best Practices Guide for Energy Efficiency in Municipally‐Owned Services Areas X X X X X Priority and Goals Environment awareness X Understand long term value X Split incentives Customer Participation Barriers Few dealers offering high efficiency products High upfront cost of equipment Lack of staff resources Lack of awareness Lack of decision maker support Provide homeowners a mix of services and measures, and promote messages that equate energy efficiency with home improvement. Provide a portfolio of eligible measures and services including rebates for those less likely to be considered and installed. Use a whole‐building approach to achieve deeper energy savings, and tie incentives to building performance. Promote the program on the utility website. Lack of knowledge Best Practice List Lack of funding resources Utility Constraints X X X 74 | P a g e X X A Best Practices Guide for Energy Efficiency in Municipally‐Owned Services Areas X X High savings‐to‐cost ratio No rate increases Educate community Reduce peak load X X Lack of directions Participation time‐ consuming Lack of skilled contractors X Qualified vendors X Priority and Goals Qualifying measures X Split incentives Few dealers offering high efficiency products High upfront cost of equipment Environment awareness X Customer Participation Barriers Understand long term value X Lack of staff resources X Lack of awareness Lack of decision maker support Perform market assessments and impact evaluations regularly, including an estimation of free ridership and spillover. Track quantifiable economic benefits and align evaluation metrics with program goals. Promote a life‐cycle cost perspective of benefits. Choose an experienced evaluator with a full understanding of the market context in which a program operates. Seriously consider evaluation recommendations and incorporate them into the program. Ensure both societal and non‐energy benefits are included in cost‐effectiveness calculations. Evaluate the impacts of free measures. If the impact is small, replace them with alternative measures that generate more energy savings. Provide staff with thorough training and reward good performance. Lack of knowledge Best Practice List Lack of funding resources Utility Constraints X X 75 | P a g e Section 5 Energy Efficiency Plan While it will be impossible within the project budget and timeline to complete customized energy efficiency program plans for each of Texas’ 72 MOUs, the Project Team has provided the tools and resources that will facilitate the process of identifying programs and program components best suited to each MOU’s service territory and customer base, from a selection of identified best practice programs. For each identified program, the Project Team provided basic program design elements, along with implementation tools, rule of thumbs and guidelines to support the MOUs as they develop, launch, deliver, and measure each program. In this section, the Project Team has provided an overview of energy efficiency opportunities and priorities within two predominant customer sectors: residential and C&I. Further, each recommended program concept includes an introduction that outlines MOU issues and considerations with regard to offering that type of program. These introductory sections are intended to provide insights for each MOU to help it determine whether the program is a good fit for its service territory. Further, in this section, the Project Team has provided an overview of key considerations and cross‐cutting best practices with regard to energy efficiency programs, such as rate impact analysis and evaluation, and M&V. The Project Team has also highlighted several important issues, resources, and innovative program concepts that will help the Texas MOUs plan, develop, implement, and promote long term cost‐effective energy efficiency programs. 5.1 Energy Efficiency Program Concepts The Project Team developed a range of recommended program concepts that may be applied by MOUs in the Texas market according to seven program categories. Program categories were largely assigned based on the program’s incentive mechanism and operational characteristics, and in many cases include several program subcategories with similar basic operating parameters. The seven program categories are described in detail in Section 4. The Project Team used both a top‐down and bottom‐up approach to develop program concepts that would be most readily applicable to conditions among Texas MOUs. The Project Team began by assigning specific best practice attributes from a pool of program features identified by the National Efficiency Best Practices Study12 to each of the seven program categories. Next market conditions prevalent in the Texas MOU environments were cross‐referenced to determine those best practice attributes that are most likely to help overcome local barriers, address specific market needs or opportunities, and allow for cost‐effective MOU implementation given the organizational and financial characteristics common to municipal utility operations. Next, the Project Team conducted in‐depth research on the best practice programs identified through a screening analysis. Through this research, it was determined which best practices, from among the pool of attributes, were being implemented in the program and also identified additional innovations or key delivery features deemed to be vital to the program’s success. In some cases, program managers were contacted directly to determine how specific program 12 http://www.eebestpractices.com/index.asp A Best Practices Guide for Energy Efficiency in Municipally‐Owned Services Areas 76 | P a g e functions or characteristics contributed to the program’s performance and to better understand nuances associated with program delivery. While the program recommendations provided below are generally unique concepts, they may draw heavily on the model programs determined based on the research. The Project Team’s objective with the development of recommended program concepts was to articulate program strategies that would be best suited to MOUs in Texas; thus each program that was evaluated was filtered according to its adaptability to the Texas municipal utility environment. Best practice attributes designated for each program category were used as a general guide, and applied the best, most adaptable features of each best practice program that was researched, and incorporated key innovations and unique success factors that were determined to provide specific advantages to MOUs or that are generating significant performance results in other jurisdictions. These features were combined into program concepts that may serve as a roadmap for MOUs, whether they are interested in entering the DSM market for the first time or they wish to expand their current program offerings. It should be noted, that while program recommendations provide specific design strategies and implementation details, they are meant to serve as a guide only. MOUs may wish to modify program details to best suit their specific operations, local conditions, and budgets. In many cases, programs may be scaled up or down based on the MOU’s capacity and savings targets or over time as MOUs become more comfortable with delivery protocols and the market matures. Finally, each program recommendation concludes with a range of “best practices and innovations.” These highlight some of the key success factors determined in the Project Team’s analysis and ideas for customizing programs to the Texas MOUs’ needs. MOUs who adopt these program strategies are highly encouraged to incorporate as many best practice attributes and innovative program features as they can reasonably and cost‐effectively deliver. Over time, MOUs may wish to explore some of the identified best practice features on a pilot basis to determine whether they offer significant advantages and are appropriate for their service territories. Each program concept is preceded by general comments and guidelines to help MOUs determine whether the program is a good fit based on their operational capacity, customer base, and market characteristics. In addition, the matrix (see Table 25) matching efficiency programs to MOUs’ local conditions is further intended as a guide to help MOUs select program concepts best suited to their needs. Recommended program concepts are identified according to three major market sectors: residential, small to mid‐sized commercial, and large C&I. Within each market sector, some background is provided regarding the energy efficiency potential for the sector in Texas as a whole and the potential within Texas MOUs based on the research. Program concepts for each market sector may draw from each program category included in the Project Team’s research, or in some cases multiple program concepts in a given market sector may derive from a single program category. Where appropriate, the Project Team also provides more detailed information on specific innovations, program features, or operating strategies that are deemed to offer key advantages or address specific needs in the Texas MOU environment. A Best Practices Guide for Energy Efficiency in Municipally‐Owned Services Areas 77 | P a g e 5.1.1 Residential Program Concepts The Project Team’s analysis showed that the residential sector dominates MOU customer bases and represents slightly under half of utilities’ electricity sales. MOUs also have the most experience with implementing residential sector programs, with nearly 53 percent of existing energy efficiency programs among MOUs being targeted to residential customers. Existing residential programs primarily target lighting, HVAC systems, and renewable energy technologies, with additional focus on weatherization, appliance recycling, and other program types. A 2007 ACEEE study13 of energy efficiency potential in Texas indicated that in the residential sector, the major opportunities for electricity efficiency resources are housing shell measures (i.e., insulation, air sealing, etc.) that can reduce heating and cooling loads by about 53 percent compared to current average space heating and cooling consumption, combined with more energy‐efficient HVAC equipment and systems. Taken together, these heating and cooling measures represent approximately two‐thirds of the residential energy savings potential in Texas. The Project Team’s analysis of potential energy savings among MOUs reinforced ACEEE’s statewide findings, with nearly all of the MOUs indicating a moderate to significant opportunity for building shell upgrades and two‐thirds indicating a significant opportunity for cooling efficiency measures. Yet, among MOUs that have offered DSM programs to their customers in the past, HVAC programs represent only 8 percent of programs, and weatherization represents another 8 percent. Clearly these two program types offer significant energy savings potential in the Texas marketplace. Many utilities combine incentives for residential weatherization and building shell efficiency measures with residential energy audits. There are several advantages to this model. Energy audit programs alone do not generate energy savings, but are very popular with customers and provide an exceptional “sales” opportunity for larger energy efficiency upgrades. Identifying appropriate building shell efficiency measures requires diagnostic testing by trained professional contractors and special equipment. Attaching building shell upgrades to energy audit programs not only allows the audit program to be more cost‐effective, it also adds a quality assurance component that ensures that the best‐suited measures are installed in the right places, and by trained professionals. Additionally, both the ACEEE study and the Project Team’s market research on MOUs’ efficiency potential indicated significant energy savings opportunities from residential lighting. ACEEE indicated the second‐largest potential for energy savings from lighting and appliances combined; and nearly all of the Texas MOUs indicated that residential lighting represents a moderate to significant energy savings opportunity. Several MOUs also have experience offering residential energy‐efficient lighting programs to their customers, with 18 percent having offered some form of lighting program, second only to renewable energy programs. However the delivery model among MOUs varied considerably, ranging from bulb giveaways to a rebate model. ACEEE: Potential for Energy Efficiency, Demand Response, and Onsite Renewable Energy to Meet Texas’s Growing Electricity Needs. March 2007. Report number E073. 13 A Best Practices Guide for Energy Efficiency in Municipally‐Owned Services Areas 78 | P a g e The following residential program recommendations draw from these key areas of potential, as well as standard residential utility offerings, such as appliance recycling and DR. It should be noted, that renewable energy programs have not been included among these recommendations. Although renewable energy programs are very popular with customers, and Texas has excellent solar and wind resources, renewable energy programs are typically among the least cost‐effective from both a utility and a total resource cost (TRC) perspective. The program recommendations below are primarily focused on those programs that offer a significant amount of energy savings at a relatively low implementation cost. 5.1.1.1 Residential Equipment Rebate Program Prescriptive rebate programs are among the most straightforward to implement and are a good entry‐level program option. They can be delivered with minimal staff commitments and utilities need not contract with a third‐party implementation firm. They are also the most popular programs with customers: they are easy to understand, and participation requires minimal effort. Utilities also gain valuable goodwill with customers – the customer’s incentive is a clear benefit directly resulting from the utility’s intervention. The Project Team evaluated two types of prescriptive rebates: customer and trade ally incentives, or dealer spiffs. Some utilities have had very good success offering nominal dealer spiffs, generally in conjunction with standard customer rebates. Because these trade allies are by far a utility’s most valuable marketing tool, spiffs are a way to incentivize dealers and installers to promote their programs. Particularly in MOU territories where trade allies have traditionally been less active in promoting high‐efficiency equipment, spiffs can be a way to jump‐start a program until the market begins to transform. A Best Practices Guide for Energy Efficiency in Municipally‐Owned Services Areas 79 | P a g e Table 27. Residential Equipment Rebate Program Residential Equipment Rebate Program Program description Objectives The program promotes the purchase and installation of high‐efficiency equipment by providing customers with financial incentives to offset the higher purchase costs of energy‐efficient equipment. The program provides a financial incentive in the form of a prescriptive rebate on a per‐ unit basis to customers installing qualifying equipment and technologies. Rebates are a fixed amount per device, paid by check to customers who complete a rebate application and submit documentation of the equipment purchase. Targeted equipment includes electric heating, cooling, water heating, and appliances (ENERGY STAR®‐labeled equipment is specified where available). Provide customers with opportunities to reduce their energy costs and increase their energy efficiency Encourage customers to install high‐efficiency HVAC equipment and electric appliances. Encourage the use of high‐efficiency/ENERGY STAR®‐rated equipment Promote other energy efficiency programs Infrastructure and staffing Customer targets and eligibility Estimated utility staffing requirement: 0.5 full‐time employee (FTE) for management, promotional, marketing, trade ally support, evaluation, and other administrative functions. This program targets all residential customers in existing single family, multifamily, manufactured and mobile homes. To be as cost‐effective as possible, the program should target customers seeking to replace older, inefficient equipment. Participant eligibility is verified through customer rebate applications cross‐referenced against customer account numbers. Customers must submit a program application with documentation of the equipment purchase and installation(s) for verification. A Best Practices Guide for Energy Efficiency in Municipally‐Owned Services Areas 80 | P a g e Residential Equipment Rebate Program Implementation Equipment rebate programs are relatively simple to implement and administer and can be managed and delivered with in‐house staff. Key steps in program implementation include: Marketing and outreach, including to trade allies. Provide call center services to respond to customer questions and provide technical and program support. Review documentation to verify the applicant is an active customer and the installed equipment meets the minimum efficiency standard. Track program data. Process rebate checks for qualified equipment. Verify equipment/appliance installation for a sample of participants. Customer participation involves: Customers installing eligible high‐efficiency equipment, scheduling the work directly with their equipment dealer or installation contractor. Program barriers Higher first cost of energy‐efficient equipment and economic environment limit customer’s ability to purchase energy‐efficient equipment Customers needing emergency replacement may not know about the program. Work with the equipment/appliance retailer or installation contractor to complete program applications and ensure the required documentation is submitted to the utility for processing. Mitigation Strategies Offer rebates to offset higher incremental cost. Educate customers on the long‐term cost‐saving benefits of higher efficiency equipment. Market program and general efficiency awareness to customers. Provide trade ally training and outreach to explain the benefits of selling higher‐efficiency equipment. In‐store brochures and collateral. Customers may choose to purchase less Promote efficiency awareness to customers and trade allies. energy‐efficient equipment A Best Practices Guide for Energy Efficiency in Municipally‐Owned Services Areas 81 | P a g e Residential Equipment Rebate Program Marketing and outreach This program relies on both customer marketing and point‐of‐sale dealer and installer information for promotion. A high level of trade ally participation and program promotion are critical to ensure program success. The program messaging focuses on the features and benefits of energy‐efficient equipment. The marketing strategy for the program may include: Bill inserts Utility dedicated program web page Active trade ally outreach and support Newspaper, radio, and other mass media Brand marketing material with ENERGY STAR® Present program information at seminars, conferences, home shows, and community events Sponsor co‐advertising with trade allies (i.e., equipment dealers, distributors, and installers) Coordinate marketing opportunities with key market partners (i.e., SECO, community groups) Publish and distribute program brochure Cross‐promote through other programs A Best Practices Guide for Energy Efficiency in Municipally‐Owned Services Areas 82 | P a g e Residential Equipment Rebate Program Measures and incentive levels Program incentives are set at approximately 50 percent of the incremental cost of high‐efficiency equipment, but may be adjusted as needed. The following incentive levels are provided as examples. Utilities should endeavor to set incentive amounts at a level appropriate for their own budgets and program strategies. Measure Central Air Conditioner Central Air Conditioner Central Air Conditioner Room A/C Air‐Source Heat Pump Air‐Source Heat Pump Air‐Source Heat Pump Heat Pump Hot Water Heater Dishwasher Clothes Washer Refrigerator Budgeting rules of thumb Eligibility Rating Seasonal energy efficiency ratio (SEER) 14.5 SEER 15 SEER 16 ENERGY STAR® SEER 14.5 SEER 15 SEER 16 ENERGY STAR®, EF >= 2.0, or coefficient of performance (COP) >= 2.014 ENERGY STAR® ENERGY STAR® ENERGY STAR® Incentive $150 $225 $300 $25 $250 $325 $400 $300 $30 $75 $50 Estimated dollars spent per annual gross kWh saved15: average $0.20/kWh, ranging from $0.15/kWh to $0.34/kWh. Estimated program costs as a percent of total program budget: Administration (internal): 5% to 10% Third‐party contractor: less than 5% Marketing, advertising, trade ally training and outreach: 15% 14 While there is an ENERGY STAR rating for heat pump hot water heaters, it is relatively new and qualifying equipment is not currently available. Annual kWh savings is used in this cost of savings calculation, but the kWh savings benefits remain in utility’s service territory until the end of the measure’s useful life. 15 A Best Practices Guide for Energy Efficiency in Municipally‐Owned Services Areas 83 | P a g e Residential Equipment Rebate Program Incentives: 70% to 80% Evaluation, Measurement and Verification (EM&V): 1% and 5% Benefits Measuring savings Best practices and innovations Customers can increase their home’s energy efficiency while reducing their costs Minimal staff requirements Straightforward to implement with no third‐party contracts necessary Low administrative costs and significant energy savings potential Popular with customers as it is easy to understand and participate Minimal effort required from customers Calculation of energy savings relies primarily on deemed savings estimates using information on measure installations. Program applications require customers to specifically identify equipment replaced, including make, model, and efficiency level, as well as documentation on energy‐efficient equipment installed. Where estimates are not available for specific measures, the utility should conduct an engineering review of per‐unit savings and verify installations through field observations or other confirmation (i.e., via telephone) of a statistically valid sample of participants. Offer dealer and installer incentives (such as 5–10 percent of customer rebate per unit) to encourage program promotion by trade allies. Leverage ENERGY STAR® brand, marketing materials, and other resources. Build strong communication channels with retailers and make extensive use of POP program materials and in‐store rebate applications. Allow retail partners to submit rebate applications on behalf of customers. Use simple rebate forms and program rules. Track and utilize retailer's records and equipment information to analyze actual savings. Educate customers about the benefits and features of energy‐efficient appliances and equipment to encourage greater adoption of energy‐efficient technologies in the future. A Best Practices Guide for Energy Efficiency in Municipally‐Owned Services Areas 84 | P a g e Residential Equipment Rebate Program Couple equipment incentives with low‐cost financing. Sponsor equipment quality installation and best practices training to gain contractor buy‐in and ensure program quality. Coordinate eligible measures and incentives among regional MOUs to ensure continuity and reduce customer confusion. Perform installation inspections to ensure quality of work is maintained throughout the program. A Best Practices Guide for Energy Efficiency in Municipally‐Owned Services Areas 85 | P a g e 5.1.1.2 Residential Lighting Program Utilities throughout the United States have generated an enormous amount of energy savings from residential lighting programs. There is a rich history of experience with program approaches ranging from CFL giveaways to upstream programs that can inform MOU programs. Upstream programs are generally considered the best practice residential lighting program model, particularly for CFLs. Lighting rebates simply are not effective; the nominal rebate amount is not adequate to encourage participation or to justify a customer’s effort to fill out and submit a program application. However, upstream lighting programs are complicated and can be costly to implement. Some utilities use an experienced third‐party implementation contractor to negotiate with manufacturers, handle transactions, and build relationships with retailers; others handle these functions with internal staff, which can be a resource‐intensive approach. This program model may not be a good fit for Texas MOUs, many of which indicated they have relatively small budgets, limited staff resources and few big box stores in their service territories. Texas MOUs may want to consider a simpler model that still uses a retail discount, coupled with event‐based CFL giveaways. A modified, coupon‐based, incentive program that uses local retail partners to support implementation may be as effective as an upstream buy down approach but with a lower cost, simpler delivery, and greater opportunities for local retailer participation. This approach could be seasonal (e.g., coupons included in spring and fall bill inserts) and provide customers with the same on‐site discounts needed to encourage their participation, but without the need to negotiate discounts and incentive payments with manufacturers. The Project Team recommends interested MOUs pursue a collaborative approach that leverages external resources, such as the EPA “Change the World, Start with ENERGY STAR®” campaign (https://www.energystar.gov/index.cfm?fuseaction=globalwarming.showPledgeHome). The EPA’s “Change the World, Start with ENERGY STAR®” campaign is an annual pledge drive aimed at encouraging consumers and organizations to commit to making small changes to reduce their energy consumption. The Change the World, Start with ENERGY STAR® website offers a range of resources for organizations that wish to become involved, such as marketing images and messaging, sample newsletters, an event toolkit, and creative guide. By timing their lighting programs to piggy‐back with the ENERGY STAR®campaign, MOUs can leverage excitement about the program and increase general awareness of energy efficiency measures and behavioral changes. A Best Practices Guide for Energy Efficiency in Municipally‐Owned Services Areas 86 | P a g e Table 28. Residential Lighting Program Residential Lighting Program Program description The Residential lighting programs provides free or discounted energy‐efficient lighting products (fixtures and/or bulbs depending on the program) to residential customers. Typically these programs provide standard screw‐in CFLs and some may offer discounts or rebates for larger varieties of lamp wattages and specialty bulbs. Three possible residential lighting program components are recommended. Utilities should use a strategy that best fits their delivery capacity, budgets, and program objectives. Upstream buy‐down. Utilities or program implementers work with manufacturers and retailers to negotiate bulk purchase pricing and apply incentives before bulbs hit retail shelves. To gain economies of scale with this model, MOUs should pursue a collaborative approach (see discussion below under Implementation). Coupon‐based. Coupons may be provided to customers as a bill insert or through another delivery mechanism. The utility partners. along with local retailers, create an incentive payment mechanism that’s invisible to customers. Giveaway. The utility provides free lighting products (usually CFLs) in exchange for incandescent bulbs, or sometimes no exchange is required. Objectives Provide a mechanism for customers to easily obtain discounted ENERGY STAR®‐ qualified CFLs and/or other energy‐efficient lighting products. Help customers save energy by switching to higher‐efficiency lighting products. Contribute to transforming the market for ENERGY STAR®‐qualified CFLs by increasing the number of qualified products purchased and installed in the utility territory. Encourage customers to install CFLs obtained from a giveaway program. Increase consumer awareness and understanding of the energy efficiency of CFLs, as well as proper use of CFLs in various lighting applications. A Best Practices Guide for Energy Efficiency in Municipally‐Owned Services Areas 87 | P a g e Residential Lighting Program Promote consumer awareness and understanding of the ENERGY STAR® label. Infrastructure and staffing Customer targets and eligibility Implementation Promote other utility energy efficiency programs. Estimated utility staffing requirements vary depending on the type and scope of chosen program components. For a third‐party implemented program, approximately 0.5 to 1 FTE for management and coordination of program or third‐party implementer and other administrative functions, including monitoring and tracking. This program primarily targets residential customers, but may be made available to all customer classes. Three alternative implementation strategies may be used: Collaborative approach. Multiple MOUs collaboratively select a single implementation contractor to provide services in support of an upstream buy‐down approach. There are experienced contractors with national presence that provide turnkey services to support utility lighting programs. This approach requires participating MOUs to jointly issue a RFP and select an implementation contractor. Centralized collaborative approach. A statewide agency may take the lead on significant program development and coordination tasks and invite utilities to participate. In this approach, the centralized agency may conduct planning and program development tasks independently, or it may coordinate the selection of a third‐party implementation contractor. Utility‐led approach. Many utilities develop and implement lighting programs themselves. This approach may be most applicable to a coupon and/or giveaway program as these are relatively straightforward to develop and deliver. With any approach, key implementation tasks include: Develop and implement marketing and outreach to consumers. Coordinate and negotiate with manufacturers and/or retail locations (recruitment, bulk pricing, participation, collaboration, collection of coupons, etc., depending on implementation approach). A Best Practices Guide for Energy Efficiency in Municipally‐Owned Services Areas 88 | P a g e Residential Lighting Program Coordinate with the national Change the World, Start with ENERGY STAR® campaign. Track program data to calculate participation and savings (varies depending on coupon, giveaway, buy‐down, or other type of program approach). For a coupon‐based program: Design, print, and deliver coupons to customers as bill inserts, at events, or through another delivery mechanism. Recruit local retail partners and negotiate process for retailer to apply incentives at the register, collect critical program data, and arrange for the utility to transfer funds to cover incentives. For an upstream buy‐down approach: MOU or implementation contractor coordinates with manufacturers and retailers on program discounts, data tracking, and transfer of funds to cover incentives. For a giveaway approach: Plan for and coordinate bulb giveaway mechanism that may include: providing by mail, events, central pick‐up location, or door‐to‐door. Track number of bulbs sold or given away and calculate savings based on deemed approach and an industry‐accepted realization rate, and/or conduct surveys to determine market penetration. Program barriers Lack of program awareness among customers Mitigation Strategies Robust marketing, education, and outreach strategy, leveraging ENERGY STAR® brand. Cost of energy‐efficient bulbs Robust marketing strategies, including point‐of‐sale promotions and discounts. Outreach to retailers to solicit participation. Willingness of retailers to stock CFLs Provide upstream incentives or coupons and giveaways. A Best Practices Guide for Energy Efficiency in Municipally‐Owned Services Areas 89 | P a g e Residential Lighting Program Negative media attention associated with Provide customer education and outreach on the proper handling and disposal of CFLs. CFL mercury content and CFL disposal Ongoing retailer communications, training, outreach, and education. CFL performance Marketing and outreach Utility program staff should coordinate with internal marketing and communications departments and the implementation contractor (if applicable) to ensure program materials are consistent with utility branding and advertising protocols. External marketing can be led internally or by an implementation contractor. The marketing strategy may include: Bill inserts (potentially with coupons for CFLs twice per year or more) Utility dedicated program web page Newspaper, radio, and other mass media In‐store advertising with participating retailers Use ENERGY STAR® lighting materials and other program tools as a marketing resource; include program on the EPA’s Change the World, Start with ENERGY STAR® web page; leverage Change the World, Start with ENERGY STAR® campaign to create excitement, solicit efficiency pledges, and expand the program’s educational reach. Brand program marketing materials with the ENERGY STAR® label Publish and distribute program information to community organizations, such as Chambers of Commerce, community groups (e.g., churches, Boy Scout troops, senior centers) Present program information at seminars, conferences, and community events Cross‐promote through other MOU programs A Best Practices Guide for Energy Efficiency in Municipally‐Owned Services Areas 90 | P a g e Residential Lighting Program Measures and incentive levels Program may be limited to CFLs or expanded to include energy‐efficient fixtures, specialty bulbs, and potentially newer technologies such as light emitting diodes (LEDs). Provide between 2 and 10 CFL bulbs per home depending on program budget and delivery mechanism. Incentives should cover 50% of CFL retail cost for upstream and coupon mechanisms, or 100% of the cost for giveaways. Budgeting rules of thumb Estimated dollars spent per annual gross kWh saved: $0.10/kWh to $0.15/kWh Estimated program costs as a percent of total program budget: Benefits Administration (internal): 5% to 10% Third‐party contractor: 25% Marketing and advertising: 10% Incentives: 65% EM&V: less than 5% History of achieving significant energy savings throughout the United States Several delivery options are available May be implemented with minimal staff requirements Low delivery costs and high cost effectiveness Provides a mechanism for customers to easily save energy Increase customer awareness and understanding while requiring minimal effort Partnership opportunities with manufacturers, local retailers, government agencies, and community organizations Opportunities to transform the market for Energy Star‐qualified CFLs A Best Practices Guide for Energy Efficiency in Municipally‐Owned Services Areas 91 | P a g e Residential Lighting Program Measuring savings Energy savings estimates for this program rely mainly on deemed savings and use information on measure installations, including: Best practices and innovations Number of CFLs sold (from retailer sales data) Sample‐based verification of CFLs installed Sample‐based verification of baseline CFLs Sample‐based verification of location of installations Detailed data on unit characteristics will be collected by the implementer (or if MOU is implementing then by working with the retailer). With other MOUs, coordinate a jointly funded municipal residential lighting program with shared administrative and implementation costs, operated by a single program implementation contractor. Build relationships and partnerships with manufacturers, local retailers, government agencies, and local community organizations to leverage diverse resources and broaden the program’s reach. Leverage the resources of a regional energy efficiency advocacy group to coordinate program development and implementation, allowing MOUs to participate as desired. Coordinate coupon or giveaway activities, promotions, and events to correspond with the EPA’s Change the World, Start with ENERGY STAR® campaign to leverage federal resources and expand the program’s reach. Keep the customer participation process simple, requiring minimal effort. Conduct telephone surveys with a sample of participants to determine installation rate, satisfaction, program awareness, leakage, and realization rate. A Best Practices Guide for Energy Efficiency in Municipally‐Owned Services Areas 92 | P a g e 5.1.1.3 Residential Refrigerator Recycling A 20‐year old refrigerator or freezer can consume two to four times more energy annually than a new model, and as a result, can significantly increase customers’ electric bills. Older refrigerators also put strain on local power grids, especially during peak hours. Studies have shown that a large percentage of residents keep old refrigerators, even after purchasing new units. In many cases, these second refrigerators are used infrequently and are empty or nearly so. Additionally, older refrigerators often find their way into a secondary market and are re‐sold. Hundreds of utilities across the country have implemented appliance recycling programs to address these issues and ensure that these energy hogs are retired. Utility refrigerator recycling programs often produce a significant amount of energy savings and provide a valuable societal service: ensuring refrigerator components are properly dismantled and disposed of. Appliance recycling programs have been in existence for many years and the program delivery approach is now relatively consistent across utility territories, using well‐established, mature marketing, administrative, delivery, and tracking strategies. The Project Team’s study looked at several appliance recycling programs. Because specialized services are required, all of the programs use a third‐party implementation contractor with the experience and infrastructure needed to operate best practice programs. For Texas MOUs, the Project Team recommends that any potential appliance recycling program be implemented using a collaborative approach and leverage existing resources in the state. The California Statewide Appliance Recycling Program offers a good model for a collaborative program approach. A Best Practices Guide for Energy Efficiency in Municipally‐Owned Services Areas 93 | P a g e Table 29. Residential Refrigerator Recycling Program Residential Refrigerator Recycling Program Program description Objectives Appliance recycling programs offer free pick‐up and disposal of working residential refrigerators. A customer incentive is offered for customers who turn in eligible appliances. Appliances must be in working condition. All units are disposed of in an environmentally responsible manner. This involves removing hazardous materials such as chlorinated fluorocarbons from the refrigerant, preparing refrigerant for reclamation, and recycling other materials, such as metal and plastic. Encourage customers to dispose of existing, inefficient refrigerators when they purchase new ones or when they eliminate a second unit that may not be needed Reduce the use of secondary, inefficient appliances Ensure appliances are disposed of in an environmentally responsible manner Ensure appliances are not resold in a secondary market Promote other energy efficiency programs Infrastructure and staffing Customer targets and eligibility Estimated utility staffing requirement: 0.3 FTE for management and coordination of third‐party implementer and other administrative functions. This program primarily targets residential customers, but may be made available to all customer classes with a working, residential grade refrigerator. Participant eligibility is verified at sign‐up through customer account numbers. Units must be plugged in and functioning when picked up. Implementation There are a small number of experienced contractors with national presence that provide turnkey services to support utility appliance recycling programs. The implementer provides comprehensive services including: Marketing Call center services, including customer intake and scheduling Processing applications and rebates A Best Practices Guide for Energy Efficiency in Municipally‐Owned Services Areas 94 | P a g e Residential Refrigerator Recycling Program Tracking program data Pick‐up, storage, dismantling, and proper disposal of refrigerator components Providing customer and transaction information Key steps in program participation include: Implementer schedules and executes appliance collection. Implementer verifies customer and appliance eligibility. Implementer picks up and transports appliances to a recycling facility. Implementer recycles applicable components and appropriately disposes of remaining components. Implementer tracks customer data, appliances, and outcomes throughout process. Implementer processes rebate payment and delivers to customers. Program barriers Customer must be available for pick‐ up Mitigation Strategies Implementer responsible for working with customer to ensure the pick‐up is as convenient as possible Need to fill out rebate forms Provide simple rebate forms Lack of program awareness among customers Robust marketing, education, and outreach strategy, leveraging ENERGY STAR® brand Customers do not see benefit of harvesting qualified appliance(s) Implementer works with retailers to display information about the benefits of appliance recycling Customized educational materials that highlight the cost of operating an old refrigerator or freezer and explain environmental benefits of eliminating inefficient appliances A Best Practices Guide for Energy Efficiency in Municipally‐Owned Services Areas 95 | P a g e Residential Refrigerator Recycling Program Marketing and outreach Utility program staff coordinates with internal marketing and communications departments and the implementation contractor to ensure program materials are consistent with utility branding and advertising protocols. External marketing is led by the implementation contractor. The marketing strategy may include: Bill inserts Utility dedicated program web page Newspaper, radio, and other mass media Use ENERGY STAR® refrigerator harvesting materials as a marketing resource; include program on the ENERGY STAR® “Find a fridge or freezer recycling program” web page Brand program marketing materials with the ENERGY STAR® label Present program information at seminars, conferences, and community events Distribute program brochures to community organizations, such as Chambers of Commerce Measures and incentive levels Program may be limited to refrigerators or expanded to include stand‐alone freezers and room A/Cs. Refrigerators typically must be at least 10 cubic feet in size. Budgeting rules of thumb Incentives may range from $25 to $50 per unit. Estimated dollars spent per annual gross kWh saved: $0.19/kWh Estimated program costs as a percent of total program budget: Administration (internal): 5% to 10% Third‐party contractor costs: 30% Marketing and advertising: 10% Incentives: 45% EM&V: 3% to 5% A Best Practices Guide for Energy Efficiency in Municipally‐Owned Services Areas 96 | P a g e Residential Refrigerator Recycling Program Benefits Measuring savings Produces a significant amount of energy savings Can reduce strain on local power grids Offers both monetary and convenience incentives for customers Produces multiple environmental benefits Reduces the use of inefficient appliances and lowers customers’ electric bills Widely‐used program with consistent delivery approaches and well established strategies Can be implemented collaboratively with multiple utility partners to gain economies of scale Energy savings estimates for this program rely mainly on deemed savings and use information on measure installations, including: Number of units removed Unit characteristics: Model Size Age Best practices and innovations Detailed data on unit characteristics are collected by the implementer. Coordinate a jointly‐funded, statewide municipal recycling program with shared administrative and implementation costs, operated by a single program implementation contractor. Allow customers to enroll in the program and schedule pick‐up at retail locations when purchasing a new appliance. Promote the recycling program to customers who have received a rebate on a new appliance. Partner the recycling program message with state or federal appliance rebate programs. Offer online scheduling and pick‐up on Saturday. Pick up units within one week of receipt of a request for pick‐up. Conduct random inspections of recycling services contractor to ensure program compliance. A Best Practices Guide for Energy Efficiency in Municipally‐Owned Services Areas 97 | P a g e 5.1.1.4 Residential Audit and Direct Installation/Weatherization Program Residential audit and weatherization programs are very popular with customers. Many utility programs offer audits as a free or very low cost service and provide free installation of low‐cost energy efficiency measures. From a utility perspective, audit programs that include direct installation can provide instantaneous energy savings with a near 100 percent realization rate (since auditors do the installation on site and verify to the utility the quantity and types of measures installed). They also generate good will with customers and serve as a useful sales tool for other utility programs and the installation of weatherization measures, since audits typically provide data on the home’s leakiness. Customers tend to value the information they receive about their homes and the level of service provided by utilities. Customers who have had energy audits are often empowered to implement energy efficiency measures – armed with detailed information on how to best invest their efficiency dollars. However, audit and weatherization programs have experienced some problems that utilities should be careful to avoid so they maximize the benefits afforded by these programs. The primary issue with residential audit and weatherization programs is that audits, by themselves, do not generate energy savings. It is not unusual for audit customers to enthusiastically embrace their audit and upgrade recommendations, then become distracted and never get around to actually installing the measures. And, because audit programs are often quite expensive to deliver (and the cost of audits increases as quality and accuracy of data collection increase), utilities must use either a direct installation mechanism or attach specific measure incentives to the program to help bring the full program into cost‐effectiveness. For Texas MOUs, this may be less of an issue; however, it should be noted that achieving high installation rates should be a primary goal of any energy audit program. Over time, audit program administrators and implementers have increasingly become aware that in order to achieve real energy savings, an audit should be treated as a sales tool and utilities should make taking the recommended actions as seamless, simple, and inexpensive as possible. A Best Practices Guide for Energy Efficiency in Municipally‐Owned Services Areas 98 | P a g e Table 30. Residential Audit and Weatherization Program Residential Audit and Weatherization Program Program description This program is designed to provide customers with information on their homes’ energy performance and recommendations on energy efficiency actions they can take to reduce their energy consumption. Recognizing the varying economic conditions and interest levels among residential customers, the cost of the audit should be subsidized by the utility so that customers’ cash outlay is minimal. The program also provides customers with an option to increase the rigor of the energy audit through diagnostic testing for an additional cost. Customers who install a minimum of recommended energy efficiency upgrades in their homes will be reimbursed the cost of the audit and will be eligible for rebates for the installed equipment. A walk‐through energy audit will include a thorough visual inspection of the home to evaluate major energy‐using equipment (e.g., lighting systems, space conditioning and hot water heating equipment, and appliances), building envelope characteristics, and to identify areas for cost‐ effective efficiency upgrades. The auditor will provide customers with an audit report that includes recommendations for appropriate follow‐up activities. For an additional cost, customers may request a comprehensive energy audit delivered by a Building Performance Institute (BPI) trained and certified energy auditor. The auditors perform specific minimum diagnostic tests. Participating customers in either the walk‐through or comprehensive audit: Receive installation of low‐cost energy‐saving measures and an A/C tune up, information on the benefits and features of energy‐efficient equipment, an assessment of energy savings opportunities, and recommendations for energy‐efficient upgrades; Are eligible for incentives to install weatherization measures, including attic, wall, and foundation insulation, as well as duct sealing; and Will be directed to other utility programs as appropriate for additional incentives on equipment upgrades. A Best Practices Guide for Energy Efficiency in Municipally‐Owned Services Areas 99 | P a g e Residential Audit and Weatherization Program To encourage customers to follow‐through on recommendations and implement recommended efficiency upgrades, participants will be reimbursed for the full cost of the audit if they install at least one recommended qualifying measure. Objectives Provide customers with information about their home’s energy use and opportunities to save energy. Provide customers with opportunities to reduce their energy costs and increase their energy efficiency. Encourage customers to weatherize their homes by providing rebates. Promote installation of low‐cost energy saving measures and A/C tune‐ups that may result in immediate savings. Promote other energy efficiency programs. Infrastructure and staffing Estimated utility staffing requirement: 0.5 FTE for management, marketing, trade ally support, evaluation, and other administrative functions. Additional utility staff or third‐party contractors will deliver customer energy audits. To deliver comprehensive audits, utility staff or third‐party contractors must participate in BPI or equivalent training and be certified in whole home audit delivery. Infrastructure needs to support comprehensive audits include blower door and duct blaster. Use of auditing/residential modeling software, run on a tablet computer for on‐site data collection, is strongly recommended. Customer targets and eligibility This program targets residential customers in single family homes or mobile homes. Customers in rental housing must have owner’s approval to participate. Participants must have electric heat, electric water heating, and/or central air conditioning to qualify. Participant eligibility is verified at the time the audit is scheduled, using customer account number. A Best Practices Guide for Energy Efficiency in Municipally‐Owned Services Areas 100 | P a g e Residential Audit and Weatherization Program Implementation Utility staff will manage customer intake, verify customer eligibility, schedule audits, process applications and rebates, and track and verify program data. Additional staff will provide overall strategic direction and program management for the program, marketing, trade ally outreach, evaluation, and other administrative functions. Key steps in program participation include: Most customers will enter the program by calling the utility. Utility staff will explain the program, verify the customer’s eligibility, and schedule an appointment. The certified energy auditor will conduct an assessment of the customer’s home, directly install simple energy efficiency measures, perform a tune‐up of the A/C (if present) and inspect major energy‐using equipment and building envelope characteristics to identify areas for cost‐ effective efficiency upgrades. Customers who request a comprehensive audit will receive diagnostic testing in addition to standard visual inspections. These tests will provide more detailed insight into the performance of the home, and can help identify a greater range of energy‐saving opportunities. The auditor will also review additional available financial incentives or programs that may benefit the customer, discuss best practices for operating home energy systems efficiently, and disseminate educational materials. Customers will receive an audit report with recommendations for appropriate energy efficiency upgrades and information on incentives available through the audit and other programs, as well as a rebate application for weatherization measures. Energy auditors will provide a copy of the audit report to utility staff for tracking and reporting purposes. Customers will issue payment to the auditor for the cost of the audit, minus the utility incentive. Utility staff will follow up with customers to inquire about their audit and any measures the customer has installed, and to encourage customers to implement recommended measures. A Best Practices Guide for Energy Efficiency in Municipally‐Owned Services Areas 101 | P a g e Residential Audit and Weatherization Program Customers installing weatherization measures through the program will contact a third‐party contractor to install measures and submit documentation of the installation and the rebate application directly to the utility. Program barriers Higher cost of comprehensive energy audit Economic environment may limit customer’s ability to purchase energy‐ efficient equipment. Lack of program awareness Availability of qualified contractors to install recommended measures Marketing and outreach Utility staff process rebate applications and issue payment to the customer. Mitigation Strategies Offer rebates to offset higher incremental cost. Educate customers on the long‐term cost‐ saving benefits of higher‐efficiency equipment. Provide trade ally training and outreach. Target equipment being replaced or customers remodeling or building new. Use a robust marketing strategy and promote general efficiency awareness to customers and trade allies. Collaborate with trade schools and other workforce development resources to increase the local contractor base. This program should leverage both traditional and grassroots social customer marketing for promotion. If the utility chooses to use external auditors to deliver the program, they should be provided tools and resources to support program promotion. The marketing tactics for the program may include: Bill inserts Utility dedicated program web page Newspaper, radio, and other mass media advertising Brand marketing material with ENERGY STAR®. Present program information at seminars, conferences, home shows, and community events. Coordinate marketing opportunities with key market partners (i.e., community groups, local nonprofit organizations). A Best Practices Guide for Energy Efficiency in Municipally‐Owned Services Areas 102 | P a g e Residential Audit and Weatherization Program Publish and distribute program brochure. Cross‐promote through other programs. Measures and incentive levels Depending on the delivery model, the cost of audits may vary and utilities can set the audit cost at a level that they deem appropriate to generate customer interest and participation in the program. The Project Team cautions against offering free energy audits, as these typically receive the lowest conversion rate. Customers who pay nothing for a service are much less motivated to install the recommended measures than those who have invested in the program to some extent. In some cases, utilities charge a nominal fee for audit services, but reimburse the cost or offer bonus incentives when customers install a minimum number of recommended measures. Additionally, the majority of programs provide direct installation measures at no cost. The following incentive levels are provided as examples. Utilities should endeavor to set incentive amounts at a level appropriate for their own budgets and program strategies. Measure Incentive Walk‐through audit $25‐$50 customer cost. Cost is reimbursed 100% if the customer implements one recommended measure. Comprehensive audit $100‐$200 customer cost. Cost is reimbursed at 50% for one installed measure and 100% for two installed measures. Compact fluorescent lamps Electric water heater measures: Faucet aerator Free to customer (customer must have electric water Low flow showerhead heater to qualify for water heater measures). Water heater pipe insulation Water heater setback AC system tune up Smart‐strip Customer co‐pay 50% of retail or installed cost. Programmable thermostat A Best Practices Guide for Energy Efficiency in Municipally‐Owned Services Areas 103 | P a g e Residential Audit and Weatherization Program Budgeting rules of thumb Infiltration Ceiling insulation 50% of installed cost with $1,000 cap (customer must have central air conditioning or electric heat to qualify). Wall insulation Duct sealing Estimated dollars spent per annual gross kWh saved: $0.33/kWh Estimated program costs as a percent of total program budget: Benefits Administration (internal): 5% to 10% Marketing and advertising: 10% to 15% Incentives and measure costs (direct install or giveaway): 70% EM&V: 5% Options to provide immediate energy savings through direct installation of measures Popular with customers Provides customers with immediate energy savings and access to additional rebates for significant energy saving measures Opportunity for utility to connect directly with customers to enhance relationship and increase customer good will Opportunity to educate customers on long‐term benefits of efficiency and other utility programs Collaboration opportunities with local workforce Good local job creation and other economic benefits Measuring savings Energy savings for this program will be calculated using information gathered during the energy audit, including energy consumption data and quantities of direct installation measures installed. To ensure data is adequate to conduct impact evaluations, collected information should include: Participant contact information, including name, address, and participation date. Essential structural attributes A Best Practices Guide for Energy Efficiency in Municipally‐Owned Services Areas 104 | P a g e Residential Audit and Weatherization Program Best practices and innovations Household characteristics Types and quantities of installed measures Estimated savings Measure cost Interval daily electricity consumption Climate information to calculate heating and cooling degree information Additional savings resulting from weatherization measures installed will be calculated using information from rebate applications for those measures. Rebate applications should require customers or their contractors to provide specific information on pre‐installation conditions, including the type, location, and condition of existing insulation as well as the types, locations, and quantities of measures installed. Use customer’s actual 12 month billing history to inform upgrade measure recommendations and calculate energy savings. Provide tools and resources for customers to take action after the audit, such as lists of qualified installation contractors and tips on how to select a contractor, simple rebate applications (with online submittal options), technical support hotline, tips for do‐it‐yourself energy‐saving opportunities and behavioral actions, FAQs, and other educational materials. Use an advanced, software‐based, energy audit and analysis tool to enter data on site and generate audit reports that can be delivered instantly through email or printed on a portable printer. Couple weatherization measures with OBF or low‐cost financing mechanism. Structure financing to result in positive cash flow Partner with other utility, state, or local incentive programs to present a unified program to customers. Use simple rebate forms and program rules. A Best Practices Guide for Energy Efficiency in Municipally‐Owned Services Areas 105 | P a g e Residential Audit and Weatherization Program Refund some or all of audit cost if customer follows through on recommended actions. Solicit customer commitment to install recommended measures. Offer to help customers develop a phased implementation approach and generate work orders on site for immediate installation measures. Provide performance‐based incentives that offer greater incentives and interest subsidies the more measures a customer implements. Provide simple, visually appealing energy audit reports that clearly articulate priority measures and estimated energy savings. Use community‐based marketing approaches to create a word‐of‐mouth effect. A Best Practices Guide for Energy Efficiency in Municipally‐Owned Services Areas 106 | P a g e 5.1.1.5 Behavior and Education Utility education and behavior‐based programs can take many forms and the landscape for this program type is evolving very rapidly. Utilities across the country are experimenting with school‐ based, on‐line, in‐home, and mail‐based programs that provide energy efficiency information ranging from general awareness to customized energy usage information. Utilities often sponsor school‐based energy efficiency programs that integrate energy efficiency education into the general school curriculum through a variety of approaches. The theory is that educating young people encourages them to adopt energy‐efficient behaviors that last a lifetime. These programs also can leverage a variety of resources that have been developed to support energy efficiency education. One of the newest program models gaining traction with utilities is a home energy assessment report approach. Third‐party implementers typically deliver these programs, where customers receive a semi‐customized individual energy usage report through the mail. The reports use a range of utility data to disaggregate energy consumption into various end uses and generate a comparison to neighbors or others in the community in similar homes. The program theory contends that this use of normative messaging will compel customers to voluntarily implement energy efficiency strategies and change their behaviors in an effort to “keep up with the Joneses.” In reality, these programs have received mixed reviews. While some customers consider the information they provide useful, others consider them an invasion of privacy or claim the comparisons are inaccurate. Measuring energy savings associated with behavioral programs has also proven to be difficult. Surveys have resulted in inaccurate or misleading information and measure persistence tends to be short. Many utilities have forgone efforts to justify behavioral programs on a cost‐ effectiveness basis and have simply adopted these programs in an effort to promote their other programs, contribute to long‐term market transformation, and provide a general social benefit. For the Texas MOUs interested in implementing an educational and behavior‐based program, the Project Team recommends general awareness education for customers and trade allies, along with a school‐based program. A Best Practices Guide for Energy Efficiency in Municipally‐Owned Services Areas 107 | P a g e Table 31. Energy Efficiency Education Energy Efficiency Education Program description This program promotes energy efficiency education and the adoption of energy‐efficient behaviors. It contains two components: a school‐based educational platform and a general awareness campaign. School Curriculum The utility will work with schools to integrate energy efficiency education into the curriculum and extracurricular activities. The program targets elementary‐aged children in the fourth and fifth grades. To implement the program, the utility partners with a third‐party organization specializing in energy efficiency education. The selected implementation provider should offer some combination of the following: Teaching guides to support curriculum development Student workbooks or other materials to reinforce the curriculum Fun and interesting activities that can be done in a classroom setting or at home Information on general efficiency awareness, behavioral actions and tips, and other utility programs to be shared with parents Classroom and/or assembly presentations focused on awareness of energy safety and efficiency concepts that are fun and engaging Guidelines for extracurricular activities such as science fair projects, school contests, and similar activities Free energy efficiency kits that contain no‐cost/low‐cost energy saving measures (e.g., CFLs and energy saving tips) General Awareness Utility general efficiency awareness campaigns are aimed at increasing customer knowledge about the benefits of energy efficiency and strategies they can take to reduce their own energy A Best Practices Guide for Energy Efficiency in Municipally‐Owned Services Areas 108 | P a g e Energy Efficiency Education consumption. These types of campaigns are particularly appropriate and well received in areas with municipal utilities, since they are often viewed as a way to support the community. Approaches may include: Media advertising that uses a “did you know…?” approach. Energy efficiency tips and information on the utility website. Distribute energy efficiency information through brochures, flyers, door hangers, utility newsletters, and other collateral through one‐on‐one interactions Outreach at local events such as community fairs, organization gatherings (e.g., church picnics), farmers markets, parades, etc. Outreach to trade allies through key account managers, at trade shows, seminars, webinars, etc. Leverage social media channels (Facebook, Twitter, YouTube, Flickr, LinkedIn) to create two‐way dialog with customers regarding energy efficiency. Promote programs, energy‐saving tips, and events. Trade ally training through lunch‐and‐learn events, webinars, and workshops. Objectives Sponsor demonstrations and presentations to large customers, town hall meetings, community groups, and other venues. Educate customers (and future customers) about energy use and the benefits of energy efficiency. Provide customers with information about no‐cost/low‐cost energy efficiency measures and behaviors that can reduce their energy consumption. Encourage customers to adopt more energy‐efficient behaviors and to install energy efficiency measures in their homes by becoming more aware of how their behavior and practices impact their energy usage. Inform customers and trade allies about available utility‐sponsored energy efficiency programs and incentives. A Best Practices Guide for Energy Efficiency in Municipally‐Owned Services Areas 109 | P a g e Energy Efficiency Education Enhance customer relationships. Improve the likelihood trade allies will promote utility programs to their customers. Contribute to long‐term market transformation by encouraging customers to consider energy efficiency as a normal part of their daily lives and purchasing decisions. Infrastructure and staffing Estimated utility staffing requirement: 0.25 to 0.5 FTE for management, coordination, and other administrative functions. Utility staffing requirements to support education and behavior programs can vary depending on the utility’s budget allocation and program objectives. School‐based programs typically include curriculum and materials from a third‐party vendor. However, low cost resources exist. Infrastructure needs to support general awareness may include a functional utility website, marketing materials, event displays, and training and general awareness presentations and computer/presentation hardware. Customer targets and eligibility Implementation This program targets residential customers and school children throughout the utility service territory. No eligibility verification is required. Utility staff typically manages and directs the program delivery approach and provides other administrative functions. Key steps in program implementation include: School Curriculum Utility staff will identify curriculum and other educational activities appropriate to the service territory. Solicit potential school curriculum program providers Facilitate marketing to local schools to encourage their participation in the program (often through a letter to the school principal) Coordinate activities with the implementation contractor A Best Practices Guide for Energy Efficiency in Municipally‐Owned Services Areas 110 | P a g e Energy Efficiency Education General Awareness General awareness can include a broad range of activities that the utility may wish to undertake, often without a great deal of lead time. Implementation steps may vary by activity. Planning for awareness activities such as participation in events, advertising campaigns, presentations, etc. Identifying and developing communication channels, meetings and events, and advertising support appropriate to each activity. Coordinating activities with partners and other participants. Developing materials such as media publications, case studies, newsletters, brochures, and other materials. Evaluating the effectiveness of each activity. Program barriers Lack of customer awareness of educational opportunities Mitigation Strategies Conduct outreach through traditional and non‐traditional mechanisms; create a comprehensive marketing strategy. Lack of time and resources to participate Provide educational opportunities at no cost. Cost of educational curriculum, activities, and materials Use flexible scheduling and streamline programs to ensure energy‐efficient use of participants’ time. Leverage programs and curricula created by national organizations. A Best Practices Guide for Energy Efficiency in Municipally‐Owned Services Areas 111 | P a g e Energy Efficiency Education Marketing and outreach Marketing strategies for the education and behavior program will vary depending on the program component. The objective of marketing for a school based program is recruiting schools to participate in the program. Many utilities recruit schools by writing a personal letter to school principals or using one‐on‐one direct contact (email, phone call, or visit) to explain the program and enlist their support. Marketing is an integral part of general awareness program delivery. For several program delivery components, the two are one and the same. The key difference between program marketing and general awareness marketing is that materials use a more informational message, rather than promoting a specific program. General awareness messaging can be delivered through: Measures and incentive levels Budgeting rules of thumb Benefits Bill inserts Mass media (e.g., radio, print, digital advertising, public service announcements) Website Newsletters Case studies Brochures, flyers, FAQs, door hangers, etc. Presentations, workshops, participation in community events, sponsorships Trade ally training and industry events Social media (e.g., Twitter, Facebook, YouTube, Flickr, LinkedIn) This program does not cover specific measures and does not provide specific incentives. All education and general awareness activities are provided at no cost to customers. The cost of education and behavior programs can vary widely depending on the delivery approach. A program focused strictly on general awareness can be categorized as 100% marketing cost. Utilities are encouraged to seek out pricing from a variety of program implementation perspectives to develop budgets. Provides energy efficiency education to students through fun activities Begins the process of lifelong awareness of efficiency among future customers Can increase customer knowledge through approaches that support the community A Best Practices Guide for Energy Efficiency in Municipally‐Owned Services Areas 112 | P a g e Energy Efficiency Education Offers an opportunity for utilities to have a two‐way dialogue with customers that enhances customer relationships Increases awareness of how customers’ behavior impacts their energy usage Can contribute to market transformation by encouraging consideration of energy efficiency in purchasing decisions Potential to help change individuals’ patterns of energy use and encourage ongoing, consistent energy‐efficient behaviors Measuring savings Best practices and innovations Implementation can include a broad range of activities and partnerships This program does not require any measurement or tracking of energy savings. However the effectiveness of individual program activities should be evaluated on a case by case basis, through customer surveys, or by soliciting feedback through other means. School‐based programs: Design curriculum that’s fun, engaging, visually appealing, and memorable. Use contests or challenges to engage kids. Design age‐appropriate curriculum and target kids old enough to understand energy concepts and efficiency benefits. Use a variety of educational materials, activities, and assignments to reinforce curriculum. Assign take‐home projects and provide general awareness information for kids to share with their parents. Invite guest speakers and community leaders to present in classrooms or at assemblies. Present curriculum in small doses over an extended period following a phased path. General Awareness: Use positive, fact‐based, credible communications to overcome perception barriers about energy efficiency. A Best Practices Guide for Energy Efficiency in Municipally‐Owned Services Areas 113 | P a g e Energy Efficiency Education Ensure the educational messages are audience‐specific and include a call to action. Speak to customers on their own terms using regional mindsets and terminology. Maintain focus on the end goal. Build momentum to create bandwagon effect. A phased approach sometimes works best. Leverage multiple outreach tactics, such as participation in events, social media, and traditional media Use normative messaging that conveys energy efficiency as a social norm (e.g., “all of your neighbors have participated in the energy challenge, why haven’t you?”) to encourage customers to adopt energy‐efficient behaviors. Encourage customers to commit or pledge to take action. Offer recognition for participants’ contribution. A Best Practices Guide for Energy Efficiency in Municipally‐Owned Services Areas 114 | P a g e 5.1.1.6 New Construction The best practice programs the Project Team evaluated in residential new construction all share a basic structure and program components. The programs were all based on EPA’s ENERGY STAR® New Homes program. Each included marketing and education for the program participants (builders and developers), as well as for the consumers. Each program includes tiered incentives combined with targeted prescriptive options. The national ENERGY STAR® Homes program provides utilities with a high profile market brand and set of technical requirements for the construction of energy‐efficient new homes. Programs provide marketing and education to the community. Program participants use the framework of the Residential Energy Services Network (RESNET®) and accredited HERS to verify that a home meets program qualifications. Tiered incentive structures provide a program flexibility to adapt to new codes and eliminate incentives for measures that are no longer above the standard. In addition, tiers allow the program to offer higher incentives for strategies that provide greater energy efficiency but have higher upfront costs. Prescriptive incentives allow a utility to target specific strategies and technologies, such as premium performance heating or cooling systems or solar technology. The Project Team observed that while the best practice programs all shared these basic elements and included tiered prescriptive incentives, the utilities analyzed each faced different challenges, ranging from service areas with multiple energy codes in effect, to the need to differentiate energy sources across their customer bases. In each case the utility was able to apply the same program components and customize the incentive formula to suit its needs. The Project Team acknowledges that the new construction market in the United States has been virtually flat for the past few years and that many utility new construction programs have suffered from equally low uptake. The Project Team has included a recommendation for a new construction program for possible future consideration. MOUs should carefully evaluate the housing market within their service territories before embarking on a significant new construction program effort. As the residential construction market begins to rebound, MOUs may want to experiment with pilot‐level programs before launching a full‐scale program. A Best Practices Guide for Energy Efficiency in Municipally‐Owned Services Areas 115 | P a g e Table 32. Residential New Construction Program Residential New Construction Program Program description Objectives This program supports the construction of energy‐efficient new homes. The program offers a per house incentive for homes built to meet EPA’s ENERGY STAR® New Homes requirements, using a tiered incentive structure. A third‐party HERS rater is employed by participating builders to confirm that homes meet the ENERGY STAR® Homes requirements. The program provides marketing, education, technical support, and administration. Support the creation of more energy‐efficient housing stock Educate builders, and thus move the industry to adopt more energy‐efficient building practices Educate consumers about the value and comfort of energy‐efficient and high performance homes and the ENERGY STAR® programs Infrastructure and staffing Customer targets and eligibility Implementation strategy Estimated utility staffing requirement: 0.5 FTE for management, marketing, trade ally support, evaluation, and other administrative functions. This program targets all builders of single family homes and duplexes. Participating builders must become ENERGY STAR® Partners. Once in the program, participants are responsible for building homes to meet the designated ENERGY STAR® Homes requirements. An ENERGY STAR® Homes program can be managed and delivered with in‐house staff and minimal outside technical support. Key steps in program implementation include: Promote program participation through industry events and trade allies. Educate program participants on the ENERGY STAR® Homes program and requirements. Provide program participants with energy efficiency education and design assistance. Participate in statewide program activities. Provide marketing and outreach to consumers. A Best Practices Guide for Energy Efficiency in Municipally‐Owned Services Areas 116 | P a g e Residential New Construction Program Provide program information on the utility website. Process and track program participation and incentives. Train builders’ marketing and sales staff, lenders, and real estate agents about energy efficiency, the financial savings, and the user comfort benefits of ENERGY STAR® Homes. Verify that properties meet the incentive requirements. Participation steps include: Participating builders must attend technical training on the requirements of the ENERGY STAR® New Homes program and become ENERGY STAR® Partners. Prior to the start of construction, the program participant must submit building plans to a RESNET accredited provider for analysis of the home’s anticipated energy consumption to verify project eligibility. Once the home is completed the physical structure undergoes a comprehensive assessment using diagnostic testing to verify that the ENERGY STAR® Homes requirements have been met. For volume builders, a predetermined sample of finished structures is tested to verify the entire community. Program barriers Builder concern that consumers will not understand or pay for a home built to ENERGY STAR® Homes standards. The HERS rater submits the final evaluation to the program administrator to show compliance. Mitigation Strategies Target consumers with marketing and advertising focused on the energy efficiency, savings, and increased comfort of homes built to ENERGY STAR® Homes standards. Provide outreach and education to builders’ sales and marketing staff, as well as lenders and Industry stakeholders lack understanding of real estate agents on the energy efficiency, savings, and increased comfort of homes built to financial and user benefits of a home built ENERGY STAR® Homes standards. to ENERGY STAR® Homes standards. A Best Practices Guide for Energy Efficiency in Municipally‐Owned Services Areas 117 | P a g e Residential New Construction Program Additional upfront costs for the building and verification of ENERGY STAR® Homes. Provide incentives to offset the additional costs of building and verification of residences built to ENERGY STAR® Homes standards. Participants don’t meet the program’s design, technical, and verification requirements. Require participants to attend an initial program orientation and provide design and technical assistance. Marketing and outreach This program relies on both developing the demand side through customer marketing, and on recruiting active builders. A high level of trade ally participation and program promotion are critical to ensure program success. Program messaging to consumers focuses on the ENERGY STAR® brand and education on the long‐term benefits of homes built to ENERGY STAR® Homes standards. Marketing messages for builders should highlight that the program is a way to differentiate their products, while also positioning them to better meet future energy code requirements. Marketing tactics for consumers may include: Dedicated program web page Brand marketing material with ENERGY STAR®. Presenting program information at seminars, conferences, home shows, and community events. Coordinating marketing opportunities with key market partners (e.g., SECO, neighborhood associations, and city building departments). Marketing to builders may include: Outreach through industry organizations and events (American Institute of Architects (AIA), the Home Builders Association). Advertising in trade publications. Presenting program information at seminars, conferences, home shows, and community events. A Best Practices Guide for Energy Efficiency in Municipally‐Owned Services Areas 118 | P a g e Residential New Construction Program Coordinating marketing opportunities with key market partners (i.e., SECO, city building departments). Measures and incentive levels Following are suggested tiers and incentives for an MOU providing electric service to customers in areas that have adopted International Energy Conservation Code (IECC) 2009. Tier 1 Tier 2 Tier 3 Prescriptive Options Requirement ENERGYSTAR Standard v2.5 ENERGYSTAR Standard 3.0 HERS Index of 60 of below Utility‐Specific Incentive $250 $500 $750 Program adjustment strategies: In areas with less stringent energy codes, start tiers with ENERGYSTAR v2 and provide higher incentives. If requiring lower versions of ENERGY STAR®, additional tiers can be offered for the installation of higher SEER AC systems or higher window efficiency. Partner with relevant gas utilities to enhance whole home incentives. Additional rebates can be offered for targeted or premium efficiency prescriptive measures. Examples might include solar technologies or premium efficiency air source heat pumps. Budgeting rules of thumb Estimated dollars spent per annual gross kWh saved: $0.23/kWh Estimated program costs as a percent of total program budget: Administration (internal): 5% Third‐party contractors: 5% to 10% Marketing and advertising: 5% to 10% Incentives: 70% EM&V: between 5% and 10% A Best Practices Guide for Energy Efficiency in Municipally‐Owned Services Areas 119 | P a g e Residential New Construction Program Benefits Measuring savings The HERS ratings provided with incentive applications provide estimated energy savings compared with a home built to code. These predicted savings may be adjusted based on post‐ installation inspections. Offer tiered incentives that encourage increasing levels of efficiency. Best practices and innovations Educates builders and developers as well as consumers Tiered incentives allow for flexibility to adapt to changing markets Provides utilities with a high profile market brand Increases efficiency of housing stock over time Can help move the industry to adopt more energy‐efficient building practices Minimal outside technical support is required Partner with local gas utility to create a comprehensive program package that addresses the whole home as a system. Include incentives for targeted prescriptive measures, such as: Premium efficiency heating, cooling, lighting, or appliances Solar‐ready homes Solar technology or geothermal systems Offer high‐quality building science and energy efficiency training to the building community in order to move the entire industry practice forward. Require builders to attend building science and energy efficiency trainings before being eligible to receive incentives. Include strategies to encourage builders’ subcontractors to attend building science and energy efficiency training. Provide technical and design assistance to support program participants. Educate customers about the benefits and features of ENERGY STAR® Homes to encourage greater market adoption. A Best Practices Guide for Energy Efficiency in Municipally‐Owned Services Areas 120 | P a g e Residential New Construction Program Leverage ENERGY STAR® brand, marketing materials, and other resources to the greatest extent possible. Build strong communication channels with trade allies and builder associations. Offer training to marketing and sales departments of volume builders to support their ability to successfully sell the benefits of ENERGY STAR® Homes. Outreach to industry stakeholders (e.g., lenders, real estate agents) with education about the value of ENERGY STAR® Homes. Work with other MOUs to build economies of scale where possible (e.g., education, training, and marketing). A Best Practices Guide for Energy Efficiency in Municipally‐Owned Services Areas 121 | P a g e 5.1.1.7 On‐bill Financing OBF is increasingly being used as an important tool for utilities to help customers afford the cost of making energy efficiency improvements. While early versions of OBF were not very attractive to utilities, improvements have been made that now address typical utility concerns. Municipal and cooperative utilities are voluntarily adopting OBF at an increasing rate. In fact, three of the five sample financing programs presented in this report involve voluntary OBF programs: Electric Cooperatives of South Carolina (ECSC), Midwest Energy in Kansas, and Manitoba Hydro, plus a program mentioned in the ECSC write‐up that involves four cooperatives in Eastern Kentucky. OBF offers two advantages over most other financing models: it works for tenant‐occupied properties; and the tariff form of OBF offers customers off‐balance sheet financing that doesn’t add to debt. For tenant‐occupied properties where the tenant pays the utility bills, a common barrier for utility energy efficiency programs is known as “split incentives.” In these situations, the landlord has little incentive to pay for energy improvements, since the tenant would be the one to benefit from the savings on the utility bill. Conversely, tenants are normally reluctant to pay for improvements to a property they do not own. OBF addresses this obstacle by putting both the savings and the monthly financing payments on the same bill, with the net result being a lower utility bill overall. OBF is the only financing model that solves this problem. Another common obstacle to financing is that businesses and homeowners are often reluctant to take on debt for non‐essential purposes. Especially in the current economic environment, they may prefer to preserve their borrowing capacity for unforeseen problems or competing needs that are more important. The tariff form of OBF addresses these concerns by tying the repayment obligation to the utility account instead of to the customer. A tariff is not considered a loan; it stays with the property and is transferred to the next customer if the current customer moves. Tariffs do not show up on the customer’s financial balance sheet, do not in most programs create a lien on the property, and do not reduce the customer’s ability to borrow. It also does not have to compete with other company priorities for capital budget dollars, which can be a significant advantage for utilities. A Best Practices Guide for Energy Efficiency in Municipally‐Owned Services Areas 122 | P a g e Table 33. On‐bill Financing Program On‐bill Financing Program Program description Financing programs help customers make energy improvements by removing the obstacle of upfront costs. The energy cost savings from the improvements are used to pay off the financing over time. OBF programs use the utility bill as the vehicle for repaying the loan. The utility’s role beyond managing the program can vary from providing capital and originating loans to simply serving as the repayment vehicle. OBF programs are generally used to target deeper retrofits. If the loan form of OBF is selected (as opposed to the tariff form), the challenge of complying with consumer lending laws may lead the program to, either avoid the residential sector or to use a third‐party lender to originate and service loans to the residential sector. OBF’s unique ability to solve the “split incentive” problem makes it the only good financing choice for the multifamily and small business sectors. Objectives Provide customers with opportunities to reduce their energy costs and increase their energy efficiency. Eliminate the obstacles to customers of the upfront cost of making energy efficiency improvements. Create a mechanism that helps address the split incentive barrier. Enable customers to pay for the improvements over time using the savings delivered by the improvements. Enable customers to pay for energy efficiency improvements without affecting their ability to borrow. Infrastructure and staffing Estimated utility staffing requirement: 1.0 FTE for management, trade ally support, evaluation, and other administrative functions. A Best Practices Guide for Energy Efficiency in Municipally‐Owned Services Areas 123 | P a g e On‐bill Financing Program Customer targets and eligibility OBF can target all sectors (residential, commercial, government, etc.), although it is best to choose one sector to focus on initially. While eligible measures can be prescriptive (e.g., air‐sealing, insulation, etc.), most OBF programs encourage deeper retrofits by requiring a comprehensive energy audit that identifies a package of recommended measures and includes an estimate of installation costs and energy savings. Project eligibility is generally based on whether the package will generate positive cash flow for the customer (i.e., they will on average save enough money to cover the monthly financing payments). Implementation Participants must own the property and pass a check of their utility bill payment history. Some programs, especially those that use third‐party lenders, also check the customer’s credit report and debt‐to‐income ratio. OBF can take a variety of forms. Many utilities engage outside expertise for help determining the best form to meet their specific situation and objectives. There are many different program design approaches utilities can take. Each MOU should explore available options and select the approach that best fits their operational capacity and program objectives. Design variables include: Sources of Capital: Utility – system benefits charge (SBC); operating or capital budget; borrowing; and bonds Third‐Party Lenders – local or regional banks or credit unions; and low‐interest community development financial institutions (CDFIs) such as nonprofit lenders and state and local housing and economic development authorities Government – local (fees, budget, revenue bonds); state (energy or development agencies); DOE and EPA grants; zero‐interest United States Department of Agriculture (USDA) Rural Economic Development Loans and Grants; Qualified Energy Conservation Bonds; Qualified Zone Academy Bonds for schools; and quasi‐governmental entities such as state and local housing and economic development authorities. A Best Practices Guide for Energy Efficiency in Municipally‐Owned Services Areas 124 | P a g e On‐bill Financing Program Security: the ability to disconnect service is typically the only security needed, although some programs may file a lien on the property or equipment in lieu of (or in addition to) a disconnect provision. Risk of Loan Defaults: may be borne by: a third party lender that makes the loans program participants (as a small fee or interest rate supplement that covers the few losses) all ratepayers, since all share in the benefits of avoiding the cost of building new generating capacity, creating installation jobs, and conserving resources (note that, when spread across an entire rate base, typical losses of 1% to 3% are quite minimal). Loan Origination and Servicing: provided by the utility, third‐party lender, or a third‐party program administrator Credit Enhancement: third‐party lenders may or may not be willing and able to lend on terms necessary for program success; the utility or another party (see Sources of Capital above) may need to provide an interest rate buy‐down or loan loss reserve in order to achieve the desired interest rate, length of loan, and credit requirements. Loan versus Tariff: loans may be easier to implement, but many businesses and homeowners are reluctant to use their limited borrowing capacity for non‐essential purposes; tariffs have the advantages of being off‐balance sheet and not adding to debt, and being transferable to a new owner or occupant if the property is transferred. Program barriers Utilities may not want to use their capital budget to make loans Mitigation Strategies Use other non‐utility capital (see Sources of Capital above) Assign the risk of loan defaults to parties other than the utility (see Risk of Loan Defaults above) A Best Practices Guide for Energy Efficiency in Municipally‐Owned Services Areas 125 | P a g e On‐bill Financing Program Assuming the risk of loan defaults may not be in a utility’s interest Assign partial payment to the energy bill first, then the financing payment and carry over the remainder Assigning partial bill payments Bear in mind that the total bill is less than before the loan; let low‐income energy assistance include the finance payment; take disconnect out of the utility’s hands (make it mandatory) Utilities may be reluctant to disconnect customers for failure to make the financing payment Use the OBF program to help justify upgrading old software to enable line‐item billing, perhaps including third‐party services that can help subsidize utility rates Billing software may not be able to handle the monthly finance charge Loans are an acceptable option, but tariffs offer significant advantages (see Loan Versus Tariff above) A tariff may not be easy to implement Use a third‐party lender or program administrator to originate and service the loans Loan origination and servicing may not be Focus on regional and local banks and credit unions, as well as CDFIs such as non‐profit lenders and state and local housing and economic development authorities of interest to utilities Lenders may not be interested in participating in the program Marketing and outreach Utilities often market OBF programs in tandem with their equipment rebate, audit, and direct installation, or other relevant programs – offering financing as an adjunct to traditional equipment rebates. Thus many of the same marketing and outreach strategies apply, including: Bill inserts Utility dedicated program web page Active trade ally outreach and support Newspaper, radio, and other mass media Brand marketing material with ENERGY STAR® Present program information at seminars, conferences, home shows, and community events A Best Practices Guide for Energy Efficiency in Municipally‐Owned Services Areas 126 | P a g e On‐bill Financing Program Outreach to and coordinated advertising with trade allies (i.e., equipment dealers, distributors, and installers) Coordinate marketing opportunities with key market partners (i.e., SECO, community groups) Publish and distribute program brochure Measures and incentive levels Cross‐promote through other programs Eligible measures are typically quite broad. The primary requirement is that a package of measures must generate positive cash flow over the length of the loan. Loan length is usually limited to the average useful life of the measures being financed. Typical energy efficiency measures such as air sealing, insulation, and HVAC equipment are almost always eligible, while renewable energy measures such as solar electric, solar thermal, and geothermal may or may not be included. Financing incentives typically take the form of: Low Interest Rates – normally in the range of 0% to 7%, depending on the source of capital and the availability of funds to buy down the rate. Long Loan Terms – often 2 to 3 years for small loans, and 5 to 10 or even 15 years for whole‐ building retrofits. Broad Eligibility – OBF programs often include good customers who might not qualify for traditional bank loans, especially since loan security seldom relies on the customer’s equity in the property (security is usually provided by a disconnect provision). Rebates and other incentives can be combined with the financing program, and are sometimes offered as an “either/or” choice. AE’s “Best Offer Ever,” indicates that the combined approach is far more attractive to customers than the either/or approach. Financing incentives may be tiered to help motivate customers to make deeper retrofits. Budgeting rules of thumb Because OBF programs are offered in conjunction with other programs (such as equipment rebate programs), the cost of energy savings is based on the installed equipment. A Best Practices Guide for Energy Efficiency in Municipally‐Owned Services Areas 127 | P a g e On‐bill Financing Program Costs for marketing, incentives, and EM&V are born under the companion program. Program costs typically include labor for approximately 1.0 FTE for program set up, plus 0.2 FTE for ongoing program administration. Benefits Cost of capital depends on capital source. Capital provided internally is equal to the utility’s cost of capital. Capital from external sources can vary from 2% to 3% from a CDFI to 7% to 8% from a commercial bank. Helps customers afford energy efficiency improvements by removing upfront costs and allowing payment over time with low interest rates Customers often see net reduction in monthly energy bills Offers a mechanism to overcome the split incentive barrier Enables customers to improve energy efficiency without increasing debt Can take a variety of forms for implementation Measuring savings Best practices and innovations Opportunity for partnership with contractors, installers, and community organizations Energy savings are typically calculated through the energy audit. Many programs include an inspection and/or test‐out of the installed improvements, although this is determined more by the overall retrofit program than by the financing program itself. Team with lenders to leverage their experience in financing home improvements. Be familiar with the benefits to lenders of participating in the program, as described in Lawrence Berkeley National Laboratory’s Policy Brief on AE’s loan program. Use low‐interest financing as a high‐leverage tool (the cost of subsidizing the interest rate is a small fraction of the cost of the improvements). Train trade allies, such as installers, to point customers to the OBF program, as a highly motivated sales channel. Use a network of trained and qualified contractors to help assure quality workmanship. A Best Practices Guide for Energy Efficiency in Municipally‐Owned Services Areas 128 | P a g e On‐bill Financing Program Partner with cities and community‐based organizations to help expand participation. Target rental properties: use OBF to solve the “split incentive” problem associated with tenant‐occupied properties. Use the tariff form of OBF (as opposed to the loan form) to offer customers off‐balance sheet financing that is not considered debt and can be transferred to a new customer if the current customer moves. Collaborate with other utilities to achieve economies of scale and a stronger program. Approve loans quickly to meet the needs of a reactive market (i.e., customers who must immediately replace equipment, such as a furnace that fails in mid‐winter). Develop a comprehensive marketing program tied to appropriate companion programs. Design a quick and easy process that eliminates the hassles of getting an audit, obtaining a loan, and making improvements. A Best Practices Guide for Energy Efficiency in Municipally‐Owned Services Areas 129 | P a g e 5.1.1.8 Residential Demand Response DR programs are designed specifically to help utilities control energy demand during peak periods. Although few of the MOUs interviewed for this study indicated that demand constraints were a current issue, the ACEEE potential study indicated supply scarcity was a near‐term concern. Residential DR programs can be subdivided into two categories: DLC and pricing programs. DLC programs primarily target customers who have working central A/Cs or heat pumps. Electric water heaters and pool pumps can also be considered for participation as long as they are in good working order and compatible with the MOU control technology. DLC program participants’ A/Cs are equipped with a device that is capable of reducing the energy use of the equipment during peak demand periods when it receives an event signal from the utility. These devices simply interrupt the “on” signal of the unit to reduce the amount of time it operates. Newer DLC programs often utilize smart thermostats that similarly reduce the use of connected equipment when they receive event signals. Pricing programs typically target the same customers, but their methodology varies slightly. Instead of simply sending signals to DLC devices, pricing programs vary the rate that customers pay for electricity. TOU rates are generally split into higher rates during peak demand periods and lower rates during off‐peak periods, but the rates are typically consistent from day to day. Dynamic pricing programs have the same intraday variation as TOU rates, but rates can also vary from day to day to address particularly high demand periods (when DLC events are typically called). Utilities normally offer customers a nominal incentive (often between $25 and $50 per summer season) in exchange for allowing them to cycle off their air conditioning systems during peak periods. Customers generally notice no difference in the comfort of their homes, so the program is a benefit to both the utility and the customer. Pricing programs use a pricing structure that incentivizes customers to shift their electric usage to off peak periods. Some pricing programs provide customers with enabling technologies, that alert them to varying pricing and/or control equipment per the customers’ preset specifications during peak demand periods. A Best Practices Guide for Energy Efficiency in Municipally‐Owned Services Areas 130 | P a g e Table 34. Residential Demand Response Program Residential Demand Response Program Program description The Residential DR program includes two potential components: a DLC program or a pricing program that utilities may implement based on their operational capabilities and infrastructure. The DLC component primarily targets customers who have working central A/Cs or heat pumps. Electric water heaters and pool pumps can also be considered for participation (as long as they are in good working order and compatible with the MOU control technology). DLC participants are equipped with a device that is capable of reducing the energy use of their equipment during peak demand periods when they receive an event signal from the utility. Either a DLC switch or a smart thermostat can be used as the control technology; both similarly reduce the use of connected equipment when they receive event signals. Objectives The pricing program component assigns different rate structures to electricity consumed during different times of the day and/or different days during the peak season. Higher rates are charged during peak periods and lower rates are applied during off‐peak periods. Enabling technologies such as smart thermostats, in‐home displays (IHDs), or direct load control receivers (LCRs) may be installed in the customer’s home. Customers manage their energy use so as to incur the lowest prices. Reduce peak demand and alleviate strain on the electric system during peak periods. Provide incentives to customers willing to reduce their energy consumption during summer peak hours, or offer customers lower electric rates when they use equipment during off‐peak times. Educate customers about peak load reduction and energy efficiency. Infrastructure and staffing Estimated utility staffing requirement: 1 FTE for internal program management or 0.25 to 0.5 FTE for management of a third‐party implementer. If the program is implemented with internal utility staff, additional staff will be required to install switches at customer sites. Additionally, the utility will be required to purchase DLC devices for installation on customer air conditioning systems. A Best Practices Guide for Energy Efficiency in Municipally‐Owned Services Areas 131 | P a g e Residential Demand Response Program Third‐party implementers offer customizable DR options that can range from complete turnkey programs to only providing technology, or any combination in between. Customer targets and eligibility This program primarily targets residential customers, but small commercial customers with compatible central air conditioning systems, heat pumps, water heaters, window A/Cs, and pool pumps, could also be eligible. The program can be offered for both existing and new construction. If the participant resides in rental property he or she must obtain the owner’s approval to participate. Implementation The utility may either implement the program internally or select an experienced DR contractor with national presence, to provide turnkey program services. The implementer or MOU provides comprehensive services including: Marketing Customer recruitment and troubleshooting Installing control devices on eligible customer equipment, processing applications, tracking program data; paying incentives to customers Documenting customer and transaction information Key steps in program participation include: MOU/implementer markets to, enrolls, and contracts with new participants. MOU/implementer schedules customer visits to install DR equipment (if utilized). MOU/implementer verifies customer and appliance eligibility. MOU/implementer provides customer educational materials about the program and ways to manage energy use and peak demand. MOU/implementer controls units or sends pricing signals during specified peak periods to provide firm load reductions. A Best Practices Guide for Energy Efficiency in Municipally‐Owned Services Areas 132 | P a g e Residential Demand Response Program MOU/implementer tracks customer data, appliances, and outcomes throughout process. Program barriers Customers do not understand the program. Ability to maintain comfort levels with air conditioning cycling. AMI infrastructure compatibility. Customers override control devices. Marketing and outreach MOU/implementer processes and delivers customer incentives. Mitigation Strategies Design a robust marketing strategy. General customer education and awareness. Use proven technologies and cycling strategies that prevent large temperature swings. Ensure MOU/implementer fully understands the AMI system. Limit customer access to controls. Utility program staff coordinates with internal marketing and communications departments and the implementation contractor to ensure program materials are consistent with utility branding and advertising protocols. External marketing is led by the implementation contractor. The marketing strategy may include: Direct mail Bill inserts Utility dedicated program web page Newspaper, radio, and other mass media Present program information at seminars, conferences, and community events Coordinate advertising opportunities with trade allies Distribute program brochures to community organizations, such as Chambers of Commerce A Best Practices Guide for Energy Efficiency in Municipally‐Owned Services Areas 133 | P a g e Residential Demand Response Program Measures and incentive levels For the DLC component, an LCR or smart thermostat is installed on control equipment by the implementer/MOU at no cost to the customer. Customers participating for the entire peak summer period receive an end‐of‐summer incentive of $25 to $50 for participation (to be determined by the MOU/implementer). A customer with more than one appliance may be eligible for multiple incentives. Incentives for partial summer participation may be prorated. For pricing programs, enabling technologies such as smart thermostats, IHDs, or LCRs may be installed at no cost to the customer. Customer incentives vary depending on their electric usage. Customers that provide higher levels of demand savings will typically earn greater incentives than customers with low demand reduction. Customers with high on‐peak consumption may pay more than they would have if they hadn’t participated in the program. Budgeting rules of thumb Estimated dollars spent per annual gross kWh saved: $135/kW but will range depending on the ramp‐up of the program because of initial equipment costs Estimated program costs as a percentage of total program budget: Benefits Administration (internal): 10% Third‐party contractors, trade ally, and technical costs: 30% Marketing and advertising: 10% Incentives: 50% EM&V: 3% to 5% Provides opportunity to control energy demand during peak periods History of market acceptance and successful implementation Benefits both customer and utility Provides opportunity to educate customers on energy management strategies A Best Practices Guide for Energy Efficiency in Municipally‐Owned Services Areas 134 | P a g e Residential Demand Response Program Measuring savings Actual impacts of the DR program will be verified using a statistical comparison of hourly load shapes of program participants between events and a reference (baseline) day. Hourly interval meter readings will be the primary data used in this analysis. These data may be augmented by information on the dwelling unit and household demographics to develop a better understanding of factors affecting demand savings. Best practices and innovations As MOUs traditionally have high levels of customer satisfaction and very trusting customers, it is valuable to clearly outline the program to provide detailed program materials that explain the program, why it is necessary, and what the alternatives are (higher rates, building more power plants, etc.). Materials should offer tips for managing peak demand voluntarily (e.g., doing laundry at night) to each new participant in the DR program. Utilities should also use this opportunity to provide materials on other energy efficiency program opportunities. Encourage customers to bundle similar programs to gain multiple benefits. Adopt a regular schedule to test appliance cycling switches in the service territory and replace any that are missing or not functioning. Offer a large enough incentive to gain customers’ interest; continue to provide incentive each year the customer participates. Conduct customer satisfaction surveys to gather information on program barriers and bottlenecks and solicit feedback from customers. Provide annual feedback to customers on the system‐wide program benefits and thank them for making a difference. For pricing programs, develop rate structures with significant differences between peak and off‐peak rates so as to provide high motivation for load shifting. A Best Practices Guide for Energy Efficiency in Municipally‐Owned Services Areas 135 | P a g e Residential Demand Response Program Advanced metering infrastructure (AMI) / smart grid implications for DR An AMI system can be used to transmit the event signals to DR devices An AMI system can be used to verify that DLC devices are operational. Smart thermostats are typically used when an AMI system is available, as they provide the participant with enhanced functionality such as the ability to override an event on the device and near‐real time data on energy consumption. DLC can be marketed as a “Smart Home” feature of the smart grid. AMI systems make evaluation of the program less costly and improve validity as larger sample sizes are available due to the presence of smart meters. A Best Practices Guide for Energy Efficiency in Municipally‐Owned Services Areas 136 | P a g e 5.1.2 Commercial Program Concepts The Project Team’s analysis showed that, in aggregate, the C&I sectors combined represent only 16 percent of MOUs’ customers; however, this sector consumes 54 percent of the total electricity sold. According to the ACEEE study16 of Texas’ energy efficiency potential, existing commercial buildings offer significant energy savings opportunities, particularly through energy‐efficient lighting, HVAC equipment and systems, high‐efficiency refrigeration, and water heating equipment and systems. Commercial lighting accounts for about 43 percent of all electricity consumption in Texas, representing the largest commercial end‐use consumer of electricity. ACEEE identified several technologies that could increase the efficiency of these systems, including fluorescent lighting improvements, replacing incandescent lamps with CFLs, daylight dimming systems, and others. These measures offer energy savings potential on the order of 22,552 GWh or nearly 35 percent energy savings. ACEEE also found significant energy savings potential from a combination of building shell upgrades and HVAC equipment to address HVAC electricity consumption. Less prominent, but still attractive savings opportunities are available through commercial refrigeration and high‐ efficiency office equipment upgrades. Together these savings make up another 29 percent of energy efficiency potential. The Project Team’s assessment found that Texas MOUs’ perceptions of potential are consistent with ACEEE’s findings. Of the MOUs interviewed for the study, 90 percent of respondents indicated moderate to significant opportunities to gain energy savings through commercial lighting and HVAC upgrades, and 80 percent indicated that building shell upgrades were a moderate to significant opportunity. These were the highest‐rated measures for potential energy savings by MOUs. In the industrial sector, the ACEEE potential study diverged slightly from the MOU representatives’ perceptions of energy savings opportunities. While ACEEE’s study estimates the economic efficiency resource potential among Texas’ large industrial users at 26 percent, among the MOUs evaluated for this study, industrial energy use represents about 15 percent of total electricity sold and very few MOUs offer energy efficiency programs for the industrial sector since most MOUs have few or no industrial customers. Given these findings, the Project Team’s recommendations for the C&I sectors largely focus on lighting and HVAC measures for smaller commercial customers, but they include offerings that may be implemented by any commercial or industrial customer. One program, a custom program, is targeted strictly to larger C&I customers. 5.1.2.1 Commercial Prescriptive Rebate Program Prescriptive rebate programs are among the most straightforward to implement, so they offer a good entry‐level program option. From a utility perspective, prescriptive rebate programs can be delivered with minimal staff commitments, and utilities need not contract with a third‐party implementation firm. Utilities generally have good relationships with their commercial ACEEE: Potential for Energy Efficiency, Demand Response, and Onsite Renewable Energy to Meet Texas’s Growing Electricity Needs. March 2007. Report number E073. 16 A Best Practices Guide for Energy Efficiency in Municipally‐Owned Services Areas 137 | P a g e customers, so being in a position to offer valuable energy solutions that can reduce operating expenses can further enhance their relationships with business customers. From a commercial customer’s perspective, prescriptive rebates can be a very compelling option if the program is easy to understand, implementing the required measures is straightforward, and the application process is relatively simple. These are absolutely critical components of commercial rebate programs. Because business owners are generally stretched thin in terms of both capital and time, commercial programs need to offer robust enough incentives to get customers’ attention and a simple enough participation process that the customer sees the project through to fruition. Utilities have amassed a significant amount of energy efficiency program experience and lessons learned from commercial sector program implementation efforts. Successful programs in this market have three essential ingredients: simplicity, robust marketing and outreach, and an engaged trade ally network. Based on the Project Team’s research of local market conditions and energy saving potential, the following program concept includes those commercial measures that scored highest in the interview results analysis: lighting, HVAC equipment, and building shell measures. A Best Practices Guide for Energy Efficiency in Municipally‐Owned Services Areas 138 | P a g e Table 35. Commercial Prescriptive Rebate Program Commercial Prescriptive Rebate Program Program description The program promotes the purchase and installation of high‐efficiency equipment by C&I customers in both existing and new facilities. It offers incentives to offset the higher purchase cost of energy‐efficient equipment including lighting; HVAC equipment; building shell measures such as insulation, air sealing, and duct sealing; and motors and drives. The program provides a financial incentive in the form of a prescriptive rebate on a per‐unit basis to customers installing qualifying equipment and technologies. Rebates are a fixed amount per device, paid by check to customers who complete a rebate application and submit documentation of the equipment purchase. When implemented as part of a commercial program portfolio, the equipment rebate program is a critical implementation vehicle for installing measures recommended in commercial energy audits or new construction assistance processes. The program is delivered with support from a network of trade allies who specify, sell, and install qualified equipment. Additionally, program and technical support is provided by the utility or a program contractor. Objectives Provide customers with opportunities to reduce their energy costs and increase their energy efficiency. Encourage customers to install high‐efficiency lighting, HVAC equipment, and building shell efficiency measures. Encourage the use of high‐efficiency/ENERGY STAR®‐rated equipment where appropriate. Promote other energy efficiency programs. Infrastructure and staffing Estimated utility staffing requirement: 1 FTE for management, marketing, trade ally interaction, evaluation, and other administrative functions. An additional 0.5 FTE or a third‐party contractor is recommended to provide technical and program support as well as quality assurance/quality control (QA/QC) functions. A Best Practices Guide for Energy Efficiency in Municipally‐Owned Services Areas 139 | P a g e Commercial Prescriptive Rebate Program Customer targets and eligibility Implementation This program is available to all C&I customers; however the primary program target is small to mid‐sized commercial customers. To be as cost‐effective as possible, the program should target customers seeking to replace older, inefficient equipment, or building new commercial facilities. Participant eligibility is verified through customer rebate applications cross‐referenced against customer account numbers. Customers must submit a program application with documentation of the equipment replaced (if applicable), new equipment purchased, and installation(s) for verification. Equipment rebate programs are relatively simple to implement and administer and can be managed and delivered with in‐house staff. Key steps in program implementation include: Marketing and outreach, including to trade allies. Provide call center services to respond to customer questions and provide technical and program support. Verify customer eligibility and ensure that selected equipment meets program qualifications. Process applications and rebates. Review documentation to verify the applicant is an active customer and the installed equipment meets the minimum efficiency standard. Track program data. Process rebate checks for qualified equipment. Verify equipment/appliance installation for a sample of participants. Customer participation involves: Customers installing eligible high‐efficiency equipment schedule the work directly with their equipment dealer or installation contractor. Work with the equipment installation contractor to fill out program applications and ensure the required documentation is submitted to the utility for processing. A Best Practices Guide for Energy Efficiency in Municipally‐Owned Services Areas 140 | P a g e Commercial Prescriptive Rebate Program Program barriers Higher first cost of energy‐efficient equipment and economic environment limit customer’s ability to purchase energy‐efficient equipment. Customers unaware of the program or benefits of high efficiency upgrades in their facilities. Customers needing emergency replacement may not know about the program. Customers don’t have the time to commit to large projects. Marketing and outreach Mitigation Strategies Offer rebates to offset higher incremental cost. Educate customers on the long‐term energy cost‐saving benefits of higher efficiency equipment. Market program and general efficiency awareness to customers. Provide trade ally training and outreach to explain the benefits of selling higher efficiency equipment. Promote efficiency awareness to customers and trade allies. Use a simple participation, application, and verification process. This program relies primarily on equipment dealers that sell qualifying measures to market the program. Dealers promote the program, help customers understand the features and benefits of qualifying equipment, specify and install equipment, and help customers fill out program applications. A high level of trade ally participation and program promotion are critical to ensure program success. Thus, program marketing should target trade allies in addition to customers, to encourage their participation. The following types of trade allies are predominant: HVAC equipment distributors, dealers, and service providers Plumbing and mechanical contractors Lighting distributors and dealers Electrical contractors Motor and variable‐speed drive distributors and dealers Insulation installers Engineering firms Architects The program messaging focuses on the features and benefits of energy‐efficient equipment. A Best Practices Guide for Energy Efficiency in Municipally‐Owned Services Areas 141 | P a g e Commercial Prescriptive Rebate Program The marketing strategy for the program may include: Active trade ally outreach and support Bill inserts Utility dedicated program web page Newspaper, radio, and other mass media Present program information at seminars, conferences, home shows, trade shows, and community events Outreach to and coordinated advertising with trade allies (i.e., equipment dealers, distributors, and installers) Coordinate marketing opportunities with key market partners (i.e., SECO, community groups) Publish and distribute program brochure Cross‐promote through other programs Measures and incentive levels Commercial customers typically require an investment payback of 1.5 years or less. Program incentives may be set to roughly correspond to a 1.5‐year payback, or to cover approximately half of the installed cost of the measure, but may be adjusted as needed to stimulate the market or scale back program uptake. The following measures and incentive levels are provided as examples. Utilities should select measures and set incentives at levels appropriate for their own customer bases, budgets, and program strategies. Measure Cooling Tower‐Decrease Approach Temp. Cooling Tower‐Two‐Speed Fan Motor Pipe Insulation Water‐Cooled Chiller, Screw Chiler A Best Practices Guide for Energy Efficiency in Municipally‐Owned Services Areas Eligibility Rating Incentive Chiller tonnage > 100 tons $8/ton Replace one–speed fan motor ≥ R‐4 High‐Efficiency /ton 0.2 $1/ton $1.60/linar foot $7/ton 142 | P a g e Commercial Prescriptive Rebate Program Water‐Cooled Chiller, Screw Chiller Programmable Thermostat Heat Pump ‐ Air Source Heat Pump ‐ Air Source Premium Efficiency kW/ton = 0.574 11.0 energy efficiency ratio (EER) 11.5 EER 2.0 EER 17 ENERGY STAR® EER=11.0, COP=3.5 EER=11.8, COP=3.8 Motors Premium Efficiency High Efficiency Fixture/Design 15% Lighting Power Density (LPD) Reduction Improved Exterior Lighting Design Full Cut Off Fixtures and Photometric Analysis Direct Expansion (DX) Packaged Air Conditioner System CFL CFL Pin‐Base Fixtures Daylighting Controls LED Exit Lighting Occupancy Sensors Time Clocks and Timers High‐Pressure Sodium Pulse Start Metal Halide ‐ Exterior De‐lamp and Install Reflectors Fluorescent High Bay Fixtures Lighting Package T8 Lighting Package ENERGY STAR® ENERGY STAR® Dimming‐Continuous, Fluorescent Fixtures 5 W Wall or Ceiling‐mounted Lighting Sensor Not applicable (N/A) 70 W (Exterior) <320 W >320 W Remove 1 or more lamps to equal 2‐ Lamp 4 ft. T8 + New Reflector High Bay Lighting ‐ T5HO (4 Lamps, 240 W per fixture) High Bay Lighting ‐ T8HO (6 Lamps, [240 W] estimated per fixture) 4 ft. T8 2‐Lamp Fixture (lamp & ballast) $10/ton 55/ton 80/to $105/ton $55/unit $75/ton $160/ton 50% of incremental installed cost 50% of incremental installed cost up to $10,000 50% of incremental installed cost up to $10,000 $1.70 $30 $35/controlled fixture $15/unit $45/sensor $100/unit $40 $25 $50 $50/fixture $18/lamp $14/lamp $14/fixture 17 ENERGY STAR will discontinue rating programmable thermostats after 12/31/2009. PPL Electric will determine appropriate equipment qualification guidelines when this occurs. A Best Practices Guide for Energy Efficiency in Municipally‐Owned Services Areas 143 | P a g e Commercial Prescriptive Rebate Program Variable Speed Drives Ceiling Insulation Wall Insulation Budgeting rules of thumb 4 ft. T8 3‐Lamp Fixture (lamp & ballast) 4 ft. T8 4‐Lamp Fixture (lamp & ballast) 8 ft. T8 2‐Lamp Fixture (lamp & ballast) Variable Frequency Drives (VFDs) with motor horsepower (HP) >5 and ≤0 Above code requireent Above code requirement $30/HP 70% of installedost 70% of installed cost Estimated dollars spent per annual gross kWh saved: $0.15/kWh Estimated program costs as a percent of total program budget Benefits Administration (internal): 10% Third‐party contractors: 3% Marketing, advertising, trade ally training and outreach: 10% Incentives: 80% to 85% EM&V: between 1% and 3% Straightforward to implement and simple for customers to participate in Potential for significant energy savings Low delivery cost and high cost‐effectiveness Minimal staff requirements with no third‐party contracts necessary Opportunity to enhance utility relationship with business customers Provides opportunities for business customers to reduce energy costs while increasing energy efficiency and improving their building’s comfort for employees Provides C&I customers opportunities to replace inefficient equipment at a lower out of pocket cost Opportunity to engage a robust trade ally network A Best Practices Guide for Energy Efficiency in Municipally‐Owned Services Areas 144 | P a g e Commercial Prescriptive Rebate Program Measuring savings This program targets common end uses such as lighting and HVAC. The impact evaluation will therefore be measure‐specific and may include pre‐ and post‐installation inspections. Verification of savings will be based on a sample‐based validation of installations and operating conditions. For lighting measures, the analysis will be based primarily on engineering validation and will have three components: verification of installation (measure count), calculation of savings (wattage differential), and verification of full‐load hours. Run‐time is a key parameter in calculation of savings from lighting retrofits. The impact evaluation should include verification of operating hours using light loggers on a sample of installations. The number of points to be monitored will be based on a sample stratified to represent functional areas and variability of savings within each functional area using a 90/10 confidence criterion. HVAC savings may be validated using engineering calculations, calibrated with site‐specific data, including climate conditions, and selective interval recording of key parameters, such as run‐time. Data necessary for verification savings in this program will consist of the following: Best practices and innovations Engineering estimates of savings for each measure installed under the program, according to technical studies; Facility characteristics; Daily weather data from local weather stations to calculate heating degree days and cooling degree days; and Status and interval data for key equipment parameters. Limit the program to a small number of measures to begin with, then expand as the utility and customers become more comfortable with the program implementation, documentation, and verification processes. Build and maintain strong communication channels with trade allies. A Best Practices Guide for Energy Efficiency in Municipally‐Owned Services Areas 145 | P a g e Commercial Prescriptive Rebate Program Create a formal trade ally network and verify trade ally participants’ qualifications by requiring certifications, number of years of experience, insurance, background checks, etc. Conduct regular quality checks on all participating trade ally installations. Decrease the number of site inspections as a trade ally proves its capabilities. Allow trade allies to submit rebate applications on behalf of customers. Use simple rebate forms and program rules. Provide ongoing, active education and outreach to customers about the benefits and features of energy‐efficient equipment. Couple equipment incentives with low‐cost financing. Create program ties with other commercial offerings to provide interested customers with a comprehensive package of services. Conduct program and quality installation training for all participating trade allies. Coordinate eligible measures and incentives among regional MOUs and/or create regional partnerships to ensure continuity, enhance program reach, and reduce customer confusion. Maintain flexibility to allow program managers to make program changes to address problems as they arise, but ensure that all stakeholders are given notice of program changes and ample time to respond. Offer free technical and program assistance to customers and trade allies (e.g., through a program “hotline”). Perform process evaluations to gain insights and feedback on the program’s effectiveness and inform future program enhancements. A Best Practices Guide for Energy Efficiency in Municipally‐Owned Services Areas 146 | P a g e 5.1.2.2 Small Commercial Audit and Direct Installation Marketing energy efficiency to small businesses is notoriously difficult, and persuading them to make energy efficiency upgrades is even more challenging. Across the United States, utilities struggle with this sector more than any other sector. Market barriers are well known, with the greatest being 1) lack of capital, 2) lack of control over the building facilities (business doesn’t always own the space), and 3) lack of time on the part of decision makers. Commercial customers with small facilities are very busy with business priorities, they have constrained budgets, do not have easy access to program information, and may not participate in energy efficiency programs due to language (i.e., primarily non‐English), business size (less than ten employees); or geographic (i.e., outside major metropolitan areas) constraints. Customers in this sector have limited knowledge about energy efficiency and may not trust that energy savings estimates will be realized in actual savings; or they may hesitate to dedicate scarce capital resources for future savings that they consider uncertain. In addition, because of the small scale of most projects, fixed transaction costs are higher so energy service companies (ESCOs) and other commercial vendors are often reluctant to address this market. Finally, a large percentage of smaller commercial customers occupy leased space, so the split incentive barrier is a common issue in this market. Not surprising, given the historical difficulty of reaching small commercial customers, this sector offers significant energy efficiency potential. Few small commercial customers have invested in energy efficiency upgrades; most are unlikely to do so in the absence of incentive programs. To attract customers, efficiency upgrades must be seen as an equally good or better investment than core business improvements, typically with a 1.5 year payback or better. To attract this market, utilities must offer programs that are not only financially attractive, but also minimize customers’ direct involvement, provide clear information, and are simple from start to finish. The most successful programs address small commercial market barriers by offering turnkey solutions and providing rebates that pay a significant percentage of project installed costs. The top small business efficiency programs rely on either turnkey delivery by an experienced implementation contractor or an active trade ally program that offers specific benefits to contractor networks to promote services and bring in customers. Many utilities approach their small commercial audit and direct installation programs as an opportunity to connect with customers, install a few energy savings measures, and look for opportunities to sell customers on larger upgrades. Those programs that generate the largest amount of energy savings use a comprehensive, whole building approach whereby bundled energy efficiency measures benefit from more robust incentives. Ideally, the small commercial audit and direct installation program offers a set of larger efficiency measure incentives or is tied to a prescriptive program that can be leveraged for installation of a package of upgrades. The program concept provided here is designed to be delivered by a third party implementation contractor that specializes in small commercial programs and offered alongside a commercial prescriptive rebate program so that auditors can offer an attractive, turnkey upgrade package that leverages substantial incentive dollars. If MOUs opt not to offer commercial prescriptive rebates, but still wish to offer a small commercial energy audit program, the Project Team recommends they incorporate lighting, HVAC, and building shell upgrade measures into the overall program offering. A Best Practices Guide for Energy Efficiency in Municipally‐Owned Services Areas 147 | P a g e Table 36. Small Commercial Audit and Direct Installation Program Small Commercial Audit and Direct Installation Program Program description This program is designed to provide small commercial customers with information on their buildings’ energy performance, direct installation of low‐cost energy‐efficient measures, and recommendations on energy efficiency actions they can take to reduce their energy consumption. Recognizing the barriers inherent in small commercial energy efficiency programs, the cost of the audit should be either free to customers or sufficiently subsidized by the utility so that customers’ cash outlay is minimal. Customers who install a package of recommended energy efficiency upgrades in their buildings will be reimbursed the cost of the audit and will be eligible for rebates for the installed equipment that increase with each subsequent installed measure. Small commercial energy audits include a thorough visual inspection and diagnostic testing of the facility to evaluate major energy‐using equipment (lighting systems, HVAC, refrigeration, etc.), building envelope characteristics, and to identify areas for cost‐effective energy efficiency upgrades. The auditor will review energy usage and cost patterns in historic energy bills, install simple energy efficiency measures, may tune‐up space conditioning systems (i.e., residential type AC systems or packaged rooftop units) and provide customers with an audit report that includes recommendations for appropriate follow‐up activities. Following the technical audit, the energy auditor presents the customer with a comprehensive energy efficiency package of measures that includes a detailed financial proposition and incorporates the full range of available utility incentives. To encourage customers to follow‐through on recommendations and implement recommended efficiency upgrades, the auditor should be able to generate a formal work order that triggers installation of the package of upgrades. Participants who agree to implement the full upgrade package will be reimbursed for the full cost of the audit, each qualifying measure, and provided with a bonus incentive for implementing each successive measure. A Best Practices Guide for Energy Efficiency in Municipally‐Owned Services Areas 148 | P a g e Small Commercial Audit and Direct Installation Program Objectives Provide customers with information about their facilities’ energy use and opportunities to save energy. Provide customers with opportunities to reduce their operational costs and improve the value of their building through energy efficiency upgrades. Provide customers with opportunities to increase the comfort of their buildings, which can result in higher staff productivity. Promote installation of low‐cost energy saving measures, which may result in immediate savings. Provide trustworthy energy savings recommendations from trained energy auditors. Promote other energy efficiency programs. Infrastructure and staffing Estimated utility staffing requirement: 0.5 FTE for management, marketing, trade ally support, evaluation, and other administrative functions. This program assumes a third‐party contractors will provide turnkey program delivery, including customer energy audits. The third‐party contractor will be expected to offer a full range of diagnostic testing equipment to support the program, as well as commercial modeling software, run on a tablet computer for on‐site data collection. Customer targets and eligibility This program targets small commercial customers in existing commercial buildings. The program uses building size (recommended: less than 25,000 square feet) and rate classes (those used by smaller business customers) to target and qualify customers. The utility should identify target customers by analyzing the Customer Information System and prioritize them by geography, energy intensity, or business type (North American Industry Classification System (NAICS) Code). A Best Practices Guide for Energy Efficiency in Municipally‐Owned Services Areas 149 | P a g e Small Commercial Audit and Direct Installation Program Implementation Utility staff will solicit bids from professional implementation contractors with specific expertise delivering programs to small commercial customers. The selected delivery contractor should be guided by a contract that includes detailed performance expectations with incentives and/or penalties associated with performance metrics. Once a delivery contractor is selected, utility staff will provide overall strategic direction and manage the contractor, work with them to develop marketing and program materials, provide QA/QC and oversight, track progress against goals, oversee evaluation, and provide other administrative functions. The implementation contractor provides turnkey customer delivery of the program including: marketing and outreach to target customers, managing customer intake, verifying customer eligibility, scheduling audits, conducting audits, directly installing measures, analyzing efficiency savings opportunities, working with customers to implement recommended measure packages, processing applications and rebates, tracking and verifying program data. Key steps in program participation include: The implementation contractor will conduct direct outreach to potential customers, explain the program, verify the customer’s eligibility, and schedule an appointment. The energy auditor will conduct an audit of the customer’s facility, directly install simple energy efficiency measures, tune‐up space conditioning systems as appropriate, and inspect major energy‐using equipment and building envelope characteristics to identify areas for cost‐ effective efficiency upgrades. The auditor will identify a package of energy efficiency upgrades that qualify for financial incentives and offer a net payback of one year or less and review the measure package, available financial incentives, investment metrics, and installation process with the customer. Customers will receive an audit report with recommendations for appropriate energy efficiency upgrades and information on incentives available through the audit and other programs. If the customer opts to proceed with installation of the recommended measure package, the auditor will provide the customer with a written firm or estimated work order, as well as a rebate application and details for obtaining incentives. Energy auditors will provide a copy of the audit report to utility staff for tracking and reporting purposes. A Best Practices Guide for Energy Efficiency in Municipally‐Owned Services Areas 150 | P a g e Small Commercial Audit and Direct Installation Program If the customer commits to installing the recommended measure package, the implementation contractor schedules and conducts measure installation and helps the customer fill out all applicable program applications. The customer’s cost for installed measures is paid, minus incentives, directly to the implementation contractor at the time measures are installed. The implementation contractor submits reports monthly to the utility indicating all participating customers, measures installed, incentives provided and audit subsidies allocated. Program barriers Mitigation Strategies Economic environment limits customer’s Offer free on‐site energy audits and direct installation of measures for immediate savings; ability to purchase energy‐efficient provide rebates to offset higher incremental cost of energy‐efficient equipment. Educate equipment. customers on the long‐term cost‐saving benefits of higher‐efficiency equipment. Lack of customer program awareness Conduct targeted, active outreach to potential customers. Limited time, resources, and awareness on how to act on recommendations Provide ongoing follow‐ups and technical support to help customers move through the installation steps. Customers don’t trust energy‐savings calculations Provide free, independent, expert analysis and recommendations. Energy small part of overall operating costs Marketing and outreach Install free energy savings measures that generate immediate cost savings. Review case studies of actual projects with customers to show evidence of energy savings. Marketing for the program should be led by the implementation contractor that has experience marketing to this customer sector. Effective marketing to this sector requires that the delivery contractor be considered reliable, credible, and energy‐efficient. This program should leverage both traditional and grassroots social customer marketing for promotion, but be cognizant that direct, one‐on‐one outreach to this sector is essential for program success. The marketing tactics for the program may include: Door‐to‐door canvassing Presentations to targeted customers, trade associations and at seminars, and conferences A Best Practices Guide for Energy Efficiency in Municipally‐Owned Services Areas 151 | P a g e Small Commercial Audit and Direct Installation Program Measures and incentive levels Bill inserts Utility dedicated program web page Newspaper, radio, and other mass media advertising Publish and distribute program brochure Cross‐promote through other programs There should be no cost for audits and direct installation measures. Due to the significant and varying customer barriers to implementing programs in this sector, the utility should eliminate the cost barrier completely. The audit program is designed to tie directly to the utility’s commercial prescriptive rebate program. To encourage customers to implement a comprehensive package of measures, this program provides an additional incentive, above and beyond prescriptive incentives, for customers who install measures within a reasonable timeframe. The following incentive levels are provided as examples. Utilities should endeavor to set incentive amounts at a level appropriate for their own budgets and program strategies. Measure Incentive Energy audit Compact fluorescent lamps LED exit signs Free to customer when measure is recommended Occupancy sensors HVAC tune up Vending machine controls Electric water heater measures: Faucet aerator Free to customer (customer must have electric water heat High pressure rinse sprayers to qualify for water heater measures). Water heater pipe insulation Water heater setback Bonus Incentives 20% of installed cost added to prescriptive rebate for each recommended measure installed as part of a Ceiling and wall insulation A Best Practices Guide for Energy Efficiency in Municipally‐Owned Services Areas 152 | P a g e Small Commercial Audit and Direct Installation Program Budgeting rules of thumb comprehensive package. T5 and T8 lighting fixtures and lamps Efficient HVAC equipment Programmable thermostats Efficient electric water heaters Efficient motors Refrigerated vending machine controllers Variable speed drives Estimated dollars spent per annual gross kWh saved: $0.31/kWh Estimated program costs as a percent of total program budget: Benefits Administration (internal): 15% to 20% Third‐party contractors: 10% Marketing, advertising, trade ally training and outreach: 10% to 15% Incentives: 75% to 80% EM&V: between 1% and 3% Opportunities for significant and immediate energy savings Provides a mechanism to identify cost effective efficiency strategies and offset capital costs for customers Utilities provide direct benefits to customers, enhancing their relationships, and offers an entry point with HTR market Opportunities for customers to improve the value and comfort of their buildings Educate customers on their facilities energy use Eliminates cost barriers for customers to make energy efficiency improvements Opportunities for partnerships with other utilities or local incentive programs A Best Practices Guide for Energy Efficiency in Municipally‐Owned Services Areas 153 | P a g e Small Commercial Audit and Direct Installation Program Measuring savings Energy savings for this program will be calculated using information gathered during the energy audit, including energy consumption data and quantities of direct installation measures installed. To ensure data is adequate to conduct impact evaluations, collected information should include: Best practices and innovations Participant contact information, including name, address, and participation date. Essential structural attributes Building and business characteristics, including estimated equipment run times Types and quantities of measures installed Estimated savings Measure cost Interval daily electricity consumption Climate information to calculate heating and cooling degree information Additional savings resulting from measures installed through the prescriptive rebate program will be calculated using information from rebate applications for those measures Conduct an open, competitive solicitation to identify a skilled implementation contractor. Selection criteria should include previous experience and proven success delivering programs to small commercial customers. Be aware of customer communities dominated by non‐English speakers and develop marketing and program materials in multiple languages, where appropriate. The roles of sales representative and technical energy auditor should be rolled into one person. The auditor should be an articulate program representative who can walk customers through the process and address questions. Use mobile modeling software with pre‐loaded, approved, energy efficiency measures that include capabilities to recommend a measure package tailored for a specific business type, climate, or Standard Industrial Classification (SIC) code, and calculate their costs and benefits. Provide a concise, short audit report that shows estimated cost and savings (totaled and for each measure), incentives, and net customer benefits (in dollars and kWh). A Best Practices Guide for Energy Efficiency in Municipally‐Owned Services Areas 154 | P a g e Small Commercial Audit and Direct Installation Program Provide concise but thorough printed materials that explain the program process, rules, and value proposition in detail, and include colorful and intuitive graphics. Initial contact, audits, direct measure installation, and generation of all required documents (e.g., audit reports, contracts, work authorizations, and warranty statements) happen within a single visit. More extensive measure installation may be conducted in a second visit. Partner with other utility, state, or local incentive programs to present a unified program to customers. Use simple rebate forms and program rules. Solicit customer commitment to install recommended measures. Offer bonus incentives to encourage customers to install the full package of measures. Ensure the payback for the recommended measure package, including bonus incentives, equates to less than a one‐year payback. Consider offering a financing option with positive cash flow for customers who install the full recommended measure package. Provide simple, visually appealing energy audit reports that clearly articulate priority measures and estimated energy savings. Measure installation should be provided either by the implementation contractor or by a small network of pre‐selected (through an RFP/bid process). Scheduling and installing equipment should be seamless and automatic. In the case of pre‐selected contractors, prices should be fixed and under contract so that the auditor can provide firm pricing and work orders at the time of the audit. Conduct measure verification, savings measurement, and process evaluations for a random sample of participants. A Best Practices Guide for Energy Efficiency in Municipally‐Owned Services Areas 155 | P a g e 5.1.2.3 Commercial New Construction As commercial construction has slowed down dramatically in the current economic environment, the cost of running a whole building new construction program may not be a valuable use of limited resources. Several of the programs analyzed by the Project Team integrate the Advanced BuildingTM Guidelines as either, the basis or as a component of their commercial new construction programs. Using the Advanced BuildingTM Guidelines and related suite of tools and resources allow utilities to offer a turnkey program to commercial construction design teams for minimal program effort and expense. The Advanced BuildingTM Guidelines include prescriptive procedures, tools, and resources to help design teams create high‐performance buildings. The Core Performance Guide is the component that defines high performance in building envelopes, lighting, HVAC, power systems, and controls. Design teams that utilize the guide as a part of an integrated design process can create buildings that are up to 30 percent more energy‐efficient than model building standards using off‐the‐shelf strategies, without the expense of energy modeling. The Advanced BuildingTM Guidelines were developed by the New Buildings Institute (NBI). NBI is a nonprofit organization focused on transforming the market to include construction of more energy‐efficient commercial buildings. The suite of tools is a key part of its efforts. NBI encourages the use of its resources in energy efficiency programs through sponsorship opportunities. By becoming an NBI sponsor, utilities obtain access to additional administrative and technical tools and resources specifically designed to help them leverage the Guidelines. For an annual sponsorship an organization can take advantage of the following: Marketing and administration templates Monthly sponsor calls to discuss program challenges and share resources Technical support Program analysis tools Attendance at an annual sponsors’ conference Being a sponsor allows organizations to leverage the resources and recognition of a larger, international organization for a minimal cost. More information can be found at http://www.advancedbuildings.net and http://newbuildings.org. A Best Practices Guide for Energy Efficiency in Municipally‐Owned Services Areas 156 | P a g e Table 37. Commercial New Construction Program Commercial New Construction Program Program description This program is based on the nationally tested Guidelines: a national program created to raise the standards for energy efficiency in commercial construction in North America. The primary component of the Guidelines is the Core Performance Guide: a prescriptive, easy‐to‐follow guide to energy‐efficient lighting, HVAC, and insulation strategies. Used in conjunction with the tools and resources specifically designed to support the guide, design teams can create buildings that are 15‐ 30% more energy‐efficient than code, without the overhead of energy modeling. The program provides outreach, technical assistance, project verification, and program administration. In addition, the utility provides incentives upon completion of a building that meets the program’s performance requirements. When a participant commits to the program, the project design team meets with a program representative to review the program requirements and resources available. The program offers incentives on a per‐square‐foot basis for meeting the base building requirements and additional incentives for more aggressive energy efficiency measures. Objectives Infrastructure and staffing Estimated utility staffing requirement: 0.25 FTE for management, marketing, trade ally support, evaluation, and other administrative functions. Customer targets and eligibility Support the creation of energy‐efficient commercial buildings. Provide a cost‐effective program for both the program administration and participants. Additionally, third‐party technical assistance and verification contractors are needed to support the program. This program targets developers and architects of commercial buildings 20,000 to 100,000 square feet. New construction projects proposed for the program must be located within the utility’s territory and certify their intention to purchase electricity from the utility. Customer eligibility is verified when participants initially apply to the program. The building is verified for project compliance upon completion of construction. A Best Practices Guide for Energy Efficiency in Municipally‐Owned Services Areas 157 | P a g e Commercial New Construction Program Implementation An Advanced Building program can be managed and delivered through a combination of minimal in‐ house staff and outside technical support. Implementation includes: Promote program participation through industry events and trade allies. Educate program participants on the Advanced Building tools and resources. Provide program participants with design assistance. Participate in NBI sponsored support activities. Provide program information on the utility web site. Process and track program participation and incentives. Key steps in program participation include: The customer’s project team registers its project at the beginning of the design phase. Project team meets with a utility program representative to review the Guidelines and program processes. Design team meets with program technical assistance consultant to review the program’s technical requirements and the required energy efficiency features and establish a schedule for periodic follow‐up meetings based on the experience of the design team and the complexity and size of the project. Design team applies the Guidelines specifications and tools to the building design. Program technical advisor reviews plans and certifies that project meets Advanced Building Checklist and other program requirements. Project team submits incentive reservation indicating the anticipated energy efficiency measures to be implemented in the project. Post‐construction, on‐site verification is performed by a third‐party engineer. Project team submits final incentive paperwork. A Best Practices Guide for Energy Efficiency in Municipally‐Owned Services Areas 158 | P a g e Commercial New Construction Program Program barriers Mitigation Strategies Recruiting participants early in their design process. Outreach to trade allies, offer educational seminars to target market, and perform outreach at architectural and real estate development industry events. Owner’s resistance to increased upfront costs in building Provide incentives to offset the additional costs of meeting the Guidelines. Provide education on the increased resale value generated by buildings with lower operating costs. Provide marketing and promotion through tours, case studies, or web site recognition for qualifying projects. Marketing and outreach Outreach through educational programs, industry ally events (AIA), real estate development, or shopping mall industry organizations). Promote utility web site. Advertising in trade publications. Coordinate marketing opportunities with key market partners (i.e., SECO, community groups). Outreach to trade allies. Offer industry educational seminars. Promote program participants’ projects on the utility web site and industry events. Cross‐promote through other programs. Measures and incentive levels Incentives for this program include free technical assistance and a rebate to cover a portion of the additional cost of advanced building design and high efficiency equipment. Building incentives may be designed to use either an incentive $ /square foot option (with the value to be determined by the utility, based on the market) or a combination of prescriptive rebates with a lower $/square foot incentive, offered as a bonus for meeting the Guidelines design criteria. In the second option, prescriptive rebates are tied to the utility’s commercial equipment rebate program. A Best Practices Guide for Energy Efficiency in Municipally‐Owned Services Areas 159 | P a g e Commercial New Construction Program Projects must be verified for compliance with the Guidelines to receive the incentive $/square foot rebate. Budgeting rules of thumb If appropriate, total incentive can be capped to allow the utility to control total program costs. Estimated dollars spent per annual gross kWh saved: $0.23/kWh Estimated program costs as a percent of total program budget: Benefits Program administration (internal): 5% to 10% Marketing, advertising, trade ally outreach: 5% to 10% Rebates/Incentives: 70% Evaluation: 5% to 10% Supports transition to higher efficiency commercial building stock and creates long term energy savings Involvement from the early design stage ensures a whole building approach to efficiency Program can be managed with minimal in‐house staff Opportunity to educate commercial building owners on energy efficiency Potential for partnerships with trade allies and real estate professionals Promotional opportunities for participating buildings Measuring savings Best practices and innovations Calculation of energy savings is conducted during engineering verification of the completed building. Include incentives for targeted prescriptive measures. Provide training and education to the design community on NBI’s Advanced Building Guidelines and resources. Require design team to attend program training before being eligible to receive incentives. Provide technical assistance to support an integrated design process. A Best Practices Guide for Energy Efficiency in Municipally‐Owned Services Areas 160 | P a g e Commercial New Construction Program Provide technical and design assistance to support program participants. Promote participating buildings to the public through signage, tours, and recognition. Promote participating buildings to their target market through industry events, tours, and recognition. Leverage the Advanced Building Guidelines brand, marketing materials, and other resources to the greatest extent possible. Build strong communication channels with trade allies and real estate associations. Work with other MOUs to build economies of scale where possible (education, training, and marketing, where appropriate). A Best Practices Guide for Energy Efficiency in Municipally‐Owned Services Areas 161 | P a g e 5.1.2.4 Commercial and Industrial Custom Incentives Large C&I facilities are often characterized by complex systems, unique electrical processes, and significant demand. Many employ dedicated, knowledgeable facility engineers tasked with maintaining energy‐efficient operations. For these customers, energy often represents a significant portion of their overall operating costs. Likewise, for utilities, even if large C&I customers represent a small portion of the overall customer base, their energy consumption can make up a significant percentage of overall load. In many cases, these types of facilities can only make limited use of traditional prescriptive rebate programs. Custom incentive programs offer an energy efficiency delivery option for such customers by allowing the installation of a broad range of measures that do not fit neatly into prescriptive rebate programs. For MOUs, offering a custom program may seem unnecessary if there are only a few large C&I customers in their territories. However, even if the overall customer base is small, a custom program can offer several significant advantages. In particular, even a small participant base can offer significant cost‐effective energy savings opportunities when they can be evaluated and implemented on a whole‐facility basis. Additionally, because large C&I customers are often a utilities’ largest customers, a custom program is a way for utilities to offer added value to these customers through technical assistance and by providing opportunities to help customers hedge against rising energy costs. Custom programs can also allow customers to implement new technologies and alternative energy‐savings strategies and may serve as a testing ground for measures that may later be incorporated into prescriptive rebate programs. Custom programs are typically offered as a supplement to prescriptive rebate programs and promote the types of non‐typical efficiency measures or strategies that are more common among industrial customers. Examples of typical custom measures may include refrigeration measures, energy management systems, other building control systems, complex lighting systems, heat recovery measures, large motors and process boilers, compressed air systems, and re‐commissioning. Eligibility for custom projects is typically based on estimated energy savings and other performance metrics following an in‐depth technical study or comprehensive facility audit. In most cases, to be eligible projects must be shown to be cost‐effective using the TRC test or another common cost‐effectiveness test. From a customer perspective, custom programs offer flexibility to implement any process improvement, equipment upgrade, or other improvement and utility incentives often provide a significant portion of the overall project costs. The result can be significant; large custom retrofit projects can generate substantial long‐term energy savings that benefit both the customer and the utility. The recommended custom program concept incorporates two components: a standard custom measure component and services component focused on retrofit‐commissioning and equipment optimization. A Best Practices Guide for Energy Efficiency in Municipally‐Owned Services Areas 162 | P a g e Table 38. Commercial and Industrial Custom Efficiency Program Commercial and Industrial Custom Efficiency Program Program description The C&I Custom Incentive Program provides a delivery channel and financial incentives to customers installing individual equipment measures or systems not covered by prescriptive rebates, extensive energy efficiency projects, retrofit ‐commissioning, repairs, equipment optimization, and operational and process improvements that result in cost‐effective energy efficiency savings. The program is delivered via two components: Custom measures: incentives are provided to cover a portion of the capital cost of retrofitting facilities with new cost‐effective energy‐efficient equipment. To qualify for financial incentives, eligible customers must provide documentation that their proposed efficiency upgrades pass the utility’s cost‐effectiveness threshold and technical criteria. Services: the program provides incentives to cover a portion of technical studies, retrofit‐ commissioning studies, equipment tune‐ups, and optimization. Any qualifying service may qualify for incentives under this component, based on the program manager’s authorization. Custom projects may benefit from incentives in one or both components. For example, the services component provides incentives to help customers cover the cost of a technical study, and the custom measure component may provide additional incentives to implement recommended facility retrofits. Likewise, the services component would cover a portion of the cost of a retrofit ‐commissioning study and equipment optimization services, while the custom measures component would provide incentives for any qualifying equipment needed to maximize the existing equipment’s efficiency. These incentives may be performance‐based on avoided or reduced kWh or designed to cover a percentage of the project installed cost. Incentives may be subject to an annual cap for each project and for each participating customer. A Best Practices Guide for Energy Efficiency in Municipally‐Owned Services Areas 163 | P a g e Commercial and Industrial Custom Efficiency Program Objectives Encourage the installation of high‐efficiency equipment not covered by prescriptive rebates by C&I customers in new and existing facilities. Encourage equipment repairs and optimization and operational or process changes that reduce electricity consumption and peak demand. Encourage a “whole facility” approach to energy efficiency. Increase customer awareness of the features and benefits of electric energy‐efficient equipment. Increase the market penetration of high‐efficiency equipment. Support emerging technologies and non‐typical efficiency solutions in cost‐effective applications. Infrastructure and staffing Estimated utility staffing requirements will vary depending on the implementation strategy. At a minimum 1 FTE with strong technical skills is required for management, marketing, and outreach to customers, trade ally interaction, project analysis, evaluation, and other administrative functions. An additional 0.5 FTE or a third‐party contractor is recommended to provide technical and program support as well as QA/QC functions. Customer targets and eligibility This program targets all new and existing C&I facilities. The program will be available for any type of new or replacement energy‐efficient equipment, whole‐facility retrofit measures, or facility optimization services that are not eligible for prescriptive rebates. All measures, packages of measures, retrofit ‐commissioning services, and process changes must be cost‐effective as substantiated through a technical analysis. Participant eligibility is verified by utility staff by cross‐referencing customer applications against customer account numbers. Customers must submit a program application with documentation of the equipment replaced (if applicable), new equipment purchased and installed, analysis of project cost effectiveness, and estimated energy savings. A Best Practices Guide for Energy Efficiency in Municipally‐Owned Services Areas 164 | P a g e Commercial and Industrial Custom Efficiency Program Implementation This program may be implemented using a relatively straightforward process led by utility staff or through a third party delivery model. Under a utility‐led model, a program manager conducts one‐on‐one outreach to large C&I customers and works with the customer and the customer’s technical assistance provider (e.g., an engineering firm or ESCO) to identify and assess energy efficiency opportunities and calculate incentives and energy savings. Utility staff then continues to work with the customer’s project team throughout the implementation process and facilitates the incentive payment. A third‐party delivery model relies on an outside contractor and trade allies for implementation. In most cases, a third‐party implementer will provide turnkey services and deliver a contractually‐ agreed level of savings. The implementer will handle customer intake and routing; will work directly with customers to help identify and flesh out project ideas; perform technical analyses; confirm scope, cost, and potential energy savings of proposed projects; conduct field verification of completed projects; and adjust energy savings from installed projects, if appropriate. Utility staff provides oversight and program management, marketing, trade ally support, evaluation, and other administrative functions. The project development process for the Custom Incentive Program is more fluid than other programs and may not follow a precise work path. The following workflow is an example of a typical scenario through which a utility‐led, equipment‐ based custom efficiency project may proceed: The utility manager reaches out to a potential customer to explain the program, its benefits, and the potential opportunities for capital improvements at the customer’s facility. The program manager works with the customer to evaluate their facility’s energy efficiency opportunities, develop potential project ideas, and solicit potential contractors to perform technical services. A professional engineering firm or other qualified contractor, under contract to the customer, performs a detailed technical study of potential projects and evaluates their cost‐ effectiveness. A Best Practices Guide for Energy Efficiency in Municipally‐Owned Services Areas 165 | P a g e Commercial and Industrial Custom Efficiency Program The program manager evaluates the customer’s technical study report to qualify projects. This involves confirming project incremental cost and potential energy and capacity savings data and evaluating cost‐effectiveness. The customer schedules installation of eligible high‐efficiency equipment upgrades, operational or process changes, or other eligible measures directly with an installation contractor. The program manager verifies equipment installation, operational, or process changes or other eligible work for all participants. Processing rebates for qualified equipment or extensive building efficiency projects. Program barriers Higher first cost of energy‐efficient equipment and economic environment limit customer’s ability to purchase energy‐ efficient equipment. Not a high priority; limited access to discretionary cash/credit. Mitigation Strategies Offer customized incentives on equipment and technical study to offset higher cost Market program and general efficiency awareness to customers. Robust marketing strategy that markets to decision makers and facility operators to facilitate understanding of capital budget and operating concerns. Marketing to equipment dealers, distributors and installers, and other trade allies. Lack of program awareness and “emergency replacement” scenario among target customers. Low dealer, customer, and trade ally awareness. Procurement policies that specify low first‐ cost instead of life‐cycle cost A Best Practices Guide for Energy Efficiency in Municipally‐Owned Services Areas 166 | P a g e Commercial and Industrial Custom Efficiency Program Marketing and outreach This program relies on one‐on‐one outreach to large C&I customers through utility program staff, key account managers, and trade allies, such as engineering firms and ESCOs to market the program. Staff and trade allies promote the program, help customers understand the features and benefits of the program, scope projects, specify and install equipment, and help customers fill out program applications. A high level of trade ally participation and program promotion are critical to ensure program success. Thus, program marketing should target trade allies in addition to customers, to encourage their participation. The program messaging focuses on the features and benefits of energy‐efficient equipment. The marketing strategy for the program may include: Active trade ally outreach and support Bill inserts Utility dedicated program web page Present program information at on‐site customer presentations and webinars Targeted marketing to high‐potential market sectors. One‐on‐one marketing to C&I customers through key account managers and the program manager. Targeted marketing to facility managers and building or process engineers, building owners and managers associations, HVAC contractors, energy services firms, architects and engineers, real estate developers, economic development organizations, customer advocacy groups, trade associations, and other trade allies to encourage installation of new energy‐efficient technologies and adoption of best operating practices. Targeted marketing to specific sectors identified as having a high level of unrealized energy efficiency potential, such as manufacturing and data centers. Measures and incentive levels The program provides customer incentives for technical studies and for implementation of qualifying measures or large projects. Program incentives may be set to roughly correspond to a A Best Practices Guide for Energy Efficiency in Municipally‐Owned Services Areas 167 | P a g e Commercial and Industrial Custom Efficiency Program 1.5‐year payback, or to cover approximately half of the installed cost of the measure, but may be adjusted as needed to stimulate the market or scale back program uptake. The following measures and incentive levels are provided as examples. Utilities should select measures and set incentives at levels appropriate for their own customer bases, budgets, and program strategies. Measure Qualification Incentive 50% of technical study cost. Another 50% of Performed by Technical study or professional engineer technical study cost may be rebated if retrofit‐commissioning or other qualified customer proceeds with the project. Capped study firm at $20,000 total incentive. Budgeting rules of thumb Equipment measure or 1.0 benefit‐to‐cost whole‐facility upgrade ratio project Performance based: $0.10/kWh saved based on technical study results, up to $500,000 per customer site. Standard: 50% of installed cost, up to $500,000 per customer site. Retrofit‐ commissioning, repairs, optimization, and operational or process changes 50% of the cost of the service up to a total cap of $50,000. 1.0 benefit‐to‐cost ratio Estimated dollars spent per annual gross kWh saved: $0.20/kWh Estimated program cost as a percent of total program budget: Program administration (internal): 5% to 10% Third‐party contractors: 5% Marketing, advertising, trade ally outreach: 5% to 10% Rebates/Incentives: 70% to 80% EM&V: 5% to 10% A Best Practices Guide for Energy Efficiency in Municipally‐Owned Services Areas 168 | P a g e Commercial and Industrial Custom Efficiency Program Benefits Offers customers an opportunity to install measures not covered by rebates Provides program opportunity for customers with large, complex facilities, and systems Encourages installation of energy‐efficient equipment that may not be considered otherwise Opportunity to support emerging technologies Provides increased customer awareness of energy‐efficiency options Opportunity to reduce electricity consumption and peak demand by supporting repairs and process changes All new and existing C&I facilities are eligible Measuring savings The M&V analysis for custom measures will be based on regression‐based statistical billing analysis using a Statistically Adjusted Engineering (SAE) specification. The advantage of this specification is it will provide estimates of actual savings realization rates for groups of measures affecting the end uses targeted by the program. Energy simulation modeling may be used in more complex projects involving multiple measures with interactive effects. The simulation modeling will use the DOE’s DOE2, eQuest, or an American Society of Heating, Refrigerating, and Air Conditioning Engineers (ASHRAE) Standard 140 compliant tool. The models will be informed with directly observed characteristics for local climate and possibly selective metering of certain equipment. Final determination of the impact evaluation methodology will occur after publication of the statewide EM&V protocols. Monitoring of certain equipment in existing buildings may be necessary to calibrate the energy simulation models. In such cases, end uses would be monitored for a period of at least three weeks during cooling or heating seasons as required under the International Performance Measurement and Verification Protocols (IPMVP) Option B. The impacts estimated under Option B will be weather‐normalized to long‐term average weather data. End‐use data will be applied to energy simulation, consistent with the IPMVP Option D for use in the demand and energy impact calculations. A Best Practices Guide for Energy Efficiency in Municipally‐Owned Services Areas 169 | P a g e Commercial and Industrial Custom Efficiency Program Best practices and innovations Use one‐on‐one outreach and leverage relationships with large customers to market the program. Build and maintain strong communication channels with trade allies. Use a formal review and certification process to vet and verify trade ally participants’ qualifications. Conduct regular quality checks on all participating trade ally installations. Decrease the number of site inspections as a trade ally proves its capabilities. Allow trade allies to submit rebate applications on behalf of customers. Develop a simple participation process and program rules. Conduct program and quality installation training for all participating trade allies. Maintain flexibility to allow program managers to make program changes to address problems as they arise, but ensure that all stakeholders are given notice of program changes and ample time to respond. Offer free technical and program assistance to customers and trade allies (e.g., through a program “hotline”). Perform process evaluations to gain insights and feedback on the program’s effectiveness and inform future program enhancements. A Best Practices Guide for Energy Efficiency in Municipally‐Owned Services Areas 170 | P a g e 5.2 Key Preliminary Considerations Before embarking on the design and development of new energy efficiency efforts, MOUs should first consider several factors to help them determine what types of programs are the right fit for their organization, at what scale they wish to implement a program, and how they should proceed. Several steps are involved in choosing and developing DSM programs. Identify Objectives and Guiding Principles: A utility’s first step is to identify its goals and establish a set of principles that will serve as a platform for program decision making. This requires a keen understanding of the utility’s service territory and customer needs. Among the key considerations in this process are the following: What factors are driving the need for energy efficiency programs? Should the utility offer programs focused on customer service, reducing system demand, conserving energy, or something else? How do market conditions in the service territory support, or create barriers to, the program? What are the areas of greatest need? And greatest opportunity? How will success be measured? Should the utility adopt targets and/or metrics against which to measure progress? What values should the program incorporate (e.g., equity among customer classes, a special focus on low‐income customers, customer service as the highest priority)? Determine Load Shape Objectives: Most DSM programs impact system load, so the utility must identify load shape objectives. Knowing the program’s impact on the system will help the utility plan for future needs. Examples of how DSM programs impact system load are shown below: Peak shaving: These programs, which generally include DR and pricing programs, are designed to reduce demand during peak periods. Load shifting: These programs also address peak demand but shift load from peak to off‐ peak periods. Conservation: Energy efficiency programs are generally designed to reduce energy consumption at all times. They can reduce a utility’s need to add generation capacity or help diversify the resource base. In planning to implement DSM programs, the utility should identify its resource objectives and determine the most beneficial load impacts (as well as impacts to avoid). Once identified, the load shape objectives will help inform program design approaches that address customer end uses and in turn, produce the intended impact. Conduct an Economic Analysis: Although Texas MOUs are not required to meet a formal cost‐ test criteria and commonly do not include this analysis in their evaluation of program options, A Best Practices Guide for Energy Efficiency in Municipally‐Owned Services Areas 171 | P a g e an economic analysis is a useful tool to determine resources needed to implement the program and whether it will result in a net benefit or net cost to the utility. Section 5.5 of this Guide provides guidelines on conducting economic analysis of programs to help utilities understand how energy efficiency programs will impact their rates and customer bills. Commit the Resources: Before undertaking final program planning, the utility needs to commit both funding and human resources to ensuring the program design and implementation are fully supported to achieve success. Depending on what program(s) the utility plans to implement, resources may be required for start‐up and administration activities: Train existing staff Hire new staff Develop implementation plans, program manuals, rebate forms, tracking systems, and/or other documentation Purchase software, equipment, or other infrastructure to support the program Upgrade billing and other administrative systems Plan for and implement market strategies Manage program incentive payments Solicit and contract with third‐party program support 5.3 Developing Budgets In developing budgets for DSM portfolios, it is important to consider the range of costs from administration and communications to planning and evaluation. An overview of cost categories and considerations follows. 5.3.1 Program Development and Administration Program development includes researching delivery strategies, estimating market potential, designing program concepts, performing economic analyses, and preparing implementation plans. In administering a program, the following should be included: Fully‐loaded personnel costs Training costs Industry related sponsorships and memberships Tracking system Tracking system costs can range substantially depending on the system requirements. In budgeting for this cost, expectations should be clearly defined as early as possible and consider reporting requirements, understanding of system users, and data transfers. A Best Practices Guide for Energy Efficiency in Municipally‐Owned Services Areas 172 | P a g e 5.3.2 Program Marketing and Trade Ally Activities Marketing and promotion activities typically include producing and distributing program literature, displays, events, promotional items, bill inserts, and communications. Program advertising encompasses all forms of media such as direct mail, print, radio, and Web activities. Trade allies include heating contractors, weatherization contractors, product installers, retailers and other vendors, auditors, community groups, and trade associations. Depending on the nature of the program, interaction with trade allies can range from providing program literature to conducting comprehensive program and technical training. Budgets should include all training and education activities, vendor recruitment, and coordination costs. 5.3.3 Customer Incentives and Technical Studies Typically, customer incentives can include a variety of costs from direct rebates to customers who purchase energy‐efficient equipment to technical study or other support. For more targeted or technically challenging programs, such as audit, direct install, and custom incentive programs, the costs of audits and technical studies can represent a significant portion of the overall costs. Program administrators must also budget for the cost of free or direct‐install measures. 5.3.4 Program Implementation Costs associated with implementation can include third‐party contractor costs, lead intake, customer service, rebate application processing, quality assurance, and reporting costs. Often, programs delivered by turnkey providers, such as appliance recycling programs encompass the full range of program implementation costs, including marketing, while rebate processing is a larger concern for energy‐efficient equipment programs. Program implementation requirements are outlined in more detail in Section 5 for each program concept. 5.3.5 Evaluation, Measurement, and Verification While the industry standard is to assume 5 percent of total budget for EM&V activities, this should only be applied at a portfolio level, since program evaluation costs can differ substantially depending on the required evaluation activities. Planners must consider whether site visits or metering are required, which can increase overall costs dramatically. Survey costs are also important and should take into account the sample size and the target population. For example, surveys of non‐residential customers are generally more costly than residential customer surveys. Non‐participant surveys are substantially more expensive than participant survey costs. Trade ally, program staff, implementer, and stakeholder interview costs will vary depending on program delivery and size of the program. Availability and cost of relevant and necessary information, such as billing data for participating customers, is also an important cost component. Regulatory reporting requirements (frequency, format, etc.) will also impact the overall costs. 5.4 Evaluation, Measurement, and Verification Evaluation is the process of independently determining and documenting the results, benefits, and lessons learned from an energy efficiency program. Utilities use evaluation results in planning for future programs and determining the value and potential of a portfolio of energy efficiency programs in an integrated resource planning process. The results can also be used to A Best Practices Guide for Energy Efficiency in Municipally‐Owned Services Areas 173 | P a g e assess implementers’ performance, the effectiveness of program incentives, and the effectiveness of motivators such as payments and penalties. There are many components and concurrent tasks involved in evaluating energy efficiency and DR programs. A diagram of the evaluation protocols is depicted in Figure 20. Process Evaluation Protocol Sampling Protocol M&V Protocol EM&V Protocol Impact Evaluation Protocol Market Effects Protocol Sampling and Uncertainty Protocol Sampling and Uncertainty Protocol Figure 20. EM&V Protocol Diagram 5.4.1 Impact Evaluation Impact evaluations determine program‐induced benefits that include reductions in energy and demand usage (kWh, kW, and therms) and avoided air emissions that can be directly attributed to an energy efficiency program. One of the primary research objectives of an impact evaluation is to calculate the verified gross savings, which are the savings directly achieved by the program, validated by an independent third‐party evaluator. Impact evaluations begin at the installation or site level. Depending on the measure type and level of engineering rigor, the M&V protocols for impact evaluation can vary. These paths are depicted in Figure 21, which provides guidance on choosing the level of rigor by measure type. A Best Practices Guide for Energy Efficiency in Municipally‐Owned Services Areas 174 | P a g e Impact Evaluation Measure Type Gross Energy Impact Rigor Level Deemed Savings Measure Gross Savings M&V Options Basic Rigor Verification Only Basic Rigor IPMVP Option A Enhanced Rigor IPMVP Option B or C Basic Rigor IPMVP Option B or C Enhanced Rigor IPMVP Option C or D Partially Deemed Savings Measure Custom Measure Figure 21. Required Protocols for Impact Evaluations IPMVP is a recognized industry standard approach to M&V that has broad application for businessmen, energy managers, law makers and educators and could become the national standard document for M&V. A detailed discussion and definition of the IPMVP options A, B, C, and D can be found in Appendix H. Detailed M&V activities associated with typical energy efficiency program measure types are listed in Table 39 below. Table 39. Measurement and Verification Activities by Measure Type Measure Type: Appliance Recycling Basic Rigor Level: Verification of utility inputs (type of unit, energy source, usage, location). Residential Lighting/ CFL Rewards/ Giveaway Verification of quantity based on invoices for bulbs purchased, by category (wattage, size, etc.). Predefined operating hours. Verification of measure installation. Software simulation for verifying energy savings. Weatherization, Envelope Improvements Enhanced Rigor Level: Verification of project inputs. Spot measurements (kW). Short term metering (kW, operating hours). Verification of quantity installed in sockets and estimates of operating hours based on participant surveys. Verification of measure installation. Software simulation for verifying energy savings. Billing analysis A Best Practices Guide for Energy Efficiency in Municipally‐Owned Services Areas 175 | P a g e Residential HVAC C&I Lighting C&I HVAC Efficiency 5.4.2 Verification of measure installation (quantity, type, efficiency). Baseline efficiency defined by Energy Efficiency Program Manual (baseline equals efficiency of old equipment for early replacement; for end of life replacement, and new construction, baseline equals efficiency of code‐compliant equipment). New equipment efficiency from manufacturers’ catalog data. Stipulated operating hours (pre‐defined by baseline studies or customer reported) Verification of measure installation (fixture quantity, type). Pre‐ and post‐installation fixture types and performance. Operating hours Verification of measure installation (quantity, type, efficiency). Baseline efficiency defined by utility (baseline equals efficiency of old equipment for early replacement; for end of life replacement, and new construction, baseline equals efficiency of code‐compliant equipment). New equipment efficiency from manufacturers’ catalog data. Stipulated operating hours (defined by utility, baseline studies, or customer‐reported) Verification of measure installation (quantity, type, efficiency). Pre‐ and post‐installation site visits to verify efficiency levels. Baseline efficiency equals efficiency of old equipment for early replacement; for end of life replacement, and new construction, baseline efficiency equals efficiency of code‐ compliant equipment). Short term metering (pre‐ or post‐) to calculate Equivalent Full Load Hours (EFLH). Verification of measure installation (fixture quantity, type). Pre‐ and post‐installation fixture types and performance. Short term metering to log operating hours and stipulated categories. Verification of measure installation (quantity, type, efficiency). Pre‐ (where applicable) and post‐installation site visits to verify baseline and retrofit equipment information. Short term or continuous metering (kW) for a minimum of three weeks to calculate pre‐ and post‐installation energy use. Process Evaluation The primary purpose of a process evaluation is to assess program design and delivery characteristics in order to provide specific and detailed recommendations for program changes. A Best Practices Guide for Energy Efficiency in Municipally‐Owned Services Areas 176 | P a g e Typically, recommendations are designed to affect one or more areas of the program’s operational practices, such as marketing, program delivery bottlenecks, internal communications, or the incentive application process. Process evaluations are a significant undertaking, designed to produce more energy efficient, successful, and cost‐effective programs. Process evaluation is an important tool in the evaluation toolbox. A process evaluation consists of in‐depth examinations of the design, delivery, and operations of an energy efficiency program in order to improve its ability to achieve energy savings and accomplish other program goals. Process evaluation findings and recommendations are a valuable tool for program designers and managers who use the evaluation results to improve the cost‐effectiveness and operational efficiency of their programs. The process evaluation examines the effectiveness of the following program components: Program design and operational systems Program tracking and information management systems Internal and external program communications Program delivery organization and staffing Program staff understanding of the program’s goals and objectives Skill levels needed to implement the program The methods and procedures used to target customers for outreach efforts The incentive levels used to promote the program Program operations related to the program theory and logic model Marketing and outreach channels, tactics, materials, and messages Customer satisfaction with the program, equipment, installation contractors, utility, and other service experiences Program barriers and bottlenecks Most programs do not need a process evaluation every year of their implementation cycle. As stated earlier, new programs may want to undergo a process evaluation in the first year and involve the program evaluation staff early in the design process. For this reason, MOUs should consider having their process evaluation team on board and engaged during the early development efforts and conduct an early process evaluation within the first year of program implementation. 5.4.3 Sampling and Uncertainty Protocol The energy and demand savings and other evaluation parameters for a program are developed by surveying all or some of the population of the program participants. There are three major options for surveying a population of program participants; these are outlined in Table 40. A Best Practices Guide for Energy Efficiency in Municipally‐Owned Services Areas 177 | P a g e Table 40. Survey Options How Many Are Measured & Resulting Precision of Estimates Measure entire population. Statistical precision is not applicable because every outcome is counted and the evaluation effort, therefore, achieves enumeration Sample: Measure a randomly selected subset of Probability Sample: the population. Probability of a unit Simple random and entering the sample is known. Sampling precision depends on the number of stratified random items, i.e., participants measured. The more measured, the better the precision. Systematic: Measure a non‐randomly selected Any non‐random subset of the population. Probability of method of sampling selection unknown. Statistical precision is not applicable. Carefully selected representative samples are sometimes claimed to have properties “similar to” probability samples. Option Census: Rank Order of Contribution to Defensibility Highest Rank Order of Cost Highest Varies Varies Lowest Various One challenge in evaluating energy efficiency programs is the impossibility of directly measuring the primary end result—energy savings. Energy savings are a reduction in a level of energy use that did not happen. What can be measured is actual energy consumption after, and sometimes before, the energy efficiency actions took place. Consequently, the difference between (a) actual energy consumption and (b) what energy consumption would have been, had the efficiency measures not been installed, is an estimate of energy (and demand) savings.18 Since impact evaluations seek to reliably determine energy and demand savings with reasonable accuracy, the value of the estimates as a basis for decision making can be called into question if the sources and level of uncertainty of reported savings estimates are not fully understood and described. While additional investment in the estimation process can reduce uncertainty, tradeoffs between evaluation costs and reduced uncertainty are inevitably required. For each program’s impact evaluation to produce reliable and accurate results, the evaluation process should adhere to a specified set of sampling and uncertainty protocols. Sampling and uncertainty protocols are generally dependent on the type of analysis desired, M&V protocols specified, and inherent uncertainties in measure, demand, and usage19. 18 National Action Plan for Energy Efficiency (2007). Model Energy efficiency program Impact Evaluation Guide. Prepared by Steven R. Schiller, Schiller Consulting, Inc. <www.epa.gov/eeactionplan> 19 Note: The elements of evaluation uncertainty developed for the State of Pennsylvania Act 129 Energy Efficiency and Conservation Programs have been adapted from The California Evaluation Framework prepared by TecMarket Works for the California Public Utilities Commission and the Project Advisory Group in June 2004. A Best Practices Guide for Energy Efficiency in Municipally‐Owned Services Areas 178 | P a g e 5.5 Program Cost‐effective Analysis and Utility Level Rate Impact Analysis 5.5.1 Program Cost‐effective Analysis To ensure the Texas MOUs initiate and implement a cost‐effective energy efficiency plan, they are encouraged to conduct a program economic analysis concurrent with the program design process, and to evaluate and verify the program impacts. The Project Team summarized cost‐ effectiveness analysis methods at a portfolio level, sector level, and end‐use level from three perspectives—the utility cost test (UCT), the total resource cost test (TRC), the societal cost test (SCT), and the participant cost test (PCT) perspectives. The specification of each analysis model is described below. The UCT perspective assesses cost‐effectiveness to the utility (or program administrator), and indicates whether the cost of implementing energy efficiency measures or programs is greater or less than the cost of generating and delivering an equivalent amount of energy. Benefits are measured by the avoided costs of utility energy supply (e.g., electrical, gas, and other energy costs, as well as avoided capacity costs). Costs include the total program costs to the utility, including incentive payments plus any administrative costs of implementing programs. UCT ΔkWh Utility Avoided Cost Incentives Program Admin & Marketing The TRC test seeks to determine whether the cost of generating and delivering a particular amount of energy is greater or less than the cost of implementing measures or programs to save that amount of energy. Benefits are measured by the avoided cost of utility energy supply. From a DSM program perspective, TRC costs include both the incremental costs of purchasing, installing, and maintaining energy efficiency measures plus any administrative costs to implement programs (program administrative costs were not included in the measure‐level analysis). TRC Program ΔkWh Utility Avoided Cost Measure Cost Program Admin & Marketing The SCT is similar to the TRC, except the SCT explicitly quantifies externality benefits such as avoided pollutant emissions not represented in market prices and other non‐energy benefits (e.g., improved health/productivity). TRC Program ΔkWh Utility Avoided Cost non ‐ energy benefits Measure Cost Program Admin & Marketing The PCT perspective assesses cost‐effectiveness to participants, and indicates whether participation in a program would result in net benefits to a customer. Benefits are measured by the reduction in participants’ energy costs plus any incentives received to offset energy efficiency measure costs. Costs include the incremental costs of purchasing, installing, and maintaining energy efficiency measures. PCT ΔkWh Retail Electric Rate Incentives Measure Cost A Best Practices Guide for Energy Efficiency in Municipally‐Owned Services Areas 179 | P a g e 5.5.2 Utility Level Rate Impact Analysis Based on feedback from Texas MOUs through the in‐depth phone interview process, the Project Team recognized the utilities’ needs for funding resources to implement and expand energy efficiency programs. While some financing and funding resources may be available to assist MOUs with planning, marketing, and other program costs (see Section 5.3), the utility may still need to consider increasing utility rates to fund continuous energy efficiency plans. The Project Team also recognized that rate increases to pay for energy efficiency programs—and even the perception of rate increases— can pose a significant barrier to implementing energy efficiency programs for MOUs. The typical response to rate impact concerns is to limit energy efficiency program budgets. However this response is rarely based on a thorough assessment of rate and bill impacts, and will deprive customers of the many benefits offered by energy efficiency programs, as well as significantly limiting opportunities to achieve important public policy goals such as mitigating climate change and future supply constraints. The ratepayer impact measure (RIM) test is often utilized to analyze cost‐effectiveness from an electricity ratepayer perspective, which seeks to determine whether the effects of energy program implementation would cause electricity rates to go up or go down as compared to a baseline resource plan without the program. Benefits are measured by the avoided costs of electric utility energy supply (e.g., electrical energy costs, as well as avoided capacity costs). RIM costs include any administrative costs to implement programs, plus any direct financial incentives given to customers who implement energy efficiency measures, plus revenues lost as a direct result of the energy efficiency programs. RIM ΔkWh Utility Avoided Cost Incentives Program Admin & Marketing Utility Lost Revenues While widely used, the RIM is an insufficient indicator of rate and bill impacts, as it is overly narrow and does not present rate and bill impacts in a way that is useful to regulatory bodies. However, the Project Team has provided this section to introduce the utilities to the general principles of the RIM test and framework for utilizing the principles in rate impact analysis and mitigation strategies. In analyzing rate and bill impacts of energy efficiency programs, it is important to account for the long‐term savings as well as the short‐term costs. It is also important to account for all ways in which rates may be affected, including reduced generation costs and reduced wholesale electricity prices. 5.5.2.1 General Principles In lieu of limiting or curtailing the energy efficiency plan budget with increased utility rate requirements, the utilities, city council, and other stakeholders should first analyze the extent of the impacts. Based on the Project Team’s experience assisting utilities with utility rate impact analysis and cost caps, the central concern generally pertains to impacts of energy efficiency programs on nonparticipants. In other words, nonparticipants experience higher rates without receiving the benefits of the energy efficiency programs. From this perspective, it is necessary for utility decision makers to assess the impacts of energy efficiency programs on all customer levels, and ensure the opportunity to benefit from energy efficiency services is provided to the vast majority of customers with the help of a thoughtful program design. A Best Practices Guide for Energy Efficiency in Municipally‐Owned Services Areas 180 | P a g e 5.5.2.2 Framework for Rate and Bill Impact Analysis In order to present the rate and bill impact analysis to stakeholders in a meaningful and quantifiable way, MOUs should account for the following factors: Perform impact analysis at a portfolio level, in addition to a program‐level analysis. Divide impacts among program participants, nonparticipants, and all customers on average. Account for long‐term and full potential costs and benefits of the energy efficiency programs. The potential costs may include program costs, shareholder incentives, lost base revenue collections, and decoupling adjustments, while the potential benefits may include the avoided generation, transmission and distribution costs and losses, avoided environmental compliance costs, and wholesale market price suppression effects. Compare the estimated rates and bills with and without the energy efficiency programs in place. Present both the percentage and absolute dollar increases in total rates and total bills. 5.5.2.3 Mitigation Strategies Once utilities gain a thorough and meaningful understanding of rate and bill impacts, decision makers and stakeholders can consider possible approaches to mitigating rate impacts from energy efficiency programs: 5.6 Minimize program administrative costs as much as is feasible. Maintain a balance between minimizing program costs and overcoming market barriers. Maintain a balance between minimizing program administrative cost and providing sufficient incentive payments. Deliver all cost‐effective efficiency measures to each participant, in order to leverage marketing and delivery costs. Provide all customer types, especially low‐income customers, with opportunities to participate. Offer energy efficiency measures specifically tailored to each customer type. Consider a collaborative utility model to achieve economies of scale and to share lessons learned, as discussed further in Section 5.2.5. Energy Independence and Security Act In 2007, Congress passed the Energy Independence and Security Act (EISA) that establishes minimum efficiency and lifetime performance standards for light bulbs. EISA will begin to take effect starting January 1, 2012, when traditional 100 watt incandescent bulbs are phased out. This will be the first of three waves in which certain bulb wattages will be restricted: 100 watt bulbs in 2012, 75 watt bulbs in 2013, and both 60 watt and 40 watt bulbs in 2014. Lumen A Best Practices Guide for Energy Efficiency in Municipally‐Owned Services Areas 181 | P a g e ranges, or the amount of light a bulb puts out, as well as the lifetime rating per bulb are required to remain constant. While manufacturers are doing their best to make strategic production decisions and hedging bets on which technologies will dominate the lighting landscape, the market is changing at a rapid pace. Industry players’ predictions on the market outlook for specific non‐incandescent lighting products remain mixed and conflicted. In the short term (pre‐2013), it appears likely that halogens, CFLs, and LEDs (if they become cost‐competitive) will dominate the market. In the longer run, new technologies under development will likely emerge in the lighting market. However, consumer purchasing preferences and satisfaction will dictate which technologies take hold. There is currently a large knowledge gap between industry professionals and the general public. In surveys, consumers are either unaware, or have expressed confusion about the new legislation, and of those that are aware of EISA, some express a strong preference for current lighting options. In one study, when asked what customers will do when faced with the new standards, the most frequent response was to stockpile incandescent bulbs; the least common response was to purchase CFLs. In fact, the majority of consumers across multiple studies mentioned that they already are or plan on stockpiling incandescent bulbs before EISA takes effect. Consumer opinion of CFL bulbs is dominated by concerns about lighting quality and fears about mercury content. Many consumers are apprehensive about regulations that would force them to use products that they felt were substandard in quality and safety. Industry leaders have high hopes that LED bulbs will gain better market acceptance, but at this point they are still too expensive to be cost‐competitive. Impact of EISA on Utility CFL Programs Although utility CFL programs will likely see a decline in savings (as the residential baseline will shift once EISA takes effect), these programs are still valid and CFLs will continue to produce energy savings. As EISA phases in, there is expected to be a one‐year lag before the baseline changes, as incandescent bulbs in existing sockets remain in use; thus current savings levels from CFL programs will most likely continue into 2013. Some manufacturers are concerned that because historically CFLs have not been consumers’ first choice lighting option, they could be less popular than other post‐EISA lighting options (e.g., halogens). Many utilities offering high‐efficiency residential lighting programs are preparing by developing and delivering educational components that address EISA and alternative lighting options, and testing the market acceptance of new high‐efficiency bulbs. Another way for utilities to influence residents to select the most energy‐efficient lighting products post‐EISA will be to increase CFL direct install and giveaway programs and to phase in LED options as they become more cost‐effective. 5.7 Building Codes Energy codes are one component of a group of standards governing new building construction. Historically, building codes were simply the minimum requirements necessary to ensure building safety. However, today codes often are designed to support societal goals, including energy A Best Practices Guide for Energy Efficiency in Municipally‐Owned Services Areas 182 | P a g e efficiency, resource conservation, and accessibility. However, code requirements still represent a minimum level of performance compared to what is possible or optimal. The International Codes Council (ICC) sets a model IECC that provides standardized energy efficiency protocols to govern new building construction. The IECC model codes are updated on three‐year cycles. Texas Energy Codes In Texas, SECO has the authority to adopt the state energy codes. In April 2011, SECO officially adopted the 2009 IECC for residential (excluding single‐family), commercial, and industrial building construction as the state’s energy code. This updates the previous Texas Building Energy Performance Standards that were based on the 2000 IECC with 2001 Supplement. Full adoption of the 2009 IECC should produce approximately 8‐15 percent savings in residential and commercial energy use. For single‐family residences, the 2009 International Residential Code goes into effect January 2012. Texas is considering adopting the IECC 2012 code, which is designed to achieve a 30 percent increase in energy savings compared to the IECC 2006, in both residential and commercial buildings. For more information on IECC standards, see Appendix E. Home Rule Texas is a home rule state. Although there is a state code, it does not apply to jurisdictions until they adopt it. Local ordinances can adopt code amendments provided they are at least as stringent as the state code. Dallas, Austin, San Antonio, and Houston have all adopted codes that are more stringent than the state’s. Municipal utilities are uniquely positioned to influence the adoption of more stringent building codes in their communities. Such actions can significantly influence the energy efficiency of the local building stock and shift the burden of efficiency to the builder, eliminating the need for new revenues to support program implementation. Impacts of Energy Codes New Construction is the most cost‐effective point in the life of a building to establish energy efficiency elements. Building energy codes serve as a starting point to lower the energy use of the building stock over time. Existing Buildings. In the state of Texas, alterations and additions to existing buildings must comply with applicable local codes. Local jurisdictions may amend the code to increase stringency or better define how they apply to existing buildings. Municipalities around the country are looking at how codes can help increase the energy efficiency of existing buildings. Builder‐Friendly. Keeping track of different code requirement in neighboring jurisdictions can be onerous for builders. Having consistent codes across jurisdictions increases efficiency. A Best Practices Guide for Energy Efficiency in Municipally‐Owned Services Areas 183 | P a g e 5.8 Collaborative Utility Model As mentioned in a prior section, there is no “one‐fits‐all” solution to apply the identified best practices to each Texas MOU. Each Texas MOU is encouraged to gain a thorough knowledge and understanding of its service territory and its own deliverable capabilities to identify the most suitable best practices for itself. On the other hand, the Texas small to mid‐sized MOUs do share similar constraints, barriers, priorities, and interests. For example they have funding and staffing limitations related to marketing and implementing comprehensive energy audit programs. Application and training process requirements for trade allies who want to participate in multiple energy efficiency programs offered by different MOUs can be redundant. Many MOUs lack experience measuring, verifying, and documenting savings and program costs, as well as experience evaluating program cost‐effectiveness. As a solution, small and mid‐sized MOUs might consider adopting a collaborative utility model to initiate or expand their current energy efficiency plan. The benefits of doing so include the following: Standardized program design, implementation, and tracking systems Centralized resources for information, data, and documents Standardized rebate administration and processing Standardized evaluation, monitoring, and verification Standardized savings and program cost documentation and reporting process Uniform trade ally training and quality control schematics Synchronized regulatory and policy support Two case studies of collaborative utility efforts on managing, implementing, and tracking energy efficiency programs are given in the following subsections. 5.8.1 Case Study: Texas IOU Collaboration – EUMMOT In 1999, the Texas Legislature passed Senate Bill 7 (SB 7) that mandated at least 10 percent of an IOU's annual growth in electricity demand be met through energy efficiency programs each year. Eight years later, the Legislature passed House Bill 3693 (House Bill (HB) 3693) that raised the goals for energy efficiency to 20 percent of each utility's annual growth in demand by 2009, superseding the goals set by SB 7. In 2010 and 2011, the PUCT underwent a rulemaking process to modify Substantive Rule §25.181 and Senate Bill 1125 that mandates starting in 2013, IOUs must meet at least 30 percent of their annual growth in demand by December 31 of each year. Utilities are required to administer energy savings incentive programs that are implemented through retail electric providers and energy efficiency service providers (EESPs). All programs are designed to reduce system peak demand, energy consumption, or energy costs. Utilities must achieve their energy efficiency goals through, either SOPs or targeted MTPs. Programs are made available to all customers, in all customer classes. This gives each customer a choice of a variety of energy efficiency alternatives. Per PUCT Substantive Rule §25.181, the utilities are required to file an annual EEPR. The EEPR details the utility's future plans for energy efficiency and reports on the most recent year's actual achievements. A Best Practices Guide for Energy Efficiency in Municipally‐Owned Services Areas 184 | P a g e EUMMOT is a voluntary organization of electric IOUs formed to address utility industry energy efficiency issues. Further, EUMMOT serves as a forum to facilitate coordination among the energy efficiency program managers responsible for administering programs designed to meet Texas goals for energy efficiency. EUMMOT serves the IOUs listed below: American Electric Power‐Southwestern Electric Power Company (AEP‐SWEPCO) American Electric Power‐Texas North Company CenterPoint Energy Houston Electric LLC El Paso Electric Company Entergy Texas, Inc. Texas‐New Mexico Power Company Oncor Xcel Energy Company20 EUMMOT's objectives and deliverables include: 5.8.2 Convey common perspectives on efficiency program design and implementation. Provide for exchange of information on markets and technologies. Advance understanding and participation in energy efficiency programs. Consolidate the results from each utility and produce an EEPR Summary report, highlighting statewide achievements. Case Study: Colorado IOU Collaboration – Excess Is Out In 2008, the state of Colorado enacted legislation requiring all IOUs, regardless of size, to meet specific energy savings targets. This ruling affected several small utilities in Colorado, which because of their smaller customer bases would incur a higher proportion of administrative costs to deliver programs than larger utilities that can spread costs over a larger customer population. In an effort to design a cost‐ effective portfolio, three small gas utilities: Atmos Energy, SourceGas Distribution, and Colorado Natural Gas formed a collaborative to serve as a base for their collective energy efficiency programs. The trio of utilities also partnered with the Colorado Governor’s Energy Office to further leverage available promotional resources, state efficiency incentives, and low‐income program delivery. The Excess Is Out collaborative (http://excessisout.com/) has now been operational for nearly three years. Through the collaborative mechanism, the three utilities share the costs of the activities below: Program design and planning Marketing and website hosting Trade ally training Residential energy audit and low income program implementation Rebate administration and processing Evaluation, monitoring, and verification 20 Voluntary participant in energy efficiency programs. A Best Practices Guide for Energy Efficiency in Municipally‐Owned Services Areas 185 | P a g e The collaborative strategy was essential to the three utilities achieving a cost‐effective program portfolio and provided additional benefits, described below: Economies of scale associated with common program costs such as marketing, administration, delivery, tracking, as well as bulk purchases of program materials. Common marketing, efficiency measures, and rebate structures support a consistent message and decrease confusion among customers. Integrated training on program protocols, guidelines, and installation best practices offers administrative cost savings, helps ensure consistent quality protocols, and offers streamlined participation for trade allies and delivery contractors. 5.9 Financing Sources, Utility Resources, Tools, and Available Incentives A range of financing and technical resources are available to help support MOUs implementing new DSM programs. This section summarizes the Project Team’s research findings of potential useful resources that were found to be the most relevant, including: Financing Strategies for Municipal Energy Efficiency – this report describes a sustainable financing mechanism for energy efficiency retrofits in municipal buildings in eight of Michigan’s poorest cities. Compendium of Best Practices – Sharing Local and State Successes in Energy Efficiency and Renewable Energy from the United States, this report describes more than 20 practices and includes examples of their effective implementation in states or cities. Recovery.gov website provides easy access to data related to Recovery Act spending. EPA website publishes federal funding opportunities on a monthly basis. Office of Energy Efficiency and Renewable Energy (EERE) works with business, industry, universities, and others to increase the use of renewable energy and energy efficiency technologies. State of Energy Conservation Office in Texas website provides several funding and incentive opportunities for Texas consumers, schools, businesses, and local governments. There are several ways for municipal utilities to fund their programs. These are described in the sections below. 5.9.1 Grants Texas received about $2 billion from the 2009 American Recovery and Reinvestment Act (ARRA). Of this amount, approximately $808.3 million funds energy efficiency efforts. Two state agencies, SECO and the Texas Department of Housing and Community Affairs (TDHCA) received the ARRA funding. SECO is managing the State Energy Program (SEP) and Energy Efficiency and A Best Practices Guide for Energy Efficiency in Municipally‐Owned Services Areas 186 | P a g e Conservation Block Grant Program (EECBG21). TDHCA is managing the Weatherization Assistance Program (WAP). EECBG helps Texas communities develop, implement, and manage local energy efficiency programs. Large cities and urban counties (cities over 35,000/counties over 200,000) received an EECBG allocation of $163,121,800 in total, directly from DOE. These allotment grants are administered directly by DOE22. SECO received $45,638,100 that was redistributed to 1,130 cities and 244 counties that did not receive direct EECBG funds from DOE. SECO and the Comptroller of Public Accounts made the decision to distribute the grant equitably to smaller cities and all nonurban counties across Texas, disseminating grants of $46,000 and $23,000 for smaller cities and counties. Those cities and counties have to apply and qualify by submitting details of eligible projects relating to energy efficiency, energy‐efficient transportation, and renewable energy. SECO played a “marketing” role in these block grants by helping cities with determining eligibility criteria and offering suggestions on eligible projects. The grant recipient reports can be found at the government’s recovery website23. Other grant opportunities can be found at the DOE, EPA, and Grants.gov websites. 5.9.2 Bonds and Loans Bonds are an important and frequently used funding route for launching new energy efficiency and renewable energy programs. The municipalities use bond measures to facilitate energy efficiency or renewable energy investment in communities and repaying them with public funds typically obtained through routine tax revenues. The interest paid by municipal bonds is typically tax‐exempt. This allows the municipalities to pay lower interest rates to the investors but still be competitive in the market. In 1988, the city of Ann Arbor utilized its bonding authority to fund a $1.4 million project for energy efficiency upgrades in 30 city facilities. The city paid off the original bond loan without hardship since the payment was offset by lower energy bills. After the initial bond was paid in full, the city continued to contribute $100,000 annually of its energy cost savings to create the Municipal Energy Fund. Qualified Energy Conservation Bonds A qualified energy conservation bond (QECB) is a debt instrument that enables qualified state, tribal, and local government issuers to borrow money to fund energy conservation projects (it is important to note that QECBs are not grants). A QECB is among the lowest‐cost public financing tools available; the U.S. Department of Treasury subsidizes the issuer's borrowing costs. For more information see: http://www1.eere.energy.gov/wip/solutioncenter/financialproducts/QECB.html Qualified Zone Academy Bonds 21 Energy Efficiency and Conservation Block Grant Program, http://www1.eere.energy.gov/wip/eecbg.html 22 U.S. Department of Energy. Energy Efficiency and Conservation Block Grant Program, online available: http://www1.eere.energy.gov/wip/eecbg.html 23 U.S. Recovery website, http://www.recovery.gov/Pages/TextViewProjSummary.aspx?data=recipientAwardsList&State=TX&Agenc y=89&AwardType=CGL A Best Practices Guide for Energy Efficiency in Municipally‐Owned Services Areas 187 | P a g e In 1997, Congress created a new financial instrument, the qualified zone academy bond (QZAB), to help schools raise funds to: Renovate and repair buildings Invest in equipment and up‐to‐date technology Develop challenging curricula Train quality teachers QZABs also encourage schools and businesses to cooperate in innovative ways that expand students' learning opportunities and help schools prepare students with the kinds of skills employers, and the nation, need to compete in the global economy. For more information see: http://www2.ed.gov/programs/qualifiedzone/faq.html Revolving Loans Revolving loans allow an initial fund to continue indefinitely. A portion of project savings is returned to a central fund that refills until it has sufficient capital for additional projects. The Texas LoanSTAR (Loans to Save Taxes and Resources) program uses a revolving loan mechanism. The program was initiated by the Texas Energy Office with a pool of $98.6 million in 1988 and has become one of the most successful energy efficiency programs in the United States. As of November 2007, LoanSTAR has funded a total of 191 loans totaling over $240 million dollars. The LoanSTAR program provides low‐interest loans to assist selected public entities in financing their energy‐related cost reduction efforts. The awards are structured as low‐interest 2 percent loans of up to $10 million, of which up to $2 million may be used for renewable energy systems. The term of the loan is for 10 years or less; if at least 10 percent of the project cost contains renewable energy technologies, the loan may qualify for up to a 15‐year payback. Rural Economic Development Loan and Grant The Rural Economic Development Loan and Grant (REDLG) program provides funding to rural projects through local utility organizations. Under the REDLoan program, the U.S. Department of Agriculture provides zero interest loans to local utilities that they, in turn, pass through to local businesses (ultimate recipients) for projects that will create and retain employment in rural areas. For more information see: http://www.rurdev.usda.gov/rbs/busp/redlg.htm 5.9.3 Municipal Budget Allocation An energy efficiency program can be funded by a municipality by allocating funds in the annual budget. The main advantages of this mechanism are that it ensures that energy efficiency becomes a line item in future capital budgets and is perceived as a vital service to the community. 5.9.4 Service Charges on Utility Bills Energy efficiency programs can be funded by an SBC. An SBC is determined by either legislation or a regulatory process. The charge is usually a fixed amount on the utility bill and is set for a number of years. The energy efficiency program funded through this mechanism has a more stable funding source. A Best Practices Guide for Energy Efficiency in Municipally‐Owned Services Areas 188 | P a g e Third‐Party Financing – Performance Contracting and Demand Side Bidding For all municipalities, especially those with limited capital or staff resources, performance contracts are a simple approach to financing energy efficiency retrofits. In performance contracting, the financing is structured so that the energy savings cover the cost of the contractor’s services and the cost of the energy efficiency equipment. For a municipality new to energy management, working with an ESCO provides a comfortable level of technical support. The municipal managers should think strategically about pursuing more comprehensive retrofits that will yield more energy and cost savings in the long run if they choose this type of financing. In addition to these financing incentive options, there are some free energy efficiency resources available to Texas MOUs. 5.9.5 Technical Assistance Technical Assistance Program: DOE’s Technical Assistance Program (TAP) supports the EECBG Program and the SEP by providing state, local, and tribal officials the tools and resources needed to implement successful and sustainable clean energy programs. TAP offers one‐on‐one assistance on topics including energy efficiency and renewable energy technologies, program design and implementation, financing, and performance contracting. Its extensive online resource library includes webcasts, events calendars, the TAP blog, best practices, and project resources. TAP solution center link: http://www1.eere.energy.gov/wip/solutioncenter/default.html Technical Assistance Center: http://www1.eere.energy.gov/wip/solutioncenter/technical_assistance.html ENERGY STAR® Portfolio Manager EPA’s Portfolio Manager (PM) is a free, web‐based tool for benchmarking existing buildings. It provides benchmarking for all commercial buildings, including ENERGY STAR® scores for eligible buildings and normalized energy use intensities (EUI) for all buildings. The benchmarking activity in PM has continued to increase since 1999. The PM rating 50 is average and a rating of 75 qualifies the building for ENERGY STAR®. ENERGY STAR® provides ratings for many building types. If the building type doesn’t fall into an ENERGY STAR® category, ENERGY STAR® PM can still be used to track water use, EUI, and emissions. ENERGY STAR® PM reports a statement of building energy performance. The users can create custom views to demonstrate savings from EECBG retrofit projects. The PM reporting tool provides many capabilities, e.g., it gives access to much more data and allows users to download data in different formats. PM can be a useful tool for MOUs to support implementation of commercial sector programs. There are many benefits of benchmarking. Enable portfolio‐wide continuous energy management strategy and reductions Verify pre‐ and post‐project energy use, GHG emissions, and energy costs Identify under‐performing facilities Assess effectiveness of current operations, policies, and practices Assist in planning: set goals, targets, and timelines A Best Practices Guide for Energy Efficiency in Municipally‐Owned Services Areas 189 | P a g e Set investment priorities Be more responsive to ongoing issues Identify billing errors Conduct low cost “pre‐audits” of building energy use The ENERGY STAR® PM link: http://www.energystar.gov/index.cfm?c=evaluate_performance.bus_portfoliomanager Clean Energy Ambassadors Clean Energy Ambassadors (CEA) work to share winning strategies for energy efficiency and renewable energy development at community‐owned utilities. The program is all about developing leadership, taking a broad view, and fostering productive public participation in energy efficiency and renewable energy development. Many of the services, including expert advice and on‐site meetings, are provided at no cost. CEA collaborates with established networks, including the APPA’s EER Central, the national Clean and Efficient Energy Program, Midwest Energy Efficiency Alliance, state farmer’s unions, tribal groups, and more, bringing regional and national research, field experience, and market transformation to your hometown. For more information see: http://cleanenergyambassadors.ning.com/ American Public Power Association: “Energy Services that Work Guidebook.” This comprehensive handbook for understanding and implementing utility DSM and energy services programs covers 21 program areas for residential, commercial/community, industrial, and agricultural customers. It communicates successful program implementation by identifying pitfalls and presenting best practices and insights that have helped utilities offer better programs and services to their customers. This guidebook will help utility staff understand the costs and benefits of prescriptive and customer programs along with key considerations for program development, implementation, and marketing. This resource is available as a hard‐copy handbook and as a web‐based handbook. Available through the APPA Website: $150 for APPA members. http://www.publicpower.org. Department of Energy Industrial Technologies Program Traditionally, the industrial sector has been underserved by utility‐sponsored, energy efficiency programs. To help increase awareness and provide training and education for industrial customers, MOUs can offer design assistance for construction of new industrial facilities as well as partner with the DOE Industrial Technologies Program (DOE‐ITP). The DOE‐ITP offers several layers of support for industrial energy efficiency programs. The DOE‐ITP “leads the national effort to reduce energy use and carbon emissions in industry…” To achieve this, the program: Conducts research and development (R&D) on energy‐efficient new technologies Promotes distributed generation and fuel and feedstock flexibility Supports the commercialization of emerging technologies Helps plants access and use proven technologies, energy assessments, software tools, and other resources Promotes a culture of energy efficiency and carbon management in industry” A Best Practices Guide for Energy Efficiency in Municipally‐Owned Services Areas 190 | P a g e (Source: http://www1.eere.energy.gov/industry/about/pdfs/mypp_program_overview.pdf) Program Objectives Provide national leadership in energy‐efficient, low‐carbon manufacturing and products Harness the scientific ingenuity of academia, industry, and the National Laboratories to transform energy use in manufacturing Promote the use of proven, advanced technologies and strategies throughout the industrial supply chain Foster industrial productivity to stimulate economic growth and jobs creation (Source: http://www1.eere.energy.gov/industry/about/pdfs/itp_program_fact_sheet.pdf) Financial Assistance and Other Resources MOUs can apply for solicitations from DOE‐ITP for rebates, grants, loans, assessments, and other incentives via the State Incentives and Resource Database located at: http://www1.eere.energy.gov/industry/states/state_activities/incentive_search.aspx. This database is organized by region/state, sponsor type, resource type, industrial system type, and energy type and provides a listing of potentially compatible programs. Additional resources provided by ITP are: Combined Heat and Power (CHP) Project Profiles Database‐ Database of select CHP project profiles. Industrial Assessment Centers Database‐ Database of small‐ to medium‐sized manufacturer energy assessments Save Energy Now Participating Plants Database‐Detailed information on completed on‐ site plant assessments. (Source: http://www1.eere.energy.gov/industry/resources/databases.html) A Best Practices Guide for Energy Efficiency in Municipally‐Owned Services Areas 191 | P a g e Section 6 Conclusions and Final Remarks As stated at the beginning of this report, energy efficiency has been long recognized and accepted as one of the most cost‐effective resources that contribute to the country’s growing electricity needs. Numerous organization, agencies, and utilities across the country are utilizing energy efficiency in their resource portfolios by offering programs to help reduce demand. Through extensive research, interviews, data collection, and analysis, the Project Team identified significant potentials for energy conservation in local markets, and great interest among the MOUs to uncover energy savings through initiating new energy efficiency programs or expanded energy efficiency plans to incorporate successful program initiatives and cost saving measures. Meanwhile, the Project Team also recognized energy efficiency best practices and disseminated them among locally owned electric providers so that decision makers can assess, select, and implement the policies and programs that align best with local conditions and constraints. This comprehensive Guide is intended to be a first, not final, step in a process that seeks to identify and communicate best practices on an on‐going or periodic basis. The Guide does not expect to produce a concensus of best practices across all types of programs. The large scope and changing nature of energy efficiency programs and energy markets requires that a dynamic approach be deployed. Like any study of this type, resource and schedule constraints must limit the scope of the effort. It is anticipated that future phases of the work can expand the number and types of programs covered. The Project Team, along with DOE and SECO, will provide assistance and support to Texas MOUs with their planning and implementation of energy efficiency programs that will ultimately result in energy and electric bill savings for their customers. This Guide is also a resource to support SECO’s commitment to reach 1 percent annual electricity savings statewide. A Best Practices Guide for Energy Efficiency in Municipally‐Owned Services Areas 192 | P a g e Appendix A. Project Introductory Letter to Texas MOUs MEMORANDUM TO: TPPA-Member Municipally Owned Utilities FROM: Mark Zion, Executive Director, TPPA DATE: June 9, 2011 SUBJECT: Energy Efficiency Programs for Your Customers and Community Please consider participating in a new public power project which, at no cost to your utility, can give you the tools to implement proven energy efficiency programs in your community, Please fill out and return the attached questionnaire to TPPA no later than June 23, 2011. Please call if you have any questions or need additional information. This memorandum is to enlist your participation in a project, which at no cost, can help your utility implement or expand energy efficiency projects in your community. The project is just getting underway. It is being funded by DOE and will be conducted by TPPA and the Texas State Energy Conservation Office (SECO). It will consist of an energy-efficiency best practices study for municipally owned utilities (MOUs) in Texas. The results are intended to provide clear benefits for TPPA member utilities like yours, including: Locally-appropriate and ready-to-implement programs based on other successful and cost-effective energy-efficiency efforts. If you participate, the results of the study can be tailored to your MOU to help you plan future energy efficiency efforts at the local level. The tools your utility needs to help your customers realize energy and electric bill savings, and to help our state reach its goal of saving energy. SECO has retained the nationally recognized energy efficiency consulting firm Nexant to conduct this project. Nexant has broad experience, including the development of energy efficiency programs for CPS Energy, San Antonio’s municipal electric system. Beginning in June, Nexant will conduct a study to identify best practices in energy-efficiency programs that are compatible with your local service area conditions. The end result will be a comprehensive guide available to TPPA members: “SAVING ENERGY and MONEY: HOW TO START, EXPAND, OR REFINE MOU PROGRAMS, A Guide to Best Practices for Energy Efficiency in Locally Governed Electric Services Areas in the State.” With fully developed program implementation plans, this guide will give you the option to deliver customer-focused energyefficiency programs, and the tools you need to move forward. However, to ensure the best practices guide that is locally meaningful - YOUR PARTICIPATION IS NEEDED. The Nexant team will match proven energy-efficiency best practices to the individual customer and market characteristics of MOUs like yours. That way, the programs identified in the study will be suitable for adoption if you so choose, implementable, and developed in recognition of your local situation and needs. A Best Practices Guide for Energy Efficiency in Municipally‐Owned Services Areas 193 | P a g e Today, different MOUs in Texas have different energy efficiency programs and needs. Very large systems have mature efficiency programs. This project is aimed primarily at (1) mid-sized systems that already have a number of efficiency programs which they may want to expand or refine, and (2) other mid-sized and smaller MOUs that may just be getting started or that may have very basic programs (like customer education). To support our collective study efforts, please complete the attached questionnaire and return to me at [email protected] or 512-472-5965 (fax) no later than June 23, 2011. We will then forward your responses to Nexant. Your participation will help us create a thorough, beneficial, no-cost guide for public power’s future energy-efficiency program development efforts. Thanks, Mark XC: Pam Groce, SECO; Jessy Shao, PE, Nexant ATTACHMENT – Questionnaire and FAQ. A Best Practices Guide for Energy Efficiency in Municipally‐Owned Services Areas 194 | P a g e Texas State Energy Conservation Office and Texas Public Power Association Introductory Survey: MOU Energy ‐Efficiency. PLEASE RETURN BY JUNE 23, 2011 to [email protected] or 512‐472‐5965(fax). 1. Organization/utility name: Number of customers your organization serves: 2. Does your organization currently offer any energy‐efficiency, renewable energy, or demand programs? YES____ NO____ 3. If yes, what types of programs do you currently offer? Please complete the table below, adding more rows if necessary, or provide the information in an attachment. Targeted Customer Program Name Segment Brief Summary of the Program 4. Using a scale of 1‐5, where 1 indicates “not interested” and 5 indicates “very interested,” please rate your interest in offering new programs or expanding/refining your existing energy‐efficiency programs portfolio. Please choose ONE RESPONSE: ____ 1 – Not Interested ____ 2 ____ 3 ____ 4 ____ 5 – Very Interested 5. What types of energy‐efficiency programs are you most interested in? 6. May someone from Nexant, the consulting firm retained by TPPA and SECO, contact you (or someone else at your organization) to better understand the characteristics of your service territory and further explore your energy‐efficiency program goals? YES____ NO____ 7. Please provide the name, phone number, and e‐mail address for the best person at your organization for us to contact when following up about energy‐efficiency programs. Name: Phone: E‐mail address: If you have any questions, please feel free to contact Mark Zion or Wendell Bell at TPPA, 512‐472‐5965. A Best Practices Guide for Energy Efficiency in Municipally‐Owned Services Areas 195 | P a g e Texas State Energy Conservation Office and Texas Public Power Association FAQs: MOU Energy‐Efficiency Best Practices Guide Participation How will your survey participation – and the best practices guide ‐ benefit your utility? This project will to match national best practice energy‐efficiency programs and program characteristics with those well suited for TPPA MOU utilities. It will give you Locally‐appropriate and ready‐to‐implement programs based on other successful and cost‐effective energy‐efficiency efforts. If you participate, the results of the study can be tailored to your MOU to help you plan future energy efficiency efforts at the local level. You will have the opportunity to provide feedback on which program elements might be most desirable in your community. The resulting guide, “SAVING ENERGY and MONEY: HOW TO START, EXPAND, OR REFINE MOU PROGRAMS, A Guide to Best Practices for Energy Efficiency in Locally Governed Electric Services Areas in the State.” will help you select, develop, and implement customer‐focused energy efficiency programs based on proven best practices. It will provide the tools your utility needs to help your customers realize energy and electric bill savings, and to help our state reach its goal of saving energy. Will resources be available to support energy‐efficiency programs in my community? Options and recommendations for available financing solutions and potential incentives for program participants will be included in this best practices guide. Technical support and implementation assistance may be available to support pilot programs. What is involved in participation – and what is the timeframe? Level 1 ‐ Respond to the brief introductory survey. Level 2 ‐ Submit information to follow‐up request to provide existing, published data (annual reports, etc.). Level 4 ‐ Join in a one‐hour brainstorming session (webinar or conference call). Level 5 ‐ Participate in a one‐hour telephone interview to discuss the unique characteristics of your community, utility, and energy efficiency goals. Level 6 – Respond to research findings when Nexant presents its initial research and best practice program findings at the TPPA annual statewide conference in July. This study participant session will give you an opportunity to respond to early results, explore the applicability of identified best practice elements to your communities, and develop topics for further examination. A written feedback mechanism will be provided to those who are unable to attend the TPPA conference in San Antonio. A Best Practices Guide for Energy Efficiency in Municipally‐Owned Services Areas 196 | P a g e MEMORANDUM TO: TPPA-Member Municipally Owned Utilities1 FROM: Mark Zion, Executive Director, TPPA DATE: June 9, 2011 SUBJECT: Energy Efficiency Programs for Your Customers and Community Please consider participating in a new public power project which, at not cost to your utility, can give you the tools to: (1) expand or refine your current energy efficiency programs, and/or (2) implement new energy efficiency programs based on proven best practices. This project can help your municipally owned utility comply with SB-924 – new legislation which will require your MOU to report annually to the state on your efficiency efforts. You will have to make these new reports every year starting in 2012 in a state-standardized format. Previous law only required a one-time MOU report on energy efficiency. Your MOU made that report to SECO in 2009 and a copy of the summary sheet is attached. Please update that form and return it to TPPA no later than June 23, 2011. Please call if you have any questions or need additional information. This memorandum is to enlist your participation in a project, which at no cost, can help your utility implement or expand energy efficiency projects in your community. The project is just getting underway. It is being funded by DOE and will be conducted by TPPA and the Texas State Energy Conservation Office (SECO). It will consist of an energy-efficiency best practices study for municipally owned utilities (MOUs) in Texas. The results are intended to provide clear benefits for TPPA member utilities like yours, including: Locally-appropriate and ready-to-implement programs based on other successful and cost-effective energy-efficiency efforts. If you participate, the results of the study can be tailored to your MOU to help you plan future energy efficiency efforts at the local level. The tools your utility needs to help your customers realize energy and electric bill savings, and to help our state reach its goal of saving energy. SECO has retained the nationally recognized energy efficiency consulting firm Nexant to conduct this project. Nexant has broad experience, including the development of energy efficiency programs for CPS Energy, San Antonio’s municipal electric system. Beginning in 1 To MOUs >500,000 MWH sales in 2005 and subject to SECO reporting requirements. A similar communication has been sent to smaller MOU systems. A Best Practices Guide for Energy Efficiency in Municipally‐Owned Services Areas 197 | P a g e June, Nexant will conduct a study to identify best practices in energy-efficiency programs that are compatible with your local service area conditions. The end result will be a comprehensive guide available to TPPA members: “SAVING ENERGY and MONEY: HOW TO START, EXPAND, OR REFINE MOU PROGRAMS, A Guide to Best Practices for Energy Efficiency in Locally Governed Electric Services Areas in the State.” With fully developed program implementation plans, this guide will give you the option to deliver customer-focused energyefficiency programs, and the tools you need to move forward. However, to ensure the best practices guide that is locally meaningful - YOUR PARTICIPATION IS NEEDED. The Nexant team will match proven energy-efficiency best practices to the individual customer and market characteristics of MOUs like yours. That way, the programs identified in the study will be suitable for adoption if you so choose, implementable, and developed in recognition of your local situation and needs. Today, different MOUs in Texas have different energy efficiency programs and needs. Very large systems have mature efficiency programs. This project is aimed primarily at (1) mid-sized systems that already have a number of efficiency programs which they may want to expand or refine, and (2) other mid-sized and smaller MOUs that may just be getting started or that may have very basic programs (like customer education). To support our collective study efforts, please complete the attached questionnaire and return to me at [email protected] or 512-472-5965 (fax) no later than June 23, 2011. We will then forward your responses to Nexant. Your participation will help us create a thorough, beneficial, no-cost guide for public power’s future energy-efficiency program development efforts. Thanks, Mark XC: Pam Groce, SECO; Jessy Shao, PE, Nexant ATTACHMENT – 2009 Energy Efficiency Report Summary Sheet A Best Practices Guide for Energy Efficiency in Municipally‐Owned Services Areas 198 | P a g e Appendix B. Texas MOUs Phone Interview Guide : SECOIn‐depthInterviewGuide forMOUs Respondent name/organization: Respondent phone/email: Interview date: Interviewer: Introduction Hi, my name is [NAME] from Nexant team. Nexant team is hired by the State Energy Conservation Office (SECO) to conduct a study of energy‐efficiency best practices for Texas municipal utilities. You may recall receiving an email from TPPA in June with some information about this study. The purpose of the interview is to gather information about local conditions and get your feedback about what kinds of energy‐efficiency programs you are interested in. This interview should take approximately one hour. Do you have any questions before we begin? More Information About This Study (if needed): TPPA, in partnership with the State Energy Conservation Office, and with funding support from the U.S. Department of Energy, is embarking on a study of energy‐efficiency best practices for Texas municipal utilities. This study will identify and catalogue best practices gleaned from demand‐side management programs offered throughout the country and analyze those best practices for their compatibility with conditions in local service areas. The results of this study will be offered in a comprehensive guide entitled: “SAVING ENERGY and MONEY: HOW TO GET STARTED, A Guide to Best Practices for Energy Efficiency in Locally Governed Electric Services Areas in the State.” The information in this Guide will provide a valuable resource for TPPA members interested in developing customer‐focused energy‐efficiency programs, and who want to contribute to the statewide municipal utility goal of one percent energy savings over the next three years. OperationalStructure First, I’d like to start by asking some questions to learn about how your organization operates. 1. Can you begin by telling me what your title is, and what your typical responsibilities include? 2. How many employees does your utility employ? A Best Practices Guide for Energy Efficiency in Municipally‐Owned Services Areas 199 | P a g e 1. Is there someone in the utility or on city staff who is in charge of energy‐efficiency and/or environmental services? If yes, may we contact them? 2. Are there utility customer reps? If Yes, does the utility break down accounts by customer reps? Also may we contact the customer reps? 3. Does your organization use third‐party contractors to deliver any functions within your utility, for example, marketing, call center, billing? 4. Can you talk a little about how your utility develops its electricity rates? a. What is the board or council’s role in this process? b. Is there separate utility charge on the electric demand use? If so, how do you define the demand period? c. Have there been any recognizable trends either increasing or decreasing in your rates over the last five years? [PROBE FOR REASONS WHY] d. Would your utility decision makers consider a rate increase to help pay for energy efficiency programs for your customers? 5. Have there been any other changing trends in population or energy usage over the past five or so years? [PROBE FOR REASONS WHY] 6. How does your utility obtain electricity? a. Do you own generation resources? Does your utility every have trouble meeting demand during peak periods? (i.e. – brownouts) A Best Practices Guide for Energy Efficiency in Municipally‐Owned Services Areas 200 | P a g e LocalMarketConditions I’d like to learn about your service territory. These next questions will help me gain a better understanding of your customer base. 1. How does your utility typically interact with the community (not just for energy‐efficiency programs, but all interactions) (e.g., events, news releases, etc.)? 2. I’d like to know more about the potential for and specific opportunities for energy‐efficiency in your territory. For each customer sector (e.g., residential, commercial, industrial) I am going to list a range of energy uses, please indicate whether you feel there is low, moderate, or significant energy savings potential in your community related to these technologies. [NOTE WE ARE ONLY LOOKING FOR THEIR OPINION ABOUT SAVINGS POTENTIAL, NOT ABOUT THEIR ABILITY TO OFFER A PROGRAM] [PROBE ON MOST COMMON TYPES OF EXISTING TECHNOLOGIES, ADD INSIGHTS AND DISCUSSION NOTES BELOW TABLE]. Sector/technology Savings potential [SELECT ONE] 1=low opportunity 2=moderate opportunity 3=Significant opportunity Residential Lighting Heating Cooling Building shell (insulation, air sealing, windows, solar screens) Kitchen appliances (refrigerator, dishwasher, oven, washer/dryer) Renewable energy (Solar PV, geothermal heat pump) solar water heat Other (list) Low Income weatherization or other opportunities (if different from broader residential sector)? A Best Practices Guide for Energy Efficiency in Municipally‐Owned Services Areas 201 | P a g e Lighting HVAC Data Center/Server Room Building Controls/Automation/System Operation Optimization Motors Building shell (Insulation, Window film) Office Equipment Refrigeration O&M Measures Process Central Plant Upgrade Other (list) Discussion notes: 1. Is there anything else you can tell me about the energy usage characteristics or opportunities for energy savings in your territory? 2. Do you have any especially high‐usage customers like industrial facilities, data centers, or college campuses in your territory? LocalDeliveryCapacity 3. Are you aware of any outside efforts to promote energy‐efficiency in your service territory, either through nonprofit organizations, the city or county, or other organizations? [PROBE FOR DETAILS AND CONTACT INFORMATION] 4. Are you aware of any efforts to distribute CFLs or other energy efficiency measures in your service territory, either through these types of organizations or through your utility? [PROBE FOR DETAILS AND CONTACT INFORMATION] A Best Practices Guide for Energy Efficiency in Municipally‐Owned Services Areas 202 | P a g e 1. Do you know if these trade allies are already integrating energy‐efficiency into their business practices? 2. Do you know if the local home improvement stores such as Best Buy, Lowes, or smaller locally‐ owned stores sell high‐efficiency products? ProgramOfferings The next several questions are about energy efficiency programs specifically. Current Program Offerings [Fill out table on following page with programs and available information before interview, ask for information gaps during interview] A Best Practices Guide for Energy Efficiency in Municipally‐Owned Services Areas 203 | P a g e 1. Does your utility currently offer energy efficiency programs for your customers? [If no, skip to question 25] Programs Program name Measures Year launched Participation Eligibility Target Customer Sector How is it funded? Who implements (e.g., in house, 3rd party)? How do you market? Are goals being met? Process and other notes (e.g., how does the program work?) Are there goals (e.g., participation, savings)? How are the goals or targets decided? A Best Practices Guide for Energy Efficiency in Municipally‐Owned Services Areas 204 | P a g e 1. How did you evaluate, measure and verify the savings for your programs? 2. How did you track and report the programs? 3. Do you measure program cost effectives? [If yes], how? 4. Of the past program participants, how well is the program received? Is the feedback you’ve received overall positive or negative? [PROBE FOR WHY] 5. How well is the program received by utility officials and decision making boards/councils? 6. How does your utility make decisions on whether or not to offer programs? Please describe the process. 7. Has the utility ever produced any type of annual report that provides detail on your programs, such as eligibility, incentive amounts, program budgets, spending, participation, etc.? If yes, would you be willing to share a copy of this with us? 8. Has your utility offered programs in the past that are no longer offered? [IF YES] Why were they discontinued? Future Program Offerings 9. Are there any/other types of programs you are interested in offering? [PROBE FOR WHY] 10. Now I’m going to read you a list of common operational constraints utilities face in offering energy efficiency programs. For each, please indicate whether this constraint is not problematic, slightly problematic, or a significant issue for your utility. A Best Practices Guide for Energy Efficiency in Municipally‐Owned Services Areas 205 | P a g e Prevalence of Constraint [ENTER 1‐3] Constraint 1=Not problematic 2=Slightly Problematic 3= Significant Issue Lack of funding Lack of interest among city/utility decision makers Lack of interest among community members Lack of staff resources Lack of skilled contractors needed to deliver programs Few dealers/retailers offer high efficiency options Discussion notes: 1. Do you face any additional operational constraints that I have not mentioned? [ADD TO TABLE; PROBE WITH PREVALENCE QUESTION FOLLOW‐UP] 2. I’m going to read you a list of common barriers for customers to participate in energy efficiency programs. For each, please indicate whether this barrier is not problematic, slightly problematic, or a significant issue in your territory. Prevalence of Barrier [ENTER 1‐3] Barrier 1=Not problematic 2=Slightly Problematic 3= Significant Issue Lack of program awareness among customers or trade allies Lack of awareness or concern about general environmental issues Lack of availability of qualifying measures A Best Practices Guide for Energy Efficiency in Municipally‐Owned Services Areas 206 | P a g e 1. Do you face any additional barriers that I have not mentioned? [ADD TO TABLE; PROBE WITH PREVALENCE QUESTION FOLLOW‐UP] 2. If more additional labor resources were needed to offer energy efficiency programs, would your organization have to generate additional funding to add staff? Or, do you think the organization could absorb these costs with your current resources? 3. Now I’m going to read you a list of considerations associated with a utility’s decision to offer energy efficiency programs. For each, please indicate whether it is high, moderate, or low priority consideration for your organization. Consideration Priority [ENTER 1‐3] 1=Low priority 2=Moderate priority 3= High Priority Obtain the most energy savings for the lowest cost Reduce peak load to avoid high peaking costs or blown‐outs Good utility public relations value Contributes to local economic growth (job creation) Contributes to local environmental goals (emission, pollution reduction) Educate or transform the community to be aware of and adopt energy efficiency measures Incentivizes cutting edge technologies Can be implemented without customer rate increases/alternative funding available 4. Does your organization have any additional priorities that I have not mentioned? [DESCRIBE BELOW; PROBE WITH PREVALENCE QUESTION FOLLOW‐UP] A Best Practices Guide for Energy Efficiency in Municipally‐Owned Services Areas 207 | P a g e Appendix C. Program Benchmarking Database 2007‐ 2008 Equipment Rebates CA 2006 NY Multiple Utilities Upstream Res Multiple measures Equipment Rebates Prescriptive rebates Res White goods 2006 Equipment Rebates Prescriptive rebates Res White goods CT 2006 Equipment Rebates Prescriptive rebates Res Multiple Utilities MA 2006 Equipment Rebates Prescriptive rebates Multiple Utilities VT 2006 Equipment Rebates Prescriptive rebates Utility Name Program Name Lighting and appliances High Efficiency Appliance Rebate Program New York Energy $mart Products Program Northeast ENERGY STAR® Lighting and Appliance Initiative Northeast ENERGY STAR® Lighting and Appliance Initiative Northeast ENERGY STAR® Lighting and Appliance Initiative B‐C Ratio UT Res Nevada Power Company; Sierra Pacific Power Company Rocky Mountain Power Southern California Edison; San Diego Gas & Electric; PG&E New York State Energy Research and Development Authority (NYSERDA) Net Benefits Prescriptive rebates ENERGY STAR® Lighting and Appliance Program Cool Cash Incentive Program 84,600 NPV Benefits Equipment Rebates Net Present Value (NPV) Costs 2006‐ 2007 Primary Test NV Gross Winter MW Res London Hydro Gross Summer MW Target Sector Prescriptive rebates Chill Out Gross Annual MWh Incentive Structure Equipment Rebates Number of Participants Program Category Total Cost Year ON Canada Predominant Measure State 700,000 63,182 57,364 4,800 1.7 756 647,000 Multiple measures 2,645 Res Lighting, appliances 2,645 Res Lighting, appliances 2,645 A Best Practices Guide for Energy Efficiency in Municipally‐Owned Services Areas TRC 208 | P a g e Equipment Rebates Prescriptive rebates Res Lighting Residential Heating and Cooling Program Consumer Rebate Program MI 2009 Equipment Rebates Prescriptive rebates Res Ameren Illinois IL 2009 Equipment Rebates Prescriptive rebates Res room AC, dehumidifiers, ceiling fans, CFLs Ameren Illinois IL 2009 Equipment Rebates Prescriptive rebates Res HVAC DTE Energy MI 2009 Equipment Rebates Prescriptive rebates Res HVAC Prescriptive rebates Res 1,400 1.8 2,095,290 92,454 1,015,490 40,350.187 2.91683 7917 10,489 5.26 5091 1,166 13,241 11,500 NJ 2006 AE TX 2005 Equipment Rebates Prescriptive rebates Res HVAC Multiple Utilities MA 2005 Equipment Rebates Prescriptive rebates Res HVAC CT 2005 Equipment Rebates Prescriptive rebates Res HVAC CA 2005 Equipment Rebates Prescriptive rebates Res HVAC A Best Practices Guide for Energy Efficiency in Municipally‐Owned Services Areas 9 Multiple Utilities Connecticut Light & Power and United Illuminating Company Los Angeles Department of Water and Power 1,103 Equipment Rebates 9 DTE Energy 4,817 clothes washers, thermostats, showerheads, CFLs B‐C Ratio 2002 Net Benefits WA NPV Benefits Seattle City Light Torchiere Retail Coupon Program Residential and Small Business ENERGY STAR® Products Program Residential Lighting and Appliance Program New Heating and Cooling Equipment Program Residential HVAC Program COOL Advantage Program Residential Efficiency Programs Massachusetts COOL SMART with ENERGY STAR® Net Present Value (NPV) Costs Res Primary Test Target Sector Prescriptive rebates Gross Winter MW Incentive Structure Equipment Rebates Gross Summer MW Program Category 2002 Gross Annual MWh Year WA Number of Participants State Seattle City Light; Seattle Public Utilities Total Cost Utility Name WashWise Program Predominant Measure Program Name 7,473 9.6 0.023 209 | P a g e ENERGY STAR® New Homes Program New Jersey ENERGY STAR® Homes Program National Grid RI 2005 Equipment Rebates Prescriptive rebates Res HVAC 210 Sacramento Municipal Utility District CA 2005 Equipment Rebates Prescriptive rebates Res 6,300 2005 Equipment Rebates Prescriptive rebates Res Heat Pumps Prescriptive rebates Res Air Conditioning 24,721 14,367.659 7.591 11,458 2,415 0.96 2,987 1,140 0.09847 Tacoma Power WA Nevada Power Company NV 2009 Equipment Rebates DTE Energy MI 2009 Audit and/or Direct Install Whole building Res Weatherization Ameren Illinois IL 2009 Audit and/or Direct Install Whole building Res Multiple measures National Grid; NSTAR; Unitil; Cape Light Compact; Western Massachusetts Electric Company MA 2010 Audit and/or Direct Install Whole building Res Multiple Measures Rocky Mountain Power UT 2006‐ 2008 New Construction Whole building Res Multiple measures New Jersey Clean Energy Program NJ 2001‐ 2006 New Construction Whole building Res Multiple measures A Best Practices Guide for Energy Efficiency in Municipally‐Owned Services Areas 16,380 9,566,922 5.348 2,000 2 500 5,934 8,982.301 26,309 24,018 B‐C Ratio Net Benefits HVAC NPV Benefits Res Net Present Value (NPV) Costs Prescriptive rebates Primary Test Equipment Rebates Gross Winter MW Total Cost 2005 Gross Summer MW Predominant Measure IA Gross Annual MWh Target Sector MidAmerican Energy Company Number of Participants Incentive Structure Mass Save Program Category Heat Pump System Rebate Residential High Efficiency Air Conditioning Residential Audit and Weatherization Program Home Energy Performance Program Year Equipment Efficiency Program State Residential Equipment Program Rhode Island COOL CHANGE with ENERGY STAR® Utility Name Program Name TRC 51.7 TRC 210 | P a g e 2006 New Construction Whole building Res Multiple measures IA 2006 New Construction Whole building Res NY 2006‐ 2007 New Construction Whole building 2006 New Construction Whole building AZ 2006 New Construction CO 2009 NV 200 2,161 0.444 Multiple measures 5,866 3,302.088 1.952 Res Multiple measures 342 972 0.98 Res Multiple measures 14,000 25,180 28 Whole building Res Multiple measures 7,118 35,200 41 New Construction Whole building Res Multiple measures 2,350 11,181 2009 New Construction Whole building Prescriptive rebates Prescriptive rebates Res Multiple measures 1,023 2,041.407 0.919 Res HVAC Res HVAC HVAC 18,000 3,219.918 54.707 7,100 600 Xcel Energy CO 2008 DR Saver’s Switch Xcel Energy MN 2008 DR Air Conditioning Load Management Program (DR Program) Nevada Power Company NV 2009 DR Prescriptive rebates Res Neighborhood Power Project Seattle City Light; Phinney Neighborhood Association WA 2002 Equipment Rebates Prescriptive rebates Com A Best Practices Guide for Energy Efficiency in Municipally‐Owned Services Areas Total Cost Saver’s Switch Colorado Governor's Energy Office Nevada Power Company TX 1,837 Tucson Electric Power Oncor Electric Delivery 25,064 LIPA ENERGY STAR® Labeled Homes Program ENERGY STAR® Homes Program Tucson Electric Power Guarantee Home Program Colorado ENERGY STAR® New Homes Program Energy Plus New Homes LIPA B‐C Ratio VT Vermont Gas Systems, Inc. and Efficiency Vermont Interstate Power and Light Company; MidAmerican Energy Net Benefits Multiple measures NPV Benefits Res Net Present Value (NPV) Costs Whole building Primary Test Predominant Measure New Construction Gross Winter MW Target Sector 2006‐ 2008 Gross Summer MW Incentive Structure CA Gross Annual MWh Program Category Multiple Utilities Number of Participants Year Iowa New Home Construction Program State ENERGY STAR® New Homes Program Homebase New Construction/ Vermont ENERGY STAR® Homes Utility Name Program Name 100,000 300,000 TRC TRC 211 | P a g e B‐C Ratio CHP Net Benefits Ind NPV Benefits Whole building Net Present Value (NPV) Costs CHP Primary Test Com Gross Annual MWh Whole building Gross Winter MW Local Government Energy Watch Partnership Program Local Government Energy Watch Partnership Program Local Government Energy Watch Partnership Program Com Gross Summer MW RETAP Prescriptive rebates Number of Participants CHP Demonstration Program CHP Demonstration Program CHP Demonstration Program CHP Demonstration Program Retiree Environmental Technical Assistance Program (RETAP) Equipment Rebates Education and Behavior Impact Education and Behavior Impact 12,000 0.12 Total Cost 2002 Predominant Measure Year WA Target Sector State Seattle City Light Incentive Structure Utility Name Green Power Program Category Program Name NYSERDA NY 2009 NYSERDA NY 2009 NYSERDA NY 2009 Equipment Rebates Whole building Com CHP 146 109,461 203 NYSERDA NY 2009 Equipment Rebates Whole building Ind CHP 146 109,461 203 Minnesota Pollution Control Agency (MPCA) MN 2004‐ 2008 Audit and/or Direct Install Prescriptive rebates Com 143 1,070.881 MPCA MN 2004‐ 2008 Audit and/or Direct Install Prescriptive rebates Ind 143 1,070.881 PG&E CA 2006‐ 2008 Audit and/or Direct Install Prescriptive rebates Res Multiple Measures 22 66,230 10.9 PG&E CA 2006‐ 2008 Audit and/or Direct Install Prescriptive rebates Com Multiple Measures 22 66,230 10.9 PG&E CA 2006‐ 2008 Audit and/or Direct Install Prescriptive rebates Ind Multiple Measures 22 66,230 10.9 A Best Practices Guide for Energy Efficiency in Municipally‐Owned Services Areas 212 | P a g e Prescriptive rebates Com Prescriptive rebates Ind Industrial Energy Efficiency Programs Education and Behavior Impact Education and Behavior Impact B‐C Ratio Ind Net Benefits Prescriptive rebates NPV Benefits Audit and/or Direct Install Net Present Value (NPV) Costs 2007 Primary Test CT Gross Winter MW Com Gross Summer MW Prescriptive rebates Gross Annual MWh Target Sector Audit and/or Direct Install Number of Participants Incentive Structure 2007 Total Cost Program Category CT Predominant Measure Year PRIME Program Connicut Light & Power; Connecticut Energy Efficiency Fund Connecticut Light & Power; Connecticut Energy Efficiency Fund State PRIME Program Utility Name Program Name Manufacturing efficiency Focus on Energy Industrial Program Focus on Energy WI 2007 Focus on Energy Industrial Program Focus on Energy WI 2007 New York State Residential ENERGY STAR® HVAC Training, Education, Certification, & Awareness (TECA) Program NYSERDA NY 2005 Education and Behavior Impact Prescriptive rebates Ind HVAC Energy Education and Consultation Nevada Power Company NV 2009 Education and Behavior Impact Prescriptive rebates Ind Trainings and education sessions California Statewide Emerging Technologies Program PG&E; SCE; Southern California Gas; San Diego Gas & Electric CA 2004‐ 2008 Innovative Financing Financing Res A Best Practices Guide for Energy Efficiency in Municipally‐Owned Services Areas 55 3,100 1,500 141,000 20.7 45,034 3,895.7 5.217 79 n/a n/a TRC 213 | P a g e Prescriptive rebates Res Appliance Recycling DTE Energy MI 2009 Appliance Recycling Prescriptive rebates Res Appliance Recycling PG&E CA 2006‐ 2008 Appliance Recycling Prescriptive rebates Res Appliance Recycling Seattle City Light WA 2002 Equipment Rebates Prescriptive rebates Res Water heaters Focus on Energy WI 2009 Appliance Recycling Prescriptive rebates Res HVAC Nevada Power Company NV 2009 Appliance Recycling Prescriptive rebates Res Appliance Recycling DOE (Federal); Public Service of New Hampshire; Unitil; New Hampshire Electric Cooperative; Granite State Electric; Keyspan; Northern Utilities NH 2006 Audit and/or Direct Install Whole building Res Weatherization A Best Practices Guide for Energy Efficiency in Municipally‐Owned Services Areas B‐C Ratio Appliance Recycling Net Benefits 2010 NPV Benefits MO Net Present Value (NPV) Costs Ameren Missouri Primary Test Res Gross Winter MW Prescriptive rebates Gross Summer MW Innovative Financing Gross Annual MWh Target Sector 2006 9,574 13,891 1.65 70,663 50,423.895 8.038 Number of Participants Incentive Structure CA Total Cost Program Category SCE Predominant Measure Year New Hampshire Weatherization Program State Innovative Designs for Energy Efficiency Applications Refrigerator Recycling Program Residential Appliance Recycling Program California Statewide Appliance Recycling Program Water Heater Rebate Program Early Replacement of Inefficient Residential Central Air Conditioners Second Refrigerator Collection and Recycling Program Utility Name Program Name 100 704 2,042 1.25 9,054 12,439.4 2.913 656 463.136 TRC TRC 214 | P a g e WA 2003‐ 2005 Audit and/or Direct Install Whole building Res Weatherization 419 AZ 2010 Whole building Whole building Whole building Res Weatherization 93 1,113.15 2007‐ 2009 2007‐ 2009 Audit and/or Direct Install Audit and/or Direct Install Audit and/or Direct Install Res Weatherization 601 632.3333333 Res Weatherization 88.66666667 179.3333333 17,842 25,062.242 472 1.256 2,700 2,995.569 LIWAP Utah LIWAP Idaho LIWAP Electric Partnership Program Ameren LIWAP Iowa Weatherization Program Salt River Project (SRP) Rocky Mountain Power Rocky Mountain Power UT Multiple Utilities OH 2006‐ 2008 Audit and/or Direct Install Whole building Res Weatherization MO 2006‐ 2008 Audit and/or Direct Install Whole building Res Weatherization IA 2009 Audit and/or Direct Install Whole building Res Weatherization Ameren Corporation DOE (Federal); Home Energy Assistance Program (HEAP) (State funded); Interstate Power and Light Company; MidAmerican Energy; Black Hills Energy ID A Best Practices Guide for Energy Efficiency in Municipally‐Owned Services Areas B‐C Ratio Pacific Power Net Benefits Washington Low Income Weatherization Program (LIWAP) NPV Benefits Predominant Measure Multiple Measures Net Present Value (NPV) Costs Target Sector Res Primary Test Incentive Structure Whole building Gross Winter MW Program Category Audit and/or Direct Install Gross Summer MW Year 2010 Gross Annual MWh State MA Number of Participants Utility Name Massachusetts Low Income Program National Grid; NSTAR; Unitil; Cape Light Compact; Western Massachusetts Electric Company Total Cost Program Name TRC 0.975 0.494 TRC TRC 215 | P a g e PA 2008 Audit and/or Direct Install Whole building Res Weatherization/ Education SCE CA 2001‐ 2004 Audit and/or Direct Install Whole building Res Weatherization Multiple Utilities VT 2000‐ 2005 Audit and/or Direct Install Whole building Res Weatherization Multiple Utilities NH 2002‐ 2004 Audit and/or Direct Install Whole building Res Weatherization/ Education Multiple Utilities CO 2003‐ 2004 Audit and/or Direct Install Whole building Res LIPA NY 2000‐ 2004 Audit and/or Direct Install Whole building Multiple Utilities OR 2001‐ 2004 DR Home$ense Program Golden Valley Electric Association (GVEA); Interior Weatherization, Inc AK 1992‐ 2005 Assisted Multi‐ Family Building Multiple Utilities NY 2000‐ 2005 NHSAVES@Home; HEAP Energy $avings Partners Residential Energy Affordability Partnership Program Low Income DSM Programs 8,812 1.85 46,921.25 27,750 1,099 1,870.6 978 2,947.2 Weatherization 4,000 24.35801002 Res Weatherization/ Education 4076.6 3958.8 Whole building Res Weatherization 1277.4 1534.1855 Audit and/or Direct Install Whole building Res Weatherization 277.1428571 2,000 Audit and/or Direct Install Whole building Res Weatherization 7.333333333 14,625 A Best Practices Guide for Energy Efficiency in Municipally‐Owned Services Areas Total Cost 604.616 8.025 TRC 0.45528 1.071428571 TRC B‐C Ratio PECO Low Income Usage Reduction Program Energy Management Assistance Low Income Single Family Service 290 Net Benefits Predominant Measure Weatherization NPV Benefits Target Sector Res Net Present Value (NPV) Costs Incentive Structure Whole building Primary Test Program Category Audit and/or Direct Install Gross Winter MW Year 2003 Gross Summer MW State OH Gross Annual MWh Utility Name Ohio Home WAP DOE (Federal); HEAP (State funded); American Electric Power; Columbia Gas; Dominion; Vectren Energy Delivery of Ohio; Cinergy Number of Participants Program Name 216 | P a g e Number of Participants Gross Annual MWh 989.5 2,048.5 OR 2002‐ 2004 Audit and/or Direct Install Whole building Res Weatherization 1,465 5,681.666667 UT 2005 Appliance Recycling Prescriptive rebates Res Appliance Recycling IN 2001‐ 2002 Audit and/or Direct Install Whole building Res Weatherization B‐C Ratio Total Cost Weatherization Net Benefits Predominant Measure Res NPV Benefits Target Sector Whole building Net Present Value (NPV) Costs Incentive Structure Audit and/or Direct Install Primary Test Program Category 1997‐ 2002 Gross Winter MW Year VT Gross Summer MW State Utility Name Program Name Program Multifamily Low Income Program Energy Conservation Helping Oregonians Low Income Refrigerator Replacement Program Indiana LIWAP and Refrigerator Replacement Program Efficiency Vermont; Vermont Gas Systems; Burlington Electric Department Oregon Housing & Community Services; Portland General Electric; PacifiCorp State of Utah; Utah Power; Program Grantees Cinergy/ PSI; State of Indiana Weatherization; Indiana Community Action Programs 671.3333333 1,988.5 458 788.171 Low Income Weatherization SOP TXU Electric Delivery TX 2003‐ 2005 Audit and/or Direct Install Whole building Res Weatherization 16978.66667 25,760.33333 Targeted HPwES Focus on Energy; Wisconsin Energy Conservation Corporation WI 2003‐ 2005 Audit and/or Direct Install Whole building Res Multiple measures 213.6666667 172.2153333 Wisconsin HEAP Focus on Energy WI 2004 Weatherization Focus on Energy WI 2004 Res Weatherization Oregon WAP Office of Housing OR 2003‐ Prescriptive rebates Whole building Whole Res WAP Audit and/or Direct Install Audit and/or Direct Install Audit and/or Res Weatherization A Best Practices Guide for Energy Efficiency in Municipally‐Owned Services Areas 0.042522 TRC TRC 217 | P a g e Audit and/or Direct Install Whole building Res Weatherization Energy Partners PG&E CA 2006 Audit and/or Direct Install Whole building Res Weatherization/ Education CenterPoint Energy non‐Profit Affordable Housing Project CenterPoint Energy MN 2007‐ 2008 Audit and/or Direct Install Whole building Res The Neighborhood Energy Saver Progress Energy FL 2007 Audit and/or Direct Install Whole building PA 2004‐ 2005 Audit and/or Direct Install PA 2008‐ 2010 Universal Services Program Low Income Usage Reduction Program PECO Allegheny Power 24,300 Weatherization 56.375 Res Weatherization/ Education 2,000 Whole building Res Weatherization Audit and/or Direct Install Whole building Res Weatherization 1,062 Prescriptive rebates Res Weatherization/ Education 2,378 Colorado Governor's Energy Office CO 2006‐ 2007 Education and Behavior Impact Jersey Central Power & Light NJ 2003‐ 2004 Audit and/or Direct Install Whole building Res Weatherization Niagara Mohawk NY 1998 Audit and/or Direct Install Whole building Res Weatherization New Jersey LIWAP DOE (Federal) NJ 2004 Weatherization New Jersey Board of Public NJ 2004 Whole building Whole building Res New Jersey Comfort Partners Audit and/or Direct Install Audit and/or Direct Install Res Weatherization First Response Program New Jersey Comfort Partners Seniors' Pilot Program Low Income Customer Assistance Program A Best Practices Guide for Energy Efficiency in Municipally‐Owned Services Areas Number of Participants 66,043 Total Cost Incentive Structure 1.366666667 Program Category 9933.333333 Year 5907.666667 113440.3333 TRC 3688.888889 0.844444444 170.19 704 6.887197223 336 154.56 6,268 305 B‐C Ratio 2006‐ 2007 0.67 3333.333333 Net Benefits NY 0.48 building NPV Benefits NYSERDA 4,200 Direct Install Net Present Value (NPV) Costs Weatherization 2005 Primary Test Res Gross Winter MW Whole building Appliance Management Program and Low Income Services EmPOWER New York Gross Summer MW Audit and/or Direct Install and Community Services Gross Annual MWh Predominant Measure 2006‐ 2007 State RI Utility Name National Grid Program Name Target Sector 218 | P a g e Prescriptive rebates Res Education NV 2009 Audit and/or Direct Install Whole building Res Weatherization OR 2008 Equipment Rebates Custom rebates Com HVAC NEEA OR 2008 Equipment Rebates Custom rebates Com HVAC NEEA WA 2008 Equipment Rebates Custom rebates Com HVAC NEEA WA 2008 Equipment Rebates Custom rebates Com HVAC NYSERDA NY 2009‐ 2010 Equipment Rebates Custom rebates Com Lighting 81.81818182 7,860 2.13 NYSERDA NY 2009‐ 2010 Equipment Rebates Custom rebates Ind Lighting 81.81818182 7,860 2.13 APS AZ 2006‐ 2007 Equipment Rebates Upstream Res Lighting 65,600 NEEA OR 2005‐ 2006 Equipment Rebates Upstream Res Lighting 0.03 2,500 456.459 980 3,327.228 B‐C Ratio Education and Behavior Impact 2,686 Net Benefits 2009 829 NPV Benefits IA Net Present Value (NPV) Costs Weatherization Primary Test Res Gross Winter MW Prescriptive rebates Gross Summer MW Audit and/or Direct Install Gross Annual MWh 2008 Number of Participants Predominant Measure MI Total Cost Target Sector Small Commercial HVAC Pilot Program Small Commercial HVAC Pilot Program Small Commercial HVAC Pilot Program Small Commercial HVAC Pilot Program New York Energy $mart Commercial Lighting Program New York Energy $mart Commercial Lighting Program APS ENERGY STAR® Residential Lighting Program ENERGY STAR® Residential Incentive Structure Comfort Savings Program Category Iowa Energy Wise Program Year Residential Energy Efficiency Assistance Program State Program Utility Name Program Name Utilities (NJBPU) Office of Clean Energy DTE Energy Alliant Energy – IPL, Black Hills Energy, and MidAmerican Energy Nevada Power Company Northwest Energy Efficiency Alliance (NEEA) A Best Practices Guide for Energy Efficiency in Municipally‐Owned Services Areas 83 8,800,000 2.074 2.074 2.074 2.074 0.944 TRC TRC TRC 219 | P a g e Equipment Rebates Upstream Res Lighting PG&E CA 2000‐ 2006 Upstream Res Lighting 4428571.429 Efficiency Vermont VT 2006 Upstream Res Lighting Lighting Program Efficiency Maine ME 2006 Equipment Rebates Equipment Rebates Equipment Rebates Upstream Res Lighting Oncor Electric Delivery Air Conditioning Installer Information and Training MTP Oncor Electric Delivery TX 2006 Equipment Rebates Prescriptive rebates Res HVAC Cool Homes LIPA NY 2006‐ 2007 Equipment Rebates Upstream Res 2007 Equipment Rebates Upstream 2007 Equipment Rebates B‐C Ratio 2006‐ 2007 Net Benefits WA NPV Benefits Puget Sound Energy Net Present Value (NPV) Costs Lighting Primary Test Predominant Measure Res Gross Winter MW Target Sector Upstream Gross Summer MW Incentive Structure Equipment Rebates Gross Annual MWh Program Category 2005‐ 2006 Number of Participants Year WA Total Cost State NEEA Program Name Utility Name Lighting Program ENERGY STAR® Residential Lighting Program Puget Sound Energy ENERGY STAR® Residential Lighting Program Upstream Lighting Program Community Lighting Events Bright Ideas Commercial Lighting Bright Ideas Commercial Lighting AC Distributor MTP Residential Energy Efficient Lighting Energy Efficient Pool Pumps ENERGY STAR® Manufactured Homes Efficiency New Brunswick Efficiency New Brunswick NB (Canad a) NB (Canad a) TXU Electric Delivery Nevada Power Company Nevada Power Company TX 2005 NV 2009 NV 2009 Nevada Power Company NV 2009 8,800,000 1,600,000 55,300 338714.2857 5 265,053 75,638.75 22.167 41 10386 8.9 HVAC 4,444 13277.77778 18.71111111 Com Lighting 37,800 3,500 1.75 Upstream Ind Lighting 37,800 3,500 24,050 Equipment Rebates Equipment Rebates Equipment Rebates Upstream Res HVAC Upstream Res Lighting 2,667,278 113,868.8 9.786 Upstream Res Pool pumps 1,102 4,232.584 0.564 Equipment Rebates Prescriptive rebates Res Multiple measures 0 0 0 A Best Practices Guide for Energy Efficiency in Municipally‐Owned Services Areas 10 TRC TRC TRC 220 | P a g e 0 Incentive Structure Target Sector Predominant Measure Equipment Rebates Prescriptive rebates Res Renewables Xcel Energy MN 2000‐ 2007 Equipment Rebates Prescriptive rebates Com Lighting Xcel Energy MN 2000‐ 2007 Equipment Rebates Prescriptive rebates Ind Lighting Efficiency Xcel Energy MN Lighting Efficiency Xcel Energy MN 2002‐ 2006 2002‐ 2006 Equipment Rebates Equipment Rebates Prescriptive rebates Prescriptive rebates PG&E CA 2006 Equipment Rebates PG&E CA 2006 3.825 Lighting 319.125 14,262.5 3.825 Com Lighting 971.2 61,000 11.65 Ind Lighting 971.2 61,000 11.65 Upstream Com Motors and HVAC Equipment 95% 16,550.0 8.79 Equipment Rebates Upstream Ind Motors and HVAC Equipment 95% 16,550.0 8.79 Custom rebates Com 99 15,176.0 99 15,176.0 5,400 48,629.0 C&I Non‐ Prescriptive Program DTE Energy MI 2009 Equipment Rebates C&I Non‐ Prescriptive Program DTE Energy MI 2009 Equipment Rebates Custom rebates Ind C&I Prescriptive Program DTE Energy MI 2009 Equipment Rebates Prescriptive rebates Com Custom lighting, HVAC, Motor, Custom Electric, Custom Gas Custom lighting, HVAC, Motor, Custom Electric, Custom Gas Lighting, motors and drives, controls, HVAC, refrigeration, and food service equipment A Best Practices Guide for Energy Efficiency in Municipally‐Owned Services Areas B‐C Ratio 14,262.5 Net Benefits 319.125 NPV Benefits Net Present Value (NPV) Costs 0.279 Primary Test 982.478 Total Cost 738 Gross Winter MW Motor and HVAC Distributor Rebate Program Motor and HVAC Distributor Rebate Program Gross Summer MW Program Category 2009 Gross Annual MWh Year WI Focus on Energy Renewables Program One‐Stop Efficiency Shop Lighting Rebate Program One‐Stop Efficiency Shop Lighting Rebate Program Number of Participants State Focus on Energy Program Name Utility Name 221 | P a g e Whole building Com Whole Building 440 19.9 Energy Trust of Oregon OR 2007‐ 2008 New Construction Whole building Ind Whole Building 440 19.9 National Grid MA 2007 New Construction Whole building Com Whole Building National Grid MA 2007 New Construction Whole building Ind Whole Building National Grid NH 2007 New Construction Whole building Com Whole Building National Grid NH 2007 New Construction Whole building Ind Whole Building Connecticut Light & Power; The United Illuminating Company; CT 2006 New Construction Whole building Com Multiple measures A Best Practices Guide for Energy Efficiency in Municipally‐Owned Services Areas 300 13.8 4.7 Gross Annual MWh Number of Participants Total Cost B‐C Ratio New Construction Net Benefits 2007‐ 2008 NPV Benefits OR Net Present Value (NPV) Costs Energy Trust of Oregon Primary Test Ind Gross Winter MW Prescriptive rebates Incentive Structure Equipment Rebates Program Category 2009 Year MI State DTE Energy Gross Summer MW Energy Conscious Blueprint Program Predominant Measure Business Energy Solutions: New Building Business Energy Solutions: New Building Design 2000plus (MA) and NH Saves @ Work‐ New Construction (NH) Design 2000plus (MA) and NH Saves @ Work‐ New Construction (NH) Design 2000plus (MA) and NH Saves @ Work‐ New Construction (NH) Design 2000plus (MA) and NH Saves @ Work‐ New Construction (NH) Target Sector C&I Prescriptive Program Lighting, motors and drives, controls, HVAC, refrigeration, and food service equipment Utility Name Program Name 54,00 48,629.0 222 | P a g e Total Cost Number of Participants Gross Annual MWh Gross Summer MW Multiple measures 300 13.8 4.7 Xcel Energy CO 2006 New Construction Whole building Com Whole Building 103 57,400.0 14.1 Xcel Energy CO 2006 New Construction Whole building Ind Whole Building 103 57,400.0 14.1 We Energies WI 2008 New Construction Whole building Com Whole Building 71 20,300.0 6.8 We Energies WI 2008 New Construction Whole building Ind Whole Building 71 20,300.0 6.8 San Diego Gas & Electric Company CA 2004‐ 2008 New Construction Whole building Com Whole Building 14 3,500.0 San Diego Gas & Electric Company CA 2004‐ 2008 New Construction Whole building Ind Whole Building 14 3,500.0 National Grid RI 2007 New Construction Whole building Com Whole Building 7 38,000.0 B‐C Ratio Predominant Measure Ind Net Benefits Target Sector Whole building NPV Benefits Incentive Structure New Construction Net Present Value (NPV) Costs Program Category 2006 Primary Test Year CT Gross Winter MW State Connecticut Light & Power; The United Illuminating Company; Connecticut Energy Efficiency Fund Utility Name Program Name Connecticut Energy Efficiency Fund Energy Conscious Blueprint Program Energy Design Assistance‐ Customer Consulting Energy Design Assistance‐ Customer Consulting Energy Incentives from We Energies C/I New Construction Program Energy Incentives from We Energies C/I New Construction Program Sustainable Communities Program Sustainable Communities Program Advanced Buildings Program A Best Practices Guide for Energy Efficiency in Municipally‐Owned Services Areas 223 | P a g e 4,000.0 Ind Whole Building 84 4,000.0 2006‐ 2007 New Construction Whole building Com Whole Building 3,401 130,000.0 NY 2006‐ 2007 New Construction Whole building Ind Whole Building 3,401 Vermont Gas Systems, Inc. VT 2006 New Construction Whole building Com Whole Building 26 6,784.0 43.7 Vermont Gas Systems, Inc. VT 2006 New Construction Whole building Ind Whole Building 26 6,784.0 43.7 OR 2008 OR 2008 NV 2009 NV 2009 New Construction New Construction New Construction New Construction Whole building Whole building Whole building Whole building Rocky Mountain Power WY 2008 Equipment Rebates Upstream Com Self‐Direction Credit Program Rocky Mountain Power WY 2008 Equipment Rebates Upstream Ind Refrigerant Charge and Air Flow Tune‐Up PG&E CA 2006‐ 2007 Audit and/or Direct Install Prescriptive rebates Res VT 2006 LIPA NY LIPA Energy Trust of Oregon Energy Trust of Oregon Nevada Power Company Nevada Power Company Self‐Direction Credit Program Com Ind Com Ind Multiple measures Multiple measures Multiple measures Multiple measures lighting, motors, other industrical mechanical measures lighting, motors, other industrical mechanical measures HVAC A Best Practices Guide for Energy Efficiency in Municipally‐Owned Services Areas 28,111.5 28,111.5 59,394.1 59,394.1 18 6,384.3 18 6,384.3 62,500 9,550.0 B‐C Ratio 84 Net Benefits NPV Benefits Whole Building 2006 Net Present Value (NPV) Costs Gross Annual MWh Com VT Efficiency Vermont Efficiency Vermont Primary Test Number of Participants 38,000.0 2007 Gross Winter MW Predominant Measure 7 RI Gross Summer MW Target Sector National Grid Advanced Buildings Program Business New Construction Business New Construction Commercial New Construction Program Commercial New Construction Program WorkPlace New Construction Program WorkPlace New Construction Program New Buildings Program New Buildings Program Commercial New Construction Commercial New Construction Total Cost Incentive Structure Whole Building Year Ind State Whole building Whole building Whole building Utility Name New Construction New Construction New Construction Program Name Program Category 2; Total for C&I 2; Total for C&I 25 25 16.15 TRC TRC 224 | P a g e Predominant Measure Total Cost Number of Participants Gross Annual MWh Gross Summer MW Com HVAC 62,500 9,550 16.15 PG&E CA 2006‐ 2007 Audit and/or Direct Install Prescriptive rebates Ind HVAC 62,500 9,550 16.15 Prescriptive rebates Com lighting, HVAC, premium efficiency motors, and others B‐C Ratio Target Sector Prescriptive rebates Net Benefits Incentive Structure Audit and/or Direct Install NPV Benefits Program Category 2006‐ 2007 Net Present Value (NPV) Costs Year CA Primary Test State PG&E Gross Winter MW Utility Name Program Name Program Refrigerant Charge and Air Flow Tune‐Up Program Refrigerant Charge and Air Flow Tune‐Up Program Energy FinAnswer and FinAnswer Express Rocky Mountain Power; Pacific Power WY 2006 Equipment Rebates Energy FinAnswer and FinAnswer Express Energy Initiative (MA) and NH Saves @ Work‐ Large C/I Retrofit (NH) Energy Initiative (MA) and NH Saves @ Work‐ Large C/I Retrofit (NH) Energy Initiative (MA) and NH Saves @ Work‐ Large C/I Retrofit (NH) Energy Initiative (MA) and NH Saves @ Work‐ Large C/I Retrofit (NH) Rocky Mountain Power; Pacific Power WY 2006 Equipment Rebates Prescriptive rebates Ind National Grid MA 2006 Audit and/or Direct Install None Com Whole Building National Grid MA 2006 Audit and/or Direct Install None Ind Whole Building National Grid NH 2006 Audit and/or Direct Install Whole building Com National Grid NH 2006 Audit and/or Direct Install Whole building Ind A Best Practices Guide for Energy Efficiency in Municipally‐Owned Services Areas 100,000.0 TRC 100,000.0 TRC 225 | P a g e Total Cost Number of Participants Gross Annual MWh Gross Summer MW Whole Building 700 49,516 10.8 Multiple Utilities CT 2007 Audit and/or Direct Install Whole building Ind Whole Building 700 49,516 10.8 Flexible TAP NYSERDA NY Whole Building 116 18,125.0 3.375 NYSERDA NY Ind Whole Building 116 18,125.0 3.375 Custom Efficiency Xcel Energy CO 2006 Com Whole Building 9 2,000.0 0.4 Custom Efficiency Xcel Energy CO 2006 Ind Whole Building 9 2,000.0 0.4 Custom Efficiency Xcel Energy MN 2006 Custom Efficiency Xcel Energy MN 2006 Whole building Whole building Custom rebates Custom rebates Whole building Whole building Com Flexible TAP Audit and/or Direct Install Audit and/or Direct Install Equipment Rebates Equipment Rebates Audit and/or Direct Install Audit and/or Direct Install National Grid MA 2006 Audit and/or Direct Install Whole building Com Audits National Grid MA 2006 Audit and/or Direct Install Whole building Ind Audits Whole Building Assessment/ Benchmarking Whole Building Assessment/ Benchmarking 2004‐ 2007 2004‐ 2007 Com Ind Workplace Retrofit Program Vermont Gas Systems, Inc. VT 2006 Equipment Rebates Custom rebates Com Workplace Retrofit Program Vermont Gas Systems, Inc. VT 2006 Equipment Rebates Custom rebates Ind Custom Process CenterPoint MN 2006 Equipment Custom Com 64 2,461.0 64 2,461.0 cost‐effective, natural gas‐ saving space, water, process heating measures cost‐effective, natural gas‐ saving space, water, process heating measures equipment A Best Practices Guide for Energy Efficiency in Municipally‐Owned Services Areas B‐C Ratio Predominant Measure Com Net Benefits Target Sector Whole building NPV Benefits Incentive Structure Audit and/or Direct Install Net Present Value (NPV) Costs Program Category 2007 Primary Test Year CT Energy Opportunities Program Energy Opportunities Program Gross Winter MW State Multiple Utilities Program Name Utility Name 37.92857143 37.92857143 226 | P a g e Whole building Com Whole Building PG&E CA 2007 Audit and/or Direct Install Whole building Ind Whole Building Production Efficiency Energy Trust of Oregon OR 2006 Audit and/or Direct Install Com Multiple measures Production Efficiency Energy Trust of Oregon OR 2006 Audit and/or Direct Install Ind New Jersey Pay for Performance New Jersey Pay for Performance New Jersey Clean Energy Program New Jersey Clean Energy Program 2009‐ 2010 2009‐ 2010 Audit and/or Direct Install Audit and/or Direct Install Apartment and Condominium Efficiency Services Focus on Energy WI 2008‐ 2009 Audit and/or Direct Install Residential Multifamily Program DTE Energy MI 2009 Equipment Rebates California Statewide MEERP PG&E; SCE; Southern California Gas; San Diego Gas & CA 2006 Equipment Rebates NJ NJ B‐C Ratio Audit and/or Direct Install Net Benefits 2007 NPV Benefits CA Net Present Value (NPV) Costs PG&E Primary Test Ind Gross Winter MW 2006 Gross Summer MW MN equipment installed 500 101,000.0 12.3 500 101,000.0 12.3 229 38.2 Multiple measures 229 38.2 Com holistic 66 78,400.0 Ind holistic 66 78,400.0 Res Multiple measures 431 915.5 Prescriptive rebates Res Multiple measures 119 8,743.0 Whole building Res Multiple measures 168,537 51,296.9 Incentive Structure Gross Annual MWh Predominant Measure installed Custom rebates Number of Participants Target Sector rebates Equipment Rebates Total Cost Program Category Rebates CenterPoint Energy State Energy Custom Process Rebate Program Heavy Industrial and Manufacturing Energy Efficiency Program Heavy Industrial and Manufacturing Energy Efficiency Program Utility Name Rebate Program Program Name Year Whole building; custom rebates Whole building; custom rebates Whole building Whole building Whole building; custom rebates A Best Practices Guide for Energy Efficiency in Municipally‐Owned Services Areas SCT 5.3 SCT 227 | P a g e 18,000 12,800.0 National Grid NH 2006 Equipment Rebates Whole building Res Multiple measures 18,000 12,800.0 1,318 18,000,000 11 94 500 B‐C Ratio Gross Annual MWh Net Benefits Number of Participants Multiple measures NPV Benefits Predominant Measure Res Net Present Value (NPV) Costs Target Sector Whole building Primary Test Incentive Structure Equipment Rebates Gross Winter MW Program Category 2006 Gross Summer MW Year MA Total Cost State National Grid Utility Name Program Name 18,200 2.18 18,200 2.18 5,309.732 2.1258 Electric EnergyWise (MA) and Home Energy Solutions (NH) EnergyWise (MA) and Home Energy Solutions (NH) Multifamily Housing Efficiency Vermont VT 2006 New Construction Whole building Res Multifamily Performance Program NYSERDA NY 2007 Equipment Rebates Whole building Res CenterPoint Energy MN 2006 PG&E CA 2006 Equipment Rebates Equipment Rebates Prescriptive rebates Prescriptive rebates Multiple Utilities CA 2006 Equipment Rebates Prescriptive rebates Com High Tech Energy Efficiency Program PG&E CA 2006‐ 2007 Equipment Rebates Prescriptive rebates; Financing Com High Tech Energy Efficiency Program PG&E CA 2006‐ 2007 Equipment Rebates Prescriptive rebates; Financing Ind Energy Smart Schools Nevada Power Company NV 2009 Equipment Rebates Prescriptive rebates Com Food Service Program Food Service Technology Center California Statewide Food Service Equipment Program Com Com White goods; Lighting; HVAC; Weatherization; Audit; water heaters; education White goods; Lighting; HVAC; Weatherization; Audit; water heaters; education White goods; Education White goods; Education White goods; audits; education Audits; Data Computing Equipment; Education Audits; Data Computing Equipment; Education Weatherization A Best Practices Guide for Energy Efficiency in Municipally‐Owned Services Areas 3,477 142 1,300,000 4 TRC 228 | P a g e Public Buildings Enhanced Energy Efficiency Program Ind Education 25 16,100 HI 2006‐ 2009 Education and Behavior Impact No Incentive Com Energy‐efficient retrofits 26 16,970 MN 2004‐ 2010 Education and Behavior Impact No Incentive Com New construction 110 36,200 MN 2004‐ 2010 Education and Behavior Impact No Incentive Com Benchmarking 1,120 220,000 MN 2008‐ 2010 Education and Behavior Impact No Incentive Com Building performance standards 44 MN 2009‐ 2010 Education and Behavior Impact No Incentive Com Energy‐efficient retrofits 1,120 A Best Practices Guide for Energy Efficiency in Municipally‐Owned Services Areas Number of Participants Whole building Total Cost Education and Behavior Impact Incentive Structure 2009 2,700 9.4 TRC TRC 229 | P a g e B‐C Ratio NY 2,700 Primary Test NYSERDA Hawaii Department of Business, Economic Development, and Tourism Minnesota Department of Administration and the Department of Commerce Minnesota Department of Administration and the Department of Commerce Minnesota Department of Administration and the Department of Commerce Minnesota Department of Administration and the Gross Winter MW Equipment Rebates Gross Summer MW Gross Annual MWh Predominant Measure Target Sector Net Benefits Sustainable Building 2030 NPV Benefits B3 Benchmarking Net Present Value (NPV) Costs Minnesota Sustainable Building Guidelines 2009 Program Category Lead by Example Program NV Ind Nevada Power Company Year Wastewater Efficiency Program Equipment Rebates 2009 Data Computing Equipment; Education Data Computing Equipment; Education NV Com Nevada Power Company Prescriptive rebates; upstream Prescriptive rebates; upstream State 80 PLUS and ENERGY STAR® Plug Load 80 PLUS and ENERGY STAR® Plug Load Utility Name Program Name Education and Behavior Impact No Incentive Com Building performance standards CA 2006‐ 2008 Education and Behavior Impact No Incentive Ind Building performance standards 2009 Equipment Rebates Prescriptive rebates; upstream; direct install Com Prescriptive rebates; upstream; direct install Com 195333.3333 56 195333.3333 56 B‐C Ratio 2006‐ 2008 56 Net Benefits CA 195,333 NPV Benefits Net Present Value (NPV) Costs Building performance standards Primary Test Predominant Measure Res Gross Winter MW Target Sector No Incentive Gross Summer MW Incentive Structure Education and Behavior Impact Gross Annual MWh Program Category 2006‐ 2008 Number of Participants Year CA Total Cost State Utility Name Program Name Department of Commerce California Statewide Codes and Standards Program California Statewide Codes and Standards Program California Statewide Codes and Standards Program PG&E; SCE; Southern California Gas; San Diego Gas & Electric PG&E; SCE; Southern California Gas; San Diego Gas & Electric PG&E; SCE; Southern California Gas; San Diego Gas & Electric Commercial Retrofit Incentives Nevada Power Company Commercial Retrofit Incentives Nevada Power Company NV 2009 Equipment Rebates A/C Cool Credit Idaho Power ID 2009 DR A/C Cool Credit Idaho Power OR 2009 DR Ductless Heat Idaho Power ID 2009 Audit and/or NV Prescriptive rebates Prescriptive rebates Prescriptive White goods, Lighting, HVAC, Weatherization, Audits, Water heaters; Education White goods, Lighting, HVAC, Weatherization, Audits, Water heaters; Education 714 114,572.1 714 114,572.1 Res HVAC 30,391 Res HVAC 30,391 Res HVAC 96 A Best Practices Guide for Energy Efficiency in Municipally‐Owned Services Areas 409.18 38.5 38.5 TRC TRC TRC TRC TRC 230 | P a g e Lighting 549,846 13,411 Res Lighting 549,846 13,411 1,266 928.875 1,266 928.875 474 705.784 1.1 474 705.784 1.1 349 1,274.829 349 1,274.829 1,188 1,338.876 ID 2009 Idaho Power OR 2009 Energy House Calls Idaho Power ID 2009 Audit and/or Direct Install Direct Install Res Energy House Calls Idaho Power OR 2009 Audit and/or Direct Install Direct Install Res ENERGY STAR® Homes Northwest Idaho Power ID 2009 New Construction Whole building Res ENERGY STAR® Homes Northwest Idaho Power OR 2009 New Construction Whole building Res Heating & Cooling Efficiency Program Idaho Power ID 2009 Equipment Rebates Whole building Res Heating & Cooling Efficiency Program Idaho Power OR 2009 Equipment Rebates Whole building Res Home Improvement Idaho Power ID 2009 Equipment Rebates Prescriptive rebates Res weatherization; lighting; audits; water heater; education weatherization; lighting; audits; water heater; education White goods; Lighting; HVAC; Weatherization; Audit; water heaters White goods; Lighting; HVAC; Weatherization; Audit; water heaters White goods; Lighting; HVAC; Weatherization; Audit; water heaters White goods; Lighting; HVAC; Weatherization; Audit; water heaters Weatherization A Best Practices Guide for Energy Efficiency in Municipally‐Owned Services Areas TRC TRC TRC TRC TRC TRC TRC TRC TRC TRC 231 | P a g e B‐C Ratio Res Idaho Power Net Benefits 409.18 NPV Benefits 96 Net Present Value (NPV) Costs 2009 Primary Test HVAC OR Gross Winter MW Gross Annual MWh Res Idaho Power Gross Summer MW Number of Participants rebates Prescriptive rebates Prescriptive rebates Prescriptive rebates Total Cost Direct Install Audit and/or Direct Install Equipment Rebates Equipment Rebates Predominant Measure Pump Pilot Ductless Heat Pump Pilot Energy Efficient Lighting Energy Efficient Lighting Target Sector Incentive Structure Program Category Year State Utility Name Program Name 1,661 1,132.80 1,661 1,132.80 1,638.038 9,499 1,638.038 1 2.907 57 247.348 57 247.348 B‐C Ratio 9,499 Net Benefits NPV Benefits Weatherization Net Present Value (NPV) Costs Predominant Measure Res Primary Test Target Sector Prescriptive rebates Gross Winter MW Incentive Structure Equipment Rebates Gross Summer MW Program Category 2009 Gross Annual MWh Year ID Number of Participants State Idaho Power Total Cost Utility Name Program Name Program Home Products Program Home Products Program Idaho Power OR 2009 Equipment Rebates Prescriptive rebates Res White goods; Lighting; HVAC; Weatherization; Audit; water heaters Oregon Residential Weatherization Idaho Power OR 2009 Audit and/or Direct Install Audit; Prescriptive; Financing Res Weatherization; audit White goods; Lighting; HVAC; Weatherization; Audit; water heaters; education White goods; Lighting; HVAC; Weatherization; Audit; water heaters; education Rebate Advantage Idaho Power ID 2009 Equipment Rebates Whole building Res Rebate Advantage Idaho Power OR 2009 Equipment Rebates Whole building Res Idaho Power ID 2009 Education and Behavior Impact None Res Education Idaho Power OR 2009 Education and Behavior Impact None Res Education Idaho Power ID 2009 Idaho Power OR 2009 Appliance Recycling Appliance Recycling Prescriptive rebates Prescriptive rebates Residential Energy Efficiency Education Initiative Residential Energy Efficiency Education Initiative See Ya Later Refrigerator See Ya Later Refrigerator Res Res Appliance Recycling Appliance Recycling A Best Practices Guide for Energy Efficiency in Municipally‐Owned Services Areas TRC TRC TRC TRC TRC TRC 232 | P a g e Gross Summer MW Gross Winter MW 4,678.815 41 211.72 72 6,146.14 1.3 72 6,146.14 1.3 72 6,146.14 1.3 72 6,146.14 1.3 Audits; Education Audits; Education Audit and/or Direct Install Direct Install; Financing Res Weatherization Assistance for Qualified Customers Idaho Power OR 2009 Audit and/or Direct Install Direct Install; Financing Res Weatherization Solutions for Eligible Customers Idaho Power ID 2009 Audit and/or Direct Install Direct Install; Financing Res Building Efficiency Idaho Power ID 2009 New Construction Whole building Com Building Efficiency Idaho Power ID 2009 New Construction Whole building Ind Building Efficiency Idaho Power OR 2009 New Construction Whole building Com Building Efficiency Idaho Power OR 2009 New Construction Whole building Ind Idaho Power ID 2009 None Com Audits; Education Idaho Power ID 2009 None Ind Idaho Power OR 2009 None Com A Best Practices Guide for Energy Efficiency in Municipally‐Owned Services Areas TRC TRC TRC TRC TRC TRC TRC 233 | P a g e B‐C Ratio Primary Test Net Benefits 437 2009 NPV Benefits ID Net Present Value (NPV) Costs Gross Annual MWh Number of Participants Total Cost 4,678.815 Idaho Power Education and Behavior Impact Education and Behavior Impact Education and Behavior Impact 437 Lighting; HVAC; Weatherization; Audits; Water Heaters; Education Lighting; HVAC; Weatherization; Audits; Water Heaters; Education Lighting; HVAC; Weatherization; Audits; Water Heaters; Education Lighting; HVAC; Weatherization; Audits Lighting; HVAC; Weatherization; Audits Lighting; HVAC; Weatherization; Audits Lighting; HVAC; Weatherization; Audits Weatherization Assistance for Qualified Customers Commercial Education Initiative Commercial Education Initiative Commercial Education Initiative Predominant Measure Target Sector Incentive Structure Program Category Year State Utility Name Program Name Idaho Power ID 2009 Equipment Rebates Whole building Com Easy Upgrades Idaho Power ID 2009 Equipment Rebates Whole building Ind Easy Upgrades Idaho Power OR 2009 Equipment Rebates Whole building Com Easy Upgrades Idaho Power OR 2009 Equipment Rebates Whole building Ind Idaho Power ID 2009 DR Idaho Power ID 2009 DR Holiday Lighting Program Idaho Power ID 2009 Equipment Rebates Prescriptive Rebates Holiday Lighting Program Idaho Power ID 2009 Equipment Rebates FlexPeak Management FlexPeak Management Prescriptive Rebates Prescriptive Rebates 1,224 35,171.63 6.1 1,224 35,171.63 6.1 1,224 35,171.63 6.1 1,224 35,171.63 6.1 Com n/a 33 Com n/a 33 Com Appliance Recycling; Lighting; Education 32 142.109 Ind A Best Practices Guide for Energy Efficiency in Municipally‐Owned Services Areas 19.3 19.3 B‐C Ratio Easy Upgrades White goods, Lighting, HVAC, Weatherization, Audits, Water heaters; Education White goods, Lighting, HVAC, Weatherization, Audits, Water heaters; Education White goods, Lighting, HVAC, Weatherization, Audits, Water heaters; Education White goods, Lighting, HVAC, Weatherization, Audits, Water heaters; Education Net Benefits Audits; Education NPV Benefits Predominant Measure Ind Net Present Value (NPV) Costs Target Sector None Primary Test Incentive Structure Education and Behavior Impact Gross Winter MW Program Category 2009 Gross Summer MW Year OR Gross Annual MWh State Idaho Power Number of Participants Utility Name Commercial Education Initiative Total Cost Program Name TRC TRC TRC TRC TRC TRC TRC 234 | P a g e Idaho Power OR 2009 Audit and/or Direct Install None Ind Com Custom Efficiency Idaho Power ID 2009 Equipment Rebates Whole building Com Custom Efficiency Idaho Power ID 2009 Equipment Rebates Whole building Ind Custom Efficiency Idaho Power OR 2009 Equipment Rebates Whole building Com Custom Efficiency Idaho Power OR 2009 Equipment Rebates Whole building Ind Audits White Goods; Lighting; HVAC; Weatherization; Audits; Water Heaters;Educatio n White Goods; Lighting; HVAC; Weatherization; Audits; Water Heaters;Educatio n White Goods; Lighting; HVAC; Weatherization; Audits; Water Heaters;Educatio n White Goods; Lighting; HVAC; Weatherization; Audits; Water Heaters;Educatio n A Best Practices Guide for Energy Efficiency in Municipally‐Owned Services Areas B‐C Ratio Equipment Rebates Net Benefits 2009 TRC NPV Benefits OR Net Present Value (NPV) Costs Idaho Power Ind Primary Test 142.109 Gross Winter MW Equipment Rebates 32 Gross Summer MW 2009 Gross Annual MWh OR Number of Participants Idaho Power Com Appliance Recycling; Lighting; Education Total Cost 2009 Predominant Measure OR Prescriptive Rebates Target Sector Incentive Structure Idaho Power Equipment Rebates State Program Category Holiday Lighting Program Oregon Commercial Audits Oregon Commercial Audits Year Holiday Lighting Program Utility Name Program Name 41 132 51,835.612 6.7 132 51,835.612 6.7 132 51,835.612 6.7 132 51,835.612 6.7 TRC TRC TRC TRC 235 | P a g e Prescriptive Rebates Ind Idaho Power OR 2009 DR Prescriptive Rebates Ind Irrigation Peak Rewards Aspen Municipal Utility Colorado Springs Utilities Colorado Springs Utilities Colorado Springs Utilities Colorado Springs Utilities Colorado Springs Utilities Fort Collins Utilities Fort Collins Utilities Fort Collins Utilities Fort Collins Utilities CO CO CO CO CO CO CO CO CO CO DR Equipment Rebates Equipment Rebates New Construction Prescriptive rebates Prescriptive rebates Prescriptive rebates Res Com Com DR Bill credit Com Equipment Rebates Education and Behavior Impact Prescriptive rebates Res DR Bill credit Com Equipment Rebates Innovative Financing Prescriptive rebates Com Financing Res A Best Practices Guide for Energy Efficiency in Municipally‐Owned Services Areas 3.4 1512 1512 160 160 TRC TRC TRC Windows Com 13,157.619 Lighting Com No Incentive 887 TRC B‐C Ratio DR Net Benefits 2009 3.4 NPV Benefits ID 13,157.619 Net Present Value (NPV) Costs Idaho Power Irrigation Peak Rewards 887 Primary Test Ind Gross Winter MW Custom rebates Gross Summer MW Equipment Rebates Idaho Power Gross Annual MWh 2009 Irrigation Efficiency Rewards Number of Participants OR ID pumps, other irrigation equipment and design pumps, other irrigation equipment and design pumps, other irrigation equipment and design pumps, other irrigation equipment and design Total Cost Ind Idaho Power Predominant Measure Incentive Structure Custom rebates Irrigation Efficiency Rewards Appliance Rebate Program Lighting Rebate Program Prescriptive Rebate Program Builder Incentive Program Peak Demand Rebate Windows Rebate Program Business Environmental Program Series Load Management Program Electric Efficiency Program Zero‐Interest Loans Target Sector Program Category 2009 Equipment Rebates State Year Utility Name Program Name 236 | P a g e TX BPUB TX Equipment Rebates Prescriptive rebates Com Equipment Rebates Prescriptive rebates Res Equipment Rebates Prescriptive rebates Res Lighting Audit and/or Direct Install Direct install Res Audits Prescriptive rebates Res Lighting AE TX 2010 AE TX 2010 AE TX 2010 AE TX 2010 Equipment Rebates Education and Behavior Impact Equipment Rebates Equipment Rebates Audit and/or Direct Install Equipment Rebates Prescriptive rebates Prescriptive rebates Com B‐C Ratio BPUB Net Benefits USA Lighting NPV Benefits EPA Ind Net Present Value (NPV) Costs CO Prescriptive rebates Equipment Rebates Primary Test Longmont Power & Communication Equipment Rebates Gross Winter MW CO Lighting Gross Summer MW CO Com Audit and/or Direct Install Gross Annual MWh Longmont Power & Communication Longmont Power & Communication Predominant Measure CO Target Sector Fort Morgan Electric Light & Gas Department Prescriptive rebates Incentive Structure CO HVAC Program Category Fort Morgan Electric Light & Gas Department Res Year CO Number of Participants Free Weatherization Multifamily Incentive Fort Collins Utilities Total Cost HPwES State Air Conditioner Tune‐Up EnergySmart Lighting Program (in partnership w/ MEAN) EnergySmart Lighting Program (in partnership w/ MEAN) Commercial Matching Grant Program Residential Matching Grant Program Lighting with a Twist (in partnership with Platte River Power Authority (PRPA)) Tier 1 Energy Audit and Easy Direct Install Earth Day CFL Promotion Online Residential & Commercial Energy Suite Air Conditioning Rebate Utility Name Program Name 11,839 29,513 Res HVAC 4,444 5,353.000 4.15 Res HVAC 2,941 5,808.000 5.29 No Incentive Res Weatherization 456 498.000 0.43 Custom rebates Res Lighting 18,234 13,231.000 4.48 A Best Practices Guide for Energy Efficiency in Municipally‐Owned Services Areas SCT SCT SCT SCT 237 | P a g e SCT 1.31 SCT Direct install Res HVAC Prescriptive rebates Res Appliance Recycling AE TX 2010 AE TX 2010 AE TX 2010 AE TX 2010 AE TX 2010 AE TX 2010 Smart Vendor AE TX 2010 Green Building Programs AE TX Seattle City Light WA Focus on Energy WI Focus on Energy WI Efficiency Vermont VT Great River Coop MN New Jersey BPU NJ San Diego Gas & Electric Company CA 1995‐ 2001 2004‐ 2006 Audit and/or Direct Install Appliance Recycling Education and Behavior Impact Equipment Rebates Equipment Rebates Prescriptive rebates Prescriptive rebates Res Com 3,428 2,530.000 0.66 315 37,126.000 10 Com Lighting 384 5,311.000 1.94 DR Bill credit Com HVAC 780 8.000 0.6 Equipment Rebates Equipment Rebates Education and Behavior Impact Equipment Rebates Equipment Rebates Equipment Rebates New Construction Equipment Rebates Equipment Rebates Equipment Rebates Prescriptive rebates Com Renewables 0 0.000 0.01 Upstream Com vending misers 120 137.000 0.02 Codes/Stand ards Res 209 25,413.000 2.901 Prescriptive rebates Custom rebates Custom rebates Whole building Prescriptive rebates Prescriptive rebates Prescriptive rebates Com Lighting Com Ind Res Res SCT SCT SCT SCT SCT 964 1,588.000 0.179 0.336 Lighting A Best Practices Guide for Energy Efficiency in Municipally‐Owned Services Areas SCT Res Res B‐C Ratio 2.3 12.000 Net Benefits 45.000 2,009 NPV Benefits 4,617 Primary Test Net Present Value (NPV) Costs Gross Winter MW HVAC Water heaters 2010 $mart Business Program Custom Incentive Program Custom Incentive Program Energy Star Homes Residential Rebate Program New Jersey Clean Energy Program Hard‐to‐Reach Lighting Turn‐In Gross Summer MW Number of Participants Res Res TX Commercial Rebates Small Business Lighting Commercial Power Partner Thermal Energy Storage Gross Annual MWh Total Cost Bill credit Bill credit AE Residential Online Energy Analysis Target Sector DR DR Incentive Structure 2010 2010 Program Category TX TX Year AE AE State Predominant Measure The Power Partner Cycle‐Saver Water Heater Timers Duct Diagnosis and Sealing Refrigerator Recycling Program Utility Name Program Name 5,577 23,416.000 577,091.000 TRC 238 | P a g e Whole building Res New Construction Innovative Financing Financing Res Equipment Rebates Prescriptive rebates Res Renewables 2009‐ 2013 Appliance Recycling Prescriptive rebates Res DR Bill credit 131,339 43,536.000 7.709 794 2,943.000 1.38 0 0.000 0 Appliance Recycling 9,395 14,198.000 1.933 Res HVAC 53,996 206.000 33 Financing Com Audits Direct install Com 12 4,593.000 0.4 270 40,008.000 6.289 270 40,008.000 6.289 33 15,058.000 3.634 5,521 27,748.500 5.052 295 5,584.500 0.605 TRC TRC TRC B‐C Ratio Res 6.14 Net Benefits Prescriptive rebates 4,724.500 NPV Benefits Equipment Rebates 6,624 Net Present Value (NPV) Costs Primary Test Weatherization Gross Winter MW Res Gross Summer MW Prescriptive rebates Gross Annual MWh Audit and/or Direct Install Number of Participants Total Cost Predominant Measure IA Target Sector Alliant Energy ‐ Iowa Incentive Structure IA Program Category State Alliant Energy ‐ Iowa Year Utility Name Program Name Program Home Energy Audit & Insulation Residential Prescriptive Rebates New Home Construction Low‐Interest Financing Residential Efficiency‐First Renewable Cash Back Rewards Appliance Recycling Residential Direct Load Control Shared Savings Performance Contracting Custom Rebates Custom Rebates Commercial New Construction Non‐Residential Prescriptive Rebates Iowa Farm Rewards CheckMe! Plus AC Program Cool Share for Alliant Energy ‐ Iowa Alliant Energy ‐ Iowa Alliant Energy ‐ Iowa Alliant Energy ‐ Iowa Alliant Energy ‐ Iowa Alliant Energy ‐ Wisconsin Alliant Energy ‐ Iowa Alliant Energy ‐ Iowa Alliant Energy ‐ Iowa Alliant Energy ‐ Iowa IA IA IA IA IA WI IA IA IA IA Alliant Energy ‐ Iowa IA Alliant Energy ‐ Iowa IA NV Energy NV NV Energy NV Audit and/or Direct Install Innovative Financing Equipment Rebates Equipment Rebates New Construction Equipment Rebates Prescriptive rebates Com Equipment Rebates Prescriptive rebates Agri cult ural Equipment Rebates DR Prescriptive rebates Bill credit Custom rebates Custom rebates Prescriptive rebates Com Ind Com Res HVAC Res HVAC A Best Practices Guide for Energy Efficiency in Municipally‐Owned Services Areas TRC 0 TRC TRC TRC TRC TRC TRC TRC TRC 239 | P a g e San Diego Gas & Electric Company CA 2004 Audit and/or Direct Install Small Commercial Prescriptive Lighting Initiative Sacramento Municipal Utility District CA 2004 Equipment Rebates Small Business Energy Advantage Program Connecticut Light and Power CT 2004 Equipment Rebates Four CA IOUs CA 2004 Four CA IOUs CA 2004 B‐C Ratio EZ Turnkey Program Net Benefits Audit and/or Direct Install NPV Benefits 2004 Net Present Value (NPV) Costs CA Primary Test KEMA‐XENERGY Gross Winter MW Business Energy Services Team Program Gross Summer MW MN Gross Annual MWh Xcel Energy Number of Participants Energy Lighting Efficiency Program Year WA Program Name NEEA Total Cost Target Sector Res Energy Star Homes Predominant Measure Incentive Structure No Incentive State Education and Behavior Impact Utility Name Program Category Southern Nevada Express Efficiency Program Express Efficiency Program Cool Choice Program Cool Choice Program HVAC Maintenance Program Express Efficiency Program ‐ HVAC Element Multiple Utilities Multiple Utilities 2004 2004 Audit and/or Direct Install audit / prescriptive rebates / financing audit / prescriptive rebates / financing audit / prescriptive rebates / financing Prescriptive rebates Equipment Rebates Equipment Rebates Equipment Rebates Equipment Rebates audit / prescriptive rebates / financing Prescriptive rebates Prescriptive rebates Prescriptive rebates Prescriptive rebates Com Lighting Com Com Com Lighting Com Com Ind 535 179 687 1,478 605 9,621 9,621 Com HVAC 1,390 702.000 Ind HVAC 1,390 702.000 2,700 13,000.000 389 2,901.000 Avista ID 2004 Audit and/or Direct Install Prescriptive rebates Com HVAC California CA 2004 Equipment Rebates Prescriptive rebates Com HVAC A Best Practices Guide for Energy Efficiency in Municipally‐Owned Services Areas TRC TRC TRC TRC TRC TRC TRC TRC TRC TRC TRC 240 | P a g e Total Cost HVAC 26 Florida Light and Power FL 2004 Equipment Rebates Prescriptive rebates Com HVAC Florida Light and Power FL 2004 Equipment Rebates Prescriptive rebates Ind HVAC Puget Sound Energy WA Equipment Rebates Prescriptive rebates Com CPS Energy TX 2009 Prescriptive rebates Res Lighting CPS Energy TX 2009 Equipment Rebates Equipment Rebates Equipment Rebates Equipment Rebates No Incentive Res New windows Res HVAC Res Renewables HVAC Commercial and Industrial HVAC Program Commercial and Industrial HVAC Program Commercial Kitchen Equipment Rebates CFL Program Home Efficiency Program Residential HVAC Program Solar PV & Water Heater Program Air Flow Performance Program New Homes Construction Program Refrigerator Recycling Program Wash Right Program Commercial Large Lighting Commercial Small Lighting Program Commercial HVAC Prescriptive rebates Prescriptive rebates CPS Energy TX 2009 CPS Energy TX 2009 CPS Energy TX 2009 Equipment Rebates Prescriptive rebates Res CPS Energy TX 2010 New Construction No Incentive Res CPS Energy TX 2010 CPS Energy TX 2009 CPS Energy TX 2009 CPS Energy TX 2009 CPS Energy TX 2009 Appliance Recycling Equipment Rebates Equipment Rebates Equipment Rebates Equipment Prescriptive rebates Prescriptive rebates Prescriptive rebates Prescriptive rebates Prescriptive 523 54,112.000 20.395 523 54,112.000 20.395 1,726,942 65,346.000 99.466 2,339 1,952.000 0.861 7,990 7,173.000 2.734 42 327.000 0.176 302 490.000 0.304 Number of Participants TRC TRC TRC B‐C Ratio Predominant Measure Com Net Benefits Target Sector Prescriptive rebates NPV Benefits Incentive Structure Equipment Rebates Net Present Value (NPV) Costs Program Category 2004 Primary Test Year CA Gross Winter MW State Los Angeles Department of Water and Power Gross Summer MW Utility Name Chiller Efficiency Program Gross Annual MWh Program Name Res Appliance Recycling Res Wash Machine 2,331 334.000 0.57 Com Lighting 147 21,739.000 5.596 Com Lighting 5,476.000 3.24 HVAC 112 Com A Best Practices Guide for Energy Efficiency in Municipally‐Owned Services Areas 241 | P a g e Lean Clean Energy Commercial New Construction Program Commercial Custom Program CPS Energy TX 2010 Equipment Rebates Prescriptive rebates Com CPS Energy TX 2010 Audit and/or Direct Install No Incentive Ind 2010 New Construction No Incentive Com 2009 Equipment Rebates Custom rebates Com HVAC CPS Energy CPS Energy TX TX Audits Peak Saver CPS Energy TX 2009 DR Bill credit Res programmable thermostat DR Program CPS Energy TX 2009 Bill credit Com load curtailment Power Watch City of Ames Electric Services IA DR Education and Behavior Impact Energy Efficiency & Environmental Stewardship Programs Connecticut Municipal Electric Energy Cooperative CT Equipment Rebates Prescriptive rebates SRP M‐Power SRP AZ Equipment Rebates Appliance Recycling Equipment Rebates Education and Behavior Outreach to Underserved Customers Grease to Gas Program Silicon Valley Power CA City of Riverside Public Utilities CA House of Green City of Waverly IA Direct install Res B‐C Ratio 2009 9 Net Benefits TX 0.001 NPV Benefits CPS Energy 1.951 Net Present Value (NPV) Costs Roof 2009 1 Primary Test Com TX Gross Summer MW Window Film CPS Energy Gross Annual MWh Com 2009 Number of Participants Motors TX Total Cost Incentive Structure Com CPS Energy Gross Winter MW Window Film Program Roof Coating Program Restaurant Equipment Program rebates Prescriptive rebates Prescriptive rebates Prescriptive rebates Predominant Measure Motors Program Rebates Equipment Rebates Equipment Rebates Equipment Rebates Target Sector Program Program Category Year State Utility Name Program Name 28 207.621 0.174 1 244.477 0.005 25,696 735.000 16.7 19 615.000 16.8 Res Appliance Recycling Com Renewables Res Res Res A Best Practices Guide for Energy Efficiency in Municipally‐Owned Services Areas 242 | P a g e Primary Test Net Present Value (NPV) Costs NPV Benefits Net Benefits B‐C Ratio Renewables Gross Winter MW Res Gross Summer MW Renewables Gross Annual MWh Predominant Measure Res Number of Participants Target Sector Prescriptive rebates Total Cost Incentive Structure Program Category Year State Utility Name Program Name Impact High‐Energy Cost Community‐ Service Cost Assistance Program Public Utility District #1 of Ferry County WA PaloAltoGreen City of Palo Alto CA City of Westerville Electric Division Concord Municipal Light Plant Concord Municipal Light Plant MA InvestSmart JEA FL 2010 InvestSmart JEA FL 2010 InvestSmart JEA FL 2010 InvestSmart JEA FL 2010 InvestSmart JEA FL 2010 InvestSmart JEA FL 2010 EnergySmart Westerville Electric Thermal Storage Electric Thermal Storage OH MA Equipment Rebates Equipment Rebates Education and Behavior Impact Res Equipment Rebates Prescriptive rebates Com Renewables Equipment Rebates Prescriptive rebates Ind Renewables Equipment Rebates Equipment Rebates Equipment Rebates Equipment Rebates Audit and/or Direct Install Audit and/or Direct Install Prescriptive rebates Prescriptive rebates Custom rebates Custom rebates Com Ind Com Ind Direct install Com lighting Direct install Ind lighting A Best Practices Guide for Energy Efficiency in Municipally‐Owned Services Areas 243 | P a g e RCx EnergyRight Solutions for Business ‐ Standard Rebate Program EnergyRight Solutions for Business ‐ Standard Rebate Program EnergyRight Solutions for Business ‐ VA VA 2009‐ 2011 Prescriptive rebates Custom rebates Prescriptive rebates Res Res Res Com Com Res ComEd IL Tennessee Valley Authority AL 2009 Equipment Rebates Prescriptive rebates Com Tennessee Valley Authority AL 2009 Equipment Rebates Prescriptive rebates Ind Tennessee Valley Authority GA 2009 Equipment Rebates Prescriptive rebates Com B‐C Ratio Residential VA Net Benefits Business Custom VA NPV Benefits Business Savings VA Codes/Stand ards Prescriptive rebates Net Present Value (NPV) Costs WarmWise Home Savings Evaluation Columbia Gas of Virginia Columbia Gas of Virginia Columbia Gas of Virginia Columbia Gas of Virginia City of Danville, VA New Construction Equipment Rebates Audit and/or Direct Install Equipment Rebates Equipment Rebates Equipment Rebates Audit and/or Direct Install Primary Test WarmWise Com Gross Winter MW SC Custom rebates Gross Summer MW Santee Cooper Equipment Rebates Gross Annual MWh Smart Energy Homes Com Number of Participants SC Prescriptive rebates Total Cost Santee Cooper Equipment Rebates Predominant Measure Reduce The Use Target Sector SC Incentive Structure Santee Cooper Sep 16 2009‐ prese nt Sep 16 2009‐ prese nt Program Category Reduce The Use Year State Utility Name Program Name Com A Best Practices Guide for Energy Efficiency in Municipally‐Owned Services Areas 22,100.000 244 | P a g e Prescriptive rebates Com Tennessee Valley Authority KY 2009 Equipment Rebates Prescriptive rebates Ind Tennessee Valley Authority MS 2009 Equipment Rebates Prescriptive rebates Com Tennessee Valley Authority MS 2009 Equipment Rebates Prescriptive rebates Ind Tennessee Valley Authority NC 2009 Equipment Rebates Prescriptive rebates Com B‐C Ratio Equipment Rebates Net Benefits 2009 NPV Benefits KY Net Present Value (NPV) Costs Tennessee Valley Authority Primary Test Ind Gross Winter MW Target Sector Prescriptive rebates Gross Summer MW Incentive Structure Equipment Rebates Gross Annual MWh Program Category 2009 Number of Participants Year GA Total Cost State Tennessee Valley Authority Predominant Measure Utility Name Program Name Standard Rebate Program EnergyRight Solutions for Business ‐ Standard Rebate Program EnergyRight Solutions for Business ‐ Standard Rebate Program EnergyRight Solutions for Business ‐ Standard Rebate Program EnergyRight Solutions for Business ‐ Standard Rebate Program EnergyRight Solutions for Business ‐ Standard Rebate Program EnergyRight Solutions for Business ‐ Standard Rebate Program A Best Practices Guide for Energy Efficiency in Municipally‐Owned Services Areas 245 | P a g e Prescriptive rebates Com Tennessee Valley Authority TN 2009 Equipment Rebates Prescriptive rebates Ind Tennessee Valley Authority VA 2009 Equipment Rebates Prescriptive rebates Com Tennessee Valley Authority VA 2009 Equipment Rebates Prescriptive rebates Ind Tennessee Valley Authority AL 2009 Equipment Rebates Custom rebates Com Tennessee Valley Authority AL 2009 Equipment Rebates Custom rebates Ind Tennessee Valley Authority GA 2009 Equipment Rebates Custom rebates Com B‐C Ratio Equipment Rebates Net Benefits 2009 NPV Benefits TN Net Present Value (NPV) Costs Tennessee Valley Authority Primary Test Ind Gross Winter MW Prescriptive rebates Gross Summer MW Target Sector Equipment Rebates Gross Annual MWh Incentive Structure 2009 Number of Participants Program Category NC Total Cost Year Tennessee Valley Authority Predominant Measure State EnergyRight Solutions for Business ‐ Standard Rebate Program EnergyRight Solutions for Business ‐ Standard Rebate Program EnergyRight Solutions for Business ‐ Standard Rebate Program EnergyRight Solutions for Business ‐ Standard Rebate Program EnergyRight Solutions for Business ‐ Standard Rebate Program EnergyRight Solutions for Business ‐ Custom Incentive Program EnergyRight Solutions for Business ‐ Custom Incentive Program EnergyRight Solutions for Business ‐ Custom Incentive Program Utility Name Program Name A Best Practices Guide for Energy Efficiency in Municipally‐Owned Services Areas 246 | P a g e Custom rebates Com Tennessee Valley Authority KY 2009 Equipment Rebates Custom rebates Ind Tennessee Valley Authority MS 2009 Equipment Rebates Custom rebates Com Tennessee Valley Authority MS 2009 Equipment Rebates Custom rebates Ind Tennessee Valley Authority NC 2009 Equipment Rebates Custom rebates Com Tennessee Valley Authority NC 2009 Equipment Rebates Custom rebates Ind Tennessee Valley Authority TN 2009 Equipment Rebates Custom rebates Com Tennessee Valley Authority TN 2009 Equipment Rebates Custom rebates Ind B‐C Ratio Equipment Rebates Net Benefits 2009 NPV Benefits KY Net Present Value (NPV) Costs Tennessee Valley Authority Primary Test Ind Gross Winter MW Custom rebates Gross Summer MW Target Sector Equipment Rebates Gross Annual MWh Incentive Structure 2009 Number of Participants Program Category GA Total Cost Year Tennessee Valley Authority Predominant Measure State EnergyRight Solutions for Business ‐ Custom Incentive Program EnergyRight Solutions for Business ‐ Custom Incentive Program EnergyRight Solutions for Business ‐ Custom Incentive Program EnergyRight Solutions for Business ‐ Custom Incentive Program EnergyRight Solutions for Business ‐ Custom Incentive Program EnergyRight Solutions for Business ‐ Custom Incentive Program EnergyRight Solutions for Business ‐ Custom Incentive Program EnergyRight Solutions for Business ‐ Custom Incentive Program EnergyRight Solutions for Business ‐ Custom Incentive Program Utility Name Program Name A Best Practices Guide for Energy Efficiency in Municipally‐Owned Services Areas 247 | P a g e Custom rebates Ind SCE CA 2009‐ 2011 DR Custom Incentive Com SCE CA 2009‐ 2011 DR Custom Incentive Ind SCE CA 2010‐ 2012 Equipment Rebates Custom Incentive Ind SCE CA 2010‐ 2012 Equipment Rebates Custom Incentive Ind SCE CA 2010‐ 2012 Audit and/or Direct Install Other Ind CA 2009‐ 2011 Audit and/or Direct Install Custom rebates Com CA 2009‐ 2011 Audit and/or Direct Install Custom rebates Ind Southern California Gas Co. Southern California Gas Co. Customized Retrofit Incentives (formerly Non‐ Residential Retrofit) PG&E CA 2000‐ 2012 Equipment Rebates Custom incentive Com Customized Retrofit Incentives PG&E CA 2000‐ 2012 Equipment Rebates Custom incentive Ind B‐C Ratio Equipment Rebates Net Benefits 2009 NPV Benefits VA Net Present Value (NPV) Costs Tennessee Valley Authority Primary Test Com Gross Winter MW Custom rebates Gross Summer MW Equipment Rebates Gross Annual MWh 2009 Number of Participants VA Total Cost Tennessee Valley Authority Predominant Measure Target Sector Engineering Support 2010 Incentive Structure Engineering Support 2010 Program Category Refinery Energy Efficiency Program (REEP) Chemical Products Efficiency Program (CPEP) Continuous Energy Improvement (CEI) Year TATI State EnergyRight Solutions for Business ‐ Custom Incentive Program EnergyRight Solutions for Business ‐ Custom Incentive Program Technical Assistance & Technology Incentives (TATI) Utility Name Program Name 2,300.000 0.267 6,900.000 0.8 A Best Practices Guide for Energy Efficiency in Municipally‐Owned Services Areas 248 | P a g e Equipment Rebates Custom incentive Ind PG&E RCx PG&E CA PG&E RCx PG&E CA CA No Incentive Com PG&E CA No Incentive Com PG&E CA Audit and/or Direct Install Audit and/or Direct Install Audit and/or Direct Install Audit and/or Direct Install Audit and/or Direct Install Custom incentive Custom incentive PG&E 2006‐ 2012 2006‐ 2012 2006‐ 2012 2008‐ 2012 2008‐ 2012 No Incentive Ind PG&E CA 2008‐ 2012 Audit and/or Direct Install No Incentive Ind Process PG&E CA Custom incentive Custom incentive HVAC, Process CA Equipment Rebates Audit and/or Direct Install Ind PG&E 2006‐ 2012 2010‐ 2012 Ind RCx Silicon Valley Power CA 2009‐ 2011 Equipment Rebates Custom incentive Com Alameda Municipal Power CA 2009‐ 2010 Equipment Rebates Custom incentive Com SCE CA 2010‐ 2012 Equipment Rebates Custom incentive Com SCE CA 2010‐ Equipment Custom Ind Large Integrated Energy Audit Calculation Assistance Calculation Assistance Industrial Technical and Calculation Support Refinery Energy Efficiency Program Industrial Recommissioning Laboratory Energy Management Program Alameda Municipal Power ‐ reAMP Continuous Energy Improvement Continuous 44,824.000 6.17 3,517.000 0.182 3,517.000 0.182 2,379.000 1.966 1,900.000 0.23 Com RCx Ind RCx Lighting A Best Practices Guide for Energy Efficiency in Municipally‐Owned Services Areas B‐C Ratio 2005‐ 2012 Net Benefits CA 6.17 NPV Benefits PG&E 44,824.000 Net Present Value (NPV) Costs Com Primary Test Target Sector Custom incentive Gross Winter MW Incentive Structure Equipment Rebates Gross Summer MW Program Category 2005‐ 2012 Gross Annual MWh Year CA Number of Participants State PG&E Total Cost Utility Name (formerly Non‐ Residential Retrofit) Savings by Design (Non‐Residential New Construction) Savings by Design (Non‐Residential New Construction) Predominant Measure Program Name 15,000.000 1.8 2,800.000 0.33 0.900 0.22 249 | P a g e Production Efficiency Program New Buildings Program Self‐Direction Credit Program Self‐Direction Credit Program Self‐Direction Credit Program Self‐Direction Credit Program Cool Cash Utah State Industrial Program Recommissioning Program Energy FinAnswer Energy FinAnswer Energy FinAnswer Energy FinAnswer Energy FinAnswer Energy FinAnswer FinAnswer Express PGE and Pacific Power via Energy Trust of Oregon PGE and Pacific Power via Energy Trust of Oregon Rocky Mountain Power Rocky Mountain Power Rocky Mountain Power Rocky Mountain Power Rocky Mountain Power State of Utah, no utility Rocky Mountain Power Rocky Mountain Power Rocky Mountain Power Rocky Mountain Power Rocky Mountain Power Rocky Mountain Power Rocky Mountain Power Rocky Mountain Ind OR 2008‐ 2011 New Construction Custom rebates Com 2003‐ 2011 2003‐ 2011 2003‐ 2011 2003‐ 2011 2003‐ 2011 Equipment Rebates Equipment Rebates Equipment Rebates Equipment Rebates Equipment Rebates Equipment Rebates Audit and/or Direct Install Equipment Rebates Equipment Rebates Equipment Rebates Equipment Rebates Equipment Rebates Equipment Rebates Equipment Bill credit Com Bill credit Ind Bill credit Com Bill credit Ind UT UT WY WY UT UT UT UT UT ID ID WY WY CA 2010 2006‐ 2011 2005‐ 2011 2005‐ 2011 2005‐ 2011 2005‐ 2011 2005‐ 2011 2005‐ 2011 2005‐ Prescriptive rebates Custom rebates Custom rebates Custom rebates Custom rebates Custom rebates Custom rebates Custom rebates Custom rebates Prescriptive Res Ind Com Ind Com A Best Practices Guide for Energy Efficiency in Municipally‐Owned Services Areas HVAC Com Ind Com Com Ind B‐C Ratio Custom rebates Net Benefits Equipment Rebates NPV Benefits OR 2008‐ 2011 Net Present Value (NPV) Costs Ind Primary Test Custom incentive Gross Winter MW Equipment Rebates Gross Summer MW 2010‐ 2012 Gross Annual MWh CA Number of Participants SCE Total Cost Incentive Structure incentive Predominant Measure Program Category Rebates Energy Improvement CPEP Target Sector Year 2012 State Utility Name Program Name RCx 94,13.342 9,413.342 0 0 2,661 1,011.640 166 62,753.885 166 62,753.885 4 1,650.440 33 1 237.062 0 237.062 TRC TRC TRC TRC TRC TRC TRC TRC TRC TRC $ 250 | P a g e EnergyStar for New Homes HPwES Questar Weatherization Questar Weatherization Questar Business Rebates Questar Business Rebates Questar Custom Rebates Commercial and Industrial RCx Program 2010‐ 2011 Audit and/or Direct Install ID ID WY WY UT UT Questar Gas UT Questar Gas WY Questar Gas UT Questar Gas WY Questar Gas UT PG&E CA 2011 No Incentive $ 0 690 40,970.925 690 40,970.925 4 927.494 23 927.494 34 2,356.075 6 2,356.075 2,077 3,688.913 Total Cost Predominant Measure Target Sector Incentive Structure Program Category Year State 2010‐ 2011 2008‐ 2011 2008‐ 2011 2007‐ 2011 2007‐ 2011 2008‐ 2011 UT B‐C Ratio FinAnswer Express UT Net Benefits FinAnswer Express WA NPV Benefits FinAnswer Express WA Net Present Value (NPV) Costs FinAnswer Express CA Primary Test FinAnswer Express rebates Prescriptive rebates Prescriptive rebates Prescriptive rebates Prescriptive rebates Prescriptive rebates Prescriptive rebates Prescriptive rebates Prescriptive rebates Prescriptive rebates Prescriptive rebates Gross Winter MW FinAnswer Express Rebates Equipment Rebates Equipment Rebates Equipment Rebates Equipment Rebates Equipment Rebates Equipment Rebates Equipment Rebates Equipment Rebates Equipment Rebates New Construction Equipment Rebates Audit and/or Direct Install Audit and/or Direct Install Equipment Rebates Equipment Rebates Equipment Rebates Gross Summer MW FinAnswer Express 2011 2005‐ 2011 2005‐ 2011 2005‐ 2011 2005‐ 2011 2005‐ 2011 2005‐ 2011 2005‐ 2011 2005‐ 2011 2005‐ 2011 Gross Annual MWh FinAnswer Express Power Rocky Mountain Power Rocky Mountain Power Rocky Mountain Power Rocky Mountain Power Rocky Mountain Power Rocky Mountain Power Rocky Mountain Power Rocky Mountain Power Rocky Mountain Power Rocky Mountain Power State of Utah, no utility Number of Participants FinAnswer Express Utility Name Program Name 0 Ind Com Ind Com Ind Com Ind Com Ind Res Res Prescriptive rebates Prescriptive rebates Prescriptive rebates Prescriptive rebates Custom rebates Com Custom rebates Com Res Weatherization Res Weatherization Com Com A Best Practices Guide for Energy Efficiency in Municipally‐Owned Services Areas TRC TRC TRC TRC TRC TRC TRC 251 | P a g e Custom rebates Com PG&E CA 2010‐ 2013 Audit and/or Direct Install Custom rebates Ind PG&E CA Equipment Rebates Custom rebates Com AEP Texas Central Company TX Equipment Rebates SPIFF Com AEP Texas Central Company TX Equipment Rebates Custom rebates Com AEP Texas Central Company TX Equipment Rebates Custom rebates Com AEP Texas Central Company TX Audit and/or Direct Install Custom rebates Com AEP Texas Central Company AEP Texas Central Company AEP Texas Central Company AEP Texas Central Company AEP Texas Central Company AEP Texas Central Company TX TX TX TX TX TX Equipment Rebates Equipment Rebates Custom rebates Custom rebates Custom rebates Audit and/or Direct Install New Construction Audit and/or Direct Install DR B‐C Ratio Audit and/or Direct Install Net Benefits 2010‐ 2013 NPV Benefits CA Net Present Value (NPV) Costs PG&E Primary Test Ind Gross Winter MW Custom rebates Gross Summer MW Audit and/or Direct Install Gross Annual MWh 2010‐ 2011 Number of Participants Target Sector CA Total Cost Incentive Structure PG&E Predominant Measure Program Category CoolSaver AC Tune‐Up Pilot MTP Load Management SOP SCORE/ CitySmart MTP SMART SourceSM Solar PV Pilot MTP CoolSaver AC Tune‐Up Pilot MTP ENERGY STAR® New Homes MTP Residential Energy Efficiency Pilot Year Commercial SOP State Commercial and Industrial RCx Program Large Integrated Energy Audits Program Large Integrated Energy Audits Program CasinoGreen Program AEP Texas CARE$ Energy Efficiency for Not‐ for‐Profit Agencies SOP Commercial Solutions Pilot MTP Utility Name Program Name 1,576.000 0.393 HVAC Com Com 13 181.250 0.049 47 4,967.964 1.167 87 10,956.115 2.51 6 9.446 0.003 70 22.253 9.452 20 4,859.023 1.816 Com Renewables 2 61.488 0.032 Custom rebates Res HVAC 32 30.627 0.011 Whole building Res 340 618.375 0.344 Direct install Res 51 109.744 0.039 A Best Practices Guide for Energy Efficiency in Municipally‐Owned Services Areas UCT UCT UCT UCT UCT UCT UCT UCT UCT UCT 252 | P a g e Equipment Rebates Custom rebates Com Equipment Rebates Custom rebates Custom rebates Custom rebates Custom rebates Custom rebates Custom rebates Custom rebates 13 132.867 0.069 4,051 12,054.889 3.618 514 1,430.525 0.379 9 92.055 0.024 22 2,414.532 0.58 15 6,361.351 1.069 5 5.604 1.401 11 1,240.402 0.555 5 188.440 0.098 1,114 2,441.915 0.844 12 107.336 0.056 643 1,211.436 0.422 42 131.373 0.042 121 50,878.110 10.6 UCT UCT UCT UCT UCT UCT UCT UCT UCT UCT UCT UCT UCT UCT UCT B‐C Ratio Net Benefits Com 7.473 NPV Benefits SPIFF 22,230.458 Net Present Value (NPV) Costs Equipment Rebates 8,661 Primary Test Gross Winter MW Res Gross Summer MW Direct install Gross Annual MWh Audit and/or Direct Install Number of Participants Total Cost Custom rebates Custom rebates Custom rebates Predominant Measure Incentive Structure Target Sector Program Category Equipment Rebates Equipment Rebates Equipment Rebates Year State Utility Name Program Name MTP Residential SOP SMART SourceSM Solar PV Pilot MTP Hard‐to‐Reach SOP Targeted Low‐ Income Energy Efficiency Program AEP Texas CARE$ Energy Efficiency for Not‐ for‐Profit Agencies SOP Commercial Solutions Pilot MTP Commercial SOP Load Management SOP SCORE/CitySmart MTP SMART SourceSM Solar PV Pilot MTP Residential SOP SMART SourceSM Solar PV Pilot MTP Hard‐to‐Reach SOP Targeted Low‐ Income Energy Efficiency Program Large Commercial SOP AEP Texas Central Company AEP Texas Central Company AEP Texas Central Company TX TX TX AEP Texas Central Company TX AEP Texas North Company TX AEP Texas North Company TX AEP Texas North Company AEP Texas North Company AEP Texas North Company AEP Texas North Company AEP Texas North Company AEP Texas North Company AEP Texas North Company TX TX TX TX TX TX TX AEP Texas North Company TX CenterPoint Energy Houston TX DR Res Res Audit and/or Direct Install Direct install Res Equipment Rebates Custom rebates Com Com Com Renewables Res Equipment Rebates Equipment Rebates Equipment Rebates Equipment Rebates Equipment Rebates Com Com Renewables Res Com Renewables Res A Best Practices Guide for Energy Efficiency in Municipally‐Owned Services Areas 253 | P a g e New Construction Whole building Res Equipment Rebates Custom rebates Res Equipment Rebates Custom rebates Res Equipment Rebates Custom rebates Res Equipment Rebates Custom rebates Res Audit and/or Direct Install SPIFF Res Equipment Rebates Custom rebates Res 92 163.040 81.52 11 9,081.040 1.72 9,569 25,640.830 11.82 2,557 6,443.760 2.01 859 1,897.540 0.73 15,670.890 1.15 UCT UCT UCT UCT UCT UCT UCT UCT UCT UCT B‐C Ratio Net Benefits Com 6.47 NPV Benefits Custom rebates 15,511.280 Net Present Value (NPV) Costs Audit and/or Direct Install 28 Primary Test Gross Winter MW Com Gross Summer MW Custom rebates Gross Annual MWh DR Number of Participants Target Sector Com Total Cost Incentive Structure Custom rebates Predominant Measure Program Category Equipment Rebates Year State Utility Name Program Name Electric, LLC The Texas SCORE MTP Large Commercial Load Management SOP RCx Energy Star MTP A/C Distributor Program Residential SOP Advanced Lighting Program Multi‐Family Water & Space Heating ‐ MTP Residential (RES) City of Houston Weatherization (RES) Hard‐To‐Reach SOP CenterPoint Energy Houston Electric, LLC CenterPoint Energy Houston Electric, LLC CenterPoint Energy Houston Electric, LLC CenterPoint Energy Houston Electric, LLC CenterPoint Energy Houston Electric, LLC CenterPoint Energy Houston Electric, LLC CenterPoint Energy Houston Electric, LLC CenterPoint Energy Houston Electric, LLC CenterPoint Energy Houston Electric, LLC CenterPoint Energy Houston Electric, LLC TX TX TX TX TX TX TX TX TX TX HVAC Lighting A Best Practices Guide for Energy Efficiency in Municipally‐Owned Services Areas 93 422.530 0.04 394 690.250 0.3 2,052 4,695.160 1.76 254 | P a g e Commercial SOP Small Commercial SOP Large C&I Solutions Pilot MTP Texas School/University Programs (SCORE) MTP Load Management SOP Residential SOP TX TX TX TX El Paso Electric Co TX El Paso Electric Co TX El Paso Electric Co El Paso Electric Co TX TX Custom rebates Res Equipment Rebates SPIFF Res Equipment Rebates Custom rebates Res Audit and/or Direct Install Direct install Res Equipment Rebates Equipment Rebates Custom rebates Custom rebates Equipment Rebates Custom rebates Com Equipment Rebates Custom rebates Com DR Equipment Rebates Custom rebates Custom rebates Com Com Com Res A Best Practices Guide for Energy Efficiency in Municipally‐Owned Services Areas 71 71.220 0.08 127 353.000 0.11 1,275 2,079.620 0.95 855 1,442.140 0.64 909 2,822.400 0.9 6 1,917.000 0.376 1 70.000 0.022 63 7,554.000 1.39 133 4,543.000 1.937 6 5.000 4.554 0 0.000 0 UCT UCT UCT UCT UCT UCT UCT UCT UCT UCT UCT UCT 255 | P a g e B‐C Ratio Audit and/or Direct Install Net Present Value (NPV) Costs 0.18 Primary Test Res 1,801.980 Gross Winter MW SPIFF 424 Net Benefits Agencies in Action MTP TX Equipment Rebates NPV Benefits Rebuilding Together Houston CenterPoint Energy Houston Electric, LLC CenterPoint Energy Houston Electric, LLC CenterPoint Energy Houston Electric, LLC El Paso Electric Co El Paso Electric Co Gross Summer MW TX Res Gross Annual MWh CenterPoint Energy Houston Electric, LLC TDHCA Low‐ Income Weatherization (SB‐712) City of Houston Weatherization (HTR) Custom rebates Number of Participants TX Equipment Rebates Total Cost CenterPoint Energy Houston Electric, LLC Predominant Measure Res HTR ‐ Affordable Home Target Sector TX Incentive Structure State CenterPoint Energy Houston Electric, LLC Program Category Utility Name Multi‐Family Water & Space Heating MTP Hard‐to Reach (HTR) Year Program Name ENERGY STAR® Homes MTP Solar PV Pilot MTP Premium Lighting MTP Hard‐to‐Reach SOP Commercial SOP TX TX TX TX TX TX TX TX TX TX TX TX TX TX DR Equipment Rebates Equipment Rebates New Construction Equipment Rebates Equipment Rebates Equipment Rebates Equipment Rebates Prescriptive rebates Custom rebates Custom rebates Custom rebates SPIFF Custom rebates Custom rebates Custom rebates Custom rebates Codes/Stand ards Custom rebates 290 3,290.000 0.821 7,385 1,217.000 0.035 Res Appliance Recycling 1,172 1,015.000 0.138 Res Renewables 18 142.000 0.074 72 248.000 0.045 831 1,039.000 0.391 433 364.000 0.074 40 7,100.000 1.6 5 0.000 2.74 28 7,249.000 3.044 2,293 4,555.000 2.05 867 1,464.000 1.9 Res Res Res Com Com Com Res Res Res Renewables 22 277.000 0.152 Upstream Res Lighting 7,231 4,511.000 0.451 Custom rebates Res 2,559 3,472.000 1.312 Custom rebates Com 558 108,914.129 19.883 A Best Practices Guide for Energy Efficiency in Municipally‐Owned Services Areas UCT UCT UCT UCT UCT UCT UCT UCT UCT UCT UCT UCT UCT UCT UCT 256 | P a g e B‐C Ratio Net Present Value (NPV) Costs UCT Primary Test Gross Winter MW Gross Summer MW Gross Annual MWh Res Net Benefits Residential SOP El Paso Electric Co El Paso Electric Co El Paso Electric Co El Paso Electric Co El Paso Electric Co Entergy Texas Inc. Entergy Texas Inc. Entergy Texas Inc. Entergy Texas Inc. Entergy Texas Inc. Entergy Texas Inc. Entergy Texas Inc. Entergy Texas Inc. Oncor Electric Delivery Company, LLC Codes/Stand ards Education and Behavior Impact Appliance Recycling Equipment Rebates Equipment Rebates Equipment Rebates Audit and/or Direct Install Equipment Rebates NPV Benefits Appliance Recycling MTP PV/Solar Pilot MTP Hard‐to‐Reach SOP Hard‐to‐Reach Solutions MTP Energy Saver (TDHCA) Commercial Solutions MTP Load Management SOP Texas SCORE/ CitySmart MTP Res Number of Participants TX Custom rebates Total Cost El Paso Electric Co Equipment Rebates Predominant Measure LivingWise MTP Target Sector TX Incentive Structure State El Paso Electric Co Program Category Utility Name Res & Small Comm. Solutions MTP Year Program Name Small Commercial SOP Air Conditioning Distributor MTP Commercial Load Management SOP Home Energy Efficiency SOP ENERGY STAR® Homes MTP A/C Installer MTP Refrigerator/Freez er Recycle MTP TX TX TX TX TX TX TX TX Equipment Rebates Custom rebates Com Equipment Rebates Custom rebates Com Equipment Rebates Custom rebates Com Equipment Rebates Custom rebates Com DR Custom rebates Com Equipment Rebates Custom rebates Res New Construction Codes/Stand ards Res Equipment Rebates Custom rebates Res Appliance Recycling Prescriptive rebates Res HVAC HVAC A Best Practices Guide for Energy Efficiency in Municipally‐Owned Services Areas 248 16,098.534 6.409 52 1,777.984 0.4 5 7,649.167 0.82 0 0.000 0 54 1,390.835 0.286 24 474.293 0.188 61 0.000 39.308 12,704 39,319.090 12.893 1,836 3,982.986 3.475 31 147.215 0.061 0 0.000 0 UCT UCT UCT UCT UCT UCT UCT UCT UCT UCT UCT UCT 257 | P a g e B‐C Ratio Com 0 Net Present Value (NPV) Costs Custom rebates 0.000 Primary Test Equipment Rebates 0 Gross Winter MW Gross Summer MW Com Gross Annual MWh Custom rebates Number of Participants Equipment Rebates Total Cost Predominant Measure Com Year State TX Custom rebates Net Benefits Third Party DSM Contracts TX DR NPV Benefits Data Centers MTP TX Target Sector Government Facilities MTP TX Incentive Structure Educational Facilities MTP Oncor Electric Delivery Company, LLC Oncor Electric Delivery Company, LLC Oncor Electric Delivery Company, LLC Oncor Electric Delivery Company, LLC Oncor Electric Delivery Company, LLC Oncor Electric Delivery Company, LLC Oncor Electric Delivery Company, LLC Oncor Electric Delivery Company, LLC Oncor Electric Delivery Company, LLC Oncor Electric Delivery Company, LLC Oncor Electric Delivery Company, LLC Oncor Electric Delivery Company, LLC Program Category Emergency Load Management SOP Utility Name Program Name TX SCORE MTP SWEPCO TX SMART SourceSM Solar PV Pilot MTP SWEPCO TX SWEPCO SWEPCO TX CoolSaver© A/C Tune‐Up Pilot SWEPCO TX TX New Construction Codes/Stand ards Res Equipment Rebates Custom rebates Res Audit and/or Direct Install SPIFF Res Equipment Rebates Custom rebates Com Equipment Rebates Custom rebates Com Audit and/or Direct Install Custom rebates Com 2008‐ prese nt 2009‐ prese nt 2010‐ prese Equipment Rebates Custom rebates Custom rebates Equipment Rebates Custom rebates Com SPIFF Com Custom rebates Res DR Equipment Rebates Audit and/or Direct Install HVAC Com Com Renewables HVAC A Best Practices Guide for Energy Efficiency in Municipally‐Owned Services Areas 8,478 0.000 4.885 743 1,753.201 0.584 769 981.244 0.238 12,868 40,679.086 10.757 903 2,616.263 0.933 38 2,307.809 0.630 20 4,551.035 0.904 11 8.231 0.004 10 157.541 9.297 12 3,412.786 1.120 4 161.520 0.084 7 29.626 0.010 30 18.078 0.009 UCT UCT UCT UCT UCT UCT UCT UCT UCT UCT UCT UCT UCT UCT 258 | P a g e B‐C Ratio Res Net Present Value (NPV) Costs Custom rebates 0.001 Primary Test Equipment Rebates 1.388 Gross Winter MW 2 Number of Participants Res Total Cost Custom rebates Predominant Measure DR Net Benefits SWEPCO TX Res NPV Benefits TX CoolSaver© A/C Tune‐Up Pilot MTP Load Management SOP TX Direct install Gross Summer MW SWEPCO Hard‐to‐Reach SOP TX Audit and/or Direct Install Gross Annual MWh TX ENERGY STAR® Low‐Rise MTP TX Target Sector SWEPCO Air Conditioning Distributor MTP TX Incentive Structure Commercial SOP Res DR SOP TX Program Category Targeted Weatherization LI SOP Commercial Solutions Pilot MTP Oncor Electric Delivery Company, LLC Oncor Electric Delivery Company, LLC Oncor Electric Delivery Company, LLC Oncor Electric Delivery Company, LLC Oncor Electric Delivery Company, LLC Oncor Electric Delivery Company, LLC Southwestern Electric Power Co (SWEPCO) Air Conditioning Tune‐Up MTP Year State Utility Name Program Name TX Home$avers SWEPCO TX Large Commercial & Industrial SOP Small Commercial SOP Southwestern Public Service Co Southwestern Public Service Co Southwestern Public Service Co Southwestern Public Service Co Southwestern Public Service Co Texas‐New Mexico Power Co Texas‐New Mexico Power Co Solar PV Pilot Underserved Area SOP 5 50.784 0.026 734 2,656.619 0.792 177 670.440 0.235 36 11,512.000 2.21 8 247.000 0.06 1,415 3,272.000 1.12 446 668.000 0.28 0 0.000 0 1 224.000 0.039 1 28.000 0.007 44 5,454.000 2.075 3 0.613 0.207 1,128 3,141.000 1.191 542 804.000 0.909 6 67.000 0.035 510 1,004.000 0.239 UCT UCT UCT UCT UCT UCT UCT UCT UCT UCT UCT UCT UCT UCT UCT UCT B‐C Ratio UCT Net Present Value (NPV) Costs 1.636 Primary Test 4,453.468 Gross Winter MW Gross Summer MW Gross Annual MWh Predominant Measure Target Sector Res 1,439 Net Benefits SWEPCO ENERGY STAR® Homes MTP SPIFF NPV Benefits TX Residential SOP Res Number of Participants SWEPCO Hard‐To‐Reach SOP Low Income Weatherization Large Commercial SOP Small Commercial SOP Texas SCORE/ CitySmart/ Comm Solutions Pilot Load Management Pilot Custom rebates Custom rebates Custom rebates Total Cost TX Residential SOP Equipment Rebates Equipment Rebates Equipment Rebates Audit and/or Direct Install Equipment Rebates Equipment Rebates Equipment Rebates Equipment Rebates Audit and/or Direct Install Equipment Rebates Equipment Rebates nt SWEPCO SMART SourceSM Solar PV Pilot MTP Hard‐to‐Reach SOP Incentive Structure Residential SOP Program Category MTP Year State Utility Name Program Name Texas‐New Mexico Power Co Texas‐New Mexico Power Co Texas‐New Mexico Power Co Texas‐New Mexico Power Co Texas‐New Mexico Power Co Texas‐New Mexico Power Co TX TX TX TX TX TX TX TX TX TX TX TX TX Custom rebates Custom rebates Custom rebates Custom rebates SPIFF Custom rebates Custom rebates Equipment Rebates Custom rebates DR Equipment Rebates New Construction Equipment Rebates Equipment Rebates Custom rebates Custom rebates Codes/Stand ards Custom rebates Custom rebates Res Renewables Res Com Com Res Res Res Com Com Com Com Res Res Res Renewables Res A Best Practices Guide for Energy Efficiency in Municipally‐Owned Services Areas 259 | P a g e Oncor Electric Delivery Company, LLC Oncor Electric Delivery Company, LLC TX TX Prescriptive rebates Com Renewables 2009 Equipment Rebates Prescriptive rebates Ind Renewables Audit and/or Direct Install Free Audit Com Multiple Measures Audit and/or Direct Install Free Audit Ind Multiple Measures A Best Practices Guide for Energy Efficiency in Municipally‐Owned Services Areas 83 180.000 0.054 383 17,728.991 2.04 383 17,728.991 2.04 28,573 13.476 50,000 11.25 UCT UCT B‐C Ratio Equipment Rebates Net Benefits 2009 0.433 NPV Benefits Res 1,033.000 Net Present Value (NPV) Costs Whole building 384 Primary Test Audit and/or Direct Install Gross Winter MW Gross Summer MW WI Res Gross Annual MWh Focus on Energy Custom rebates Number of Participants WI Equipment Rebates Total Cost Focus on Energy Predominant Measure TX Target Sector Texas‐New Mexico Power Co Incentive Structure TX Program Category Texas‐New Mexico Power Co Year State Hard‐to‐Reach SOP Low Income Weatherization Pilot Focus on Energy Renewables Program Focus on Energy Renewables Program Oncor Commercial Energy Audit Program Oncor Target Industrial Energy Efficiency Program Utility Name Program Name 260 | P a g e Appendix D. 1. Best Practice Program Summaries Equipment Rebate Programs Residential and Small Business ENERGY STAR® Products Program – DTE Energy, MI The Residential and Small Business ENERGY STAR® Products Program was designed to increase the awareness and sale of ENERGY STAR® lighting and appliances among residential and small business customers. Through the program, DTE Energy offered products through a variety of retail channels and provided incentives to subsidize the incremental cost of energy efficiency products. The program was available in DTE Energy’s service territory, and incentives were offered for both electric and gas products. DTE Energy offered upstream incentives to manufacturers to subsidize the cost of both standard and specialty CFLs. In addition to incentives, participating retailers received POP marketing materials and guidance on how to best display program products. Best practices from this program include: DTE Energy conducted regular checks of the tracking reports to assess how the program was working and to make program corrections that would ensure success. The program was designed to achieve energy savings as well as to make the ENERGY STAR® label more recognizable. DTE Energy offered upstream incentives to manufacturers to subsidize the cost of CFLs and other specialty light bulbs. In addition to incentives, retailers received POP marketing materials and guidance on how to best display program products. Marketing efforts reached customers who did not purchase discounted equipment through the program, in order to increase their knowledge and awareness about ENERGY STAR® lights and appliances. This was meant to encourage the purchase of energy‐efficient products in the future, resulting in additional energy savings. DTE Energy built a strong communication channel with retailers and customers to ensure program participation and success. DTE Energy tracked and utilized retailer records and equipment information to help them analyze and report actual savings. Residential Multifamily Program – DTE Energy, MI Through the Residential Multifamily Program, DTE Energy provided energy‐efficient upgrades for the multifamily buildings or complexes they served with five or more units per building. No cost entry was provided to multifamily property managers for receipt of energy efficiency measures through direct installation of CFLs, low‐flow showerheads, faucet aerators, and pipe wrap insulation in residential units. The program also included an on‐site building assessment of A Best Practices Guide for Energy Efficiency in Municipally‐Owned Services Areas 261 | P a g e common areas to identify eligible measures. DTE Energy provided incentives to the property managers who worked with contractors to install high‐efficiency equipment in common areas. Best program practices include: DTE Energy focused the program on educating tenants and property managers about energy‐efficient measures in order to ensure program success. DTE Energy developed a network of contractors and educated them about optimal energy‐efficient equipment and installation practices. DTE Energy improved measure persistence by prescreening and removing participants who were likely to remove the measures after installation. DTE Energy conducted inspection activities to ensure the contractors’ work quality. The program was primarily focused on energy savings, but energy efficiency education played a large role in achieving program success. DTE Energy educated customers (tenants/property managers) about energy efficiency in order to build trust in the program. DTE Energy performed customer/contractor satisfaction surveys to evaluate the program processes and effectiveness. They incorporated the results of these surveys in future program practices to ensure continuous program improvement. Energy‐Efficient Lighting – Idaho Power, ID Idaho Power’s Energy‐Efficient Lighting Program strived for residential energy savings by replacing less energy‐efficient lighting with more energy‐efficient technology. In 2009, Idaho Power worked with Fluid Market Strategies (Fluid) to promote ENERGY STAR®‐qualified spiral bulbs priced at roughly 99 cents each. Idaho Power also participated in the Bonneville Power Administration (BPA) Change a Light promotion that focused on specialty bulbs. Portland Energy Conservation, Inc. (PECI) managed this promotion that ran the entire 2009 year. Both PECI and Fluid regularly visited stores to check pricing, stock, and signage. Additional program activities included direct install and in‐store events. During 2009, Idaho Power participated in 18 in‐store events with large and small national retailers. They redesigned their program brochures to add educational information about energy–efficient lighting. Notable/replicable program components include: PECI and Fluid regularly visited retail stores to check pricing, stock, and signage. Idaho Power participated in store events with retailers in order to communicate directly with customers at the point‐of‐sale. They set up tables with light displays at the entrances of stores and answered customer questions about CFLs. The program worked with ENERGY STAR® and BPA to promote energy‐efficient lighting. A Best Practices Guide for Energy Efficiency in Municipally‐Owned Services Areas 262 | P a g e Residential Prescriptive Rebates – Alliant Energy, IA The Residential Prescriptive Rebates Program provided a range of energy efficiency options for Alliant Energy customers. Alliant Energy offered cash rebates to residential customers for the purchase of high‐efficiency electric and natural gas equipment, as well as offered incentives to dealers who sold that equipment. Alliant Energy also offered low‐interest financing to eligible customers on qualifying, energy saving equipment and measures. Customers had to choose between receiving the incentive and receiving the low‐interest loan. Through the Residential Prescriptive Rebates Program, Alliant Energy supported the System Adjustment and Verified Efficiency (SAVE) program that trained approximately 260 individual contractors in the fall of 2010 on how to verify the efficiency of HVAC systems. Alliant Energy worked with stakeholders and other IOUs to ensure that the verification component of the SAVE program was consistent across all of the IOUs. The best practices of this program include: Alliant Energy provided customers with several options to participate in their energy efficiency program. Alliant Energy educated customers and dealers about energy efficiency. Alliant Energy enhanced their Residential Prescriptive Rebates Program by adding a coupon‐based campaign in the fall of 2010 to their buy‐down opportunities throughout the year. Alliant Energy sought opportunities to reach out to customers and encourage them to make additional energy saving improvements after participating in their energy efficiency program. High‐Efficiency Appliance Rebate Program – Pacific Gas & Electric, CA The PG&E High‐Efficiency Appliance Rebate Program provided rebates to customers for the purchase of energy‐efficient appliances, including clothes washers, dishwashers, room A/Cs, and water heaters. The program started in 1983 and progressed based on energy efficiency standards developed by ENERGY STAR® and the CEE. PG&E was on the CEE appliance committee that worked with manufacturers to improve energy efficiency standards in the marketplace. Program‐qualifying product specifications for clothes washers were based on specifications developed by CEE; dishwasher standards were based on specifications developed by ENERGY STAR® and CEE. The program achieved 1.7 MW and 4.8 GWh of savings in 2006. The best practices of this program include: PG&E worked with manufacturers to improve energy efficiency standards in the marketplace. The average energy efficiency of residential appliances continues to increase. PG&E recognized this trend and worked with ENERGY STAR® to promote the most energy‐ efficient appliances on the market. A Best Practices Guide for Energy Efficiency in Municipally‐Owned Services Areas 263 | P a g e PG&E offered mail‐in rebates to customers, and also offered instant rebates that were immediately credited to customers at the time of purchase. PG&E developed a co‐marketing strategy with local municipals to promote water and energy savings. Residential Standard Offer Program – Entergy Texas, Inc., TX Entergy Texas, Inc. designed their Residential SOP to achieve a high level of energy and demand savings in the residential sector. The program provided incentives to customers for installing one or more of a wide range of measures that reduce energy costs, reduce peak demand, and/or save energy in existing residential facilities. Certain new construction single family and multifamily affordable housing projects were also eligible for incentives. The primary objective of the Residential SOP was to achieve cost‐effective reductions in peak summer demand. Best program practices include: Entergy Texas, Inc. reduced participation barriers by streamlining program procedures and M&V activities. Entergy Texas, Inc. developed a complete and well thought‐out program plan, and had well‐articulated program logic. Entergy Texas, Inc. prepared a comprehensive and easy‐to‐use database tool for reporting implementation measures. The tool also calculated appropriate savings and incentive amounts. Entergy Texas, Inc. offered high‐incentive levels, as appropriate, in segments and for program designs that required high penetration rates in order to be cost‐effective and where policy goals demanded high penetration levels. Entergy Texas, Inc. used a PUCT‐approved baseline document that provided guidelines for determining the appropriate benchmark for energy impacts. Entergy Texas, Inc. hired a turnkey vendor/sponsor to conduct door‐to‐door marketing to achieve a high penetration rate. Entergy Texas, Inc. evaluated the program cost‐effectiveness, periodically, to ensure program goals were met. California Statewide Multifamily Energy‐Efficiency Rebate Program –Pacific Gas & Electric, Southern California Edison, Southern California Gas and San Diego Gas & Electric, CA The California Statewide MEERP was a collaboration between California’s four major IOU’s: PG&E, SCE, Southern California Gas, and San Diego Gas & Electric. The program promoted energy efficiency and provided equipment rebates to owners and tenants of multifamily properties. MEERP encouraged owners and tenants to install qualifying energy‐efficient products in individual tenant units and in common areas of residential apartment buildings, mobile home parks, and condominium complexes with two or more units. The program drove long‐term A Best Practices Guide for Energy Efficiency in Municipally‐Owned Services Areas 264 | P a g e change in the state through the installation of ENERGY STAR® interior and exterior hardwire fixtures and other permanent energy efficiency equipment and products. Best program practices include: The IOUs paid incentives to property owners for investing in the installment of energy‐ efficient measures inside tenant dwellings that allowed them to avoid the split incentive barrier. The IOUs actively administered and promoted the program to develop a relationship with the multifamily market sector. The IOUs communicated effectively with program customers through multiple media outlets. The IOUs continuously refined the program structure, increased communications, and refined the rebate structure to reach more customers and reflect the newest energy efficiency technologies. Heating and Cooling Efficiency Program – Idaho Power, ID Idaho Power’s Heating and Cooling Efficiency Program provided incentives to residential customers and HVAC contractors for purchasing and properly installing qualified heating and cooling equipment and services. The objective of this program was to achieve energy savings. Best program practices include: Idaho Power maintained program design flexibility and made changes as required. Idaho Power conducted periodic customer and contractor participation surveys to receive feedback about program processes. Idaho Power worked with contractors to ensure they understood program requirements. Idaho Power performed installation inspections to ensure that the quality of work was maintained throughout the program. Idaho Power conducted a cost‐effectiveness study for all the measures annually and excluded less cost‐effective measures in next subsequent program years. Residential Energy Efficient Lighting Program – Nevada Power Company, NV The Residential Energy‐Efficient Lighting Program was market‐based and targeted existing residential customers through retail channels. Nevada Power Company delivered incentives to customers through discounted retail pricing for energy‐efficient CFLs, as well as through direct distribution, community outreach events, and builder model homes. Nevada Power contracted with Ecos Consulting in 2009 to deliver this program to customers in southern Nevada. The rebates and upstream buy‐downs are only part of the program efforts. Nevada Power also participated in a number of community and commercial events to work towards market transformation by promoting ENERGY STAR® lighting. The M&V analysis reported a verified annual savings of 113,868.8 MWh and a peak demand reduction of 9,786 kW. Through the program, Nevada Power developed synergistic relationships with energy A Best Practices Guide for Energy Efficiency in Municipally‐Owned Services Areas 265 | P a g e auditors, customer service representatives, major account executives, energy educators, and staff from other energy efficiency and conservation programs in an effort to yield additional kWh savings. Program best practices include: Nevada Power worked directly with local residents, customers, new home builders, and a variety of agencies and organizations to deliver the program. The appliance portion of this program was cancelled in 2007, as it was no longer cost‐ effective due to a high level of freeriders. For the program, Nevada Power participated in a number of community and commercial events to work towards market transformation by promoting ENERGY STAR® lighting. Nevada Power contracted with ADM Consulting to perform M&V analysis. ADM examined the database for systemic entry errors and conducted in‐store intercept interviews to verify the number of CFLs purchased as a result of the program. ADM subsequently interviewed CFL purchasers by telephone two to three months after the in‐store intercepts to verify installations. The program team expanded relationships with other program teams within Nevada. Not only did energy auditors distribute CFLs to customers during each in‐home audit, the CFL recycling team gave a pack of CFLs to program participants who called to have their second refrigerator picked up. Upstream Lighting Program – Pacific Gas & Electric, CA PG&E’s Upstream Lighting Program provided incentives to manufacturers and retailers to reduce the price of pre‐approved ENERGY STAR®‐qualified CFLs and other energy‐efficient lighting products to residential and small commercial customers at the point of sale. Consumer did not need to submit a rebate application to receive the savings. PG&E had incentive agreements with 13 manufacturers, who partnered with over 640 retailers in 2007. As of October 31, 2007, PG&E had paid incentives of more than $23 million and realized savings of almost 55,195 kW and more than 460 GWh. Recognizing the potential to reach a large number of commercial customers, PG&E searched for new energy saving and innovative products to promote. Notable/replicable program components include: PG&E encouraged manufacturers to work with retail partners to provide consumer educational materials at the point of sale. PG&E offered manufacturer buy‐down and retailer point‐of‐sale instant discounts. The program administrative costs were significantly reduced by avoiding traditional rebate application processing. $mart Business Program – Seattle City Light, WA For the $mart Business Program, Seattle City Light provided per‐fixture rebates to small commercial customers who replaced inefficient lighting with approved energy‐efficient lighting. A Best Practices Guide for Energy Efficiency in Municipally‐Owned Services Areas 266 | P a g e Customers could use their own licensed contractor or choose from a pre‐approved contractor list. Seattle City Light paid incentives to the customer upon completion of the work. Seattle City Light conducted on‐site verifications after installation was completed. Notable/replicable program components include: The media coverage of the West Coast energy crisis during 2001 helped market outreach of the program. Seattle City Light took advantage of utility outreach channels and program brands for marketing. Seattle City Light kept consistent program funding throughout the year. Light Efficiency – Xcel Energy, MN Light Efficiency was offered by Xcel Energy for its Minnesota service territory. Xcel Energy paid rebates to customers who purchased and installed qualifying lighting equipment for retrofit projects or new constructions. They routinely updated the qualified equipment list to reflect new technologies and products and to remove those that became standard in the market. Wherever the newly installed equipment was not on the qualified list, Xcel Energy would evaluate the savings and cost/benefits to determine whether it was eligible for a rebate based on the demand saving. The program also had a lighting redesign study component that provided a complete lighting system analyses for customers with over‐lit or inappropriately lit spaces, and recommended the base approach to improving the design by de‐lamping while maintaining the proper lighting levels. Xcel Energy offered telephone customer service to answer energy conservation questions from customers. Xcel Energy was successful in establishing strong relationships with customers through the program, as well as maintaining strong relationship with lighting vendors, providing regular updates to the trade, and providing marketing and promotions. Notable/replicable program components include: Xcel Energy constantly improved the program by adopting new technology and products, as well as by monitoring marketing changes. The program process and impact evaluation helped Xcel Energy improve the program services. Small Commercial Standard Offer Program – Southwestern Public Service Co., TX The Small Commercial SOP from Southwestern Public Service Co. targeted commercial customers with either a single meter demand of less than or equal to 100 kW, or with a commonly owned meter demand of less than 250 kW. Southwestern paid incentives to program sponsors for energy efficiency measures in new construction or retrofit projects. Southwestern used an online database to record all program activity, such as installed measures, inspection results, and authorized incentives. Project sponsors could also access the database. They applied a deemed savings method for most of the projects, and applied the approved M&V protocol outlined in the IPMVP for installations where the deemed method was not applicable. A Best Practices Guide for Energy Efficiency in Municipally‐Owned Services Areas 267 | P a g e The program website was the primary medium for program updates and information, as well as for project sponsor applications. Southwest offered program marketing and outreach at workshops, industry‐related meetings, and through mass e‐mail notifications. Notable/replicable program components include: The online database was used by program administrators to ensure that duplicate incentives were not provided from this program and other programs provided by Southwestern. Southwestern coordinated with the National Association of Energy Service Companies to notify all its members about the program. Commercial Standard Offer Program – CenterPoint Energy Houston Electric, LLC, TX CenterPoint Energy Houston Electric, LLC offered a Commercial SOP targeting commercial customers with a minimum demand of 100 kW. CenterPoint paid incentives to project sponsors for installing energy efficiency measures in new construction or retrofit projects that resulted in verified demand and energy savings. Based on the specific application, CenterPoint applied the deemed savings calculation method approved by PUCT, a simplified M&V method, or a full M&V method to calculate the demand and energy savings. They also required pre‐ and post‐ inspections to verify the savings. Notable/replicable program components include: CenterPoint paid the incentives on a first‐come, first‐served basis. The program website provided detailed project eligibility, end‐use measures, incentives, procedures, and application forms. CenterPoint used mass e‐mail notifications to inform potential project sponsors about the program. CenterPoint conducted marketing and outreach for the program at appropriate industry‐related meetings, events, and workshops, and through area‐wide outreach activities. Custom Rebates – Alliant Energy, IA Through the Custom Rebates Program, Alliant Energy promoted energy efficiency products and practices to encourage large C&I customers towards more energy‐efficient utilization of energy. They provided custom rebates to customers for installing new high‐efficiency equipment and for implementing energy efficiency measures. The Custom Rebates Program integrated the following components: C&I energy audits, feasibility studies, RCx, and building staff Building Operator Certification (BOC). Free ASHRAE level II audits were provided to customers through the energy audits component. Customers received an audit report with a description of major building features and energy‐using systems; a utility bill analysis; and an end‐use breakdown, energy benchmarking, and description of facility and energy management improvements with estimated costs and savings. A Best Practices Guide for Energy Efficiency in Municipally‐Owned Services Areas 268 | P a g e Through the feasibility studies component, Alliant Energy offered technical assistance and funded the study to identify energy saving projects. Alliant Energy evaluated a facility’s usage and systems, and identified ways to optimize its direct digital controls and process controls through the RCx component. For the BOC component, Alliant Energy worked with the State of Iowa to offer rebates to C&I customers for successfully completing the BOC training and certification. Notable/replicable program components include: Key account managers and business consultants actively promoted the program for large C&I accounts. Alliant Energy included energy audits and studies to enhance the program. Alliant Energy conducted customer survey to uncover roadblocks and potential program enhancements. Easy Upgrades Program – Idaho Power, ID The Easy Upgrades Program was offered by Idaho Power to encourage C&I customers to implement energy efficiency retrofits. They paid incentives up to $100,000 per site for the installation of eligible measures covering lighting, HVAC, motors, building shell, plug loads, and grocery refrigerator. Although the program was designed for easy implementation, it was one of Idaho Power’s largest and most complex programs. To participate in the program, the customer would first need to contact their equipment supplier, contractor, or Idaho Power service representative to assess their energy‐saving opportunities. They were required to submit a preliminary application to Idaho Power before initiating any projects with expected incentive of more than $1,000. For projects with an expected incentive of less than $1,000, the customer was permitted to skip the preliminary application and only submit a final application for payment. There was a program requirement that the projects must have been completed no more than six months before customers submitted the application for payment. Idaho Power paid the incentive to the contractor only if the customer specified the contractor was to be paid in their application; otherwise they paid the incentive to the customer. Idaho Power applied a deemed savings method for the demand and energy savings calculation if valid data was available. Wherever the deemed method was not appropriate, they calculated the savings based on pre‐measure levels of specific inputs, such as building operating hours, square footage, and tonnage size. Notable/replicable program components include: Idaho Power established a good relationship with trade allies and contractors, and regarded them as significant program partners. The program website provided the application documents, and Idaho Power included an auto‐response e‐mail function to help their customers obtain basic program information. A Best Practices Guide for Energy Efficiency in Municipally‐Owned Services Areas 269 | P a g e Idaho Power conducted program marketing and outreach through distributing program brochures, flyers, and other materials outlining FAQs. Idaho Power used marketing and outreach activities to promote the program to trade allies, and presented program details to various business and professional groups. Idaho Power conducted customer and trade ally surveys to obtain feedback about program improvement suggestions. Bright Ideas Commercial Lighting Program – Efficiency New Brunswick, Canada Efficiency New Brunswick provided incentives to commercial customers in New Brunswick through their Bright Ideas Commercial Lighting Program to reduce energy costs and improve lighting quality by installing new high‐efficiency products. Based on market research results, they adopted an upstream approach for the program, and contracted with eight unique lighting distributors in the province to deliver the program. Efficiency New Brunswick paid incentives to the participating distributors for each unit of qualifying high‐efficiency T8 products they sold and installed in a commercial, institutional, industrial, or other non‐residential facility. The incentive amount was based on the average incremental cost of each technology, and was intended to overcome the incremental cost barrier to the customer, as well as the cost of participation by the distributor. For this purpose, Efficiency New Brunswick worked very closely with the lighting manufacturer sales representatives to determine the program structure and incentive rates. Based on the monthly reported eligible products sold by participating distributors, Efficiency New Brunswick calculated the energy saving and reimbursed distributors. Efficiency New Brunswick also conducted random site inspections to ensure that products sold were actually installed. Notable/replicable program components include: 2. Efficiency New Brunswick targeted decision makers and stressed availability from the supply side, making it easy for trade allies, participating distributor, and customers to participate. Due to the low number of program partners, the program was easy to administer. The program cost was low due to comparatively low incremental costs. Appliance Recycling Second Refrigerator Collection and Recycling Program – Nevada Energy, NV The Second Refrigerator Collection and Recycling Program was designed to help residential customers reduce their energy consumption by removing a functional second refrigerator/freezer from their home that usually operated inefficiently, and permanently removed that unit from the marketplace. The recycling process safely disposed of all potentially environmentally harmful materials. Potential customers would call the primary contractor to schedule the appliance pick up, or were enrolled by a retailer at the time they purchased a new appliance. The contractor or retailer collected the old unit and recycled it at their EPA‐approved disposal site. Upon A Best Practices Guide for Energy Efficiency in Municipally‐Owned Services Areas 270 | P a g e verification that the refrigerator was recycled, Nevada Energy paid an incentive to the contractor that covered the full recycling cost, and paid an incentive to the customer. Nevada Energy contracted with JACO Environmental to implement the program and with ADM Consulting, Inc. for program M&V services. The data was entered into the program database. ADM determined the energy savings by conducting a detailed analysis of the program data extracted from the database. ADM calculated a census of model numbers and unit ages, and they also developed an equipment degradation factor for use in the savings estimation. Notable/replicable program components include: The program implementer solicited customers through bill inserts and media ads, and also leveraged Nevada Energy’s retail network to promote the program. M&V staff also performed telephone surveys with a sampling of customers to ensure that units were picked up as reported by the program implementer, and that the customer received an incentive. Appliance Recycling Program – Alliant Energy, IA The Appliance Recycling Program offered by Alliant Energy was designed to help residential customers remove and safely dispose of their old, inefficient refrigerators, freezers, and room conditioners. The program was also designed to prevent existing primary equipment from become secondary equipment when customer purchase new units. Certified agents removed the old equipment from customers’ homes and prepared it for recycling in an environmentally friendly manner. This recycling included various unit material components, such as metals, foam, and plastic. Notable/replicable program components include: Alliant Energy cross‐promoted the recycling program to customers who received a new appliance rebate. The Appliance Recycling Program implemented coordinated marketing with state and federal appliance rebate programs. California Statewide Appliance Recycling Program – Pacific Gas & Electric, Southern California Edison, Southern California Gas, San Diego Gas & Electric, CA The California IOUs PG&E, SCE, Southern California Gas, and San Diego Gas & Electric jointly offered this Appliance Recycling Program in their respective service territories. The program encouraged residential and small business customer to remove old refrigerators, freezers, and A/Cs and recycle them, with a focus on the refrigerators and freezers. The IOUs that offered the program shared a common platform and menu of services, though differences existed between each IOU. The IOUs paid rebates to customers who turned in their old, inefficient refrigerators or freezers that could have been a primary or secondary unit. The program contractors recycled the returned units. The contractors could also pick the units up from participating customers. The IOUs contracted with JACO Environmental, Inc. or Appliance Recycling Centers of America to implement, manage, or administrate the program. The program A Best Practices Guide for Energy Efficiency in Municipally‐Owned Services Areas 271 | P a g e received very significant savings each year, and reached a high customer satisfaction as reported by customers during a survey. Notable/replicable program components include: The IOUs offered online appointment scheduling and pick‐up on Saturdays, and strived to pick the units up within one week of the scheduled appointment. The IOUs conducted random inspections of contractors’ recycling services to ensure program compliance. The IOUs coordinated program promotional and outreach activities with other energy efficiency and demand response programs. Low‐Income Refrigerator Replacement Program – Utah Power & State of Utah, UT The Low‐Income Refrigerator Replacement Program was administrated by the State of Utah Department of Community and Culture, in conjunction with the full services from the DOE WAP. The State of Utah contracted with Utah Power for 50 percent of the program funding. The other 50 percent of funding came from matching federal funding or other sources. The program required that every refrigerator under consideration for replacement be tested and evaluated for a minimum of 72 hours. The State of Utah compiled a comprehensive database with these test results. It was mandatory for every refrigerator to be tested and for the results to be run in the audit software (according to the program guideline). All refrigerators that were replaced needed to have a savings‐to‐investment ratio of 1.0 or greater. Notable/replicable program components include: 3. Minimum 72 hours of refrigerator testing. The program administrator had active communication with all sponsoring organizations. The program administrator followed‐up with customers to verify the savings on customers’ utility bills. Audit and Direct Install Programs (including weatherization) Overview Minnesota Pollution Control Agency, MN Minnesota RETAP is a multiyear initiative run by MPCA whose mission is to develop a service corps of retired, experienced engineers and other professionals to help Minnesota small/mid‐ size businesses and institutions reduce waste, prevent pollution, and improve energy efficiency while reducing costs. RETAP employs skilled retirees from3M, Honeywell, General Mills, and other companies, pays them a modest hourly wage on a part‐time basis, (some operate as volunteers taking minimal or no compensation), to provide tailored technical assistance through onsite visits and analysis of utility bills. The retirees then follow‐up the analysis with an in‐ person (or over‐the‐phone) review with the client to answer questions and help prioritize possible actions. In addition, the program conducts a follow‐up survey in the first year after the A Best Practices Guide for Energy Efficiency in Municipally‐Owned Services Areas 272 | P a g e assessment to check with clients and determine how many recommendations have been implemented. To date, RETAP clients implement recommendations at a rate higher than 30 percent compared to the typical 11‐15 percent for similar audit‐based programs. The program is administered by the MPCA and coordinated on a day‐to‐day basis by a RETAP consultant allowing for local oversight and quality control. All information is tracked and analyzed using a database (created by a RETAP member) and provides administrative, analysis, and reporting functions. This program does have many positive attributes but would require qualified, experienced, engineers interested in providing free (low‐cost) services and therefore does not appear to be compatible with Texas municipal utility delivery and operations. Nonetheless, RETAP program best practices attributes include: Collaboration with private sector stakeholders at a low cost is effective way to deliver energy efficiency services. Note: RETAP supplies information and recommendations on energy efficiency and sustainability improvements but leaves the implementation to the business. Collaboration with other public sector entities allows for RETAP’s success, having partnered with Minnesota State University Good job of benchmarking, data tracking, to capture potential energy savings for projects. Follow‐up surveys and in person meetings are essential to ensure that the company is implementing the recommended measures and ensure that the organization understands the report that was delivered Achieves success by targeting sectors underserved by utility programs Utilizes existing resources such as ENERGY STAR® PM Your Energy Savings Audit and Weatherization Program – DTE, OH DTE Energy’s Your Energy Savings (YES) Audit and Weatherization Program is a multiyear effort designed to help customers take action to reduce energy use. Customers participate in the program either through an online or in‐home audit, or by applying for a rebate for weatherization measures in the Detroit Edison Electric and Michigan Consolidated Gas Co. (MichCon) service areas. Actual rebate levels vary for YES according to whether the customer receives MichCon gas, DTE electric service, or both, and based on the selected audit level. The Program offers four audit options, including: 1. A free, self‐administered online energy audit. Once completed DTE sends the customer an energy savings kit. 2. An in‐Home Energy Consultation (HEC). Customers receive a list of energy‐saving actions and the consultant directly installs CFLs, water pipe insulation, water saving shower heads and faucet aerators. 3. A comprehensive in‐home energy audit from a certified auditor that includes a blower door test, specific energy efficiency recommendations, and ROI analysis. A Best Practices Guide for Energy Efficiency in Municipally‐Owned Services Areas 273 | P a g e 4. A comprehensive energy audit with HERS score; this includes a blower door test, thermal imaging, a list of recommendations and ROI analysis. DTE leverages the YES program to educate its customers about the benefits of energy efficiency and promote other DTE energy efficiency measures and programs. DTE implemented many best practices when developing the program, including conducting active, ongoing process evaluations and constantly making improvements to the program. DTE has in‐house program managers to oversee the program and an implementation contractor that manages the audit program, tracks data (DTE manages the online tracking in‐house), and coordinates and trains subcontractors. This program does appear to be compatible with municipal utility delivery and operations, by virtue of the following best practice attributes: Collaborative effort between different electric/gas companies (though they are subsidiaries of the same holding company) utilizing a duel fuel approach to efficiency. Multiple options for audits (online/in‐home) to increase opportunity for audit uptake. In‐home audits provide educational materials, as well as direct installs ensuring energy savings. Interior Weatherization, Inc: Home$ense Program ‐ Golden Valley Electric Association, IL The GVEA Home$ense program is a multiyear initiative designed to provide clients with effective DSM and energy efficiency education and best practices. The cornerstone of the program is for trained energy specialists to assess a client’s electric energy use, identify potential high‐use devises, and convey the energy saving potential by showing clients the purpose of each energy efficiency measure employed. GVEA uses customer data to identify and target high energy use customers and then markets the Home$ense program to those customers. GVEA also targets marketing to subsidized‐housing clusters as another means of reaching low‐income customers. The Home$ense program is provided for a $40 fee, but is accessible to low‐income residents through the state’s WAP for free. Home$ense provides clients with an in‐home energy efficiency assessment, at which time the rater provides some energy‐efficient products at no additional cost. Items include a refrigerator thermometer and coil cleaning brush, adjustable weather‐proof vehicle plug‐in timer (if applicable), replaces CFLs, and reviews educational materials and best practices with the clients. In addition, homes equipped with electric water heaters may also receive an insulating blanket, pipe wrap, faucet aerators, and a low‐flow shower head. Low‐income customers also receive weatherization services, such as shell insulation, air sealing, and heating system repair/upgrades. Funding for the program is approved by GVEA’s board of directors and expensed by the cooperative utility. All GVEA members pay for Home$ense and the utility’s suite of DSM programs without any outside funding. This program does appear to be compatible with municipal utility delivery and operations by virtue of the following best practice attributes: A Best Practices Guide for Energy Efficiency in Municipally‐Owned Services Areas 274 | P a g e Low cost to implement the program Regular communications and performance reviews (twice a year) with low‐income weatherization agency to review/assess performance and adjust/improve program Employing simple, effective tools such as a light meter to compare light levels before and after retrofits, watt meter/monitoring tool to educate residents about energy intensive devices Flexible schedule (including nights/weekends), to maximize the audience of people who might participate in the program (particularly important for low‐income households) Provides educational materials that cover a whole‐house approach to efficiency – specialists review the materials with the homeowner and answer questions as part of the audit program Multifamily Low‐Income Program ‐ Efficiency Vermont, VT Also listed under New Construction Programs The Multifamily Low‐Income Program is a multiyear collaborative effort delivering comprehensive package of energy efficiency education, technical assistance, and incentives for both new and existing residential multifamily housing across much of northwestern Vermont. Managed by Efficiency VT, the program operates in both Vermont Gas Systems and Burlington Electric Department service areas to deliver a duel fuel approach to efficiency. The program works together with the low‐income WAP, to present recommended energy‐saving measures to building owners where tenants qualify for WAP services. The weatherization team goes to the property and performs an audit and identifies potential improvements and then provides renovation construction services. The incentives are delivered to support a comprehensive project, not as one off measures. This encourages building owners to adopt all cost‐effective energy efficiency measures, not just quick payback options. The developer receives building plan reviews, at no cost, and discusses potential improvements identified by Efficiency VT. Site visits are provided during the construction process to assist with air sealing details and purchasing decisions, and to ensure that insulation and energy‐efficient products are selected and installed. The program works with virtually all new subsidized multifamily construction in the state, as well as a high percentage of privately owned new construction projects. Training programs are in high demand. Efficiency VT Implements the program on a joint basis that allows for the development of a shared vision and big‐picture thinking regarding projects, as well as for consistent messaging from multiple companies, rather than different messages depending on service territories. This program does appear to be compatible with municipal utility delivery and operations by virtue of the following best practice attributes: Understands the market and builds relationships with all market actors across the state spanning project types or customer classes which enables the program to find solutions to market barriers A Best Practices Guide for Energy Efficiency in Municipally‐Owned Services Areas 275 | P a g e Implements the program on a joint basis allowing for the development of a broader, shared vision regarding the projects – delivering a consistent message to multifamily building operators and developers and trade allies Efficiency VT has developed and implemented a design guide for multifamily housing as well as a comprehensive track for new construction/rehab projects 4. Education and Behavior Residential Energy Efficiency Education Initiative ‐ Idaho Power, ID Idaho Power’s Residential Energy Efficiency Education Initiative‘s goal is to promote energy efficiency to the residential community sector by creating and delivering educational programs that result in energy‐efficient and conservation‐oriented behaviors and choices. The program encompasses a wide variety of customer education and outreach activities to reach a wide variety of customers in several different demographic groups. Education and Outreach activities include: Collateral (Energy Savings Booklet), paid media (radio, print, TV), content in customer newsletters, a speaker’s bureau, sponsorship at local events, a library series, content on company website, coordination with community organizations, and school programs. With strong management support and positive community perception, Idaho Power leverages this program to educate customers to use energy wisely, make energy‐efficient behavior choices and increase participation in existing residential programs. Residential Online Energy Analysis ‐ Austin Energy, TX AE has a suite of energy efficiency programs marketed as the Power Saver Program. One piece is their online Home Energy Analysis tool for residential customers. It’s an online tool to help customers find energy wasters in their home. The online tool provides specific feedback using the customer’s energy consumption information that they enter online. It shows customers how they use energy in their home, how their home compares with others, and how they can save on their utility bills using easy to read graphs and custom energy saving advice. It’s an easy to use system. Customers simply fill out information about their home such as property details, property features, equipment and amenities, utility details, and personal information including their utility account information. The four main components of the tool are: Analyze‐ Customers fill out their energy profile then are able to look at the data to see if their home is energy efficient, review what appliances use the most energy, and see potential savings. Learn‐ The portal provides information about: energy safety, how to read the ENERGY STAR® guide label, and explore energy‐related topics to help make their home more energy efficient, comfortable and safe. A Best Practices Guide for Energy Efficiency in Municipally‐Owned Services Areas 276 | P a g e Improve‐ Getting the most out of: their heating and cooling systems, energy‐efficient appliances, home improvement projects with built‐in energy savings, and access to tools and calculators that focus in on specific areas. Save‐ Explains surefire ways to reduce energy use, how to save without spending a lot upfront, shows how and when energy efficiency improvements provide an ROI, and get the bottom‐line information on specific energy‐saving ideas that will work in their particular home. Currently, AE uses Aclara software, but there are numerous home energy reporting companies on the market. The reports use advanced customer data analytics, behavioral science, and the latest software, web and/or hardware technology to educate customers. They are meant to be an active medium to inform customers about their energy use in order to help them lower their utility bill and reduce overall demand. Best practices with these reports are to roll out on a pilot basis to make sure they are relevant for your market. Things to think about when selecting a vendor are cost and accessibility, ease of use, input/outputs, accuracy, and applicability to US climate zones. ENERGY STAR® New Homes Program ‐ Northwestern Energy Efficiency Alliance, OR NEEA’s Northwest ENERGY STAR® New Homes program promotes the construction and sale of new homes built to the Northwest ENERGY STAR® Homes specification. It was designed specifically for the states of Washington, Oregon, Idaho, and Montana. Homes built are at least 15 percent more energy efficient than Washington and Oregon State energy codes. The new homes include high‐efficiency lighting, windows, appliances, water heaters, insulation, and heating and cooling equipment. As a result, the new homes are designed to save an average of 1,000 to 1,500 kWh per year for gas‐heated homes and 3,700 kWh annually for electrically heated homes. Builders use the ENERGY STAR® label to differentiate themselves in the marketplace, as well as increase revenue and enhance overall customer satisfaction. Consumers and builders see an ENERGY STAR® home as a quality home of greater value. In 2009, the U.S. EPA recognized NEEA with a 2009 ENERGY STAR® Partner of the Year award for their work to increase market share of energy‐efficient ENERGY STAR® qualified products, homes and buildings through comprehensive outreach, education, and marketing efforts in both the residential and commercial sectors. Even despite the severe downturn in the new homes market, their efforts in the residential sector led to nearly doubling the market share for Northwest ENERGY STAR® certified homes in 2008. This program is an off‐the‐shelf‐proven solution to leverage a powerful brand, along with fully‐ developed technical specifications, implementation policies, marketing tools, sales training, and technical support available from the EPA at no cost. It also provides increased customer value with co‐branding outreach and educational efforts. However, every market is different and each would need to do extensive research before implementing the program. In NEEA’s market they identified a lack of consumer demand and an industry resistance to change. Based on knowledge gained through market research and targeted key regional barriers to build participation, they implemented a broad marketing strategy that included cooperative advertising, training, and strategic partnerships. A Best Practices Guide for Energy Efficiency in Municipally‐Owned Services Areas 277 | P a g e Power Watch ‐ City of Ames Electric Services, IA The City of Ames Electrical Services’ Power Watch is an energy information and call‐to‐action program that uses a thermometer, gauge, and colors to explain to customers the correlation between temperature and electricity usage. The gauge is divided into different colored quadrants, each color corresponding to a different Power Watch level (green – awareness, blue – preparedness, yellow – watch, and red – peak alert). Power Watch is an energy education program aimed at raising community awareness. It provides timely and meaningful energy conservation messages based on the actual demand for electricity. The program helps increase energy conservation during times of high demand by providing a channel to send the information. It provides real‐time information between the utility and the public. The goal is to inform, educate, and help customers develop good energy habits aimed at conserving energy at a time that is most appropriate and advantageous to the utility system, such as during a peak. Based on real‐time monitoring of electricity demand levels and temperatures, it adjusts and prioritizes energy messages to participating customers. To ensure maximum impact information is broadcast in many different ways such as visual signals, recorded phone messages, newspaper and radio ads, brochures, and the Internet. The real‐time communication effort increases the public’s ability to conserve energy when it is most beneficial to the utility so the City of Ames can increase reliability, and reduce energy use to keep rates low, reduce individual bills, and improve the environment. This program is a good example of a new way to connect to their customers in real time. Studies show that customers do a better job of conserving energy if they are given real‐time energy‐use feedback. The more frequent the feedback the more action they take. For example, in a March 2006 paper, “The Impact of Real‐Time Feedback on Residential Electricity Consumption,” researcher Dean Mountain, a professor of economics at the McMaster Institute for Energy Studies in Hamilton, Ontario, reported data from an energy‐dashboard study conducted by a Canadian utility, Hydro One. On average, the 400 Ontario households that received a PowerCost whole‐house electricity monitor reduced their electricity usage by 6.5%. Mountain noted, “An important observation from the study is that the behavioral response remained persistent and did not decrease over time during the study period.” Also, an article titled, “Evaluating Energy Use Feedback Devices,” reports the results of a Florida study of electricity‐use monitors. Three researchers from the Florida Solar Energy Center measured electricity savings in houses equipped with an electricity monitor called The Energy Detective. After correcting the data for reductions in energy use that were weather‐related, the researchers concluded that the homes with energy monitors had average electricity savings of 7.4 percent. House of Green ‐ City of Waverly (Waverly Light & Power), IA Waverly Light and Power built the House of Green in 2006 to demonstrate energy efficiency, passive solar design, and green building. The home incorporated renewable building products, passive solar design, and landscaping for energy efficiency. Using the latest and best practices, Waverly Light & Power has showcased unique features that can be utilized by consumers and contractors. The features set an example in educating other public power systems working with new developments, as well as techniques for energy savings in existing homes. Waverly Light & Power also used this opportunity to monitor the home’s energy use and KW demand by A Best Practices Guide for Energy Efficiency in Municipally‐Owned Services Areas 278 | P a g e separately monitoring the HVAC system, hot water heater, appliance loads, and other plug load. The data was used to educate customers on real‐time energy and demand savings. It was designed to set the standard in energy efficiency and to show the utilities strong commitment to energy efficiency and environmental stewardship. They educated consumers through demonstrations. It was a three bedroom, 1,500 square foot home designed to meet the needs of the average size family. Their 2006 annual report was designed to showcase the house and motivate consumers to take action. The report included information on lighting, appliances, energy‐saving recipes, rebates, sustainable material information, GoodCents Program information, and other home improvement information. Energy Smart Westerville ‐ City of Westerville Electric Division ‐ OH The City of Westerville Electric Division’s Energy Smart Westerville describes the leadership role and initiatives the City undertook to educate its customers and the public on alternative energy and energy efficiency. The City of Westerville Electric Division partnered with the Ohio Energy Project and Westerville City schools to promote energy education through a number of school outreach programs that they continuously improve year after year. The Ohio Department of Development has designated Westerville as one of the Governor’s Energy Smart Communities, an honor that not many cities receive. The program includes innovative projects, mentoring, educational, and instructional materials, a resourceful website, online tools, energy calculators, and community outreach. Specific examples of initiatives include: 5. Solar initiatives‐ Installed solar arrays at two schools for power and as a teaching tool, and added solar flashing signals and a solar back‐up power supply for a vital traffic signal. The City’s Fuel Cell Project‐ Demonstrated a commercial‐scale, “next generation” molten carbonate fuel cell. Residential On‐Line Energy Audit and Energy Calculator‐ Enables customers to perform their own on‐line energy audit. One school’s “Wacky Watts” project centered on its fifth grade students mentoring the school’s second graders about heat, light, sound, and electricity. Another school’s project focused on the connection between landscaping and energy efficiency. Students also performed an energy audit and held an energy fair. New Construction The best practices in new construction programs have proven to be effective in creating a more energy‐efficient new building stock, showcasing new technologies, and supporting the adoption of more energy‐efficient building practices throughout a region. The key elements of the best practice programs are training, technical assistance, and financial incentives, regardless of whether the program is commercial or residential. In addition, many of the programs are built on a national model, allowing them to leverage the national program’s economies of scale and expertise, and apply their own limited resources more effectively. A Best Practices Guide for Energy Efficiency in Municipally‐Owned Services Areas 279 | P a g e Incentives are the most prominent component of the programs identified. The incentives offered were based on three different models: prescriptive, performance based, and capital cost offset. Prescriptive incentives offer predetermined incentives for the installation of prequalified equipment or strategies. Performance based incentives were determined on either the projected energy savings of the project, the HERS rating in residential projects, or the estimated savings generated by a specific higher efficiency measures installed. Capital cost offset incentives are designed to encourage projects to implement more aggressive energy‐efficient strategies by providing financial support to offset higher initial capital costs. In addition, most of the programs included a tiered incentive structure. A tiered structure provides programs with two advantages. It creates a mechanism to support wide‐scale adoption and the implementation of nonstandard, higher efficiency and more expensive strategies. In addition, it builds flexibility into the program to easily phase out technologies or efficiency targets as they become more standard practice. Training and technical assistance were also key aspects of the best practice programs. Depending on the goals of the program some include technical assistance for design teams to create showcase projects. Highlighting for a community what is possible. Others provide industry training on the construction of high performance buildings to facilitate the adoption of better building practices across the board. Many of the programs leveraged existing national programs (ENERGYSTAR®, Advanced Building TM Guidelines, and LEED®). As the national programs have already developed the concepts, technical soundness, and administration process, the program administrators can focus their resources on other aspects of the program. In addition, the association with a recognized national program can give a program credibility with the building community and consumers, as well as immediate market recognition. Some of the practices can be easily implemented as a standalone program, such as an ENERGYSTAR® Home program. Others are only effective implemented as a part of a suite of offerings, as APS’s ENERGYSTAR® + Solar Homes ‐ Builder Incentives program does, building on their existing ENERGYSTAR® Homes Program. Another strategy to consider is creating economies‐of‐scale across regions, as the State of Colorado did with the Governor’s Energy Office’s ENERGYSTAR® New Homes Program. a state sponsored program to support local and regional initiatives. Sustainable Communities Program – San Diego Gas and Electric, CA The goal of the Sustainable Communities Program is to increase the market adoption of energy‐ efficient technologies and sustainable design practices that offer greater energy efficiency at lower costs over their life cycle than many of the more commonly adopted energy‐efficient technologies. The Sustainable Communities Program supports the building of demonstration projects incorporating measures that can increase energy efficiency by more than 30 percent, higher than California’s Title 24 requirements. The demonstration projects are then used as showcases of energy‐efficient design and building practices. The program offers incentives, technical and design assistance, marketing and outreach, and project promotion. To be eligible, projects must exceed Title 24 requirements by 30 percent. The State of California offers a variety of programs that encourage participants to invest in energy‐efficiency options that exceed the California Title 24 requirements by 10 to 25 percent. A Best Practices Guide for Energy Efficiency in Municipally‐Owned Services Areas 280 | P a g e To support the implementation of measures that have higher upfront costs but offer greater benefits over the life of the projects, the program provides incentives 15 percent higher than the State programs for specific measures. The eligible measures are those with generally higher up‐front capital costs but a longer EULs, and lower O&M costs. In addition, the program is also attempting to increase the market acceptance of LEED® standards, and offers incentives to cover approximately 50 percent of the costs associated with LEED® registration and certification for LEED® buildings. Colorado ENERGY STAR® New Homes – Colorado Governor’s Energy Office, CO The Governor's Energy Office (GEO) ENERGY STAR® New Homes (ESNH) Program is run by the Colorado GEO. The program goal is to increase consumer awareness of ENERGY STAR® homes, the energy‐efficiency options in residential new construction, and to support participating Colorado ENERGY STAR® homebuilders. The state energy office partners with counties, cities, nonprofit organization, and utilities to offer local programs to support and promote ENERGY STAR certification in new residential construction. GEO manages a fund for the program and local and regional partnerships apply for funding based on numerous criteria, including their ability to implement an ESNH program suitable to their local market, and their ability to align with existing efforts. Energy Incentives from WE Energies Commercial and Industrial New Construction Program ‐ WE Energies, MI The We Energies Commercial and Industrial New Construction Program is designed to transform the market and reduce peak loads. The program works with the building community to help them deliver high performance buildings through the implementation of more energy‐efficient building systems and the use of an integrated design process. This is achieved through technical assistance and a tiered incentive program for both the design and implementation of energy‐ efficient strategies. In addition, the program provides education, information, and outreach to both program participants and the broader community to facilitate a market transformation. This outreach is also used to recruit program participants. Projects accepted into the program will follow one of two potential paths: comprehensive or the Advanced Buildings TM Approach. The comprehensive approach is based on an integrated design process and is generally applied to larger projects and allows for greater potential energy efficiency. The Advanced Buildings TM Approach also uses integrated design, but is more streamlined and more applicable to smaller projects. The comprehensive approach offers higher potential energy efficiencies and its participants receive a higher level of technical assistance and are eligible for higher incentives than participants applying the Advanced Buildings TM Approach. The building size, project type, design stage, and opportunities dictate which approach is pursued. Commercial Construction Program ‐ Long Island Power Authority, NY LIPA’s Commercial Construction Program promotes the adoption of energy‐efficient electric technologies through incentives and technical assistance. The new construction program offers participants three approaches: prescriptive, custom, and whole building. In addition the program incentivizes LEED certification and commissioning related to energy efficiency. A Best Practices Guide for Energy Efficiency in Municipally‐Owned Services Areas 281 | P a g e The prescriptive option provides predetermined incentives for pre‐qualified electric energy‐ efficient equipment. The custom option supports customers that are installing higher efficiency equipment, designing lighting, or incorporating control systems not available through the prescriptive option. Incentives are capped on a per project basis of $200,000 dollars. The whole building option supports a more comprehensive approach to building energy efficiency offering greater incentives and more flexibility. In addition, the program supports LEED certification for buildings by offering higher total incentives available to the project. For non‐LEED projects incentives are capped on a per project basis of $400,000 dollars. LEED projects can receive up to $500,000 per project. Incentives for both the custom and whole building options are calculated on a case‐by‐case basis based on the cost differential between a standard technology or approach and the higher efficiency technology or approach being implemented. Incentives being paid cannot exceed the energy‐savings dollars (electric benefits) to the utility. In addition, the utility will pay for technical assistance to program participants for $10, and 50 percent of any additional costs, up to $50,000. ENERGY STAR® Market Transformation Program – CenterPoint, TX CenterPoint’s ENERGYSTAR® MTP program offers developers and builders incentives for the construction of energy‐efficient homes. Both ENERGY STAR® builders and non ENERGYSTAR® builders are accepted into the program (see note below regarding ENERGYSTAR® V3). Builders constructing homes that meet or exceed the ENERGYSTAR® New Homes Version 2 standards are qualified to participate. Incentives are based on the amount of energy savings from specific measures implemented, based on the kW and kWh baseline indicated from REM/Rate files for the home. Builders are encouraged to build to higher energy standards through a two tiered incentive system, paying higher incentives for measures installed in higher efficiency homes. Participants in the program also receive technical assistance and training for their sales and operations teams and the program helps build demand through advertising and marketing targeted consumers. CenterPoint Energy does not pay direct incentives to homeowners for this program. New Home Construction – Alliant Energy, IA The goal of the New Home Construction program is to make energy efficiency a standard design practice in new homes. Targeting home builders, the program provides builders with education, design assistance, and incentives to build more energy‐efficient housing. The incentives are tiered, based on which of two options a builder pursues: installing a prescriptive option package or building to ENERGYSTAR® qualifications. The prescriptive option incentivizes the implementation of a pre‐specified set of measures. ENERGYSTAR® homes are eligible for a higher tier of incentives. Homes pursuing either option are also eligible for additional incentives for installing premium‐efficiency heating and cooling equipment. In addition to the tiers, rewards are based on the square footage of the home, and whether or not the home receives heating and/or cooling energy from Alliant Energy. The program markets to both the supply side of the industry (builders, lenders, and real estate agents) and to consumers to help create demand. The program also applies to multifamily residential buildings of three stories or less that qualify for the ENERGYSTAR® label. A Best Practices Guide for Energy Efficiency in Municipally‐Owned Services Areas 282 | P a g e ENERGYSTAR® + Solar Homes ‐ Builder Incentives ‐ Arizona Public Service, AZ APS’s ENERGYSTAR® + Solar Homes ‐ Builder Incentives program encourages the adoption of solar technologies on a neighborhood‐wide scale. Built on the foundation of their APS ENERGYSTAR® Homes Program, the Solar Homes Builder Incentives requires homes to first meet the ENERGYSTAR® home efficiency requirements and then incentivizes the integration of either solar voltaic or solar thermal technologies. Primary components of the program include the ENERGYSTAR® Homes program, tiered incentives, and a nationally recognized builder education program. To be eligible for the program a builders must be an ENERGYSTAR® partner, the homes/communities must meet the APS ENERGYSTAR® Homes Program requirements, and the homes must include room pressure balancing and mechanical fresh air ventilation. The APS ENERGYSTAR® Homes Program requires s builders to attend the APS ENERGYSTAR® workshop. These workshops are a fundamental part of the program’s success in delivering the desired energy efficiency and comfort to the homes. Reinforcing how valuable solid training is to APS, they fly in a company nationally‐renowned for the quality of their trainings for building teams on how to construct high performance buildings. Once a builder is accepted into the program, they are eligible to receive incentives and support. Incentives are paid on a per home basis and are based on three variables: the HERS rating of the homes, whether homes are solar ready or have solar technology installed, and the percentage of homes in a community a builder commits to the program. Based on the combination of these variables, builders receive incentives ranging from $100 to $1,000 per home. To ensure program consistency, it includes a twelve‐month reservation life‐cycle. In addition to the incentives, the program helps market the communities, provides builders with technical assistance, and provides builder’s sales and marketing teams with additional training. Payments are paid directly to the builder and are above and beyond the standard APS renewable energy incentives. Advanced BuildingsTM Program – National Grid , NY The goals of National Grid’s Advanced BuildingsTM Program are to encourage the construction of 20,000 to 100,000 square foot, energy efficient, commercial buildings in a manner that is simple and cost effective for both the projects and the program. Utilizing the resources provided through the New Building Institute’s Advanced Building TM Guidelines, the program is able to offer design teams a prescriptive path, design tools and technical support to create buildings that are 10 to 30 percent more energy efficient than if built to code. When a project commits to the program the design team meets with a program representative to review the program requirements and resources available. The program offers incentives on a per square foot basis for meeting the base building requirements, and additional incentives for more aggressive energy efficiency measures. The additional incentives are customized based on the incremental costs and potential energy savings above a standard technology. The program is marketed almost entirely through educational seminars and brown bag lunch presentations. Multifamily Low‐Income Program ‐ Efficiency Vermont, VT Also listed under Audit and Direct Install Programs The Multifamily Low‐Income Program is a multiyear collaborative effort delivering a comprehensive package of energy‐efficiency education, technical assistance, and incentives for A Best Practices Guide for Energy Efficiency in Municipally‐Owned Services Areas 283 | P a g e both new and existing residential multifamily housing across much of northwestern Vermont. Managed by Efficiency VT, the program operates in both Vermont Gas Systems and Burlington Electric Department service areas to deliver a duel fuel approach to efficiency. The program works together with the low‐income WAP, to present recommended energy‐saving measures to building owners where tenants qualify for WAP services. The weatherization team goes to the property and performs an audit and identifies potential improvements and then provides renovation construction services. The incentives are delivered to support a comprehensive project not as one‐off measures. This encourages building owners to adopt all cost‐effective efficiency measures, not just quick payback options. The developer receives building plan reviews at no cost and discusses potential improvements identified by Efficiency VT. Site visits are provided during the construction process to assist with air sealing details and purchasing decisions, and to ensure that insulation and energy‐efficient products are selected and installed. The program works with virtually all new subsidized multifamily construction in the state, as well as a high percentage of privately owned new construction projects. Training programs are in high demand. Efficiency VT Implements the program on a joint basis that allows for the development of a shared vision and big picture thinking regarding projects, as well as for consistent messaging from multiple companies, rather than different messages depending on service territories. This program does appear to be compatible with municipal utility delivery and operations by virtue of the following best practice attributes: Efficiency VT understands the market and builds relationships with all market actors across the state spanning project types or customer classes that enables the program to find solutions to market barriers Efficiency VT implements the program on a joint basis allowing for the development of a broader, shared vision regarding the projects – delivering a consistent message to multifamily building operators and developers and trade allies Efficiency VT has developed and implemented a design guide for multifamily housing as well as a comprehensive track for new construction/rehab projects The New Building Institute’s Advanced Buildings’ TM Tools: Several of the programs reference the New Building Institute’s Advanced Building TM Guidelines. The NBI is a nonprofit organization focused on transforming the market to build more energy‐ efficient commercial buildings. A key part of their efforts is the development and sharing of The Advanced Buildings TM suite, a set of guidelines, tools, and resources to help design teams create high performance buildings. The Core Performance Guide is the component that defines high performance in building envelopes, lighting, HVAC, power systems, and controls. Design teams that utilize the guide as a part of an integrated design process can create buildings that are up to 30 percent more energy efficient than model building standards. The guidelines are written to use off the shelf strategies, be adapted into beyond code programs, and include regional variations. In addition to tools and resources for design teams, the NBI offers a suite of services to help sponsor organizations administer programs based on the Advanced Building TM Guidelines. For A Best Practices Guide for Energy Efficiency in Municipally‐Owned Services Areas 284 | P a g e an annual sponsorship an organization can take advantage of a host of administrative and technical tools and resources, including: Marketing and administration templates Monthly sponsor calls to discuss program challenges and share resources Technical support Program analysis tools Attendance of an annual sponsors’ conference Being a sponsor allows organizations to leverage the resources and recognition of a larger, international organization for a minimal cost. More information can be found at http://www.advancedbuildings.net and http://newbuildings.org. 6. Financing Performance Contracting Program ‐ Alliant Energy, WI Alliant Energy works with ESCOs, including an in‐house contracting team, to offer all non‐ residential customers the option to make energy efficiency improvements at no upfront cost. The cost is paid by a third‐party lender facilitated by the ESCO, and is repaid by the customer from the energy savings. The ESCO models and recommends the improvements, guarantees the savings, installs the measures, and guides the customer through the entire process from start to finish. The utility serves as the program administrator and is responsible for managing the overall program, approving project applications, and verifying the savings estimates. A unique feature of the program is that the utility pays the ESCO a “risk premium” incentive, in order to encourage deeper retrofits. For the ESCO, the risk of the savings guarantee decreases with each marginal improvement. The incentive is based on the verified kWh savings during the first year, and is increased from $0.06/kWh to $0.14/kWh for more extensive retrofits. The best practices from this program include: A guarantee of savings is provided to the customer by the performance contractor An economic incentive encourages performance contractors to participate in the program Incentives are linked to building performance; the incentive is based on measured savings A whole‐building approach maximizes energy savings; deeper retrofits earn a higher incentive Home Performance with ENERGY STAR® Loans ‐ Austin Energy, TX AE has teamed with a local lender, Velocity Credit Union (VCU), to provide financing for over 1,800 energy upgrades since 2006 as part of their HPwES program. Participants may choose between rebates of up to 20 percent of the project cost or low‐interest unsecured financing through VCU. AE buys down the interest rate on the loans to between 0 percent and 6 percent depending on the extent of the upgrade, loan term, and the customer’s credit score. Loan terms A Best Practices Guide for Energy Efficiency in Municipally‐Owned Services Areas 285 | P a g e are from three to ten years, loan amounts range from $1,500 to $11,000, and there is no minimum credit score. In 2010, AE ran a promotion named the “Best Offer Ever” and allowed participants to receive both the rebates and the financing. The promotion was very successful, with over 300 comprehensive retrofits financed as a result. This program is a good example of the growing trend in which utilities team with lenders to help customers finance the cost of energy upgrades. While national lenders have generally been reluctant to develop products for this small but growing market, utilities are finding that local and regional banks and credit unions can be willing partners. Non‐profit lenders known as C can also be attractive partners, since they may be able to offer below‐market interest rates. The best practices from this program include: Teaming with lenders leverages their experience in financing home improvements. Low‐interest financing serves as a high‐leverage tool. A network of local installers has been trained and quality assurance procedures are in place. Installers help sell the program to their customers. Help My House Pilot Program ‐ The Electric Cooperatives of South Carolina, SC Eight rural electric coops in South Carolina have joined forces to test OBF as an acquisition strategy. Led by the ECSC and Central Electric Power Cooperatives, the Help My House Pilot Program provides low‐cost financing (2.5 percent interest) to fund the full upfront cost of a home’s energy efficiency improvements. The financing is paid back over time (up to 10 years) through the homeowner’s monthly electric bill. The monthly financing payments are offset by the energy savings, so that the resulting utility bill is less than it was before the improvements. The financing is attached to the electric service account, rather than the property owner or tenant; if the home is sold or the tenant moves, the financing can simply transfer to the next occupant. For the pilot, the utilities are actively identifying homeowners based on above‐ average energy use, and are offering free energy audits as well as assistance with contractor selection and supervision. An important feature of OBF is that it works for rental properties. Normally, if the tenant pays for utilities, the landlord has little incentive to pay for energy improvements, since the tenant would be the one to benefit from the savings on the utility bill. Conversely, tenants are usually reluctant to pay for improvements to a property they do not own. This problem of “split incentives” is solved by OBF, since the tenant both enjoys the savings and also makes the monthly financing payment, with the net result being a lower utility bill overall. A similar cooperative effort among four utilities is taking place in Kentucky. The best practices from this program include: A collaboration among utilities leads to economies of scale and a stronger program. Low‐interest financing serves as a high‐leverage tool. A Best Practices Guide for Energy Efficiency in Municipally‐Owned Services Areas 286 | P a g e Information about customers is used to target homeowners with above‐average energy use. OBF is used to solve the “split incentives” problem associated with tenant‐occupied properties. Power Smart Residential Loans ‐ Manitoba Hydro, Manitoba, Canada Manitoba Hydro is a government‐owned gas and electric utility serving over 500,000 customers throughout the province of Manitoba. Since 2001, the utility has issued 51,000 loans for more than $200 million for residential energy‐efficiency measures. This is an OBF program, with repayment via the utility bill. Loan terms are up to five years (15 years for furnaces), and the interest rate is currently subsidized from 5.5 percent down to 4.9 percent. The loan can be combined with a grant available from the federal ecoENERGY program. The success of this large program is attributed to a fast and easy loan application process and strong relationships with contractors and retailers. Customers simply fill out a one‐page application and then quickly learn if they are approved, usually within three to five minutes. More than 90 percent of the contractors in the province participate in the program, along with about 800 suppliers. Windows and doors make up half of all installations, followed closely by heating systems, with insulation constituting less than 5 percent of installations. The best practices from this program include: Low‐interest financing serves as a high‐leverage tool. Loans are approved quickly. A network of local installers has been trained and quality assurance procedures are in place. Installers help sell the program to their customers. How$mart ‐ Midwest Energy, KS Midwest Energy is a gas and electric cooperative utility serving 48,000 customers in western Kansas. Their How$mart OBF program funds the full up‐front cost of energy upgrades for residential and small commercial customers. Repayment is provided via a tariff, or surcharge, attributed to the meter rather than the customer. The surcharge includes the project costs, the cost of capital, and the administrative cost of the program (roughly 5 percent of the project cost). The cost of capital is just 4 percent, thanks to the Kansas Housing Resources Corporation that contributes half of project funds at 0 percent interest. Terms are up to 15 years for homeowners and 10 years for small businesses. One advantage of the tariff is that it is not considered a loan and does not show up on a company’s financial balance sheet. As such, it does not eat into the borrowing capacity of the business, and does not have to compete with other company priorities for capital budget dollars. These are significant advantages in the commercial sector. In 2009, Midwest Energy partnered with the Climate & Energy Project to sponsor the Take Charge Challenge, a contest between six communities to reduce energy use over the course of one year. The kickoff event in each town was a major event with participation of town leaders, A Best Practices Guide for Energy Efficiency in Municipally‐Owned Services Areas 287 | P a g e followed by quarterly events and community celebrations. The challenge generated 87 How$mart audits and conservation plans, 97 percent of which were either installed or pending. The best practices from this program include: Partnerships with cities and community‐based organizations were used to expand participation. Low‐interest financing serves as a high‐leverage tool. OBF is used to solve the “split incentives” problem associated with tenant‐occupied properties. Off‐balance sheet financing addresses business concerns about borrowing capacity and capital budget priorities. Assisted Multifamily Building Program, NYSERDA, NY NYSERDA’s AMP was a multiyear initiative providing a range of technical and financial services to help multifamily building owners and tenants identify, finance, implement, and monitor energy‐ saving measures and increase the health and safety benefits for building occupants. The program was designed to change the market for energy‐efficiency investments in low‐income multifamily buildings. AMP emphasized energy and bill savings for low‐income tenants through contractual and policy directives. The program also provided free training to owners, maintenance staff, and building operators in the proper use and maintenance of energy‐ efficient technologies. AMP was a single point‐of‐entry across the state for multifamily building owners and developers interested in improving the energy efficiency of new and existing buildings. The program leveraged all DSM incentives available through local utilities, as well as outside funding from local, state, and federal agencies to create a unified structure across the state. The program worked with buildings that would not typically qualify for a conventional loan by providing low‐ interest financing secured by 80 percent of the projected savings from energy‐efficiency rehabilitations. A high priority was placed on program tracking and quality assurance and control to ensure program practices were consistent and easily replicated. In addition, the program has developed a host of policies to establish consistency and reduce barriers across both internally and externally across the state; this includes building relationships with regulators and government agencies and collaborative efforts to modify regulations and incorporate higher energy efficiency standards. Despite the high program budget, this program does appear to be compatible with municipal utility delivery and operations by virtue of the following best practice attributes, A “gap funding” model that has proven to be an extremely efficient way to use NYSERDA resources – the program takes maximum advantage of outside funding (local, state, federal, and utility programs) before providing “gap funding” in the form of a grant. NYSERDA developed strong relationships with regulators and then successfully implemented and refined a host of statewide policies to coordinate desperate groups, incorporate higher efficiency standards, apply new technologies and methods, and navigate various marketplace/program barriers. A Best Practices Guide for Energy Efficiency in Municipally‐Owned Services Areas 288 | P a g e Employed health and safety measures as part of the AMP analysis providing tenants with better living conditions (lighting, ventilation, air pollution reduction, safer buildings) Placed a high priority on quality assurance and control; stringent underwriting standards as well as rigorous documentation requirements; a detailed policy and procedures manual; all of which ensured program practices were consistent and easily replicated. 7. Demand Response Air Conditioning Load Management (Cool Share) – Nevada Power Company, NV The DR Program, which prior to its expansion was the Air Conditioning Load Management Program, and was recently marketed as the Cool Share Program, was a DLC program that reduced system peak loads by providing incentives to customers in return for their permission to allow the Nevada Power Company to control their air conditioning loads during peak times. Through the program, the Nevada Power Company sought to reduce the upward pressure on rates for both participating and non‐participating customers by offsetting capacity costs. By deploying programmable communicating thermostats, the program could be used as a peaking resource that helped reduce or avoid the necessity to purchase higher cost capacity and energy, and delayed the construction of new generation and/or distribution assets. For the 2007‐2009 Action Plan period, the Nevada Power Company installed 120 MW of demand reduction capacity. They curtailed customers on 31 days during the summer of 2009. The highest one‐hour average load reduction achieved during the 31 days of thermostat set‐backs of 4° Fahrenheit was 2.1 kW per air conditioning unit; which occurred on June 29, 2009 from 4:00 p.m. to 5:00 p.m. Over the three year Action Plan period, the Nevada Power Company achieved 120 percent of their demand reduction target through the program and actual expenditures were 100 percent of the original budget for the same period. Notable/replicable program components include: In 2004 and 2005, the Nevada Power Company piloted a sophisticated load control and customer information gateway system; however, due to operating complications and vendor issues, they removed these installations in 2006 and largely replaced them with Carrier two‐way programmable communicating thermostats. The Nevada Power Company migrated the programs’ Microsoft Excel® model to a tool that was more flexible and intuitive and had a more sophisticated optimization engine. They could use this updated model to plan and analyze the peak load impact of DR resources for both long‐term and short‐term optimization. Residential Direct Load Control– Alliant Energy, IA The DLC Program operates during the peak summer season from May 15 to September 15, 2010. Alliant Energy shuts off a participant’s A/C for 15 minutes of every half hour and then returns the compressor to the set control temperature for the remaining 15 minutes of the half hour. A typical cycling event lasts six hours, from 1:00 p.m. to 7:00 p.m., on weekdays. Participants’ water heaters are turned off for the duration of the cycling event. A Best Practices Guide for Energy Efficiency in Municipally‐Owned Services Areas 289 | P a g e Alliant Energy partnered with Michaels Engineering to test the appliance cycling switches. Through testing and switch upgrades and replacements, Alliant Energy has the potential to achieve a reduction of approximately 38 MW by the end of 2012. Some of the programs’ best practices are: Alliant Energy partnered with an ESCO to test appliance cycling switches in their service territory and replace those that are missing or not functioning properly. The program marketing materials include descriptions of other energy efficiency program offered by Alliant Energy. Alliant Energy provides cross‐marketing to all DLC program participants with ideas for them to bundle related measures (e.g., install a programmable thermostat in conjunction with installing a new air conditioning unit). The program provides materials to each new participant that explains the DLC program and other Alliant Energy related programs when installing the DLC switch. They also provide similar energy efficiency program materials to existing participants on an annual basis. FlexPeak Management – Idaho Power, ID FlexPeak Management was a DR program provided by Idaho Power. The program objective was to reduce the demand on Idaho Power’s system during peak times through customers’ voluntary electrical‐use reduction. The program targeted industrial and large‐commercial customers. The program hours were defined as June 1 to August 31, 2009 between the hours of 2:00 p.m. and 8:00 p.m. on non‐holiday weekdays. Customers received notification of a demand‐reduction event two hours prior to the start of the event, and events would last between two and four hours. Idaho Power contracted with EnerNOC, Inc. to implement the program. EnerNOC was responsible for marketing plans, enrolling participants, installing the equipment to reduce demand, and reporting the results to Idaho Power. Idaho Power initiated DR events by notifying EnerNOC, who then implemented the requested load reduction to the Idaho Power system. Idaho Power then monitored the real‐time energy‐usage data and the demand‐reduction event in aggregate. Customers could also continuously monitor their demand‐reduction performance using their individual, near real‐time energy‐usage data. Notable/replicable program components include: The program implementer would meet with prospective customers to identify their potential for reducing electrical energy loads during program hours. Program administration costs were much lower than originally estimated. Customer satisfaction surveys were conducted by the program implementer. Commercial Load Management Standard Offer Program– Oncor Electric Delivery, TX The Commercial Load Management SOP offered by Oncor Electric Delivery, LLC targeted commercial customers with demand higher than 700 kW. The objective of the program was to A Best Practices Guide for Energy Efficiency in Municipally‐Owned Services Areas 290 | P a g e assist businesses with reducing their peak demand in order to help meet the state energy efficiency goals. Oncor paid the program incentives to the service providers who worked with local commercial and manufacturing facilities to reduce their peak demand. In order to qualify for the program, the customer must have had an Internal Data Records (IDR) meter. Oncor would verify the savings by reviewing data recorded on IDRs and calculating the amount of demand savings achieved through the curtailment during the summer peak season. The minimum savings requirement for the program was 100 kW. Notable/replicable program components include: Service providers would undergo an application process and enter into a standard contract with Oncor. A Best Practices Guide for Energy Efficiency in Municipally‐Owned Services Areas 291 | P a g e Appendix E. References 1. AEP Texas Central (2011) AEP Texas Central Company 2011 Energy Efficiency Plan and Report Available at: http://www.texasefficiency.com/files/EEPRs/AEP_TCC_2011_EEPR.pdf. 2. AEP Texas North (2011) AEP Texas North Company 2011 Energy Efficiency Plan and Report Available at: http://www.texasefficiency.com/files/EEPRs/AEP_TNC_2011_EEPR.pdf. 3. Alliant Energy 2010 Alliant Energy annual report Available at: http://www.alliantenergy.com/wcm/groups/wcm_internet/@int/documents/contentpage/ 029077.pdf. 4. Austin Energy (2011) DSM Performance Measures ‐ FY 2009‐2010 Available at: http://www.austinenergy.com/About%20Us/Newsroom/Reports/DSMPerfMeas2010.pdf. 5. California Municipal Utilities Association (2009) Energy Efficiency in California’s Public Power Sector: A Status Report. Available at: http://cleanefficientenergy.org/resource/energy efficiency‐california%E2%80%99s‐public‐power‐sector‐status‐report. 6. California Municipal Utilities Association (2010) Energy Efficiency in California’s Public Power Sector: A Status Report. Available at: http://cleanefficientenergy.org/resource/energy‐ efficieny‐californias‐public‐power‐sector‐status‐report. 7. CenterPoint Energy (2011) CenterPoint Energy 2011 Energy Efficiency Plan and Report Available at: http://www.texasefficiency.com/files/EEPRs/2011_CEHE_Revised_EEPR.pdf. 8. Colorado Governor’s Energy Office 2010 Colorado Utilities Report Available at: http://rechargecolorado.org/images/uploads/pdfs/2010_Colorado_Utilities_Report_7‐26‐ 10.pdf. 9. Dan York, Marty Kushler, and Patti Witte (2005) Meeting Essential Needs: The Results of a National Search for Exemplary Utility‐Funded Low‐Income Energy Efficiency Programs (American Council for an Energy‐Efficient Economy) Available at: http://aceee.org/research‐ report/u053. 10. Dan York, Marty Kushler, and Patti Witte (2008) Compendium of Champions: Chronicling Exemplary Energy Efficiency Programs from Across the U.S. (American Council for an Energy‐ Efficient Economy) Available at: http://www.aceee.org/research‐report/u081. 11. DOE Technical Assistance Program DOE Technical Assistance Program Blog. Available at: http://www.eereblogs.energy.gov/tap/. 12. El Paso Electric Co (2011) El Paso Electric Co 2011 Energy Efficiency Plan and Report Available at: http://www.texasefficiency.com/files/EEPRs/EPE_2011_EEPR.pdf. 13. Energy Information Administration EIA Electricity Database. Annual Electric Utility Data. Available at: http://www.eia.gov/cneaf/electricity/page/eia861.html. A Best Practices Guide for Energy Efficiency in Municipally‐Owned Services Areas 292 | P a g e 14. Energy Trust of Oregon, Inc. (2005) Recommendations forCommunity‐Based Energy Program Strategies Available at: http://www.veic.org/Libraries/Resumes/Reccomendations_for_Comm_Based_wAppx.sflb.a shx. 15. Energy Trust of Oregon, Inc. Best Practices From Energy Efficiency Organizations and Programs Available at: energytrust.org/library/reports/EE_bestpractices_summary_F.pdf. 16. Entergy Texas Inc. (2011) Entergy Texas Inc. 2011 Energy Efficiency Plan and Report Available at: http://www.texasefficiency.com/files/EEPRs/Entergy%202011%20EEPR.docx. 17. Environmental Protection Agency (2006) National Action Plan for Energy Efficiency Available at: http://www.epa.gov/cleanenergy/documents/suca/napee_report.pdf. 18. Environmental Protection Agency (2007) Model Energy Efficiency Program Impact Evaluation Guide Available at: http://www.epa.gov/cleanenergy/documents/suca/evaluation_guide.pdf. 19. Environmental Protection Agency (2008) National Action Plan for Energy Effi ciencyVision for 2025: A Framework for Change Available at: http://www.epa.gov/cleanenergy/documents/suca/vision.pdf. 20. Environmental Protection Agency (2008) Understanding Cost‐Effectiveness of Energy Efficiency Programs: Best Practices, Technical Methods, and Emerging Issues for Policy‐ Makers Available at: www.epa.gov/cleanrgy/documents/suca/cost‐effectiveness.pdf. 21. Environmental Protection Agency EPA Grants and Debarment. Available at: http://www.epa.gov/ogd/grants/funding_opportunities.htm. 22. Environmental Protection Agency National Action Plan for Energy Efficiency. Available at: http://www.epa.gov/cleanenergy/energy‐programs/suca/resources.html. 23. Environmental Protection Agency Energy Efficiency in Government Operations and Facilities. Available at: http://www.epa.gov/statelocalclimate/local/topics/government.html. 24. Environmental Protection Agency EPA National Energy Efficiency Best Practices Study Available at: www.epa.gov/cleanrgy/documents/suca/napee_chap6.pdf. 25. Environmental Protection Agency Quick Start Energy Efficiency Programs Available at: http://s3.amazonaws.com/zanran_storage/www.epa.gov/ContentPages/7739544.pdf. 26. Federal Energy Regulation Commission (2011) Assessment of Demand Response & Advanced Metering Available at: www.ferc.gov/legal/staff‐reports/2010‐dr‐report.pdf. 27. Frontier Associates, LLC (2008) Texas Renewable Energy Resource Assessment Available at: http://www.seco.cpa.state.tx.us/publications/renewenergy/pdf/renewenergyreport.pdf. A Best Practices Guide for Energy Efficiency in Municipally‐Owned Services Areas 293 | P a g e 28. Global Energy Partners, LLC (2010) A PRACTICAL GUIDE TOENERGY EFFICIENCYDesigning successful energy efficiencyprograms. Available at: http://www.gepllc.com/EE_PracticalGuide.pdf. 29. Graham Brown, Mike Elchinger, Ryan Flynn, Andy Lubershane (2011) Financing Strategies for Municipal Energy Efficiency Available at: http://www.erb.umich.edu/Research/InstituteReports/11‐ 12/FinancingStrategiesforMunicipalEnergyEficiencyweb.pdf. 30. Itron Inc (2008) Assessment of the Feasible and. Achievable Levels of Electricity. Savings from Investor Owned. Utilities in Texas: 2009‐2018. Available at: http://www.puc.state.tx.us/industry/electric/reports/misc/Electricity_Saving_2009‐ 2018_122308.pdf. 31. Luisa Freeman, Shawn Intorcio and Jessica Park (2010) Implementing Energy Efficiency: Program Delivery Comparison Study Available at: http://www.edisonfoundation.net/iee/reports/IEE_EEProgDeliveryComparison.pdf. 32. Michael Sciortino (2010) States Stepping Forward: Best Practices for State‐Led Energy Efficiency Programs Available at: http://www.aceee.org/research‐report/e106. 33. Michael Sciortino, Seth Nowak, Patti Witte, Dan York and Martin Kushler (2011) Energy Efficiency Resource Standards: A Progress Report on State Experience Available at: http://www.aceee.org/research‐report/u112. 34. National Action Plan for Energy Efficiency (2009) Rapid Deployment Energy Efficiency Toolkit. Available at: http://www.epa.gov/cleanenergy/energy‐ programs/suca/rdeetoolkit.html. 35. Nexant Inc. (2008) Demand Side Management Potential Study ‐ CPS Energy. Available at: www.cpsenergy.com/files/Nexant_Potential_Study.pdf. 36. Nexant Inc. (2010) Measurement and Verification of CPS Energy’s 2009 DSM Program Offerings Available at: http://www.sanantonio.gov/oep/pdf/STEP/FY09AnnualReport.pdf. 37. Nigel Jollands (IEA) and Stephen Kenihan & Wayne Wescott (ICLEI) (2008) Promoting Energy Efficiency Best Practice in Cities ‐ A Pilot Study Available at: http://www.iea.org/papers/2008/cities_bpp.pdf. 38. Oncor Electric Delivery Company, LLC (2011) Oncor Electric Delivery Company, LLC 2011 Energy Efficiency Plan and Report Available at: http://www.texasefficiency.com/files/EEPRs/Oncor_2011_EEPR.pdf. 39. Quantum Consulting Inc. Best Practices Benchmarking for Energy Efficiency Programs Available at: http://www.eebestpractices.com/. 40. R. Neal Elliott, Maggie Eldridge, Anna M. Shipley,John “Skip” Laitner, and Steven Nadel,Alison Silverstein, Bruce Hedman, Mike Sloan (2007) Potential for Energy Efficiency, A Best Practices Guide for Energy Efficiency in Municipally‐Owned Services Areas 294 | P a g e Demand Response,and Onsite Renewable Energyto Meet Texas’s Growing Electricity Needs. Available at: www.naesco.org%2Fresources%2Findustry%2Fdocuments%2F2007‐03.pdf. 41. REEEP, Alliance to Save Energy, ACORE (2010) Compendium of Best Practices ‐ Sharing Local and State Success in Energy Efficiency and Renewable Energy from the United States Available at: http://www.acore.org/wp‐ content/uploads/2011/02/Compendium_of_Best_Practices_‐_Final.pdf. 42. Rocky Mountain Power Demand Side Management Team (2009) 2009 Rocky Mountain Power Demand Side Management Annual Report ‐ Wyoming. Available at: www.pacificorp.com/content/dam/pacificorp/doc/Energy_Sources/Demand_Side_Manage ment/DSM_UT_Report.pdf. 43. Rocky Mountain Power Demand Side Management Team Energy Efficiencyand Peak Reduction Annual Report ‐ Idaho. Available at: www.pacificorp.com/content/dam/pacificorp/doc/Energy_Sources/Demand_Side_Manage ment/ID_DSM_Report_2010.pdf. 44. Seattle City Light Energy Conservation Accomplishments: 1977‐2006 Available at: http://www.seattle.gov/light/Conserve/Reports/accomplish_3.pdf. 45. Seth Nowak, Martin Kushler, Michael Sciortino, Dan York and Patti Witte (2011) Energy Efficiency Resource Standards: State and Utility Strategies for Higher Energy Savings Available at: http://aceee.org/research‐report/u113. 46. Southwestern Electric Power Co. (2011) Southwestern Electric Power Co 2011 Energy Efficiency Plan and Report Available at: http://www.texasefficiency.com/files/EEPRs/SWEPCO_2011_EEPR.pdf. 47. Southwestern Public Service Co. (2011) Southwestern Public Service Co 2011 Energy Efficiency Plan and Report Available at: http://www.texasefficiency.com/files/EEPRs/SPS_2011_EEPR.doc. 48. Summit Blue Consulting, LLC (2010) Minnesota Statewide Electricity Efficiency Potential Study DSM Potential Report Available at: http://www.state.mn.us/mn/externalDocs/Commerce/CARD_Minnesota_Electric_Energy_E fficiency_Potential_Study__Executi_063010013802_DSMPotentialsReportExecutiveSummar y.pdf. 49. Texas Energy Efficiency 2010 Energy Efficiency Plan and Reports from Texas IOU’s Available at: http://www.texasefficiency.com/report.html. 50. Texas‐New Mexico Co. (2011) Texas‐New Mexico Power Co 2011 Energy Efficiency Plan and Report Available at: http://www.texasefficiency.com/files/EEPRs/TNMP_2011_EEPR.pdf. 51. The Consortium for Energy Efficiency (CEE) (2005) Residential HVAC Programs National Summary Available at: http://www.cee1.org/resid/rs‐ac/rs‐ac‐main.php3. A Best Practices Guide for Energy Efficiency in Municipally‐Owned Services Areas 295 | P a g e 52. Utility Motivation and Energy Efficiency Working Group of the State and Local Energy Efficiency Action Network (2011) Analyzing and Managing Bill Impacts of Energy Efficiency Programs: Principles and Recommendations. Available at: http://www1.eere.energy.gov/seeaction/pdfs/utility_motivation_billimpacts.pdf. 53. William Prindle (2010) From Shop Floor to Top Floor: Best Business Practices in Energy Efficiency. Available at: http://www.pewclimate.org/energy efficiency/corporate‐energy efficiency‐report. 54. Energy Efficiency and Renewable Resource ProgramActivities in Wisconsin Available at: http://psc.wi.gov/reports/documents/18%20Mo%20FOE%20Rpt%20090910.pdf. 55. 2009 Efficiency Vermont annual report Available at: http://www.efficiencyvermont.com/stella/filelib/FINAL2009AnnualReport.pdf. 56. Recovery.gov ‐ Tracking the Money Available at: http://www.recovery.gov/Pages/default.aspx. 57. US Department of Energy ‐ Energy Efficiency and Renewable Energy (EERE) Available at: http://www.eere.energy.gov/. 58. Texas State Energy Conservation Office Available at: http://seco.cpa.state.tx.us/. 59. Aspen Municipal Utility Available at: http://www.aspenpitkin.com/Living‐in‐the‐ Valley/Green‐Initiatives/Energy‐Efficiency/Rebates‐and‐Incentives/. 60. Colorado Springs Utilities Available at: http://www.csu.org/business/rebates/lighting/item6505.html. 61. Fort Collins Utilities Available at: http://www.fcgov.com/utilities/community‐ events/adults/business‐environmental‐program‐series. 62. Pacific Gas and Electric Available at: http://www.pge.com/mybusiness/energysavingsrebates/rebatesincentives/ief/. 63. Southern California Edison Available at: http://www.sce.com/business/energy‐ solutions/continous‐energy‐improvement.html. 64. Fort Morgan Electric Light&Gas Department Available at: http://www.cityoffortmorgan.com/index.aspx?NID=550. 65. Longmont Power & Communication Available at: http://www.ci.longmont.co.us/lpc/res/mg_res_index.htm. 66. JEA Available at: www.jea.com/investsmart. 67. Santee Cooper Available at: www.reducetheuse.com. A Best Practices Guide for Energy Efficiency in Municipally‐Owned Services Areas 296 | P a g e 68. Tennessee Valley Authority Available at: http://www.energyright.com/commercial/index.htm. 69. Nevada Energy Available at: http://www.nvenergy.com/saveenergy/home/rebates/checkme/contractors.cfm. A Best Practices Guide for Energy Efficiency in Municipally‐Owned Services Areas 297 | P a g e Appendix F. Acronyms A/C air conditioner ACEEE American Council for an Energy Efficient Economy AE Austin Energy AIA American Institute of Architects AMI advance metering infrastructure AMP Assisted Multifamily Building Program APPA American Public Power Association APS Arizona Public Service ARRA American Recovery and Reinvestment Act ASHRAE American Society of Heating, Refrigerating and Air Conditioning Engineers BOC Building Operator Certification BPA Bonneville Power Administration BPI Building Performance Institute BPUB Brownsville Public Utilities Board BTU Bryan Texas Utilities C&I Commercial and Industrial CDFI community development financial institutions CEA Clean Energy Ambassadors CEE Consortium for Energy Efficiency CFL compact fluorescent lamp CHP combined heat and power COP coefficient of performance CPEP Chemical Products Efficiency Program DLC direct load control DOE Department of Energy DOE‐ITP Department of Energy – Industrial Technologies Program DR demand response DSM demand‐side management DX direct expansion ECSC Electric Cooperatives of South Carolina EE Energy Efficiency EECBG Energy Efficiency and Conservation Block Grant A Best Practices Guide for Energy Efficiency in Municipally‐Owned Services Areas 298 | P a g e EEPR Energy Efficiency Plan and Report EER energy efficiency ratio EERE Office of Energy Efficiency and Renewable Energy EERS Energy Efficiency Resource Standards EESP energy efficiency service provider EFLH equivalent full load hours EIA US Energy Information Administration EISA Energy Independence and Securities Act EM&V evaluation, measurement, and verification EPA Environment Protection Agency ERCOT Electric Reliability Council of Texas ESCO energy service companies ESNH ENERGY STAR® New Homes EUL energy use intensity EUMMOT Electric Utility Marketing Managers of Texas FAQs frequently asked questions FELPS Floresville Electric Light and Power System FERC Federal Energy Regulatory Commission FTE full‐time employee FY fiscal year GEO Governor’s Energy Office GHG greenhouse gas GPS global positioning system GUS Georgetown Utility System GVEA Golden Valley Electric Association GWh gigawatt hours HB House Bill HEAP Home Energy Assistance Program HEC in‐Home Energy Consultation HERS Home Energy Rating System Hp horsepower HPwES Home Performance with ENERGY STAR® HTR hard‐to‐reach A Best Practices Guide for Energy Efficiency in Municipally‐Owned Services Areas 299 | P a g e HVAC heating, ventilation, and air conditioning ICC International Codes Council ICLEI Local Governments for Sustainability IDR Internal Data Records IECC International Energy Conservation Code IHDS in‐home displays IOU investor‐owned utility IPMVP International Performance Measurement and Verification Protocol IT information technology ITP Industrial Technologies Program kW kilowatt kW/ton kilowatts per ton LCR load control receiver LED light emitting diode LIPA Long Island Power Authority LIWAP Low Income Weatherization Assistance Program LPD Lighting Power Density M&V Measurement and verification MEAN Municipal Energy Agency of Nebraska MEERP Multifamily Energy Efficiency Rebate Program MichCon Michigan Consolidated Gas Co. MOU municipally‐owned utility MPCA Minnesota Pollution Control Agency MTP Market Transformation Program MW megawatt MWh megawatt hours N/A not applicable NAICS North American Industry Classification System NBI New Buildings Institute NBU New Braunfels Utilities NEEA Northwest Energy Efficiency Alliance NERC North American Electric Reliability Corporation NJBPU New Jersey Board of Public Utilities A Best Practices Guide for Energy Efficiency in Municipally‐Owned Services Areas 300 | P a g e NOx nitrogen oxide NPV net present value NYSERDA New York State Energy Research and Development Authority O&M operation and maintenance OBF on‐bill financing PCT participant cost test or programmable communicating thermostat PECI Portland Energy Conservation, Inc PG&E Pacific Gas and Electric PM Portfolio Manager POP point‐of‐purchase PRPA Platte River Power Authority PTE part‐time employee PUCT Public Utility Commission of Texas PV photovoltaic QA/QC quality assurance/quality control QECB qualified energy conservation bonds QZAB qualified zone academy bond R&D research and development RCx retro‐commissioning RDEE Rapid Deployment Energy Efficiency REDLG Rural Economic Development Loan and Grant REEP Refinance Energy Efficiency Program REP retail electricity provider RES residential RESNET Residential Energy Services Network RETAP Retiree Environmental Technical Assistance Program RFP request for proposal RIM ratepayer impact measure ROI return on investment SAE Statistically Adjusted Engineering SAVE System Adjustment and Verified Efficiency SB Senate Bill SBC system benefits charge A Best Practices Guide for Energy Efficiency in Municipally‐Owned Services Areas 301 | P a g e SCORE School/University Programs SCT Social Cost Test SECO State Energy Conservation Office SEER seasonal energy efficiency ratio SEP State Energy Program SIC Standard Industrial Classification SOP Standard Offer Program SRP Salt River Project STEP Save for Tomorrow Energy Plan SWEPCO Southwestern Electric Power Co. TPA Technical Assistance Plan TATI Technical Assistance and Technology Incentives TDHCA Texas Department of Housing and Community Affairs TECA Training, Education, Certification, and Awareness TOU time‐of‐use TPPA Texas Public Power Association TRC total resource cost UCT utility cost test USDA United States Department of Agriculture VCU Velocity Credit Union VFD variable frequency drive WAP Weatherization Assistance Program YES Your Energy Savings A Best Practices Guide for Energy Efficiency in Municipally‐Owned Services Areas 302 | P a g e


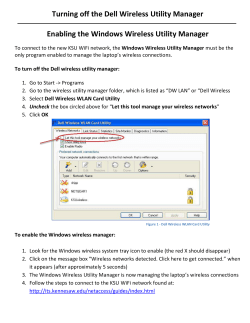

© Copyright 2026