
Regulatory Impact Assessment 12 SPI Committee Projects Workshop Romanian Banking Association
C o n ver g en c e Ro ma n ia F in a n c ia l Sec t or M o der n iza t ion
Spec ial Pr o j ec t s Init iat ive Publ ic -Pr ivat e St eer ing C o mmit t ee
Regulatory Impact Assessment
12 SPI Committee Projects
Mr. Riccardo Brogi - Convergence Program
[email protected]
Workshop
Romanian Banking Association
Bucharest 15-16 January, 2007
About the Workshop…
Object:
To review the preliminary Regulatory Impact
Assessment (RIA) on 12 Romania SPI projects.
Methodology:
To go through RIA techniques applied to project by
project in an interactive way with Project Working
Group (PWG) members.
•To develop awareness among “SPI Projects
Community” about the economic relevance of each
project;
Aim:
•To improve understanding
estimates and rationale;
of
preliminary
RIA
• To help PWG members use RIA tool to assess
regulatory options discussed within Working Groups.
2
RIA session: program
January 15th:
9.40 – 9.50:
9.50 – 11.00:
An introduction to RIA and how banking industry is
affected by regulation
First group of projects
Rural lending, IFRS, Rating agencies, Ombudsman.
11.15 – 12.15: Second group of projects
Law on safety, Stress testing, Bank guarantees.
January 16th:
9.40 – 9.50:
9.50 – 11.00:
An introduction to RIA and how banking industry is
affected by regulation
Third group of projects
Credit Bureau, Debit Instruments, AML, Databases.
11.15 – 12.15: Fourth group of projects
Rural lending, IFRS, Rating agencies, Law on safety.
3
Invited Participants (1)
SPI Projects Community
BANK
Alphabank
Banca Anglo Romana
Bancpost
BCR
BRD-GSG
PWG Members
- Ms. Monica Iovu
- Mr. Tudor Taslaoanu
- Ms. Cornelia Dimistrescu
- Ms. Beatrice Popescu
- Mr. G. Carabasan
- Mr. Traian Vasilescu
- Mr. Ionel Arghiroiu
- Ms. Marilena Popovici
- Ms. Daniela Barbu
- Ms. Liana Teodorescu
- Ms. Adina Bulgaru
- Mr. Mihai Stoica
- Ms. Luminita Cioaca
- Mr. Doru Bulata
- Mr. Arion Negrila
- Mr. Dragos Stoian
- Mr. Constantin Rotaru
- Ms. Dana Zachi
- Mr. A. Zaharescu
- Mr. Alexandru Berea
- Mr. Marian Georgescu
- Ms. Ramona Ivan
- Ms. Dana Stroescu
- Ms. Ileana Velicu
- Ms. Maria Sheikh-Ahmad
- Mr. Constantin Jumuga
- Mr. Alin Lupea
- Mr. Gelu Ghergescu
BANK
CEC
Finansbank
HVB Tiriac Bank
Mindbank
OTP Bank
Raiffeisen Banca pt.
Locuinte
RIB
RZB Romania
Unicredit Romania
Total
PWG Members
- Mr. Viorel Hodoiu
- Mr. Iulius Mironescu
- Ms. Magda Calangiu
- Mr. Iulian Zaharia
- Mr. Mihai Pitica
- Mr. Dragos Cabat
- Ms. Victoria Preoteasa
- Ms. Ana Costea
- Ms. Cristina Pieleanu
- Ms. Bogdana Grigoroiu
- Mr. Horatius Schiopu
- Mr. Jianu Lazar
- Ms. Lucia Stefan
- Ms. Adriana Blogu
- Ms. Margareta Puschiaza
- Ms. Eugen Bezdedeanu
- Mr. Sergiu Bogea
- Ms. Madalina Cristea
- Mr. Nicolae Craciun
- Ms. Daniela Copoiu
48
4
Invited Participants (2)
SPI Projects Community
OTHER STAKEHOLDERS
AML Office
Credit Bureau
FGCR
Ministry of Agriculture
MPF
NBR
NACP
Transfond
Total
PWG Members
- Ms. Paula Lavric
- Mr. Serban Epure
- Mr. Doru Calitoiu.
- Ms. Ileana Bratu
- Mr. Aurica Stoica
- Ms. Simona Butoi
- Ms. Victoria Mandru
- Ms. Monica Bizon
- Ms. Gheorghita Toma
- Mr. Cezar Luca
- Ms. Magda Scrieciu
- Ms. Irina Zamfirescu
- Mr. Florian Neagu
- Mr. Alis Avramescu
- Mr. Ianfred Silberstein
- Ms Isabelle Chelariu
- Ms. Dina Ilie
- Ms. Raluca Cristofor
- Mr. Goerge Popescu
- Ms. Angela Margarit
- Mr. Traian Pometcu
- Mr. Bogdan Moinescu
- Mr. Romulus Mircea
- Ms. Ruxandra Avram
- Mr. Mihail Meiu
- Ms. Mirela Palade
26
5
Agenda
I.
II.
What Regulatory Impact Assessment is;
Preliminary RIA on SPI projects;
¾
¾
¾
¾
¾
¾
¾
Expansion of Credit Bureau Services;
Debit Instruments Clearing and Settlement;
Anti Money Laundering Law (AML);
Rural lending;
Law on Bank Guarantees;
Loan Loss Provisioning in View of IFRS Application;
Mortgage Loans Database;
¾
LGD Database;
¾
Rating agencies;
¾
Stress testing;
¾
Law on safety;
¾
Ombudsman.
III. Concluding remarks.
6
I. What Regulatory Impact Assessment is
7
«It is an analysis of the likely impacts of a policy change and the range of
options for implementing it»
The Better Regulation Executive
(www.cabinetoffice.gov.uk/regulation/ria/)
«Impact assessment is an aid to decision-making, not a substitute for it»
European Commission
(Impact Assessment Guidelines)
Impact assessment allows to:
9 Ascertain of whether or not the new regulation would have the desired
impact;
9 Identify any possible side effects or hidden costs associated with regulation;
9 Quantify the likely costs of compliance on individuals and enterprises.
8
Type of Regulatory Optimization
Industry
competitiveness
Prudential Supervision
Banking compliance with National
Central Bank (included
transparency, accounting &
Banking and
reporting)
financial
Regulation-related risk management
regulation
activities and databases
Balance sheet, accounting principles
and international accounting
Safety net
Civil, penal and administrative
Rule of law and
regulation affacting bamking activity
contract
Corporate law
enforcement
Insolvency law and foreclosures
Banks and financial intermediaries
Financial activities/banking products
Taxation
Labor/borrowed money/equity
Source/harmonization
Auditing and tax collection
Unemployment Fund and other
Collective labor contract
Labor Market
Any other further integrating labor
Regulation on labor
Strategic objective
Strategic areas
Value creation drivers
Business
development
Payment systems
Public/private credit registries
Financial market Primary/Secondary Markets
infrastructure
Trading and post-trading services
Investment banking
Stock Exchange
Corporate lending
Retail lending
Financial
Other lending
products/services Payment products/services
Asset management
Investment banking
Market confidence (negative externality, market power)
Consumer protection (information asimmetry, market
Industry reputation
power)
Public awareness (positive externality)
9
Balance Sheet and Income Statement items affected
INCOME STATEMENT
BALANCE SHEET
Assets
Customer Loans
Other Loans
Total Customer Loans
Problem Loans - memo
Other non-performing Loans
Total Problem Loans
Total Loans - Net
Other Earning Assets
Due from Other Banks
Other Securities
Investment Securities
Trading Securities
Total Securities
Equity Investments
Other Investments
Total Other Earning Assets
Non-Earning Assets
Cash and Due from Banks
Intangible Assets
Other Non Earning Assets
Total Non Earning Assets
Fixed Assets
Total Fixed Assets
Liabilities
Deposits
Customer Deposits
Banks Deposits
Total Deposits
Money Market Funding
Other Negotiable Instruments
Total Money Market Funding
Other Funding
Other Bonds
Subordinated Debt
Other Funding
Total Other Funding
Loan Loss and Other Reserves
Other Non Equity Reserves
Total Loan Loss & Other Reserves
Other Liabilities
Other Liabilities
Total Liabilities
Equity Reserves
Retained Earnings
Other Equity Reserves
Minority Interests
Total Equity Reserves
Interest Income
Interest Expense
Net Interest Revenue
Commision Income
Commision Expense
Net Commission Revenue
Net Trading Income
Other Operating Income
Total Operating Income
Personnel Expenses
Other Admin Expenses
Other Operating Expenses
Loan Loss Provisions
Other Provisions
Total Operating Expense
Non-Operating Income
Pre-Tax Profit
Taxes
Post Tax Profit
Focus:
Capital
Tier 1 Capital Ratio
Total Capital Ratio
10
II. Preliminary RIA on SPI projects
11
Expansion of Credit Bureau Services
Context
At present, 27 banks share negative information (accounting for 96 percent of the retail
market) of which 7 banks (accounting for 26 percent of the market) also share positive
information.
Sharing positive information can result in an increase of the banks’ loan portfolios (by
enlarging their customer base and by lowering risk margins based on good credit histories).
Positive information sharing may also reduce the risk of over-commitment by performing
borrowers.
12
Expansion of Credit Bureau Services
Industry
competitiveness
Prudential Supervision
Banking compliance with National
Central Bank (included
transparency, accounting &
Banking and
reporting)
financial
Regulation-related risk management
regulation
activities and databases
Balance sheet, accounting principles
and international accounting
Safety net
Civil, penal and administrative
Rule of law and
regulation affacting bamking activity
contract
Corporate law
enforcement
Insolvency law and foreclosures
Banks and financial intermediaries
Financial activities/banking products
Taxation
Labor/borrowed money/equity
Source/harmonization
Auditing and tax collection
Unemployment Fund and other
Collective labor contract
Labor Market
Any other further integrating labor
Regulation on labor
Type of Regulatory Optimization
Payment systems
Public/private credit registries
Primary/Secondary Markets
Financial market
infrastructure
Trading and post-trading services
Business
development
Market confidence (negative externality, market power)
Consumer protection (information asimmetry, market
Industry reputation
power)
Public awareness (positive externality)
Investment banking
Stock Exchange
Corporate lending
Retail lending
Financial
Other lending
products/services Payment products/services
Asset management
Investment banking
13
Expansion of Credit Bureau Services
Regulatory solutions have a concrete impact
Main Balance Sheet and Income
Statement items affected
Main policy choices
• “Wide positive information
sharing”;
• “Length of information retention”;
• “Borrower consent”;
• ??
Each item
impacting
on …
•??
•??
………………
………………
14
Expansion of Credit Bureau Services
Balance Sheet and Income Statement items affected
BALANCE SHEET
Assets
Customer Loans
Other Loans
Total Customer Loans
Problem Loans - memo
Other non-performing Loans
Total Problem Loans
Total Loans - Net
Other Earning Assets
Due from Other Banks
Other Securities
Investment Securities
Trading Securities
Total Securities
Equity Investments
Other Investments
Total Other Earning Assets
Non-Earning Assets
Cash and Due from Banks
Intangible Assets
Other Non Earning Assets
Total Non Earning Assets
Fixed Assets
Total Fixed Assets
INCOME STATEMENT
Liabilities
Deposits
Customer Deposits
Banks Deposits
Total Deposits
Money Market Funding
Other Negotiable Instruments
Total Money Market Funding
Other Funding
Other Bonds
Subordinated Debt
Other Funding
Total Other Funding
Loan Loss and Other Reserves
Other Non Equity Reserves
Total Loan Loss & Other Reserves
Other Liabilities
Other Liabilities
Interest Income
Interest Expense
Net Interest Revenue
Commision Income
Commision Expense
Net Commission Revenue
Net Trading Income
Other Operating Income
Total Operating Income
Personnel Expenses
Other Admin Expenses
Other Operating Expenses
Loan Loss Provisions
Other Provisions
Total Operating Expense
Non-Operating Income
Pre-Tax Profit
Taxes
Post Tax Profit
Total Liabilities
Equity Reserves
Retained Earnings
Other Equity Reserves
Minority Interests
Total Equity Reserves
Focus:
Capital
Tier 1 Capital Ratio
Total Capital Ratio
15
Expansion of Credit Bureau Services
Regulatory solutions have a concrete impact
Main Balance Sheet and Income
Statement items affected
Main policy choices
• “Wide positive information
sharing”;
• “Length of information retention”;
• “Borrower consent”;
………………
• Loan volume;
Each item
impacting
on …
• Interest income;
• Non-performing loans;
• Loan Loss Provisions;
………………
16
Expansion of Credit Bureau Services
Average annual credit flow to households
a)
(2004-2005, Mln RON)
Baseline: estimated default rate (%):
b)
Baseline: loan approval rate (%)
c)
Scenario: estimated default rate (%):
d)
Scenario: loan approval rate (%)
e)
Additional new loans (Mln, RON) f)=((a*e)/c)-a
Net interest margin (%)
g)
Gross financial margin (Mln RON)
h)=f*g
Additional Loan Loss Provisions (LLP)
i)=d*f
(Mln, RON)
Net financial margin
j)=h-i
Lower LLP on overall flow (Mln, RON) k)=(a*(d-b))
Overall annual benefits (Mln, RON)
l)=j-k
7,546
Analytics - 1
2.78%
40%
1.84%
42.5%
471.6
6.6%
31
8.7
22.4
-71
93.4
Average annual credit flow to households (20041)
2005, Mln RON)
Growth rate
2)
Loan approval rate
3)
Additional new loans (Mln, RON) 4)=(1*(3/c))-1
Net interest margin (%)
5)
Net interest margin (Mln RON)
6)=4*5
Additional Loan Loss Provisions (LLP) (Mln, RON)
7)=d*3
Net financial margin
8)=5-6
Lower LLP on overall flow (Mln, RON) 9=(1*(d-b))
Overall annual benefits (Mln, RON)
10)=7-8
PV - Overall benefits (Mln, RON)
11)
2007
2008
2009
2010
2011
8,678
9,980
11,477
13,198
15,178
15%
42.5%
542
6.6%
36
10
26
-82
107
100.3
15%
45%
1,247
6.6%
82
23
59
-94
153
133.5
15%
48%
2,295
6.0%
138
42
95
-108
203
165.5
15%
54%
4,619
6.0%
277
85
192
-124
316
240.3
15%
60%
7,589
5.5%
417
140
278
-143
420
298.4
Discount rate (%)
7.10%
Discount factor 0.93370682 0.871808 0.814013
938.1
0.76005 0.709664
17
Expansion of Credit Bureau Services
Analytics - 2
Data and assumptions:
a) Baseline: negative info sharing prevailing
b) Baseline default rate (*):
2.78%
c) Baseline loan approval rate(*):
40%
d) Households credit flow considered for assessment: average 2004-2005 (Bln, RON) (**):
e) Scenario (Lower risk, More loans) (*)
- default rate:
1.84%
- approval rate:
60%
year
2007
2009
2011
2008
2010
42.5%
45%
48%
54%
60%
f) Net interest margin(***): 6.6%
g) Growth rate of credit flow to households:
7.5
15%
(*)= drawn from A. Powell, N. Mylenko, M. Miller, G. Majnoni, Improving Credit Information, Bank
Regulation and Supervision: on the Role and Design of Public Credit Registries , World Bank Policy
(**)=data drawn from IMF, Romania: Selected issues and Statistical Appendix, May 2006.
(***)= NBR, NBR, Monthly Bulletin-Statistical Section, 9/2006, p. 19
18
Expansion of Credit Bureau Services
Economic impact assessment - 1
A
Average annual credit flow to households
(2004-2005, Mln RON)
7,546
B
Baseline: estimated default rate (%)
C
Baseline: loan approval rate (%)
40%
D
Scenario: estimated default rate (%):
1.84%
E
Scenario: loan approval rate (%)
42.5%
F
Additional new loans (Mln, RON) [((A*E)/C) - A]
471.6
G
Net interest margin (%)
6.6%
2.78%
19
Expansion of Credit Bureau Services
Economic impact assessment - 2
H
I
Gross financial margin (Mln, RON) [F*G]
Additional Loan Loss Provisions (LLP) (Mln, RON)
[D*F]
31
8.7
J
Net financial margin (Mln, RON) [H-I]
22.4
K
Lower LLP on overall flow (Mln, RON) [A*(D-B)]
(71)
L
Overall benefits
1Y horizon: Overall benefits (Mln, RON) [J-K]
5Y horizon: Present value - Overall benefits
(Mln, RON)
93
938
20
lso
a
ta
sed
Ba RB da
on
Debit Instruments Clearing and Settlement
Context
Currently, checks and other debit instruments are processed manually, while all the credit
payment instruments are electronically processed. Many in the banking industry feel that a
permanent solution has to be found.
NBR is currently working on two parallel initiatives:
a) an interim solution (referring to the RBA proposed interim solution);
b) a permanent solution – the amendment of the relevant laws in order to allow the electronic
processing of debit instruments.
21
lso
a
ta
sed
Ba RB da
on
Industry
competitiveness
Debit Instruments Clearing and Settlement
Prudential Supervision
Banking compliance with National
Central Bank (included
transparency, accounting &
reporting)
Banking and
Regulation-related risk
financial regulation management activities and
databases
Balance sheet, accounting
principles and international
accounting standard - IAS
Safety net
Civil, penal and administrative
Rule of law and regulation affacting bamking
contract
activity
enforcement
Corporate law
Insolvency law and foreclosures
Banks and financial intermediaries
Financial activities/banking
products and services
Taxation
Labor/borrowed money/equity
Source/harmonization
Auditing and tax collection
Unemployment Fund and other
social contributions
Collective labor contract
Labor Market
Any other further integrating labor
arrangement
Regulation on labor
Type of Regulatory Optimization
Business
development
Payment systems
Public/private credit registries
Financial market Primary/Secondary Markets
infrastructure
Trading and post-trading services
Investment banking
Stock Exchange
Corporate lending
Retail lending
Financial
Other lending
products/services Payment products/services
Asset management
Investment banking
Market confidence (negative externality, market power)
Consumer protection (information asimmetry, market
Industry reputation
power)
Public awareness (positive externality)
22
o
als a
d
t
se
Ba RB da
on
Debit Instruments Clearing and Settlement
Regulatory solutions have a concrete impact
Main Balance Sheet and Income
Statement items affected
Main policy choices
• “elimination of paper-based instruments, by
truncating DIs”
• “reduction of manual operations and
elimination of clearing paper documentation
through electronic submission of debit
payment instructions and DI images”
• “automatically generated reports”
• “shift from paper-based instruments
archiving to electronic archiving”
• “settlement risk mitigation by using a single
collateral scheme for all cleared debit
instruments”
• “better use of SENT system”
Each item
impacting
on…
• ??
• ??
• ??
………………
• “automated reporting to the Payments
Incident Office”
23
lso
Debit Instruments Clearing and Settlement
a
d ata
e
s
Ba RB d
Balance Sheet and Income Statement items affected
on
BALANCE SHEET
Assets
Customer Loans
Other Loans
Total Customer Loans
Problem Loans - memo
Other non-performing Loans
Total Problem Loans
Total Loans - Net
Other Earning Assets
Due from Other Banks
Other Securities
Investment Securities
Trading Securities
Total Securities
Equity Investments
Other Investments
Total Other Earning Assets
Non-Earning Assets
Cash and Due from Banks
Intangible Assets
Other Non Earning Assets
Total Non Earning Assets
Fixed Assets
Total Fixed Assets
INCOME STATEMENT
Liabilities
Deposits
Customer Deposits
Banks Deposits
Total Deposits
Money Market Funding
Other Negotiable Instruments
Total Money Market Funding
Other Funding
Other Bonds
Subordinated Debt
Other Funding
Total Other Funding
Loan Loss and Other Reserves
Other Non Equity Reserves
Total Loan Loss & Other Reserves
Interest Income
Interest Expense
Net Interest Revenue
Commision Income
Commision Expense
Net Commission Revenue
Net Trading Income
Other Operating Income
Total Operating Income
Personnel Expenses
Other Admin Expenses
Other Operating Expenses
Loan Loss Provisions
Other Provisions
Total Operating Expense
Non-Operating Income
Pre-Tax Profit
Taxes
Post Tax Profit
Other Liabilities
Other Liabilities
Total Liabilities
Equity Reserves
Retained Earnings
Other Equity Reserves
Minority Interests
Total Equity Reserves
Focus:
Capital
Tier 1 Capital Ratio
Total Capital Ratio
24
o
als a
d
t
se
Ba RB da
on
Debit Instruments Clearing and Settlement
Regulatory solutions have a concrete impact
Main Balance Sheet and Income
Statement items affected
Main policy choices
• “elimination of paper-based instruments, by
truncating DIs”
• “reduction of manual operations and
elimination of clearing paper documentation
through electronic submission of debit
payment instructions and DI images”
• “automatically generated reports”
• “shift from paper-based instruments
archiving to electronic archiving”
• “settlement risk mitigation by using a single
collateral scheme for all cleared debit
instruments”
• “better use of SENT system”
Each item
impacting
on…
• Commission expense (paid to
Transfond);
• Personnel costs;
• Administrative costs;
• One-off IT investments;
………………
• “automated reporting to the Payments
Incident Office”
25
Banking industry
Number of banks
Savings in staff/bank as a result of the electronic processing
Gross annual wage/bank employee (RON)
Number of paper-based transactions in 2005 (#)
Commissions charged by TransFond on each manually
processed transaction (RON)
Estimate of commissions charged by TransFond on each
electronically processed transaction (RON)
IT one-off investments per bank (RON)
Overall IT one-off investments borne by banks (Mln, RON)
Overall business-related staff savings (Mln, RON)
Overall savings from Transfond commissions (Mln, RON)
Overall net benefits (Mln, RON)
a)
b)
c)
d)
38
42
59,840
7,660,674
e)
2.2
f)
1
g)
h)=a*g
i)=a*b*c
j)=(e-f)*d
l)=i+j-h
288,000
11
96
9
94
Transfond
Debit Instruments Clearing and Settlement
Transfond: Annual losses from paper-based business line
under current framework (Mln, RON)
m)
2
Transfond:T one-off investments (RON)
n)
0.70
Analytics - 1
Based also on RB
(Roland Berger) data
2007
2008
2009
2010
2011
5 years
PV - Overall business-related staff savings (Mln,
Eur) (Mln, RON)(1)
Overall savings from Transfond commissions
(Mln, RON)
78.2
83.3
77.7
72.6
67.8
380
8.6
8.0
7.5
7.0
6.5
38
Transfon PV - Annual savings due to the shift from paper
d
based to electronic system (Mln, RON)(1)
1.21
1.74
1.63
1.52
1.42
7.5
Banking
industry
(1)=Net of IT one-off investments
Discount rate (%)
7.10%
Discount factor 0.933707 0.871808 0.814013
0.76005 0.709664
26
Debit Instruments Clearing and Settlement
Analytics - 2
Based also on RB
(Roland Berger) data
Data and assumptions:
a) Savings in staff/bank as a result of the electronic
processing (#) [Assuming that there 1 person in each of the
42 clearing units fully dedicated for this]
b) Annual wage/bank employee (Eur)
(RON)
42
17,000
59,840
Source: Roland Berger, The impact of external regulation on the Romanian banking system.
c) Number of paper-based transactions in 2005 (#) [Source:
TransFond . Available information provide this data only for 7,660,674
interbank transactions and not intrabank ones]
d) Commissions charged by TransFond on each manually
2.2
processed transaction (RON)
Source: Transfond
e) Commissions charged by TransFond on each electronically
processed transaction (RON)
f) Average IT investments needed by each bank to join the
new framework (RON):
g) Transfond: average annual losses from paper-based
business Line under current framework (Mln, RON)
Source: Transfond
h) IT one-off investments (EUR)
200,000
(RON)
704,000
1
288,000
2
27
Debit Instruments Clearing and Settlement
lso
a
ta
sed
Ba RB da
on
Economic impact assessment - 1
i – Banking industry
A
B
Number of banks
Savings in staff/bank as a result of the Electronic
processing (#)
C
Gross annual wage/bank employee (RON)
D
Number of paper-based transactions in 2005 (#)
E
F
Commissions charged by TransFond on each
manually processed transaction (RON)
Estimate of commissions charged by TransFond on
each electronically processed transaction (RON)
38
42
59,840
7,660,674
2.2
1
28
Debit Instruments Clearing and Settlement
lso
a
ta
sed
Ba RB da
on
Economic impact assessment - 2
i – Banking industry
G
IT one-off investments per bank (RON)
H
Overall IT one-off investments borne by banks
(Mln, RON) [A*G]
I
Overall business-related staff savings
1-year horizon: (Mln, RON) (1)
5-year horizon: present value, (Mln, RON) (1)
J
288,000
11
85
380
Overall savings in TransFond commissions
1-year horizon: (Mln, RON)
5-year horizon: present value, (Mln, RON)
(1)= Net of IT one-off investments
9
38
29
o
als a
d
t
se
Ba RB da
on
Debit Instruments Clearing and Settlement
Economic impact assessment - 3
i – Transfond
A
Average annual losses from paper-based business
Line under current framework (Mln, RON)
B
IT one-off investments (RON)
C
Overall savings net of IT investments
2
704,000
1-year horizon: (Mln, RON) (1)
1.3
5-year horizon: present value, (Mln, RON)
7.5
(1)= Net of IT one-off investments
30
ata
d
RB gy
n
d o odolo
e
s
Ba meth
&
Anti Money Laundering Law (AML)
Context
Bank anti-money laundering responsibilities are regulated by Law no. 656/2002. The law was
amended in 2005 (Law no. 230/2005), when RBA tried unsuccessfully to have some of
proposals incorporated.
Currently, local stakeholders have suggested law amendments, some of them aiming at to
improving the efficiency of the AML mechanism in harmonization with the provisions of the
EU Third Directive.
31
ata
d
RB gy
n
d o odolo
e
s
Ba meth
&
Industry
competitiveness
Anti Money Laundering Law (AML)
Prudential Supervision
Banking compliance with National
Central Bank (included
transparency, accounting &
reporting)
Banking and
Regulation-related risk
financial regulation management activities and
databases
Balance sheet, accounting
principles and international
accounting standard - IAS
Safety net
Civil, penal and administrative
Rule of law and regulation affacting bamking
contract
activity
enforcement
Corporate law
Insolvency law and foreclosures
Banks and financial intermediaries
Financial activities/banking
products and services
Taxation
Labor/borrowed money/equity
Source/harmonization
Auditing and tax collection
Unemployment Fund and other
social contributions
Collective labor contract
Labor Market
Any other further integrating labor
arrangement
Regulation on labor
Type of Regulatory Optimization
Business
development
Payment systems
Public/private credit registries
Financial market Primary/Secondary Markets
infrastructure
Trading and post-trading services
Investment banking
Stock Exchange
Corporate lending
Retail lending
Financial
Other lending
products/services Payment products/services
Asset management
Investment banking
Market confidence (negative externality, market power)
Consumer protection (information asimmetry, market
Industry reputation
power)
Public awareness (positive externality)
32
ata
d
RB gy
n
d o odolo
e
s
Ba meth
&
Anti Money Laundering Law (AML)
Regulatory solutions have a concrete impact
Main Balance Sheet and Income
Statement items affected
Main policy choices
• “Reduced suspension period”
• “Decreased reporting frequency to
AML Office from daily to bi-monthly”
• “Increased threshold for reporting to
AML Office”
• “Exclusion of cash transactions
between banks and between banks
and NBR& Treasury from reporting”
• “Introducing the possibility that the
compliance officer analyzes the STRs
and sends to AML Office only the
cases of reasonable suspicion”
• ??
Each item
impacting
on…
• ??
• ??
………………
• “AML Office will provide bi-annual
feedback on the results of STRs”
33
ata
d
Anti Money Laundering Law (AML)
RB gy
n
o
o
l
sed thodo
a
B me Balance Sheet and Income Statement items affected
&
BALANCE SHEET
Assets
Customer Loans
Other Loans
Total Customer Loans
Problem Loans - memo
Other non-performing Loans
Total Problem Loans
Total Loans - Net
Other Earning Assets
Due from Other Banks
Other Securities
Investment Securities
Trading Securities
Total Securities
Equity Investments
Other Investments
Total Other Earning Assets
Non-Earning Assets
Cash and Due from Banks
Intangible Assets
Other Non Earning Assets
Total Non Earning Assets
Fixed Assets
Total Fixed Assets
INCOME STATEMENT
Liabilities
Deposits
Customer Deposits
Banks Deposits
Total Deposits
Money Market Funding
Other Negotiable Instruments
Total Money Market Funding
Other Funding
Other Bonds
Subordinated Debt
Other Funding
Total Other Funding
Loan Loss and Other Reserves
Other Non Equity Reserves
Total Loan Loss & Other Reserves
Interest Income
Interest Expense
Net Interest Revenue
Commision Income
Commision Expense
Net Commission Revenue
Net Trading Income
Other Operating Income
Total Operating Income
Personnel Expenses
Other Admin Expenses
Other Operating Expenses
Loan Loss Provisions
Other Provisions
Total Operating Expense
Non-Operating Income
Pre-Tax Profit
Taxes
Post Tax Profit
Other Liabilities
Other Liabilities
Total Liabilities
Equity Reserves
Retained Earnings
Other Equity Reserves
Minority Interests
Total Equity Reserves
Focus:
Capital
Tier 1 Capital Ratio
Total Capital Ratio
34
ata
d
RB gy
n
d o odolo
e
s
Ba meth
&
Anti Money Laundering Law (AML)
Regulatory solutions have a concrete impact
Main Balance Sheet and Income
Statement items affected
Main policy choices
• “Reduced suspension period”
• “Decreased reporting frequency to
AML Office from daily to bi-monthly”
• “Increased threshold for reporting to
AML Office”
• “Exclusion of cash transactions
between banks and between banks
and NBR& Treasury from reporting”
• “Introducing the possibility that the
compliance officer analyzes the STRs
and sends to AML Office only the
cases of reasonable suspicion”
Each item
impacting
on…
• Personnel costs;
• Other administrative costs;
………………
• “AML Office will provide bi-annual
feedback on the results of STRs”
35
ata
d
RB gy
n
d o odolo
e
s
Ba meth
&
Anti Money Laundering Law (AML)
Analytics - 1
Number of banks
a)
Number of branches
b)
Annual AML-related costs borne by HQ under baseline
c)
(RON)
Average annual AML-realted costs borne by each
d)
branch under baseline (RON)
Savings (as FTE) in HQ under scenario (%) (*)
e)
Savings (as FTE) in each branch under scenario (%) (*)
f)
Average annual cost borne by each HQ under baseline
g)
(RON) (**)
Average annual cost borne by each branch under
h)
baseline (RON) (**)
i)
Savings (as FTE) in HQ under scenario (%) (**)
j)
% savings (as FTE) in each brach under scenario (**)
Overall annual savings for HQs (Mln, RON) k)=a*g*i
Overall annual savings for branches (Mln, RON) l)=b*h*j
Total annual savings (Mln, RON) m)=k+l
Present value (over 5 years) (Mln, RON)
n)
38
3,845
142,743
6,342
36%
59%
112,640
2,640
25%
40%
1.1
4.1
5.1
21
(*)=Source: Roland Berger Study. It makes reference to a bank with HQ and 307 branches
(**)= Convergence estimate
36
ata
d
RB gy
n
d o odolo
e
s
Ba meth
&
Anti Money Laundering Law (AML)
Analytics - 2
Data and assumptions:
a) Baseline:
Compliance for bank reporting takes place as follows:
i) on a daily basis
ii) cash transactions and external transfers
iii) over EUR 10,000
iv) reporting system consists in
56 columns for external transfers
35 columns for cash transactions
Source: Roland Berger, The impact of external regulation on the Romanian
banking system.
b) Scenario:
Compliance for bank reporting takes place as follows:
i) on a weekly basis
ii) over EUR 15,000
iv) reporting system consists in
20 columns for external transfers
15 columns for cash transactions
Source: Roland Berger, The impact of external regulation on the Romanian
banking system.
c1) Annual cost borne by HQ under baseline (Roland Berger sample)
EUR
40,552
RON
142,743
Source: Roland Berger, The impact of external regulation on the Romanian
banking system.
c2) Annual cost borne by HQ under baseline (all banks)
EUR
32,000
RON
112,640
d1) Average annual cost borne by each branch under baseline (RB sample)
EUR
1,802
RON
6,342
Source: Roland Berger, The impact of external regulation on the Romanian
banking system.
d2) Average annual cost borne by each branch under baseline (all banks)
EUR
750
RON
2,640
e) Savings gained by Roland Berger sample under scenario (%)
i) HQ:
36%
ii) Average of each territorial unit
59%
Source: Roland Berger, The impact of external regulation on the Romanian
banking system.
f) Savings gained by all banks under scenario (%)
i) HQ:
25%
ii) Average of each territorial unit
40%
37
ata
d
RB gy
n
d o odolo
e
s
Ba meth
&
Anti Money Laundering Law (AML)
Economic impact assessment - 1
A
Number of banks
B
Number of branches
C
D
E
F
AML-related annual costs borne by HQ under
baseline (RON)
Average AML-related annual costs borne by each
branch under baseline (RON)
Average savings in HQ under scenario (%)
Average savings in each branch under scenario
(%)
38
3,845
112,640
2,640
25%
40%
38
ata
d
RB gy
n
d o odolo
e
s
Ba meth
&
Anti Money Laundering Law (AML)
Economic impact assessment - 2
G
H
I
Overall annual savings for HQs (Mln, RON)
[A*C*E]
Overall annual savings for all territorial units
(Mln, RON) [B*D*F]
1.1
4.1
Overall annual savings for all banks (Mln, RON)
[G+H]
1-year horizon: (Mln, RON)
5.1
5-year horizon: present value, (Mln, RON)
21
39
Rural Lending
Context
In Romania, agricultural lending represents a modest share of total bank loans.
One of the drawbacks perceived by banks in rural financing is lack of clarity of the legislation
regulating the use of the ownership title (warrants-deposit certificates) for agricultural
products.
According to other countries’ experience, lending against warrants-deposit certificates on
cereals has the potential to increase commercial banks’ lending to agriculture, by reducing
the credit risk, lowering transaction costs, and improving loan recovery.
40
Rural Lending
Industry
competitiveness
Prudential Supervision
Banking compliance with National
Central Bank (included
transparency, accounting &
Banking and
reporting)
financial
Regulation-related risk management
regulation
activities and databases
Balance sheet, accounting principles
and international accounting
Safety net
Civil, penal and administrative
Rule of law and
regulation affacting bamking activity
contract
Corporate law
enforcement
Insolvency law and foreclosures
Banks and financial intermediaries
Financial activities/banking products
Taxation
Labor/borrowed money/equity
Source/harmonization
Auditing and tax collection
Unemployment Fund and other
Collective labor contract
Labor Market
Any other further integrating labor
Regulation on labor
Type of Regulatory Optimization
Payment systems
Public/private credit registries
Primary/Secondary Markets
Financial market
infrastructure
Trading and post-trading services
Business
development
Investment banking
Stock Exchange
Corporate lending
Retail lending
Financial
Other lending
products/services Payment products/services
Asset management
Investment banking
Market confidence (negative externality, market power)
Consumer protection (information asimmetry, market
Industry reputation
power)
Public awareness (positive externality)
41
Rural Lending
Regulatory solutions have a concrete impact
Main Balance Sheet and Income
Statement items affected
Main policy choices
• “Clarify the legal and institutional
framework about depositaries and
warrant issuance”
• “Establish the Deposit Certificates
Guarantee Fund (DCGF) as an
operational institution”
• “Make deposit certificates for crop
inventories (representing bearer
negotiable titles) as marketable as
possible”
Each item
impacting
on…
• ??
• ??
………………
…………………
42
Rural Lending
Balance Sheet and Income Statement items affected
BALANCE SHEET
Assets
Customer Loans
Other Loans
Total Customer Loans
Problem Loans - memo
Other non-performing Loans
Total Problem Loans
Total Loans - Net
Other Earning Assets
Due from Other Banks
Other Securities
Investment Securities
Trading Securities
Total Securities
Equity Investments
Other Investments
Total Other Earning Assets
Non-Earning Assets
Cash and Due from Banks
Intangible Assets
Other Non Earning Assets
Total Non Earning Assets
Fixed Assets
Total Fixed Assets
INCOME STATEMENT
Liabilities
Deposits
Customer Deposits
Banks Deposits
Total Deposits
Money Market Funding
Other Negotiable Instruments
Total Money Market Funding
Other Funding
Other Bonds
Subordinated Debt
Other Funding
Total Other Funding
Loan Loss and Other Reserves
Other Non Equity Reserves
Total Loan Loss & Other Reserves
Interest Income
Interest Expense
Net Interest Revenue
Commision Income
Commision Expense
Net Commission Revenue
Net Trading Income
Other Operating Income
Total Operating Income
Personnel Expenses
Other Admin Expenses
Other Operating Expenses
Loan Loss Provisions
Other Provisions
Total Operating Expense
Non-Operating Income
Pre-Tax Profit
Taxes
Post Tax Profit
Other Liabilities
Other Liabilities
Total Liabilities
Equity Reserves
Retained Earnings
Other Equity Reserves
Minority Interests
Total Equity Reserves
Focus:
Capital
Tier 1 Capital Ratio
Total Capital Ratio
43
Rural Lending
Regulatory solutions have a concrete impact
Main Balance Sheet and Income
Statement items affected
Main policy choices
• “Clarify the legal and institutional
framework about depositaries and
warrant issuance”
• “Establish the Deposit Certificates
Guarantee Fund (DCGF) as an
operational institution”
• “Make deposit certificates for crop
inventories (representing bearer
negotiable titles) as marketable as
possible”
Each item
impacting
on…
• New lending;
• Interest income;
………………
…………………
44
Rural Lending
Analytics - 1
Value of cereals that are warehoused in 1 year (*) (Mln, RON)
Average loan to value ratio (loans granted/value of deposit
certificates) (%)
Potential room for annual banking rural credit based on
deposit certificates (Mln, RON)
Interest rate charged on bank loans backed by deposit
certificates (%)
Interest rate charged on bank loans backed by deposit
certificates (Mln, RON)
Mark-up on bank loans (%)
Annual mark-up stemming from potential larger banking
rural credit (Mln, RON)
Potential room for annual banking rural credit based
on deposit certificates (Mln, RON)
Interest rate charged on bank loans backed by
deposit certificates (%)
Mark-up on bank loans (%)
PV - Potential rural banking lending (Mln, RON)
PV - Potential interest rate on rural lending (Mln, RON)
PV - Potential mark up from rural lending (Mln, RON)
a)
270
65%
b)
c )=a*b
175.5
d)
12.0%
e)=c*d
21.06
f)
3%
g)=e*f
5.3
2007
2008
2009
2010
2011
1)
176
176
176
176
176
2)
21
21
21
21
21
3)
3.0%
163.9
19.7
4.9
3.0%
153.0
18.4
4.6
3.0%
142.9
17.1
4.3
3.0%
133.4
16.0
4.0
3.0%
124.5
14.9
3.7
Discount rate (%)
7.10%
Discount factor 0.933707 0.871808 0.814013
717.7
86.1
21.5
5-years
0.76005 0.709664
45
Rural Lending
Analytics - 2
Data and assumptions:
a) Average length of bank loans backed by deposit certificates: 1 year
b) Lending rate:
12%
c) Mark up of a bank loan: 4%
d) Estimate of the value of crops stored every year:
i) Number of crop farms(
7,700
ii) Average size of a crop farm (hectares)(**)
270
iii) Value of agricoltural output per ha (Eur)(**) 248
iv) Percentage of the the total value stored (%) 20%
v) Total value of crops stored every year (Mln, EUR)
103
(Mln, EUR)
363
(Mln, RON)
270
Conservative assumption (Mln, RON)
e) Average loan to value ratio (loans granted/value of deposit
65%
certificates) (%)
f) All loans will be granted in RON
(*)= The World Bank, Financial Markets, credit constraints and investment in Rural
Romania , April 2001.
(**)=FAO-IBRD, Romania: bank lending to SMEs in rural area
46
Rural Lending
Economic impact assessment - 1
A
B
C
D
E
Value of crops stored every year (Mln, RON)
Average loan to value ratio (loans granted/value
of crops stored) (%)
270
65%
Annual potential room for banking rural credit
based on deposit certificates
1-year horizon: (Mln, RON)
175
5-year horizon: present value, (Mln, RON)
717
Interest rate on bank loans backed by deposit
certificates (%)
Mark-up on bank loans (%)
12%
3%
47
Rural Lending
Economic impact assessment - 2
F
G
Interest rate charged on bank loans backed by
deposit certificates
1-year horizon: (Mln, RON)
21
5-year horizon: present value (Mln, RON)
86
Mark-up on bank loans
1-year horizon: (Mln, RON)
5
5-year horizon: present value (Mln, RON)
21
48
Law on Bank Guarantees
Context
Bank guarantees play an important role in commercial contracts. In Romania, there is no
specific law on bank guarantees. The disparate and incomplete legal provisions that have
some relevance in addressing the issues pertaining to bank guarantees leave unclear
numerous aspects.
In issuing letters of guarantee, Romanian banks make reference either to the Romanian law
or to the regulations from the parent entity’s country. This practice may result in unfavourable
decisions to Romanian banks.
In order to help overcome the drawbacks in enforcing the bank guarantee contracts, an RBA
group has put together the principal terms of a proposed guarantees law.
49
Law on Bank Guarantees
Industry
competitiveness
Prudential Supervision
Banking compliance with National
Central Bank (included
transparency, accounting &
Banking and
reporting)
financial
Regulation-related risk management
regulation
activities and databases
Balance sheet, accounting principles
and international accounting
Safety net
Civil, penal and administrative
Rule of law and
regulation affacting bamking activity
contract
Corporate law
enforcement
Insolvency law and foreclosures
Banks and financial intermediaries
Financial activities/banking products
Taxation
Labor/borrowed money/equity
Source/harmonization
Auditing and tax collection
Unemployment Fund and other
Collective labor contract
Labor Market
Any other further integrating labor
Regulation on labor
Type of Regulatory Optimization
Payment systems
Public/private credit registries
Primary/Secondary Markets
Financial market
infrastructure
Trading and post-trading services
Business
development
Investment banking
Stock Exchange
Corporate lending
Retail lending
Financial
Other lending
products/services Payment products/services
Asset management
Investment banking
Market confidence (negative externality, market power)
Consumer protection (information asimmetry, market
Industry reputation
power)
Public awareness (positive externality)
50
Law on Bank Guarantees
Regulatory solutions have a concrete impact
Main Balance Sheet and Income
Statement items affected
Main policy choices
• “Linkage between the principal
obligation resulting from the commercial
contract and the obligation resulting from
the bank guarantee”
• “the extent to which the bank issuing the
guarantee is bounded to pay the
beneficiary based on his simple written
request”
• ??
Each item
impacting
on…
• ??
• ??
• “The extent to which the issuing bank
can invoke the exceptions stipulated in
the principal contract”
• “The extent to which the bank issuing
the guarantee has the right to revert
against the principal for recovering the
guarantee and any other costs paid and
not honored by the principal”
………………
51
Law on Bank Guarantees
Balance Sheet and Income Statement items affected
BALANCE SHEET
Assets
Customer Loans
Other Loans
Total Customer Loans
Problem Loans - memo
Other non-performing Loans
Total Problem Loans
Total Loans - Net
Other Earning Assets
Due from Other Banks
Other Securities
Investment Securities
Trading Securities
Total Securities
Equity Investments
Other Investments
Total Other Earning Assets
Non-Earning Assets
Cash and Due from Banks
Intangible Assets
Other Non Earning Assets
Total Non Earning Assets
Fixed Assets
Total Fixed Assets
INCOME STATEMENT
Liabilities
Deposits
Customer Deposits
Banks Deposits
Total Deposits
Money Market Funding
Other Negotiable Instruments
Total Money Market Funding
Other Funding
Other Bonds
Subordinated Debt
Other Funding
Total Other Funding
Loan Loss and Other Reserves
Other Non Equity Reserves
Total Loan Loss & Other Reserves
Interest Income
Interest Expense
Net Interest Revenue
Commision Income
Commision Expense
Net Commission Revenue
Net Trading Income
Other Operating Income
Total Operating Income
Personnel Expenses
Other Admin Expenses
Other Operating Expenses
Loan Loss Provisions
Other Provisions
Total Operating Expense
Non-Operating Income
Pre-Tax Profit
Taxes
Post Tax Profit
Other Liabilities
Other Liabilities
Total Liabilities
Equity Reserves
Retained Earnings
Other Equity Reserves
Minority Interests
Total Equity Reserves
Focus:
Capital
Tier 1 Capital Ratio
Total Capital Ratio
52
Law on Bank Guarantees
Regulatory solutions have a concrete impact
Main Balance Sheet and Income
Statement items affected
Main policy choices
• “Linkage between the principal
obligation resulting from the commercial
contract and the obligation resulting from
the bank guarantee”
• “the extent to which the bank issuing the
guarantee is bounded to pay the
beneficiary based on his simple written
request”
• Legal costs;
Each item
impacting
on…
• Losses due to operational risk;
• Commission Income;
• “The extent to which the issuing bank
can invoke the exceptions stipulated in
the principal contract”
• “The extent to which the bank issuing
the guarantee has the right to revert
against the principal for recovering the
guarantee and any other costs paid and
not honored by the principal”
………………
53
Law on Bank Guarantees
Analytics - 1
Commitments to a natural entity or non-bank, legal entity
(Mln, RON)
Incidence of bank letters of guarantee (%)
Exposure at the basis of bank letters of guarantees (Mln,
RON)
Domestic-regulated bank guarantees based on
Romanian law (%)
Amount of bank letters of guarantees regulated by the
Romanian law (Mln, RON)
Higher rate of litigation for domestic-based contracts vs
foreign-based ones
Higher annual amount of bank domestic-based bank
guarantees that go to legal disputes (Mln, RON)
Cost of enforcing contracts in Romania (% out of the
nominal value at stake)
a)
b)
c )=a*b
d)
e)=c*d
f)
g)=e*f
h)
Annual cost borne by banks due to drawbacks in Romania
framework in enforcing bank guarantees (Mln, RON)
i)=g*h
Potential annual increase in domestic-regulated bank
guarantees as a result of the regulatory improvement (%)
j)
Incremental annual volume (Mln, RON)
Average fee charged on letters of guarantee baseed on
domestic regulation (%)
Incremental annual commissions generated (Mln, RON)
k)
l)
m)=k*l
12,887
20%
2,577
20%
515
1.0%
5.2
10.7%
0.6
7%
36
1.2%
0.4
54
Law on Bank Guarantees
Analytics - 2
Annual cost borne by banks due to drawbacks in
i)
Romania framework in enforcing bank guarantees
Potential annual increase in domestic-regulated bank
ii)
guarantees as a result of the regulatory improvement (%)
Gross annual volume (Mln, RON) iii)=d*(1+ii)
Incremental annual volume (Mln, RON)
iv)=iii-d
Average fee charged on LGs baseed on domestic regulation (%)
v)
Incremental annual commissions generated (Mln, RON)
vi)-iv*v
PV - Annual cost borne by banks due to drawbacks in Romania
framework in enforcing bank guarantees (Mln, RON)
PV - Incremental annual commissions generated (Mln, RON)
2007
2008
2009
2010
2011
0.6
0.6
0.6
0.6
0.6
7%
7%
7%
7%
7%
552
36
1.2%
0.4
0.5
590
75
1.2%
0.9
0.5
631
116
1.2%
1.4
0.4
676
160
1.2%
1.9
0.4
723
208
1.2%
2.5
0.4
0.4
0.8
1.1
1.5
1.8
Discount rate (%)
7.10%
Discount factor 0.933707 0.871808 0.814013
2.3
5.5
5-years
0.76005 0.709664
55
Law on Bank Guarantees
Analytics - 3
Data and assumptions:
a) Share of LGs in total off-balance sheet exposure
20%
(Based on the evidence from Annual reports of a sample of Romanian Banks)
b) Guarantees tha make reference to Romanian law (%)
c) Higher rate of litigation for domestic-based contracts vs
foreign-based ones
d) Potential annual increase in domestic-regulated bank
guarantees as a result of the regulatory improvement (other
things being equal, e.g. foreign-regulated bank guarantees)
e) Average fee charged on letters of guarantee baseed on
domestic regulation (%)
20%
1%
7%
1.2%
(Based on the evidence from some Romanian Banks contracts)
56
Law on Bank Guarantees
Economic impact assessment - 1
A
B
C
D
E
F
Banks’ commitments to a natural entity or
non-bank, legal entity (Mln, RON) (*)
Share of bank letters of guarantee (%)
Exposure at the basis of bank letters of
guarantees (Mln, RON) [A*B]
Domestic-regulated bank guarantees (%)
Amount of bank letters of guarantees regulated
by the Romanian law (Mln, RON) [C*D]
Higher rate of litigation for domestic-regulated
contracts vs foreign-regulated ones (%)
(*)= Source: NBR, Monthly Bulletin - Statistical Section, 9/2006, p. 52
12,887
20%
2,577
20%
515
1%
57
Law on Bank Guarantees
Economic impact assessment - 2
Differential higher annual amount of bank
G
domestic-regulated bank guarantees that
9
go to legal disputes (Mln, RON) [E*F]
H
I
Cost of enforcing contracts in Romania
(% out of the nominal value at stake) (%) (*)
10.7%
Cost borne by banks due to drawbacks in
Romania framework in enforcing bank
Guarantees
1-year horizon: (Mln, RON) [A*B*df(1)]
0.6
5-year horizon: present value, (Mln, RON)
2.3
Potential annual increase in domestic-regulated
J
bank guarantees as a result of the regulatory
7%
improvement (%)
(*)= Source: The World Bank, Doing Business – Enforcing Contracts, www.doingbusiness.org
58
Law on Bank Guarantees
Economic impact assessment - 3
Incremental annual volume of domestic-
K
regulated bank guarantees (Mln, RON)
36
[E*(1+J)-E]
H
I
Average fee charged on letters of guarantee
based on domestic regulation (%)
1.2%
Incremental annual commissions generated
1-year horizon: (Mln, RON) [K*H]
0.4
5-year horizon: present value, (Mln, RON)
5.5
(*)= Source: The World Bank, Doing Business – Enforcing Contracts, www.doingbusiness.org
59
ata
d
RB gy Loan
n
d o odolo
e
s
Ba meth
&
Loss Provisioning in View of IFRS Application
Context
Currently, most of the Romanian banks calculate provisions both according to NBR
Regulation no. 5/2002 and to IFRS, for reporting to their mother entities.
The double calculation and reporting results in increased reporting and compliance costs and
the unclear fiscal treatment of the provisions calculated under IFRS determines a high level
of operational risk.
This duplication will continue after Basel II implementation and the tax problems will persist
unless the related regulations change in order to align economic, prudential, and tax
treatment of credit risk.
60
ata
d
RB gy Loan
n
d o odolo
e
s
Ba meth
&
Industry
competitiveness
Loss Provisioning in View of IFRS Application
Prudential Supervision
Banking compliance with National
Central Bank (included
transparency, accounting &
reporting)
Banking and
Regulation-related risk
financial regulation management activities and
databases
Balance sheet, accounting
principles and international
accounting standard - IAS
Safety net
Civil, penal and administrative
Rule of law and regulation affacting bamking
contract
activity
enforcement
Corporate law
Insolvency law and foreclosures
Banks and financial intermediaries
Financial activities/banking
products and services
Taxation
Labor/borrowed money/equity
Source/harmonization
Auditing and tax collection
Unemployment Fund and other
social contributions
Collective labor contract
Labor Market
Any other further integrating labor
arrangement
Regulation on labor
Type of Regulatory Optimization
Business
development
Payment systems
Public/private credit registries
Financial market Primary/Secondary Markets
infrastructure
Trading and post-trading services
Investment banking
Stock Exchange
Corporate lending
Retail lending
Financial
Other lending
products/services Payment products/services
Asset management
Investment banking
Market confidence (negative externality, market power)
Consumer protection (information asimmetry, market
Industry reputation
power)
Public awareness (positive externality)
61
ata
d
RB gy
n
d o odolo
e
s
Ba meth
&
Loan Loss Provisioning in View of IFRS Application
Regulatory solutions have a concrete impact
Main Balance Sheet and Income
Statement items affected
Main policy choices
• “Compliance and red tape can be
streamlined”
• “Provisions are calculated at
individual/ portfolio level”
• “Provisions are calculated for
exposures classified in X or Y
categories”
Each item
impacting
on…
• ??
• ??
• ??
………………
…………………
62
ata
d
RB gy Loan Loss Provisioning in View
n
d o odolo
e
s
Ba meth Balance Sheet and Income Statement
&
Problem Loans - memo
Other non-performing Loans
Total Problem Loans
Total Loans - Net
Other Earning Assets
Due from Other Banks
Other Securities
Investment Securities
Trading Securities
Total Securities
Equity Investments
Other Investments
Total Other Earning Assets
Non-Earning Assets
Cash and Due from Banks
Intangible Assets
Other Non Earning Assets
Total Non Earning Assets
Fixed Assets
Total Fixed Assets
items affected
INCOME STATEMENT
BALANCE SHEET
Assets
Customer Loans
Other Loans
Total Customer Loans
of IFRS Application
Liabilities
Deposits
Customer Deposits
Banks Deposits
Total Deposits
Money Market Funding
Other Negotiable Instruments
Total Money Market Funding
Other Funding
Other Bonds
Subordinated Debt
Other Funding
Total Other Funding
Loan Loss and Other Reserves
Other Non Equity Reserves
Total Loan Loss & Other Reserves
Interest Income
Interest Expense
Net Interest Revenue
Commision Income
Commision Expense
Net Commission Revenue
Net Trading Income
Other Operating Income
Total Operating Income
Personnel Expenses
Other Admin Expenses
Other Operating Expenses
Loan Loss Provisions
Other Provisions
Total Operating Expense
Non-Operating Income
Pre-Tax Profit
Taxes
Post Tax Profit
Other Liabilities
Other Liabilities
Total Liabilities
Equity Reserves
Retained Earnings
Other Equity Reserves
Minority Interests
Total Equity Reserves
Focus:
Capital
Tier 1 Capital Ratio
Total Capital Ratio
63
ata
d
RB gy
n
d o odolo
e
s
Ba meth
&
Loan Loss Provisioning in View of IFRS Application
Regulatory solutions have a concrete impact
Main Balance Sheet and Income
Statement items affected
Main policy choices
• “Compliance and red tape can be
streamlined”
• “Provisions are calculated at
individual/ portfolio level”
• “Provisions are calculated for
exposures classified in X or Y
categories”
Each item
impacting
on…
• Personnel costs;
• Loan Loss provisions;
• Tax;
………………
…………………
64
Loan Loss Provisioning in View of IFRS Application
Banks with majority foreign capial (#)
Net assets 2005 of an intermediate bank of Roland Berger
sample (Mln, RON)
Net assets in 2005 of banks with majority foreign capital
(RON, Mln)
Net assets of a Roland Berger benchmark bank vs Banks
with majority foreign capital (%)
a)
24
11,000
b)
Analytics - 1
70,092
c)
d)=b/c
Compliance perspective
FTE over a year needed by a bank to comply with RAS,
e)
under current framework
FTE over a year needed by a bank to comply with IFRS,
f)
under current framework
Average annual gross salary of a bank staff
g)
Factor of corretion to shift from 3-banks sample to all banks
h)
involved (%) (***)
FTE over a year needed by a bank to comply with RAS, i)=e+(e*h)
under current framework (# FTE)
FTE over a year needed by a bank to comply with IFRS, j)=f+(f*h)
under current framework (# FTE)
FTE over a year needed by a bank to comply with RAS and k)=i+j
IFRS, under current framework (# FTE)
Current regulation: overall annual costs borne by all
l)=a*g*k
international banks to comply with RAS and IFRS (Mln,
Reduction of overall FTE to comply with RAS and IFRS due
m)
to improvement of regulation
Scenario: overall annual costs saved by all international n)=l*m
banks to comply with RAS and IFRS (Mln, RON)
16%
Based on RB data
&methodology
6.3
1.4
59,840
-15%
5.4
1.2
6.5
Tax perspective
Average annual net provision expenses/bank under RAS
(Mln, RON)
Average annual net provision expenses/bank under IFRS
(Mln, RON)
Banking industry: overall annual net provision expenses
under RAS (Mln, RON)
Banking industry: overall annual net provision expenses
under IFRS (Mln, RON)
Annual accounting edge (Mln, RON)
o)
62.3
p)
68.6
q)=o/d
397.0
r)=p/d
437.4
s)=r-q
40.4
9.4
30%
2.82
PV - Scenario: overall annual costs saved by all
international banks to comply with RAS and IFRS
PV - Annual accounting edge (Mln, RON)
Discount rate (%)
Discount factor
2007
2008
2009
2010
2011
5 years
2.6
2.5
2.3
2.1
2.0
11.5
37.7
35.2
32.9
30.7
28.7
165.1
7.10%
0.93371
0.87181
0.81401
0.76005
0.70966
65
Loan Loss Provisioning in View of IFRS Application
Data and assumptions:
a) Banks with majority foreign capial (#)
Source: NBR, Annual Report 2005, p. 35
b) Net assets 2005 of an intermediate bank of Roland Berger
sample (Mln, RON)
24
11,000
(Based on Annual reports of the banks belonging to the Roland Berger sample)
70,092
c) Net assets in 2005 of banks with majority foreign capital (RON,
Mln)
Source: NBR, Annual Report 2005, p. 35
Compliance perspective
d) FTE over a year needed by a bank to comply with RAS, under
6.3
current framework
Source: Roland Berger Study. It makes reference to a bank with HQ and 307 branches
e) FTE over a year needed by a bank to comply with IFRS, under
1.4
current framework(*)
Source: Roland Berger Study. It makes reference to a bank with HQ and 307 branches
f) Average annual gross salary of a bank staff
Source: Roland Berger.
EUR 17,000
RON 59,840
g) Factor of corretion to shift from 3-banks sample to all banks
-15%
involved (%)
h) Reduction of overall FTE to comply with RAS and IFRS
due to improvement of regulation (%)
Analytics - 2
Based on RB data
&methodology
30%
Tax perspective
i) Average annual net provision expenses/bank under RAS
Source: Roland Berger Study. It makes reference to a bank with HQ and 307 branches
Mln, EUR
Mln, RON
j) Average annual net provision expenses/bank under IFRS
17.7
62.3
Source: Roland Berger Study. It makes reference to a bank with HQ and 307 branches
Mln, EUR
Mln, RON
19.5
68.6
66
ata
d
RB gy
n
d o odolo
e
s
Ba meth
&
Loan Loss Provisioning in View of IFRS Application
Economic impact assessment - 1
i – General section
A
B
C
D
Banks with majority foreign capital (#)
Net assets 2005 of an intermediate bank of
Roland Berger sample (RON, Mln)
Net assets in 2005 of banks with majority foreign
capital (RON, Mln) (**)
Weight of the average RB bank out of overall
bank affected (%) [B/C]
24
11,000
70,092
16%
67
ata
d
RB gy
n
d o odolo
e
s
Ba meth
&
Loan Loss Provisioning in View of IFRS Application
Economic impact assessment - 2
ii – Compliance section
Full time Equivalent needed over a year by
E
a RB-sample bank to comply with RAS, under
6.3
current framework(# FTE)
Full time Equivalent needed over a year by
F
a RB-sample bank to comply with IFRS, under
1.4
current Framework (# FTE) (*)
G
H
Average annual gross salary of a bank staff (RON)
Correction factor to shift from 3-bank sample to
all banks involved (%)
59,840
-15%
FTE needed over a year by each bank to comply
I
with RAS, under current framework (# FTE)
5.4
[E+(E*H)]
FTE needed over a year by each bank to comply
J
with IFRS, under current framework (# FTE)
1.2
[F+(F*H)]
68
ata
d
RB gy
n
d o odolo
e
s
Ba meth
&
Loan Loss Provisioning in View of IFRS Application
Economic impact assessment - 3
ii – Compliance section
FTE needed over a year by each bank to comply
K
with RAS and IFRS, under current framework
6.5
(# FTE) [I+J]
Current regulation: Overall annual costs borne by
L
all international banks to comply with RAS and
9.4
IFRS (Mln, EUR) [A*G*K]
M
N
Reduction of overall FTE to comply with RAS and
IFRS due to improvement of regulation
30%
Overall annual costs saved by all international
banks to comply with RAS and IFRS [L*M]
1-year horizon: (Mln, RON)
5-year horizon: present value, (Mln, RON)
2.2
11.5
69
ata
d
RB gy
n
d o odolo
e
s
Ba meth
&
Loan Loss Provisioning in View of IFRS Application
Economic impact assessment - 4
iii – Tax section
O
P
Q
R
T
Average annual net provision expenses/bank
Under RAS (Mln, RON)
Average annual net provision expenses/bank
Under IFRS (Mln, RON)
Banking industry: Overall annual net provision
expenses under RAS (Mln, RON) [O/D]
Banking industry: Overall annual net provision
expenses under IFRS (Mln, RON) [O/D]
62.3
68.6
397.0
437.0
Annual accounting edge (Mln, EUR) [R-Q]
1-year horizon: (Mln, RON)
5-year horizon: present value, (Mln, RON)
40
165
70
Mortgage Loans Database
Context
Basel II Capital Accord provides that loans fully secured by mortgages on residential property
that is or will be occupied by the borrower, or that is rented, can be risk weighted at 35%
(instead of 50%).
The application of this more favorable regime for the loans secured by mortgages would
decrease the minimum capital requirements and, consequently, lending costs.
In order to benefit of the New Accord on Capital provisions, the banking system should
create and maintain an industry database that allows the calculation of a specified set of
ratios (e.g. default rate and recovery rates for loans secured by mortgages).
71
Mortgage Loans Database
Industry
competitiveness
Prudential Supervision
Banking compliance with National
Central Bank (included
transparency, accounting &
reporting)
Banking and
Regulation-related risk
financial regulation management activities and
databases
Balance sheet, accounting
principles and international
accounting standard - IAS
Safety net
Civil, penal and administrative
Rule of law and regulation affacting bamking
contract
activity
enforcement
Corporate law
Insolvency law and foreclosures
Banks and financial intermediaries
Financial activities/banking
products and services
Taxation
Labor/borrowed money/equity
Source/harmonization
Auditing and tax collection
Unemployment Fund and other
social contributions
Collective labor contract
Labor Market
Any other further integrating labor
arrangement
Regulation on labor
Type of Regulatory Optimization
Business
development
Payment systems
Public/private credit registries
Financial market Primary/Secondary Markets
infrastructure
Trading and post-trading services
Investment banking
Stock Exchange
Corporate lending
Retail lending
Financial
Other lending
products/services Payment products/services
Asset management
Investment banking
Market confidence (negative externality, market power)
Consumer protection (information asimmetry, market
Industry reputation
power)
Public awareness (positive externality)
72
Mortgage Loans Database
Regulatory have a concrete impact
Main Balance Sheet and Income
Statement items affected
Main policy choices
• “Which way the database is
shaped”;
• “Number of parameters of the
model”;
• “Time frame for historical data”;
“Decrease in the risk weight from
50% to 30% for loans fully secured
by mortgages on residential
property”;
……………….
Each item
impacting
on…
• ??
• ??
• ??
………………
73
Mortgage Loans Database
Balance Sheet and Income Statement items affected
BALANCE SHEET
Assets
Customer Loans
Other Loans
Total Customer Loans
Problem Loans - memo
Other non-performing Loans
Total Problem Loans
Total Loans - Net
Other Earning Assets
Due from Other Banks
Other Securities
Investment Securities
Trading Securities
Total Securities
Equity Investments
Other Investments
Total Other Earning Assets
Non-Earning Assets
Cash and Due from Banks
Intangible Assets
Other Non Earning Assets
Total Non Earning Assets
Fixed Assets
Total Fixed Assets
Liabilities
Deposits
Customer Deposits
Banks Deposits
Total Deposits
Money Market Funding
Other Negotiable Instruments
Total Money Market Funding
Other Funding
Other Bonds
Subordinated Debt
Other Funding
Total Other Funding
Loan Loss and Other Reserves
Other Non Equity Reserves
Total Loan Loss & Other Reserves
Other Liabilities
Other Liabilities
Total Liabilities
Equity Reserves
Retained Earnings
Other Equity Reserves
Minority Interests
Total Equity Reserves
INCOME STATEMENT
Interest Income
Interest Expense
Net Interest Revenue
Commision Income
Commision Expense
Net Commission Revenue
Net Trading Income
Other Operating Income
Total Operating Income
Personnel Expenses
Other Admin Expenses
Other Operating Expenses
Loan Loss Provisions
Other Provisions
Total Operating Expense
Non-Operating Income
Pre-Tax Profit
Taxes
Post Tax Profit
Focus:
Capital
Tier 1 Capital Ratio
Total Capital Ratio
74
Mortgage Loans Database
Regulatory have a concrete impact
Main Balance Sheet and Income
Statement items affected
Main policy choices
• “Which way the database is
shaped”;
• “Number of parameters of the
model”;
• “Time frame for historical data”;
“Decrease in the risk weight from
50% to 30% for loans fully secured
by mortgages on residential
property”;
……………….
Each item
impacting
on…
• Interest income;
• Lending increase;
• Capital released;
………………
75
Mortgage Loans Database
Market development
Commercial
Residential
Analytics - 1
Outstanding loans to households secured with
a)
mortgages (Mln, RON)
Estimate of the % of item A that will benefit from this risk
b)
weighted reduction
Risk weight reduction (from 50% to 35%)
c)
Capital requirement (%)
d)
Free capital [Mln, RON) e)=a*b*c*d
Current medium- and long-term loans (Mln, RON)
f)
Share of loans backed by commercial property (%)
g)
Outstanding loans fully secured by mortgages on
h)=f*g
commercial property (Mln, RON)
Estimate of the % of item H that will benefit from this risk
i)
weighted reduction (%)
Risk weight reduction (from 100% to 50%)
j)
Free capital [Mln, RON) k)=d*h*i*j
Average pricing of a residential mortgage loan (%)
l)
Average pricing of a commercial mortgage loan (%)
g)
Change in the demand for credit that happens due to
h)
change in lending interest rates (%)
Increase in demand for residential mortgage loans (Mln,
i)
RON)
Increase in demand for commercial mortgage loans (Mln,
j)
RON)
Interest income on new residential lending
k)
l)
Interest income on new commercial lending
7,197
50%
15%
12%
65
27,934
30%
8,380
20%
50%
100.6
11.0%
12.6%
(0.1)
5.9
39.9
0.6
4.8
76
Mortgage Loans Database
Analytics - 2
PV - Capital freed due to residential backed mortgages
(Mln, RON)
PV - Capital freed due to commercial backed mortgages
(Mln, RON)
PV - Increase in demand for residential mortgage loans
(Mln, RON)
PV - Increase in demand for commercial mortgage loans
(Mln, RON)
PV - Interest income on new residential lending (Mln, RON)
PV - Interest income on new commercial lending (Mln,
RON)
2007
2008
2009
2010
2011
5-year
NPV
i)
60.5
56.5
52.7
49.2
46.0
264.9
ii)
93.9
87.7
81.9
76.4
71.4
411.2
iii)
5.5
5.1
4.8
4.5
4.2
24.1
iv)
37.3
34.8
32.5
30.3
28.3
163.2
v)
0.6
0.6
0.5
0.5
0.5
2.6
vi)
4.5
4.2
3.9
3.6
3.4
19.6
Discount rate (%)
7.10%
Discount factor 0.933707 0.871808 0.814013
0.76005 0.709664
77
Mortgage Loans Database
Data and assumptions:
a) Real-estate/mortgage loans to households (Mln, RON)
7,197
Source: NBR, Financial Behaviour of Households and Companies , September 2006
Analytics - 3
b) Residential mortgage lending: Real-estate/mortgage loans to
households are considered 100% residential property
c) Estimate of the % of loans fully secured by mortgages on
50%
residential property that will benefit from this risk weighted
reduction
d) Commercial mortgage lending: calculations of this item are based on
i) Current medium- and long-term loans(Mln, RON)
27,934
ii) Weight of loans backed by commercial property (%)
30%
e) Estimate of the % of loans fully secured by mortgages on
commercial property that will benefit from this risk weighted
20%
reduction
f) Average pricing of a residential mortgage loan (%)
11.0%
Source: NBR, Monthly Bulletin-Statistical Section, 9/2006, p. 19
g) Average pricing of a commercial mortgage loan (%)
12.6%
Source: NBR, Monthly Bulletin-Statistical Section, 9/2006, p. 19
h) Reduction of residential mortgage loan pricing as a result of less capital
absorbed. It is calculated as follows:
i) loan=100
ii) differential risk weight=15%
iii) capital adequacy ratio=12%
iv) cost of equity=10%
v) cost of equity as pricing component= 0.18%
i) Reduction of commecial mortgage loan pricing as a result of less capital
absorbed. It is calculated as follows:
i) loan=100
ii) differential risk weight=50%
iii) capital adequacy ratio=12%
iv) cost of equity=10%
v) cost of equity as pricing component= 0.6%
-10%
j) Estimated interest elasticity(*) of the demand for mortgage
loans (%)
78
Mortgage Loans Database
Economic impact assessment - 1
i - Section on residential real estate
A
B
Outstanding loans to households secured with
mortgages (Mln, RON)
Estimate of the % of item A that will benefit
from this risk weighted reduction (**)
7,197
50%
C
Risk weight reduction (from 50% to 35%)
15%
D
Capital requirement (%)
12%
E
Capital released [A*B*C*D]
1-year horizon: (Mln, RON)
5-year horizon: present value, (Mln, RON)
65
264
79
Mortgage Loans Database
Economic impact assessment - 2
ii - Section on commercial real estate
F
G
H
I
Current medium- and long-term loans (Mln, RON)
Share of loans backed by commercial
property (%)
Outstanding loans fully secured by mortgages
on commercial property (Mln, RON) [F*G]
Estimate of the % of item H that will benefit
from this risk weighted reduction (**)
J
Risk weight reduction (from 100% to 50%)
K
Capital released [H*I*J]
27,934
30%
8,380
20%
50%
1-year horizon: (Mln, RON)
100
5-year horizon: present value, (Mln, RON)
411
80
Mortgage Loans Database
Economic impact assessment - 3
iii - Section on market development
L
M
N
O
P
Average pricing of a residential mortgage loan
(%)
Average pricing of a commercial mortgage loan
(%)
Reduction of residential mortgage loan pricing as
a result of less capital absorbed (p.p.)
Reduction of commercial mortgage loan pricing as
a result of less capital absorbed (p.p.)
Change in the demand for credit that happens
due to change in lending interest rates (%)(*)
*= Shows percentage change in the demand for credit when interest rate changes by one percent
11%
12.6%
0.18 p.p.
0.6 p.p.
(0.1)
81
Mortgage Loans Database
Economic impact assessment - 4
iii - Section on market development
Q
Potential increase of demand for residential
mortgage loans (Mln, RON)
1-year horizon: (Mln, RON)
5-year horizon: present value, (Mln, RON)
R
24
Potential increase of demand for commercial
mortgage loans (Mln, RON)
1-year horizon: (Mln, RON)
5-year horizon: present value, (Mln, RON)
Q
6
40
163
Overall interest income (Mln, RON)
1-year horizon: (Mln, RON)
5-year horizon: present value, (Mln, RON)
5.4
22.2
82
LGD Database
Context
Loss Given Default (LGD) is an important credit risk exposure data requirement under Basel
II. Thus, a bank using internal LGD estimates might be able to differentiate LGD values on
the basis of a wider set of transaction characteristics.
In order to comply with these features of the Basel II framework, the banks should set up a
database containing loan-specific data.
In addition to its Basel II related functions, LDG is also a useful tool in assessing the
adequacy of provisioning in the day to day management of the credit risk and provides to the
authorities information that is relevant for financial stability monitoring purposes.
83
LGD Database
Industry
competitiveness
Prudential Supervision
Banking compliance with National
Central Bank (included
transparency, accounting &
reporting)
Banking and
Regulation-related risk
financial regulation management activities and
databases
Balance sheet, accounting
principles and international
accounting standard - IAS
Safety net
Civil, penal and administrative
Rule of law and regulation affacting bamking
contract
activity
enforcement
Corporate law
Insolvency law and foreclosures
Banks and financial intermediaries
Financial activities/banking
products and services
Taxation
Labor/borrowed money/equity
Source/harmonization
Auditing and tax collection
Unemployment Fund and other
social contributions
Collective labor contract
Labor Market
Any other further integrating labor
arrangement
Regulation on labor
Type of Regulatory Optimization
Business
development
Payment systems
Public/private credit registries
Financial market Primary/Secondary Markets
infrastructure
Trading and post-trading services
Investment banking
Stock Exchange
Corporate lending
Retail lending
Financial
Other lending
products/services Payment products/services
Asset management
Investment banking
Market confidence (negative externality, market power)
Consumer protection (information asimmetry, market
Industry reputation
power)
Public awareness (positive externality)
84
LGD Database
Regulatory solutions have a concrete impact
Main Balance Sheet and Income
Statement items affected
Main policy choices
• “Which way the database is
shaped”;
• “Number of parameters of the
model”;
• “Time frame for historical data”;
……………….
Each item
impacting
on…
• ??
• ??
………………
85
LGD Database
Balance Sheet and Income Statement items affected
BALANCE SHEET
Assets
Customer Loans
Other Loans
Total Customer Loans
Problem Loans - memo
Other non-performing Loans
Total Problem Loans
Total Loans - Net
Other Earning Assets
Due from Other Banks
Other Securities
Investment Securities
Trading Securities
Total Securities
Equity Investments
Other Investments
Total Other Earning Assets
Non-Earning Assets
Cash and Due from Banks
Intangible Assets
Other Non Earning Assets
Total Non Earning Assets
Fixed Assets
Total Fixed Assets
Liabilities
Deposits
Customer Deposits
Banks Deposits
Total Deposits
Money Market Funding
Other Negotiable Instruments
Total Money Market Funding
Other Funding
Other Bonds
Subordinated Debt
Other Funding
Total Other Funding
Loan Loss and Other Reserves
Other Non Equity Reserves
Total Loan Loss & Other Reserves
Other Liabilities
Other Liabilities
Total Liabilities
Equity Reserves
Retained Earnings
Other Equity Reserves
Minority Interests
Total Equity Reserves
INCOME STATEMENT
Interest Income
Interest Expense
Net Interest Revenue
Commision Income
Commision Expense
Net Commission Revenue
Net Trading Income
Other Operating Income
Total Operating Income
Personnel Expenses
Other Admin Expenses
Other Operating Expenses
Loan Loss Provisions
Other Provisions
Total Operating Expense
Non-Operating Income
Pre-Tax Profit
Taxes
Post Tax Profit
Focus:
Capital
Tier 1 Capital Ratio
Total Capital Ratio
86
LGD Database
Regulatory solutions have a concrete impact
Main Balance Sheet and Income
Statement items affected
Main policy choices
• “Which way the database is
shaped”;
• “Number of parameters of the
model”;
• “Time frame for historical data”;
……………….
Each item
impacting
on…
• Interest income;
• Capital released;
………………
87
LGD Database
Market development
Capital relief
Analytics - 1
Outstanding amount of consumer loans (Mln, RON)
Outstanding loans to SMEs
Percentage of each portfolio that will apply Basel
Current risk weight for the kind of loans above (%)
Average risk weight after the set up of LGD database (%)
Capital requirement (%)
Free capital [Mln, RON)
Cost of equity (%)
Savings in cost of capital (Mln, RON)
Average pricing of a conusmer loan (%)
Average pricing of loans to SMEs (%)
Interest elasticity of the demand for mortgage loans (%)
Demand increase (%)
Increase in demand for consumer loans (Mln, RON)
Increase in demand for loans to SMEs (Mln, RON)
Overall demand increase (Mln, RON)
Interest income on new overall lending
a)
b)
c)
d)
e)
f)
g)=(a+b)*c*(de)*f
h)
i)=g*h
j)
k)
l)
m)
n)=a*c*m
o)=b*c*m
p)=n+o
q)
28,046
12,791
5%
75%
50%
12%
61
10%
6
14.4%
14.4%
(0.3)
0.63%
9
4
13
2.4
88
LGD Database
Analytics - 2
Banks using standard approach measured in terms of share of
total assets (%)
i)
PV - Capital released due to establishment of LGD database ii)=(a+b)*i*(de)*f
(Mln, RON)
PV - Savings in cost of capital (Mln, RON)
ii)=ii*h
PV - Overall demand increase (Mln, RON) iv)=(a+b)*i*m
PV - Interest income on new overall lending (Mln, RON)
5-year
NPV
2007
2008
2009
2010
2011
5%
25%
50%
80%
80%
57.2
267.0
498.6
744.9
695.5
2,263
5.3
23.3
40.6
56.6
49.4
175
12
56
104
155
145
471.5
2
7
12
17
14
51.5
Discount rate (%)
7.10%
Discount factor 0.933707 0.871808 0.814013
0.76005 0.709664
89
LGD Database
Analytics - 3
Data and assumptions:
a) Banks using standard approach measured in terms of
share of total assets (%)
Year
%
2007
5%
2008
25%
2009
50%
2010
80%
2011
80%
b) Loans that could be benefit from the establisment of LGD are:
i) consumer loans;
ii) loans to SMEs.
c) By borrower, credit stock is composed as follows:
i) households
35.7%
ii) private companies
59.0%
of which SMEs
28.5%
iii) SOEs
5.30%
Source: Convergence computations on"IMF, Romania: Selected isues and Statistical
Appendix" .
d) Outstanding amount of consumer loans (Mln, RON)
28,046
Source: NBR, Financial Behaviour of Households and Companies, September 2006
e) Outstanding amount of loans to SMEs was worked out as follows:
44,882
i) Loans in lei (Mln, RON)
Source: NBR, Financial Behaviour of Households and Companies, September 2006
ii) weight of SMEs (%)
28.5%
iii) Outstanding loans to SMEs (i*ii)
12,791
f) Percentage of each portfolio that will apply Basel provisions enabling
use of LGD database (%)
g) Percentage of each portfolio that will apply Basel provisions
5%
enabling use of LGD database (%)
h) Current risk weight for the kind of loans above (%)
75%
i) Average risk weight after the set up of LGD database (%)
j) Cost of equity (%)
50%
10%
90
LGD Database
Analytics - 4
k) Average pricing of consumer loans (%)
14.4%
Source: NBR, Monthly Bulletin-Statistical Section, 9/2006, p. 19
l) Average pricing of loans to SMEs (%)
14.4%
m) Reduction of consumer loan pricing as a result of less capital absorbed. It is
calculated as follows:
i) loan=100
ii) differential risk weight=25%
iii) capital adequacy ratio=12%
iv) cost of equity=10%
v) cost of equity as pricing component= 0.30%
n) Reduction of pricing of loans to SMEsas a result of less capital absorbed. It is
calculated as follows:
i) loan=100
ii) differential risk weight=25%
iii) capital adequacy ratio=12%
iv) cost of equity=10%
v) cost of equity as pricing component= 0.6%
-30%
o) Estimated interest elasticity(*) of the demand for mortgage
loans (%)
91
LGD Database
Economic impact assessment - 1
i - Section on capital relief
A
B
C
D
E
F
Outstanding amount of consumer loans
(Mln, RON)
Outstanding amount of loans to SMEs (Mln, RON)
Percentage of each portfolio that will apply
Basel provisions enabling use of LGD database (%)
Current risk weight for the kind of loans above
(%)
Estimate of average risk weight after the
establishment of LGD database
Capital requirement (%)
28,046
12,791
5%
75%(**)
50%
12%
(*)= On the assumption that this is a kind of loans that could benefit from the establishment of LGD database
(**)= Basel I
92
LGD Database
Economic impact assessment - 2
i - Section on capital relief
G
Capital released [(A+B)*C*(D-E)*F]
1-year horizon: (Mln, RON)
5-year horizon: present value, (Mln, RON)
H
I
Cost of equity
61
2,940
10%
Savings in cost of capital [G*H]
1-year horizon: (Mln, RON)
5-year horizon: present value, (Mln, RON)
6
294
93
LGD Database
Economic impact assessment - 3
ii - Section on market development
I
Average pricing of a consumer loan (%)
14.4%
J
Average pricing of loans to SMEs (%)
14.4%
K
L
M
Reduction of consumer loan pricing as a result of
less capital absorbed (p.p.)
Reduction of SMEs loan pricing as a result of less
capital absorbed (%)
Estimated interest elasticity of the demand for
mortgage loans (%)
N
Demand increase (%)
O
Potential increase of demand for consumer loans
and loans to SMEs (Mln, RON)
1-year horizon: (Mln, RON)
5-year horizon: present value, (Mln, RON)
0.30 p.p.
0.30 p.p.
(0.3)
0.63%
13
471
94
LGD Database
Economic impact assessment - 4
ii - Section on market development
P
Overall interest income (Mln, RON)
1-year horizon: (Mln, RON)
5-year horizon: present value, (Mln, RON)
2.4
51.5
95
Rating Agencies
Context
Under Basel II, banks are allowed to use credit ratings – for capital requirements purposes from credit rating agencies (called “ECAIs" - “External Credit Assessment Institutions")
recognised by the competent supervisory authorities.
In Romania most of the local companies cannot afford to be clients of international rating
agencies. At present, in Romania there are only three local rating agencies which are not
allowed to carry out rating activities due to lack of legislation in this area.
96
Rating Agencies
Industry
competitiveness
Prudential Supervision
Banking compliance with National
Central Bank (included
transparency, accounting &
reporting)
Banking and
Regulation-related risk
financial regulation management activities and
databases
Balance sheet, accounting
principles and international
accounting standard - IAS
Safety net
Civil, penal and administrative
Rule of law and regulation affacting bamking
contract
activity
enforcement
Corporate law
Insolvency law and foreclosures
Banks and financial intermediaries
Financial activities/banking
products and services
Taxation
Labor/borrowed money/equity
Source/harmonization
Auditing and tax collection
Unemployment Fund and other
social contributions
Collective labor contract
Labor Market
Any other further integrating labor
arrangement
Regulation on labor
Type of Regulatory Optimization
Business
development
Payment systems
Public/private credit registries
Financial market Primary/Secondary Markets
infrastructure
Trading and post-trading services
Investment banking
Stock Exchange
Corporate lending
Retail lending
Financial
Other lending
products/services Payment products/services
Asset management
Investment banking
Market confidence (negative externality, market power)
Consumer protection (information asimmetry, market
Industry reputation
power)
Public awareness (positive externality)
97
Rating Agencies
Regulatory solutions have a concrete impact
Main Balance Sheet and Income
Statement items affected
Main policy choices
• “The establishment of domestic
ECAIs will allow local companies to
get rated and will increase the risk
sensitivity of the Basel II
framework”;
• “Banks will have the possibility
improve the credit risk
management and assign lower risk
ratings to rated creditworthy
borrowers”;
• “Creditworthy borrowers will
benefit from increased lending and
improved conditions”;
………………
• ??
Each item
impacting
on…
• ??
• ??
………………
98
Rating Agencies
Balance Sheet and Income Statement items affected
BALANCE SHEET
Assets
Customer Loans
Other Loans
Total Customer Loans
Problem Loans - memo
Other non-performing Loans
Total Problem Loans
Total Loans - Net
Other Earning Assets
Due from Other Banks
Other Securities
Investment Securities
Trading Securities
Total Securities
Equity Investments
Other Investments
Total Other Earning Assets
Non-Earning Assets
Cash and Due from Banks
Intangible Assets
Other Non Earning Assets
Total Non Earning Assets
Fixed Assets
Total Fixed Assets
Liabilities
Deposits
Customer Deposits
Banks Deposits
Total Deposits
Money Market Funding
Other Negotiable Instruments
Total Money Market Funding
Other Funding
Other Bonds
Subordinated Debt
Other Funding
Total Other Funding
Loan Loss and Other Reserves
Other Non Equity Reserves
Total Loan Loss & Other Reserves
Other Liabilities
Other Liabilities
Total Liabilities
Equity Reserves
Retained Earnings
Other Equity Reserves
Minority Interests
Total Equity Reserves
INCOME STATEMENT
Interest Income
Interest Expense
Net Interest Revenue
Commision Income
Commision Expense
Net Commission Revenue
Net Trading Income
Other Operating Income
Total Operating Income
Personnel Expenses
Other Admin Expenses
Other Operating Expenses
Loan Loss Provisions
Other Provisions
Total Operating Expense
Non-Operating Income
Pre-Tax Profit
Taxes
Post Tax Profit
Focus:
Capital
Tier 1 Capital Ratio
Total Capital Ratio
99
Rating Agencies
Regulatory solutions have a concrete impact
Main Balance Sheet and Income
Statement items affected
Main policy choices
• “The establishment of domestic
ECAIs will allow local companies to
get rated and will increase the risk
sensitivity of the Basel II
framework”
• “Banks will have the possibility
improve the credit risk
management and assign lower risk
ratings to rated creditworthy
borrowers”;
• “Creditworthy borrowers will
benefit from increased lending and
improved conditions”;
………………
• Interest income;
Each item
impacting
on…
• Lending increase;
• Capital released;
………………
100
Rating Agencies
Analytics - 1
Total non-government credit(September 2006) (Mln, RON)
a)
Total credit to private companies (%)
b)
Percentage of credit granted to borrowers eligible for being
c)
rated by local CRAs (%)
Banks using standard approach measured in terms of
d)
share of total assets (%)
Amount of credit granted to borrowers eligible for being
e)=a*b*c*d
rated by local CRAs (Mln, RON)
Percentage of credit granted that would receive a better
f)
assessment if rated by local CRAs (%)
Amount of credit granted that would receive a better
g)=e*f
assessment if rated by local CRAs (%)
Risk weight assigned as unrated credit (%)
h)
Risk weight assigned as rated credit (%)
i)
Capital adequacy ratio (%)
j)
Free Capital (Mln,RON) k)=g*(h-i)*j
Estimate of the average standard pricing of a loan to
l)
eligible for but unrated companies (%)
st of equity savings in loan pricing due to freeing capital (%)
m)
Decrease in pricing due to capital savings (%)
n)
% of price reduction
o)
Change in the demand for credit that happens due to
p)
change in lending interest rates
Increase in demand for loans by companies rated by CRAs q)=e*o*p
Interest income (%)
r)
Net interest margin for legal entities (Mln, RON)
s)=q*r
85,229
59%
20%
95%
9,554
10%
955
100%
50%
12%
57.3
12%
0.60%
11.4%
-5%
-30.0%
143.3
11.7%
17
101
Rating Agencies
Analytics - 2
Annual
Average
2007
2008
2009
2010
2011
95%
75%
50%
20%
20%
Amount of credit granted to borrowers eligible for being rated by local CRAs ii)=a*b*c*i*f
(Mln, RON)
9,554
7,543
5,029
2,011
2,011
PV - Free capital (Mln, RON) iii)=ii*f*(h-i)*j
57.3
45.3
30.2
12.1
12.1
156.9
iv)=iii*COE
(10%)
5.7
4.5
3.0
1.2
1.2
15.7
v)=ii*o*p
143.3
113.1
75.4
30.2
30.2
392.2
78.4
vi)=v*r
16.8
13.2
8.8
3.5
3.5
45.9
5-years
9.2
Banks using standard approach measured in terms of share of total assets (%)
PV - Savings in cost of equity (Mln, RON)
PV - Increase in demand for loans by companies rated by CRAs (Mln,
RON)
PV - Interest income (Mln, RON)
i)
Discount rate (%)
7.10%
Discount factor 0.933707 0.871808 0.814013
31.4
0.76005 0.709664
102
Rating Agencies
Analytics - 3
Data and assumptions:
Basel II
Claims on corporates
Credit
AAA to AA- A+ to Aassessment
Risk weight
20%
50%
BBB+ to
Below BB- Unrated
BB100%
150%
100%
59%
a) Total credit to private companies (%)
Source: IMF, Romania: Selected isues and Statistical Appendix.
b) Banks using standard approach measured in terms of
share of total assets (%)
Year
%
2007
95%
2008
75%
2009
50%
2010
20%
c) Percentage of credit granted to borrowers eligible for being
rated by local CRAs (%)
d) Percentage of credit granted that would receive a better
assessment if rated by local CRAs (%)
e) Risk weight assigned as rated credit (%)
f) Cost of equity
g) Estimate of the average standard pricing of a loan to
eligible for but unrated companies (%)
2011
20%
20%
10%
50%
10%
12%
Source: NBR, Monthly Bulletin, 9/2006, p. 22, table 8, new loans in RON, legal entities
h) Interest income (%)
11.7%
Source: NBR, Monthly Bulletin, 9/2006, p. 22, table 8, new loans in RON, legal entities
103
Rating Agencies
Economic impact assessment - 1
i - Section on capital relief
A
B
C
D
E
F
Total non-government credit (September 2006)
(Mln, RON) (*)
Total credit to private companies
Percentage of credit granted to borrowers eligible
for being rated by local CRAs (%)
Banks using standard approach measured in terms
of share of total assets (%)
Amount of credit granted to borrowers eligible
for being rated by local CRAs (Mln, RON) [A*B*C*D]
Percentage of credit granted that would receive
a better assessment if rated by local CRAs (%)
85,229
59%
20%
95%
9,554
10%
104
Rating Agencies
Economic impact assessment - 2
i - Section on capital relief
G
Amount of credit granted that would receive a
better asses. if rated by local CRAs (%) [E*F]
209
H
Risk weight assigned as unrated credit (%)
I
Risk weight assigned as rated credit (%)
50%
J
Capital adequacy ratio (%)
12%
K
Capital released (Mln, RON) [G*(H-I)*J]
K1
Savings in cost of equity
1-year horizon: (Mln, RON)
5-year horizon: present value (Mln, RON)
100%
57.3
5.7
15.7
105
Rating Agencies
Economic impact assessment - 3
ii - Section on market development
L
M
N
O
P
Estimate of the average standard pricing of a
loan to companies (%)
Cost of equity (%)
Cost of equity savings in loan pricing due to
freeing capital (%) [100*(H-I)*L*M]
New pricing due to capital savings (%)
Change in the demand for credit that happens due to
change in lending interest rates (%) (*)
*= Shows percentage change in the demand for credit when interest rate changes by one percent
12%
10%
0.60%
11.4%
(0.3)
106
Rating Agencies
Economic impact assessment - 4
ii - Section on market development
Q
Increase in demand for loans from firms rated
by CRAs (Mln, RON)
R
Interest income (%)
S
Interest income
143
11.7%
1-year horizon: (Mln, RON)
17
5-year horizon: present value (Mln, RON)
46
107
Stress Testing
Context
Stress tests permit a forward-looking analysis and an uniform approach to identifying
potential risks. System-wide stress tests can complement stress tests conducted by
individual institutions, resulting in benefits under several regards (e.g. to identify weaknesses
in risk management processes and practices; to increase expertise in risk assessment by
supervisors).
A stress test covering households and firms exposures could offer important indications on
their capacity to withstand macroeconomic shocks (such as sharp movements in interest
rates, exchange rates, GDP, employment) and how their debt servicing capacity could affect
the banking sector.
108
Stress Testing
Industry
competitiveness
Prudential Supervision
Banking compliance with National
Central Bank (included
transparency, accounting &
reporting)
Banking and
Regulation-related risk
financial regulation management activities and
databases
Balance sheet, accounting
principles and international
accounting standard - IAS
Safety net
Civil, penal and administrative
Rule of law and regulation affacting bamking
contract
activity
enforcement
Corporate law
Insolvency law and foreclosures
Banks and financial intermediaries
Financial activities/banking
products and services
Taxation
Labor/borrowed money/equity
Source/harmonization
Auditing and tax collection
Unemployment Fund and other
social contributions
Collective labor contract
Labor Market
Any other further integrating labor
arrangement
Regulation on labor
Type of Regulatory Optimization
Business
development
Payment systems
Public/private credit registries
Financial market Primary/Secondary Markets
infrastructure
Trading and post-trading services
Investment banking
Stock Exchange
Corporate lending
Retail lending
Financial
Other lending
products/services Payment products/services
Asset management
Investment banking
Market confidence (negative externality, market power)
Consumer protection (information asimmetry, market
Industry reputation
power)
Public awareness (positive externality)
109
Stress Testing
Regulatory solutions have a concrete impact
Main Balance Sheet and Income
Statement items affected
Main policy choices
• “Build up a model for the
probability of default in case of
households”;
• “Decide on the types of shocks
used for stress testing households
• test the model stability in the case
of corporates”;
• “Test the model under non-linear
transmission of shocks through
corporate balance sheets and P/Ls
in the case of corporates”;
Each item
impacting
on…
• ??
• ??
………………
…………………..
110
Stress Testing
Balance Sheet and Income Statement items affected
INCOME STATEMENT
BALANCE SHEET
Assets
Customer Loans
Other Loans
Total Customer Loans
Problem Loans - memo
Other non-performing Loans
Total Problem Loans
Total Loans - Net
Other Earning Assets
Due from Other Banks
Other Securities
Investment Securities
Trading Securities
Total Securities
Equity Investments
Other Investments
Total Other Earning Assets
Non-Earning Assets
Cash and Due from Banks
Intangible Assets
Other Non Earning Assets
Total Non Earning Assets
Fixed Assets
Total Fixed Assets
Liabilities
Deposits
Customer Deposits
Banks Deposits
Total Deposits
Money Market Funding
Other Negotiable Instruments
Total Money Market Funding
Other Funding
Other Bonds
Subordinated Debt
Other Funding
Total Other Funding
Loan Loss and Other Reserves
Other Non Equity Reserves
Total Loan Loss & Other Reserves
Interest Income
Interest Expense
Net Interest Revenue
Commision Income
Commision Expense
Net Commission Revenue
Net Trading Income
Other Operating Income
Total Operating Income
Personnel Expenses
Other Admin Expenses
Other Operating Expenses
Loan Loss Provisions
Other Provisions
Total Operating Expense
Non-Operating Income
Pre-Tax Profit
Taxes
Post Tax Profit
Other Liabilities
Other Liabilities
Total Liabilities
Equity Reserves
Retained Earnings
Other Equity Reserves
Minority Interests
Total Equity Reserves
Focus:
Capital
Tier 1 Capital Ratio
Total Capital Ratio
111
Stress Testing
Regulatory solutions have a concrete impact
Main Balance Sheet and Income
Statement items affected
Main policy choices
• “Build up a model for the
probability of default in case of
households”;
• “Decide on the types of shocks
used for stress testing households
• test the model stability in the case
of corporates”;
• “Test the model under non-linear
transmission of shocks through
corporate balance sheets and P/Ls
in the case of corporates”;
Each item
impacting
on…
• Loan loss provisions;
………………
…………………..
112
Stress Testing
Analytics - 1
Overall annual net provisions expenses under RAS (Mln,
Estimated impact of stress testing adoption in reducing
annual LLPs for lending activity (%)
Annual savings in LLPs for lending activity due to benefits
from stress testing application (Mln, RON)
PV - Annual savings in LLPs for lending activity due to benefits from
stress testing application (Mln, RON)
i)
a)
b)
397
10%
40
c)=a*b
2007
2008
2009
2010
2011
5-year
NPV
37.1
34.6
32.3
30.2
28.2
162
Discount rate (%)
7.10%
Discount factor 0.933707 0.871808 0.814013
0.76005 0.709664
113
Stress Testing
Analytics - 2
Data and assumptions:
a) Overall annual net provisions expenses under RAS (Mln,
RON)
397
Source: See Preliminary RIA on IFRS. The figure here above refers to overall annual net
provision expenses under RAS.
b) Annual amount of LLPs remains steady over next years.
c) Estimated impact of stress testing adoption in reducing
annual LLPs for lending activity (%)
10%
114
Stress Testing
Economic impact assessment - 1
This is a static representation of the methodology
A
B
C
Annual LLPs for credit granted by banks
(Mln, RON)
Estimated impact of stress testing adoption in
reducing annual LLPs for lending activity (%)
397
10%
Differential LLP for loans to households due to
adoption of stress test methodologies [A*B]
1-year horizon: (Mln, RON)
5-year horizon: present value, (Mln, RON)
40
162
115
Law on Safety
Context
At present, Law no. 333/2003 regulates the goods safeguard, values and persons’ protection,
whose provisions apply to all commercial companies, including banks. Banks are confronted
with some practical difficulties in applying the provisions of the law (e.g. complicated and
lengthy approval procedures, transportation plans for valuables subject to police approval).
In this context, RBA wants to propose amendments to the current law to reduce the cost of
compliance to the banking system.
116
Law on Safety
Industry
competitiveness
Prudential Supervision
Banking compliance with National
Central Bank (included
transparency, accounting &
reporting)
Banking and
Regulation-related risk
financial regulation management activities and
databases
Balance sheet, accounting
principles and international
accounting standard - IAS
Safety net
Civil, penal and administrative
Rule of law and regulation affacting bamking
contract
activity
enforcement
Corporate law
Insolvency law and foreclosures
Banks and financial intermediaries
Financial activities/banking
products and services
Taxation
Labor/borrowed money/equity
Source/harmonization
Auditing and tax collection
Unemployment Fund and other
social contributions
Collective labor contract
Labor Market
Any other further integrating labor
arrangement
Regulation on labor
Type of Regulatory Optimization
Business
development
Payment systems
Public/private credit registries
Financial market Primary/Secondary Markets
infrastructure
Trading and post-trading services
Investment banking
Stock Exchange
Corporate lending
Retail lending
Financial
Other lending
products/services Payment products/services
Asset management
Investment banking
Market confidence (negative externality, market power)
Consumer protection (information asimmetry, market
Industry reputation
power)
Public awareness (positive externality)
117
Law on Safety
Regulatory solutions have a concrete impact
Main Balance Sheet and Income
Statement items affected
Main policy choices
• “Allow banks to use risk based
analysis in order to determine the
requirements, the measures, the
means, and the forms of ensuring the
safeguard of values and the protection
of persons”;
• “Allow for the use of standard projects
for the electronic security systems
tailored by categories of units of an
entity”;
• “The safeguard plans get approved
only if the risk based analysis indicates
that the safeguard is ensured with
dedicated personnel”;
Each item
impacting
on…
• ??
• ??
………………
…………………….
118
Law on Safety
Balance Sheet and Income Statement items affected
INCOME STATEMENT
BALANCE SHEET
Assets
Customer Loans
Other Loans
Total Customer Loans
Problem Loans - memo
Other non-performing Loans
Total Problem Loans
Total Loans - Net
Other Earning Assets
Due from Other Banks
Other Securities
Investment Securities
Trading Securities
Total Securities
Equity Investments
Other Investments
Total Other Earning Assets
Non-Earning Assets
Cash and Due from Banks
Intangible Assets
Other Non Earning Assets
Total Non Earning Assets
Fixed Assets
Total Fixed Assets
Liabilities
Deposits
Customer Deposits
Banks Deposits
Total Deposits
Money Market Funding
Other Negotiable Instruments
Total Money Market Funding
Other Funding
Other Bonds
Subordinated Debt
Other Funding
Total Other Funding
Loan Loss and Other Reserves
Other Non Equity Reserves
Total Loan Loss & Other Reserves
Interest Income
Interest Expense
Net Interest Revenue
Commision Income
Commision Expense
Net Commission Revenue
Net Trading Income
Other Operating Income
Total Operating Income
Personnel Expenses
Other Admin Expenses
Other Operating Expenses
Loan Loss Provisions
Other Provisions
Total Operating Expense
Non-Operating Income
Pre-Tax Profit
Taxes
Post Tax Profit
Other Liabilities
Other Liabilities
Total Liabilities
Equity Reserves
Retained Earnings
Other Equity Reserves
Minority Interests
Total Equity Reserves
Focus:
Capital
Tier 1 Capital Ratio
Total Capital Ratio
119
Law on Safety
Regulatory solutions have a concrete impact
Main Balance Sheet and Income
Statement items affected
Main policy choices
• “Allow banks to use risk based
analysis in order to determine the
requirements, the measures, the
means, and the forms of ensuring the
safeguard of values and the protection
of persons”;
• “Allow for the use of standard projects
for the electronic security systems
tailored by categories of units of an
entity”;
• “The safeguard plans get approved
only if the risk based analysis indicates
that the safeguard is ensured with
dedicated personnel”;
Each item
impacting
on…
• Personnel costs;
• Other administrative costs;
………………
…………………….
120
Law on Safety
Total territorial units of banks
Average number of transportation plans over a year drawn
by each unit for police approval (#)
% total territorial units that externalize the transport of
valuables
Time needed by each unit to take care of the approval
procedure (FTE)
Average unit that rely on internal services
Average unit that externalize
Gross daily cost of a bank staff (RON)
Costs of complying with police approval for transportation
plans (Mln, RON)
Average number of records for 1 working day of non-stop
Rate of positive records over a month (%)
Unitary cost of each negative record (opportunity cost +
storing cost) (RON)
Number of records needed every year [#]
Costs of complying with storing “blank’ records in each of
the territorial unit (Mln, RON)
a)
3,845
b)
24
Analytics - 1
40%
c)
d)
d1)
d2)
e)
0.25
0.50
222
f)=a*b*d*e
7.2
g)
h)
i)
1
2%
1.5
i)
j)
264
1.5
PV - Costs of complying with police approval for
transportation plans (Mln, RON)
PV - Costs of complying with storing “blank’ records in
each of the territorial unit (Mln, RON)
5-year
NPV
2007
2008
2009
2010
2011
i)
6.7
6.3
5.8
5.4
5.1
29.3
ii)
1.4
1.3
1.2
1.1
1.1
6.1
Discount rate (%)
7.10%
Discount factor 0.933707 0.871808 0.814013
0.76005 0.709664
121
Law on Safety
Analytics - 2
Data and assumptions:
a) % total territorial units that externalize the transport of
40%
valuables
b) Time needed by each unit to take care of the approval procedure (FTE)
i) Average units that rely on internal services
0.25
ii) Average units that externalize
0.50
c) Gross daily cost of a bank staff (RON)
222
d) Average number of records for 1 day of non-stop video (#)
e) Rate of positive records over a month (%)
2%
f) Unitary cost of each negative record (opportunity cost +
2
storing cost) (RON)
g) Number of records needed every year [#] (1 record per
264
working day)
122
Law on Safety
Economic impact assessment - 1
A
B
C
D
E
Total territorial units of banks (#)
Average number of transportation plans over a
year drawn by each unit for police approval
% total territorial units that externalize
the transport of valuables
3,845
24
40%
Time needed by each unit to take care of
the approval procedure (FTE)
D-1
Average unit that rely on internal
services
0.25
D-2
Average unit that externalizes
0.50
Gross daily cost of a bank staff (RON)
222
123
Law on Safety
Economic impact assessment - 2
Costs of complying with police approval for
transportation plans [A*B*D*E]
F
1-year horizon: (Mln, RON)
5-year horizon: present value, (Mln, RON)
Average number of records/tapes for 1 working
G
day of non-stop video
7.2
29.3
1
H
Number of records/tapes needed every year (*)
264
I
Rate of positive records over a month (%)
2%
J
Unitary cost of each negative record (opportunity
cost + storing cost) (RON)
1.5
(*)= Working days
124
Law on Safety
Economic impact assessment - 3
K
L
Costs of complying with storing “blank’ records
in each of the territorial unit
1-year horizon: (Mln, RON)
1.5
5-year horizon: present value, (Mln, RON)
6.1
Overall impact [F+K]
1-year horizon: (Mln, RON)
5-year horizon: present value, (Mln, RON)
8.7
35.4
125
Ombudsman (draft)
Context
In Romania, there is a perceived need to adequately address the complaints made by
individual consumers or businesses against the financial service providers and to improve
the public image of the banks.
Most European countries have established successful Banking Ombudsman schemes in the
past 30 years, either financed by banks or set up as external organizations.
As Romania has joined the EU, the Romanian banking industry needs to be tuned with
European recent developments in the financial consumer protection area.
126
Ombudsman (draft)
Industry
competitiveness
Prudential Supervision
Banking compliance with National
Central Bank (included
transparency, accounting &
Banking and
reporting)
financial
Regulation-related risk management
regulation
activities and databases
Balance sheet, accounting principles
and international accounting
Safety net
Civil, penal and administrative
Rule of law and
regulation affacting bamking activity
contract
Corporate law
enforcement
Insolvency law and foreclosures
Banks and financial intermediaries
Financial activities/banking products
Taxation
Labor/borrowed money/equity
Source/harmonization
Auditing and tax collection
Unemployment Fund and other
Collective labor contract
Labor Market
Any other further integrating labor
Regulation on labor
Business
development
Payment systems
Public/private credit registries
Financial market Primary/Secondary Markets
infrastructure
Trading and post-trading services
Investment banking
Stock Exchange
Corporate lending
Retail lending
Financial
Other lending
products/services Payment products/services
Asset management
Investment banking
Market confidence (negative externality, market power)
Consumer protection (information asimmetry, market
Industry reputation
power)
Public awareness (positive externality)
127
Ombudsman (draft)
Regulatory solutions have a concrete impact
Main Balance Sheet and Income
Statement items affected
Main policy choices
• “Which complaints are eligible”;
• “Maximum amount for a
complaint”;
• “Ombudsman as a first/appeal
court”;
• “Which cost each complain does
entail”;
• ??
Each item
impacting
on…
• ??
• ??
• ??
………………
………………
128
Ombudsman (draft)
Balance Sheet and Income Statement items affected
BALANCE SHEET
Assets
Customer Loans
Other Loans
Total Customer Loans
Problem Loans - memo
Other non-performing Loans
Total Problem Loans
Total Loans - Net
Other Earning Assets
Due from Other Banks
Other Securities
Investment Securities
Trading Securities
Total Securities
Equity Investments
Other Investments
Total Other Earning Assets
Non-Earning Assets
Cash and Due from Banks
Intangible Assets
Other Non Earning Assets
Total Non Earning Assets
Fixed Assets
Total Fixed Assets
INCOME STATEMENT
Liabilities
Deposits
Customer Deposits
Banks Deposits
Total Deposits
Interest Income
Interest Expense
Net Interest Revenue
Commision Income
Commision Expense
Net Commission Revenue
Net Trading Income
Other Operating Income
Total Operating Income
Personnel Expenses
Other Admin Expenses
Other Operating Expenses
Loan Loss Provisions
Other Provisions
Total Operating Expense
Non-Operating Income
Pre-Tax Profit
Taxes
Post Tax Profit
Money Market Funding
Other Negotiable Instruments
Total Money Market Funding
Other Funding
Other Bonds
Subordinated Debt
Other Funding
Total Other Funding
Loan Loss and Other Reserves
Other Non Equity Reserves
Total Loan Loss & Other Reserves
Other Liabilities
Other Liabilities
Total Liabilities
Equity Reserves
Retained Earnings
Other Equity Reserves
Minority Interests
Total Equity Reserves
Focus:
Capital
Tier 1 Capital Ratio
Total Capital Ratio
129
Ombudsman (draft)
Regulatory solutions have a concrete impact
Main Balance Sheet and Income
Statement items affected
Main policy choices
• “Which complaints are eligible”;
• “Maximum amount for a
complaint”;
• “Ombudsman as a first/appeal
court”;
• “Which cost each complain does
entail”;
• Interest expense;
Each item
impacting
on…
• Interest income;
• Customer deposits;
• Customer loans;
………………
………………
130
Ombudsman (draft)
Analytics - 1
2007
2008
2009
2010
2011
23,130
0.10%
23,130
0.20%
23,130
0.50%
23,130
0.70%
23,130
1.00%
23
46
116
162
231
iv)
v)=iii*iv
1.1
25
1.1
51
1.1
127
1.1
178
1.1
254
636
vi)
vii)=v*vi
7.3%
1.9
6.9%
3.5
6.5%
8.2
6.1%
10.8
5.7%
14.5
39
PV - New flow of loans as a result of new deposits from households
(Mln, RON)
24
44
104
135
181
488
PV - Net interest margin from new loans (Mln, RON)
2
3
7
8
10
30
5-years
Outstanding households deposits (Mln, RON)
Deposits inflow as a result of higher industry reputation due to
Bank Ombudsman (%)
Deposits inflow as a result of higher industry reputation due to
Bank Ombudsman (Mln, RON)
Loan/deposit multiplier for households
New flow of loans as a result of new deposits from households
(Mln, RON)
Net interest margin (%)
Net interest margin from new loans (Mln, RON)
i)
ii)
iii)=i*ii
Discount rate (%)
7.10%
Discount factor 0.9337068 0.871808 0.814013
0.76005 0.709664
131
Ombudsman (draft)
Analytics - 2
Data and assumptions:
a) Households
Deposits in lei (Mln, RON)
Demand deposits
Time deposits
Loans in lei (Mln, RON)
Consumer loans
Real-estate/mortgage
5,967
17,163
23,130
i)
29,190
7,539
36,729
ii)
1.59
Source: NBR, Financial Behaviour of Households and Companies , October 2006
b) Every RON deposited by households generates RON
1.6
c) To be more conservative, let the mutiplier be
1.1
d) net margin yielded by the banking industry for new funds
intermediated (%)
Source: NBR, Monthly Bullletin - Statistical section, 10/2006, p. 22
year
2007
2008
2009
2010
%
7.3%
6.9%
6.5%
6.1%
of loans (ii/i)
7.3%
2011
5.7%
e) Deposits inflow as a result of higher industry reputation due to Bank Ombudsman (%)
year
%
2007
0.10%
f) Banking Ombudsman budget
(Mln, EUR)
(Mln, RON)
2008
0.20%
2009
0.50%
2010
0.70%
2011
1.00%
0.25
0.88
Source: Convergence, Establishing a Bank Ombudsman in Romania , November 2006, Annex 8
132
Ombudsman (draft)
Economic impact assessment - 1
A
B
Outstanding households deposits (Mln, RON)
Deposits inflow as a result of higher industry
reputation due to Bank Ombudsman (%)
23,130
0.10%
Deposits inflow as a result of higher industry
C
reputation due to Bank Ombudsman (Mln, RON)
23
[A*B]
D
E
Loan/deposit multiplier for households
New flow of loans as a result of new deposits
from households (Mln, RON) [C*D]
1.1
25
133
Ombudsman (draft)
Economic impact assessment - 2
F
G
Net interest margin (%)
Annual lending increase as a result of higher
reputation from the Bank Ombudsman
establishment
1-year horizon: (Mln, RON)
5-year horizon: present value (Mln, RON)
H
I
7.3%
25
488
Net interest margin
1-year horizon: (Mln, RON)
1.9
5-year horizon: present value (Mln, RON)
30
Annual cost for a Bank Ombdusman (Mln, RON)
0.9
134
III. Concluding remarks
135
Impact assessment techniques are a suitable tool helping policymaking process towards better regulation;
RIA as a high value-adding instrument at disposal of SPI Project
Managers to run more effectively WGs;
Regulatory options discussed within each Project Working Group
can be appraised better in terms of concrete potential impacts on
Romania banking industry;
A RIA Working Group is active.
136


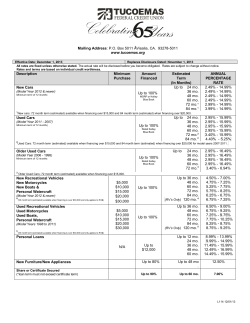
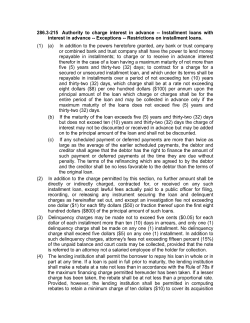


© Copyright 2026