
Renewable Energy as a Hedge Against Fuel Price Fluctuation
Renewable Energy as a Hedge
Against Fuel Price Fluctuation
How to Capture the Benefits
Commission for Environmental Cooperation
This background paper was written by Dan Lieberman and Siobhan Doherty from the Center for Resource Solutions
for the Secretariat of the Commission for Environmental Cooperation. The information contained herein does not
necessarily reflect the views of the governments of the CEC, or the governments of Canada, Mexico or the United
States of America.
Reproduction of this document in whole or in part and in any form for educational or non-profit purposes may be
made without special permission from the CEC Secretariat, provided acknowledgment of the source is made.
Except where otherwise noted, this work is protected under a Creative Commons Attribution-Noncommercial-No
Derivative Works License.
Commission for Environmental Cooperation, 2008
Publication Details
Publication type: Background paper
Publication date: September 2008
Original language: English
Review and quality assurance procedures:
First Party review: 21 December 2007–
18 January 2008
Second Party review: 8–22 May 2008
QA06.11
Un resumen ejecutivo está disponible en español
Un résumé est disponible en français
For more information:
Commission for Environmental Cooperation
393, rue St-Jacques ouest
Bureau 200
Montreal (Quebec) Canada H2Y 1N9
t 514.350.4300 f 514.350.4372
[email protected] / www.cec.org
Table of Contents
Executive Summary..........................................................................................................4
Introduction.......................................................................................................................5
I. The Problem of Pricing Volatility...................................................................................6
II. The Price Stability Benefits of Renewable Energy .....................................................17
Wind.....................................................................................................................20
Geothermal ..........................................................................................................21
Solar ....................................................................................................................21
Renewable Energy Certificates ...........................................................................23
Comparison to Fossil Fuels .................................................................................24
III. How Can the Price Stability Benefits be Conveyed to Customers? ..........................25
Utility and Energy Marketing Models.......................................................................25
Long-term Fixed Contracts with Non-residential Customers ...............................25
Adjustments to Monthly Bills................................................................................26
Contracts for Differences (CFD) ..........................................................................27
Fuel Switching from Fossil to Renewable Fuels ..................................................29
Customer Side of the Meter Models........................................................................29
On-site Solar Service Model ................................................................................29
On-site Generation ..............................................................................................29
Time-of-use Metering Combined with Solar Net Metering...................................30
Policy-Driven Models...............................................................................................31
Renewable Portfolio Standards ...........................................................................31
Integrated Resource Planning.................................................................................32
Public Benefit Funds............................................................................................35
IV. CASE STUDIES........................................................................................................37
CASE STUDY: California Renewable Portfolio Standard...............................................37
CASE STUDY: The Solar Services Model of SunEdison ...............................................38
CASE STUDY: Contract for Differences – City of Calgary, Alberta, Canada .................46
V. Program Recommendations/Conclusion...................................................................47
Additional Informational Resources................................................................................49
3
Executive Summary
In a time of fuel price fluctuation, the use of renewable energy may offer, along with
environmental benefits, greater stabilization of electricity costs. The pricing volatility of fossil
fuels, along with the difficulty of forecasting fossil fuel prices, puts energy customers and
providers at risk from fluctuating energy rates. As an alternative, this paper explores the potential
for renewable energy to serve as a financial “hedge,” reducing exposure to fuel price risk.
Renewable energy generation brings with it the price stability benefits of free-fuel generation
from emerging technologies such as solar, wind, small hydro, and geothermal sources.
Renewable energy costs tend to be stable or decreasing over time, compared to rising or
fluctuating costs for fossil fuel. With certain factors in place, it has been demonstrated that
renewable energy can be effectively priced at or below the cost of conventional sources.
.
As the paper presents, renewable energy can serve as a financial hedge in two key ways that
result in both public and private benefit:
• Since renewable energy resources (with the exception of biomass) do not require
purchased fuel, the operating costs over time are highly predictable, as opposed to fossil
fuel markets.
• Renewable energy reduces the demand for non-renewable resources, potentially easing
prices of fossil fuels.
The paper goes on to detail the practices through which renewable energy can provide hedging
solutions for utilities or other load-serving entities at the utility-scale, and can also provide price
stability benefits for retail customers who receive price-stable purchasing terms or install
renewables on-site. Utilities and electric service providers can tap into the price hedge value of
renewables by:
• Basing their evaluation of future natural gas prices not on forecasts but on forward prices.
• Including future regulatory risk as a factor when evaluating non-renewables.
• Including renewable energy in an integrated resources plan analysis or as a critical part of
the supply portfolio.
• Buying renewable energy or renewable energy certificates through Contracts for
Differences.
Individual electric customers can obtain the price stability benefits of renewable energy by:
• Installing on-site renewable energy generation.
• Buying renewables though a pricing structure that is based on the long-term price of the
renewable energy and is not tied to fossil fuel prices.
Section I of the paper presents various data points depicting the volatility and unpredictability in
electricity markets, primarily due to wildly fluctuating natural gas prices. The second section
describes the price stability benefits of free-fuel renewable energy resources. Section III ties
together the preceding sections by elaborating the concept of renewable energy serving as a
financial hedge. Finally, the last section further examines renewable energy’s price-stabilizing
potential through the following case studies: the California Renewable Portfolio Standard, the
Solar Services Model of SunEdison, Austin Energy’s Stable Rate Green Tariff, the Public
Service Company of Colorado 2003 Least-Cost Resource Plan, and the City of Calgary’s
Contract for Differences.
4
Introduction
Energy consumers – residential and non-residential alike – are concerned about the volatility of
energy prices. Enter the term “volatile energy prices” into the Google website and you receive
over a million hits. Similarly, public opinion polls show that energy users are in favor of
building more renewable resources. But how can individual energy customers and their
providers tap into this opportunity to encourage more renewables and provide greater stability to
their electricity prices? And how can regulators and policymakers encourage this to happen?
Those questions are addressed in this paper.
This paper demonstrates the benefits of renewable energy as a hedge against electricity market
fuel price fluctuation. The paper considers how regulators and electricity customers may address
this opportunity either as a socialized cost/benefit scenario (by including renewable energy in the
rate base), on an individual customer basis (through green pricing options that convey price
stability benefits, via on-site installation of renewable energy generation technology under
different business models, and through fuel switching), or through several approaches
simultaneously.
Throughout this paper, the term renewable energy generation refers to the “green” or “emerging
technologies” such as solar, wind, small hydro, and geothermal sources. The term “hedge” used
in this paper uses in the traditional generic meaning, referring to the activity of reducing the
exposure to price risk.
5
I. The Problem of Pricing Volatility
This section of the report provides an overview of available data demonstrating the effects of
fossil fuel price volatility on electricity markets and provides a forecast of future prices.1 It is
safe to say that all of North America is dependent upon fossil fuels, and that the pricing volatility
of these fuels puts energy customers and providers at risk from fluctuating energy rates.
In 2002, the United States’ energy consumption was supplied by 39 percent petroleum, 24
percent natural gas, and 23 percent coal.2 Similarly, electricity generation in the U.S. in 2005
was sourced by 49.7 percent coal and 18.7 percent natural gas.3 Therefore, even slight
fluctuations in the price of fossil fuels can have wide-reaching impacts.
In Mexico in 2004, 82 percent of electricity generation came from conventional thermal sources
(of the thermal feedstock, fuel oil represented 44 percent, natural gas represented 33 percent and
coal represented 12 percent), 10 percent came from hydroelectricity, 4 percent came from
nuclear power, and 4 percent came from other renewables. However, nearly all private
generators operate capacity fired by natural gas. As a result, the general trend in overall
feedstock consumption has seen a decline in petroleum-based fuels and a growth in natural gas
and coal.4
In Canada, 58 percent of electricity generation comes from hydroelectricity, followed by coal (19
percent), nuclear (12 percent), natural gas (6 percent), oil (3 percent), and other renewables (2
percent).5 Canada and the United States have an extensive electricity trade, and the electricity
networks of the two countries are heavily integrated.
The volatility of natural gas prices has made headlines in recent years. The build-up of natural
gas-fired power plants in the last twenty years has increased North America’s dependence on
natural gas. The combination of tight supplies, high demand, and unpredictable factors, such as
weather, results in widely varying price points for natural gas. As we witnessed last year, two
hurricanes in the Gulf Coast shut in (reduced available output) over 90 percent of offshore U.S.
gulf coast natural gas production, significantly affecting North American natural gas markets and
reducing production by 20 percent.6 Currently, about 19 percent of U.S. electricity generation is
fueled by natural gas – up from 14 percent just a decade ago.7 Dependence on natural gas – and
the volatility of natural gas prices – varies regionally and temporally, but on the whole is
increasing.
The following set of graphs depicts historical and forecast price data for natural gas and coal.
The first graph below shows average annual U.S. natural gas prices for the electricity sector for
1
Though many of the tables are using U.S. data, the purpose is illustrative with similar volatility effects in other
geographic areas dependent upon natural gas as a power plant fuel.
2
http://www.eia.doe.gov/cneaf/solar.renewables/page/rea_data/figh1.html
3
http://www.eia.doe.gov/fuelelectric.html
4
http://www.eia.doe.gov/emeu/cabs/Mexico/Full.html
5
http://www.canelect.ca/en/Pdfs/HandBook.pdf
6
http://www2.nrcan.gc.ca/es/erb/CMFiles/Final_Ex_Sum_ENGLISH206NZG-19012007-3845.pdf
7
http://www.eia.doe.gov/cneaf/electricity/epa/epat1p1.html
6
the past five years. Prices in 2002 began around $3 per thousand cubic feet, and then more than
doubled to $7 in a year’s time. Following a few years of relative stability, prices spiked again in
the winter of 2005/06 and then retreated.
Mexico Natural Gas Prices for Electricity Generation
http://www.eia.doe.gov/emeu/international/ngasprie.html
7
National data and time-aggregated data tend to present a smoother view of what is actually
happening in the market. Though the graph above, based on national averages and monthly price
points, still demonstrates considerable volatility, we present below a more localized and more
granular reporting frequency to demonstrate the actual marketplace volatility. The following
graph shows prices for the past year at Henry Hub in Louisiana, the pricing point for natural gas
futures contracts traded on the New York Mercantile Exchange (NYMEX).
Source: http://www.oilnergy.com/1gnymex.htm
When estimating the future price of natural gas, experts recommend referencing current
NYMEX futures prices. The graph below provides a number of forecasts including NYMEX. 8
An important implication is that government numbers are solely forecasts are made by
economists, while the NYMEX futures are financially binding contractual deals. In terms of
financial outcomes, there is a significant difference between the two, as the government can/will
revise a forecast while a NYMEX contract leaves one party financially liable for the term of the
contract. What is most telling about the graph is how divergent the forecasts are, showing the
unpredictability of future natural gas prices. Mark Bolinger and Ryan Wiser at Lawrence
Berkeley National Laboratory have done an excellent job of comparing the U.S. Department of
Energy’s Annual Energy Outlook price forecasts of natural gas prices to the actual forward
prices as found on NYMEX. Bolinger and Wiser expose the off-target government forecasts,
concluding that the Energy Information Administration (EIA) grossly over-projected the price of
gas in the late 1980s, and, conversely, has grossly under-projected the price of gas since the mid1990s. The latest annual summary can be found here:
http://eetd.lbl.gov/ea/emp/reports/53587_memo.pdf
8
http://eetd.lbl.gov/EA/EMP/reports/61580.pdf
8
Source: http://www.energy.ca.gov/2006publications/CEC-100-2006-001/CEC-100-2006-001-CMF.PDF
Prices for natural gas in Canada have faced similar trends of upward prices and volatility, though
slightly less so than in the United States due in part to a strong Canadian dollar, and also the
absence of severe weather-related disruptions as experienced in the southern United States. The
two key North American natural gas price hubs are the Intra-Alberta Market in Alberta (AECO)
and the Henry Hub in Louisiana (NYMEX). Gas purchased on NYMEX typically trades at a
$0.50 to $0.80/MMBtu premium relative to AECO.9
Mexico has adopted a policy of pricing natural gas based on the Houston price adjusted for
transport cost. This is an application of the Little-Mirrlees Rule and results in the market for gas
in Mexico having essentially the same character as the Houston market. Pemex behaves as a
price taker and inasmuch as Mexico is importing gas from the United States, the price of gas to
Mexican consumers reflects the marginal cost of transport to Mexico.10
Coal, despite its reputation as the stable workhorse of the electricity industry, has not been
immune to pricing volatility in recent years. While the national average price for coal may seem
to be relatively stable over time, that is not the case when coal prices are given a closer look.
9
http://www2.nrcan.gc.ca/es/erb/CMFiles/2005_Review_and_Outlook_English206PFM-02022007-2605.pdf
http://www.ksg.harvard.edu/m-rcbg/repsol_ypfksg_fellows/Papers/Rosellon/IMPLICATIONS%20OF%20THE%20ELASTICITY%20OF%20NATURAL%20GA
S%20.pdf
10
9
The graph below from Platts demonstrates worldwide coal price volatility, which was due to
China’s growing appetite for coal, weather events that limited transportation of coal, and
declining production in the U.S. 11
11
http://www.platts.com/Coal/Resources/News%20Features/coal_prices_2005/chart1.html
10
In addition to price volatility, coal also carries considerable regulatory risk. In May 2006,
Synapse Energy Economics conducted a review of the projections of 10 modeled analyses of
costs of federal CO2 emissions limits and found that while it is difficult to pinpoint exactly what
the future carbon-regulatory costs on coal will be, those future costs will certainly exist. 12
Finally, we have the two forecasted prices of coal, both displaying considerable upward
movement. The first graph displays actual coal futures prices over time, based on actual
settlement prices. The second is a graph of projected coal export prices.
2001-2005 Central Appalachian Coal Futures Daily
Price
7
0
6
0
5
0
4
$/to0
n
3
0
2
0
1
0
0
12
11/12/200
11/12/200
11/12/200
11/12/200
7/12/200
9/12/200
1/12/200
3/12/200
5/12/200
7/12/200
9/12/200
1/12/200
3/12/200
5/12/200
7/12/200
9/12/200
1/12/200
3/12/200
5/12/200
7/12/200
9/12/200
1/12/200
3/12/200
3
4
1
2
2
2
2
2
3
3
3
3
3
4
4
4
4
4
5
5
1
1
2
http://www.synapse-energy.com/Downloads/SynapsePaper.2006-06.Climate-Change-and-Power.pdf
11
Oil prices have not only seen wide price swings recently, but in decades past as well. However,
oil prices are not particularly instructive for this analysis since oil is not a major fuel source for
electricity generation in the United States and Canada. Most of the existing generating capacity
in Mexico is oil-fueled, but many of these power plants will be converted to utilize natural gas.13
History has shown that there is little relation between forecasts and actual prices. Forecasts
cannot take unforeseen events – such as war, change in government, hurricanes or the effects of
low precipitation on hydropower – into account. One report by the California Energy
Commission stated, “The best assumption about all forecasts for commodities as volatile as
natural gas is that they will be wrong.” 14 Synapse Energy Consulting proved this theory true and
put it in graphical form with its collection of gas price projections since 1975.15
13
http://www.cslforum.org/mexico.htm
http://www.energy.ca.gov/2006publications/CEC-100-2006-001/CEC-100-2006-001-CMF.PDF This document
also has nice graphs of natural gas price forecasts.
15
http://www.synapse-energy.com/Downloads/SynapsePresentation.2006-01.Forecasting-and-Using-Carbon-Pricesin-a-World-of-Uncertainty.pdf
14
12
This unpredictability bolsters arguments in favor of renewable energy. Not only is there
demonstrated volatility in fossil fuel markets, it is also coupled with a poor ability to forecast
future prices.
The final piece of the data puzzle to consider is the price of electricity. As with the previous
charts, the less granular the data, the less volatility is exposed. As an example, we present below
the average historical national price, California’s historical average price, then the historical
average price by utility in California. Moving from graph to graph you will see increasing
volatility, though these graphs cover overlapping time periods. Getting a finer level of
granularity is difficult since the contracts signed by electric utilities are typically not available to
the public.
13
14
It was well publicized that California wholesale electricity prices went from $35 MWh to $375
MWh during 2000.
Given the volatility depicted by the graphs of electricity prices presented above and the
inaccuracy of forecasting prices, we wonder how much faith should be put in the EIA’s
extremely stable electricity price forecast. Future natural gas prices are very difficult to predict
for any nation. In theory, prices for non-renewable resources would rise in real terms over time.
However, there are many mitigating factors. Technology improvements tend to reduce
production costs, increase the efficiency of gas-using equipment, reduce gas demand, and reduce
prices. Lower relative prices for other fuels may cause fuel switching away from natural gas,
causing lower gas demand and prices. Finally, new supply areas and sources, such as northern
Canada, liquefied natural gas, and coalbed methane, could increase supply thereby lowering
prices.”16 Any of the mitigating factors may be superseded by events such as extreme weather,
unexpected regulatory impacts, or acts of terror. Forecasts are made in a static environment, and
it is impossible to predict some events that will have a major affect on price.
16
http://www2.nrcan.gc.ca/es/erb/prb/english/View.asp?x=448#p12
15
Price volatility is a significant concern for electric utilities, their customers, and their
shareholders. Market volatility not only affects rates, but also increases the other risks utilities
face: transmission constraints, cost and availability of emissions allowances, blackout risk,
political risk of cost recovery, and the ability of customers to pay. Price volatility in wholesale
electricity markets can be handled in a variety of ways in terms of how electric utilities and their
regulators manage financial risk. Typically, electricity consumers face stable prices determined
by the administrative procedures of their state regulatory agency. Prices are set so as to
compensate the vertically integrated regulated utilities for investments they made, with
ratepayers, rather than shareholders, shouldering the risks. Price volatility and fluctuating
contract prices are typically handled in fuel adjustment clauses, which address the cost of fuel
risk. These allow utilities to recover increasing fuel expenses that occurred in a prior period.
Typically, these rate cases are based on retroactive assessments of the utility's portfolio, so these
are “hindsight” regulatory fixes, not prospective risk reduction strategies.
Some regions that have undergone deregulation have different means of handling volatility of
electricity markets, but those are the exception. In many cases, regulators adopt policies that
encourage greater price stability, such as encouraging long-term electricity contracts, price caps,
reducing dependence on spot markets, and encouraging fuel supply diversity. As this paper
demonstrates, renewable energy procurement is another tool in that toolbox.
16
II. The Price Stability Benefits of Renewable Energy
The increased reliance on natural gas has been concurrent with increased renewable energy
generation, which brings with it the price stability benefits of free-fuel generation from solar,
wind, hydro, and geothermal sources. This section of the report examines available data
demonstrating the price stability benefits of renewable energy. Renewable energy costs tend to
be stable or decreasing over time, compared to rising or fluctuating costs for fossil fuel. The
report presents below examples of levelized renewable energy generation costs by technology.
While this does not lend itself to a direct comparison of fuel prices as presented above, it is
important in illustrating the price stability of free-fuel renewables as compared to the volatile
pricing of fossil fuels. It is also important to note that the delivery characteristics of the
generation also affect price. For example, some technologies provide bulk power supply that
competes against wholesale electricity prices (e.g. geothermal) while others (e.g. solar PV)
usually compete against retail prices.
Energy consumers often ask the question “when will clean, renewable resources like solar and
wind power be cost-competitive with non-renewables like natural gas and coal?” Increasingly,
the answer to that question is “now.” The past few years have seen the arrival of a watershed
moment in electricity pricing, at least in some regions of the United States. Prices of renewable
energy sources can, in some regions and for some technologies, now be competitive with nonrenewable sources of electricity. While this cost-competitiveness is mostly limited to areas
where natural gas and electricity prices are high, where renewable resources are abundant, and
where renewable energy promotional policies are in place, it has been demonstrated that
renewable energy can be effectively priced at or below the cost of what otherwise would be
contracted.
The costs of electricity are based on a number of factors such as fuel prices, capital costs,
operations and maintenance requirements, siting issues, and permitting. Electricity prices are
further affected by supply/demand curves, subsidies, contract terms, and so on. As demonstrated
earlier in the report, since there are so many factors that affect costs and prices in electricity
markets, it is very difficult to simplify energy prices in an apples-to-apples price comparison of
various electricity sources. This section of the report provides the best publicly available pricing
points for renewable energy generating options, and discusses pricing trends of renewable energy
as compared to fossil fuels.
Our research found a few resources that have calculated the levelized costs of electricity from
various technologies and fuel sources. The California Energy Commission study gives a single
estimated pricing point per technology, while the World Bank study gives a price range. The
graph below was created from California Energy Commission data.
17
Source: California Energy Commission, 2003.
The World Bank report provides a wealth of data and condenses its analysis into the illustrative
figures below. 17 The figures show in cents per kWh the average levelized costs for various
renewable energy technologies. The first figure is for medium-sized systems and the second
figure is for larger utility-scale systems. The bars represent the sensitivity range (low to high)
with the point where the two colors meet representing the average.
17
http://web.worldbank.org/WBSITE/EXTERNAL/TOPICS/EXTENERGY/EXTRETOOLKIT/0,,contentMDK:2075
1106~menuPK:2069872~pagePK:64168445~piPK:64168309~theSitePK:1040428,00.html
18
19
Both the World Bank and California Energy Commission studies agree that of the various types
of emerging renewable energy, wind and geothermal are the most cost competitive with fossil
fuels for generating electricity. For illustrative purposes, we now take a closer look at cost data
for renewable energy applications in the United States. Though these numbers will be different
for Mexico and various Canadian provinces, they should follow similar patterns even though the
costs at different geographic locations may fall at different points on the cost curves.
Wind
According to the American Wind Energy Association, over the last 20 years, the cost of
electricity from utility-scale wind systems has dropped by more than 80 percent.18 The cost of
wind has risen in recent years from roughly $1100 per kW installed to perhaps $1800 - $1900
per kW. Most people attribute this higher cost to rising concrete and steel prices, but a recent
report by Ryan Wiser also suggests a weak dollar, a shortage of turbines, and a movement
18
http://www.awea.org/faq/wwt_costs.html
20
toward increased manufacturer profitability.19 In the early 1980s, when the first utility-scale
turbines were installed, wind-generated electricity cost as much as 30 cents per kilowatt-hour.
Now, state-of-the-art wind power plants can generate electricity for less than 5 cents/kWh with
the Production Tax Credit in many parts of the U.S., a price that is competitive with new coal- or
gas-fired power plants. The cost of wind energy varies widely depending upon the wind speed at
a given project site, and a large wind farm is more economical than a small one.
Geothermal20
Real levelized costs for geothermal electricity generation are 4.5-7 cents per kilowatt-hour.
Delivered costs depend on ownership arrangements, financing, transmission, the quality of the
resource, and the size of the project. Geothermal plants are built of modular parts, with most
projects including one or more 25-50 MW turbines. Geothermal plants are relatively capitalintensive, with low variable costs and no fuel costs. Usually, financing is structured so that the
project pays back its capital costs in the first 15 years, delivering power at 5-10¢/kWh. Costs
then fall by 50-70 percent, to cover only operations and maintenance for the remaining 15-30
years that the facility operates.
Solar
The website solarbuzz.com offers solar electricity benchmark price indices, comparing the
levelized costs of solar to average retail electricity prices. As of January 2007, they estimate the
levelized costs of PV as follows:
Size of system
System Cost
Sunny Climate
Cloudy Climate
price
price
Residential
2 kW
$17,838 37.30 cents kWh 82.05 cents kWh
Commercial
50 kW
$342,782 27.48 cents kWh 60.47 cents kWh
Industrial
500 kW
$2,485,098 21.42 cents kWh 47.12 cents kWh
These prices do not take rebate programs into account, but show that solar PV prices need to
drop considerably before becoming cost-competitive with fossil fueled generation. However, the
graph below shows that PV prices have been on the decline over the past two decades.
19
20
http://eetd.lbl.gov/ea/EMS/reports/ann-rpt-wind-06.pdf
source: http://www.rnp.org/RenewTech/tech_geo.html
21
Similarly, solar thermal technology prices have been on the decline, as shown in the graph
below.
One important trait of solar related to energy costs is that solar tends to be a peak generation
source. The power generation curve for solar PV fits well with the peak power demand curve.21
Therefore, each MWh of solar PV generation provides great social benefit in reducing marginal
demand when marginal prices are highest.
21
For example, see
http://www.state.mn.us/mn/externalDocs/Commerce/Relationship_between_solar_generation_and_electric_demand
_111003025625_Solarpaper11-03.pdf
22
Renewable Energy Certificates
Some may look to prices for Renewable Energy Certificates (RECs) as an indicator of the price
of renewable energy. Renewable Energy Certificates are often thought of as a tool to bridge the
price gap between renewables and fossil fuels. However, REC prices are influenced by a
number of factors such as the balance of supply and demand, penalties for non-compliance with
renewable portfolio standards, and whether or not the RECs are sold into voluntary or
compliance markets. The graph below summarizes the Monthly Market Updates for RECs
provided by the brokerage firm Evolution Markets. The graph shows the tremendous volatility,
regional price disparity, and illiquidity of REC markets.
Source: http://www.energy.ca.gov/2006publications/CEC‐100‐2006‐001/CEC‐100‐2006‐001‐CMF.PDF
The authors of this paper see a very important role for RECs in helping to finance new renewable
energy facilities, and for documenting compliance with Renewable Portfolio Standards, but do
not see REC prices as a meaningful indicator of renewable energy costs nor generally as a risk
mitigation tool unless a special contracting scheme is used to capture that value (e.g. a Contract
for Differences).
23
Comparison to Fossil Fuels
Perhaps the best proxy for the hedge value of renewable energy is the cost of securing natural
gas or coal supplies over time at a fixed price. The report “Power Price Stability: What’s it
Worth” concluded that the combined cost of meeting gas deliverability requirements through the
use of gas storage and of fixing future gas prices using options is $5.20 per megawatt hour as a
lower bound (i.e. actual cost would likely be higher), and estimated that $5.50/MWh represents a
proxy for the value of the physical hedge provided by renewables.
Some regions are so dependent on natural gas that natural gas prices become strongly correlated
with electricity prices. This is certainly the case in Texas. The Association of Electric
Companies of Texas reports that as the marginal fuel for electric generation in the Electric
Reliability Council of Texas (ERCOT) is natural gas, wholesale power prices are 98 percent
correlated with the price of natural gas.22
As presented earlier in the graphs of coal forward prices and price projections, coal prices are
also on an upward trend, making renewable energy investments look increasingly more attractive
to electricity providers and customers alike.
The point is often made that renewables, while price stable, are more expensive than
conventional power. Therefore, renewable power may be less volatile, but consistently more
expensive, than conventional power - resulting in a hedge that guarantees you always pay more.
In practice, this gap does not always exist and is quite geographically and/or temporally specific.
There are a number of case studies demonstrating how renewables are in some regions pricecompetitive with conventional power, and even Integrated Resource Plans that have identified
renewables as least-cost in all-source bidding (see the case study “ Public Service Company of
Colorado 2003 Least-Cost Resource Plan,” in this report). Moreover, as this report argues, there
are other monetizable values of renewables that may bridge the cost gap between renewables and
conventional sources in cases where renewables are "more expensive." Of course, there are
cases where renewables are clearly more expensive even when other values are considered. This
report is not suggesting that the hedge value of renewable energy will make renewables the best
financial deal in all cases.
22
http://www.aect.net/documents/2003/20030306_IP_WholesaleRising.pdf
24
III. How Can the Price Stability Benefits be Conveyed to Customers?
The first section of the report presented various data points that painted a landscape of volatility
and unpredictability in electricity markets, primarily due to wildly fluctuating natural gas prices.
The second section offered the price stability benefits of free-fuel renewable energy resources.
This section ties those two parts together by presenting conceptual ideas of how renewable
energy can provide a hedge. A number of practices are presented, and those are further
examined in case studies. In general, there are two key ways that renewable energy provides a
financial hedge:
1. Since renewable energy resources (with the exception of biomass) do not require
purchased fuel, the operating costs over time are highly predictable, as opposed to fossil
fuel markets.
2. Renewable energy reduces the demand for non-renewable resources, potentially easing
prices of fossil fuels.
The first point suggests an approach through which an energy supplier or even individual energy
consumer can privately benefit from the price stability of renewable energy. The second point
depicts the public benefits that renewable energy provides for all energy consumers. This
section of the report will cover both the individual and the socialized price stability benefits that
renewable energy provides.
Utility and Energy Marketing Models
Renewable energy can provide hedging solutions for utilities or other load serving entities at the
utility-scale, and can also provide price stability benefits for retail customers who receive pricestable purchasing terms or install renewables on their side of the meter. Several means of
tapping into the price stability benefits of renewables, both for electricity providers and their
customers, are explored below.
Long-term Fixed Contracts with Non-residential Customers
Long-term contracts are an increasingly attractive option for both providers and consumers.
Electric utilities and retail electricity providers can tap into their customers’ interest in price
stability and environmental protection by offering a renewable energy option at a fixed, longterm (5–10 year) price. The report by World Resources Institute’s Green Power Market
Development Group entitled “Developing Next Generation Green Power Products for Corporate
Markets in North America” explains in detail how this can be accomplished, and provides a case
study. 23 Our report also contains a case study of Austin Energy, the most successful proponent
of this approach.
Renewable energy projects often require a longer-term (>10 year) power purchase contract to
ensure reasonable financing terms because of their up-front capital intensity. Renewablegenerated electricity can therefore offer a longer-term hedge than many of the conventional
hedging strategies, which often focus on short-term markets. Even where long-term
23
http://pdf.wri.org/gpmdg_corporate_6.pdf
25
conventional hedges are available, these markets are often thinly traded so transaction costs
would be expected to increase, creating a higher benchmark against which a renewable power
hedge would be measured.
In contrast to gas-fired generation, long-term contracts for renewable energy are typically offered
on a fixed-price basis. To obtain a similar hedge with gas-fired generation (using gas forwards)
over the last four years, one would have to pay a substantial premium relative to the most
commonly used gas price forecasts in the USA. (Reference 1)
Some customers may choose to hedge only a portion of their electricity use. For example, a
company may have the alternative of selecting a supply option of 20 percent renewables and 80
percent system power. This arrangement may be palatable when renewables carry a small price
premium over the current cost of system power. The company may see a 20 percent hedge as an
attractive offering, since they may be concerned that system power costs will rise, and will be
willing to pay a small premium for renewables to diversify their energy portfolio and limit their
exposure to fossil fuel price increases. On the other hand, some companies may opt for a 100
percent renewable option even when the price per MWh is higher than for system power; they
may wish to make environmental claims and/or they may see the increased price stability and
certainty of their operating costs as being worth the price premium.
This product type also tends to work well for the utility/marketer and/or generator, because in the
signing of a long-term fixed price contract with the customer, they receive financial stability they
can take to the bank.
There have been some barriers in the United States to long-term contracting for renewable
energy. Some utilities may be resistant to sign because of their experience of signing PURPA
QF24 contracts with escalator clauses, only to experience a downturn in energy prices, leaving
utilities with stranded costs. Also, as demonstrated in the era leading to California’s energy
crisis, it is much more difficult to get long-term contracts in restructured or restructuring markets
because loads may shift to a competitor, or because regulators or legislators with anticompetitive concerns may discourage or prohibit utilities from entering into long-term contracts.
Adjustments to Monthly Bills
Some electric utilities that offer their customers a green pricing option have begun extending the
price-stability benefits of renewable energy to their customers by exempting those customers
from fuel adjustment clauses. When utilities apply fossil fuel rate increases, they may opt to
exempt their green pricing customers, thereby passing along the price stability benefits of
renewables to their renewable energy customers. This exemption may mean that the advertised
price of renewables is higher than the effective price, as the customer’s bill will include a zeroedout line for fossil fuel adjustments as well as a price premium for renewables. In other words,
when fuel prices increase, the effective green power premium falls. By bundling the hedge value
of renewable energy with a green power product offering, the hedge may provide additional
24
A Qualifying Facility (QF) is a generating facility, typically a small renewable energy facility, which meets the
requirements for QF status under the Public Utility Regulatory Policies Act of 1978.
26
value to a green power purchaser. With renewable energy products that offer benefits beyond
the traditional environmental sales pitch, customer demand for green power may increase.
A number of electric utilities in the United States offer this type of green pricing product,
including Alliant Energy, Clallam County PUD, Edmond Electric, Eugene Water and Electric
Board, Green Mountain Power, Holy Cross Energy, Madison Gas & Electric, OG&E Electric
Services, We Energies, and Xcel Energy. These are some of the most successful green pricing
programs in the United States, according to the National Renewable Energy Laboratory’s Green
Power Network.25
The utility green pricing examples cited above are all in regulated utility markets. The approach
described above may be impossible in restructured markets where the utility provides
transmission and distribution only and is not responsible for supply. In those cases, the
competitive electricity marketer may choose to offer a price-stable renewable energy option.
Contracts for Differences (CFD)
Contracts
for
differences,
like
long‐term
contracts,
can
provide
hedging
benefits
both
to
the
buyer
and
the
seller.
It
may
be
possible
to
finance
projects
in
the
absence
of
a
utility
Prospective
Purchaser
Agreement
(PPA)
if
large,
creditworthy
end‐users,
such
as
universities
or
government
agencies,
make
long‐term
commitments
(i.e.
10
years
or
more)
to
purchase
stand‐alone
RECs
or
RECs
bundled
with
energy.
For
example,
a
REC
contract
for
differences
would
provide
price
stability
to
the
buyer
and
revenue
security
to
the
seller.
While
it
provides
budgeting
certainty
for
the
end‐user,
most
are
uneasy
about
making
long‐
term
budget
commitments
for
energy.
A green CFD is a financial contract that allows a customer to support renewable energy
development, acquire RECs, and hedge against fluctuating electricity rates—but does not involve
the customer receiving physical power. 26 Rather, the contract sets up an exchange of payments
between a power consumer and a renewable generator that hinges upon an agreed price for
power.
The contract for differences is a purely financial product. Under this arrangement, the customer
continues to receive its electricity supply from the default service provider or from a traditional
energy services company (ESCO). The price of the supply would not be fixed. A separate,
financial CFD is signed with a renewable generator or intermediary. Under this contract, a fixed
hedge price is established (e.g. $0.05/kWh), also referred to as the strike price. The customer
would then pay the renewable supplier a floating premium for each kWh generated, which varies
depending on the difference between the fixed hedge price and a variable underlying index at the
time of production. If the variable index price is lower than the fixed hedge price, then the
customer will pay that difference to the renewable supplier. However, if the variable index price
exceeds the fixed hedge price, the renewable supplier would pay the customer. This
provides
a
benefit
to
both
parties—the
generator
gets
revenue
certainty,
while
the
buyer
gets
a
hedge
against
volatile
or
rising
electricity
prices,
as
well
as
the
RECs.
25
http://www.eere.energy.gov/greenpower/markets/pricing.shtml?page=3
26
See case study on the City of Calgary, Alberta, Canada later in this report.
27
Source: Robert C. Grace et. al.
http://www.mtpc.org/renewableenergy/public_policy/DG/resources/2005-05-16-AWEA-GraceWIndHedge.pdf
Such a CFD is a perfect hedge for a renewable generator if the generator sells the energy into the
same spot market to which the CFD is indexed. If renewable energy production is low (high) at
times when the index price exceeds (falls below) the fixed hedge price, however, this CFD will
provide a poor hedge for the customer. On the other hand, the customer will profit under this
CFD if the reverse is true. While a perfect full hedge for a customer is not possible, renewables
may provide an acceptable and attractive hedge if the prices faced by the generator and the
customer are positively correlated, and production and consumptions patterns are reasonably
well aligned.
Contracts for Differences is not an easy financial model for the layperson to comprehend. It is a
relatively new financial model for renewable energy applications and there are few retail
examples yet. Therefore, it may be a market-savvy model with limited application.
28
Fuel Switching from Fossil to Renewable Fuels
Fuel switching involves utilizing renewable fuels instead of fossil fuels when fuel prices reach a
tipping point. Renewable fuels are basically various types of biomass. This strategy can be used
by utilities or by commercial/industrial customers with on-site generation. For example, a
facility running diesel generators could fuel-switch to biodiesel when petroleum-diesel prices
reach a certain price point. Conversely, a facility may opt to use biomass fuel when biofuel
prices drop below a certain point – for example, following a storm when organic debris may be
in ample supply.
Customer Side of the Meter Models
Adjustment to monthly bills and on-site options are primarily retail customer solutions.
On-site Solar Service Model
Solar power has suffered for the last few decades from being “the next big thing” without ever
becoming widely adopted by consumers. While the cost of solar power has come down
tremendously in the last three decades, solar still makes up only a small fraction of a percent of
electricity consumed. 27 This is in large part due to solar’s large up-front capital costs, which
result in long payback periods for buyers.
A new approach to financing solar is beginning to remove solar’s front-loaded financial barriers,
while allowing the customer to capture the price-stability benefits that solar provides. This
model, pioneered by SunEdison (see case study on page 32) is known as “solar energy services.”
The traditional model of a solar installer is to sell and install the equipment and perhaps make
arrangements for financing. With the solar services business model, the vendor owns, installs,
operates and maintains the solar power plants at the customer’s facility, while the customer
benefits from predictable energy prices without paying high initial capital outlays. This also
simplifies the process for the customer, since SunEdison provides a turnkey service.
It is worth noting that in some cases solar service providers offer to peg solar electricity rates at a
level below retail. While that approach does signify savings for the customer it does not address
price volatility. Solar service providers want to offer customers a variety of pricing points to
meet individual customer needs, and some customers may prioritize comparative savings over
price stability.
On-site Generation
Generating renewable energy onsite, particularly solar, is an increasingly popular way for
customers to take control of their energy costs. With the costs of solar photovoltaic equipment
decreasing over time, coupled with rising electricity costs and low interest rates, on-site
generation is becoming more economical every year.
27
Solar power generated 534,000 MWhs in the U.S. in 2003 of 3,883,185,000 total generation, or 0. 01%.
29
Source: Solar Energy Industries Association, http://www.seia.org/images/learnmore/smalldoubling.gif
Wind power, hydropower, geothermal and biomass can also be suitable renewables for on-site
production but tend to be more site-specific. Since renewable energy sources (excluding
biomass) are fuel free, their costs are predictable. Every MWh generated on-site is one fewer
purchased from an electric supplier, whose rates may be based on volatile fossil fuels.
Companies whose operation creates suitable biofuels as a by-product, such as agriculture, water
treatment, and the pulp and paper sector, have ample opportunities to turn the waste stream into
an on-site fuel source. In some cases, this may reduce disposal fees while creating a stable
source of clean energy.
The distributed nature of onsite generation also provides public benefits. Distributed generation
can decrease transmission requirements, thereby increasing the reliability of the grid.
Time-of-use Metering Combined with Solar Net Metering
Many electric utilities now offer time-of-use rates as a way to encourage customers to reduce
their electricity consumption during peak hours. With time of use rates, a customer’s electric
rates will vary during the day (typically as “peak” and “offpeak”, though there may be more
gradations). Electricity used during peak hours will be more expensive than the standard rate,
while energy used off-peak will be less than the standard rate.
Net metering, for consumers with generators on their side of the meter, allows electricity to flow
in either direction through a bi-directional meter. When the customer's generation exceeds
his/her use, electricity from the customer’s facility flows into the utility’s distribution grid.
Operating a solar PV system with the combination of net-metering and time-of-use rates can be
an effective way to use renewable energy to reduce and stabilize energy cost because solar PV
typically generates at maximum capacity during peak pricing hours. Therefore, a customer may
be able to use PV to run the meter backwards during peak hours, generating credits with its
electric utility. When the sun is not shining, the customer is buying power from the utility and
the meter spins forward. The correlation between hours of sun and peak electricity prices is key
to achieving price stability with this model.
30
Policy-Driven Models
Renewable Portfolio Standards
Renewable Portfolio Standard (RPS) policies are aimed at increasing the contribution of
renewable energy in the electricity supply mix. Renewable Portfolio Standards typically require
that a certain percentage of a utility's overall or new generating capacity or energy sales must be
derived from renewable resources. The RPS is generally intended to create a stable and
predictable market for renewable electricity that maximizes the benefits of renewable generation
while minimizing costs.
About half of U.S. states have an RPS program, while three Canadian provinces have a
renewable energy mandate and seven provinces and three territories have ‘RPS-like’ energy
targets.28 When established, advocates for the law often include price stability as a key benefit.
Preliminary evaluations of RPS laws indicate that RPS programs have some price stabilizing
benefits. A recent report reviewed 28 distinct state- or utility- level RPS cost impact analyses
completed since 1998. 29 The survey found that renewable energy provides significant price
stability benefits by being a fuel-free energy source as well as reducing demand for fossil fuels,
which effectively lowers prices for fuels such as natural gas and coal. Specifically, the report
found that, in the year that each modeled RPS policy reaches its peak percentage target, basecase retail electricity rate increases of no greater than one percent were projected for 70 percent
of the 28 RPS cost studies. In six of those studies, electricity consumers were expected to
experience cost savings as a result of the RPS policies being modeled.
A recent study by Center for Resource Solutions of California found that that gas prices would
be reduced by an average of $0.02-0.06/MMBtu during the 2011-2020 timeframe (see the case
study at the end of this report for more detail), and other studies concur.30 A study of Virginia
assumes that each MWh of renewable generation will result in three dollars of consumer savings,
and a study of Maryland models two scenarios in which natural gas prices are assumed to fall by
2 percent and 4 percent relative to the reference case forecast – all as a result of implementing a
renewable portfolio standard. In fact, experts find that consumer natural gas bill savings are
sometimes projected to be large enough to eclipse the electricity bill impacts of some RPS
policies.31
Whether managing investments or energy supply, a diverse portfolio is desirable because
diversity reduces risk. Adding renewable resources to the electricity generation portfolio reduces
the risks posed by over-reliance on a single source of electricity and reduces costs when the costs
of producing electricity from nonrenewable sources are high.
28
“Fostering Green Power Markets: Opportunities for Growing the North American Green Power Market.”
Commission for Environmental Cooperation, 2006.
29
http://eetd.lbl.gov/EA/EMP/reports/61580.pdf
30
See Bolinger, Chen and Wiser. 2007.
31
See Bolinger, Chen and Wiser. 2007.
31
Integrated Resource Planning
Integrated resource planning (IRP) is a framework for utilities to identify the best (and in many
cases the cleanest) portfolio of electricity supplies at the lowest price over the timeframe of the
plan. IRP offers a way to compare a wide range of resource alternatives in a balanced manner.
Resource plans began as a way to identify the least cost sources of energy supply. However,
over time, some states have required consideration of social costs (i.e. environmental
externalities) and demand side measures to reduce load. Recently IRP has been used to conduct
more sophisticated risk assessment.
While resource plans differ from one utility to the next, most are structured according to the
following common basic framework:
1. Development of peak demand and load forecasts;
2. Assessment of how these forecasts compare to existing and committed generation
sources;
3. Identification and characterization of various resource options to fill a forecasted resource
need;
4. Analysis of different resource portfolios under base case and alternative future scenarios;
and
5. Selection of a preferred portfolio and creation of a near term action plan.32
In markets with retail electricity competition, resource planning is often referred to as portfolio
management.
Renewable energy resources were once barely considered in utility resource plans. However, a
number of recent western resource plans, including Avista, Idaho Power, NorthWestern Energy,
PacifiCorp, Portland General Electric, Public Service Company of Colorado, San Diego Gas and
Electric, and Puget Sound Energy include sizable renewable additions that are independent of
RPS obligations. 33 In aggregate, 3,380 MW of wind and 270 MW of other renewables not
required by an RPS are planned by western utilities. This change reflects the fact that renewable
resources and particularly wind power are increasingly found to be a useful contributor to lowcost, low-risk portfolios. It is also worth noting that many utilities in the United States are either
subject to, or expect to be subject to, a state and/or federal Renewable Portfolio Standard that
would require the utility to provide at least a specified minimum amount of renewable energy to
all customers, so there may be overlapping motivations for renewable energy development.
Utilities’ inclusion of renewable energy in resource plans is primarily motivated by:
1. Improved economies of wind power;
2. Growing acceptance of wind and other renewables by electric utilities; and
3. Increasing recognition of inherent risks in fossil-based generation portfolios (for
example, natural gas price risk and environmental compliance risk).
32
33
http://eetd.lbl.gov/ea/EMS/reports/58450-summary.pdf
See case study on Public Service of Colorado’s IRP later in this report.
32
Increasing the inclusion of renewable energy in integrated resource planning offers the
opportunity to reduce a utility’s exposure to certain electricity sector risks. As mentioned above,
renewable energy can act as a hedge against natural gas price risk and risk of future
environmental regulations, most notably carbon regulation. Those IRPs that have evaluated
natural gas and carbon risks are now regularly finding that wind power and other renewable
energy options are a beneficial contributor to a low-cost / low-risk portfolio. However, the
efficacy of including renewable energy in resource planning depends to a large extent on cost
and performance assumptions for renewable energy technologies, the treatment of risks and the
range of candidate portfolios considered.
If renewable resources are not accurately or adequately represented in utility portfolios, or if a
broad range of options is not considered, the outcome could be suboptimal. A review of western
resource plans found that most utilities constructed candidate resource portfolios by hand and
featured resources that passed initial cost or performance screening tests. This process may
allow human bias to influence the outcome. The review also found that, in many cases, a full
range of renewable energy technologies was not evaluated; rather, utilities limited their analysis
to wind and, in some cases, geothermal energy. In addition, the utilities limit the amount of
renewable energy additions in order to limit integration costs related to wind energy. The review
found that for utilities subject to an RPS, none of the plans reveal any analysis that looks at
whether renewable energy additions above and beyond the RPS would have financial merit.
Each of the utilities subject to an RPS essentially consider the RPS to be the sum total of their
planned renewable energy commitments, effectively capping planned renewable energy
additions at the RPS. This puts an artificial ceiling on the potential benefits of renewable energy.
Also important to consider are cost and performance assumptions made for various renewable
technologies including the total modeled cost of the renewable resource, transmission expansion
costs, integration costs and the impact of the production tax credit (PTC) on wind costs. Many
utilities calculate the PTC impact in a pre-tax rather than after-tax manner, thereby significantly
understating the true value of the PTC to most wind projects.
The treatment of risks may also affect the degree to which resource plans rely on renewable
energy versus more conventional sources of electricity production. Resource plans generally
evaluate the following risks:
1. Natural gas price uncertainty
2. Wholesale electricity price uncertainty
3. Variations in retail load and departing load (the latter being a particularly acute risk for
utilities in an RPS state where direct access is possible)
4. Hydropower output variability (i.e. drought)
5. Environmental regulatory risks
Short-term variability in gas prices can be mitigated with gas storage, fuel switching, and natural
gas hedge contracts (forwards, futures, swaps, and options). Hedging long-term natural gas price
risks is much more difficult. The most obvious approach to mitigating long-term natural gas
price risk is through ownership or purchase of electricity sources whose price is not tied to that
of natural gas (i.e. coal, nuclear, or renewable energy). As mentioned above, these sources
provide two hedge benefits:
33
1. By replacing variable-price gas-fired generation with fixed-price electricity production,
these sources directly reduce exposure to gas-price risk.
2. By reducing demand for natural gas, these sources may relieve gas supply pressures and
thereby reduce natural gas prices.
Renewable energy has the added benefit of reducing exposure to environmental regulatory risk,
which will be described below.
The treatment of “base case” gas prices and price uncertainty in the resource plans may have an
impact on the degree to which these plans rely on renewable energy. The higher the base case
forecast, and the more significant the expected price uncertainty, the more value a utility may
place on renewable energy.
There is a high degree of uncertainty in forecasting gas prices. Therefore, it is important that
resource plans evaluate different candidate resource portfolios under a wide range of natural gas
prices and scenarios. There are a wide variety of approaches to applying gas prices to candidate
portfolios. Few resource plans subject all candidate portfolios to stochastic gas prices; most only
apply prices to a subset of “finalist” candidate portfolios. This is important because the later in
the planning process this analysis is applied, the greater the potential for suboptimal results
because low-risk portfolios may be screened out based on cost prior to this analysis.
In Mexico, in compliance with the Ley del Servicio Público de Energía Eléctrica (LSPEE) Act’s
least cost principle, the Comisión Federal de Electricidad (CFE) would pay renewables for their
long-term avoided costs including the value of the long-term price stability.
Future environmental regulation is the second type of risk that can be reduced by increasing
renewable energy in resource planning. Laws and regulations governing the environmental
impacts of electricity are likely to change. Future requirements are likely to be more severe than
they are today. Traditional air pollutants (SOx, NOx, mercury, particulate matter) may be more
tightly regulated and new state or federal carbon regulations may be implemented.
Utility-owned fossil projects and long-term power purchase agreements may be subject to these
downside regulatory risks. However, renewable energy is likely to be unaffected. Purchasing or
owning renewable energy assets may reduce utility exposure to these environmental compliance
risks. Therefore, those utilities that consider seriously the risk of future environmental
regulations will prefer new renewable energy to new fossil generation, all other things equal.
Some states are requiring utilities to take this risk into account during resource planning.
Utilities operating in Oregon under the jurisdiction of the Oregon Public Utilities Commission
are required to consider the impact of a range of externality values on choice of portfolio.
California utilities are required to apply carbon adders in resource planning and bid evaluation
and to only allow purchases/investments in electricity generation that is at or below a specified
emission level.
The way in which utilities evaluate and balance expected costs and risk of candidate portfolios is
particularly important for renewable energy, which is generally characterized by low risk and
34
potentially higher initial costs. Utility regulators understand that a utility’s shareholders may
have a very different set of customer risk preferences than its customers. In particular, in cases
where fuel costs are automatically passed through to the customers in electricity rates, utility
shareholders may see little shareholder value in mitigating fuel price risk. Utilities should, but
rarely do, take into account customer preferences regarding cost-risk tradeoffs.
Public Benefit Funds
A public benefits fund (PBF, or “fund”) is a revenue stream most commonly financed through an
ongoing surcharge on consumer electric bills (e.g., a “green tariff”), but also occasionally
established through lump-sum cash transfers required by state legislation or regulatory
settlements. It is used to directly support projects and activities in the electricity sector that
provide important public benefits or overcome market barriers. Roughly half the states in the US
have established PBFs to promote investments in energy efficiency and/or renewable energy
technologies.
States have typically created renewable PBFs with a common goal in mind: to help protect,
preserve, and grow nascent renewable energy markets that might be in jeopardy as the electricity
industry is restructured. Accordingly, many of these funds were established in states as they
opened their electricity markets to retail competition. In some cases, state regulators have
authorized the creation of renewable PBFs (e.g., New York, Pennsylvania). PBFs have also
arisen from utility merger or environmental settlements (e.g., Illinois Clean Energy Community
Foundation, Xcel Energy’s Renewable Development Fund in Minnesota). An ancillary benefit
of these programs is that they provide cost-stabilizing new sources of renewable energy.
Do these programs provide substantial quantities of renewable energy? Review of current
practices seems to indicate that they do.
• The Energy Trust of Oregon (the non-profit administrator of Oregon’s PBF) has set a
goal to meet 10 percent of Oregon’s electricity load through renewable generation by
2012. This translates into support for 450 average MW of new renewable generation;
according to their annual report, the Energy Trust is nine percent of the way towards
meeting this goal.
•
The Massachusetts Technology Collaborative (the quasi-public administrator of
Massachusetts’ renewables PBF) has a goal of supporting the installation of 750-1000
MW of new renewable capacity by 2009. This goal overlaps considerably with the state’s
renewables portfolio standard that will require the construction of around 500 MW of
new renewable capacity by 2009 and shows the complementary role PBFs and RPS can
play.
•
New Jersey’s 2003 PBF annual report lists specific long-term goals of supporting 300
MW of new, in-state renewable capacity by 2008 and increasing in-state solar generation
to 120,000 MWh/year by 2008.
In the United States, PBFs were originally created as a relatively simple way to equitably collect
revenues to continue public benefits programs that might go unfunded in a restructured or
competitive electricity industry. However, partly due to their success and simplicity, PBFs are
35
now considered appropriate for either restructured or conventional utility systems. Although
renewable PBFs have been important to the commercialization of renewable energy technologies
in the United States, they are not a panacea for all barriers to renewable energy. While PBFs are
able to support small, distributed generation technologies (e.g., rooftop PV), modest funding
levels and an inability to offer power purchase agreements will limit the ability of PBFs to
support large, utility-scale projects (e.g., wind farms). Therefore, PBFs should be deployed in
combination with, rather than in lieu of, other policy approaches. Many states with both a
renewable PBF and an RPS are finding that the two complement, rather than compete with, each
other. In this way, PBFs can be an important element in a portfolio of policy approaches
deployed to bring renewables into the mainstream.
Regarding the "potency" of the hedge value of renewables, it is important to state the assumption
that the hedge value of renewable energy is only as effective as it is pervasive. A few solar
panels on a skyscraper or even a few percent of utility supply from a renewable source is not
going to work financial wonders for customers because the consumers will continue to be
exposed to volatile fossil fuel prices for the vast majority of their needs. This point is not a
criticism of the hedge value of renewables, it is just a reminder that scale is an important factor
in delivering benefits.
36
IV. CASE STUDIES
CASE STUDY: California Renewable Portfolio Standard
California’s RPS, enacted in 2002, is one of the most aggressive in the world. Originally,
California’s RPS required retail sellers of electricity to purchase 20 percent of their electricity
from renewable resources by 2017. California subsequently accelerated this goal of 20 percent
renewables to 2010, and set the state's 2020 goal at 33 percent. The California Renewable
Portfolio Standard, along with other California policies and regulations on the electricity sector,
provides California energy consumers with an increasing amount of price-stable and low-risk
electricity, reducing California’s dependence on natural gas and coal.
One analysis of the California RPS found that under a 33 percent RPS, gas prices would be
reduced by an average of $0.02-0.06/MMBtu during the 2011-2020 time period.34 A study by the
Union of Concerned Scientists concluded that if average annual natural gas prices are $4 per
million Btu through 2010, the original 20 percent California RPS would save consumers money,
an amount reaching $918 million (in $2001) by 2010. 35 With natural gas prices of $5 per million
Btu, the RPS would reduce consumers' bills even more, with an overall savings of $1.8 billion
($2001) by 2010.
One issue that was subject to much debate during the crafting of California’s RPS rules was
whether or not renewable energy certificates (RECs) from facilities outside California would be
eligible, particularly if the RECs were unbundled from the underlying electricity. Unbundled
RECs would reduce transmission costs by relieving the need to wheel power into the state, but
would not convey the price stability benefits to California electricity customers. The state
resolved to allow only RECs that are bundled with electricity that is imported into the state.
While this may increase cost per MWh for Californians, it also will provide greater cost stability
insurance.
34
http://www.resource-solutions.org/lib/librarypdfs/Achieving_33_Percent_RPS_Report.pdf
http://www.ucsusa.org/clean_energy/clean_energy_policies/powering-ahead-a-new-standard-for-clean-energyand-stable-prices-in-california.html
35
37
CASE STUDY: The Solar Services Model of SunEdison
Jigar Shah, CEO of SunEdison, describes SunEdison’s approach to meeting commercial
customer needs:
None of them want to own a power plant - it’s just not core to their business. But they
want solar power to lower energy costs through predictable pricing, and to improve the
state of their environment. They want a solution with little or no disruption to their
existing business.36
SunPower installs large commercial PV systems, with a customer list that includes Whole Foods,
Macy’s and Staples. Shah describes the price hedge benefits of SunEdison’s contract with
Whole Foods:
We offered a contract that locked in electricity rates for 10 to twenty years. That removes
volatility from their utility bills and provides a hedge against increasing rates in the
electricity market. So that’s a strong business rationale. There is literally no other
solution on the market where you can lock in part of your electric utility costs for that
length of time.
In 2004, Staples signed contracts for two 280 kW on-site solar PV projects at two of its
distribution centers in California, covering about 10 percent of the facilities’ loads. Staples
signed a ten-year, fixed-price power purchase agreement (PPA) with SunEdison, with the option
to renew in five-year intervals. The solar services model provides Staples with several benefits.
The PV systems reduce the amount of power Staples buys from its retail electricity provider
during the peak (and most expensive) hours of the day. They reduce the company’s greenhouse
gas emissions, helping Staples to meet one of its major environmental goals. The negotiated
price for power is competitive with market rates, and the fixed price provides a hedge against
retail electricity price increases. Furthermore, Staples avoids capital expenditures and
maintenance costs for the PV system.37
Through the use of the solar services model, SunEdison provides customers with a no-hassle,
fixed-price, long-term contract for solar power that can be cost-competitive with the customer’s
electric utility.
36
http://marketinggreen.wordpress.com/tag/business-model/
Information regarding the Staples contract with SunEdison excerpted from
http://www.thegreenpowergroup.org/pdf/case_studies_Staples_2.pdf
37
38
CASE STUDY: Austin Energy’s Stable Rate Green Tariff
Austin Energy, a regulated municipal utility serving Austin, Texas, has one of the most
successful Green Pricing programs, supporting more new renewables than any other utility
program in the US. The National Renewable Energy Laboratory ranked it number one in sales in
2002, 2003, 2004, and 2005. Austin Energy launched the nation’s first long-term (ten-year)
fixed-price green power product for both commercial and residential customers in 2000. In
designing the product, called GreenChoice®, Austin Energy locked in its own long-term fixedprice contracts for wholesale power from a variety of renewable energy projects. The price for
that electricity will remain the same for the life of those contracts, allowing GreenChoice
customers a way to hedge against fossil fuel price volatility.
Participants in the GreenChoice program see the electric bill standard fuel charge (currently 2.80
cents per kWh, but it is subject to fuel adjustment) replaced by a GreenChoice charge of 3.30
cents per kWh of electricity used. This replacement means that customers typically pay about
one-half cent more per kWh to help support the renewable energy power provided by
GreenChoice. The flat green rate provides customers with a price hedge against volatile fossil
fuel prices. While fossil fuel prices are unstable, GreenChoice is offered at a fixed rate.
GreenChoice® is approximately 80 percent wind, 18 percent landfill gas, and two percent small
hydropower, all of which is generated in Texas. An Austin Energy electric bill typically includes
four different charges: fossil fuel, energy (overhead and transmission), peak demand, and taxes.
The fossil fuel charge is typically variable. In the past, Austin Energy adjusted the fuel charge
about once per year to reflect fossil fuel costs, but these adjustments became more frequent
starting in 2000 with the volatility of natural gas prices. In the past four years, Austin Energy
has had to increase its fuel charge several times in relatively short intervals. With the
GreenChoice® product, though, the normal fossil fuel charge is replaced by a “green power
charge” proportional to the amount of renewable energy that a customer chooses to buy.
39
The GreenChoice program was authorized by the Austin city council in 1999 and the program
was launched in 2000. The initial rate was set at 1.7 cents per kilowatt hour. This rate fully
recovered the costs of the original green power sources and was subsidized up to $1 million. Ten
months after launching its program, Austin Energy had fully subscribed its initial 40 MW of new
renewable supply and had to contract for additional
renewable supply. Austin’s second offering was
not subsidized and was priced at 2.85 cents per
kWh. This represented the contract price for the
wind and did not include congestion or ancillary
service costs, which were not anticipated. At the
end of 2003, Austin Energy increased the green
power rate to 3.3 cents per kilowatt hour. This new
rate covered the wind contract price, congestion
costs and ancillary services costs. The new rate
applies to new program subscribers only; current
subscribers continue to pay the lower green power
rates established in earlier phases of the program.At the same time, standard fuel charge rates
were changing as well, making the difference between standard service and green pricing larger
or smaller (See Table 1). At one point, the price of their renewable energy product was lower
then the price of their default service, creating a "negative premium" for green power customers.
Austin Energy offered two batches of green power, each available in April 2001 but at different
prices. The green power charge for Batch 1, which was subsidized by the City of Austin, was 1.7
cents/kWh. Batch 1 totaled 100,000 MWh/year and was fully subscribed six months prior to
actual availability. Batch 2 totaled 260,000 MWh/year with a green power charge of 2.85
cents/kWh. Batch 2 was fully subscribed by January 2004, at which time Austin Energy began
offering a third batch of green power.
In contrast to the fixed green power charges, Austin Energy’s fossil fuel charges have ranged
between 1.3 and 2.8 cents/kWh (Figure 3). These fluctuations generally follow changes in the
price for natural gas, which is widely used in Texas for electricity generation and other industrial
purposes. Austin Energy, in particular, uses natural gas for 30 percent of its power generation.
As the fossil fuel charge rises above 1.7 cents/kWh, customers that signed up for Batch 1 green
power pay less for renewable energy than they would for conventional energy. Even without the
government subsidy, Batch 2 green power sells at near parity with conventional power and may
be less expensive in later years depending on changes in natural gas prices.
The experience of IBM illustrates the hedge value of GreenChoice®. In March 2001, IBM
signed a five-year contract for 5.25 million kWh per year from Batch 1. At the time, the
company predicted that the green power would actually cost a premium of $30,000 per year, but
opted for the purchase anyway due to three leading factors. First, the fixed-price nature of the
contract provided a hedge in the face of unpredictable energy markets and IBM believed that the
contract would pay off eventually. Second, the cost stability provided by the contract made it
easier for the company to manage its energy budget. Third, buying green power was an
opportunity for the company to reduce the greenhouse gas emissions associated with its business
operations.
40
Austin Energy’s fuel charge for conventional power spiked in 2001 and IBM saved $20,000 in
its first year in the program. During 2002 and 2003, GreenChoice® cost slightly less than
conventional power. The fossil fuel charge rose again in 2004 and IBM saved over $60,000 for
the year. Given the business benefits it provides, GreenChoice® quickly has become the nation’s
largest green power program among regulated utilities, and is almost double the size of the
second-largest program in terms of MWh sold per year. However, the Austin Energy approach
has not yet been widely replicated. Only a handful of utilities in the U.S. have developed green
electricity programs that protect customers from some variable charges. To build successful
green pricing programs and meet the interests of commercial and industrial energy buyers,
utilities should review the Austin Energy experience and consider approaches to integrating
green power hedge value into their offerings.
Some information taken from Aulisi and Hanson. “Developing Next Generation Green Power
Products for Corporate Markets in North America”. http://pdf.wri.org/gpmdg_corporate_6.pdf
41
CASE STUDY: Public Service Company of Colorado 2003 Least-Cost Resource Plan
The 2003 Public Service Company of Colorado Least Cost Resource Plan is distinct from other
integrated resource plans in several ways. First, the plan called for building 500 MW of new
wind generation by the end of 2006. This plan was created before the Colorado Amendment 37,
requiring a certain percentage of resources to come from renewable energy, was passed or put
into effect. The inclusion of renewable energy was based on the value of including renewable
energy within the PSCo portfolio. Secondly, while most utilities construct candidate portfolios
by hand featuring resources that are regionally available and pass initial cost or performance
screening tests, PSCo used a capacity expansion model to determine the combination of
resources that would best meet their needs. Lastly, PSCo included the possible risk of
increasingly stringent future regulations regarding sulphur dioxide, nitrogen oxides and mercury,
a rare inclusion among IRPs.
The PSCo Least Cost Resource Plan was filed with the Colorado Public Utilities Commission on
April 30, 2004. It included a planning horizon from 2003 through 2033 and an acquisition
period of 2003 – 2013. The plan called for the utility to develop or acquire 3600 MW of electric
generating power by 2013 to replace expiring contracts or meet additional demand. Eighty
percent of this new generating capacity was to be competitively bid. The capacity was broken
out as follows:
1. 500 MW of renewable energy, primarily from wind power;
2. Development of a 750 MW coal fired plant, of which Xcel was to own 500 MW; and
3. An all-source bid process to secure 2600 MW of new capacity from natural gas, other
fossil fuel-fired generation, additional renewable energy, or demand reduction.
While most utility resource plans feature resources that pass an initial cost or performance
screening test, the Public Service Company of Colorado 2003 Least-Cost Resource Plan utilized
a capacity expansion model from the start to construct an optimal portfolio. Under this model,
no candidate portfolios were developed. Instead, for each scenario examined, a capacity
expansion model optimized a single portfolio based on user-defined market conditions and
constraints. PSCo then imposed constraints on each of the potential new resources that it
modeled due to the computational challenges of modeling hundreds of thousands of possible
resource combinations available. PSCo limited the maximum amount of wind power that could
be added in any year to 320 MW (modeled as four 80 MW projects), with a cumulative cap of
2000 MW over the thirty-year planning horizon. The model allowed two of the four candidate
wind projects to be added even if not needed for capacity purposes, as long as the inclusion of
such projects resulted in energy savings.
PSCo’s initial plan ran a capacity expansion model under four different gas price scenarios - $3,
$4, $5, and $6/MMBtu gas (2003$).38 PSCo presents numerous optimal portfolios that vary
depending upon assumptions about future market conditions and natural gas prices. Over the
ten-year resource acquisition period (from 2003-2013), optimal wind power additions ranged
from 240-1120 MW at an assumed $3/MMBtu real gas price, from 240-1440 MW at $4/MMBtu
38
For price context, Henry Hub prices on Wednesday, January 31 2007 (the time of this draft) averaged $7.75 per
MMBtu.
42
gas, from 640-1440 MW at $5/MMBtu, and from 1040-1440 MW at $6/MMBtu gas. Noting a
degree of discomfort (in terms of reliability concerns and integration costs) with the amount of
wind capacity called for at the upper limit of these ranges, PSCo imposed exogenous constraints
on the model to make the optimization more tractable. These constraints play a significant role
in determining the outcome of the modeling exercise. Ultimately, the utility chose to move
forward with a solicitation for 500 MW of wind projects able to come on-line before the end of
2006. If acquired, the 500 MW, along with 222 MW of existing wind capacity, would increase
wind’s penetration on PSCo’s system to about 11 percent of peak load.
As mentioned above, the cost and performance assumptions for renewable energy included in
planning models will have a significant effect on whether or not renewable resources are
developed. Costs can be divided into direct and indirect. Direct costs include busbar costs,
which are defined to be the cost of wind power at interconnection, including levelized capital
costs and operations and maintenance expenditures, as well as the value of the production tax
credit. PSCo’s levelized capital and O&M costs seem to be towards the higher end of the range.
The value that utilities place on the federal production tax credit (PTC) can have a significant
effect on how renewables are treated in IRPs. While it appears that many utilities have
understated the value of the PTC by accounting for it in a pre-tax rather than after-tax manner,
PSCo explicitly modeled this part correctly. In its initial IRP filing, it simply assumed a busbar
cost for wind that was inclusive of the PTC (rather than breaking the PTC out). However, in its
settlement with stakeholders, PSCo calculated the cost of additional wind capacity assumed not
to benefit from the PTC by starting with the PTC inclusive busbar cost and backing out the value
of the PTC yielding an equivalent “no-PTC” busbar cost. Unfortunately, PSCo overvalued the
PTC in this calculation, which led to a “no-PTC” busbar cost that was too high relative to the
PTC-inclusive cost, thereby hurting wind’s competitiveness in this analysis.
Indirect costs include transmission and integration costs. The PSCo plan anticipates that wind
will be developed within its own control area and does not reflect any transmission costs. Wind
integration costs represent the impact of incorporating, as available, wind power into the grid.
PSCo estimates integration costs as $2.50/MWh for the first 480 MW at nine percent of peak
load wind penetration and $7/MWh for the next 320 MW at 14 percent of peak load wind
penetration. The initial $2.5/MWh cost estimate was based on an average of literature review.
In settlement with stakeholders, the cost increased for the next 320 MW based on an assumption
that costs will increase with higher levels of penetration.
The most rigorous method for determining a project’s contribution to meeting capacity needs is
effective load carrying capacity (ELCC). PSCo did not use ELCC to determine capacity in its
2003 LCP; instead, it used a method adopted by the Mid-Continent Area Power Pool (MAPP) to
assign a 10 percent capacity credit to wind in Colorado. The period of interest is the peak hour
plus three contiguous hours during the peak month of the year, and the median hourly wind
output during this period sets the capacity value. It appears that this value may have been on the
low side.
In determining the risk posed by future environmental regulation, PSCo considers the possibility
of both carbon regulation and regulation for other pollutants. This seems to be rare in most IRPs,
in that many utilities look at carbon regulation only and ignore potential future regulation for
43
other pollutants. For its initial IRP, PSCo assumes a cap and trade with a cap year of 2000, a
start year of 2009, and three scenarios with $0/ton, $5/ton, and $9.9/ton with no probability
weighting for any scenarios. The PSCo settlement plan assumes cap and trade, with cap year of
2000, a start year of 2009, and a base case model with 100 percent probability at $7.20/ton.
PSCo considers the possibility of increasingly stringent future regulation of criteria pollutants
(SOx, NOx, mercury, particulate matter) in its original resource plan. Assumed cost of
complying = SO2: $796/ton (levelized 2003 $/ton); NOx: $796/ton; and Mercury: $9,954/ton.
Resource Acquisition Process
In February 2004, Xcel Energy announced the construction of a new 750 MW coal-fired
generating unit at an existing facility, Comanche Station in Pueblo Park. In April 2004, PSCo
filed the 2003 Least Cost Resource Plan. The Colorado Public Utilities Commission (CPUC)
consolidated review of the Comanche coal plant with the Least Cost Planning (LCP) and wind
power plant review. In August 2004, the CPUC approved the RFP process for the 500 MW of
renewable energy. PSCo requested an accelerated decision on the renewable energy in order to
be able to take advantage of the federal production tax credit. Once the RFP process was
approved, PSCo issued an RFP for up to 500 MW of wind to be on-line by the end of 2006.
When the PTC was extended only to the end of 2005, PSCo accelerated the projects to come online by the end of 2005. They short-listed three projects totaling 400 MW of new wind
generation, but in late March 2005 signed contracts with only two projects, totaling 129 MW.
During the review process for the LCP and Comanche station plant, 28 organizations, agencies,
and other groups intervened in the consolidated hearings. The CPUC held three weeks of public
hearings on the LCP in November 2004. On December 17, 2004, the Colorado Public Utilities
Commission approved an all-inclusive settlement agreement regarding the Least-cost Resource
Plan. The settlement agreement was endorsed by a variety of parties, including the CPUC staff,
Colorado Office of Consumer Council. Southwestern Energy Efficiency Project, Sierra Club,
Environmental Defense, Western Resource Advocates, Tri-State Generation and Transmission
Association, and others. Under the settlement, PSCo would move forward with the building of
the new Comanche plant, but would install state-of the art emissions reduction equipment on all
generating units at the Comanche Generating Station, reducing total sulfur dioxide and nitrogen
oxide emissions at the station despite increasing total production. The company would also
expand energy conservation programs by undertaking best efforts to acquire 320 MW of total
demand reduction over 10 years, accelerate a feasibility study of additional renewable energy
resources, work with environmental organizations to identify programs to reduce GHG
emissions, provide donations to local Pueblo community to reduce diesel bus emissions from
school districts, fund mercury reduction efforts at a local steel mill, and participate in Pueblo
sustainable economic development discussions.
In late February 2005, PSCo issued an all-source RFP for 2500 MW from dispatchable, nondispatchable and demand-side resources. Renewable energy is eligible to compete in this
solicitation. In December 2005, PSCo announced intent to acquire 775 MW of additional wind
generation to be in service by the end of 2007, 1300 MW of existing and new natural gas
generation to be in service between 2007 and 2012 and 30 MW of energy efficiency and
conservation from third parties. Xcel committed to spend $196 million to achieve 320 MW of
44
energy efficiency and conservation through 2013 with third party or company-sponsored
programs.
If the proposed wind energy projects are successful, Xcel Energy would become the largest
provider of wind energy to customers in the U.S. and would also meet non-solar Amendment 37
requirements for 2015 – seven years early.
As of October 2006:
°
°
°
°
Construction continues on the 750 MW Comanche 3 coal-fired generation unit.
The All-Source RFP Bid Evaluation process for 2007-2012 is complete. PSCo has executed
power purchase contracts for three wind facilities totaling 775 MW and five gas-fired
facilities totaling 1300 MW. Therefore, PSCo has completed contracts for resource additions
to meet customers’ forecasted electricity demand through 2012.
Continuing evaluation and negotiation of bids offered for 2013.
Negotiating contracts for a 3.2 MW LFG facility and a 0.22 MW hydro facility.
45
CASE STUDY: Contract for Differences – City of Calgary, Alberta,
Canada
The concept of green Contracts for Differences (CFD) has been put into practice in Alberta,
where wind- and biomass-based CFDs have been structured in the wake of market deregulation.
Wholesale electricity market restructuring began in Alberta in 1996. In 2000, power prices
spiked, at one point reaching a 500 percent increase over prices at the start of the year. Price
volatility was hitting power markets throughout western North America due to a combination of
factors, including the California electricity crisis, natural gas price increases, capacity and
transmission issues, and gaming by market participants. As Alberta moved to full deregulation
for both wholesale and retail markets in January 2001, energy buyers understood the value of
hedging against electricity price volatility.
In September 2001, Calgary Transit of the City of Calgary began a 10-year green CFD based on
wind power. The wind generator is VisionQuest, a division of the TransAlta power company. In
addition, the retail power supplier, ENMAX, serves as an intermediary owing to its existing
customer relationship, although it has no risk exposure in the contract. Calgary Transit partnered
with VisionQuest to develop “Ride the Wind!,” a program that uses wind-generated electricity to
power its commuter CTrains.
There are 12 windmills located in southern Alberta that generate the wind power. The amount of
power equivalent to that used by the CTrain is sent to the main power grid. The CFD covers a
load of 26,000 MWh per year and is indexed to Alberta’s spot electricity market (there is only
one spot market in the province). The strike price for the contract is in the range of 7 cents
Canadian per kWh. Since contract inception, the spot price for power has fluctuated above and
below the strike price, meaning both parties have made and received payments.
Although the CTrain itself does not produce CO2 emissions, the supply of electricity used
originally for CTrain traction power was supplied by coal- or natural gas-powered facilities that
do produce greenhouse gases. Using wind-generated power, CTrain has been able to reduce CO2
emissions by 26,000 tonnes annually. As the CTrain lines are extended, the savings in emissions
will also increase. It is expected that the "Ride the Wind!" program will increase power costs by
less than one-half of one cent per passenger.
Since the implementation of the “Ride the Wind!” initiative in 2001, Calgary Transit has been
the proud winner of two prestigious awards. In 2001, it won a Federation of Canadian
Municipalities CH2M HILL Sustainable Community Award for its leadership in renewable
energy. Calgary Transit was also the recipient of a 2001 Pollution Prevention Award in the
innovations category, presented by the Canadian Council of Ministers of the Environment, and a
2004 Corporate Recognition Award from the Canadian Urban Transit Association (CUTA).
The CTrain is now 100 percent emissions free. It is the first public light rail transit system in
North America to power its train fleet with wind-generated electricity39.
39
Some information sourced from Calgary Transit web site,
http://www.calgarytransit.com/environment/ride_d_wind.html
46
V. Program Recommendations/Conclusion
Renewable energy is best known to the public for its environmental benefits. However, fossil
fuel price increases in recent years have drawn attention to renewable energy as a pricestabilizing technology. Following is a summary of key points on why renewable energy is a
price hedge, and how electricity providers and their customers can tap into that hedge benefit.
•
Fossil fuels have experienced, and continue to experience, unpredictable and volatile
prices. In order to lock into long-term, fixed-price contracts for fossil fuels, a
considerable premium must be added to the supply contract.
•
Renewable energy is mainly sourced from free fuels such as wind, sunshine, waterways,
and geothermal sources.
•
There is little correlation between forecast and actual prices. The problem is such that we
have both high volatility and little ability to forecast.
•
Coal prices have been easier to accurately forecast, but coal is associated with major
environmental and regulatory risks. It is difficult to predict how coal could be
constrained by potential greenhouse gas regulations or how this could affect prices.
•
Utilities and electric service providers can tap into the price hedge value of renewables
by:
o Basing their evaluation of future natural gas prices not on forecasts but on actual
forward prices.
o Including future regulatory risk as a factor when evaluating non-renewables.
o Including renewable energy in IRP resource plan analysis or as a critical part of
the supply portfolio.
o Buying renewable energy or renewable energy certificates (RECs) through
Contracts for Differences.
•
Individual electric customers can obtain the price stability benefits of renewable energy
by:
o Installing on-site renewable energy generation.
o Buying renewables though a pricing structure that is based on the long-term price
of the renewable energy (and is not pegged to fossil fuel prices).
Renewable energy is already making a difference in providing price stability benefits, not only
for renewable energy consumers, but for all energy consumers. According to the American
Wind Energy Association, by the end of 2006 wind energy use will save over 0.5 billion cubic
feet (Bcf) of natural gas each day, relieving some of the current supply shortages.40 As fossil
40
http://www.awea.org/pubs/factsheets/EconomicsOfWind-Feb2005.pdf
47
fuel prices appear to be on a continued upward price trend, and as price spikes have been the
norm in the industry, we expect renewable energy to be an increasingly attractive option for
utilities and individual electricity consumers.
48
Additional Informational Resources
Aulisi, Andrew and Craig Hanson. “Developing Next Generation Green Power Products for
Corporate Markets in North America”. World Resources Institute. 2006.
http://pdf.wri.org/gpmdg_corporate_6.pdf
Awerbuch, Shimon. 'Determining the real cost: Why renewable power is more cost-competitive
than previously believed,' Renewable Energy World, James & James, (March-April 2003)
http://www.awerbuch.com/shimonpages/shimondocs/REW-may-03.doc
Awerbuch, Shimon. “Market-Based IRP: It’s Easy!”
Berry, David. “Renewable energy as a natural gas price hedge: the case of wind.” Energy
Policy 33 (2005) 799-807.
Bird, L., B. Swezey, and J. Aabakken. 2004. Utility Green Pricing Programs: Design,
Implementation, and Consumer Response. NREL/TP-620-35618. Golden, Colorado: U.S.
Department of Energy National Renewable Energy Laboratory.
http://www.eere.energy.gov/greenpower/resources/pdfs/nrel_35618.pdf
Bird, Lori and Ed Holt. “Emerging Markets for Renewable Energy Certificates: Opportunities
and Challenges”. National Renewable Energy Laboratory. June 2005. NREL/TP-620-37388.
http://www.eere.energy.gov/greenpower/resources/pdfs/37388.pdf
Bolinger, Mark, Cliff Chen and Ryan Wiser. “Weighing the Costs and Benefits of Renewables
Portfolio Standards: A Comparative Analysis of State-Level Policy Impact Projections.” LBNL61580. January 2007.
http://eetd.lbl.gov/EA/EMP/reports/61580.pdf
Bollinger, Mark and Ryan Wiser. “The Value of Renewable Energy as a Hedge Against Fuel
Price Risk.” Submitted for publication: Proceedings: World Renewable Energy Congress VIII.
August 29 – September 3, 2004. Denver, CO.
Bolinger, Mark and Ryan Wiser. “Balancing Cost and Risk: The Treatment of Renewable
Energy in Western Utility Resource Plans.” Environmental Energy Technologies Division,
Ernest Orlando Lawrence Berkeley National Laboratory; August 2005.
http://eetd.lbl.gov/EA/EMP/reports/58450.pdf
Bolinger, M., R. Wiser and W. Golove. “Quantifying the Value that Wind Power Provides as a
Hedge Against Volatile Natural Gas Prices”. LBNL-50484. June 2002
http://eetd.lbl.gov/EA/EMP/reports/50484.pdf
Freese, Barbara and Steve Clemmer “Gambling with Coal: How Future Climate Laws Will Make
New Coal Power Plants More Expensive.” Union of Concerned Scientists. September 2006.
http://www.ucsusa.org/assets/documents/clean_energy/gambling_with_coal_final_report_sept_0
6.pdf
49
Grace, Robert C. et. al. “Birth of a New Market: Financing Wind Projects via Long Term Hedge
Contracts with Large End-Users”
http://www.mtpc.org/renewableenergy/public_policy/DG/resources/2005-05-16-AWEA-GraceWIndHedge.pdf
Hamrin, Jan. “Achieving a 33% Renewable Energy Target.” Center for Resource Solutions.
November 2005.
http://www.resource-solutions.org/lib/librarypdfs/Achieving_33_Percent_RPS_Report.pdf
Johnston, Lucy, Ezra Hausman, Anna Sommer, Bruce Biewald, Tim Woolf, David Schlissel,
Amy Roschelle, and David White. “Climate Change and Power: Carbon Dioxide Emissions
Costs and Electricity Resource Planning” Synapse Energy Economics. June 8, 2006.
http://www.synapse-energy.com/Downloads/SynapsePaper.2006-06.Climate-Change-andPower.pdf
Ownes, Brandon. “Power Price Stability: What It’s Worth? The Value of Renewables as a
Physical Hedge Against Natural Gas Price Movements”. Platts (A Division of McGraw-Hill).
March 2003.
Public Service Company of Colorado Annual Progress Report Public Service LCP, October
2006.
Public Service Company of Colorado Annual Progress Report 2003 PSCo LCP; December 2005.
Swisher, Joel et al. Tools and Methods for Integrated Resource Planning: Improving Energy
Efficiency and Protecting the Environment; UNEP Collaborating Center on Energy and the
Environment
Tellus Institute. Best Practices Guide: Integrated Resource Planning for Electricity.
U.S. Department of Energy. Energy Efficiency and Renewable Energy. Green Power Network.
2003.
http://www.eere.energy.gov/greenpower/markets/pricing.shtml?page=3
Wiser, Ryan and Mark Bolinger. “Annual Report on U.S. Wind Power Installation, Cost, and
Performance Trends: 2006” U.S. Department of Energy. May 2007.
http://eetd.lbl.gov/ea/EMS/reports/ann-rpt-wind-06.pdf
Wiser, Ryan. The Hedge Value of Renewable Energy, NREL Energy Analysis Forum, Golden,
CO, November 9, 2004.
World Bank, Energy Unit, Energy and Water Department. “Technical and Economic
Assessment: Off Grid, Mini-Grid and Grid Electrification Technologies” Final Report –
Annexes. November 2005.
50
http://iris37.worldbank.org/85256D2400766CC7/GetContent?OpenAgent&URL=http://iris37.w
orldbank.org/85256D8A004D64BF/(ViewContentTransaction)?OpenAgent&DOCID=1EECAC
BFB8655DDC852570FF007CE78D&Framework=IRIS&Rendering=1&
51


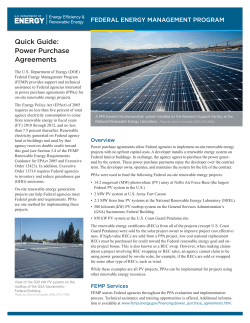


© Copyright 2026