
György Boda dr., Judit Lőrincz, Péter Szlávik
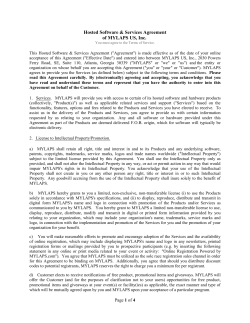
György Boda dr., Judit Lőrincz, Péter Szlávik
HOW TO BE MORE EFFICIENT IN MANAGEMENT
OF THE MOST IMPORTANT PRODUCTION FACTORS
Practical approaches for the management of complex assets
________________________________
The Icfai University Journal of Knowledge Management,
September 2008, Vol. VI No. 5, ISSN 0972-9216
INTRODUCTION
It becomes more and more obvious that the proportion as well as the importance of
tangible assets gradually decrease among production factors1, while the importance of
intellectual assets is continuously increasing. It seems that managers are still very sceptical
of using scientific methodologies as theoretically adequate methods to manage immaterial,
intangible or knowledge production factors. The corporate decision makers are often
doubtful about the uncertainties assigned to these methodologies, as they do not see the
clear connection between the expenditures invested in these assets and the revenues
generated by them. But is it really a dead end or are there some other ways to make some
progress in different domains of Intellectual Capital Management? This is the main question
we try to explore and answer in this paper.
As a first step, we examine the most important production factors (chapter 1.). Secondly, we
try to describe those unexplored management areas where managers are also lacking
adequate management tools (chapter 2.). Finally we make an attempt to show the promising
directions for the future (chapter 3.).
THE MOST IMPORTANT PRODUCTION FACTORS
The majority of economists agree that the role of tangible assets – lands, buildings and
machinery – is not as significant as it was in the past. Nowadays the proportion of less
material-intensive sectors is constantly growing, while the role of material production
factors is decreasing even in the material-intensive sectors. The weight of service based
1
All elements that are necessary for the operation of the company, including financial capital, human capital,
physical assets, etc.
1|Page
corporate activities in the contribution to GDP is already higher than the total proportion of
agricultural and industrial activities (see first part of Figure 1).
Parallel to the increasing role of the service sector the proportion of intangible elements of
production factors (e.g. competency, client and organization related assets) is also growing.
A significant part of intangible production factors is represented by people. The growing
importance of this human factor is accompanied by the evolution of human freedom.
Capital owners of physical assets will face challenges in this new environment. They used to
control the economy by owning the physical (tangible) production factors, however these
days as a result of the previously described tendency a significant part of production factors
are owned by the people themselves2, who are not closely tied to these original capital
owners. This means the fall of the monopoly of conventional capital. Due to this the capital
owners need new management techniques to better control the mix of production factors.
2
E.g.: customer relationships, knowledge, innovation capability, etc.
2|Page
Figure 1.
The changing role of production factors 3
100 %
The main economic sectors
Services
Proportion
Industry
Agriculture
0%
100 %
The role of production factors
Competency
Proportion
Other physical assets
Client,
organizational
assets
Land
0%
100 %
The human commitments
Proportion
Free people
Vassal
Slave
0%
Time
The Collapse of
The Roman Empire
The French
Revolution
The Industrial
Revolution
Some parts of intellectual capital are easier to control than others. Therefore company
managers should concentrate on those intellectual production factors which are more
manageable. If the management of intellectual capital4 is at least partly solved, then a
3
This chart was made based on the tendencies of the well developed OECD countries.
4
The ownership of intellectual assets. In the general terminology these categories (intellectual assets and
intellectual capital) are often used as synonyms.
3|Page
certain part of the intellectual capital will be controlled and owned by the company and its
owners.
Managers are familiar with the bookkeeping recommendations of the Accounting Laws and
Regulations, or the International Accounting Standards. And they surely know the balance
sheet itself, which shows the assets of a firm. But are all the important assets taken into
account in regular balance sheets? Not entirely. Conventional accounting does not support
the overview of both tangible and intangible production factors. Let’s think about clientele
of companies, organizational factors, or knowledge and competence of employees, which
are all basic elements of corporate operation and are essential in generating profit. None of
these elements are presented in the conventional balance sheet. Therefore instead of the
official, conventional balance sheets, company owners and managers should think according
to the more complex Total Asset Model shown in Figure 2.
4|Page
Figure 2.
The most popular Total Asset Model5
Assets
Cash
Liabilities
Short-term liabilities
Long-term liabilities
Current assets
Visible assets
Tangible assets
(Machines, buildings, computers, etc.)
Shareholders’ visible equity
Intangible assets
(Software, property rights, etc.)
Becomes visible
in case of
mergers & acquisitions
Network assets
(External structure: prosperous
relationship with customers, suppliers
and the micro-environment. E.g.: brand
names, trademarks, reputation, image,
etc.)
Shareholders’ invisible equity
Organizational assets
(Internal structure: good management and
company structure, prosesses, used
methodologies, concepts, models, theories,
standrads, IT and administrative systems,
corporate culture, etc.)
Individual’s competence
(Ability to create material and immaterial
assets. Employees’ capacity to act in various
situations, which includes skills, education,
experience, etc.)
Invisible assets
Intangible liabilities
(Legal cases, commitments related to
long-term employment, commitment to
maintain product and service quality,
constraint related to PR and marketing)
The „Invisible” Balance Sheet
Source: Karl-Eric Sveiby ©
The Total Asset Model expands the traditional balance sheet with new corporate production
factors such as relationship assets or organizational assets. One could say that invisible6
assets are “under the surface” and clearly separated from the well-known visible assets. If
we consider it from the ownership point of view, it becomes obvious that these invisible
assets are differentiated by the possibility of ownership. A part of the invisible equity is
owned by the shareholders, while another part is similar to debts and obligations. The exact
proportion of shareholder’s invisible equity and intangible debts and obligations depends on
how well the intangible assets are managed. The Total Asset Model attracts attention among
managers, because unlike conventional accounting reports it takes into account the complex
production factors.
This model is very important in visualizing the invisible intangibles, but like all models it has
some misleading elements. The Total Asset Model gives the illusion that the assets – tangible
5
Detailed description of originals (Edvinsson, Sveiby, Stuart, etc.)
6
Invisible, intellectual and intangible terms are used as synonyms throughout the text.
5|Page
and intangible – are isolated and clearly separated from each other. In addition to this
illusion of separation there is another imperfection with this Total Asset Model. In our
current belief there is one more intellectual asset missing from the model.
Some years ago we have met and soon entered into partnership with a Belgian consulting
company named AREOPA7. This cooperation helped us to widen our view and to share
knowledge. From our Belgian partner we have learnt a new model8, which gives a much
more realistic and complex depiction of the corporate assets (see Figure 3.). Beyond that,
what we have learnt from AEROPA is not only that there exists a better model in which the
traditionally known and the newly recognized production factors are combined and closely
interrelated, but also that another production factor exists, which the Total Asset model
shown in Figure 2. does not mention: the strategic alliance capital.
Figure 3.
AREOPA 4-leaf® Model
Structural IC level
SC
SC
Structural capital
High
SC-HC
SC-HC-SA
SC-HC-SA-CC
HA
SC-HC
Human
capital
HC-SA
SC-HC-CC
SC-SA
SC-HC-SA
SC-HC- SC-HC-CC
SA-CC
SC-SA-CC
HC-CC
SC-CC
HC-SA-CC
SA
Strategic
alliance
capital
SCSA
SC-SA-CC
SA-CC
HC
SCCC
CC
HC-SA
Customer
capital
HC-SA-CC
HCCC
SA
SA-CC
CC
Low
The model clearly presents that there are overlaps among the four main production factors.
For example the value related to a customer – that we know due to the cooperation with
one of our strategic partners (i.e. subcontractor with specific knowledge) – is presented in
SA-CC category.
7
www.areopa.com
8
The model is called AREOPA 4-leaf Model®
6|Page
For each segment of the 4-leaf model, AREOPA has developed a series of econometric
calculations and related questionnaires which allow the calculation of segment’s value.
Our fundamental economic instincts – based on our culture which we have inherited from
the Greeks – force us to compete. For continuous development in economy some
competition is generally needed, but total competition without any cooperation isn’t always
profitable or effective. If companies do not regard competition as the only way of creating
value, they could gain a lot immediately. This is especially true for production factors derived
from knowledge. Their sharing does not mean that the one who shares will have less. The
opposite result is more likely, and our experience shows that the one will have more, if the
rule of sharing is respected and carefully kept9.
After studying AREOPA’s 4-leaf model we made some extensions to it and by doing this we
defined a new total asset model. There are two major differences between the original 4leaf model and the extended one:
1. We have presented the tangible assets that have strong interrelation with
intangibles.
2. We have replaced the “capital” by “asset”. By doing this we would like to emphasise
that the existence of an intellectual element has an asset type of manifestation (i.e.
the intellectual element is identifiable and measurable). On the other hand in case of
every asset we can investigate the ownership structure (i.e. up to what proportion
the company owns, therefore controlls the asset). In this aspect “capital” refers to
the ownership structure (similar to liabilities side of the balance sheet).
9
The rules of sharing intangibles are much more complicated than sharing the tangibles, which could be a topic
of another paper.
7|Page
Figure 4.
Extended Total Asset Model based on the AREOPA 4-leaf® Model10
Structural IC level
Tangible
assets
SA
High
SA-HA
SA
SA-HA-SAA
Structural asset
SA-HA-SAA-CA
SA-HA-CA
HA
SA-HA
Human
asset
HA-SAA
SA-SAA
SA-SAA-CA
SA-HA-SAA SA-HA- SA-HA-CA
SAA-CA
SA-CA
HA-CA
HA
HA-SAA-CA
SAA
Strategic
alliance
asset
SASAA
SA-SAA-CA
SAA-CA
SACA
CA
Customer
asset
HA-SAA
HA-SAA-CA
HA-CA
SAA
SAA-CA
CA
Low
In this adjusted 4-leaf model (Figure 4.), tangible assets complete the intangibles, and thus
without the intangible assets there would be a gaping hole. In this sense the tangibles are
depending on intangibles and not conversely. A good example of the interrelationship
between tangibles and intangibles is when obtaining a computer without having the proper
knowledge to use it there is an asset in the balance sheet which brings no added value to
corporate operations and therefore to the value of the enterprise. On the other hand if
there exists the specific knowledge needed to use the new computer, value is added to the
enterprise which is already larger than the purchase price of the computer.
The coloured scales on the right side of the Figure 3. and 4. describe how much we can
structure and control each category. The higher the asset is presented on the scale, and thus
the more light-coloured it is, the more it can be owned and controlled by a company. In such
a way this asset model gives a much more realistic overview about the sharing rules of
intangibles among their owners.
This concept cannot be complete without examining the relationship between intangibles
and knowledge, so we should investigate what are the components of knowledge. Valuable
knowledge always has both explicit and tacit elements, which are present in intellectual
10
In this figure we have completed the 4-leaf Model of AREOPA with the dimension of tangible assets. By doing
this we would like to emphasize that the presence of intellectual capital is always closely relating to tangible
assets.
8|Page
capital. Both Figure 5. and Figure 6. show that owning all elements of knowledge is
impossible.
Figure 5.
The tacit dimension – I.
Information Management
Knowledge Evolution
Expertise
Experience
Know-how
Knowledge
Information
Data
Bits & Bytes
+ Syntax
+ Semantics
+ Context
+ Use
Explicit Knowledge
+ Practice
+ Efficiency
Tacit Knowledge
Intellectual Capital
Knowledge Building Process & Intellectual Capital
Source: Ludo Pyis, AREOPA
Figure 6.
The tacit dimension – II.
Dependency on the knowledge carrier
Wisdom
Knowledge
Information
Data
Understanding
The Data-to-Wisdom curve
Source: Gene Bellinger, Durval Castro, Anthony Mills
9|Page
From Pollányi we know that the greater the knowledge is the more personal and individual it
becomes11. That means a big risk for the intellectual capital investors, because only bits,
bytes and explicit knowledge can be owned without taking any risk. As personal knowledge
increases, the value of the company does as well, however it is linked to the person who
carries the knowledge. Likewise the deeper the knowledge is, the bigger the risk is that if the
knowledge-owner (the employee) goes away the investor (the employer) will suffer grave
loss. That is the reason why we should focus on the management of these new production
factors which cannot be separated from knowledge management.
This dependency on the knowledge carrier could be even greater as client and organizational
assets are also linked to the knowledge he/her possesses. Just think of the following. It often
happens that consulting companies suffer loss in client assets when a good client follows the
dismissed consultant to the new employer consulting firm. Another example is when the
retirement or departure of some IT experts makes the system unusable and often results in a
total ERP reengineering.
To summarize the main points of our thoughts we can say, that greater wealth needs bigger
intellectual capital, but investing into intellectual capital also brings higher risk. In order to
be able to effectively manage intellectual capital, the decision makers should face (and
answer) the following questions:
• Where and how to invest into intellectual capital with maximal result and minimal
risk?
• How to keep the value and the stability of the investment and how to avoid the risk
of losing it?
To answer these questions, intellectual assets need precise measuring. How to measure
intangibles will be described in the next chapter.
UNEXPLORED MANAGEMENT AREAS
Science and efficient management begin with measuring.
Everybody is familiar with the well-known management slogan: “what cannot be measured
cannot be managed”. We think it is true only in the following form: “what cannot be
measured cannot be efficiently managed”. As we will show, there are some difficulties in
measuring intangibles, which is the main reason why their exact measurement is only in an
initial stage.
11
Pollányi: The Tacit Dimension.
10 | P a g e
To show the current status of intangible measuring methods, Karl Erik Sveiby’s classification
is the most convenient summary (see Figure 7.).
Figure 7.
Karl-Erik Sveiby’s classification of methodologies to measure immaterial assets
Market-to-Book Value
ORGANISATIONAL
LEVEL ONLY
(MCM – 1997/98 – Stewart/Luthy)
MCM
MARKET
CAPITALISATION
METHOD
The Invisible Balance Sheet
Knowledge Capital Earnings
(MCM – 1989 – Sveiby)
(ROA - 1999 - Lev)
ROA
Value Added Intellectual Coefficient - VAICTM
Calculated Intangible Value
(ROA - 1997 – (Public))
RETURN ON
ASSET
METHOD
(ROA – 1997/98 – Stewart/Luthy)
Economic Value Added - EVA
TM
DIC
(ROA - 1997 - Stewart)
TM
TM
IC-Index
BusinessIQ
(SC - 1997 - Roos & al.)
IC RatingTM
(SC - 2004 - Sandvik)
DIRECT
INTELLECTUAL
CAPITAL
TM
Investor Assigned Market Value - IAMV
(MCM – 1998 – Stanfield)
Value Chain Score BoardTM
Citation-weighted Patents
(SC - 2002 - Lev)
(DIC - 1996 - Bontis)
Human Resource Costing &
Accounting - HRCA 1
SC
SCORE CARD
METHOD
(DIC - 1988 - Johansson)
(SC - 2002 - Edvinsson)
COMPONENTS
IDENTIFIED
Tobin’s q
(MCM – 1950's – Tobin)
Human Resource Costing &
Accounting - HRCA 2
Skandia NavigatorTM
(DIC - 1970's - Flamholtz)
(SC - 1994 – Edvinsson/Malone)
HR Statement
Balanced Score Card
Intangible Asset Monitor
Inclusive Valuation Methodology
(SC - 1992 – Kaplan/Norton)
(SC - 1994 - Sveiby)
(DIC - 1998 - Mc - Pherson)
Danish guidelines
(SC - 2003 – Mouritzen & al.)
Meritum guidelines
Knowledge Audit Cycle
(SC - 2002 - (EU))
(SC - 2001 – Marr&Schiuma)
The Value ExplorerTM
(DIC - 2000 - Adriessen&Tiessen)
Total Value Creation - TVCTM
(DIC - 2000 – Aderson&McLean)
Technology Broker
(DIC - 1996 - Brooking)
NO MONETARY-VALUATION
(DIC - 1990 - Ahonen)
Intellectual Asset Valuation
(DIC - 2000 - Suvillan)
Accounting for the Future - AFTFTM
(DIC - 1998 - Nash)
MONETARY-VALUATION
Intangible Assets Measurement Models
Source: Karl-Erik Sveiby ©
As it’s visible from this classification there is a large number of existing measurement
techniques. Mr. Sveiby classified the measurement methods based on the approach and
characteristics of each method. The two dimensions of the matrix refer to the level of
measurement focus (aggregated vs. disaggregated) and to the type of the measurement
(monetary vs. non-monetary). The different colours show the different measurement
method categories: Market Capitalisation Method, Return On Asset Method, Direct
Intellectual Capital and Score Card Method. The distribution and the position of the coloured
boxes among the quadrants shows that certain methods refer to certain approaches (i.e.
Direct Intellectual Capital methods are useful in case we want measure the monetary value
at the components level).
Let’s examine the quadrants separately! In the upper left quadrant the measurement is
practically impossible, which means that it has no point to measure aggregated nonmonetary values. Significant results have been achieved in the design of measurement
techniques belonging to the upper right quadrant. The company valuators have realized
long ago that there is a difference between market and asset value of a company. The
development and use of “Tobin’s Q” methodology was its famous manifestation. “Tobin’s Q”
11 | P a g e
basically analyzes the difference between the market value and the book value of the
company in total monetary format. Actually, in everyday practice there are three popular
methods to calculate the market value of a company. These are the following:
1. The market capitalization method (MCM): when the number of issued shares is
multiplied by the market price of the shares, where this total amount is regarded as
the market value of equity. For the calculation of enterprise value the market value
of equity and the value of short and long term liabilities are combined.
2. The discounted cash flow method (DCF): when a company’s forecasted future free
cash flows are discounted by the cost of capital of a company and that is all added
up.
3. The comparison methods: in cases when we both lack stock exchange information
and the knowledge of the company’s business plan, the appropriate way of valuation
could be the one made on comparisons. In this case we need exact information
about realized M&A transactions of similar companies, and we use these
transactions’ key indicators (for example EBITDA multiple) to apply these to our
company valuation.
Any of these three valuation approaches provides us information about the market value of
a company, from which we deduct the book value, and this gives us a rough calculation of
the intellectual capital value.
The aggregate monetary approaches are not useful in everyday management because they
only tell some information about the firm in total and do not give any help in answering
detailed management issues. Despite this fact, these approaches have important
contribution in attracting the attention of managers to the existence and importance of
intangibles.
Tremendous effort has been made in the lower left quadrant. Several of these methods
became widely known and highly popular. These methodologies are for example the Scandia
Navigator of Edvinsson and Malone, the Intangible Asset Monitor of Sveiby, the balanced
scorecard of Norton and Kaplan, the Koch-Schneider-Nagel model, the EFQM methodology,
etc. Although these methodologies do not measure an exact value of intangibles, they create
awareness in managers that intangibles should be managed. Besides, it provides guideline
for managers about what to manage as intangibles or what kind of intangibles they should
manage and control.
The biggest unknown field of intellectual capital calculation methods is the lower right
quadrant. Although a lot of methodologies have been developed, there is not one widely
accepted methodology to evaluate the separate, specific elements of intangibles.
12 | P a g e
There are continuous efforts to define accepted approaches for the measurement of
disaggregated intellectual capital elements.
• Some efforts are made to measure the expenditures/costs which are invested in
certain intangible assets. But the valuation from the cost side is far from being
accurate. The value of an asset is rather determined by the generated future cash
flows, than by the replacement cost of that asset. Moreover because of the
interpenetration of different intangible assets, we cannot clearly connect the
intangible assets and the future cash flows.
• The previously presented AREOPA model focuses on this measuring direction and has
developed a set of econometric equations to measure the elements intellectual
capital.
In spite of these attempts we already mentioned above, there is no widely accepted
methodology which could measure the intangible elements separately and which could
connect their calculated amount to the results measured by the upper right methodologies.
The existence of total intellectual capital value we only know from already existing total
asset models but we cannot show an approach that is summarizing it from bottom to top.
With methods in the upper right quadrant we can guess their total amount, while with the
scorecard methods we can link scorecard indicators to the focused intangible elements,
which might show the improvement or decline of these asset elements. But we do not know
anything exactly about their individual value.
We should recognize that in this field managers appreciate useful and reliable solutions.
Without direct intellectual capital valuation methods managers cannot precisely answer the
questions; where and how to invest into intellectual capital with maximal result and minimal
risk, how to keep the value and the stability of the investment and how to avoid the risk of
losing it?
In lack of precisely calculated answers, smart guesses can help in decision-making and
managing the intellectual assets (Like the Intellectual asset monitor of Sveiby in Figure 8.).
If the percentage of image enhancing clients is constant and if the revenue per clients or the
number of repeated orders grows, then the client asset base of the firm is more likely to be
strong and powerful (see the first column in Figure 9). If number of repeated orders grow, if
the rookie ratio is not declining, and if the employee satisfaction is constantly high, then we
probably have stable intangibles and we do not face big risk of losing it (see the last raw in
Figure 8.).
13 | P a g e
Figure 8.
Sveiby’s Intellectual Asset Monitor for CELEMI – an example for quick win scorecard
method
Client
Organization
Ex terna l structure
Interna l structure
Competency
Average professional experience
(years)
R&D/revenues (%)
Image enhancing clients (%)
16%
80%
16.0
Growth,
renewal
70%
14%
60%
12%
50%
10%
40%
8%
30%
6%
6.0
20%
4%
4.0
10%
2%
14.0
12.0
10.0
8.0
2.0
0%
0%
1997
1998
1999
2000
2001
0.0
1997
2002
Revenues per client (TSEK)
1998
1999
2000
2001
1997
2002
1998
1999
2000
2001
2002
Value added per expert (TSEK)
Revenues per admin staff
(TSEK)
1,400
700
1,200
18,000
600
Efficiency
16,000
500
1,000
14,000
800
12,000
400
10,000
600
300
8,000
6,000
200
400
4,000
100
200
2,000
0
0
1997
1998
1999
2000
2001
2002
0
1997
Repeat orders (%)
1998
1999
2000
2001
1997
2002
1998
1999
2000
2001
2002
People satisfaction index (%)
Rookie ratio (%)
80%
90%
60%
70%
80%
50%
60%
70%
Stability
60%
40%
50%
30%
40%
50%
40%
30%
30%
20%
20%
20%
10%
10%
10%
0%
0%
1997
1998
1999
2000
2001
2002
1997
1998
1999
2000
2001
2002
0%
1997
1998
1999
2000
2001
2002
These are all important reasonings and good starting points in decision-making, but they do
not tell exactly whether we underinvested or overinvested in intellectual assets. Competition
in business compels us to carefully balance our investments. However the scorecard
evaluation is not the most precise measurement, still it is a good starting point and a feasible
direction by giving help for managers when there is nothing else to reinforce intuitions and
corroborate decisions.
Presently, the scorecard measurements are better and cheaper solutions and even more
reliable quick wins, than the DIC calculations. But the future is theirs, as only DIC methods
are able to reduce costs of erroneous management decisions and solve the careful balancing
of investments in intangibles, just as it is more or less solved in the tangible world (see Figure
9.).
14 | P a g e
Figure 9.
Scorecard vs. DIC measurements
Costs
generated by
erroneous
decisions
Scorecard
measurements
DIC measurements
Time
PROMISING DIRECTIONS
Life and business do not stop. Managers do not have time to wait. They are compelled to act
and they have to do it. What are the directions of development in intellectual capital
management? Due to our practical experiences we believe that some directions could be
far-reaching in the future. Innovation in the field of Intellectual Capital Management could
possibly mean the followings:
1. Focusing on human resources controlling.
2. Connecting scorecards to processes.
3. Moving on from handling crowds of employees to managing individual employee
profit centers.
Focusing on human resources controlling
If production factors are carried by people, the controlling must be focused on human
resources! But what does it mean exactly?
Traditional controlling is focused on organizations. The most popular controlling model - the
master budgeting controlling model12 - is principally based on the company structure. Only
12
We have published several books and related business models in this field. Please refer to the reference list.
15 | P a g e
the minority of the firms means an exception to this rule and instead of organizational
structure it uses activity maps or process maps as the basis of developing effective
controlling systems. In this way most controllers are only controlling departments as
separated boxes – many times as black boxes – of a company and not the company as a
whole. Thus they cannot do more than to act according to the “lawnmower principle:” if a
department operates badly, than it must be regulated by cut in costs.
In reality, as the harmonizing of the external market to environmental requirements
becomes more and more important, the real stakeholders within the firm gradually
disregard the barriers of organizational structure, and pass over the problematic question of
power and subordination. In this way they begin to give preference to the processes of the
company. Corporate working processes are crossing the limits of organizational structures,
and thus processes are rather relying on cooperation of people than on separate
organizational units. The evolving of matrix organizations is a sign of this change in the way
of business thinking.
As a consequence, the focus of the controlling should be taken from departmental level to
the hand off process level13, where task are carried out by a person or by a group of people.
On this level the performing people become the targets of controlling, and in this way real
production factors become the target of management.
The process examining methodology on this hand off level is well described by the AREOPA
TAPE model (see Figure 10.). If we follow the principles laid down in this matrix we secure
the maximal client satisfaction, e.g. we promote the most efficient work processes which
strengthen both the organizational and client capital.
13
Thinking processes could be examined on strategic level, on departmental level, on hand off level, on task
level and even on motion level. For us here the hand off level is the relevant one, where the output is delivered
by men to men, e.g. from hand to hand.
16 | P a g e
Figure 10.
The AREOPA TAPE grid
Timeliness
Accuracy
Productivity
Efficiency
Product
Does the customer
get what he wants
and when he
expects it ?
(being on time)
Does the customer
get exactly what
he wants?
(correct specifications)
Is there an
added value in
each process step?
Is there any
rework in
the process?
How much of the work
must be redone?
Process
information
Does the customer
get process
information when
he expects it?
Does the
customer
get correct
information?
Does each
information element
have added value?
Is information
varying according to the
moment?
Does the commitment
to timing create
added value?
Is the
execution efficient?
Does the process
executor keeps his word?
Treatment:
- Friendlyness
- Owning the problem
- Commitment to timing
Is the problem of the
Is the problem of
customer being owned customer being accepted?
at the moment he
Is there a commitment
expects it?
to timing?
Is the customer being
Are involved personnel
treated friendly?
friendly?
TAPE® grid
Source: Ludo Pyis, AREOPA
This shift in the focus of controlling has a relevant effect on product, even if it is not the main
output: future cash flows can be connected to hand off processes and because people can
be directly connected to processes, hereby there is a considerable chance that people can be
connected to future cash flow through processes.
Connecting scorecards to processes
It is always a big question in all scorecard projects from where the most appropriate
indicators should come. The large number of cancellation of such projects shows that the
problem is not yet solved.
On strategic level the indicators can be found more easily, but below that level we are often
facing some bureaucratic distortions and when the major scorecard indicators are taken
apart to individual indicators, they usually lose their strategy making power and often
transformed to unpopular, unsupported administrative figures.
The solution can be found also on process level, when the scorecard indicators are selected
after the careful analysis of the matching between strategic goals and working processes
(Figure 11.).
17 | P a g e
Figure 11.
Connecting scorecards to processes
Strategic projects
Process 1
Process 2
Process 3
Process 4
Process 5
Process 6
Process 7
Project 1
Project 2
Project 3
Project 4
Project 5
Project 6
Project 7
Strategic Processes
Financial
perspective
Generating renewal
STRATEGIC OBJECTIVES for example:
Improving efficiency
Increase and sustain
profit-making capability
Client perspective
(customer, supplier)
Learning &
Operational perspective
improvement
(processes, structure)
perspective
4
5
6
7
1
2
3
Efficient use of free cash flow
Efficient margin management
Efficient margin
management
Growth
Central sales
management
Increase integrity with
customers
Make customers ready to
buy more new products or
request new services
Satisfied customers
Good relationship with
suppliers
Good
infrastructure
Have a „core team”
3
Increase and sustain profit-making capability
Efficient use of free
cash flow
Outstanding HR
management
2
Increase ROIC
Maximize brand value
Developing
complex brand
1
Maximize brand value
Increase
shareholders’
value
More effective and
efficient operation
Efficient time
management
Customized,
professional internal
structure
(differentiation from
multinationals)
Maintain company
culture
Controlled risktaking
Successful
multicultural
environment
Operation under
good management
control
Increase shareholders' value
Increase ROIC
Growth
Developing complex brand
Increase integrity with customers
Make customers buy more products and services
Central sales management
Satisfied customers
Good relationship with suppliers
Controlled risk-taking
Outsanding HR management
Have a "core team"
More efficient and effective operation
Good company culture (maintaining it)
Good infrastructure
Efficient time management
Successful milticultural environment
Customized, professional internal structure
Operating under good management
Satisfied employees
Satisfied employees
Increase the personal values
and the worth of the
management
Challenge
creation
Independent and
efficient way of
operation
Contribute to personal development
(training and education)
Callenge creation
Increase the personel values
Contribute to personel development
Independent and efficient way of operation
Figure 11. illustrates the connection on strategic level.
In this methodology we first define the strategic objectives and make a strategic map based
on these goals. This also means that the strategic goals are arranged into a hierarchy. The
next step of the exercise is the matching of the strategic objectives with the core business
processes. The matching also means a gap analysis between the objectives and the current
status. Based on the matching, development projects are defined. The development projects
should cover the gap between the strategic objectives and the current status of the
business.
If the processes do not support the strategic goals, obviously the strategic goals will not be
achieved. That gives strategic significance to the indicators of the main processes, which
means that this kind of indicators would never be bureaucratized. If everybody believes in a
strategy, than they will feel and accept the importance of the indicators.
The other group of useful indicators comes from those projects which generate change in
the working processes in order to promote the realization of strategic goals. The defined
projects are the basic tools of changing the processes. So the most important project
indicators become essential because without their fulfilment the strategy would not be
achieved at all. In case of determining such indicators there is no danger of
bureaucratization.
In case the previously described process is completed at the hand-off level, we get useful
indicators to manage people and to connect them with the output.
18 | P a g e
4
5
6
7
Moving on from handling crowds of employees to managing individual employee profit
centers
In case our efforts are done at hand-off level of processes, we have to differentiate people,
who are making creative work and those, who are only doing repetitive work. By doing that
on this level we arrive to the task of selecting the real knowledge carriers, the owners of the
new production factors.
Creative work always means solving something unsolved, doing something undone, hereby
creating something new. On the contrary repetitive work means doing what is already solved
and done before. These two approaches of work are different and cannot be controlled the
same way.
Creative workers, in many cases, form a special group inside organizations. They actually do
repetitive work, as well, but it is based on a previous creative work that was made by
themselves using methods they haven’t disclosed. This kind of work means a big risk for the
investors, because the method and knowledge of solving problems is totally owned by the
creative worker and cannot be duplicated.
The controlling of the repetitive work is well known from Taylor, whose name could sound
familiar for most managers. (see Figure 12.).
Figure 12.
Controlling employees doing repetitive work (The taylorian stop-watch)
Number of direct
employees
=
Planned volume of
production
(physical units)
*
Time needed for
one unit of
production
(h/physical unit)
/
Maximal hours
performable by a
man
(h/head/year)
/
Number of
expected hours
within the
performable hours
(h/h)
Total time needed for production (h)
Higher salary
Salary adjusted to
the number of
expected hours
Minimal workforce needed for production (head/year)
Workforce needed for production (head/year)
In this case the manager determines the quotient of the time needed to produce one unit of
production (unit can be a service delivery as well) and multiplies it by the number of units
19 | P a g e
produced. If the determined time is smaller than the working time, he can see it immediately
and start to investigate the reasons. Creative work cannot be controlled this way, mainly
because in creative work the key knowledge carrier cannot be controlled by a stop-watch.
Creative workers can be only controlled by a period of time defined in advance. These
creative workers often hear sentences, like: “You have this amount of time for the solution. If
it is not enough, I will look for someone else who is able to solve it.” The result is dismissal,
which may sound very cruel, but this is the only way of controlling this kind of work. Let’s see
on Figure 14 how it is communicated politely!
Figure 13.
Controlling employees doing creative work (Time report)
Number of direct
employees
=
Number of hours
planned to be
charged
(h/year)
/
Chargeability
(h/h)
/
Maximal hours
performable by a
man
(h/head/year)
/
Number of
expected hours
within the
performable hours
(h/h)
Total time needed for production (h)
Higher salary
Salary adjusted to
the number of
expected hours
Minimal workforce needed for production (head/year)
Workforce needed for production (head/year)
As mentioned above people doing repetitive work can be easily controlled by the Taylorian
stop-watch, but this cannot be done likewise in case of creative workers, where the
utilization of stop-watch is impossible. For creative workers the time report is the real
solution. The main thing what a time report should reveal is how much time was used for
the unit or units sold and how much for other purposes. In this way managers can check the
chargeability and control the creative workers.
In consulting companies, lawyer’s offices, or well organized universities creative workers –
even students – usually get some chargeability requirements. For example: “50 percentage
of your time should be sold to customers!” “In three years you should make your PhD!” Until
the end of May you should finish your exams!” These sentences are the same as the crude
sentence above. A certain output performance is specified within a given period of time,
which is only a part of the total determined time for a given person. This is called
chargeability.
20 | P a g e
Chargeability also means: “I connect your activity to the output, which is important to me.”
This way the managers are connecting the activities directly to output.
Activities can never be done without activity owners. By measuring the chargeability of a
certain group of people, whom we select not to be handled as crowds, but as individual
profit centers. The output required of the knowledge carrier could be evaluated, such as the
costs he generates and the profit made by him. It means once again a further step in
connecting some intangibles to the output, which is the main purpose.
In most organizations the Taylorian practice is the prevailing one, but this creative work
system is gradually progressing in the form of special employee treatment programs which
actually solve the specific controlling problems of knowledge carriers.
It seems that the time of modern human resource controlling systems in Intellectual Capital
Management are forging ahead, which development should be acknowledged and
supported.
SUMMARY
During this paper we have briefly outlined the most important production factors and those
related tendencies which have significant effect on management. We covered the definition
of intellectual capital and we saw that the growing importance of the intellectual capital runs
parallel to the growing importance of human factors. As intellectual elements get more
focus, the management of the complex mix of production factors becomes more difficult.
New reliable techniques are required for the continuous overview and management of
intellectual capital. We cannot stop at the aggregate levels where monetary approach is
more or less resolved; the details of intellectual assets should be grasped and understood.
We saw that there are plenty of methodologies that are aiming to solve this, but there is still
not available a widely accepted and known common approach. Until this issue is resolved,
managers still face important questions, such as:
• Where and how to invest into intellectual capital with maximal result and minimal
risk?
• How to keep the value and the stability of the investment and how to avoid the risk
of losing it?
Despite the uncertainties investigated, we still see promising new directions and useful
management techniques that might provide valuable support until the ongoing economic
revolution produces its widely accepted methods. These promising techniques link
intellectual asset management to processes, and utilize those valuation and scorecard
methods that are already tested and well understood by the majority of economists.
21 | P a g e
REFERENCES
•
Allee, Verna: The Future of Knowledge, Elsevier Science, USA, 2003.
•
Lev, Baruch: Intangibles: Management, Measurement and Reporting, Brookings Institution
Press, 2001.
•
Brealey , Richard A. - Myers, Stewart C. - Allen, Franklin: Principles of Corporate Finance,
McGraw-Hill/Irwin, New York, 2005
•
Damodaran, Aswath (2001) The Dark Side of Valuation, Prentice Hall PTR, Upper Saddle River,
2001.
•
Davenport, Thomas H. - Prusak, Laurence: Working knowledge, Harvard Business School
Press, 2000.
•
Edvinsson, Leif - Malone, Michael S. (1997) Intellectual Capital, Harper Collins, New York
•
Bellinger, Gene - Castro, Durval - Mills, Anthony: Data, Information, Knowledge, and
Wisdom, 2004., http://www.systems-thinking.org/dikw/dikw.htm
•
Boda, György - Peter Szlavik: Alternative Accounting to Manage Intellectual
Capital;
Electronic Journal of Knowledge Management (Vol. 5. Issue 1), Feb. 2007; www.ejkm.com
•
Boda, György – Szlávik, Péter: Kontrolling rendszerek [Controlling Systems], KJK-KERSZÖV Jogi
és Üzleti Kiadó, 2005., ISBN 963 224 842 2
•
Boda , György: A tudástőke kialakulása és hatása a vállalati menedzsmentre [The evolution of
knowledge capital and its impact on management], 2005., Phd dissertation
•
International Accounting Standards 2003, IAS 36 and 38
•
Juhász, Péter: Az üzleti és a könyv szerinti érték eltérésének magyarázata - Vállalatok
mérlegen kívüli tételeinek értékelési problémái [Explanation of deviations between market
and book value], Phd dissertation, Budapesti Közgazdaságtudományi és Államigazgatási
Egyetem, 2003.
•
Kaplan, Robert S. - Atkinson, Anthony A.: Advanced Management Accounting.
•
Kaplan, Robert S. - Norton, David P. (2004) Measuring the Strategic Readiness of Intangible
Assets, Harvard Business Review, 2004 February.
•
Kaplan, Robert S. - Norton, David P. (1996) The Balanced Scorecard, Harvard Business School
Press, Boston, Massachusetts
•
Mills, Roger W. (1998) The Dynamics of Shareholder Value - The principles and Practice of
Strategic value Analysis, Mars Business Associates Ltd., 256 pages.
•
Pulic, Ante: Measuring the Performance of Intellectual Potential, www.antepulic.com
•
Ridderstrale, Jonas - Nordström, Kjell A.: Funky business: Talent makes Capital Dance,
Pearson Education, 2000.
22 | P a g e
•
Standfield, Ken (2002) Intangible Management, Academic Press, Boston
•
Stewart, Thomas A. (2002) The Wealth of Knowledge, Nicholas Brealey Publishing, London
•
Sveiby, Karl Erik: The New Organizational Wealth, Berreth-Koehler Publishers, Inc., San
Francisco, 1997.
•
Sveiby, Karl Erik (2003) A Knowledge-based Theory of the Firm to guide Strategy Formulation,
Paper presented at ANZAM Conference, Macquarie University Sydney, 2003 February.
•
Thomas A. Stewart: The Wealth of Knowledge, Nicholas Brealey Publishing, London, 2002.
23 | P a g e


© Copyright 2026